
Cell-Type Specific Inhibition Controls the High-Frequency Oscillations in the Medial Entorhinal Cortex
 , and
, and 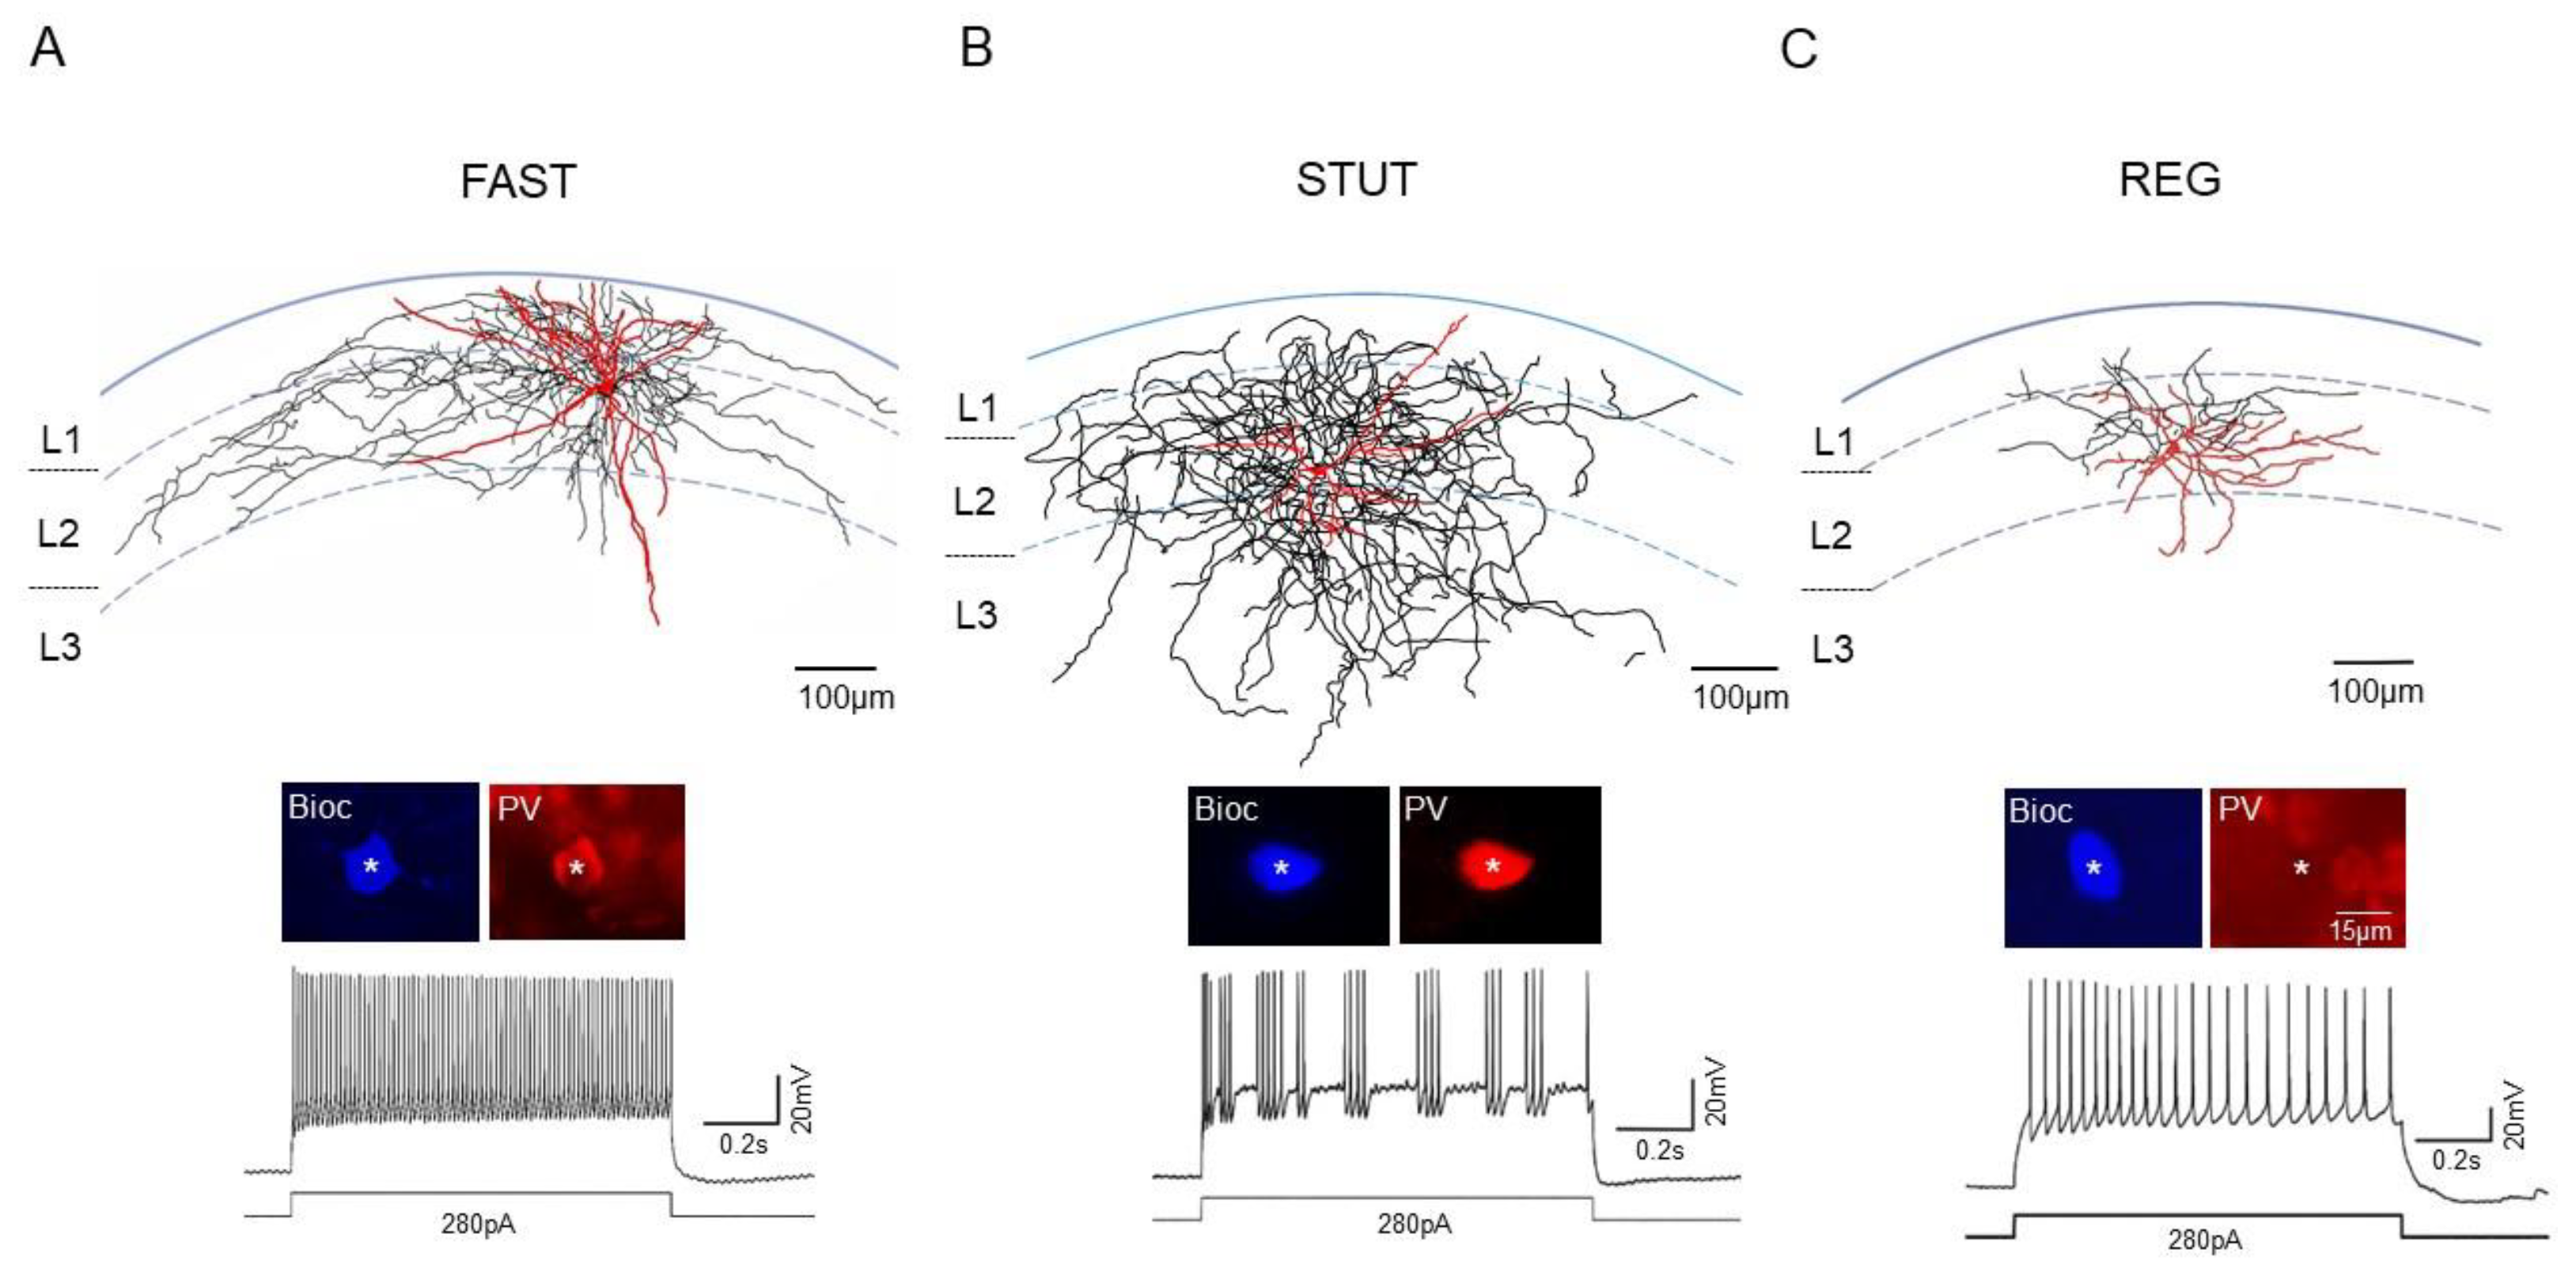
Abstract
:1. Introduction
2. Results
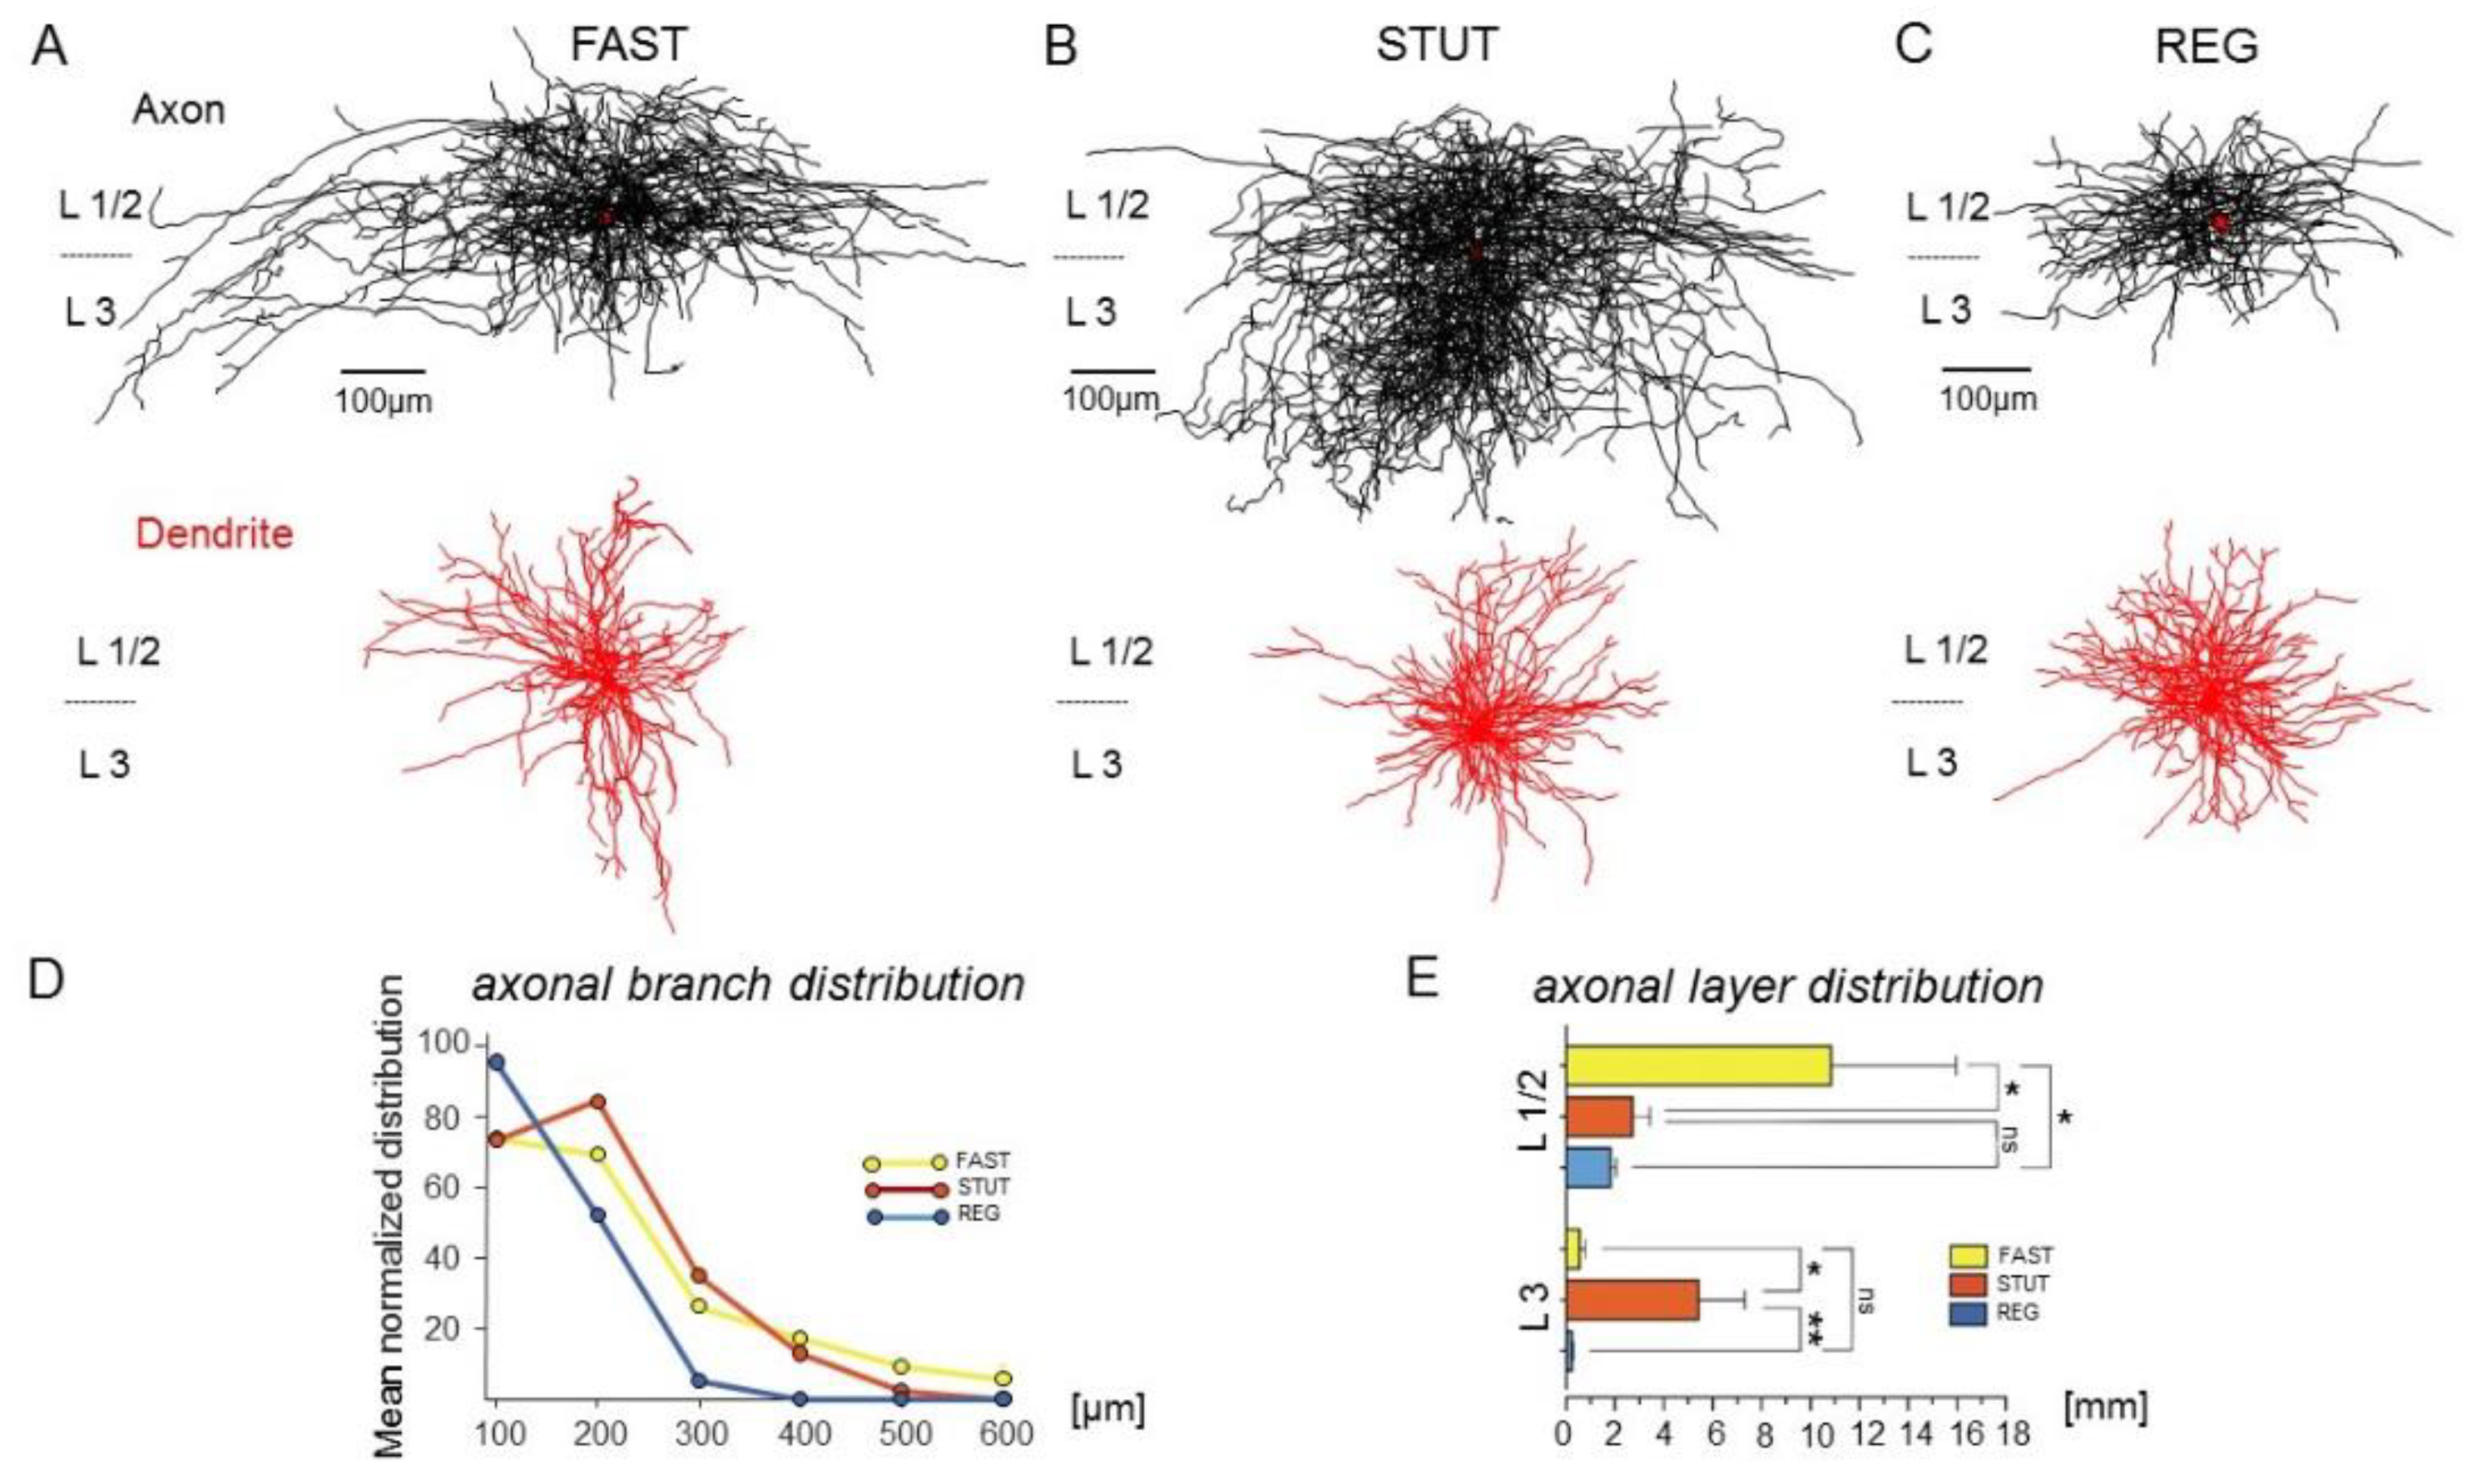
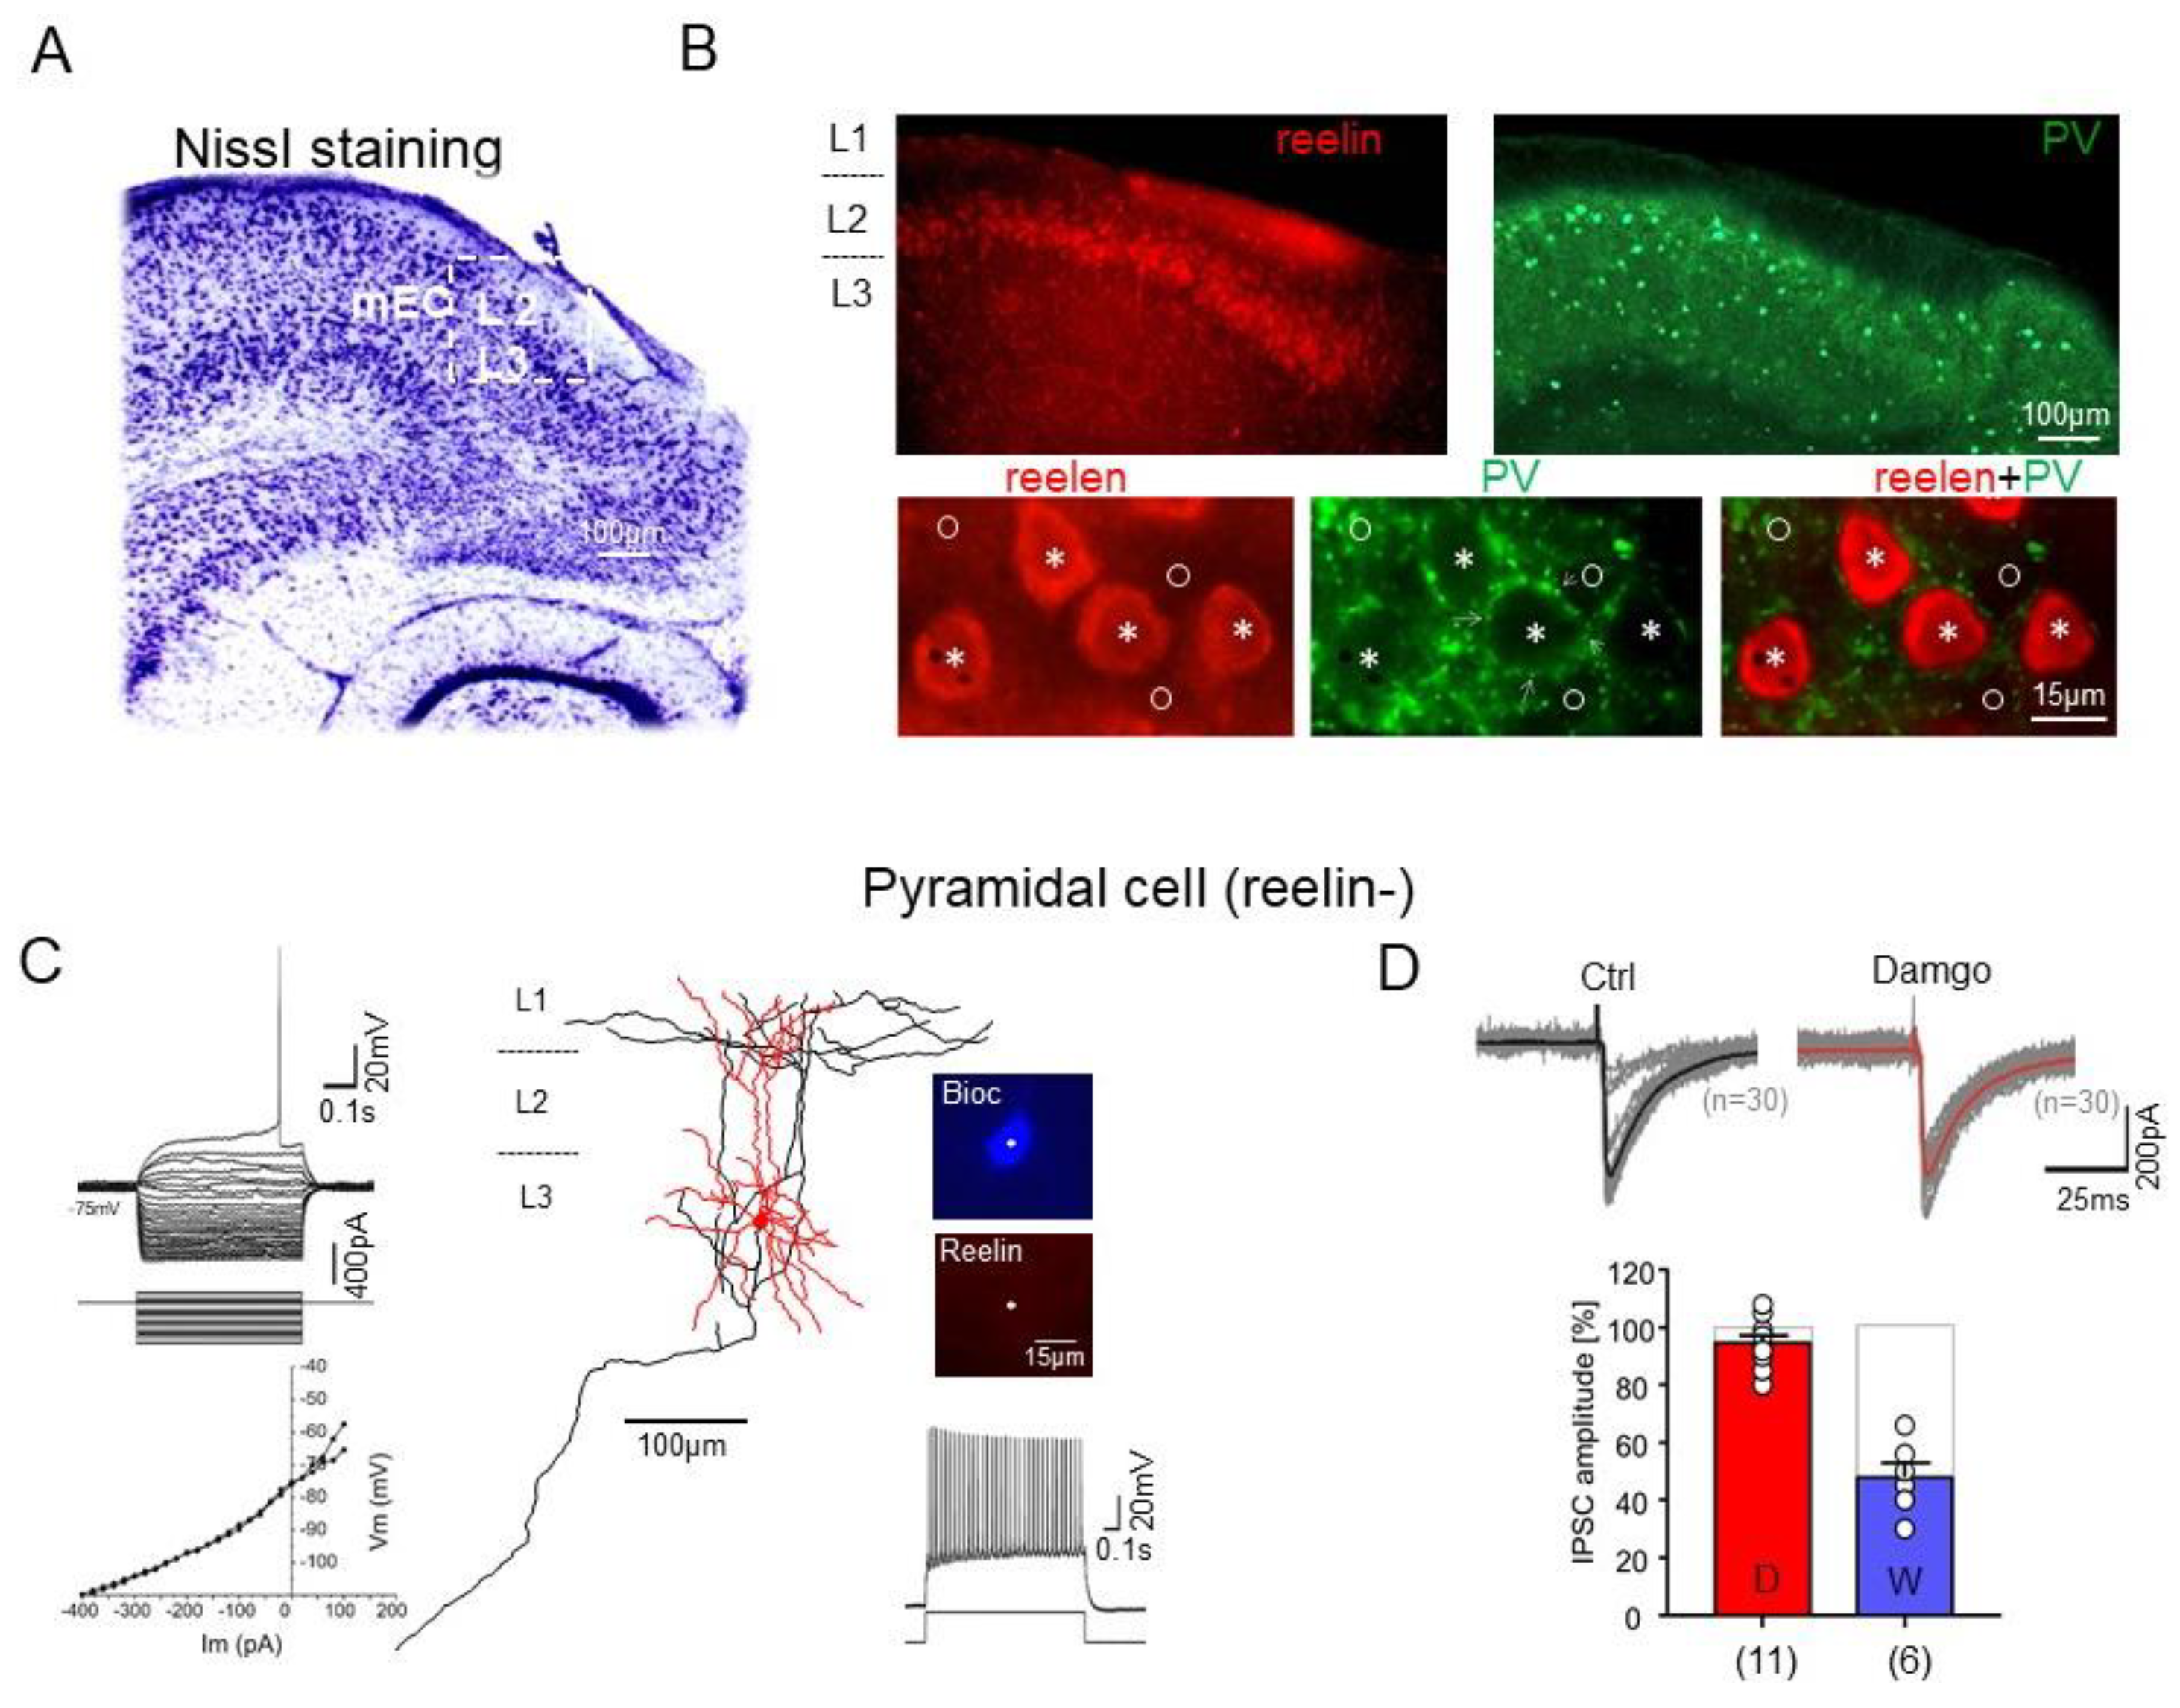
2.1. Anatomical and Electrophysiological Features of INs in the mEC
2.2. Intrinsic Physiological Properties of mEC INs
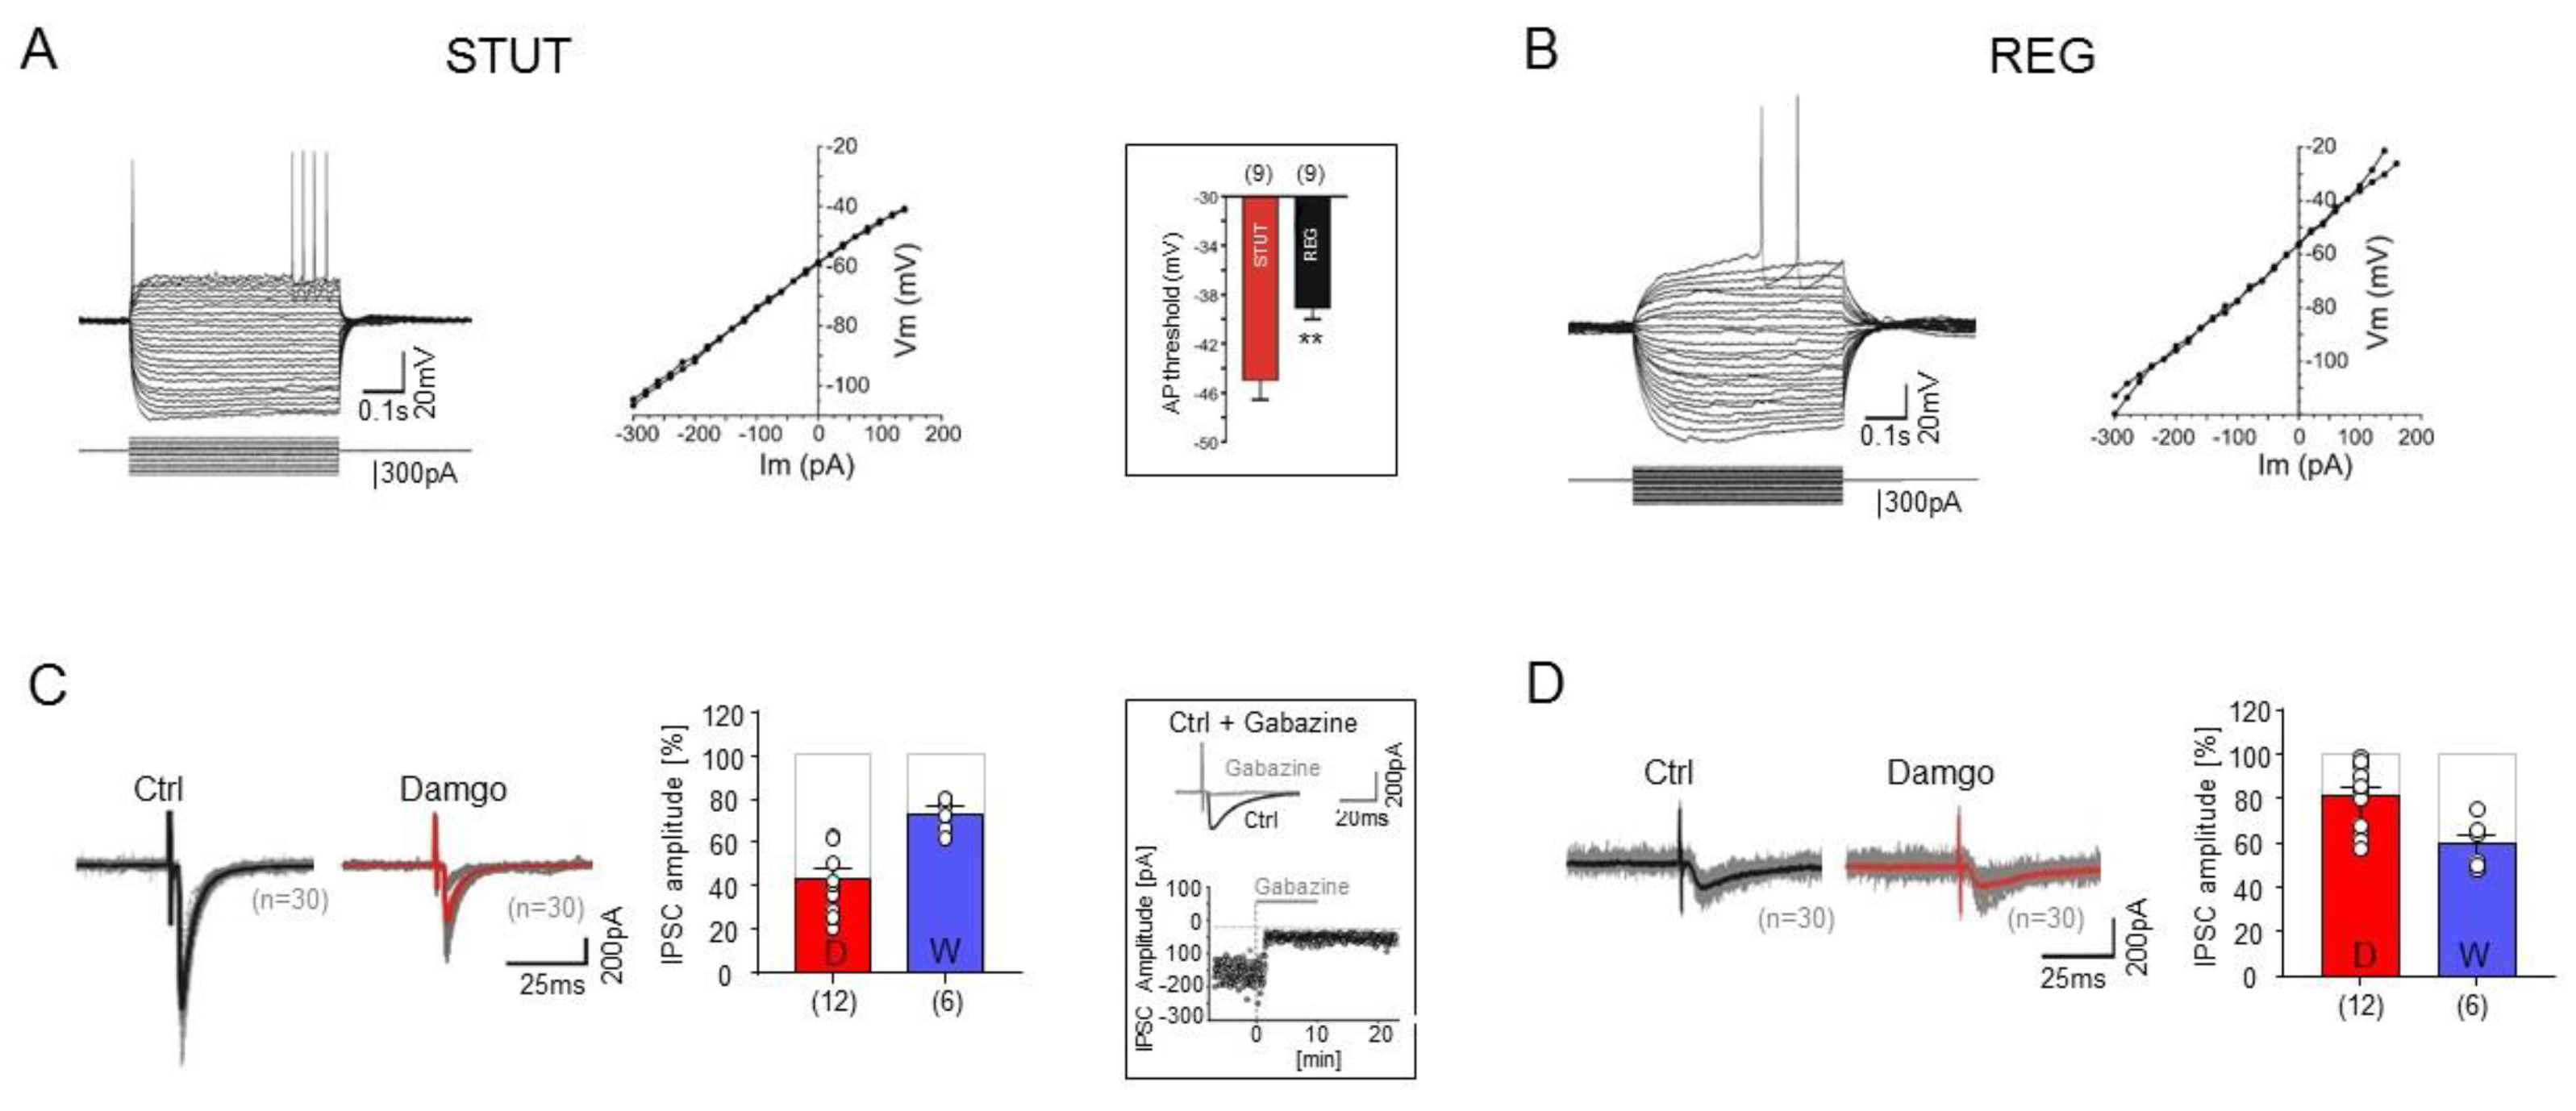
2.3. Divergent Effects of Opioid and Cannabinoid Receptor Agonists on STUT and REG
2.4. Effects of μ-Opioid and Cannabinoid Receptor Agonists on the Inhibitory Synaptic Transmission onto PCs
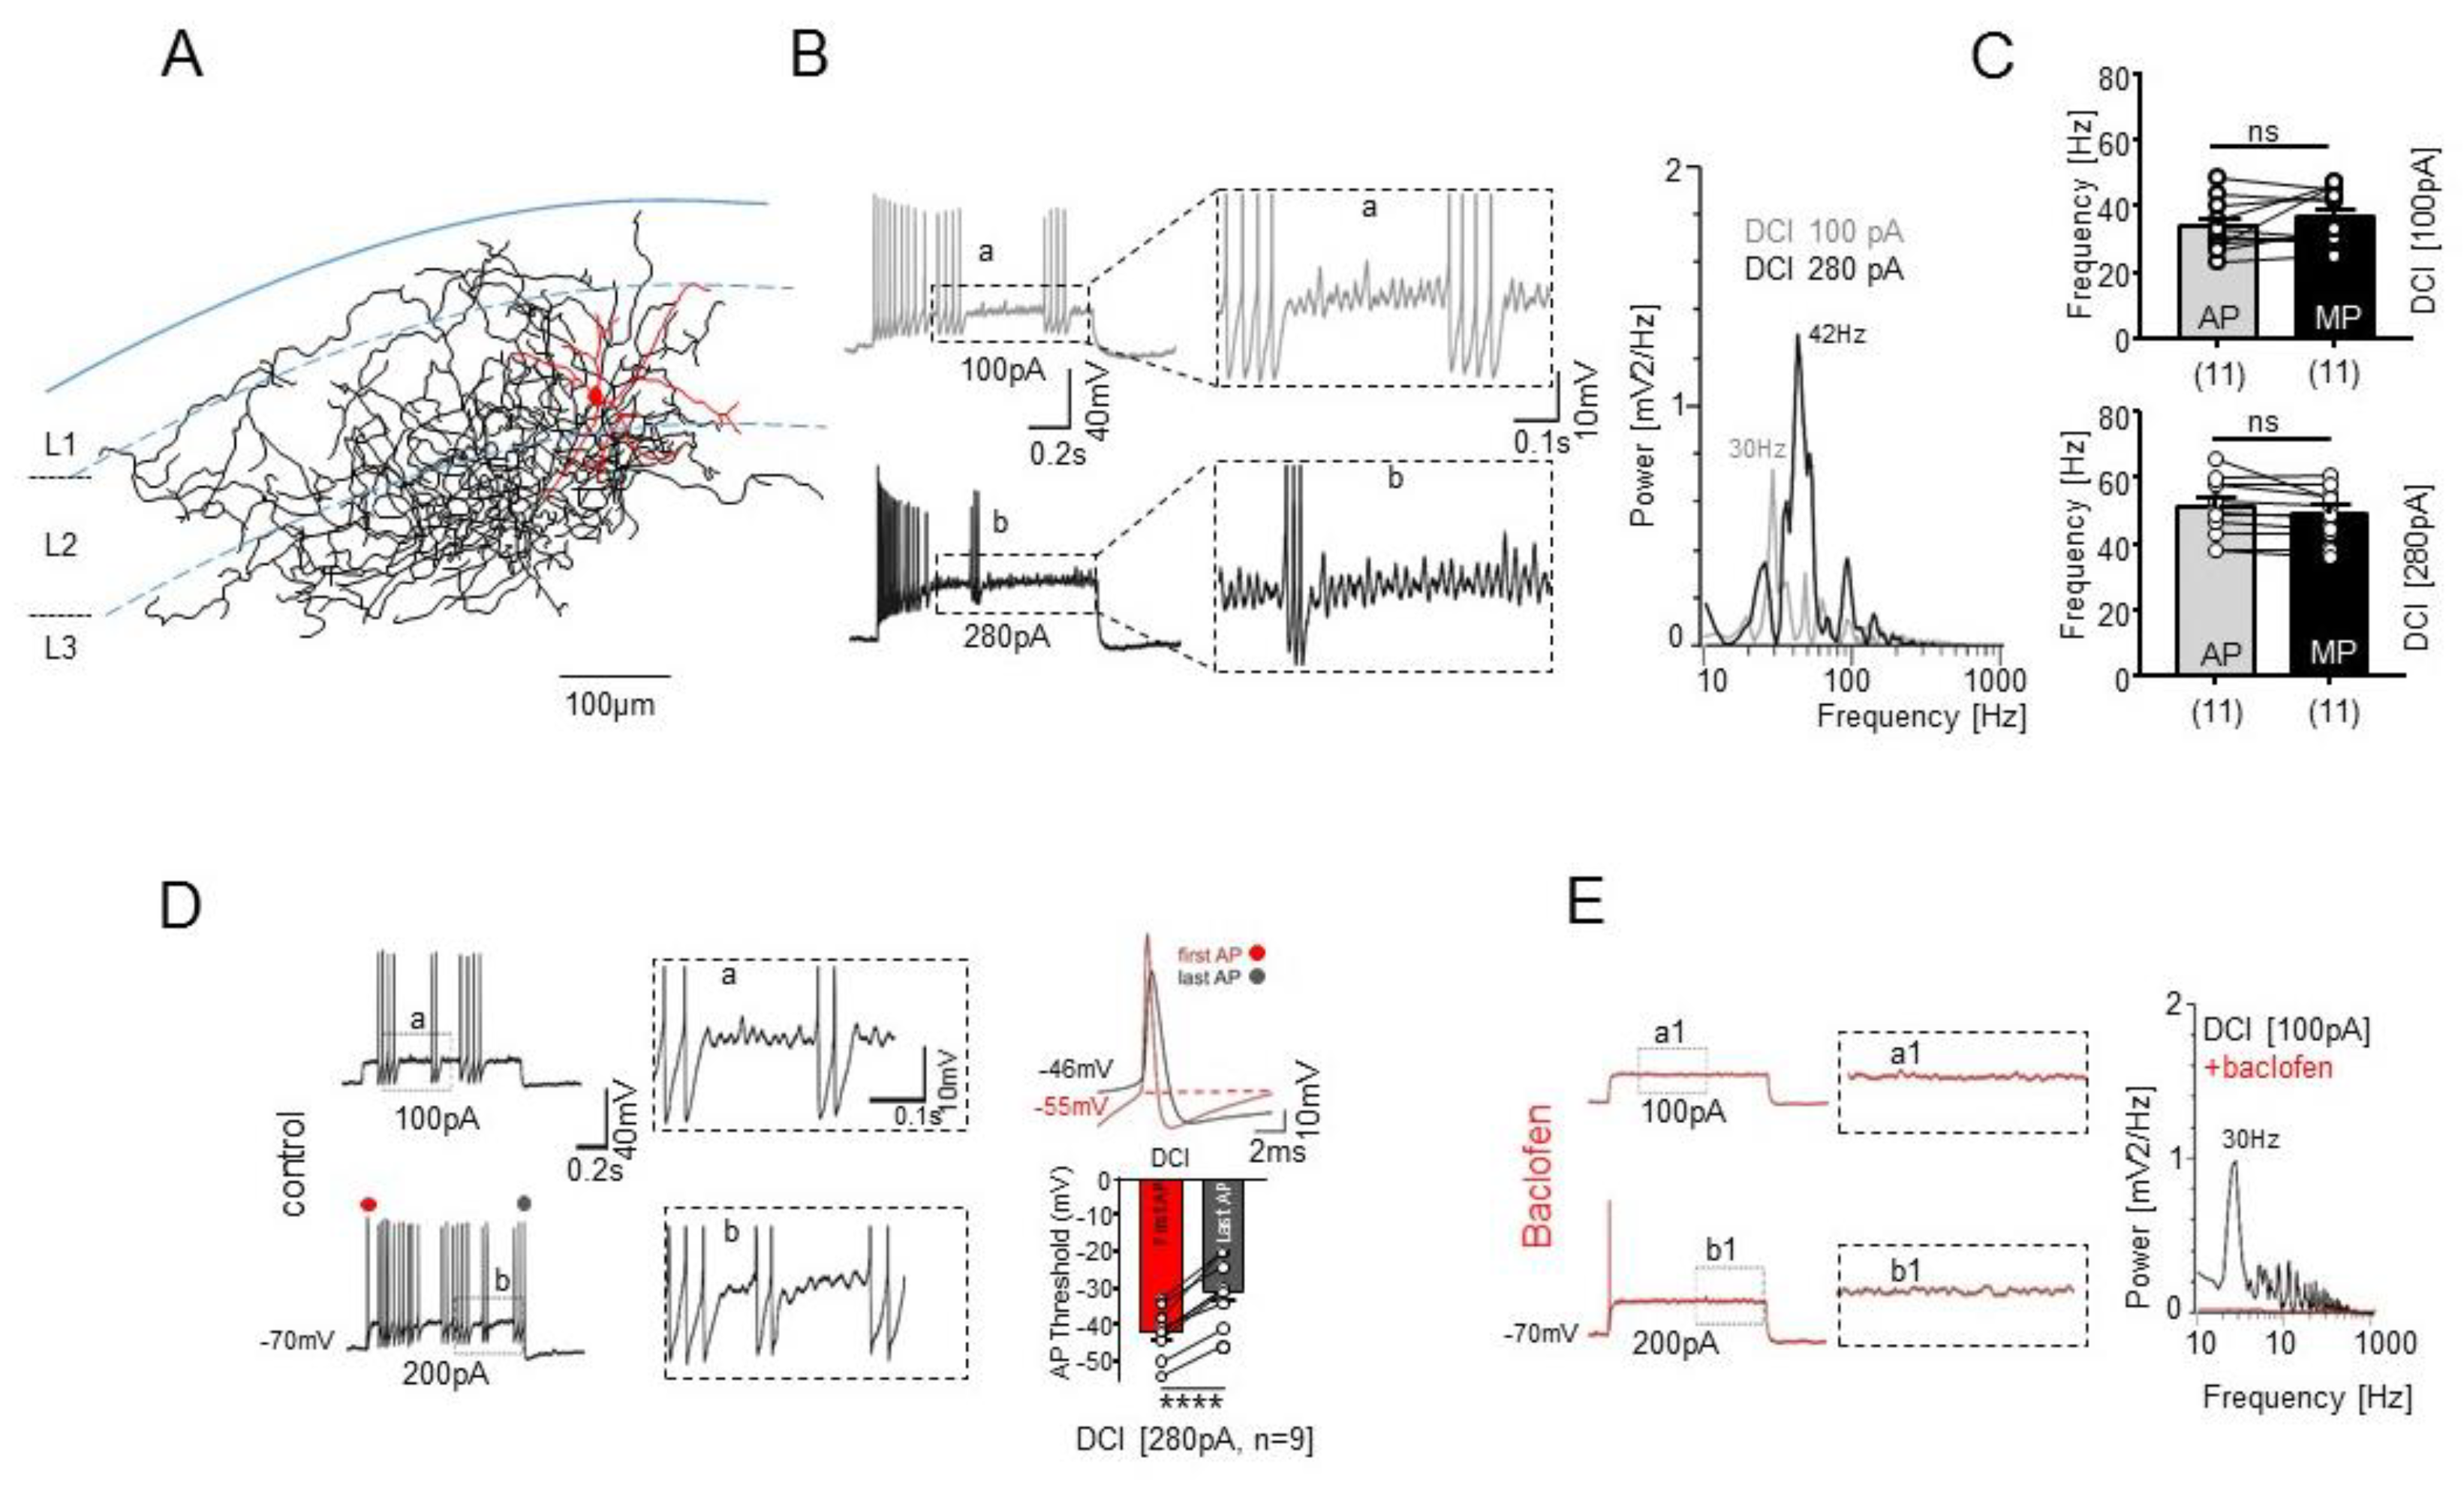
2.5. Intrinsic Membrane Properties of STUT Support Their Involvement in Oscillatory Network Activity within the mEC
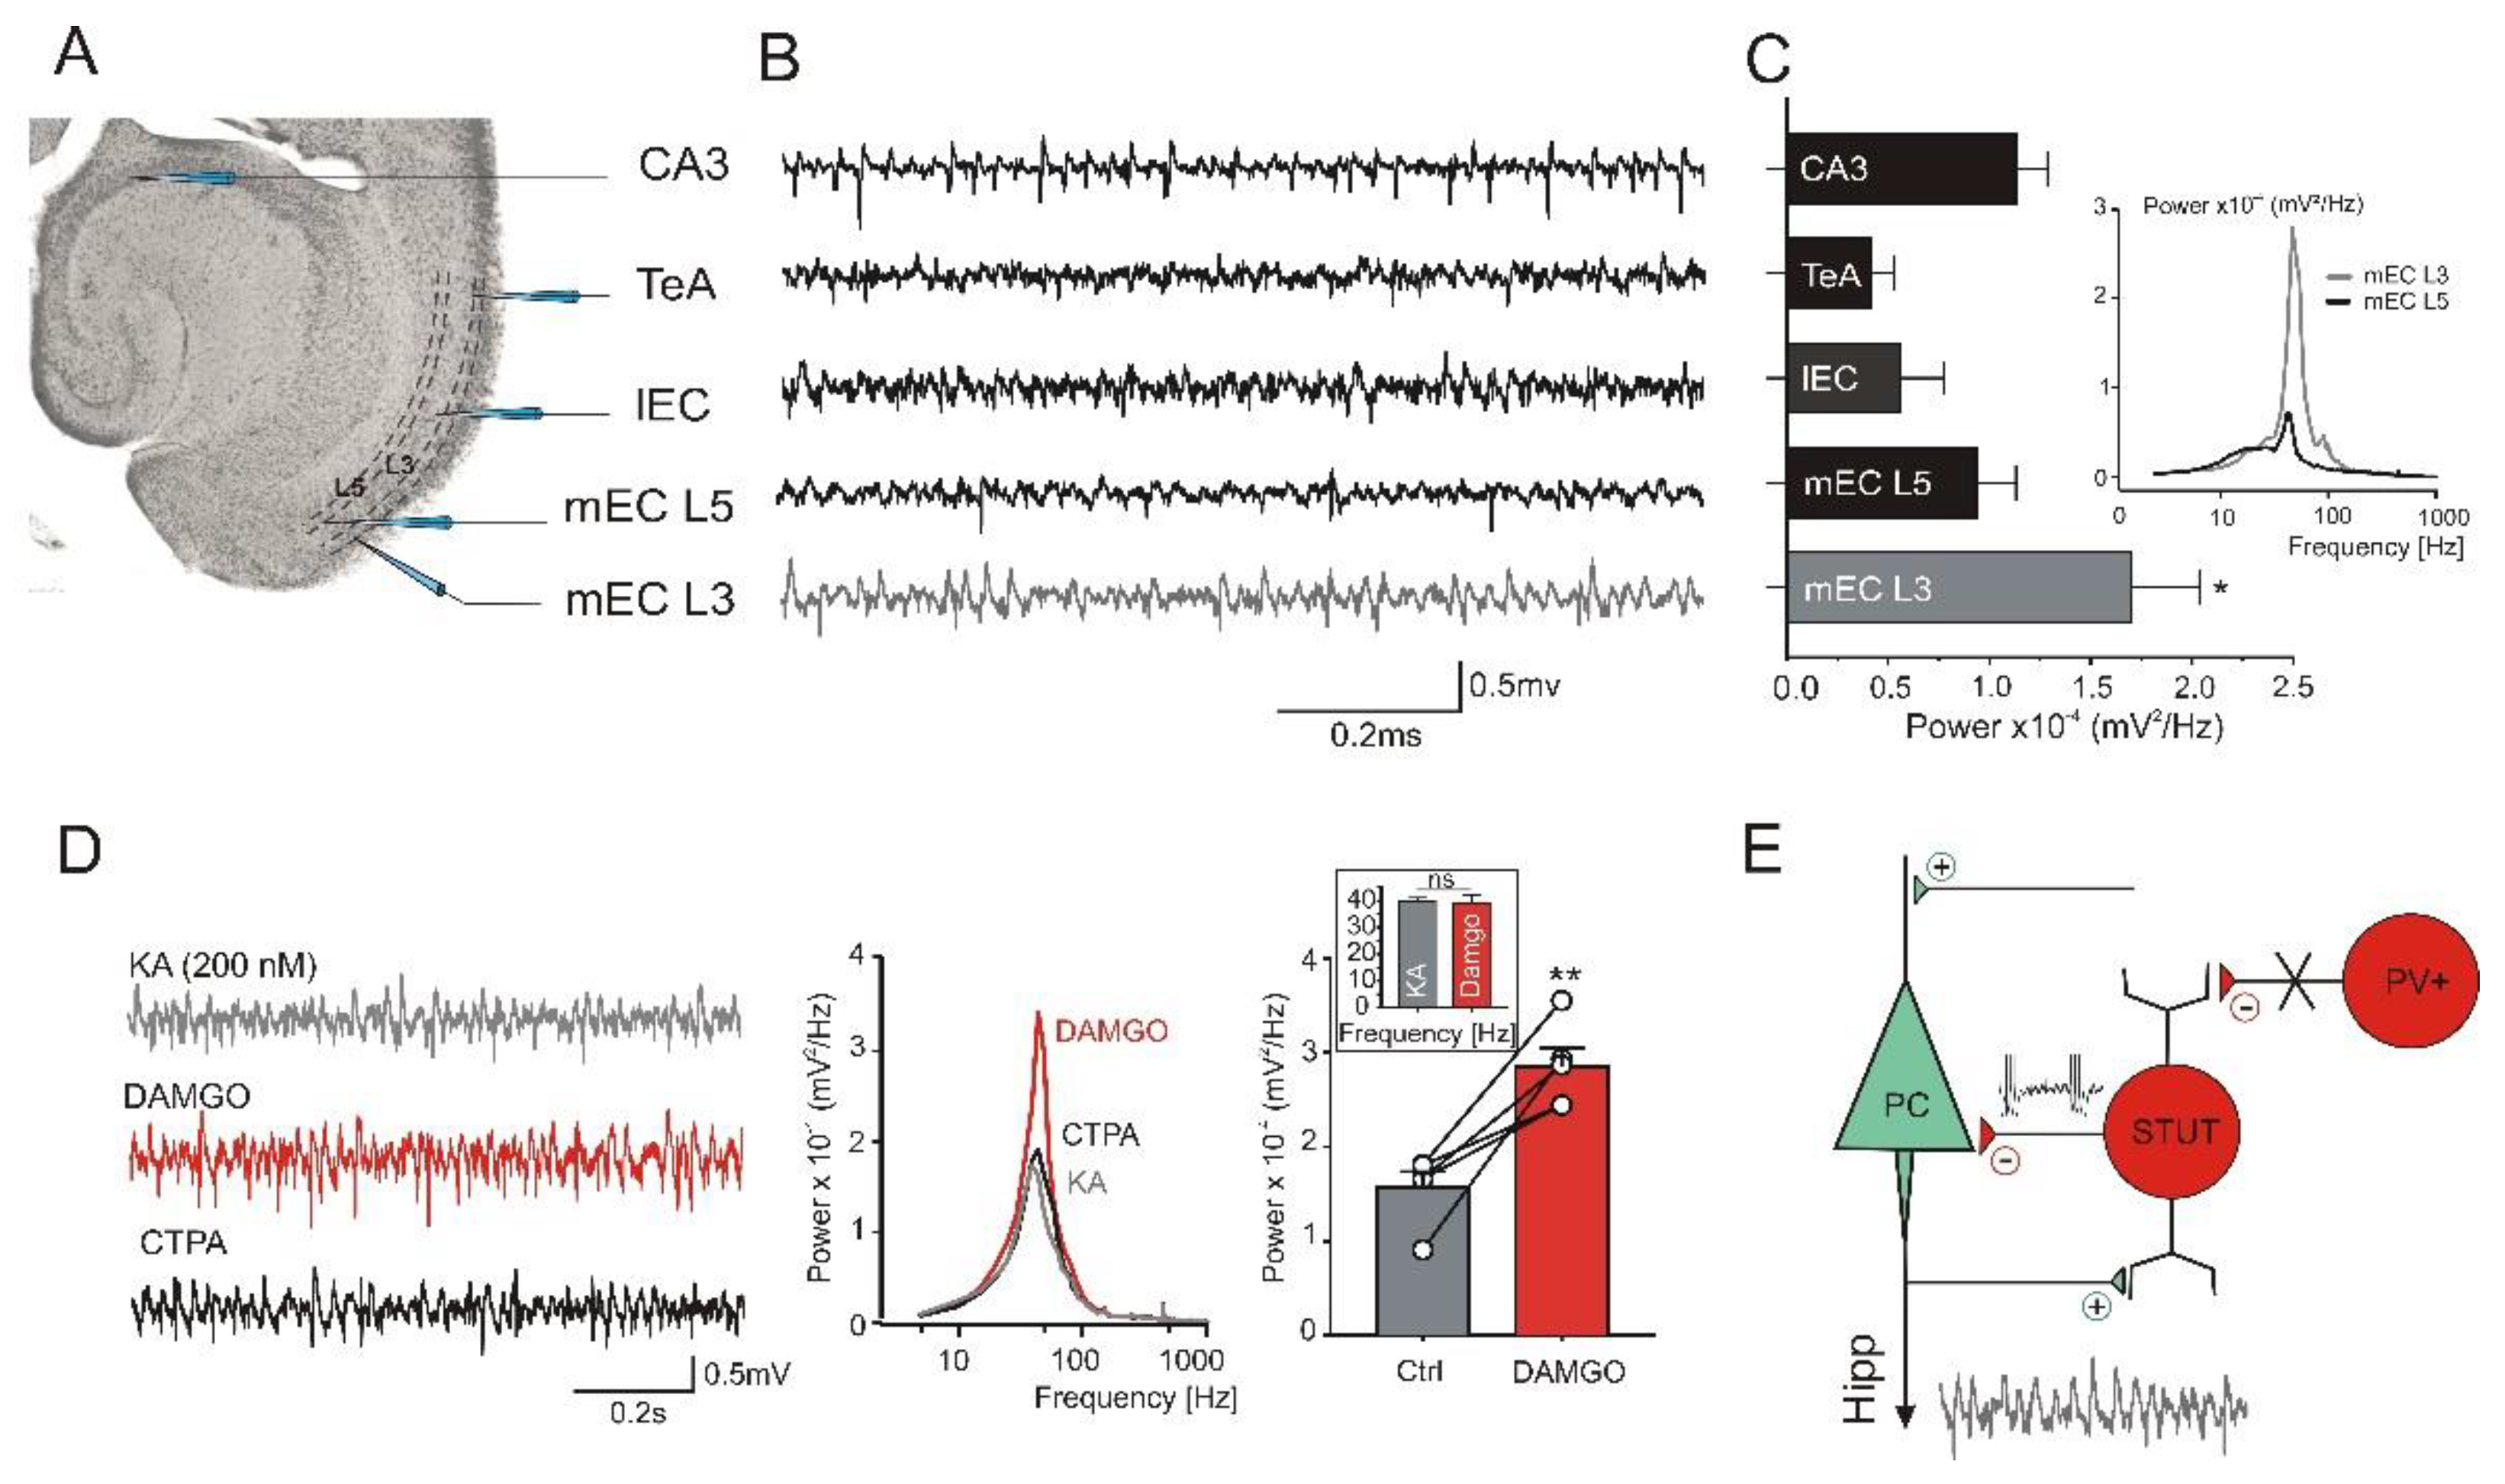
2.6. Opioid Receptor Activation Promotes Gamma Frequency Oscillations in the mEC
3. Discussion
4. Materials and Methods
4.1. Slice Preparation
4.2. Extracellular Field Recording
4.3. Whole-Cell Recording
4.4. Immunolabeling
4.5. Nissl Staining
4.6. Biocytin Staining
Author Contributions
Funding
Data Availability Statement
Acknowledgments
Conflicts of Interest
References
- Alonso, A.; Klink, R. Differential electroresponsiveness of stellate and pyramidal-like cells of medial entorhinal cortex layer II. J. Neurophysiol. 1993, 70, 128–143. [Google Scholar] [CrossRef] [PubMed]
- Gloveli, T.; Schmitz, D.; Empson, R.M.; Dugladze, T.; Heinemann, U. Morphological and electrophysiological characterization of layer III cells of the medial entorhinal cortex of the rat. Neuroscience 1997, 77, 629–648. [Google Scholar] [CrossRef]
- Gloveli, T.; Schmitz, D.; Heinemann, U. Prolonged inhibitory potentials in layer III projection cells of the rat medial entorhinal cortex induced by synaptic stimulation in vitro. Neuroscience 1997, 80, 119–131. [Google Scholar] [CrossRef]
- Gloveli, T.; Schmitz, D.; Empson, R.M.; Heinemann, U. Frequency-dependent information flow from the entorhinal cortex to the hippocampus. J. Neurophysiol. 1997, 78, 3444–3449. [Google Scholar] [CrossRef] [PubMed]
- Dickson, C.T.; Mena, A.R.; Alonso, A. Electroresponsiveness of medial entorhinal cortex layer III neurons in vitro. Neuroscience 1997, 81, 937–950. [Google Scholar] [CrossRef]
- Dickson, C.T.; Magistretti, J.; Shalinsky, M.H.; Fransen, E.; Hasselmo, M.E.; Alonso, A. Properties and role of I(h) in the pacing of subthreshold oscillations in entorhinal cortex layer II neurons. J. Neurophysiol. 2000, 83, 2562–2579. [Google Scholar] [CrossRef] [Green Version]
- Klink, R.; Alonso, A. Morphological characteristics of layer II projection neurons in the rat medial entorhinal cortex. Hippocampus 1997, 7, 571–583. [Google Scholar] [CrossRef]
- Hafting, T.; Fyhn, M.; Molden, S.; Moser, M.B.; Moser, E.I. Microstructure of a spatial map in the entorhinal cortex. Nature 2005, 436, 801–806. [Google Scholar] [CrossRef]
- Solstad, T.; Boccara, C.N.; Kropff, E.; Moser, M.B.; Moser, E.I. Representation of geometric borders in the entorhinal cortex. Science 2008, 322, 1865–1868. [Google Scholar] [CrossRef] [Green Version]
- Fyhn, M.; Hafting, T.; Witter, M.P.; Moser, E.I.; Moser, M.B. Grid cells in mice. Hippocampus 2008, 18, 1230–1238. [Google Scholar] [CrossRef]
- Sugar, J.; Moser, M.B. Episodic memory: Neuronal codes for what, where, and when. Hippocampus 2019, 29, 1190–1205. [Google Scholar] [CrossRef] [PubMed] [Green Version]
- Nilssen, E.S.; Doan, T.P.; Nigro, M.J.; Ohara, S.; Witter, M.P. Neurons and networks in the entorhinal cortex: A reappraisal of the lateral and medial entorhinal subdivisions mediating parallel cortical pathways. Hippocampus 2019, 29, 1238–1254. [Google Scholar] [CrossRef] [PubMed] [Green Version]
- Suh, J.; Rivest, A.J.; Nakashiba, T.; Tominaga, T.; Tonegawa, S. Entorhinal cortex layer III input to the hippocampus is crucial for temporal association memory. Science 2011, 334, 1415–1420. [Google Scholar] [CrossRef] [PubMed] [Green Version]
- Cunningham, M.O.; Davies, C.H.; Buhl, E.H.; Kopell, N.; Whittington, M.A. Gamma oscillations induced by kainate receptor activation in the entorhinal cortex in vitro. J. Neurosci. 2003, 23, 9761–9769. [Google Scholar] [CrossRef] [PubMed] [Green Version]
- Lee, S.; Hjerling-Leffler, J.; Zagha, E.; Fishell, G.; Rudy, B. The largest group of superficial neocortical GABAergic interneurons expresses ionotropic serotonin receptors. J. Neurosci. 2010, 30, 16796–16808. [Google Scholar] [CrossRef] [PubMed] [Green Version]
- Rudy, B.; Fishell, G.; Lee, S.; Hjerling-Leffler, J. Three groups of interneurons account for nearly 100% of neocortical GABAergic neurons. Dev. Neurobiol. 2011, 71, 45–61. [Google Scholar] [CrossRef] [Green Version]
- Buetfering, C.; Allen, K.; Monyer, H. Parvalbumin interneurons provide grid cell-driven recurrent inhibition in the medial entorhinal cortex. Nat Neurosci. 2014, 17, 710–718. [Google Scholar] [CrossRef]
- Ferrante, M.; Tahvildari, B.; Duque, A.; Hadzipasic, M.; Salkoff, D.; Zagha, E.W. Distinct Functional Groups Emerge from the Intrinsic Properties of Molecularly Identified Entorhinal Interneurons and Principal Cells. Cereb. Cortex 2017, 27, 3186–3207. [Google Scholar] [CrossRef] [Green Version]
- Martínez, J.J.; Rahsepar, B.; White, J.A. Anatomical and Electrophysiological Clustering of Superficial Medial Entorhinal Cortex Interneurons. eNeuro 2017, 4, ENEURO.0263-16.2017. [Google Scholar] [CrossRef] [Green Version]
- Miao, C.; Cao, Q.; Moser, M.B.; Moser, E.I. Parvalbumin and Somatostatin Interneurons Control Different Space-Coding Networks in the Medial Entorhinal Cortex. Cell 2017, 171, 507–521. [Google Scholar] [CrossRef]
- Ye, J.; Witter, M.P.; Moser, M.B.; Moser, E.I. Entorhinal fast-spiking speed cells project to the hippocampus. Proc. Natl. Acad. Sci. USA 2018, 115, E1627–E1636. [Google Scholar] [CrossRef] [PubMed] [Green Version]
- Grosser, S.; Barreda, F.J.; Beed, P.; Schmitz, D.; Booker, S.A.; Vida, I. Parvalbumin Interneurons Are Differentially Connected to Principal Cells in Inhibitory Feedback Microcircuits along the Dorsoventral Axis of the Medial Entorhinal Cortex. eNeuro 2021, 8, ENEURO.0354-20.2020. [Google Scholar] [CrossRef]
- De Filippo, R.; Rost, B.R.; Stumpf, A.; Cooper, C.; Tukker, J.J.; Harms, C.; Beed, P.; Schmitz, D. Somatostatin interneurons activated by 5-HT(2A) receptor suppress slow oscillations in medial entorhinal cortex. eLife 2021, 10, e66960. [Google Scholar] [CrossRef] [PubMed]
- Tukker, J.J.; Beed, P.; Brecht, M.; Kempter, R.; Moser, E.I.; Schmitz, D. Microcircuits for spatial coding in the medial entorhinal cortex. Physiol. Rev. 2022, 102, 653–688. [Google Scholar] [CrossRef]
- Klink, R.; Alonso, A. Ionic mechanisms for the subthreshold oscillations and differential electroresponsiveness of medial entorhinal cortex layer II neurons. J. Neurophysiol. 1993, 70, 144–157. [Google Scholar] [CrossRef] [PubMed]
- Gloveli, T.; Egorov, A.V.; Schmitz, D.; Heinemann, U.; Müller, W. Carbachol-induced changes in excitability and [Ca2+]i signalling in projection cells of medial entorhinal cortex layers II and III. Eur. J. Neurosci. 1999, 11, 3626–3636. [Google Scholar] [CrossRef]
- Erchova, I.; Kreck, G.; Heinemann, U.; Herz, A.V.M. Dynamics of rat entorhinal cortex layer II and III cells: Characteristics of membrane potential resonance at rest predict oscillation properties near threshold. J. Physiol. 2004, 560, 89–110. [Google Scholar] [CrossRef]
- Giocomo, L.M.; Zilli, E.A.; Fransen, E.; Hasselmo, M.E. Temporal frequency of subthreshold oscillations scales with entorhinal grid cell field spacing. Science 2007, 315, 1719–1722. [Google Scholar] [CrossRef] [Green Version]
- Garden, D.L.; Dodson, P.D.; O’Donnell, C.; White, M.D.; Nolan, M.F. Tuning of synaptic integration in the medial entorhinal cortex to the organization of grid cell firing fields. Neuron 2008, 60, 875–889. [Google Scholar] [CrossRef] [Green Version]
- Fernández-Ruiz, A.; Oliva, A.; Soula, M.; Rocha-Almeida, F.; Nagy, G.A.; Martin-Vazquez, G.; Buzsáki, G. Gamma rhythm communication between entorhinal cortex and dentate gyrus neuronal assemblies. Science 2021, 372, eabf3119. [Google Scholar] [CrossRef]
- Beed, P.; Gundlfinger, A.; Schneiderbauer, S.; Song, J.; Böhm, C.; Burgalossi, A.; Brecht, M.; Vida, I.; Schmitz, D. Inhibitory gradient along the dorsoventral axis in the medial entorhinal cortex. Neuron 2013, 79, 1197–1207. [Google Scholar] [CrossRef] [PubMed] [Green Version]
- Drake, C.T.; Milner, T.A. Mu Opioid receptors are in discrete hippocampal interneuron subpopulations. Hippocampus 2002, 12, 119–136. [Google Scholar] [CrossRef] [PubMed]
- Drake, C.T.; Milner, T.A. Mu opioid receptors are extensively co-localized with parvalbumin, but not somatostatin, in the dentate gyrus. Neurosci. Lett. 2006, 403, 176–180. [Google Scholar] [CrossRef] [PubMed]
- Taki, K.; Kaneko, T.; Mizuno, N. A group of cortical interneurons expressing mu-opioid receptor-like immunoreactivity: A double immunofluorescence study in the rat cerebral cortex. Neuroscience 2000, 98, 221–231. [Google Scholar] [CrossRef] [Green Version]
- Svoboda, K.R.; Adams, C.E.; Lupica, C.R. Opioid receptor subtype expression defines morphologically distinct classes of hippocampal interneurons. J. Neurosci. 1999, 19, 85–95. [Google Scholar] [CrossRef] [Green Version]
- Zhang, Y.; Ahmed, S.; Neagu, G.; Wang, Y.; Li, Z.; Wen, J.; Liu, C.; Vreugdenhil, M. µ-Opioid receptor activation modulates CA3-to-CA1 gamma oscillation phase-coupling. IBRO Rep. 2019, 6, 122–131. [Google Scholar] [CrossRef]
- Liao, W.T.; Chang, C.L.; Hsiao, Y.T. Activation of cannabinoid type 1 receptors decreases the synchronization of local field potential oscillations in the hippocampus and entorhinal cortex and prolongs the interresponse time during a differential-reinforcement-of-low-rate task. Eur. J. Neurosci. 2020, 52, 4249–4266. [Google Scholar] [CrossRef]
- Skosnik, P.D.; Hajós, M.; Cortes-Briones, J.A.; Edwards, C.R.; Pittman, B.P.; Hoffmann, W.E.; Sewell, A.R.; D’Souza, D.C.; Ranganathan, M. Cannabinoid receptor-mediated disruption of sensory gating and neural oscillations: A translational study in rats and humans. Neuropharmacology 2018, 135, 412–423. [Google Scholar] [CrossRef]
- Varga, C.; Lee, S.Y.; Soltesz, I. Target-selective GABAergic control of entorhinal cortex output. Nat. Neurosci. 2010, 13, 822–824. [Google Scholar] [CrossRef]
- Armstrong, C.; Wang, J.; Yeun Lee, S.; Broderick, J.; Bezaire, M.J.; Lee, S.H.; Soltesz, I. Target-selectivity of parvalbumin-positive interneurons in layer II of medial entorhinal cortex in normal and epileptic animals. Hippocampus 2016, 26, 779–793. [Google Scholar] [CrossRef]
- Golomb, D.; Donner, K.; Shacham, L.; Shlosberg, D.; Amitai, Y.; Hansel, D. Mechanisms of firing patterns in fast-spiking cortical interneurons. PLoS Comput. Biol. 2007, 3, e156. [Google Scholar] [CrossRef] [PubMed] [Green Version]
- Helm, J.; Akgul, G.; Wollmuth, L.P. Subgroups of parvalbumin-expressing interneurons in layers 2/3 of the visual cortex. J. Neurophysiol. 2013, 109, 1600–1613. [Google Scholar] [CrossRef] [PubMed] [Green Version]
- Lewis, M.E.; Pert, A.; Pert, C.B.; Herkenham, M. Opiate receptor localization in rat cerebral cortex. J. Comp. Neurol. 1983, 216, 339–358. [Google Scholar] [CrossRef] [PubMed]
- Brown, J.T.; Davie, C.H.; Randall, A.D. Synaptic activation of GABA(B) receptors regulates neuronal network activity and entrainment. Eur. J. Neurosci. 2007, 25, 2982–2990. [Google Scholar] [CrossRef]
- Dugladze, T.; Maziashvili, N.; Börgers, C.; Gurgenidze, S.; Häussler, U.; Winkelmann, A.; Haas, C.A.; Meier, J.C.; Vida, I.; Kopell, N.J.; et al. GABA(B) autoreceptor-mediated cell type-specific reduction of inhibition in epileptic mice. Proc. Natl. Acad. Sci. USA 2013, 110, 15073–15078. [Google Scholar] [CrossRef] [PubMed] [Green Version]
- Kangrga, I.; Jiang, M.C.; Randić, M. Actions of (-)-baclofen on rat dorsal horn neurons. Brain Res. 1991, 562, 265–275. [Google Scholar] [CrossRef]
- Freund, T.F.; Buzsáki, G. Interneurons of the hippocampus. Hippocampus 1996, 6, 347–470. [Google Scholar] [CrossRef]
- Gonchar, Y.; Burkhalter, A. Three distinct families of GABAergic neurons in rat visual cortex. Cereb. Cortex 1997, 7, 347–358. [Google Scholar] [CrossRef] [Green Version]
- Kawaguchi, Y.; Kubota, Y. GABAergic cell subtypes and their synaptic connections in rat frontal cortex. Cereb. Cortex 1997, 7, 476–486. [Google Scholar] [CrossRef] [Green Version]
- Urban-Ciecko, J.; Barth, A.L. Somatostatin-expressing neurons in cortical networks. Nat. Rev. Neurosci. 2016, 17, 401–409. [Google Scholar] [CrossRef]
- Couey, J.J.; Witoelar, A.; Zhang, S.J.; Zheng, K.; Ye, J.; Dunn, B.; Czajkowski, R.; Moser, M.B.; Moser, E.I.; Roudi, Y.; et al. Recurrent inhibitory circuitry as a mechanism for grid formation. Nat. Neurosci. 2013, 16, 318–324. [Google Scholar] [CrossRef] [PubMed]
- Fuchs, E.C.; Neitz, A.; Pinna, R.; Melzer, S.; Caputi, A.; Monyer, H. Local and Distant Input Controlling Excitation in Layer II of the Medial Entorhinal Cortex. Neuron 2016, 89, 194–208. [Google Scholar] [CrossRef] [PubMed] [Green Version]
- Domnisoru, C.; Kinkhabwala, A.A.; Tank, D.W. Membrane potential dynamics of grid cells. Nature 2013, 495, 199–204. [Google Scholar] [CrossRef] [PubMed] [Green Version]
- Schmidt-Hieber, C.; Häusser, M. Cellular mechanisms of spatial navigation in the medial entorhinal cortex. Nat. Neurosci. 2013, 16, 325–331. [Google Scholar] [CrossRef] [PubMed]
- Sun, C.; Kitamura, T.; Yamamoto, J.; Martin, J.; Pignatelli, M.; Kitch, L.J.; Schnitzer, M.J.; Tonegawa, S. Distinct speed dependence of entorhinal island and ocean cells, including respective grid cells. Proc. Natl. Acad. Sci. USA 2015, 112, 9466–9471. [Google Scholar] [CrossRef] [Green Version]
- Uchida, S.; Maehara, T.; Hirai, N.; Okubo, Y.; Shimizu, H. Cortical oscillations in human medial temporal lobe during wakefulness and all-night sleep. Brain Res. 2001, 891, 7–19. [Google Scholar] [CrossRef]
- Chrobak, J.J.; Buzsáki, G. Gamma oscillations in the entorhinal cortex of the freely behaving rat. J. Neurosci. 1998, 18, 388–398. [Google Scholar] [CrossRef] [Green Version]
- Quilichini, P.; Sirota, A.; Buzsáki, G. Intrinsic circuit organization and theta-gamma oscillation dynamics in the entorhinal cortex of the rat. J. Neurosci. 2010, 30, 11128–11142. [Google Scholar] [CrossRef] [Green Version]
- Buzsáki, G.; Wang, X.J. Mechanisms of gamma oscillations. Annu. Rev. Neurosci. 2012, 35, 203–225. [Google Scholar] [CrossRef] [Green Version]
- Bragin, A.; Jandó, G.; Nádasdy, Z.; Hetke, J.; Wise, K.; Buzsáki, G. Gamma (40–100 Hz) oscillation in the hippocampus of the behaving rat. J. Neurosci. 1995, 15, 47–60. [Google Scholar] [CrossRef]
- Gloveli, T.; Dugladze, T.; Saha, S.; Monyer, H.; Heinemann, U.; Traub, R.D.; Whittington, M.A.; Buhl, E.H. Differential involvement of oriens/pyramidale interneurones in hippocampal network oscillations in vitro. J. Physiol. 2005, 562, 131–147. [Google Scholar] [CrossRef] [PubMed]
- Hasenstaub, A.; Shu, Y.; Haider, B.; Kraushaar, U.; Duque, A.; McCormick, D.A. Inhibitory postsynaptic potentials carry synchronized frequency information in active cortical networks. Neuron 2005, 47, 423–435. [Google Scholar] [CrossRef] [PubMed] [Green Version]
- Cardin, J.A.; Carlén, M.; Meletis, K.; Knoblich, U.; Zhang, F.; Deisseroth, K.; Tsai, L.H.; Moore, C.I. Driving fast-spiking cells induces gamma rhythm and controls sensory responses. Nature 2009, 459, 663–667. [Google Scholar] [CrossRef] [PubMed] [Green Version]
- Sohal, V.S.; Zhang, F.; Yizhar, O.; Deisseroth, K. Parvalbumin neurons and gamma rhythms enhance cortical circuit performance. Nature 2009, 459, 698–702. [Google Scholar] [CrossRef] [PubMed] [Green Version]
- Whittington, M.A.; Traub, R.D.; Jefferys, J.G. Synchronized oscillations in interneuron networks driven by metabotropic glutamate receptor activation. Nature 1995, 373, 612–615. [Google Scholar] [CrossRef]
- Buhl, E.H.; Tamás, G.; Fisahn, A. Cholinergic activation and tonic excitation induce persistent gamma oscillations in mouse somatosensory cortex in vitro. J. Physiol. 1998, 513, 117–126. [Google Scholar] [CrossRef]
- Fisahn, A.; Pike, F.G.; Buhl, E.H.; Paulsen, O. Cholinergic induction of network oscillations at 40 Hz in the hippocampus in vitro. Nature 1998, 394, 186–189. [Google Scholar] [CrossRef]
- Hansel, D.; Mato, G. Asynchronous states and the emergence of synchrony in large networks of interacting excitatory and inhibitory neurons. Neural Comput. 2003, 15, 1–56. [Google Scholar] [CrossRef]
- Börgers, C.; Kopell, N. Synchronization in networks of excitatory and inhibitory neurons with sparse, random connectivity. Neural Comput. 2003, 15, 509–538. [Google Scholar] [CrossRef]
- Whittington, M.A.; Traub, R.D.; Kopell, N.; Ermentrout, B.; Buhl, E.H. Inhibition-based rhythms: Experimental and mathematical observations on network dynamics. Int. J. Psychophysiol. 2000, 38, 315–336. [Google Scholar] [CrossRef]
- Bartos, M.; Vida, I.; Jonas, P. Synaptic mechanisms of synchronized gamma oscillations in inhibitory interneuron networks. Nat. Rev. Neurosci. 2007, 8, 45–56. [Google Scholar] [CrossRef] [PubMed]
- Mann, E.O.; Radcliffe, C.A.; Paulsen, O. Hippocampal gamma-frequency oscillations: From interneurones to pyramidal cells, and back. J. Physiol. 2005, 562, 55–63. [Google Scholar] [CrossRef] [PubMed]
- Jafari-Sabet, M.; Jannat-Dastjerdi, I. Muscimol state-dependent memory: Involvement of dorsal hippocampal mu-opioid receptors. Behav. Brain Res. 2009, 202, 5–10. [Google Scholar] [CrossRef] [PubMed]
- McQuiston, A.R. Layer selective presynaptic modulation of excitatory inputs to hippocampal cornu Ammon 1 by mu-opioid receptor activation. Neuroscience 2008, 51, 209–221. [Google Scholar] [CrossRef] [Green Version]
- Zieglgänsberger, W.; French, E.D.; Siggins, G.R.; Bloom, F.E. Opioid peptides may excite hippocampal pyramidal neurons by inhibiting adjacent inhibitory interneurons. Science 1979, 205, 415–417. [Google Scholar] [CrossRef]
- Madison, D.V.; Nicoll, R.A. Enkephalin hyperpolarizes interneurones in the rat hippocampus. J. Physiol. 1988, 398, 123–130. [Google Scholar] [CrossRef] [Green Version]
- McQuiston, A.R.; Saggau, P. Mu-opioid receptors facilitate the propagation of excitatory activity in rat hippocampal area CA1 by disinhibition of all anatomical layers. J. Neurophysiol. 2003, 90, 1936–1948. [Google Scholar] [CrossRef] [Green Version]
- Bracci, E.; Centonze, D.; Bernardi, G.; Calabresi, P. Voltage-dependent membrane potential oscillations of rat striatal fast-spiking interneurons. J. Physiol. 2003, 549, 121–130. [Google Scholar] [CrossRef]
- Tateno, T.; Harsch, A.; Robinson, H.P. Threshold firing frequency-current relationships of neurons in rat somatosensory cortex: Type 1 and type 2 dynamics. J. Neurophysiol. 2004, 92, 2283–2294. [Google Scholar] [CrossRef] [Green Version]
- Woodruff, A.R.; Sah, P. Networks of parvalbumin-positive interneurons in the basolateral amygdala. J. Neurosci. 2007, 27, 553–563. [Google Scholar] [CrossRef] [Green Version]
- Goldberg, E.M.; Clark, B.D.; Zagha, E.; Nahmani, M.; Erisir, A.; Rudy, B. K+ channels at the axon initial segment dampen near-threshold excitability of neocortical fast-spiking GABAergic interneurons. Neuron 2008, 58, 387–400. [Google Scholar] [CrossRef] [PubMed] [Green Version]
- Sciamanna, G.; Wilson, C.J. The ionic mechanism of gamma resonance in rat striatal fast-spiking neurons. J. Neurophysiol. 2011, 106, 2936–2949. [Google Scholar] [CrossRef] [PubMed] [Green Version]
- Beatty, J.A.; Song, S.C.; Wilson, C.J. Cell-type-specific resonances shape the responses of striatal neurons to synaptic input. J. Neurophysiol. 2015, 113, 688–700. [Google Scholar] [CrossRef] [PubMed] [Green Version]
- Higgs, M.H.; Wilson, C.J. Frequency-dependent entrainment of striatal fast-spiking interneurons. J. Neurophysiol. 2019, 122, 1060–1072. [Google Scholar] [CrossRef] [PubMed]
- Chapman, C.A.; Lacaille, J.C. Cholinergic induction of theta-frequency oscillations in hippocampal inhibitory interneurons and pacing of pyramidal cell firing. J. Neurosci. 1999, 19, 8637–8645. [Google Scholar] [CrossRef] [Green Version]
- Chapman, C.A.; Lacaille, J.C. Intrinsic theta-frequency membrane potential oscillations in hippocampal CA1 interneurons of stratum lacunosum-moleculare. J. Neurophysiol. 1999, 81, 1296–1307. [Google Scholar] [CrossRef]
- Fellous, J.M.; Houweling, A.R.; Modi, R.H.; Rao, R.P.; Tiesinga, P.H.; Sejnowski, T.J. Frequency dependence of spike timing reliability in cortical pyramidal cells and interneurons. J. Neurophysiol. 2001, 85, 1782–1787. [Google Scholar] [CrossRef] [Green Version]
- Kang, Y.J.; Lewis, H.E.S.; Young, M.W.; Govindaiah, G.; Greenfield, L.J., Jr.; Garcia-Rill, E.; Lee, S.H. Cell Type-specific Intrinsic Perithreshold Oscillations in Hippocampal GABAergic Interneurons. Neuroscience 2018, 376, 80–93. [Google Scholar] [CrossRef]
- Jonas, P.; Bischofberger, J.; Fricker, D.; Miles, R. Interneuron Diversity series: Fast in, fast out—Temporal and spatial signal processing in hippocampal interneurons. Trends Neurosci. 2004, 27, 30–40. [Google Scholar] [CrossRef]
- Klausberger, T.; Somogyi, P. Neuronal diversity and temporal dynamics: The unity of hippocampal circuit operations. Science 2008, 321, 53–57. [Google Scholar] [CrossRef]
- Whittington, M.A.; Traub, R.D. Interneuron diversity series: Inhibitory interneurons and network oscillations in vitro. Trends Neurosci. 2003, 26, 676–682. [Google Scholar] [CrossRef] [PubMed]
- Moca, V.V.; Nikolic, D.; Singer, W.; Mureşan, R.C. Membrane resonance enables stable and robust gamma oscillations. Cereb. Cortex 2014, 24, 119–142. [Google Scholar] [CrossRef] [PubMed] [Green Version]
- Gloveli, T.; Dugladze, T.; Rotstein, H.G.; Traub, R.D.; Monyer, H.; Heinemann, U.; Whittington, M.A.; Kopell, N.J. Orthogonal arrangement of rhythm-generating microcircuits in the hippocampus. Proc. Natl. Acad. Sci. USA 2005, 102, 13295–13300. [Google Scholar] [CrossRef] [PubMed] [Green Version]
- Tort, A.B.; Rotstein, H.G.; Dugladze, T.; Gloveli, T.; Kopell, N.J. On the formation of gamma-coherent cell assemblies by oriens lacunosum-moleculare interneurons in the hippocampus. Proc. Natl. Acad. Sci. USA 2007, 104, 13490–13495. [Google Scholar] [CrossRef] [Green Version]
- Schmitz, D.; Gloveli, T.; Behr, J.; Dugladze, T.; Heinemann, U. Subthreshold membrane potential oscillations in neurons of deep layers of the entorhinal cortex. Neuroscience 1998, 85, 999–1004. [Google Scholar] [CrossRef]
- Bilkey, D.K.; Heinemann, U. Intrinsic theta-frequency membrane potential oscillations in layer III/V perirhinal cortex neurons of the rat. Hippocampus 1999, 9, 510–518. [Google Scholar] [CrossRef]
- Engel, T.A.; Schimansky-Geier, L.; Herz, A.V.M.; Schreiber, S.; Erchova, I. Subthreshold membrane-potential resonances shape spike-train patterns in the entorhinal cortex. J. Neurophysiol. 2008, 100, 1576–1589. [Google Scholar] [CrossRef] [Green Version]
- Boehlen, A.; Henneberger, C.; Heinemann, U.; Erchova, I. Contribution of near-threshold currents to intrinsic oscillatory activity in rat medial entorhinal cortex layer II stellate cells. J. Neurophysiol. 2013, 109, 445–463. [Google Scholar] [CrossRef] [Green Version]
- Alonso, A.; Llinás, R.R. Subthreshold Na+-dependent theta-like rhythmicity in stellate cells of entorhinal cortex layer II. Nature 1989, 342, 175–177. [Google Scholar] [CrossRef]
- Wang, X.J. Ionic basis for intrinsic 40 Hz neuronal oscillations. Neuroreport 1993, 5, 221–224. [Google Scholar] [CrossRef]
- Gutfreund, Y.; Yarom, Y.; Segev, I. Subthreshold oscillations and resonant frequency in guinea-pig cortical neurons: Physiology and modelling. J. Physiol. 1995, 483, 621–640. [Google Scholar] [CrossRef]
- Pape, H.C.; Paré, D.; Driesang, R.B. Two types of intrinsic oscillations in neurons of the lateral and basolateral nuclei of the amygdala. J. Neurophysiol. 1998, 79, 205–216. [Google Scholar] [CrossRef] [PubMed] [Green Version]
- Kantamneni, S. Modulation of neurotransmission by the GABAB receptor. In GABAB Receptor; Colombo, G., Ed.; Springer International Publishing AG: Basel, Switzerland, 2016; Volume 29, pp. 109–128. [Google Scholar] [CrossRef] [Green Version]
- Ramakrishna, Y.; Sadeghi, S.G. Activation of GABAB receptors results in excitatory modulation of calyx terminals in rat semicircular canal cristae. J. Neurophysiol. 2020, 124, 962–972. [Google Scholar] [CrossRef] [PubMed]
- Mizukami, K.; Ishikawa, M.; Hidaka, S.; Iwakiri, M.; Sasaki, M.; Iritani, S. Immunohistochemical localization of GABAB receptor in the entorhinal cortex and inferior temporal cortex of schizophrenic brain. Prog. Neuropsychopharmacol. Biol. Psychiatry 2002, 26, 393–396. [Google Scholar] [CrossRef]
- Gloveli, T.; Behr, J.; Dugladze, T.; Kokaia, Z.; Kokaia, M.; Heinemann, U. Kindling alters entorhinal cortex-hippocampal interaction by increased efficacy of presynaptic GABA(B) autoreceptors in layer III of the entorhinal cortex. Neurobiol. Dis. 2003, 13, 203–212. [Google Scholar] [CrossRef]
- Deng, P.Y.; Xiao, Z.; Yang, C.; Rojanathammanee, L.; Grisanti, L.; Watt, J.; Geiger, J.D.; Liu, R.; Porter, J.E.; Lei, S. GABA(B) receptor activation inhibits neuronal excitability and spatial learning in the entorhinal cortex by activating TREK-2 K+ channels. Neuron 2009, 63, 230–243. [Google Scholar] [CrossRef] [Green Version]
- Meyer, A.H.; Katona, I.; Blatow, M.; Rozov, A.; Monyer, H. In vivo labeling of parvalbumin-positive interneurons and analysis of electrical coupling in identified neurons. J. Neurosci. 2002, 22, 7055–7064. [Google Scholar] [CrossRef] [Green Version]
- Zarnadze, S.; Bäuerle, P.; Santos-Torres, J.; Böhm, C.; Schmitz, D.; Geiger, J.R.; Dugladze, T.; Gloveli, T. Cell-specific synaptic plasticity induced by network oscillations. Elife 2016, 5, e14912. [Google Scholar] [CrossRef]
- Dugladze, T.; Schmitz, D.; Whittington, M.A.; Vida, I.; Gloveli, T. Segregation of axonal and somatic activity during fast network oscillations. Science 2012, 336, 1458–1461. [Google Scholar] [CrossRef]


Publisher’s Note: MDPI stays neutral with regard to jurisdictional claims in published maps and institutional affiliations. |
© 2022 by the authors. Licensee MDPI, Basel, Switzerland. This article is an open access article distributed under the terms and conditions of the Creative Commons Attribution (CC BY) license (https://creativecommons.org/licenses/by/4.0/).
Share and Cite
Gurgenidze, S.; Bäuerle, P.; Schmitz, D.; Vida, I.; Gloveli, T.; Dugladze, T. Cell-Type Specific Inhibition Controls the High-Frequency Oscillations in the Medial Entorhinal Cortex. Int. J. Mol. Sci. 2022, 23, 14087. https://doi.org/10.3390/ijms232214087
Gurgenidze S, Bäuerle P, Schmitz D, Vida I, Gloveli T, Dugladze T. Cell-Type Specific Inhibition Controls the High-Frequency Oscillations in the Medial Entorhinal Cortex. International Journal of Molecular Sciences. 2022; 23(22):14087. https://doi.org/10.3390/ijms232214087
Chicago/Turabian StyleGurgenidze, Shalva, Peter Bäuerle, Dietmar Schmitz, Imre Vida, Tengis Gloveli, and Tamar Dugladze. 2022. "Cell-Type Specific Inhibition Controls the High-Frequency Oscillations in the Medial Entorhinal Cortex" International Journal of Molecular Sciences 23, no. 22: 14087. https://doi.org/10.3390/ijms232214087