Author Contributions
Conceptualization, M.E.G.; methodology, M.d.C.O.-C., V.C., A.M.-I., I.G.-C., C.L. and M.D.; software, C.L., M.D.; validation, C.L., M.D., A.M.-I., I.G.-C. and C.F.G.; formal analysis, M.d.C.O.-C., C.L., M.D., C.F.G. and G.G.G.; investigation, M.d.C.O.-C., V.C., A.M.-I. and I.G.-C.; resources, J.M.M., F.M., J.A., R.G. and M.E.G.; data curation, M.d.C.O.-C.; writing—original draft preparation, M.d.C.O.-C..; writing—review and editing, J.M.M., F.M. and M.E.G.; visualization, M.d.C.O.-C.; supervision, M.E.G.; project administration, M.E.G.; funding acquisition, M.E.G.. All authors have read and agreed to the published version of the manuscript.
Figure 1.
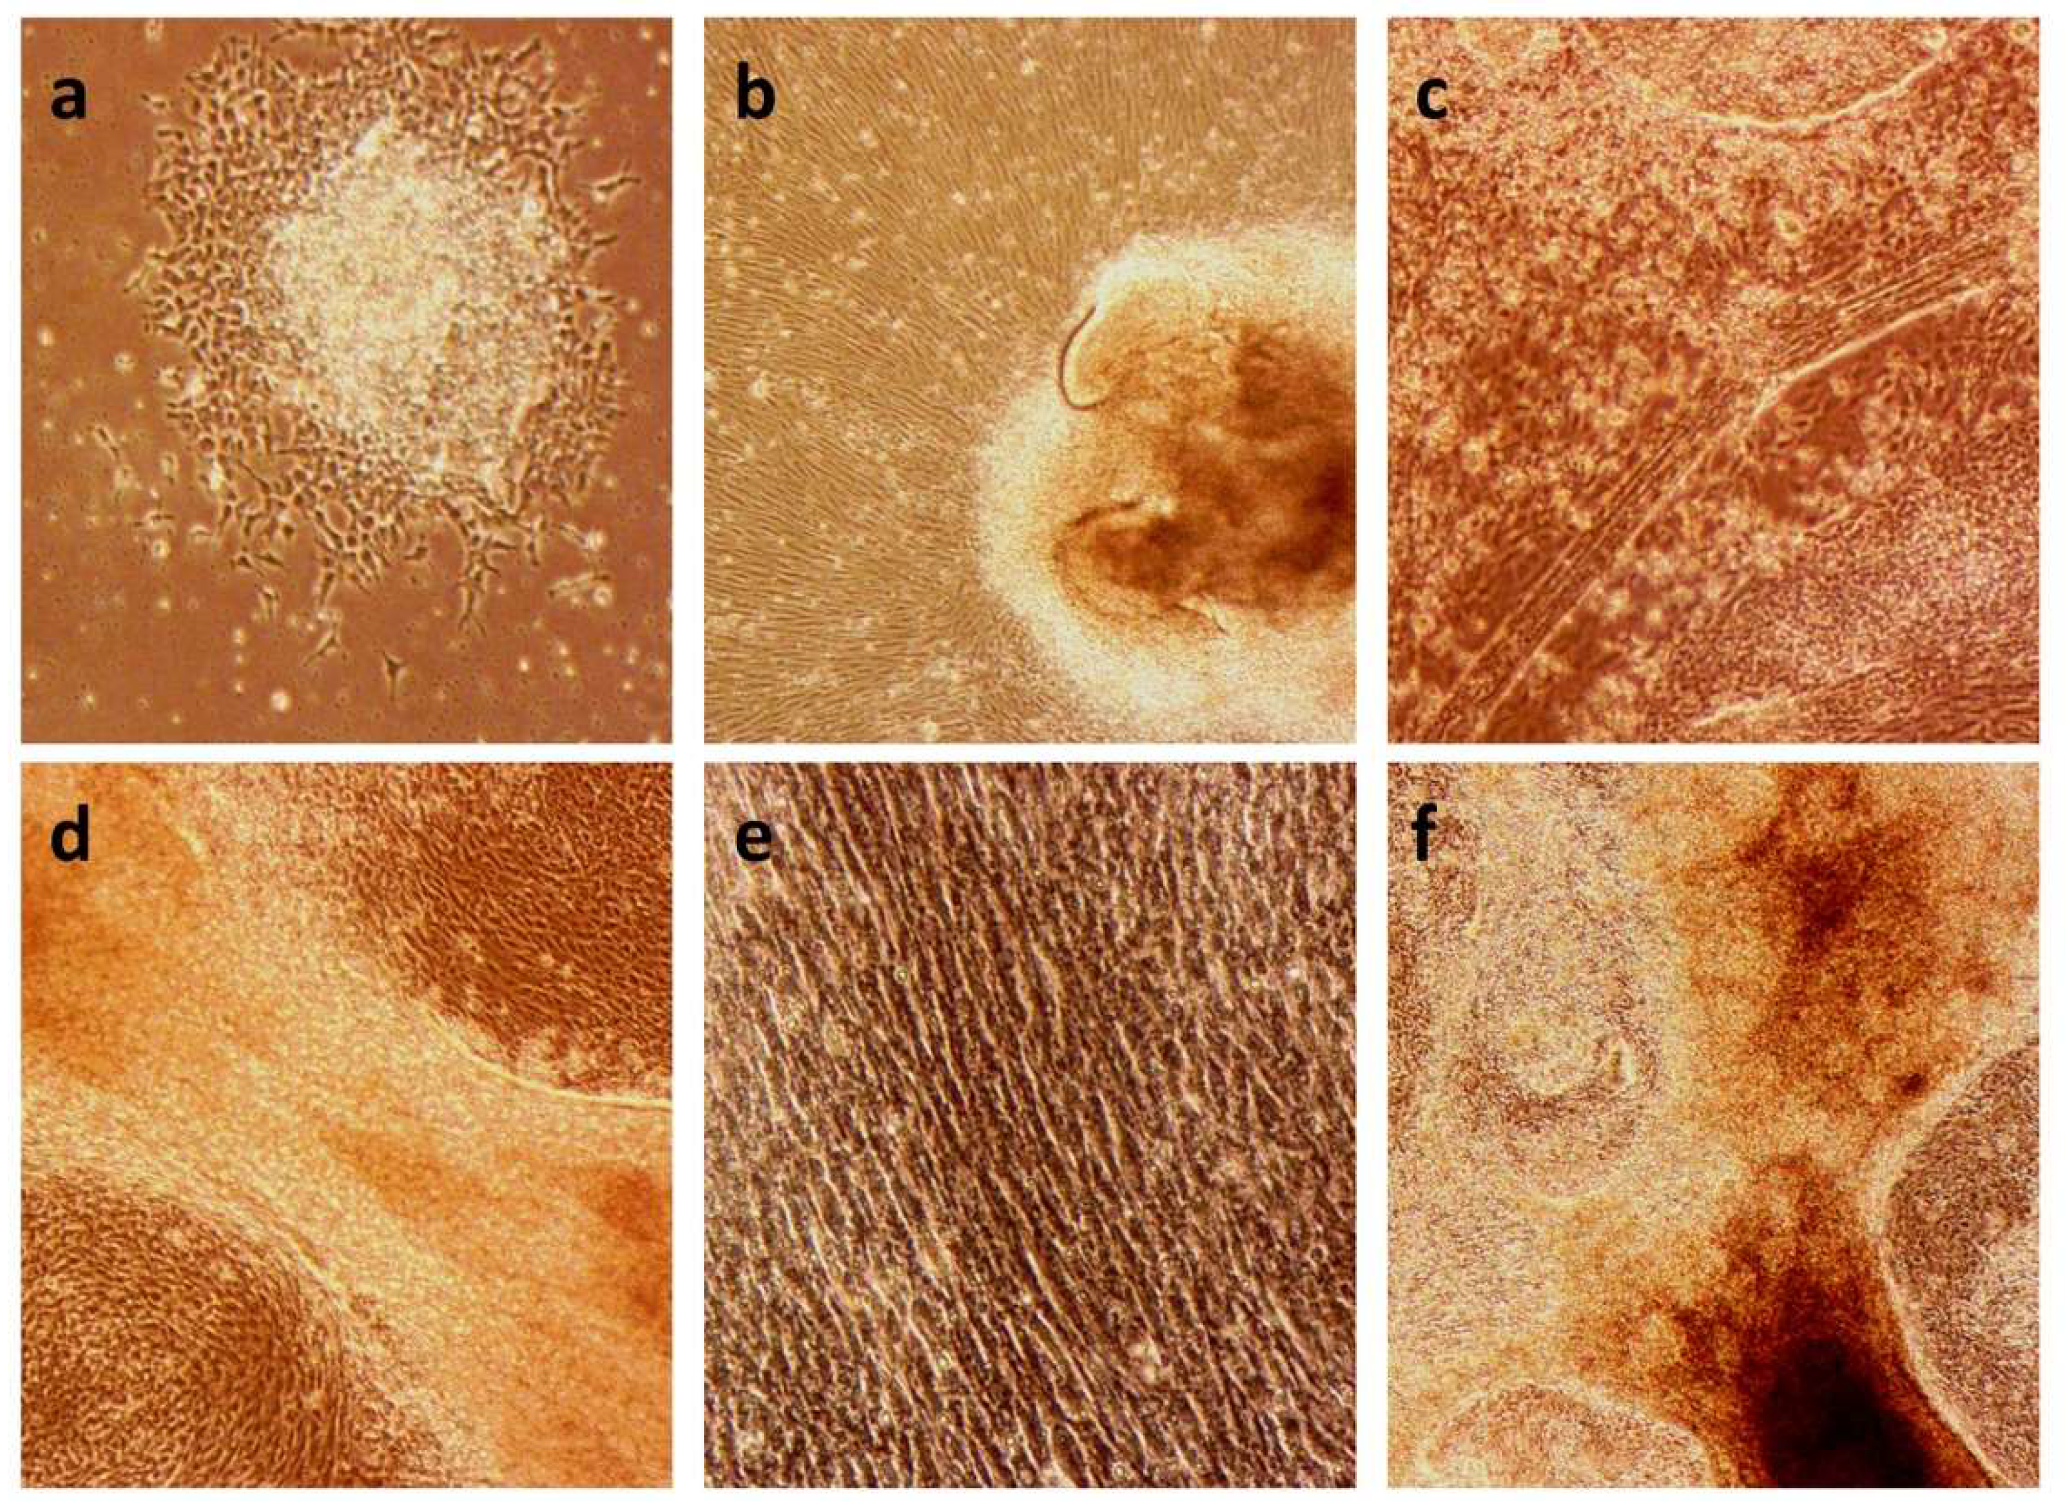
Changes in morphology of the cell cultures throughout the differentiation protocol. (a) MA1 line at day 4 of differentiation (10×). We can observe the centre of the clump still maintaining its stemness, whereas the border starts the differentiation process. (b) MA1 line at day 10 of differentiation (10×). The cells start to align while expanding from the undifferentiated clump. (c) C10 line at day 22 of differentiation (10×). Formation of myofiber-like structures. (d) C10 line at day 25 of differentiation (20×). We can observe in detail the structure of the myofibers formed in the differentiated culture. (e) C10 line at day 25 of differentiation (20×). Details of the alignment of the cells in the differentiated culture. (f) MA4 line at day 28 of differentiation (10×). The culture exhibits a great density, with formed myofiber-like structures.
Figure 1.
Changes in morphology of the cell cultures throughout the differentiation protocol. (a) MA1 line at day 4 of differentiation (10×). We can observe the centre of the clump still maintaining its stemness, whereas the border starts the differentiation process. (b) MA1 line at day 10 of differentiation (10×). The cells start to align while expanding from the undifferentiated clump. (c) C10 line at day 22 of differentiation (10×). Formation of myofiber-like structures. (d) C10 line at day 25 of differentiation (20×). We can observe in detail the structure of the myofibers formed in the differentiated culture. (e) C10 line at day 25 of differentiation (20×). Details of the alignment of the cells in the differentiated culture. (f) MA4 line at day 28 of differentiation (10×). The culture exhibits a great density, with formed myofiber-like structures.
Figure 2.
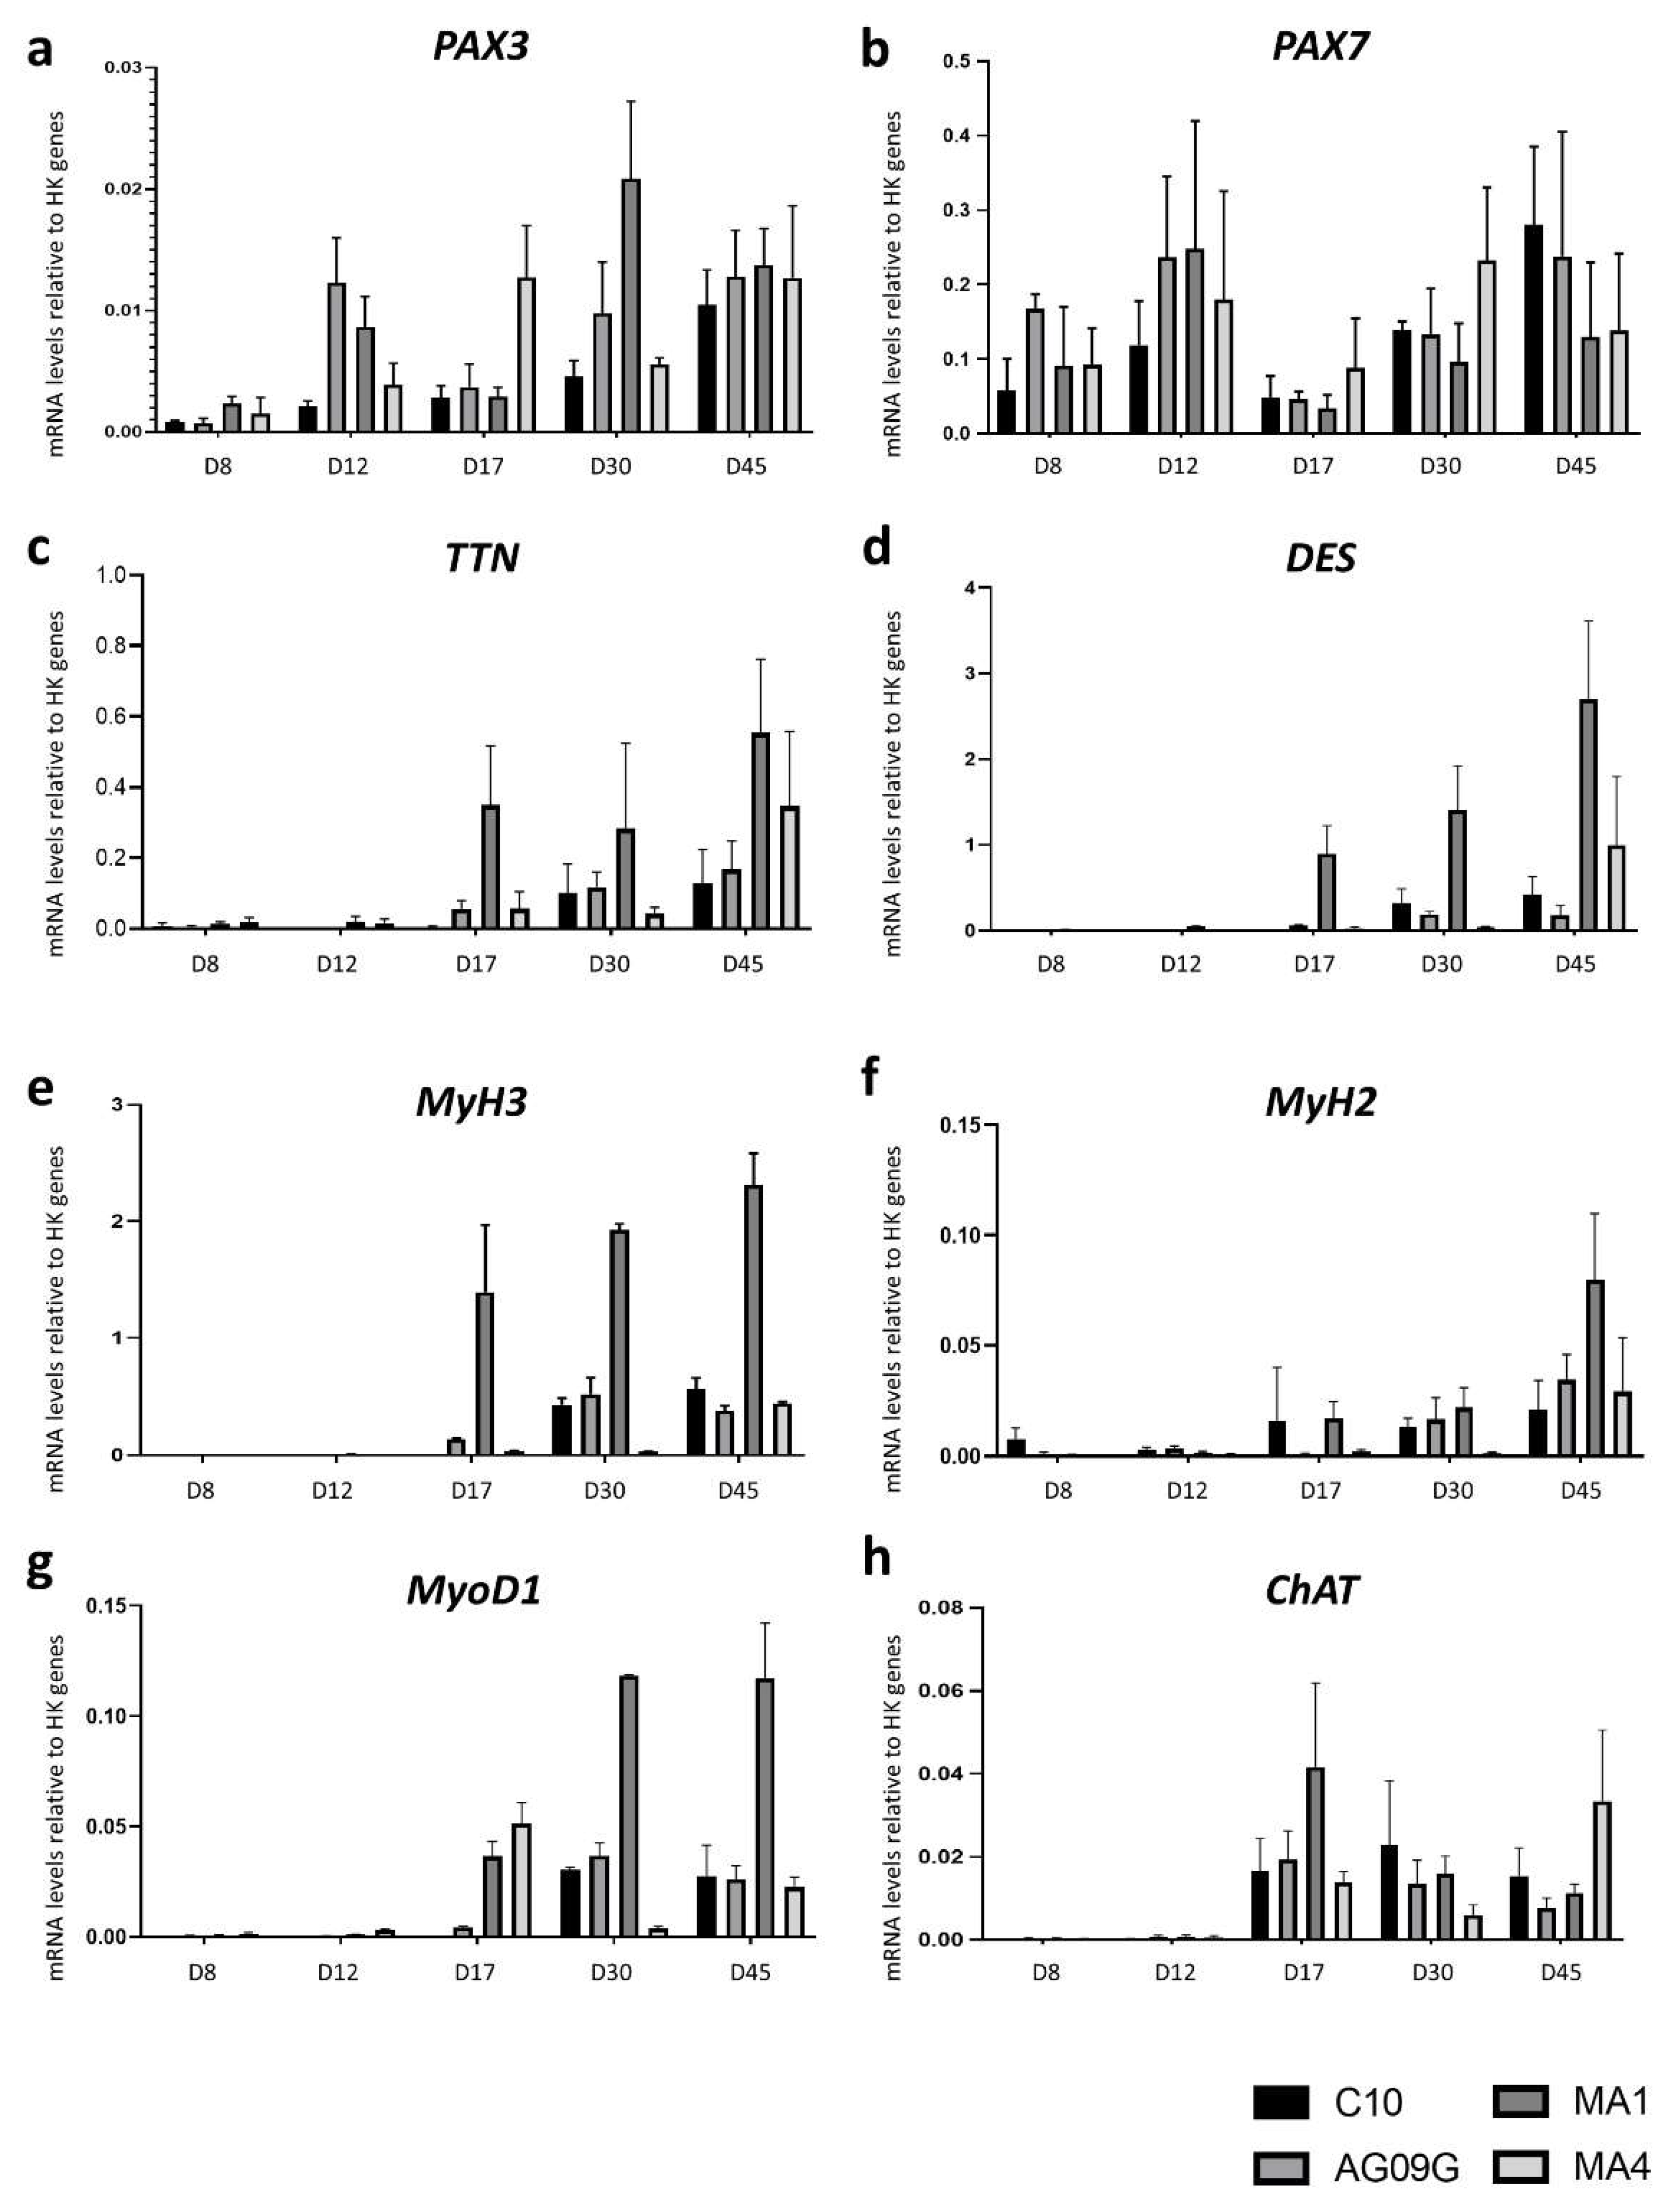
RT-qPCR analysis to assess the differentiation process from iPSCs to innervated skeletal muscle cells. The lines were evaluated at different time points during the differentiation process, at days (D) 8, 12, 17, 30 and 45. We analysed the evolution of the expression of different myogenic genes like PAX3 (a), PAX7 (b), TTN (c), DES (d), MyH3 (e), MyH2 (f) and MyoD1 (g), in addition to the motor neuron marker ChAT (h). The values represent the mean of at least three replicates, and they are relative to the expression mean of two housekeeping (HK) genes (HPRT and PPIA). Error bars show standard deviation.
Figure 2.
RT-qPCR analysis to assess the differentiation process from iPSCs to innervated skeletal muscle cells. The lines were evaluated at different time points during the differentiation process, at days (D) 8, 12, 17, 30 and 45. We analysed the evolution of the expression of different myogenic genes like PAX3 (a), PAX7 (b), TTN (c), DES (d), MyH3 (e), MyH2 (f) and MyoD1 (g), in addition to the motor neuron marker ChAT (h). The values represent the mean of at least three replicates, and they are relative to the expression mean of two housekeeping (HK) genes (HPRT and PPIA). Error bars show standard deviation.
Figure 3.
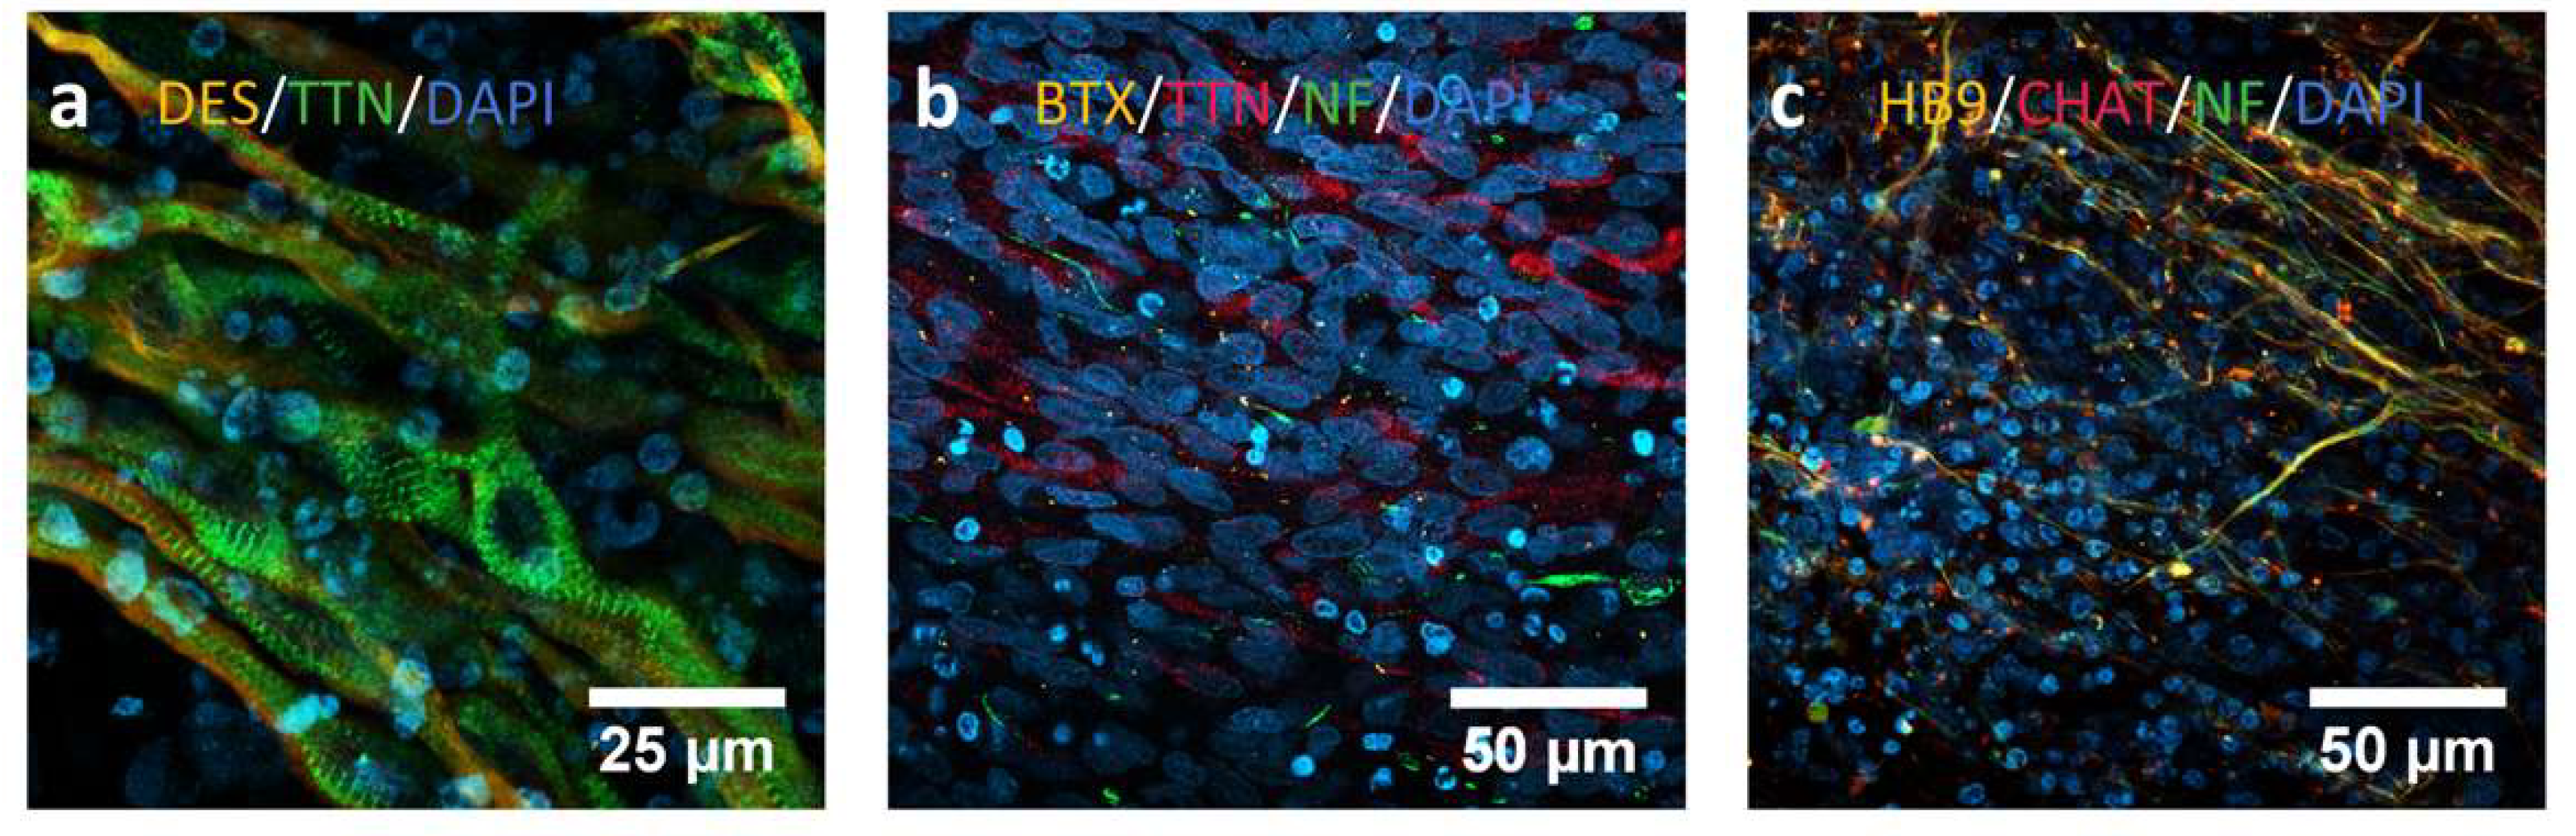
Immunocytochemistry analysis to assess the differentiation process from iPSCs towards innervated skeletal muscle. (a) C10 line at day 30, showing positive staining for Desmin (orange) and Titin (green), both mature myogenic markers. We can even observe a typical skeletal muscle alignment and striation pattern. (b) MA1 line at day 30. We can observe cells positive for Titin (TTN, red) as myogenic marker, and for neurofilament (NF, green) as motor neuron marker. The neuromuscular junctions are marked in orange with an α-bungarotoxin staining. (c) AG09G line at day 30. We can observe here the presence of motor neurons in the culture after the differentiation process, positive for markers like homeobox9 (HB9, orange), choline O-acetyltransferase (ChAT, red) and NF (green).
Figure 3.
Immunocytochemistry analysis to assess the differentiation process from iPSCs towards innervated skeletal muscle. (a) C10 line at day 30, showing positive staining for Desmin (orange) and Titin (green), both mature myogenic markers. We can even observe a typical skeletal muscle alignment and striation pattern. (b) MA1 line at day 30. We can observe cells positive for Titin (TTN, red) as myogenic marker, and for neurofilament (NF, green) as motor neuron marker. The neuromuscular junctions are marked in orange with an α-bungarotoxin staining. (c) AG09G line at day 30. We can observe here the presence of motor neurons in the culture after the differentiation process, positive for markers like homeobox9 (HB9, orange), choline O-acetyltransferase (ChAT, red) and NF (green).
Figure 4.
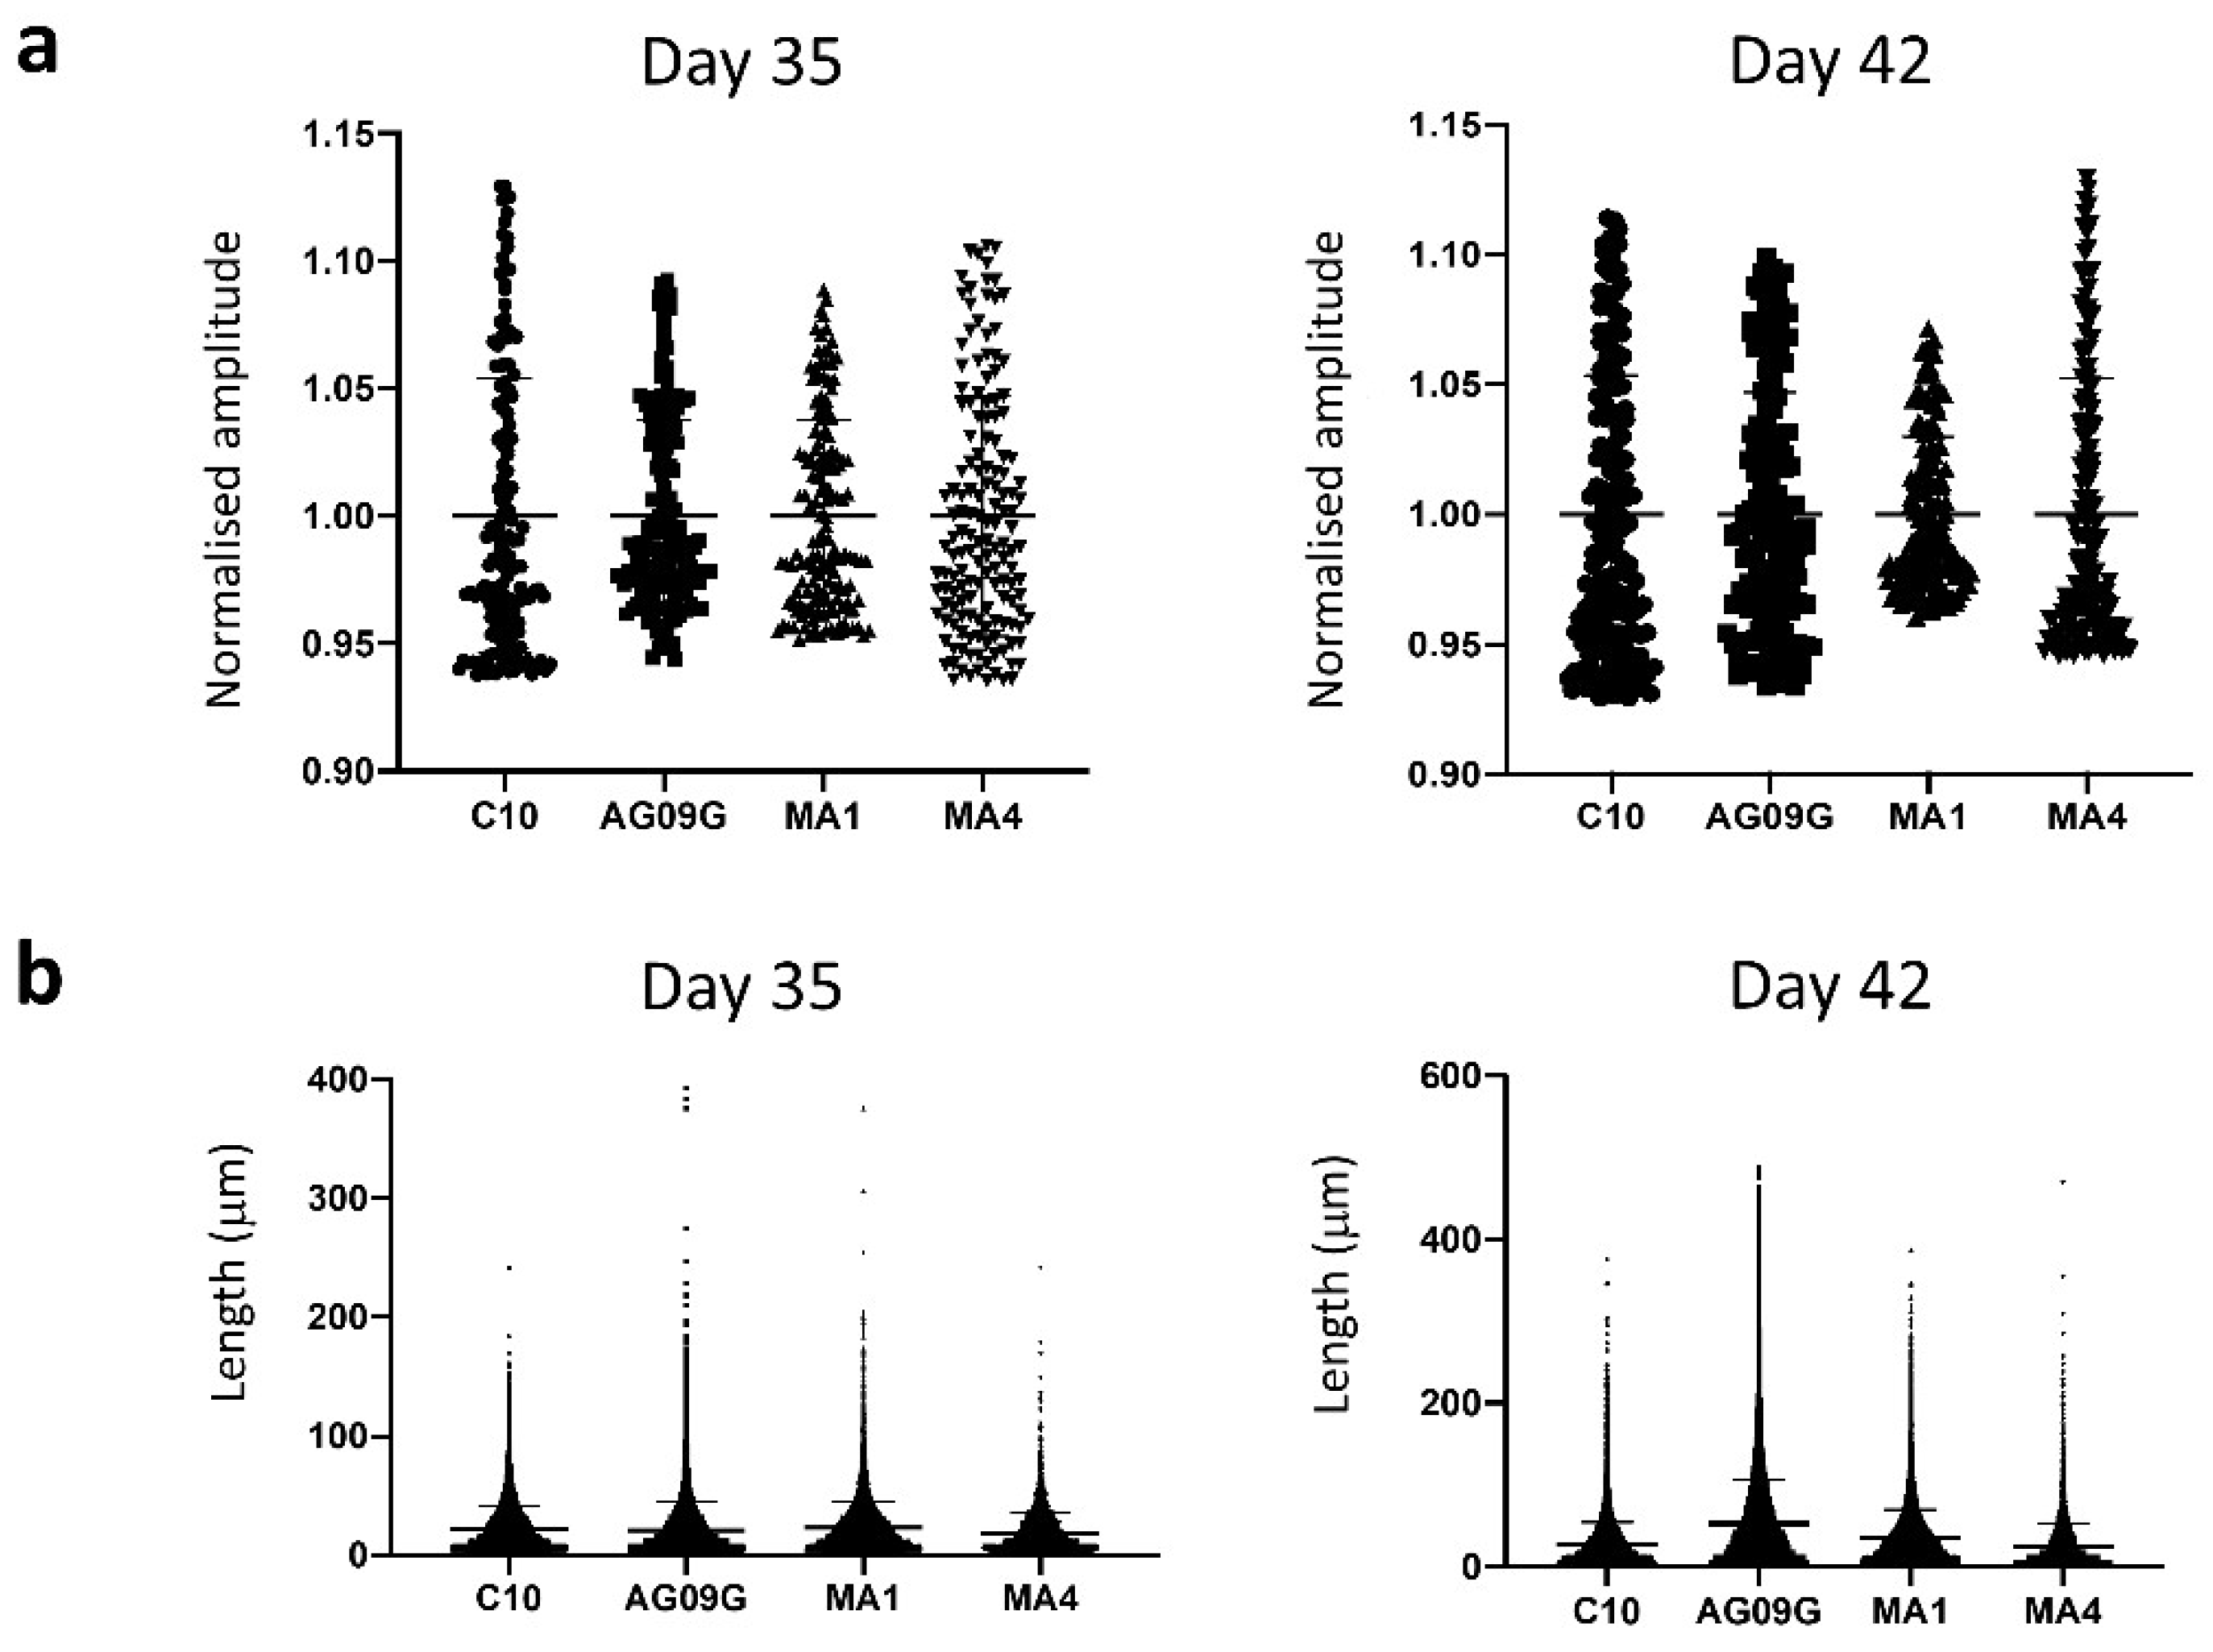
Functional assessment of the differentiated cultures. (a) Analysis of calcium transients. The characterization of calcium transients was performed at days 35 and 42 of differentiation, respectively, in the lines C10, AG09G, MA1 and MA4 by taking the values of intensity mean of at least 50 different fibres. There were no significant differences in the calcium transients of the four cell lines analysed (statistical analysis carried out with a Brown–Forsythe and Welch ANOVA test). (b) Contraction length analysis. We evaluated at least 4000 contraction events from three distinct differentiation experiments at days 35 and 42 in the lines C10, AG09G, MA1 and MA4. There were no significant differences between the values of contraction length of the four lines analysed (statistical analysis carried out with a Kruskal–Wallis test).
Figure 4.
Functional assessment of the differentiated cultures. (a) Analysis of calcium transients. The characterization of calcium transients was performed at days 35 and 42 of differentiation, respectively, in the lines C10, AG09G, MA1 and MA4 by taking the values of intensity mean of at least 50 different fibres. There were no significant differences in the calcium transients of the four cell lines analysed (statistical analysis carried out with a Brown–Forsythe and Welch ANOVA test). (b) Contraction length analysis. We evaluated at least 4000 contraction events from three distinct differentiation experiments at days 35 and 42 in the lines C10, AG09G, MA1 and MA4. There were no significant differences between the values of contraction length of the four lines analysed (statistical analysis carried out with a Kruskal–Wallis test).
Figure 5.
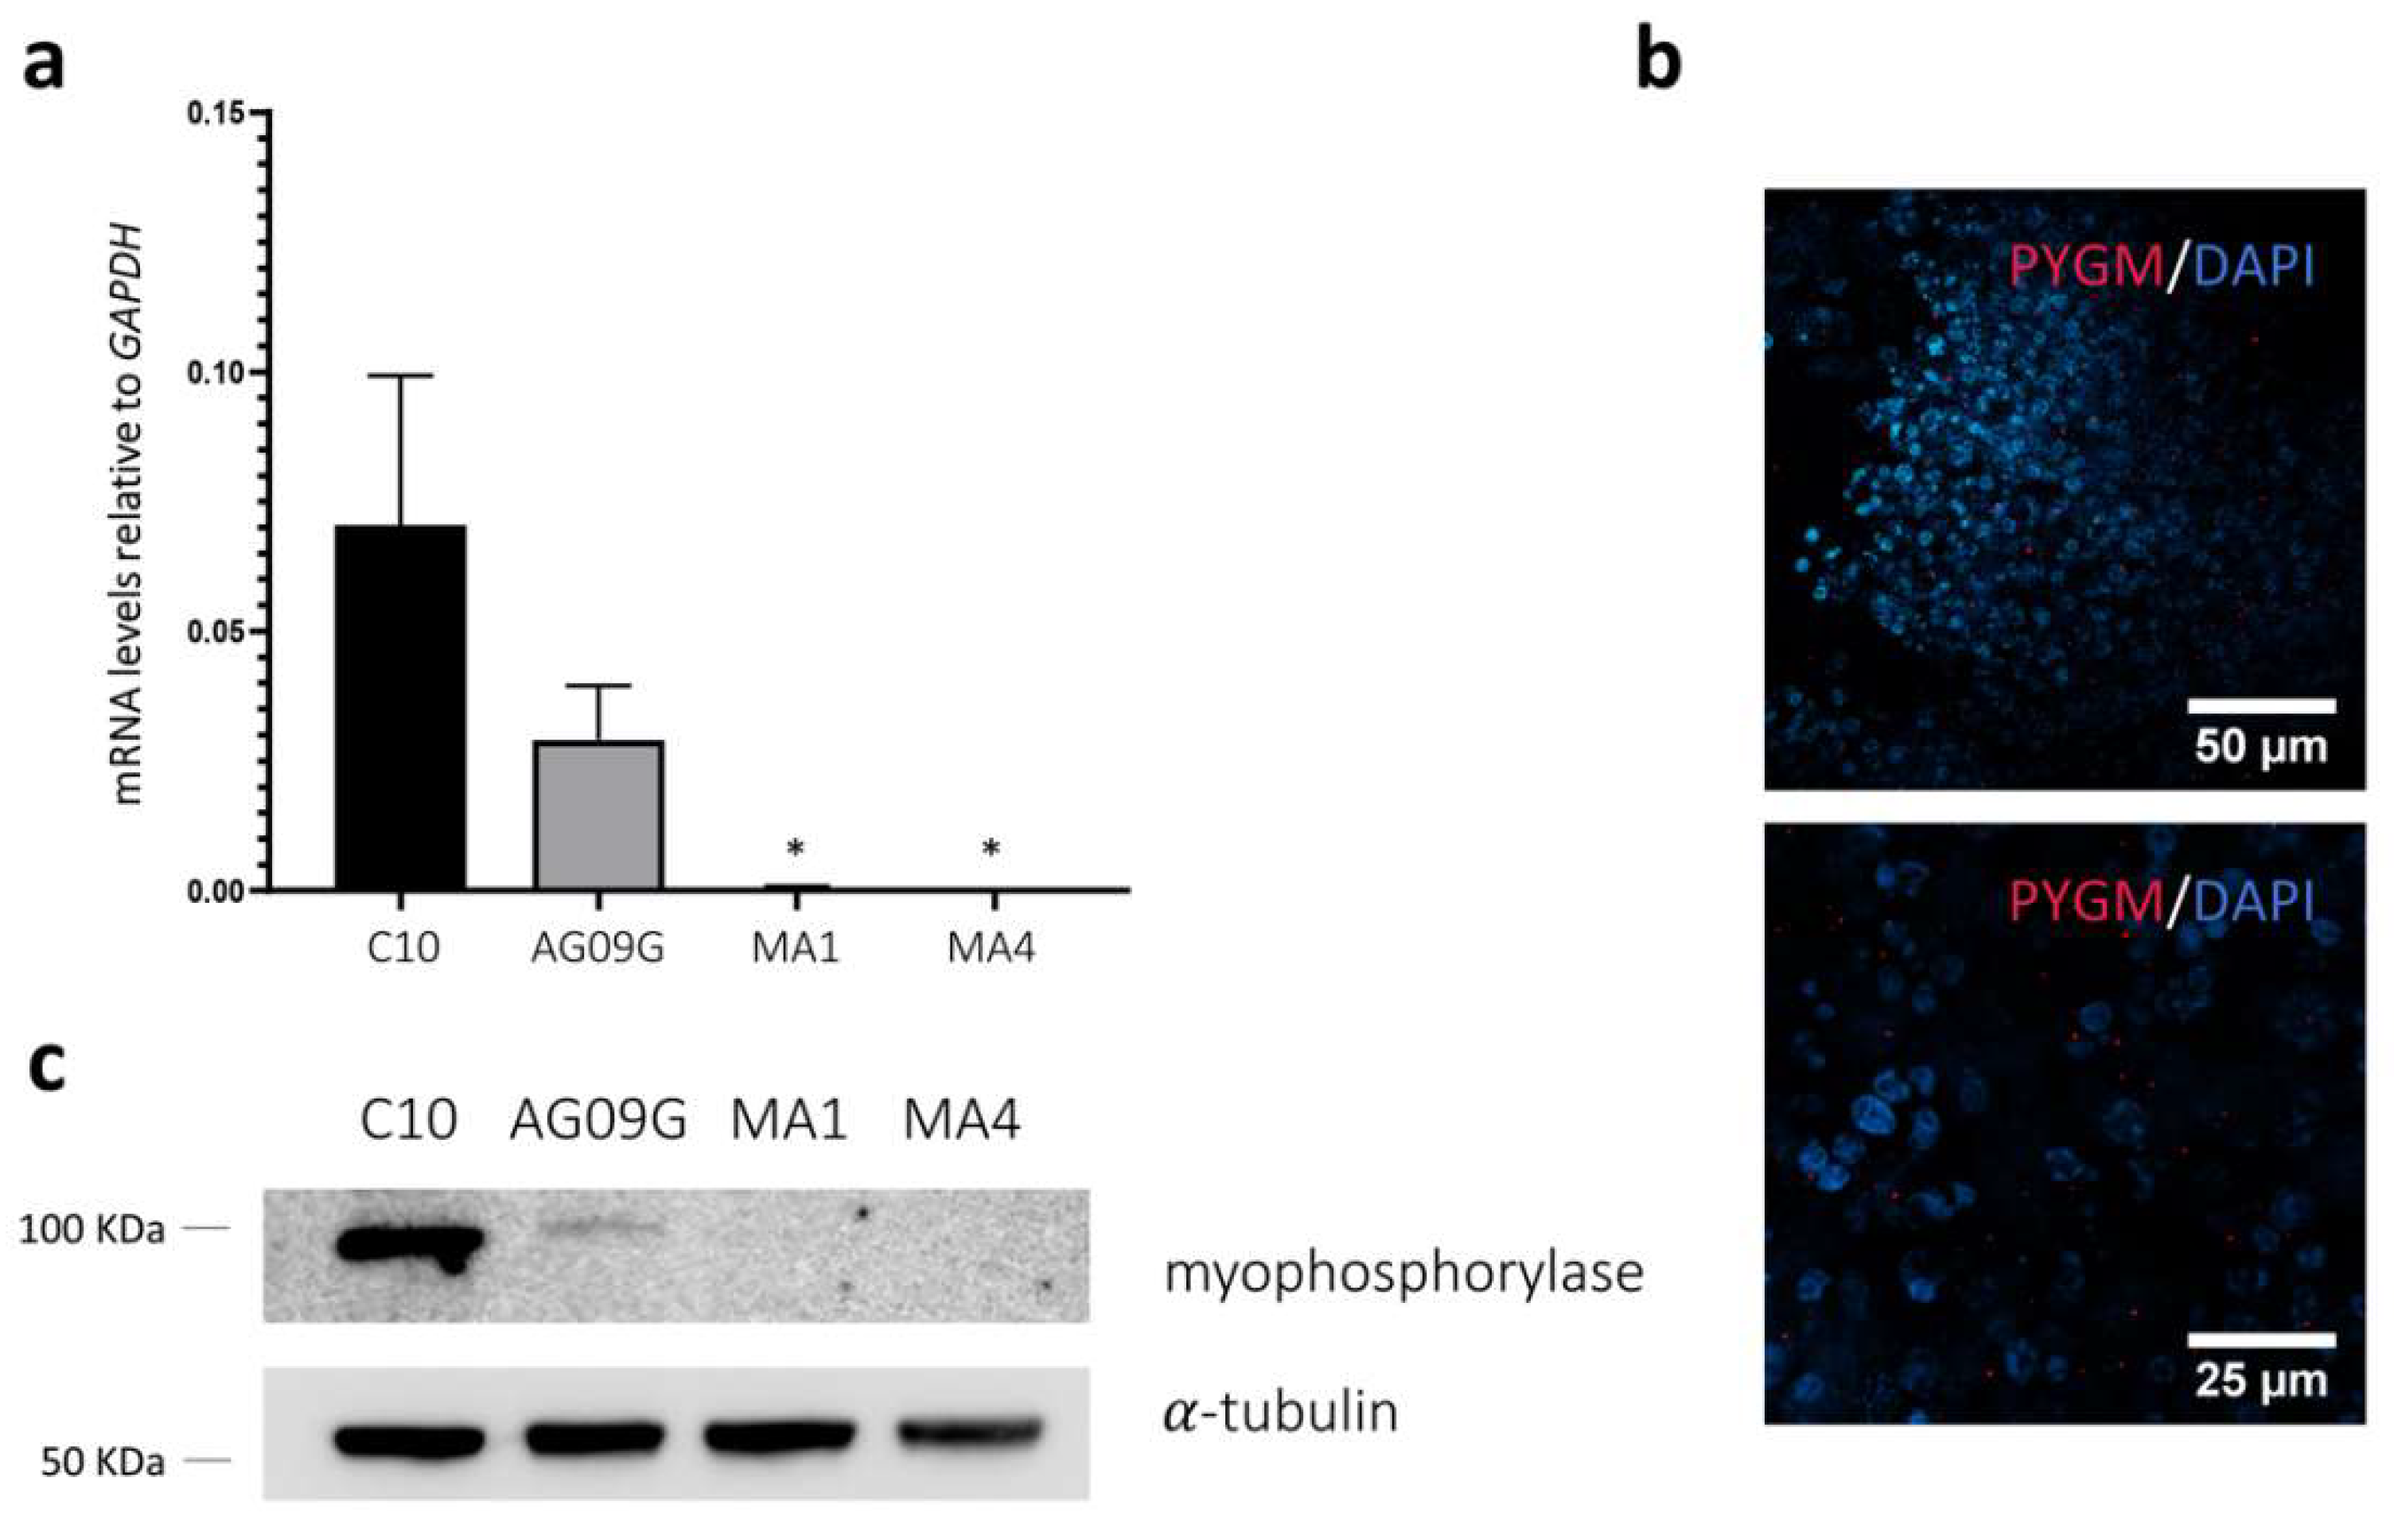
Evaluation of the expression of PYGM in the differentiated cell lines. (a) TaqMan™ assay to assess PYGM expression in the differentiated cell lines C10, AG09G, MA1, and MA4 at day 45. We can observe how the control cell lines do express PYGM as myogenic cultures, whereas both McArdle lines only maintain some negligible levels of expression. Values represent the expression mean of at least three independent replicates, relative to GAPDH as housekeeping gene. Error bars show standard deviation. * p-value < 0.05 versus control lines, one-way ANOVA with Holm–Sidak’s multiple comparisons test. (b) Immunocytochemistry analysis for the lines AG09G (above) and C10 (below). We can observe marked in red the presence of myophosphorylase in the differentiated cultures at day 30. (c) Western Blot analysis of the expression of myophosphorylase in the lines C10, AG09G, MA1 and MA4 at day 45 of differentiation. We can observe the presence of myophosphorylase in the control and its absence in the McArdle lines.
Figure 5.
Evaluation of the expression of PYGM in the differentiated cell lines. (a) TaqMan™ assay to assess PYGM expression in the differentiated cell lines C10, AG09G, MA1, and MA4 at day 45. We can observe how the control cell lines do express PYGM as myogenic cultures, whereas both McArdle lines only maintain some negligible levels of expression. Values represent the expression mean of at least three independent replicates, relative to GAPDH as housekeeping gene. Error bars show standard deviation. * p-value < 0.05 versus control lines, one-way ANOVA with Holm–Sidak’s multiple comparisons test. (b) Immunocytochemistry analysis for the lines AG09G (above) and C10 (below). We can observe marked in red the presence of myophosphorylase in the differentiated cultures at day 30. (c) Western Blot analysis of the expression of myophosphorylase in the lines C10, AG09G, MA1 and MA4 at day 45 of differentiation. We can observe the presence of myophosphorylase in the control and its absence in the McArdle lines.
![Ijms 23 13964 g005]()
Figure 6.
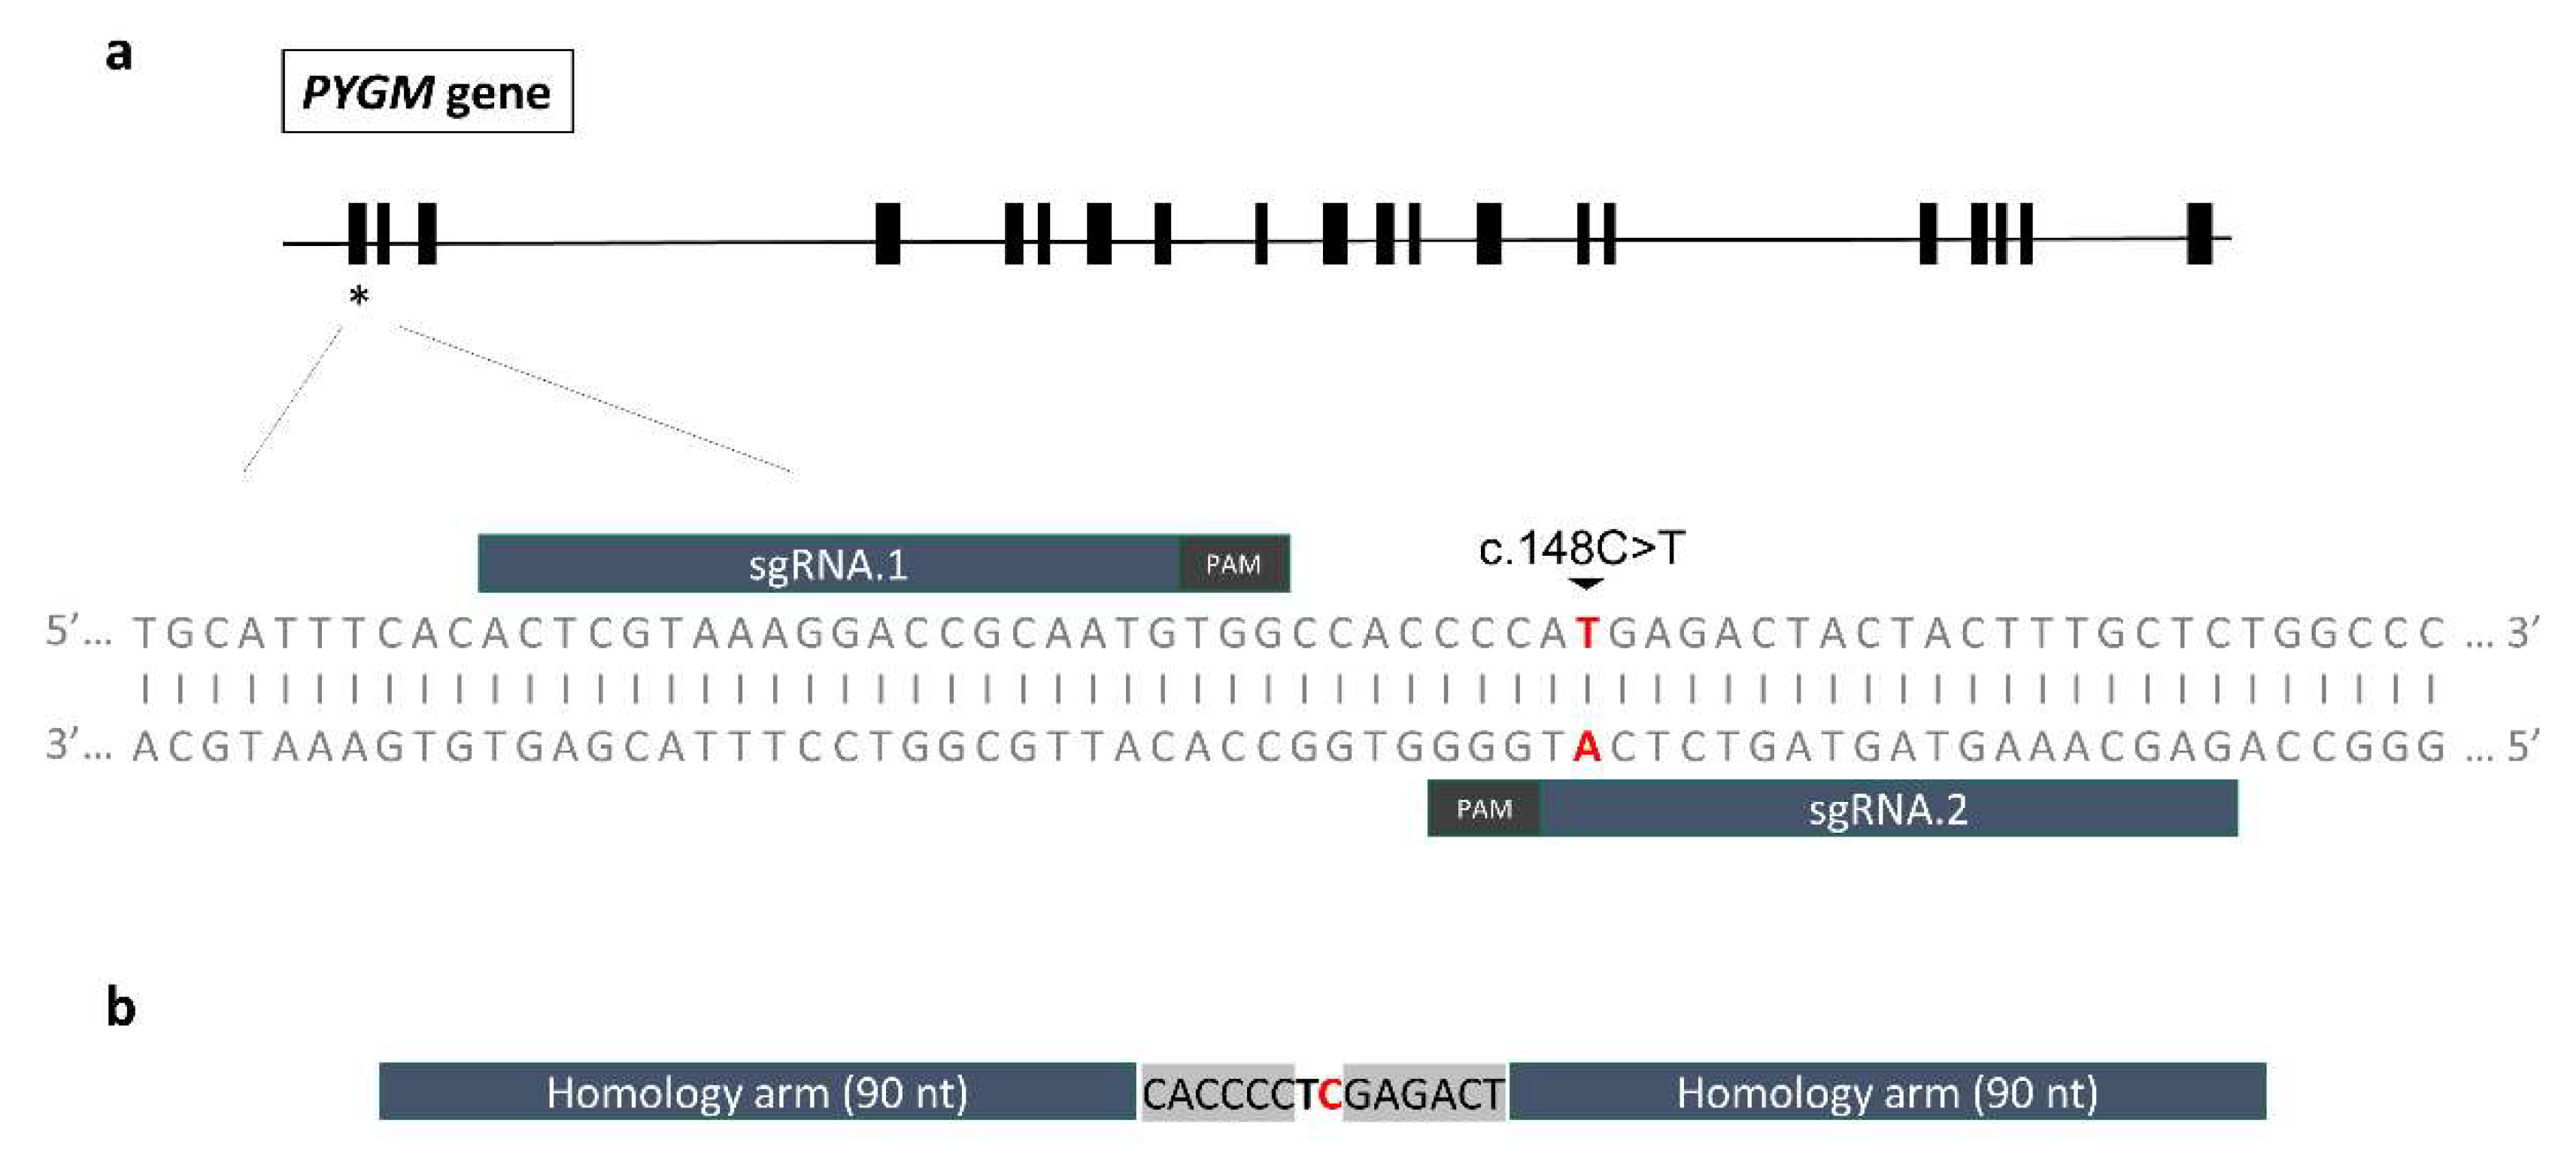
General scheme of the gene editing strategy. (a) Representation of the localization of the two designed sgRNAs targeting exon 1 of the PYGM gene. Both were selected to be placed as close to the c.148C>T; p.R50* mutation as possible, maintaining high on-target and low off-target activities. (b) ssODN repair template design. The 90-nt long homology arms leave two mutations in the centre: the edition of the c.148C>T; p.R50* target mutation (marked in red), and the introduction of a silent mutation to create a restriction site for the enzyme XhoI (c.147A>T; p.P49P, marked in bold).
Figure 6.
General scheme of the gene editing strategy. (a) Representation of the localization of the two designed sgRNAs targeting exon 1 of the PYGM gene. Both were selected to be placed as close to the c.148C>T; p.R50* mutation as possible, maintaining high on-target and low off-target activities. (b) ssODN repair template design. The 90-nt long homology arms leave two mutations in the centre: the edition of the c.148C>T; p.R50* target mutation (marked in red), and the introduction of a silent mutation to create a restriction site for the enzyme XhoI (c.147A>T; p.P49P, marked in bold).
Figure 7.
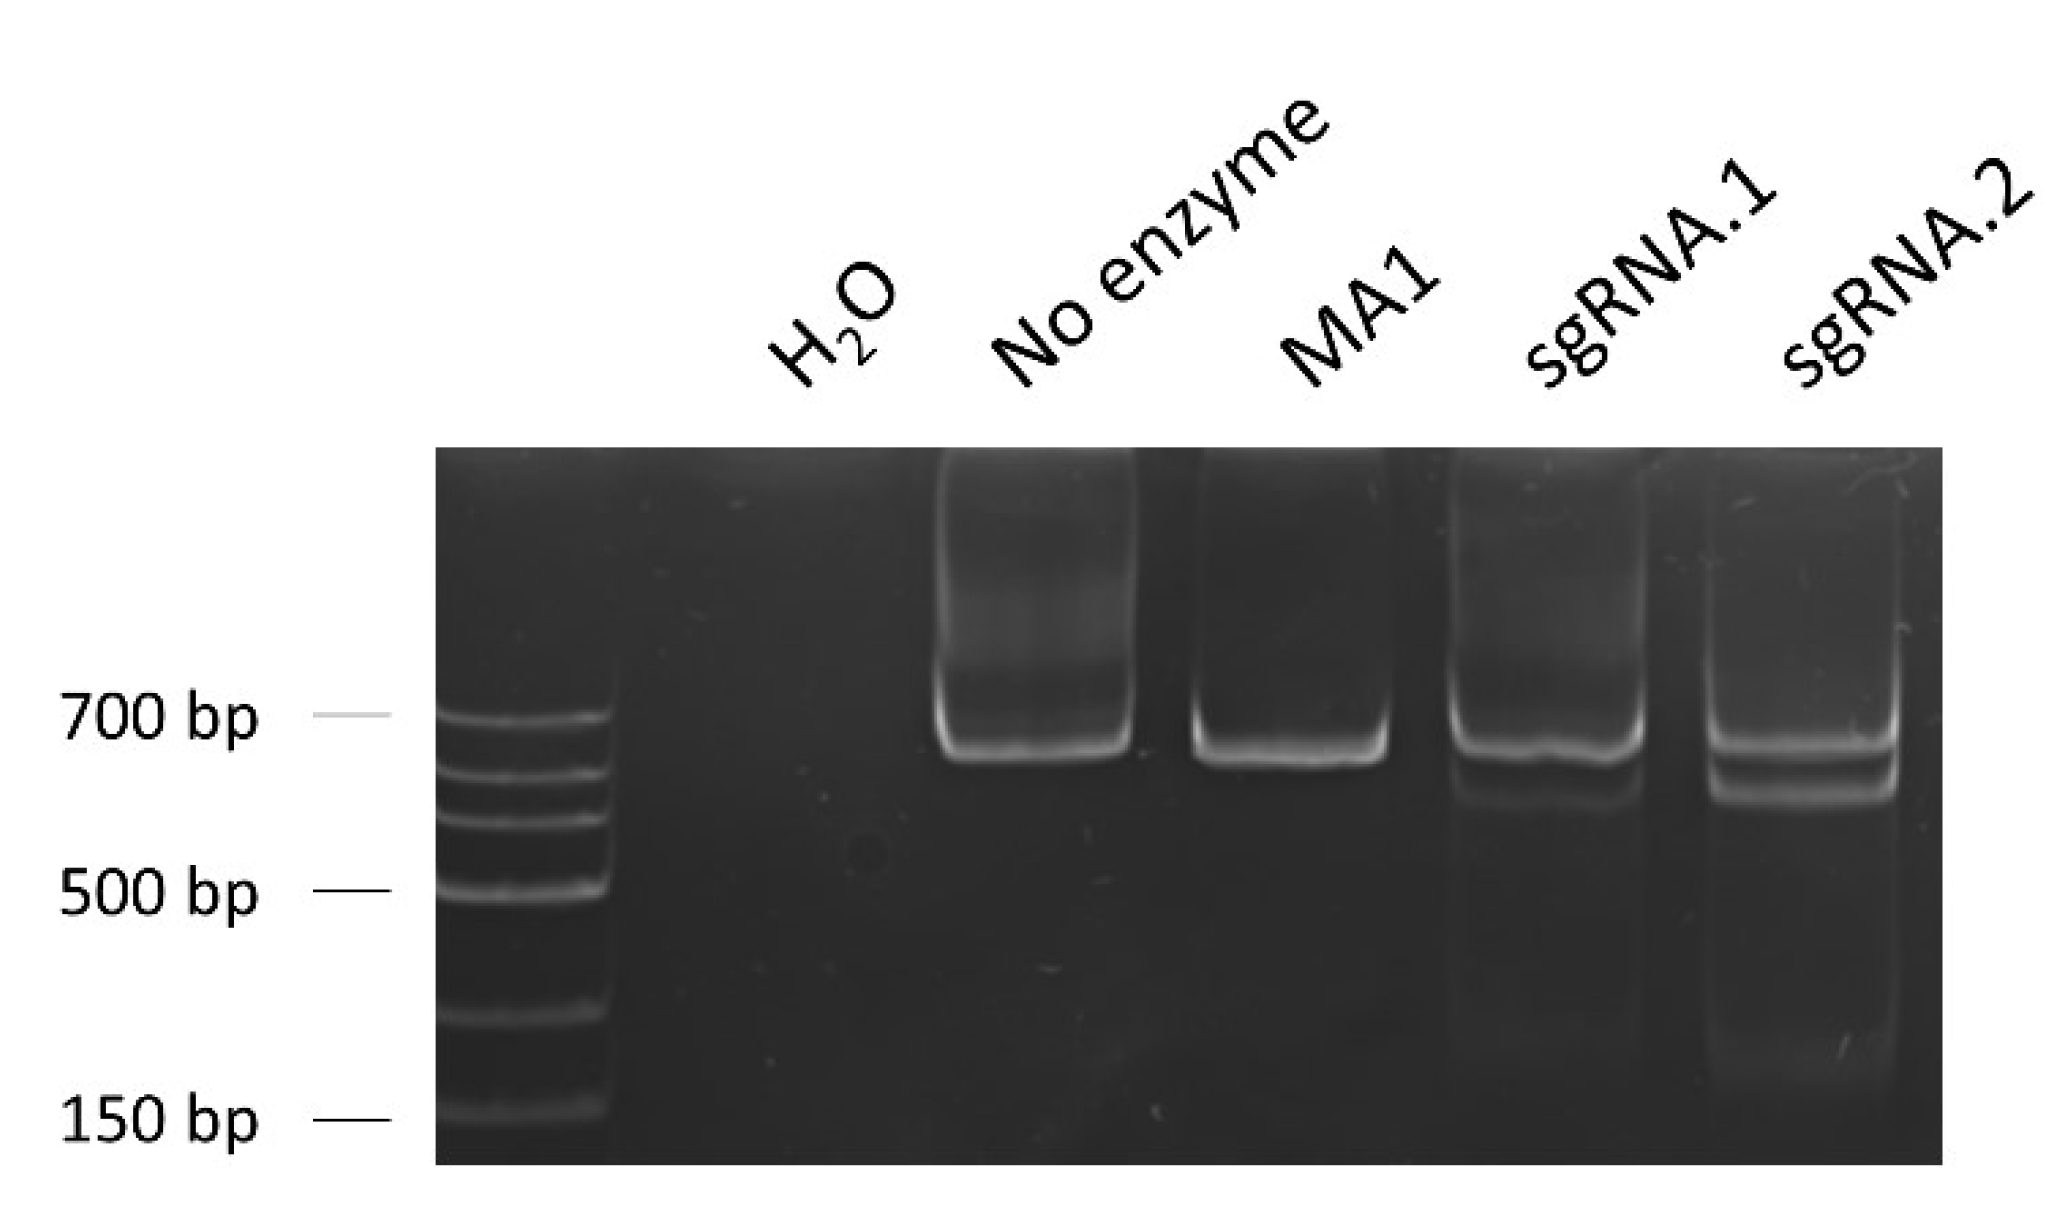
T7 endonuclease I assay to evaluate the on-target efficiency of the designed sgRNAs. The percentage of gene modification was calculated considering the band intensities of the T7-cleaved fractions, a reflexion of the Cas9 on-target activity. sgRNA.2 showed a greater on-target efficiency (28.8%) than sgRNA.1 (5.6%), being selected for the posterior edition experiments. Loading order: negative control (water as sample)—control without T7 enzyme—unedited iPSC line MA1—MA1 line nucleofected with Cas9/sgRNA.1 RNPs—MA1 line nucleofected with Cas9/sgRNA.2 RNPs.
Figure 7.
T7 endonuclease I assay to evaluate the on-target efficiency of the designed sgRNAs. The percentage of gene modification was calculated considering the band intensities of the T7-cleaved fractions, a reflexion of the Cas9 on-target activity. sgRNA.2 showed a greater on-target efficiency (28.8%) than sgRNA.1 (5.6%), being selected for the posterior edition experiments. Loading order: negative control (water as sample)—control without T7 enzyme—unedited iPSC line MA1—MA1 line nucleofected with Cas9/sgRNA.1 RNPs—MA1 line nucleofected with Cas9/sgRNA.2 RNPs.
Figure 8.
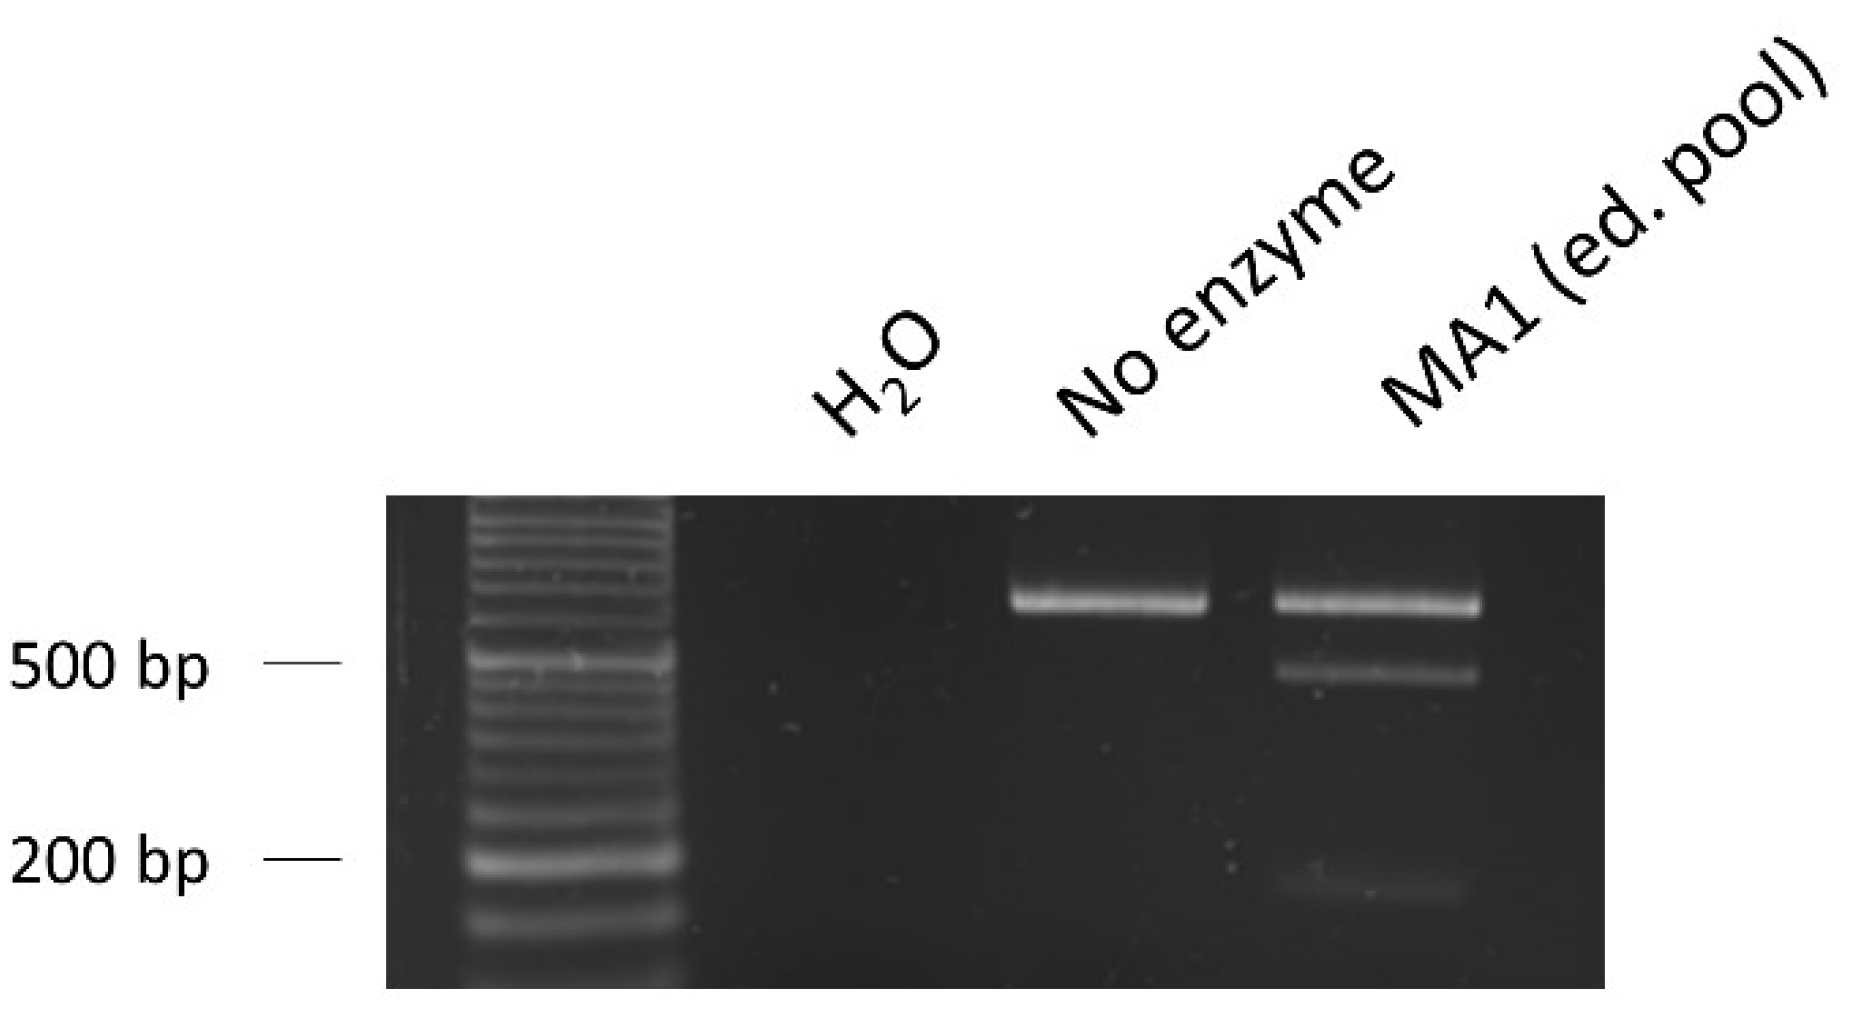
RFLP assay to evaluate the editing efficiency. The percentage of edit (30%) was calculated based on the band intensities of the fraction cleaved by the restriction enzyme XhoI, showing an acceptable number of edited cells present in the pool. Loading order: negative control (water as sample)—control without XhoI enzyme—edited pool of the iPSC line MA1 nucleofected with Cas9/sgRNA.2 RNPs and ssODN repair template.
Figure 8.
RFLP assay to evaluate the editing efficiency. The percentage of edit (30%) was calculated based on the band intensities of the fraction cleaved by the restriction enzyme XhoI, showing an acceptable number of edited cells present in the pool. Loading order: negative control (water as sample)—control without XhoI enzyme—edited pool of the iPSC line MA1 nucleofected with Cas9/sgRNA.2 RNPs and ssODN repair template.
Figure 9.
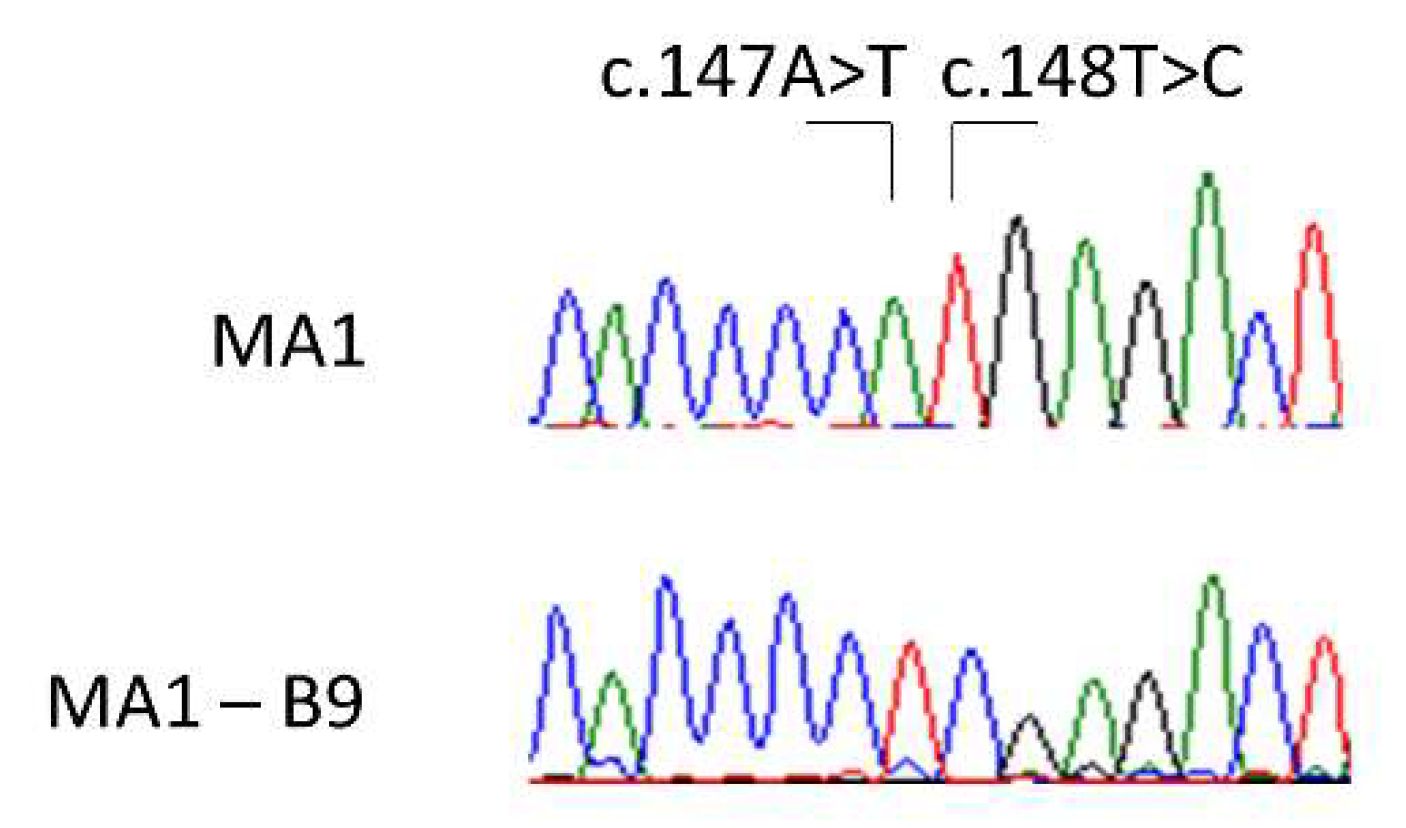
Validation of the successful edition of the selected clone MA1—B9 (below) by Sanger sequencing, compared to the MA1 origin line (above). We can observe both the modifications introduced in the edited sequence: c.147A>T and c.148T>C.
Figure 9.
Validation of the successful edition of the selected clone MA1—B9 (below) by Sanger sequencing, compared to the MA1 origin line (above). We can observe both the modifications introduced in the edited sequence: c.147A>T and c.148T>C.
Figure 10.
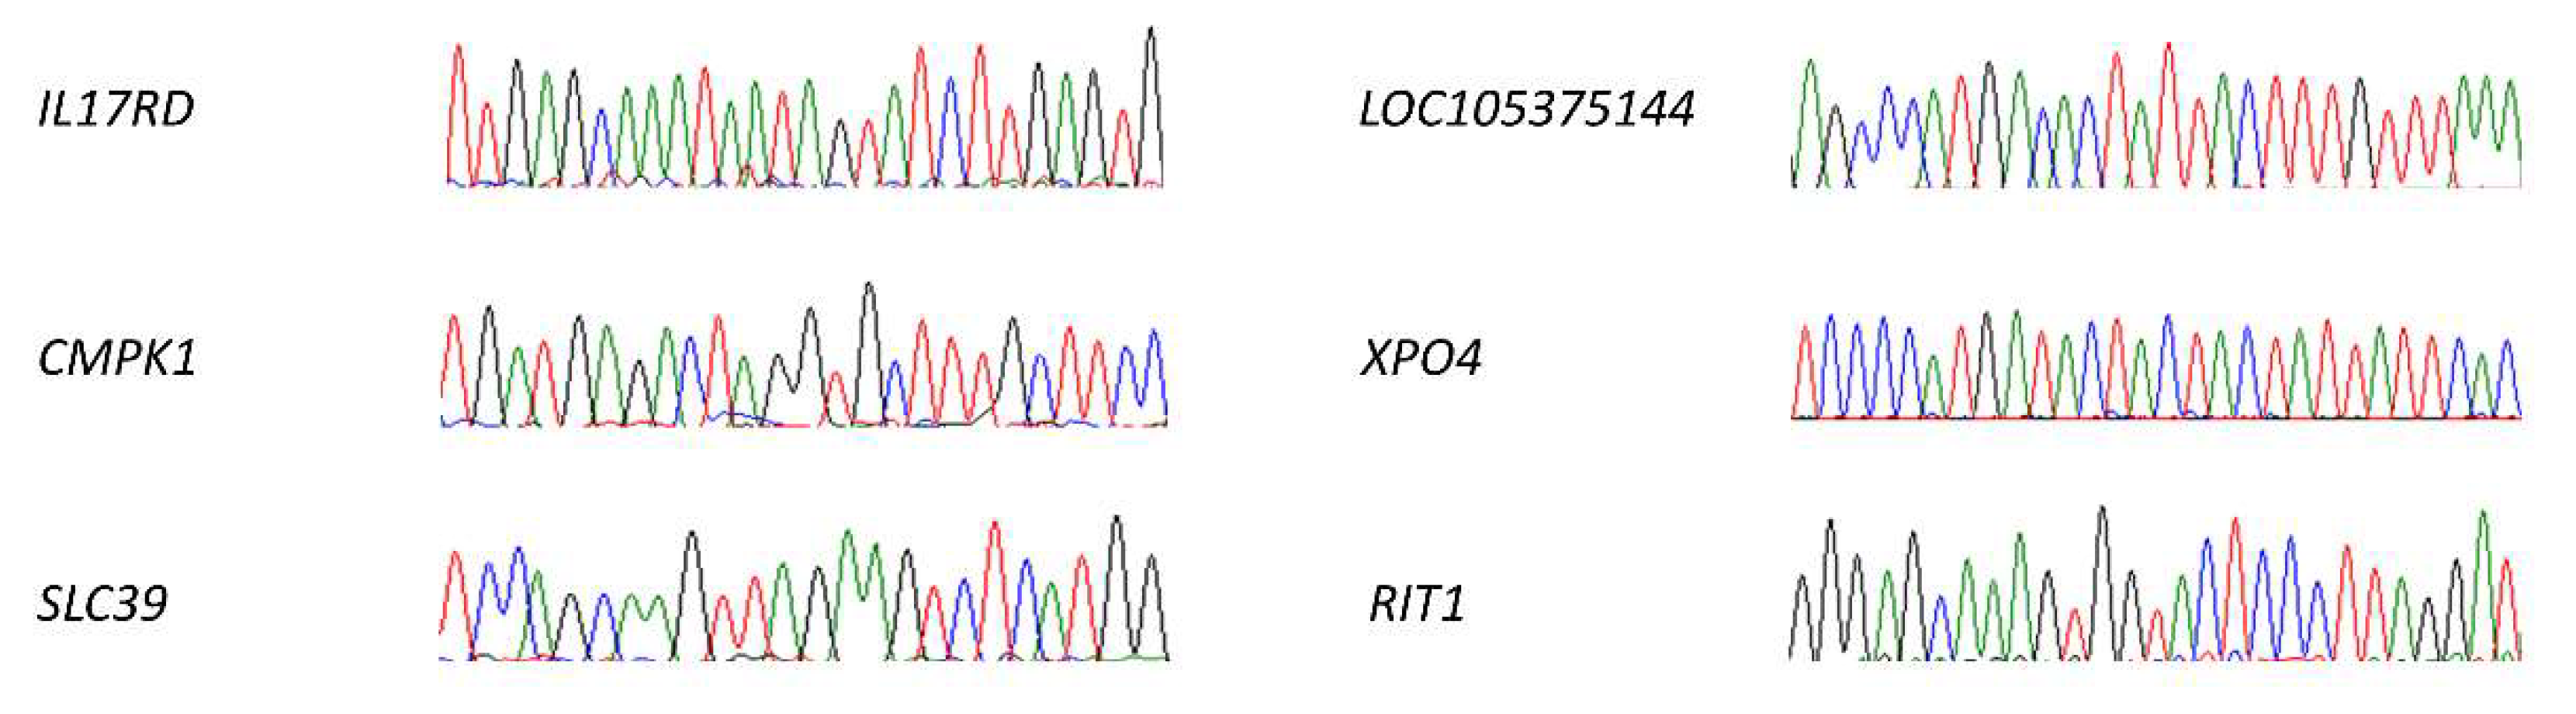
Off-targets analysis. We selected six different off-targets (IL17RD, CMPK1, SLC39, LOC105375144, XPO4, and RIT1), being the most likely ones to be modified according to the prediction algorithms. We evaluated the possible variations in their sequence by Sanger, finding no modifications in any of them. The areas shown in the image correspond to the sequences analogous to sgRNA.2, all of them identical to the reference sequence.
Figure 10.
Off-targets analysis. We selected six different off-targets (IL17RD, CMPK1, SLC39, LOC105375144, XPO4, and RIT1), being the most likely ones to be modified according to the prediction algorithms. We evaluated the possible variations in their sequence by Sanger, finding no modifications in any of them. The areas shown in the image correspond to the sequences analogous to sgRNA.2, all of them identical to the reference sequence.
Figure 11.
Analysis by RT-qPCR of the expression of myogenic and motor neuron genes to evaluate the process of differentiation at day 40 of the lines MA1-B9 and MA1. The expression of the genes PAX3 (a), PAX7 (b), TTN (c), DES (d), and MYOD1 (e) as myogenic markers, along with ChAT (f) as a motor neuron marker, was assessed. The positive expression of all of them certifies the presence of myogenic cells and motor neurons in the differentiated culture. The values represent the mean of at least three replicates, and they are relative to the expression of two housekeeping (HK) genes: HPRT and PPIA. Error bars show standard deviation.
Figure 12.
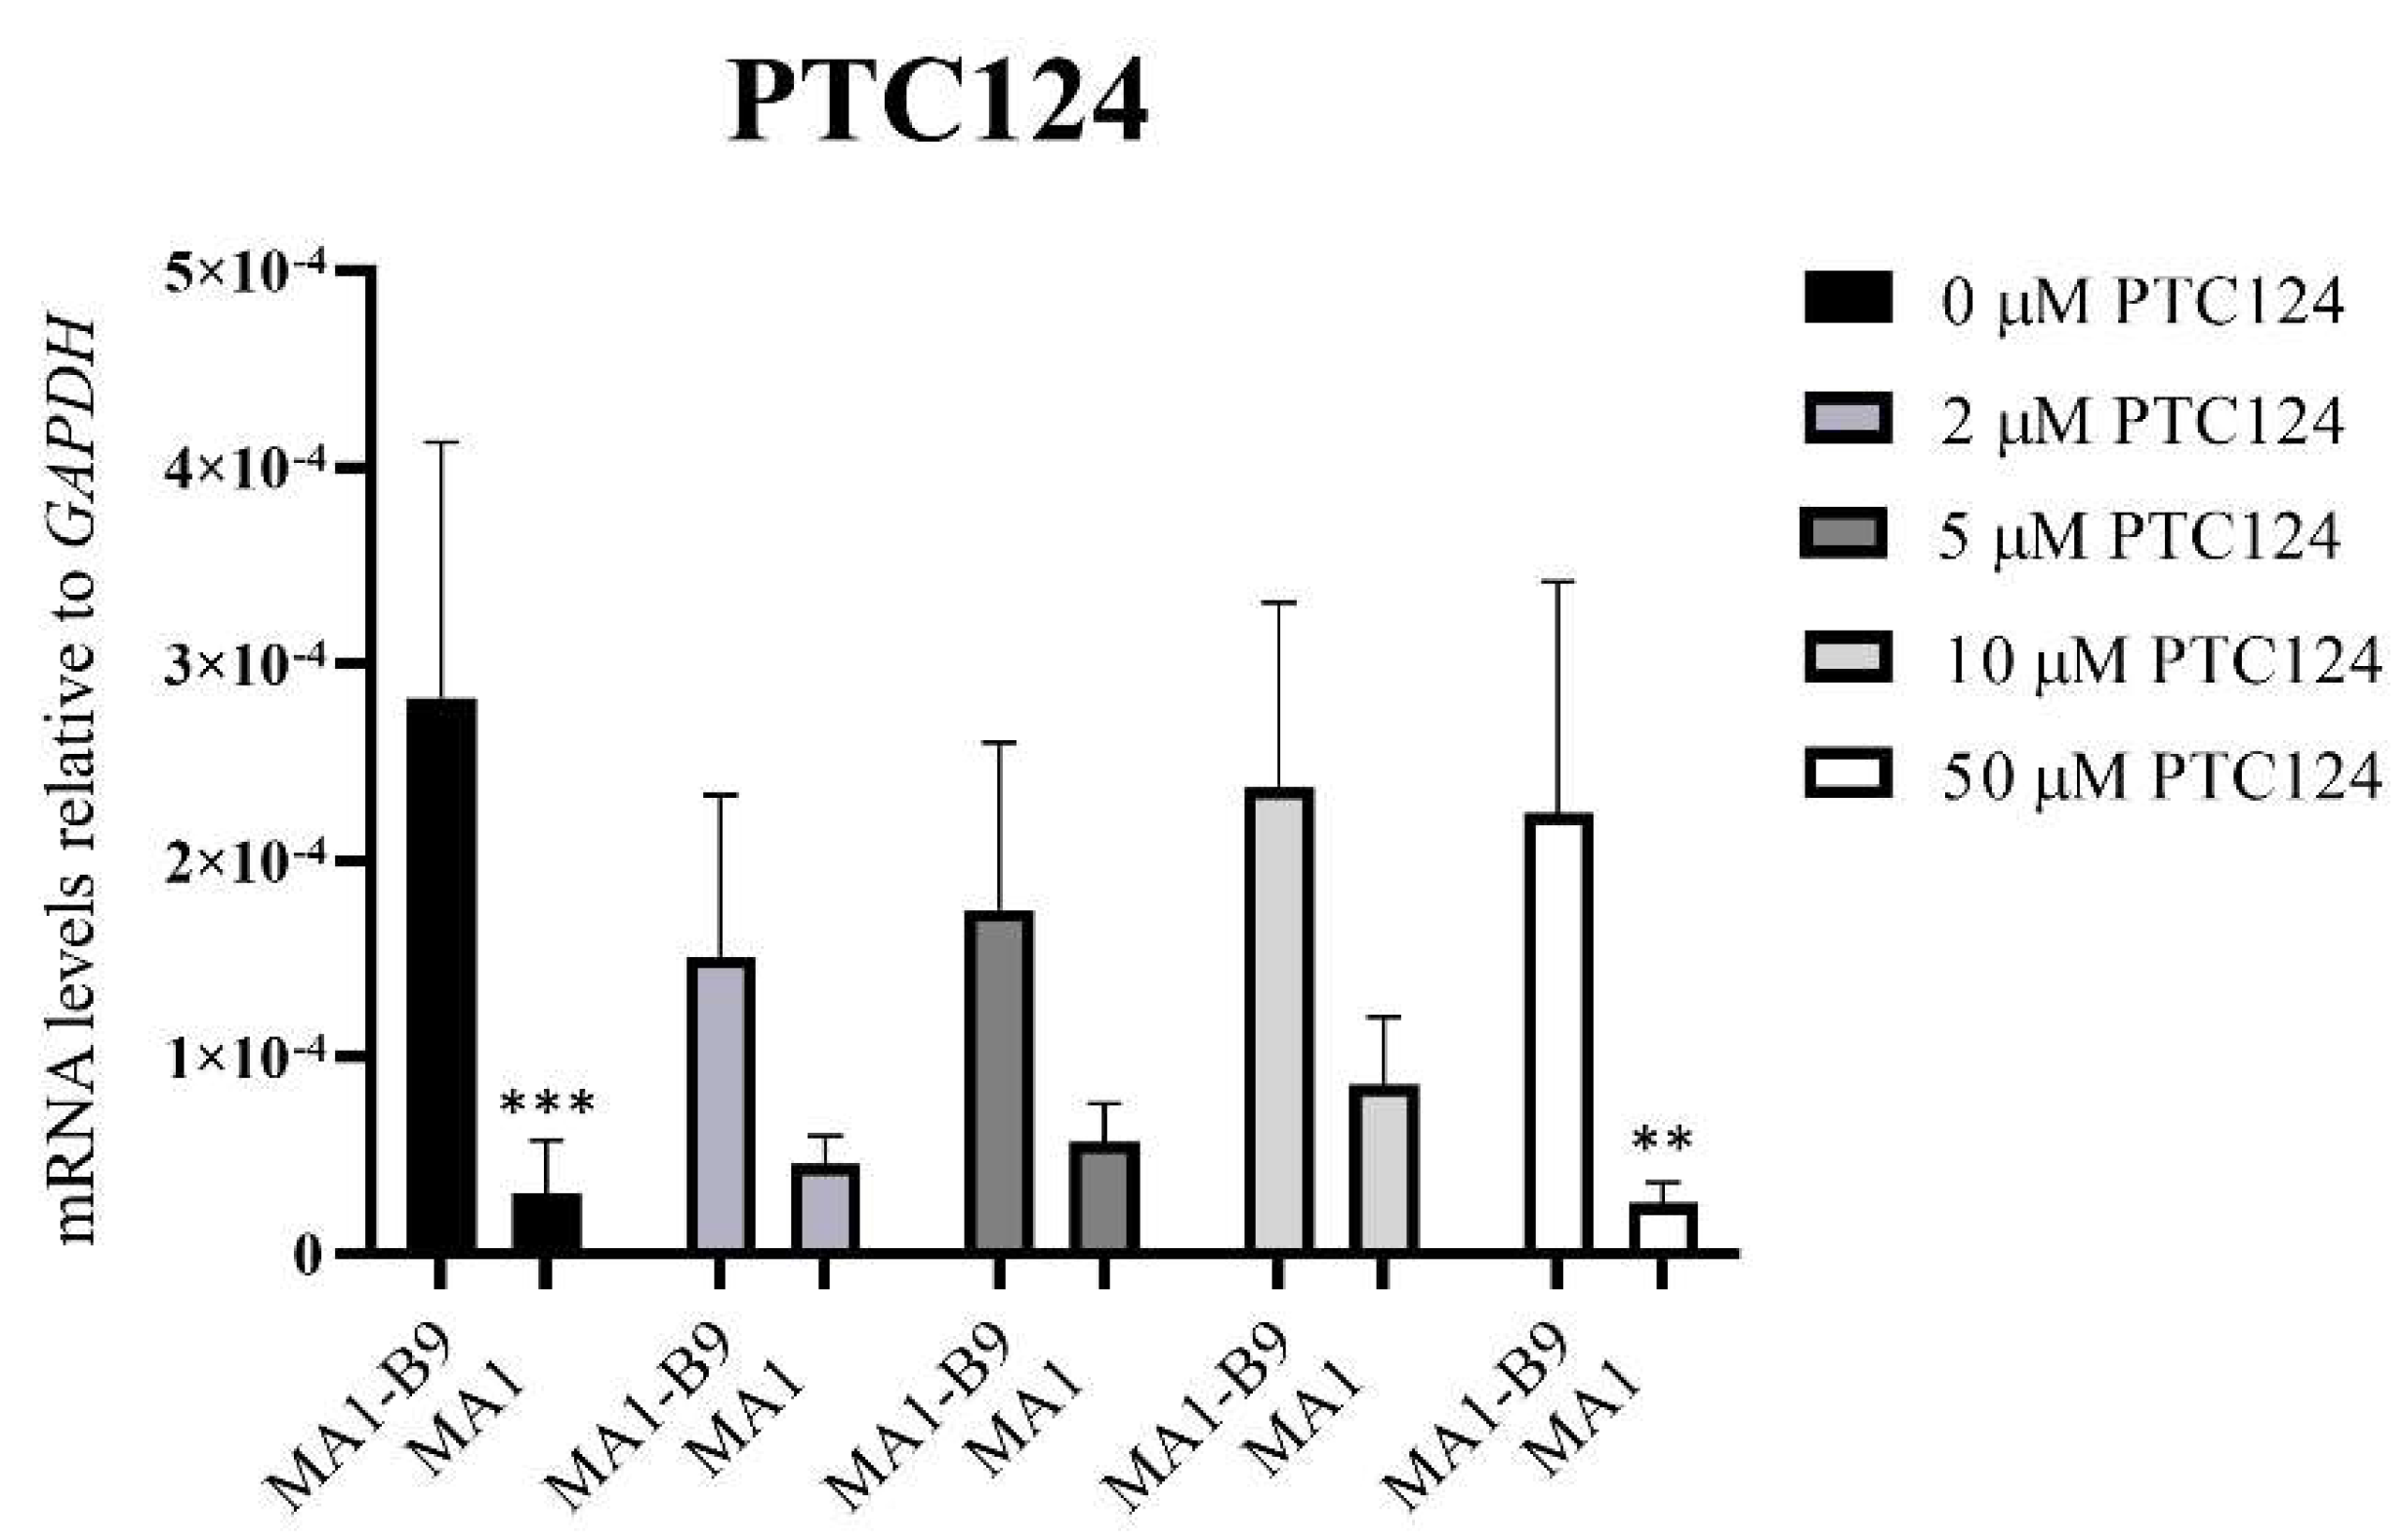
PYGM expression analysis using TaqMan™ assays after the treatment with different concentrations of PTC124 (2, 5, 10, and 50 μM) in the differentiated lines MA1-B9 and MA1. We observed no significant differences with the treatments at 2, 5, and 10 μM between the control and the mutant line. The values are representative of at least three independent replicates, relative to GAPDH as housekeeping gene. Error bars show standard deviation. The statistical analysis was performed using a two-way ANOVA analysis with Sidak’s multiple comparisons test between the control and the mutant line for each of the concentrations (** p-value < 0.01 and *** p-value < 0.001). None of the evaluated concentrations showed significant differences with respect to the absence of treatment in the control line (p-value > 0.05, two-way ANOVA analysis with Sidak’s multiple comparisons test).
Figure 12.
PYGM expression analysis using TaqMan™ assays after the treatment with different concentrations of PTC124 (2, 5, 10, and 50 μM) in the differentiated lines MA1-B9 and MA1. We observed no significant differences with the treatments at 2, 5, and 10 μM between the control and the mutant line. The values are representative of at least three independent replicates, relative to GAPDH as housekeeping gene. Error bars show standard deviation. The statistical analysis was performed using a two-way ANOVA analysis with Sidak’s multiple comparisons test between the control and the mutant line for each of the concentrations (** p-value < 0.01 and *** p-value < 0.001). None of the evaluated concentrations showed significant differences with respect to the absence of treatment in the control line (p-value > 0.05, two-way ANOVA analysis with Sidak’s multiple comparisons test).
Figure 13.
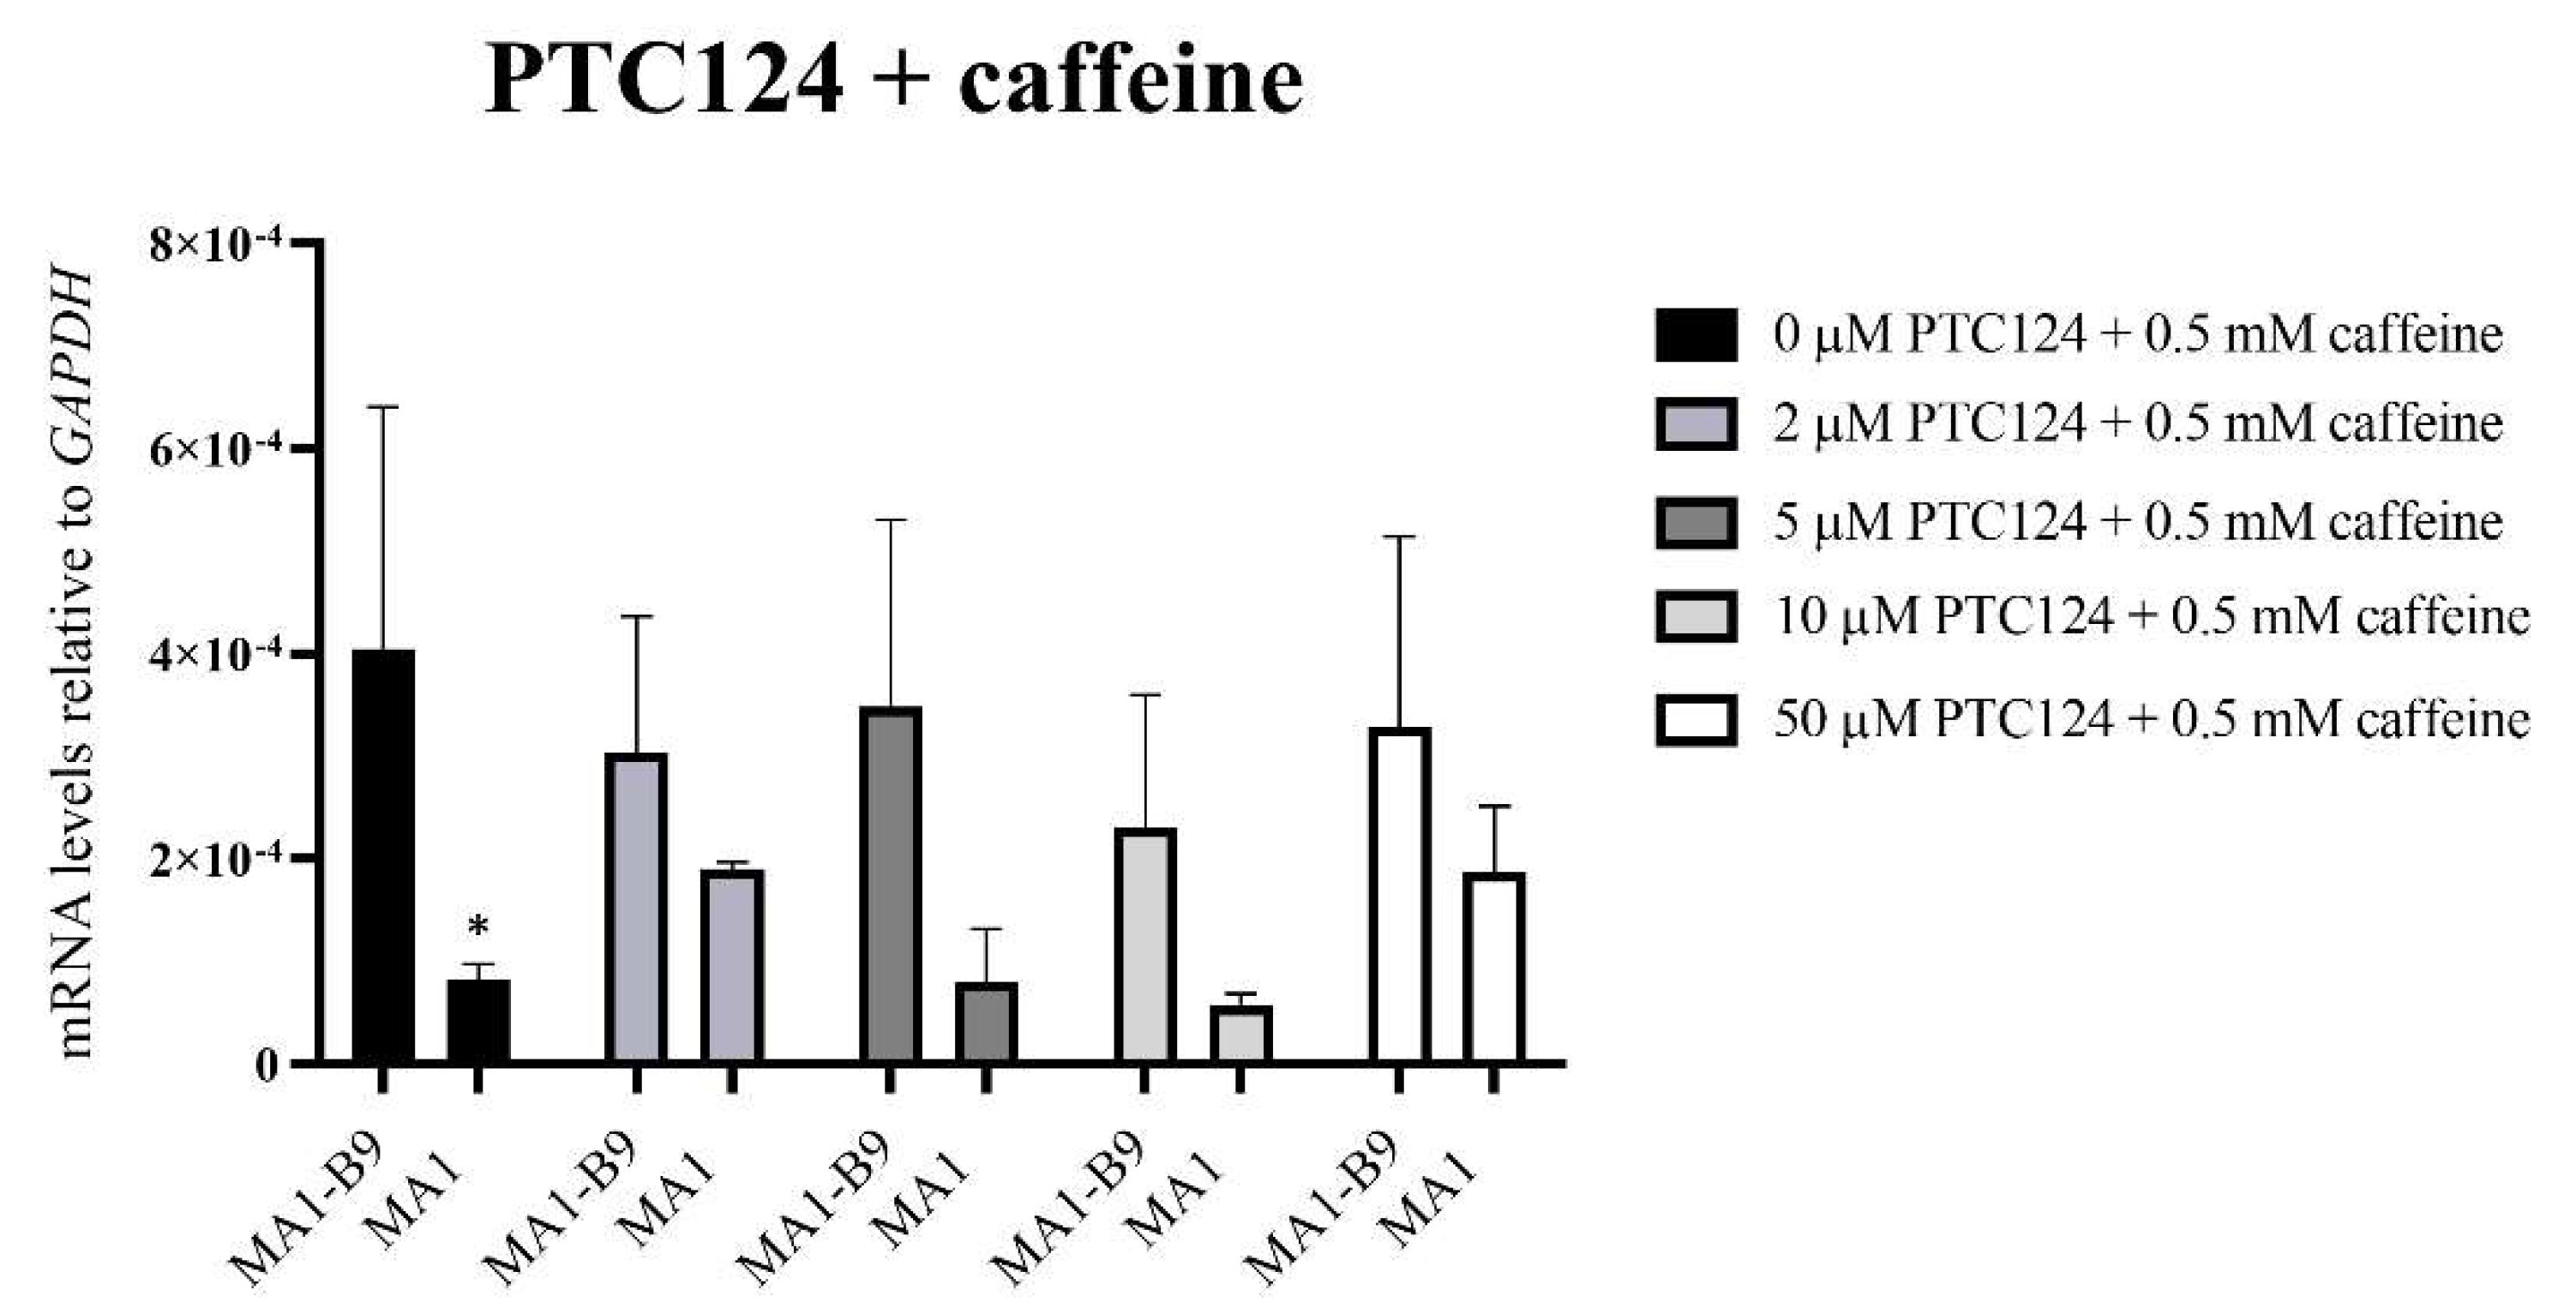
PYGM expression analysis using TaqMan™ assays after the treatment with different concentrations of PTC124 (2, 5, 10, and 50 μM) in conjunction with 0.5 mM caffeine in the differentiated lines MA1-B9 and MA1. We observed no significant differences with all the treatments evaluated between the control and the mutant line. The values are representative of at least three independent replicates, relative to GAPDH as housekeeping gene. Error bars show standard deviation. The statistical analysis was performed using a two-way ANOVA analysis with Sidak’s multiple comparisons test between the control and the mutant line for each of the concentrations (* p-value < 0.05). There were no differences between each concentration and the absence of treatment for the line MA1-B9 (p-value > 0.05, two-way ANOVA analysis with Dunnet’s multiple comparisons test).
Figure 13.
PYGM expression analysis using TaqMan™ assays after the treatment with different concentrations of PTC124 (2, 5, 10, and 50 μM) in conjunction with 0.5 mM caffeine in the differentiated lines MA1-B9 and MA1. We observed no significant differences with all the treatments evaluated between the control and the mutant line. The values are representative of at least three independent replicates, relative to GAPDH as housekeeping gene. Error bars show standard deviation. The statistical analysis was performed using a two-way ANOVA analysis with Sidak’s multiple comparisons test between the control and the mutant line for each of the concentrations (* p-value < 0.05). There were no differences between each concentration and the absence of treatment for the line MA1-B9 (p-value > 0.05, two-way ANOVA analysis with Dunnet’s multiple comparisons test).
Figure 14.
PYGM expression analysis using TaqMan™ assays after the treatment with different concentrations of RTC13 (2, 5, 10, and 50 μM) in the differentiated lines MA1-B9 and MA1. None of the assessed concentrations rescued the levels of PYGM expression in the mutant line in comparison to the isogenic control. The values are representative of at least three independent replicates, relative to GAPDH as housekeeping gene. Error bars show standard deviation. The statistical analysis was performed using a two-way ANOVA analysis with Sidak’s multiple comparisons test between the control and the mutant line for each of the concentrations (** p-value < 0.01 and *** p-value < 0.001). None of the evaluated concentrations showed significant differences with respect to the absence of treatment in the control line (p-value > 0.05, two-way ANOVA analysis with Dunnet’s multiple comparisons test).
Table 1.
Primary and secondary antibodies to evaluate the expression of pluripotency markers by immunocytochemistry.
Table 1.
Primary and secondary antibodies to evaluate the expression of pluripotency markers by immunocytochemistry.
| Primary Antibodies | | |
|---|
| Name | Dilution | Reference |
|---|
| Goat anti-NANOG | 1:25 | R&D Systems, Minneapolis, MN, USA; #sc-5279 |
| Mouse anti-OCT4 | 1:100 | Santa Cruz Biotechnology, Dallas, TX, USA; #sc-5279 |
| Rabbit anti-SOX2 | 1:100 | Thermo Fisher Scientific, Waltham, MA, USA; #PA1-16968 |
| Mouse anti-SSEA4 | 1:10 | Millipore, Burlington, MA, USA; #MAB4304 |
| Rat anti-SSEA3 | 1:20 | Abcam, Cambridge, UK; #ab16286 |
| Mouse anti-TRA-1-81 | 1:150 | Millipore, Burlington, MA, USA; #MAB4381 |
| Mouse anti-TRA-1-60 | 1:150 | Millipore, Burlington, MA, USA; #MAB4360 |
| Secondary antibodies | | |
| Name | Dilution | Reference |
| Cy™2-conjugated AffiniPure Donkey Anti-Goat IgG (H + L) | 1:50 | Jackson ImmunoResearch Labs, Ely, UK; #705-225-147 |
| Cy™2-conjugated AffiniPure Goat Anti-Mouse IgG, Fcγ subclass 2b specific | 1:50 | Jackson ImmunoResearch Labs, Ely, UK; #115-225-207 |
| Cy™3-conjugated AffiniPure Donkey Anti-Mouse IgM, μ chain specific | 1:250 | Jackson ImmunoResearch Labs, Ely, UK; #715-165-020 |
| Cy™2-conjugated AffiniPure Goat Anti-Rabbit IgG (H + L) | 1:50 | Jackson ImmunoResearch Labs, Ely, UK; #111-225-144 |
| Cy™3-conjugated AffiniPure Goat Anti-Rat IgM, μ chain specific | 1:250 | Jackson ImmunoResearch Labs, Ely, UK; #112-165-075 |
| Cy™3-conjugated AffiniPure Goat Anti-Mouse IgG, Fcγ subclass 3 specific | 1:250 | Jackson ImmunoResearch Labs, Ely, UK; #115-165-209 |
Table 2.
Primary and secondary antibodies used for the immunocytochemistry analysis of the markers for ectoderm (Tuj1), endoderm (AFP) and mesoderm (SMA) after the in vitro spontaneous differentiation assay.
Table 2.
Primary and secondary antibodies used for the immunocytochemistry analysis of the markers for ectoderm (Tuj1), endoderm (AFP) and mesoderm (SMA) after the in vitro spontaneous differentiation assay.
| Primary Antibodies | | |
|---|
| Name | Dilution | Reference |
|---|
| Mouse anti-β tubulin isotype III (ectoderm) | 1:300 | Merck, Darmstadt, Germany; #T8660 |
| Mouse anti-AFP (endoderm) | 1:300 | Merck, Darmstadt, Germany; #WH0000174M1 |
| Mouse anti-SMA (mesoderm) | 1:400 | Merck, Darmstadt, Germany; #A2547 |
| Secondary antibodies | | |
| Name | Dilution | Reference |
| Goat anti-mouse IgG (H + L), Alexa Fluor 488 | 1:500 | Thermo Fisher Scientific, Waltham, MA, USA #A-11029 |
Table 3.
Compounds to be added to the basal medium employed in the distinct stages of the differentiation protocol from iPSCs towards innervated myogenic cells.
Table 3.
Compounds to be added to the basal medium employed in the distinct stages of the differentiation protocol from iPSCs towards innervated myogenic cells.
| Differentiation Days (D) | Supplements to Be Added |
|---|
| From D0 to D5 | Insulin-transferrin-selenium (ITS) 1x (Gibco, Waltham, MA, USA; 41400045); LDN193189 0.5 μM (StemCell Technologies, Vancouver, Canada; 72147); CHIR99021 3 μM (StemCell Technologies, Vancouver, Canada; 72054)
*D1: additional supplementation with 2 μM Thiazovivin |
| From D6 to D7 | IGF-I 4 ng/mL (StemCell Technologies, Vancouver, Canada; 78022.1); HGF 10 ng/mL (StemCell Technologies, Vancouver, Canada; 78019.1); LDN193189 0,5 μM (StemCell Technologies, Vancouver, Canada; 72147); β-mercaptoethanol 100 μM (Gibco, Waltham, MA, USA; 21985023) |
| From D8 to D11 | IGF-I 4 ng/mL (StemCell Technologies, Vancouver, Canada; 78022.1); β-mercaptoethanol 100 μM (Gibco, Waltham, MA, USA; 21985023) |
| From D1 to D16 | IGF-I 4 ng/mL (StemCell Technologies, Vancouver, Canada; 78022.1); β-mercaptoethanol 100 μM (Gibco, Waltham, MA, USA; 21985023); DAPT 10 μM (Merck, Darmstadt, Germany; D5942) |
| From D17-onwards | IGF-I 4 ng/mL (StemCell Technologies, Vancouver, Canada; 78022.1); β-mercaptoethanol 100 μM (Gibco, Waltham, MA, USA; 21985023) |
Table 4.
Primary and secondary antibodies used to assess the expression of myogenic and motor neuron proteins.
Table 4.
Primary and secondary antibodies used to assess the expression of myogenic and motor neuron proteins.
| Primary Antibodies | | |
|---|
| Name | Dilution | Reference |
|---|
| Mouse anti-titin | 96:1000 | DSHB, Iowa, IA, USA; #9D10 |
| Rabbit anti-desmin | 1:100 | Abcam, Cambridge, UK; #AB15200 |
| Chicken anti-neurofilament | 1:2000 | Biolegend, San Diego, CA; USA; #PCK-593P |
| Rabbit anti-MNX1 (HB9) | 1:100 | Millipore, Burlington, MA, USA; #ABN174 |
| Goat anti-ChAT | 1:100 | Millipore, Burlington, MA, USA; #AB144P |
| Secondary antibodies | | |
| Name | Dilution | Reference |
| Goat anti-mouse IgG (H + L) Alexa Fluor® 647 | 1:1000 | Thermo Fisher Scientific, Waltham, MA, USA; #A-21236 |
| Goat anti-chicken IgG (H + L) DyLight™ 488 | 1:1000 | Rockland, Pottstown, PA, USA; #603-141-126 |
| Goat anti-rabbit IgG (H + L) Alexa Fluor® 594 | 1:1000 | Thermo Fisher Scientific, Waltham, MA, USA; #A-11012 |
| Goat anti-mouse IgG (H + L) Alexa Fluor® 488 | 1:1000 | Thermo Fisher Scientific, Waltham, MA, USA; #A28175 |
| Goat anti-rabbit IgG (H + L) Alexa Fluor® 555 | 1:1000 | Cell Signalling, Danvers, MA, USA; #4413 |
| Donkey anti-goat IgG (H + L) Alexa Fluor® 633 | 1:1000 | Thermo Fisher Scientific, Waltham, MA, USA; #A-21082 |
Table 5.
Primers for the evaluation of the expression of several myogenic and motor neuron genes by RT-qPCR.
Table 5.
Primers for the evaluation of the expression of several myogenic and motor neuron genes by RT-qPCR.
| Target | Forward Primer (5′→3′) | Reverse Primer (5′→3′) |
|---|
| MyH2 | GGAGCTGGTGGAGGGGCCAA | TGCTCCATGGCACCAGGAGTTT |
| MyH3 | GCTTGTGGGCGGAGGTCTGG | AGGGCTGGTTCTGAGCCTCGAT |
| MyoD | TGCGCAACGCCATCCGCTA | GGGCCGCTGTAGTCCATCATGC |
| TTN | CCGAAATGCATCAGTCAGCG | CCTTGCAAGCTTGTGTCACC |
| DES | CCGCCATCTGCGCGAGTACC | TGCTCAGGGCTGGTTTCTCGGA |
| PAX3 | CACCAGGCATGGATTTTCC | TTGTCAGGAGTCCCATTACCT |
| PAX7 | CCACAGCTTCTGCAGCTACTCTG | GGGTTGCCCAAGATGCTG |
| ChAT | AGAAGCAGAAATGCAGCCCT | GCTCTCACAAAAGCCAGTGC |
| HPRT | CATTATGCTGAGGATTTGGAAAGG | CTTGAGCACACAGAGGGCTACA |
| PPIA | GGCAAATGCTGGACCCAACACA | TGCTGGTCTTGCCATTCCTGGA |
Table 6.
Sequence of the crRNA domain and PAM of the two sgRNAs designed.
Table 6.
Sequence of the crRNA domain and PAM of the two sgRNAs designed.
| | crRNA Domain Sequence (5′ → 3′) | PAM |
|---|
| sgRNA.1 | ACTCGTAAAGGACCGCAATG | TGG |
| sgRNA.2 | GAGCAAAGTAGTAGTCTCAT | GGG |
Table 7.
Primers designed for the PCR amplification of the selected off-target regions.
Table 7.
Primers designed for the PCR amplification of the selected off-target regions.
| Target | Forward Primer (5′ → 3′) | Reverse Primer (5′ → 3′) |
|---|
| IL17RD | CCACCTCAACAGAGACCACC | GGGGGCCAGAGAGTTTTCTT |
| CMPK1 | GCATTCCTACTCACATAAGTG | GTCATATTATCTCAATCAACTC |
| SLC39 | TTCTCTAGATATACTCAGCC | TATAAGGCAGCCATCCATG |
| LOC105375144 | GCTGGTAGCACAAGCAGAG | AGTCCAGTGTGATAGGAGCC |
| XPO4 | CAGCATTGGGCAGATTACTTCTT | GGGGACAGAATAGTTTCATAGGCA |
| RIT1 | AGGGACCACTACTCAGAGCT | AGACATCAGGGGTGTGGGTA |

 ,
, 


