
Effect of Lipid Raft Disruptors on Cell Membrane Fluidity Studied by Fluorescence Spectroscopy
1
Department of Pharmacology and Pharmacotherapy, Medical School, University of Pécs, Szigeti Str. 12, H-7624 Pécs, Hungary
2
National Laboratory for Drug Research and Development, Magyar Tudósok Krt. 2, H-1117 Budapest, Hungary
3
Department of Pharmacology, Faculty of Pharmacy, University of Pécs, Rókus Str. 2, H-7624 Pécs, Hungary
4
János Szentágothai Research Centre and Centre for Neuroscience, University of Pécs, Ifjúság Str. 20, H-7624 Pécs, Hungary
5
Department of Experimental Physics, Faculty of Sciences, University of Pécs, Ifjúság Str. 6, H-7624 Pécs, Hungary
*
Author to whom correspondence should be addressed.
†
These authors contributed equally to this work.
Int. J. Mol. Sci. 2022, 23(22), 13729; https://doi.org/10.3390/ijms232213729
Submission received: 24 August 2022
/
Revised: 31 October 2022
/
Accepted: 2 November 2022
/
Published: 8 November 2022
(This article belongs to the Special Issue Biophysics in Membrane of Cells)
Abstract
:Lipid rafts are specialized microdomains in cell membranes, rich in cholesterol and sphingolipids, and play an integrative role in several physiological and pathophysiological processes. The integrity of rafts can be disrupted via their cholesterol content—with methyl-β-cyclodextrin (MCD) or with our own carboxamido-steroid compound (C1)—or via their sphingolipid content—with sphingomyelinase (SMase) or with myriocin (Myr). We previously proved by the fluorescent spectroscopy method with LAURDAN that treatment with lipid raft disruptors led to a change in cell membrane polarity. In this study, we focused on the alteration of parameters describing membrane fluidity, such as generalized polarization (GP), characteristic time of the GP values change—Center of Gravity (τCoG)—and rotational mobility (τrot) of LAURDAN molecules. Myr caused a blue shift of the LAURDAN spectrum (higher GP value), while other agents lowered GP values (red shift). MCD decreased the CoG values, while other compounds increased it, so MCD lowered membrane stiffness. In the case of τrot, only Myr lowered the rotation of LAURDAN, while the other compounds increased the speed of τrot, which indicated a more disordered membrane structure. Overall, MCD appeared to increase the fluidity of the membranes, while treatment with the other compounds resulted in decreased fluidity and increased stiffness of the membranes.
1. Introduction
The field of biological and pharmacological research has been impacted by the lipid raft hypothesis since it was first introduced by Karnovsky [1]. Lipid rafts are specialized microdomains in the plasma membrane, which are rich in cholesterol, sphingolipids, and gangliosides [2]. The distribution of the raft components is different in the inner and outer leaflets of the raft regions. Sphingomyelins and glycophospholipids are present in the outer leaflet, while the inner leaflet is rich in glycerophospholipids. Cholesterol, as the main component, shows equal distribution in the rafts [2,3,4]. Not only the structure of the rafts is special, but also the function. Lipid rafts play an essential role in several physiological and pathophysiological processes, such as in signal transduction pathways connected to the immune, cardiovascular, and nervous systems [5,6,7], as well as in tumor formation [7,8,9,10]. It is clearly known that several ion channels are associated with lipid rafts; for instance, the GABA (gamma-aminobutyric acid) receptor, AMPA (2-amino-3-(5-methyl-3-oxo-1,2-oxazol-4-yl)propanoic-acid) glutamate receptor, nicotinic acetylcholine receptor, and some Transient Receptor Potential (TRP) receptors—which are in the main interest of our research group [11,12,13,14,15,16,17,18]. Therefore, investigation of the integrity of rafts can be a useful technique to follow receptor functions.
The integrity of the rafts can be disrupted in two different ways, one is depletion of the different constituents, such as cholesterol or sphingomyelins, and the other is inhibition of the synthesis of the components. To deplete cholesterol from the rafts, methyl-beta-cyclodextrin (MCD) is the commonly used agent, which forms a complex with cholesterol [19]. The sphingomyelin content can be depleted by sphingomyelinase (SMase), which is a natural enzyme that hydrolyzes the sphingomyelins to ceramide and phosphocholine [20]. To inhibit the formation of rafts by blocking the synthesis of sphingolipids, myriocin (Myr) is used, which is a serine-palmitoyl-transferase inhibitor and this enzyme catalyzes the rate-limit step of the sphingolipid synthesis [21].
Our group previously described that the lipid raft disruption by MCD, SMase, Myr, and a novel carboxamido-steroid compound (C1), which depletes cholesterol from the membrane, could lead to the inhibition of the TRP Vanilloid 1 (TRPV1) and TRP Ankyrin 1 (TRPA1) receptors in different in vitro and in vivo conditions [16,17,18,22,23,24]. Despite the in vitro and in vivo data, the exact molecular mechanism of the inhibition by lipid raft disruption is still unknown. To somehow clarify this issue, we used earlier the fluorescent spectroscopy method to characterize native Chinese Hamster Ovary (CHO) cells after incubation with the lipid raft disruptors [17,18,22]-For fluorescent spectroscopy 6-dodecanoyl-N,N-dimethyl-naphthylamine (LAURDAN) is a commonly used polarity sensitive dye, which is suitable to investigate model membrane, such as POPC-LUV (2-Oleoyl-1-palmitoyl-sn-glycero-3-phosphocholine large unilamellar vesicle), DOPC-LUV (1,2-dioleoyl-sn-glycero-3-phosphocholine large unilamellar vesicle), DOPC-GUV (1,2-dioleoyl-sn-glycero-3-phosphocholine giant unilamellar vesicle), and DPPC-GUV (Dipalmitoylphosphatidylcholine giant unilamellar vesicle), as well as membranes of living cells [23,24,25,26,27]. Originally LAURDAN was introduced by Parasassi and co-workers in membrane biophysics [28,29]. LAURDAN is a polarity-sensitive probe that can incorporate into the phospholipid bilayer of membranes—both inner and plasma membrane—[23,30,31], and its excitation and emission properties depend on the actual hydration state of the membrane [23]. Different methods were developed in the last decades to use LAURDAN as a membrane-sensitive probe to determine membrane polarity and fluidity. Fluorescent spectroscopy is the less complicated one, and fluorescent microscopy and two-photon microscopy are the more complex methods [32].
Based on our earlier steady-state measurements [17,18,24], we aimed in this study to investigate the effect of SMase, Myr, MCD, and C1 treatment on membrane fluidity in native CHO cells. Fluorescence spectroscopy delivers several parameters which could be used well to describe how the microenvironment around LAURDAN changes. Using more parameters supports a more complex analysis revealing different details of the membrane structure. A methodology based on complex fluorescence spectroscopy analysis gives us a versatile tool for describing competing changes in cell membranes.
2. Results
2.1. Interpretation
The interpretation of the detailed parameters below can be individual and/or collective. Individually, they characterize the behavior of LAURDAN molecules in the membrane and, taken together, provide information on the microviscosity of the membrane. It should be noted, however, that fluorescence spectroscopy is not suitable for the selective analysis of the plasma membrane since the inner and outer membrane systems cannot be separated, but LAURDAN molecules are present in both membrane systems [31]. For this reason, the results were evaluated qualitatively, and relative conclusions were drawn from the direction of change. It is also notable that our results are presented with intrinsic errors, which represent the uncertainties of the experimental method.
2.2. Fluorescence Decays
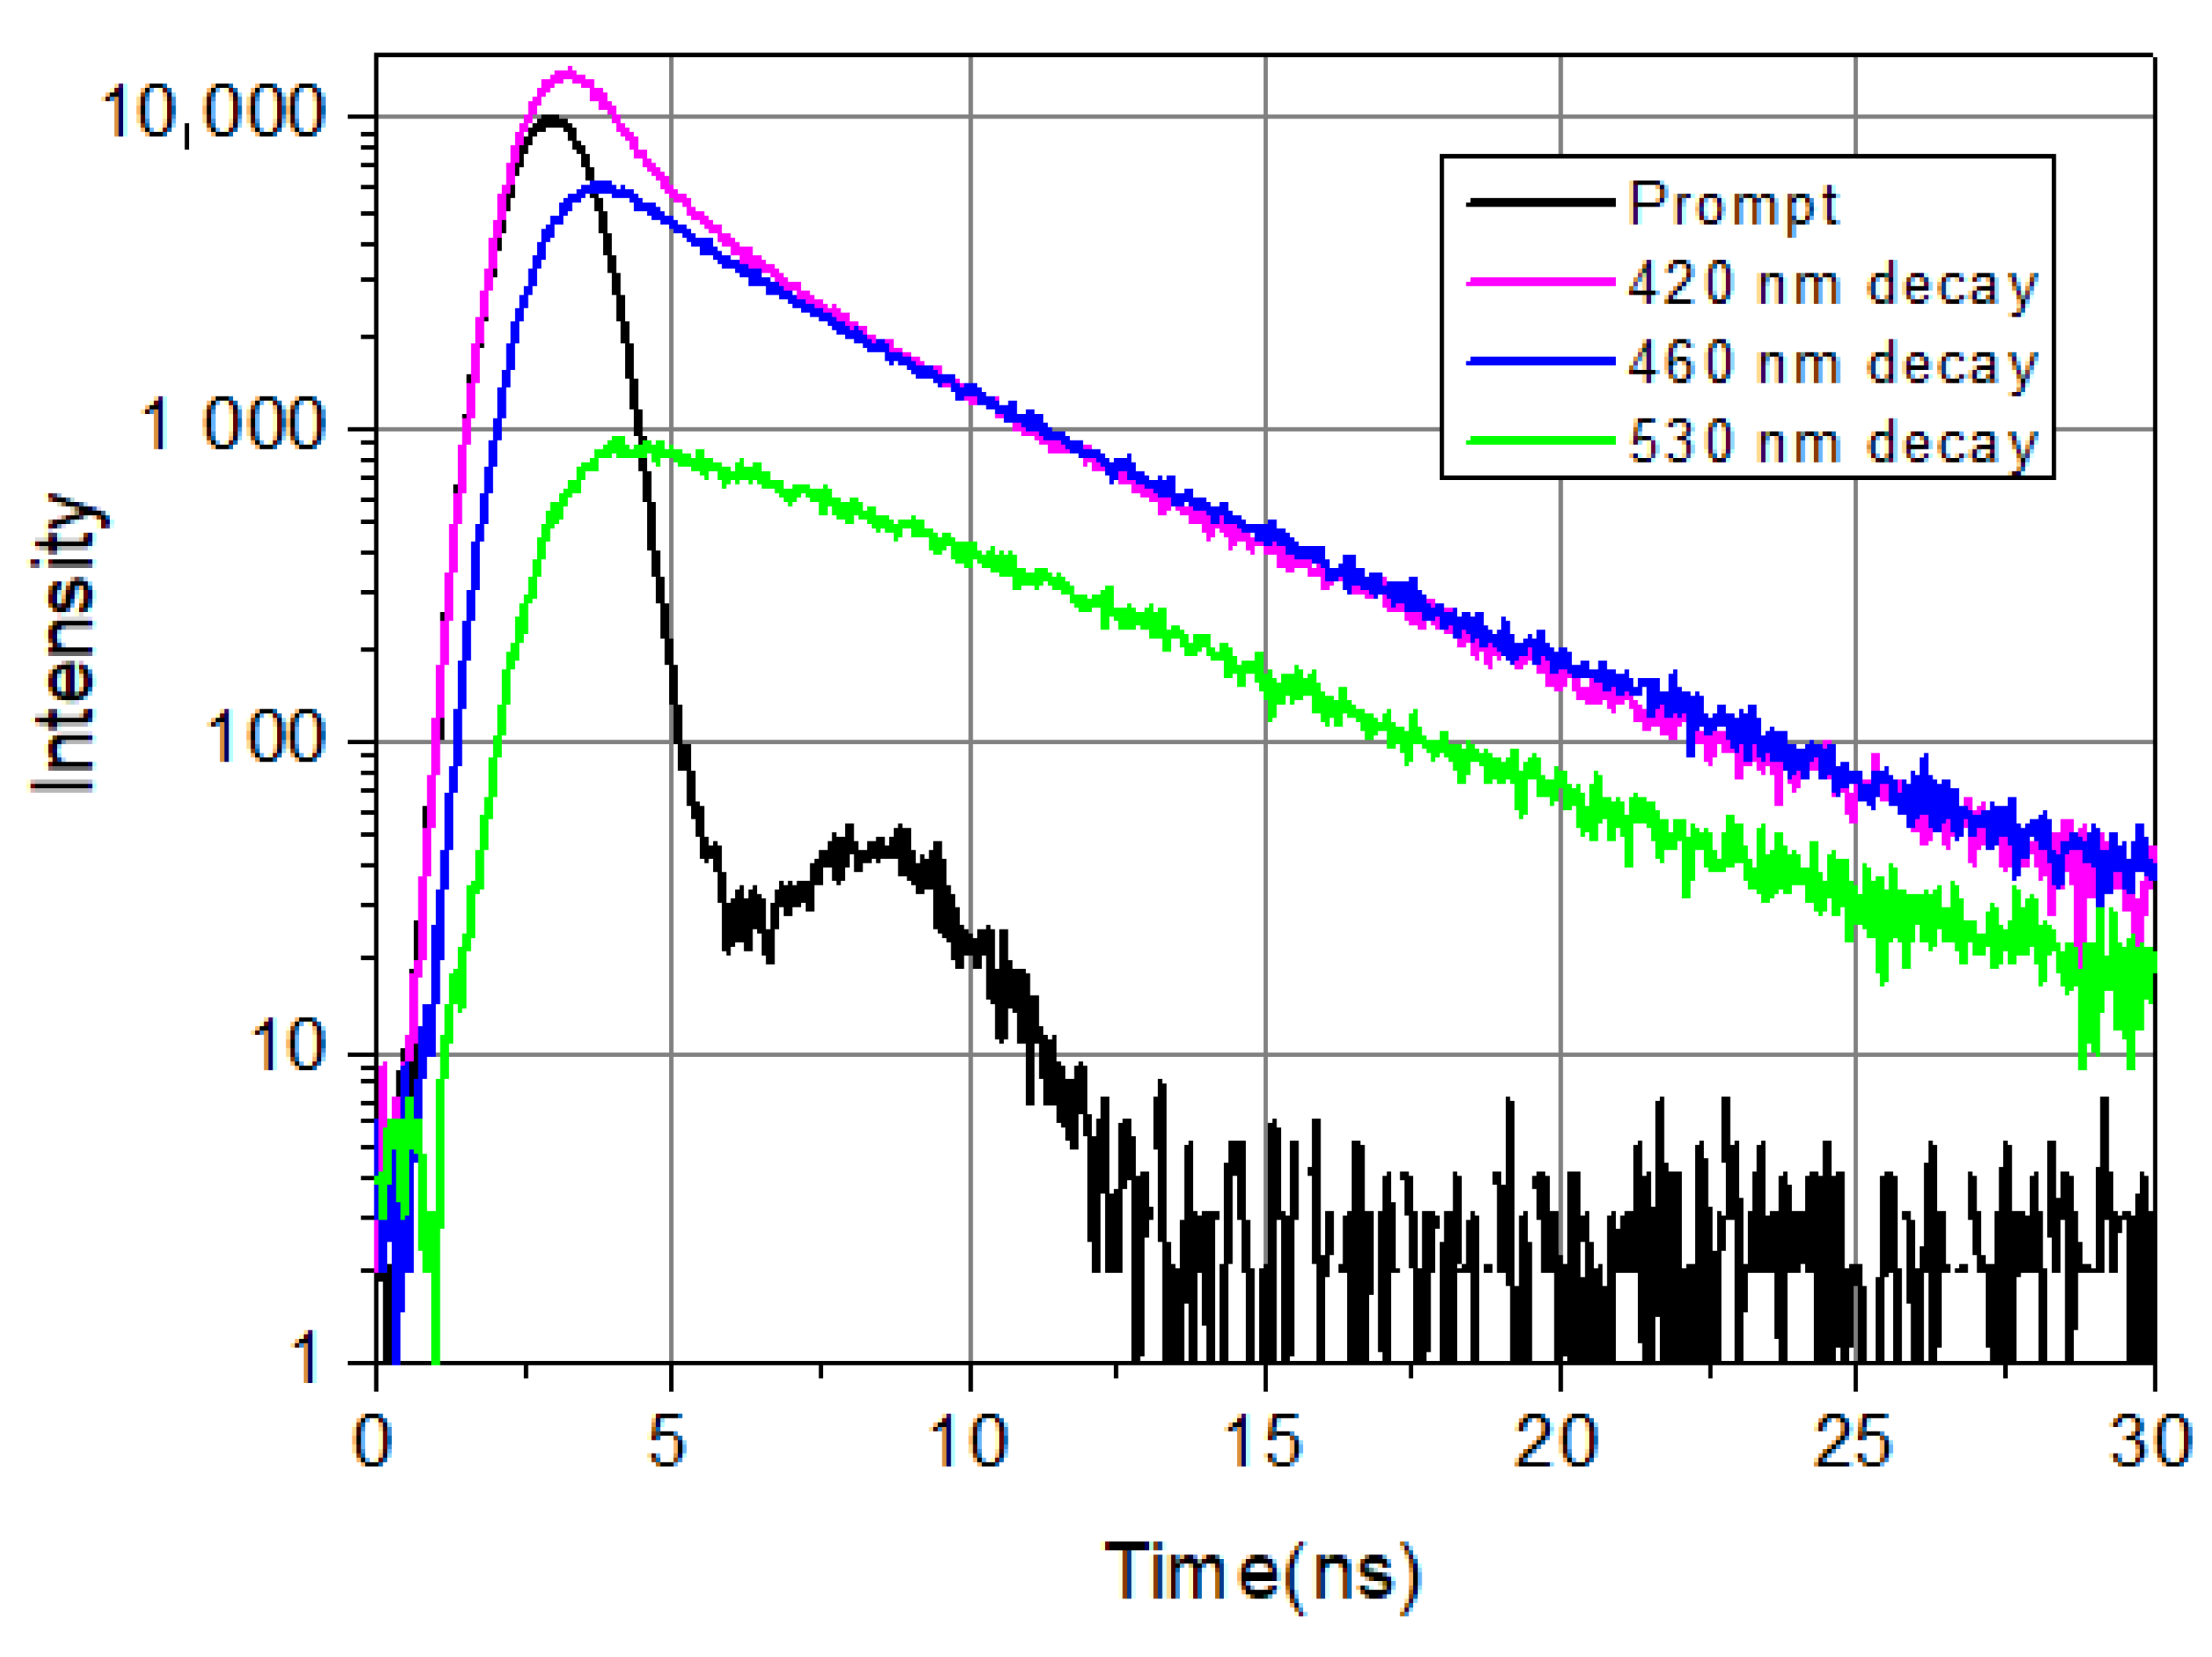
Figure 1 shows typical decays from the blue side, the center, and the red side of the LAURDAN’s emission. Among the four exponential components, there is a very fast one, faster than the resolution limit of the Nanolog spectrofluorometer. Its value is taken as 0.01 ns; the exact value is not known. Nevertheless, it is important to include this fast component in the deconvolution procedure; this way, all the other decay components and their pre-exponentials can be calculated precisely. The possible reasons for the ultrafast decay component might be scattering of excitation light not cut totally by the emission monochromator and color cut-off filter, fast component of solvent relaxation, etc.
It can be seen that on the shorter wavelength (λ = 420 nm), the fluorescence decays faster compared to the longer wavelength (λ = 530 nm) emission in the first few nanoseconds. This is a consequence of excited state processes. At longer times (t > 10 ns), the speed of decaying is the same at every wavelength, which indicates that emission arrives from relaxed molecules. These decays show the complexity of the temporal evolution of LAURDAN’s non-monoexponentially decaying emission. Details of exited state relaxation are discussed below.
2.3. Characteristic Time of Center-of-Gravity (τCoG)
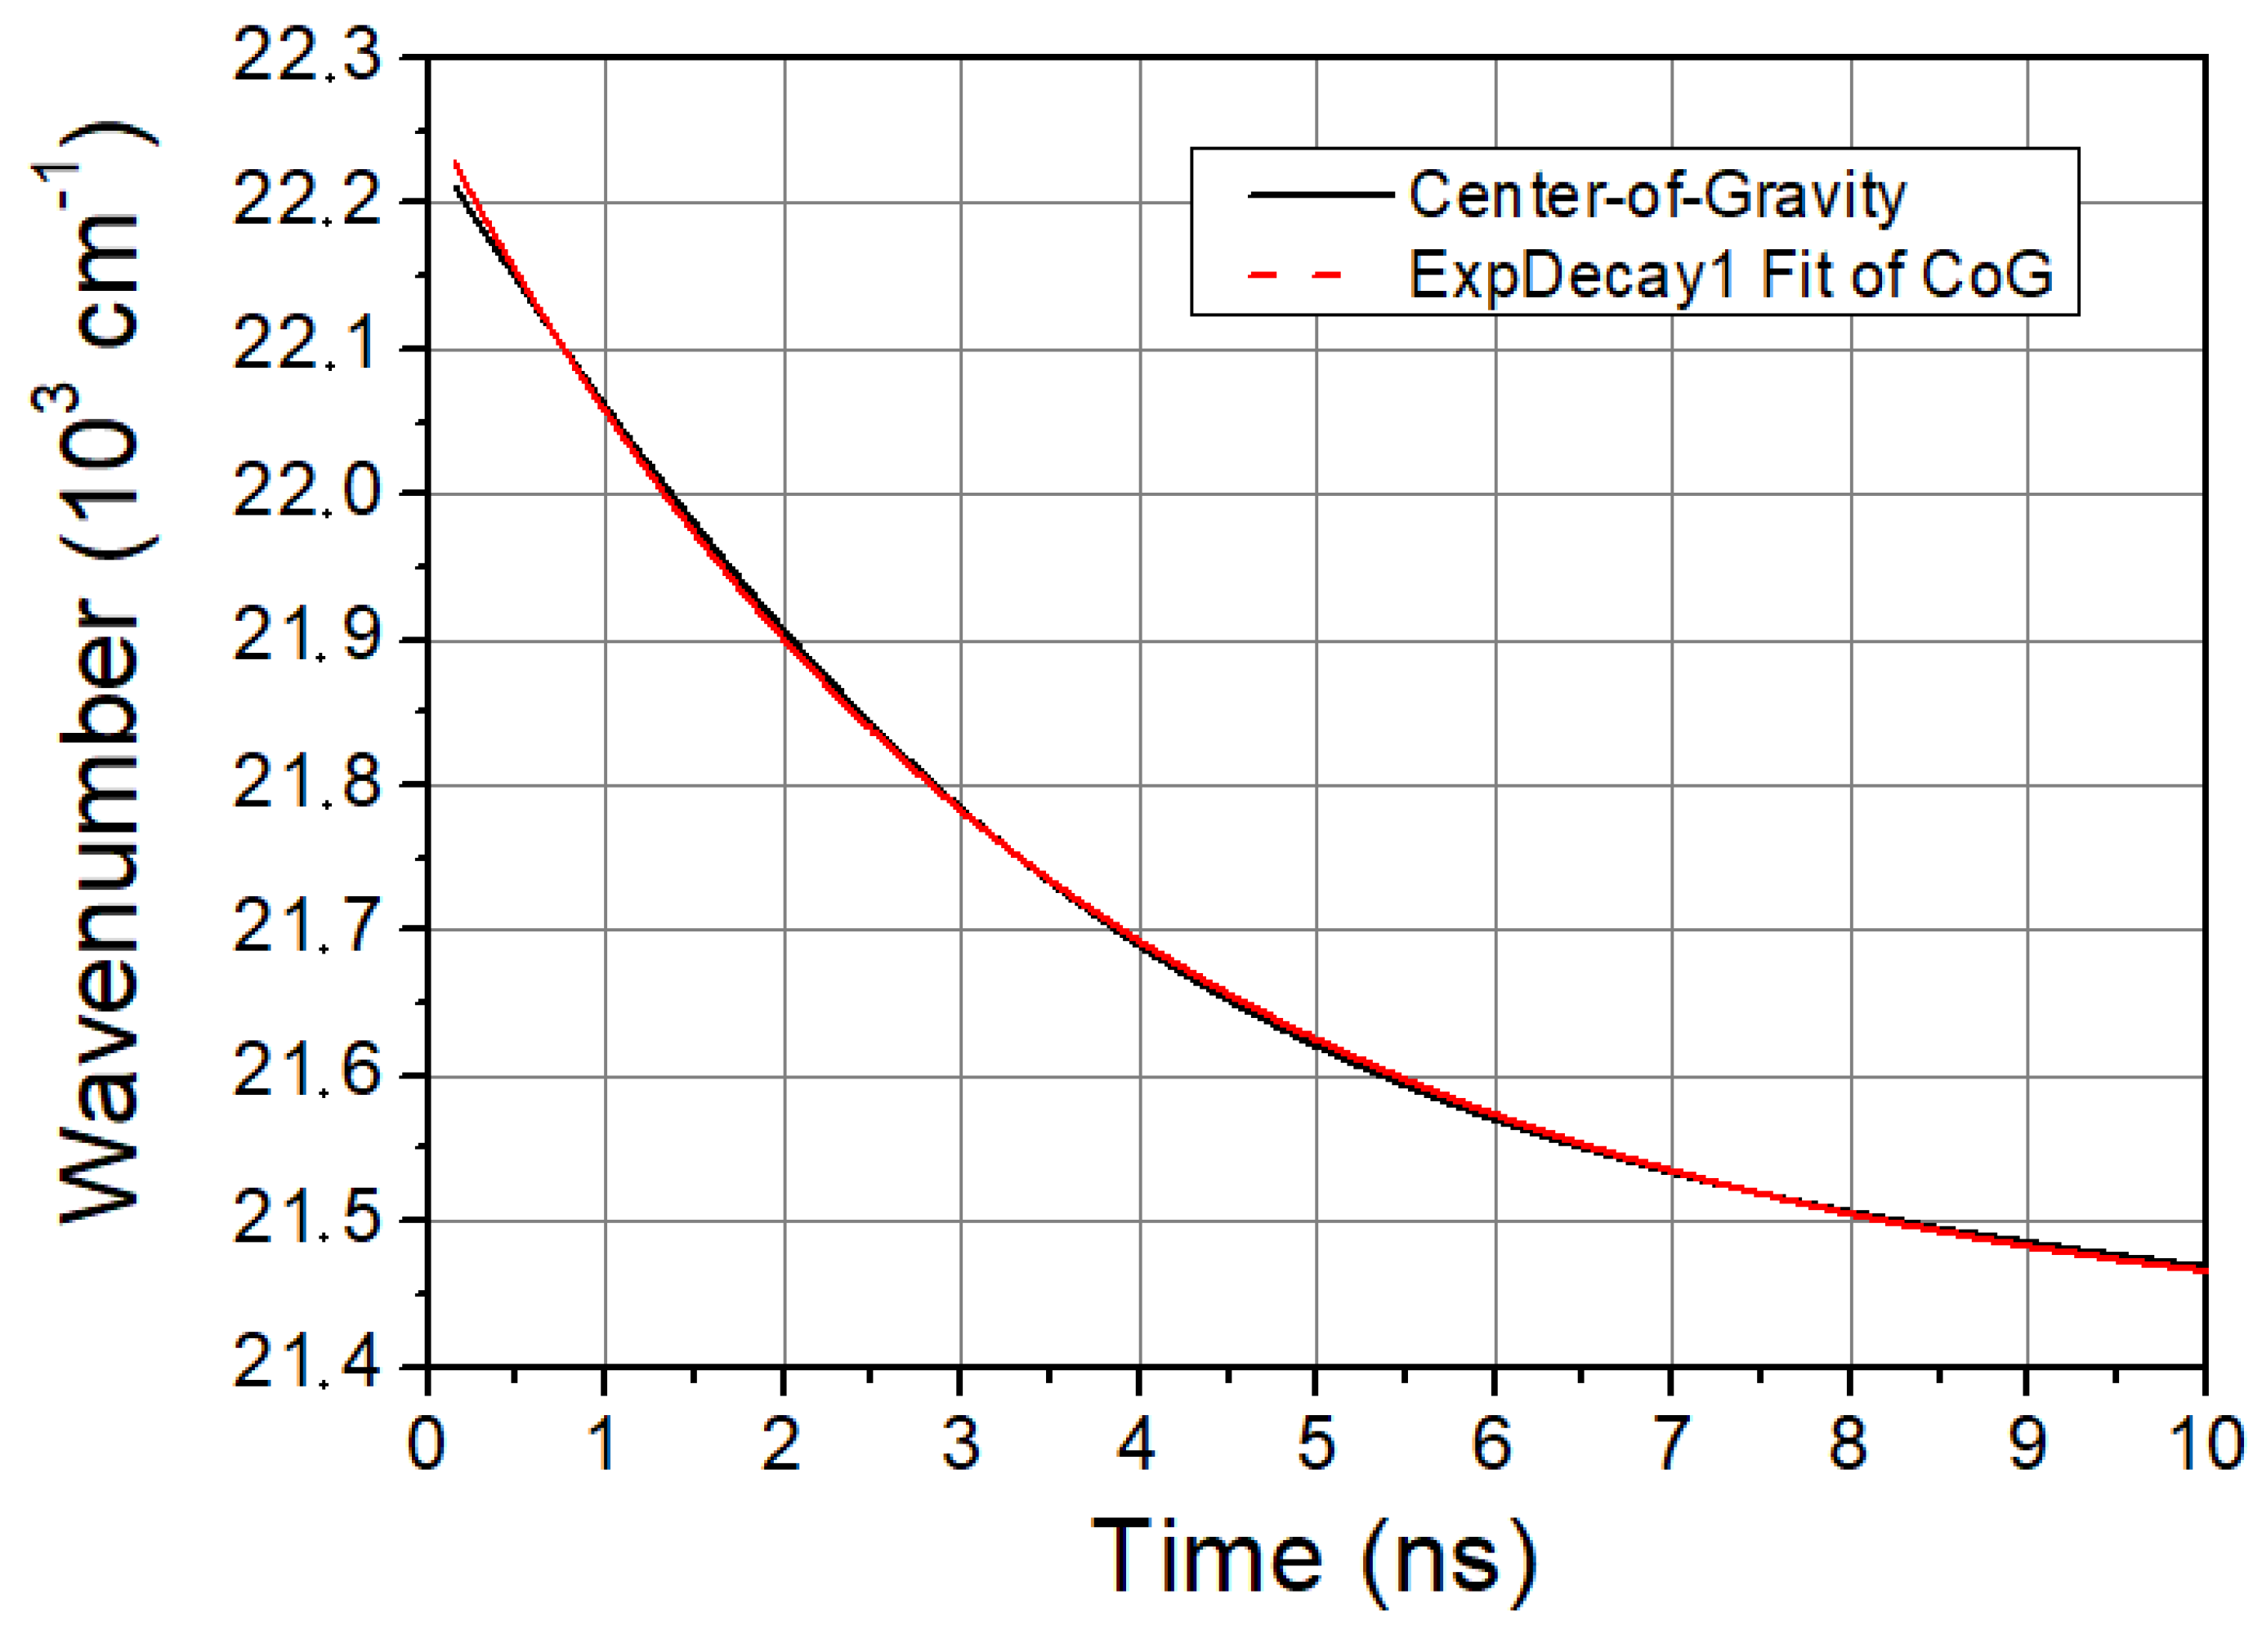
The characteristic time of solvent relaxation can be determined from the temporal evolution of the spectral shift of LAURDAN’s emission. A faster spectral shift corresponds to a faster kinetics of the solvent relaxation process. The speed of solvent relaxation is directly related to the rotational mobility of the water molecules around the LAURDAN within the membrane, and this is often referred to as membrane viscosity. If the τCoG is low, that means a faster rotational motion of water molecules around LAURDAN and lower membrane viscosity, while if the value is high, it means a slower rotational motion of water molecules around LAURDAN, higher membrane viscosity, and stiffness. The time evolution of CoG function is monoexponential in all cases studied. A typical graph of it is shown in Figure 2.
The calculated values of the characteristic times of the CoG function are presented in Table 1.
For SMase, Myr, and C1, there is an increase in τCoG values compared to non-treated samples, which characterizes a slowing of the spectral shift, suggesting some increase in membrane stiffness. In contrast, for MCD, a significant decrease in τCoG is seen, which clearly implies faster solvent relaxation, i.e., reduced stiffness.
2.4. Generalized Polarization (GP)
For the determination of the GP, the intensity values obtained by integrating the fluorescence decay from treated and control (non-treated) samples are used, comparing the results obtained in each case with the self-control. A higher GP value means a more restricted motion of LAURDAN in the membrane, while lower values are referred to as a less restricted motion of LAURDAN in the membrane. The calculated GP values are summarized in Table 2.
In the case of SMase, MCD, and C1, the GP values decreased after the treatment, indicating a red shift in the spectral pattern. The red shift is clear evidence of a transition from the liquid-ordered to the liquid-disordered phase, i.e., the substances alter the microenvironment of the membranes to a greater or lesser extent. In the case of Myr, there is a higher GP value, which means a blue shift in the spectral pattern, and this indicates a transition of the membrane into a more ordered phase.
2.5. Time-Resolved Area-Normalized Spectra (TRANES)
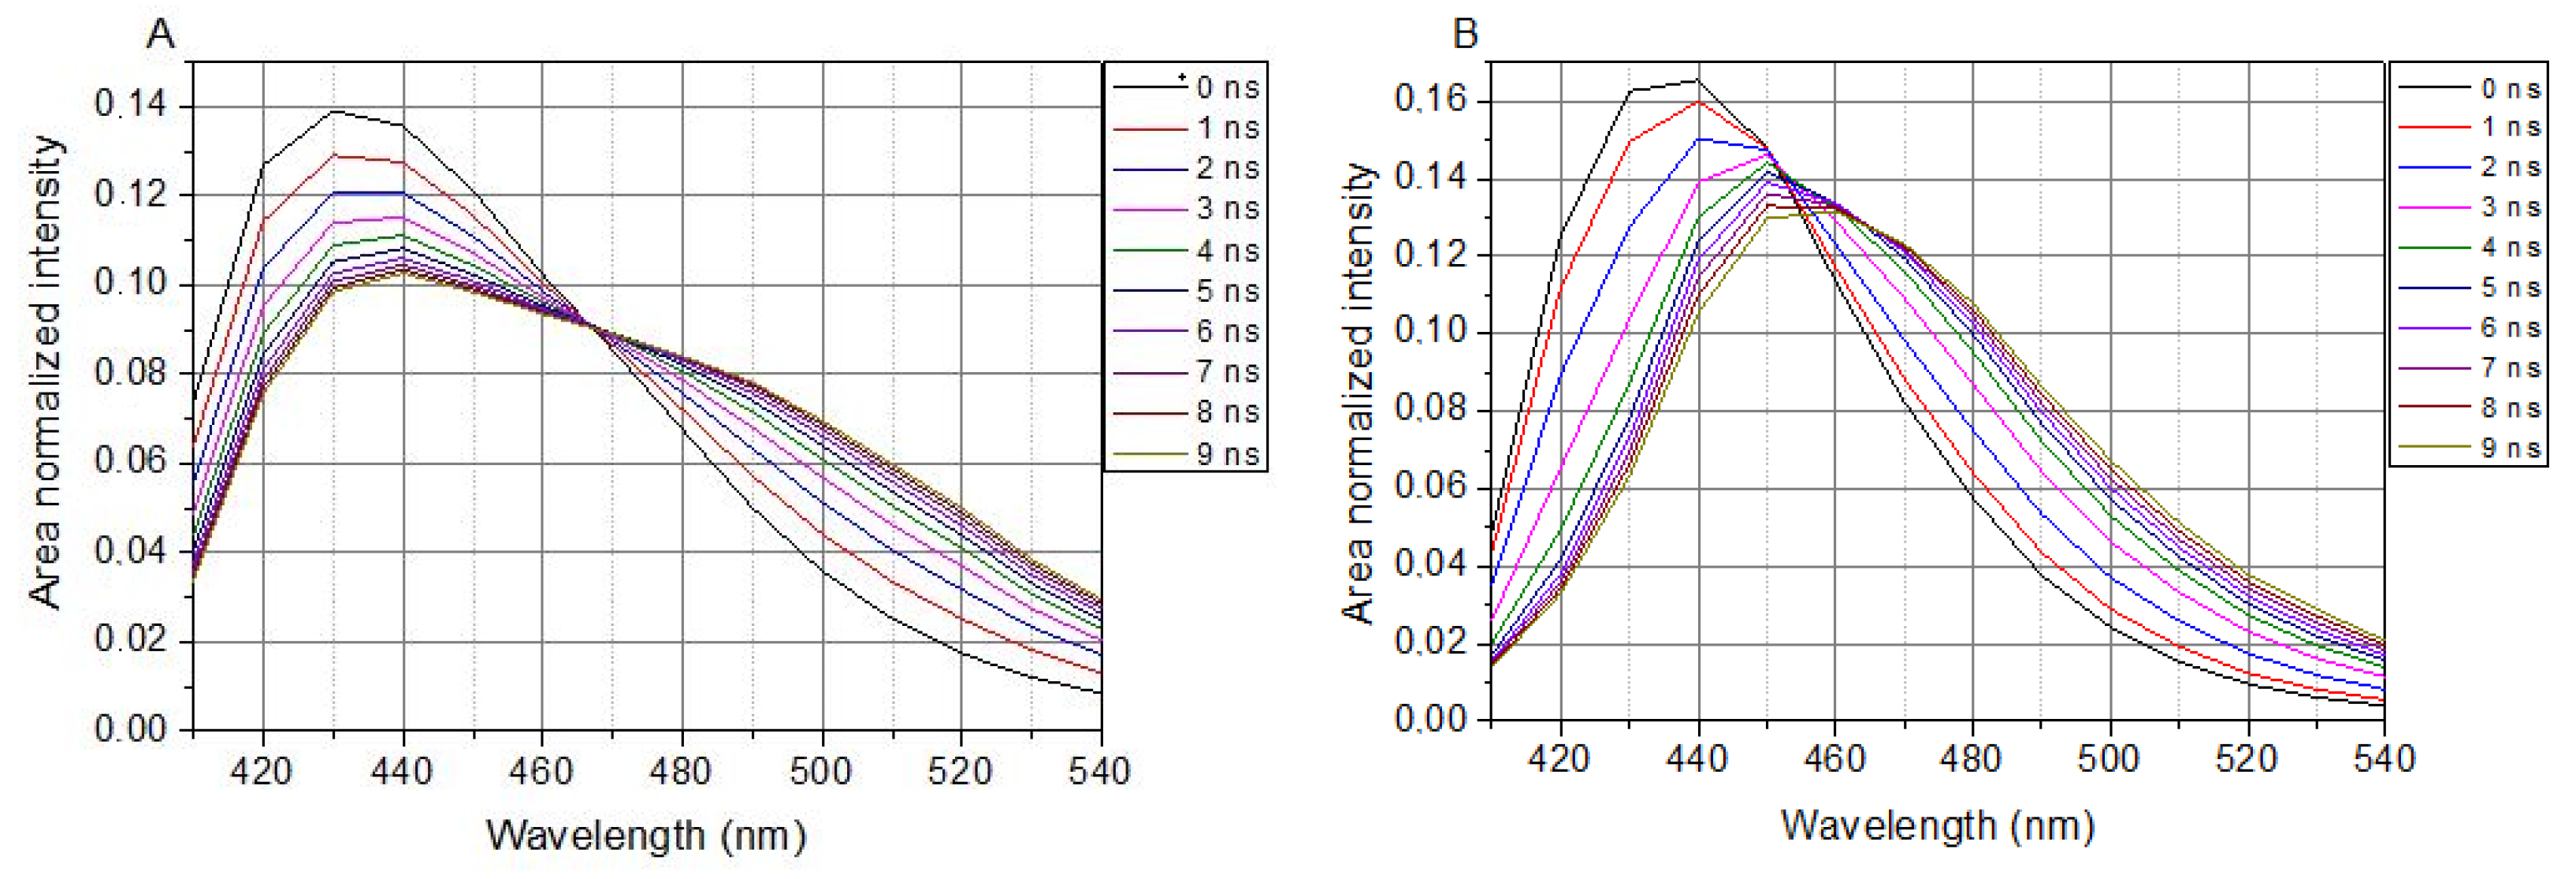
In cell-containing solutions, LAURDAN’s TRANES show an isoemissive point (λ = 466 nm in Figure 3A), which is clear evidence of a two-state reversible process within the excited states of LAURDAN. This indicates the existence of locally excited (LE) and charge transfer (CT) states. Any way of treatment with the lipid raft disruptors, there is no influence on the presence of the isoemissive point.
The presence of SMase, Myr, MCD, or C1 does not change the appearance of the isoemissive point; these compounds have an effect on the temporal evolution of processes around LAURDAN in the membrane.
In a buffer solution (without cells), LAURDAN’s TRANES does not show an isoemissive point, but rather a continuous shift of emission spectrum can be observed (Figure 3B), which corresponds to a continuous relaxation.
2.6. Time-Resolved Anisotropy
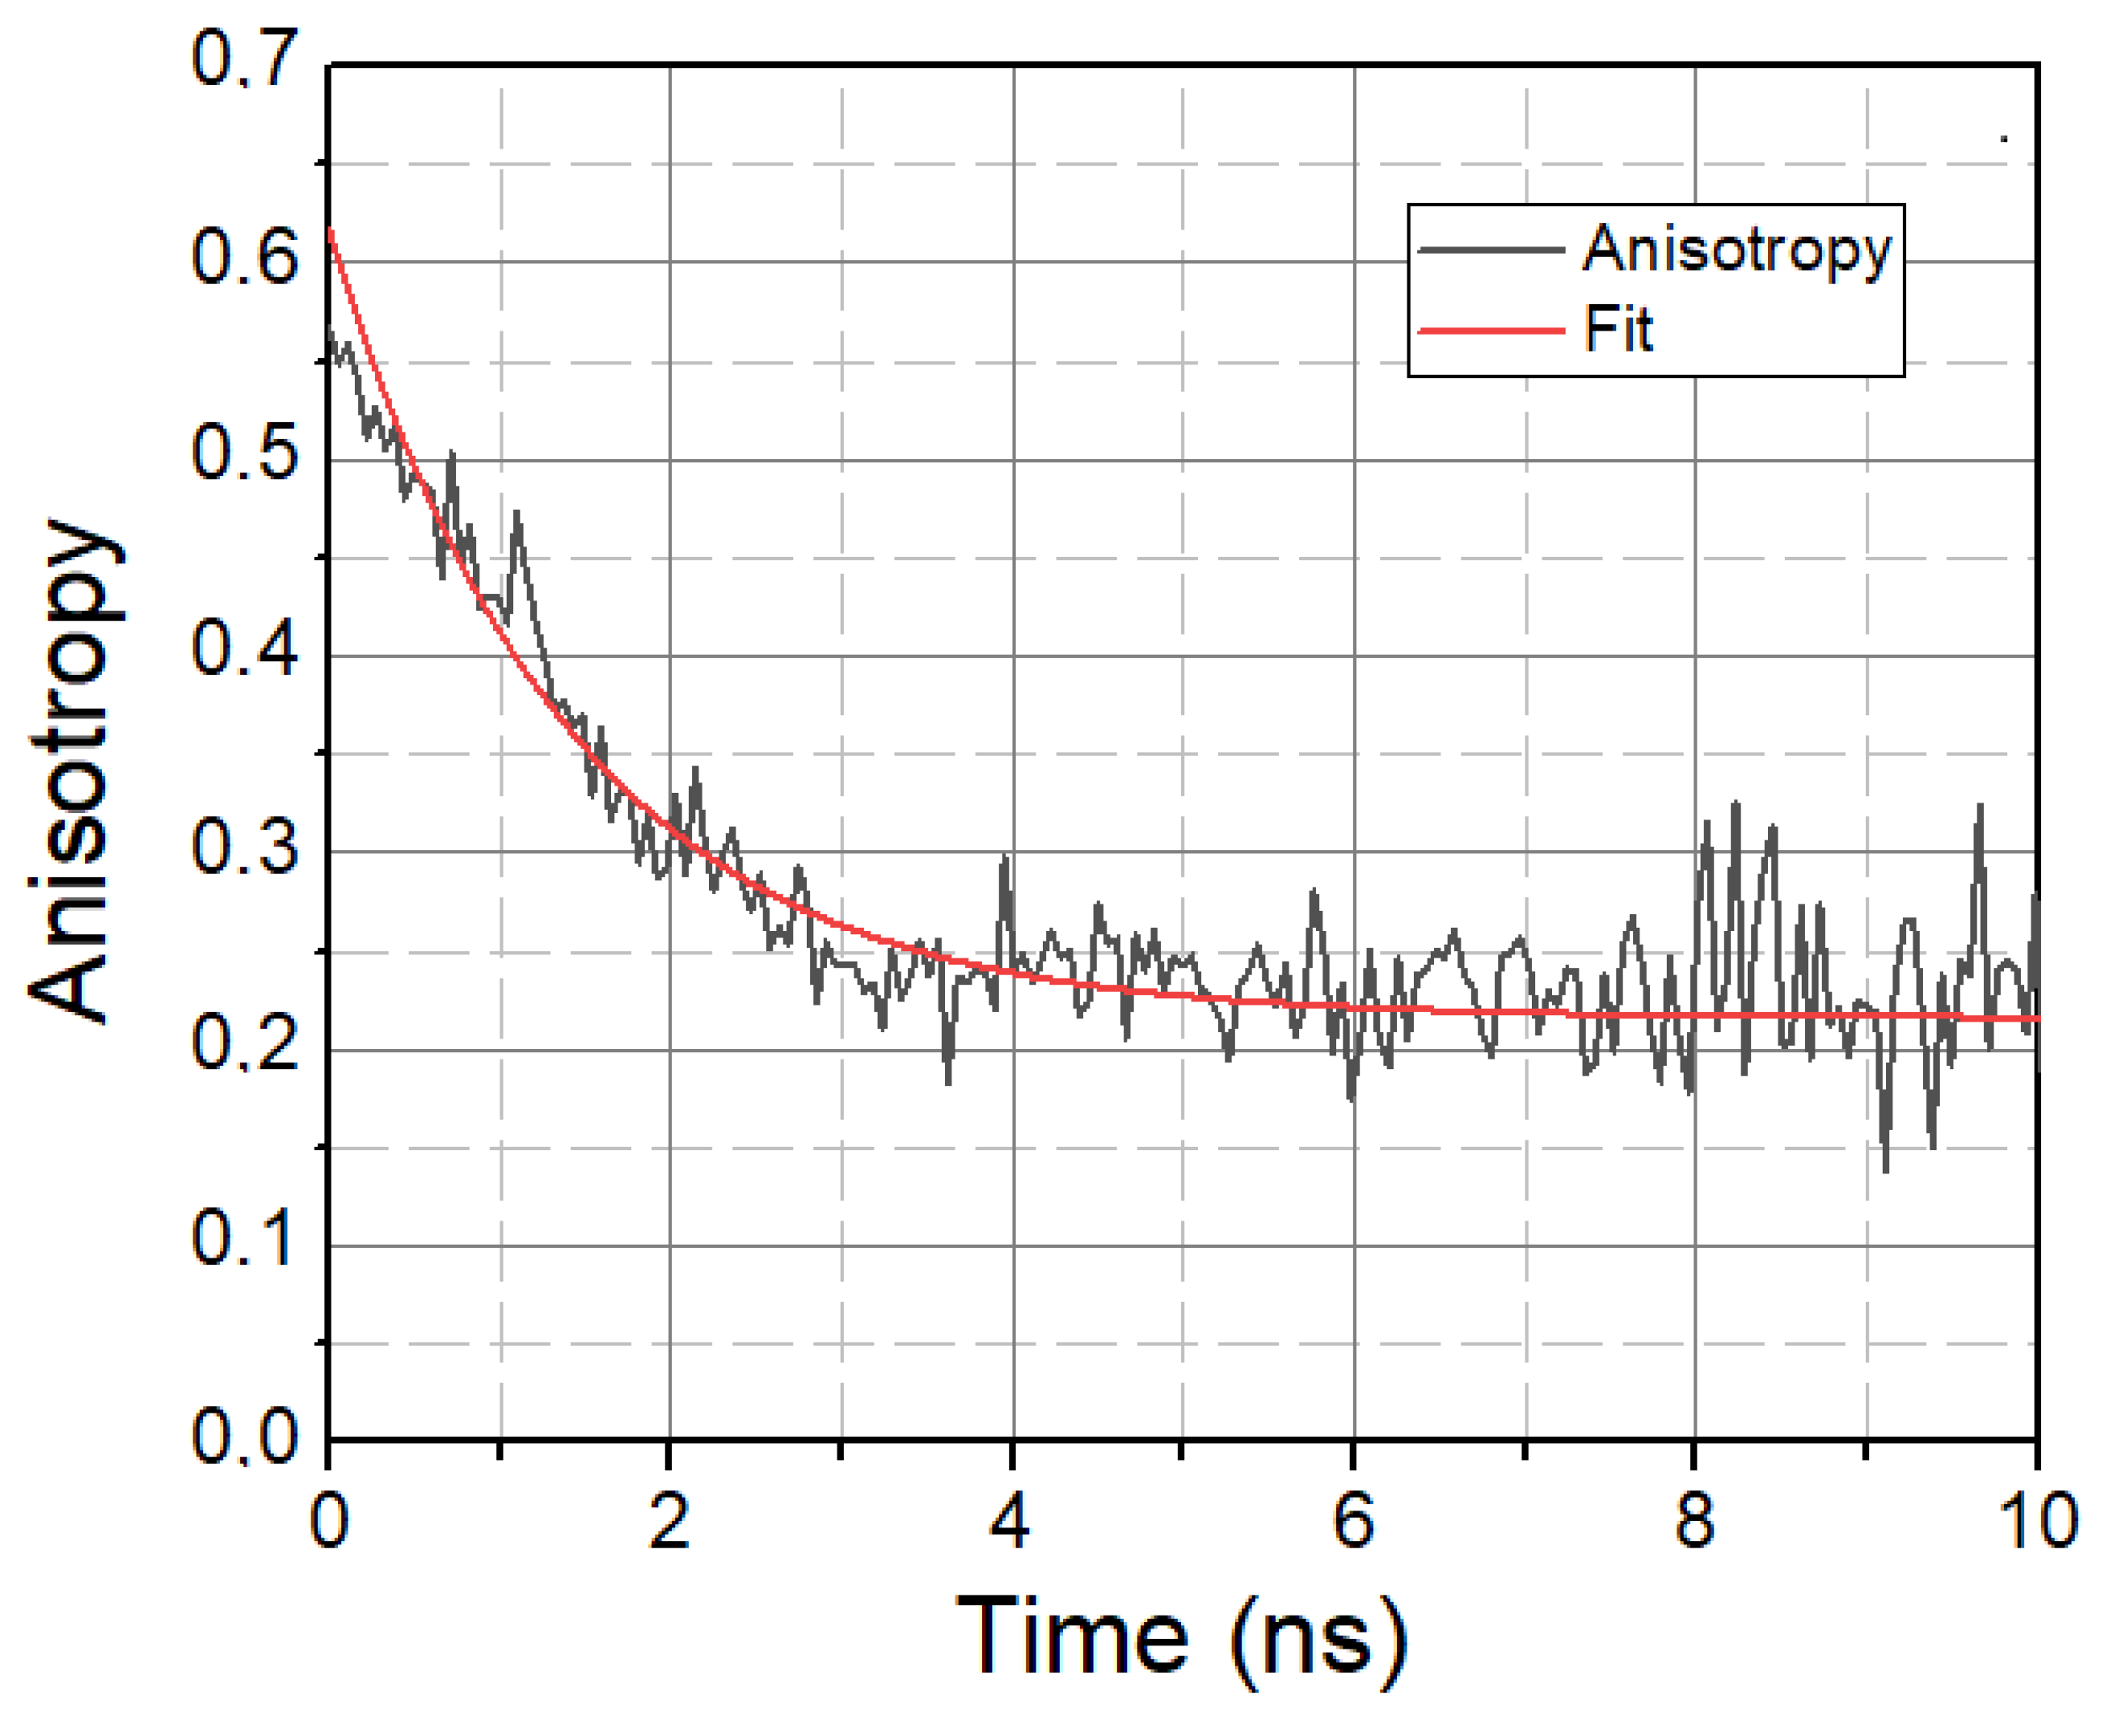
In addition to solvent relaxation, we also investigated the mobility property of LAURDAN molecules, the characteristic parameter of which is the rotational correlation time τrot, calculated using time-resolved anisotropy decays. A typical anisotropy decay is displayed in Figure 4.
A higher τrot value means the slower rotational motion of LAURDAN, while a lower τrot value means the faster rotational motion of LAURDAN. The calculated rotational lifetime values based on treated and untreated samples are given in Table 3.
The variation in τrot gives information about the rotational properties of LAURDAN in the membrane, i.e., how much the molecule is confined in the membrane. For SMase, MCD, and C1, the values decrease compared to the control, implying faster rotation and, thus, less confinement of LAURDAN molecules. In contrast, for Myr, there is an increase, implying slower rotation and, thus, more confined LAURDAN molecules in the membrane.
3. Discussion
The manipulation of lipid rafts has opened up an alternative method in pharmacological studies to investigate both the microenvironment of membranes and the function of receptor proteins located within them. An experimental tool for the environment and fluidity of membranes is the LAURDAN fluorescent dye, whose fluorescence parameters can be used to infer the current hydration level of the membrane, i.e., the ratio of liquid-ordered to liquid-disordered phases [23,24,33]. In addition, the characteristic parameters of fluorescence and anisotropy decays can be used to characterize fluidity [34,35,36]. Our research group has previously demonstrated that the cholesterol-depletor MCD and C1 alter cell membrane polarity by lowering GP values in steady-state conditions [17,18]. We also described that SMase did not change the membrane polarity, while Myr caused a significant elevation in fluorescence intensity, which meant a shift to the more liquid-ordered phase [22].
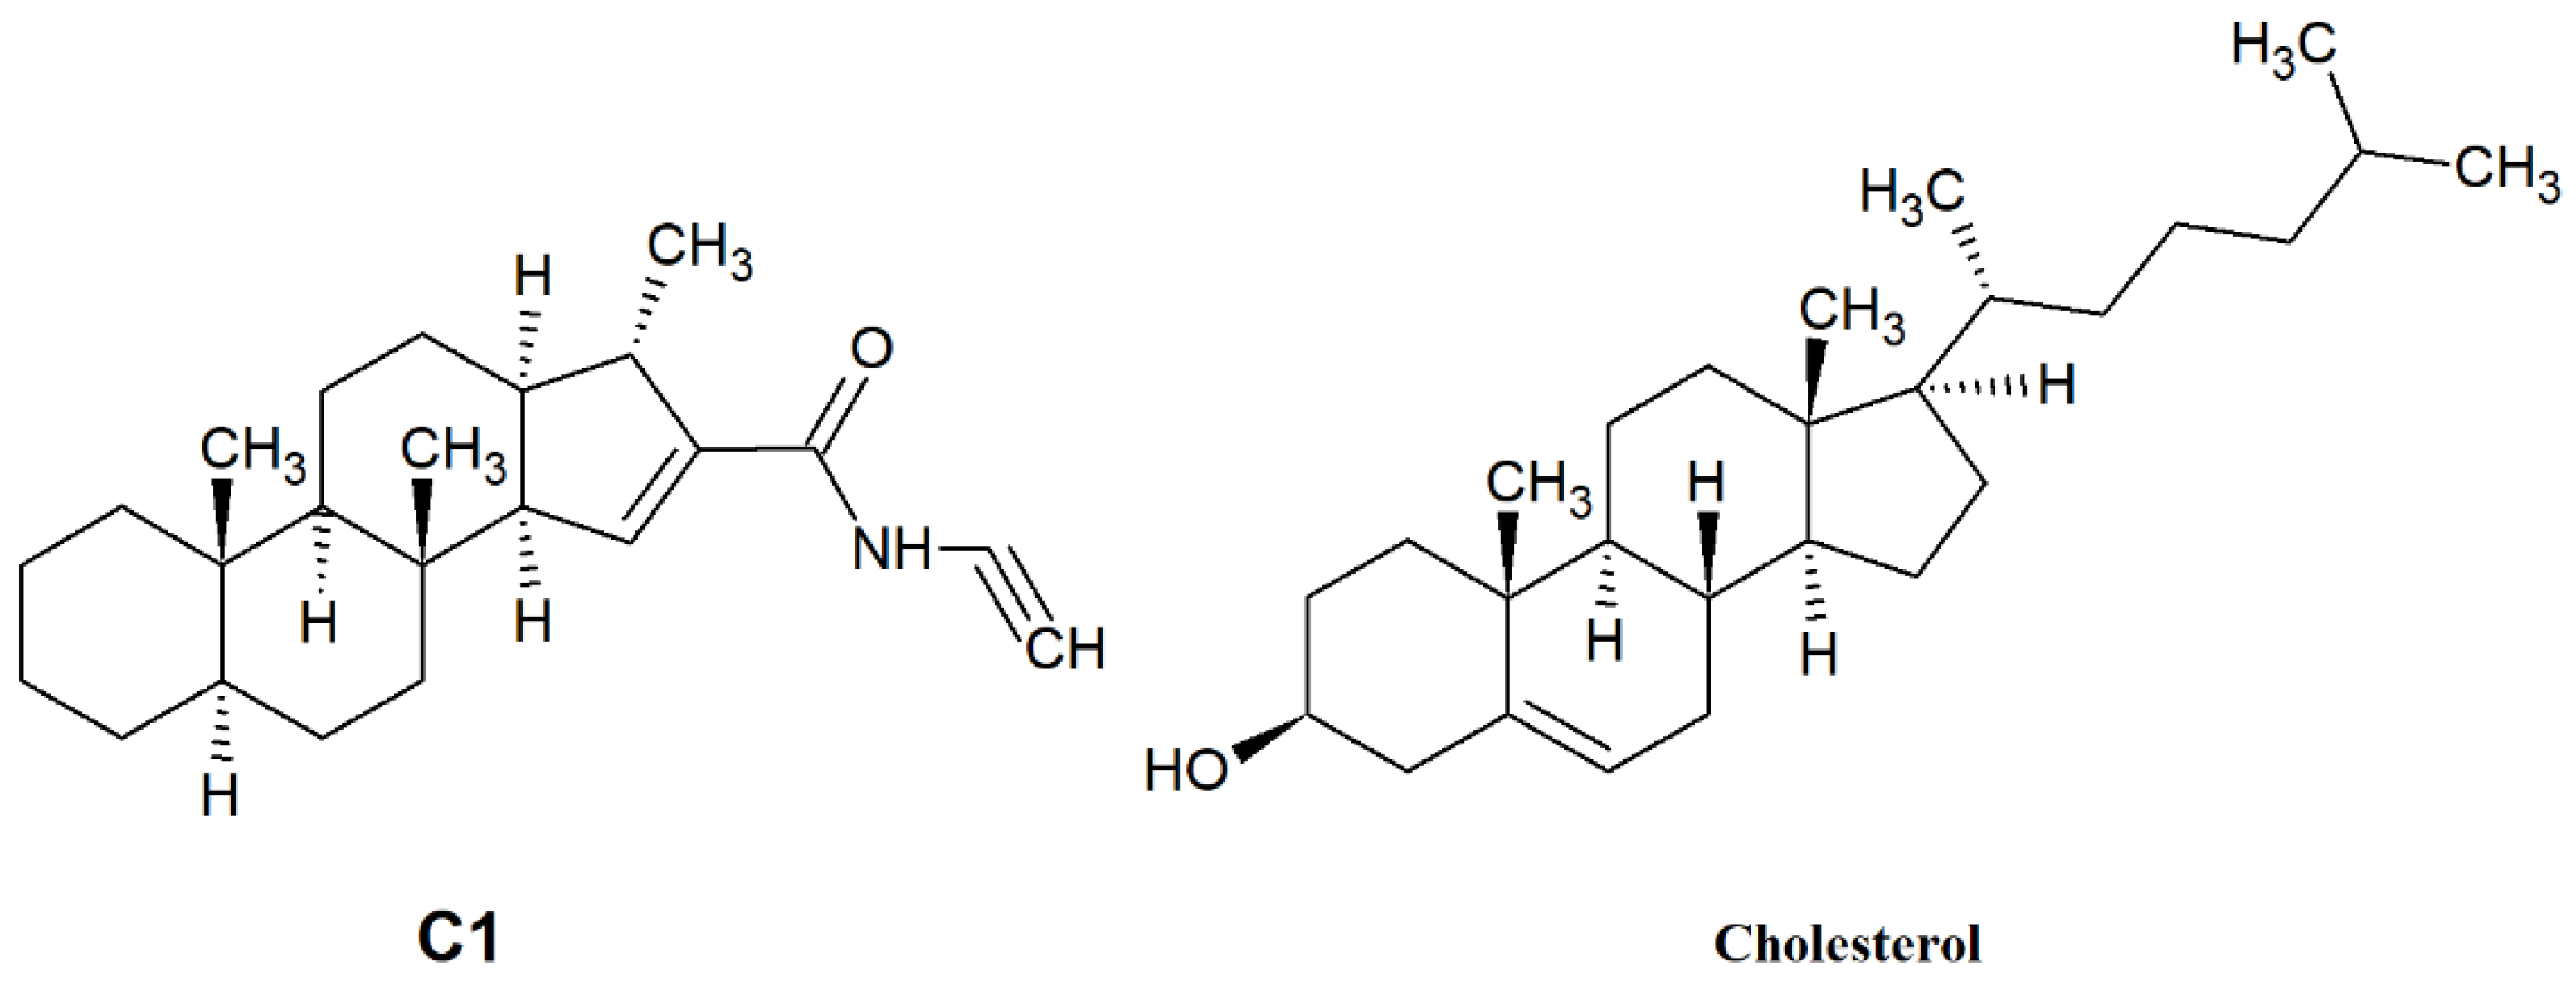
In our current study, we investigated the effect of SMase, Myr, MCD, and C1 on cell membrane fluidity with fluorescence spectroscopy using LAURDAN. First, we proved with the TRANES measurement—the existence of the isoemissive point—that LAURDAN molecules are incorporated into the membrane; however, it is important that with fluorescence spectroscopy, the cell membrane and inner membrane system cannot be distinguished. The change in GP values for SMase, MCD, and C1 showed a red shift, indicating that the membrane has changed to a more disordered direction. These results are in agreement with previous findings from other groups. Weber and colleagues investigated the effect of temperature changes and cholesterol depletion (by MCD) or supplementation (MCD:cholesterol complex) and found that increased temperature or MCD treatment decreased membrane stiffness, while cholesterol enrichment showed the opposite effect [37]. Furthermore, Startek and co-workers investigated the effect of MCD on mouse TRPA1 localization in raft region by Total Internal Reflection Fluorescence Microscopy and gradient separation methods. They found a high co-localization of mouse TRPA1 and flotillin-2 (a lipid raft marker), which is significantly decreased after MCD treatment, indicating an alteration in the membrane structure [38]. In the case of Myr treatment, the GP change showed a different shift from the others in the blue direction, in agreement with our previously described result [22], suggesting that the cell membrane has moved to a more ordered phase. This observation is in contrast to a recently reported result where two-photon microscopy was used to investigate the effects of decreased sphingolipid supply as well as Myr treatment [39,40]. Due to the impairment of sphingolipid synthesis and decreased sphingolipid supply, LAURDAN fluorescence analysis showed a significant decrease in membrane rigidity, which was also confirmed with breakthrough force measurements [39]. Furthermore, a significant decrease in LAURDAN GP was observed after 5 min of 2.5 µM Myr treatment, but the authors noted that other lipidomic analyses had measured elevated glycerophospholipid levels, which compensated to some extent for the effect of Myr [40,41]. The difference in results was presumably due to the difference in concentration (100 nM vs. 2.5 µM), the duration of treatment (24 h vs. 5 min), and the difference in method since both measurements were performed on CHO cells. The two-photon microscopy allowed selective examination of the plasma membrane, whereas fluorescence spectroscopy provided information on the whole membrane system of the cell. From the rate of change of CoG values over time, we can infer the relaxation of the solvent surrounding LAURDAN, which is related to membrane stiffness and, thus, indirectly to membrane microviscosity. The decrease of τCoG values in MCD-treated samples is a clear sign of faster solvent relaxation, indicating lower stiffness. However, in the case of SMase, Myr, and C1, there was a smaller to larger increase in τCoG values as a result of treatment, indicating a slowing of the spectral shift, i.e., increased stiffness. In the case of SMase, our observation may be explained by the fact that phosphocholine and ceramide synthesized during hydrolysis of sphingomyelins, remaining in the membrane, slow down solvent relaxation processes [20,42]. In the case of Myr, the processes involved in glycerophospholipid formation mentioned above may be responsible [40,41,43], while in the case of C1, a structural similarity to cholesterol (Figure 5) may explain the slowing of solvent relaxation and spectral shift, as it may substitute cholesterol in the membrane.
For τrot, we found that SMase, MCD, and C1 treatment resulted in reduced values compared to controls, indicating a less confined and, therefore, faster spinning LAURDAN molecule, that is, a lower microviscosity. In the case of Myr, we also obtained the opposite result, indicating a more confined presence of LAURDAN. The explanation for decreased τrot value after SMase treatment could be the structural differences between sphingomyelins and the products of SMase digestion, phosphocholine and ceramide. In the case of MCD and C1, the depletion of cholesterol provides a clear explanation for the faster rotation of LAURDAN. In the case of Myr, the elevated compensatory formation of glycerophospholipids, which can somehow counter the inhibitory effect of Myr, may explain the increased τrot values, which indicates that the LAURDAN molecules have slower rotational properties.
4. Materials and Methods
4.1. Drugs and Chemicals
C1 was synthesized by our collaborators at the University of Pannonia, Department of Organic Chemistry. SMase, MCD, Myr, and LAURDAN were purchased from Sigma (St. Louis, MO, USA). C1 and LAURDAN were dissolved in dimethyl sulfoxide (DMSO) to obtain a 10 mM stock solution, and Myr was also dissolved in DMSO to obtain a 5 mM stock. MCD was freshly dissolved in an extracellular solution (ECS), and SMase—which was in a glycerol-buffered solution—was also freshly diluted with ECS to the final concentration. ECS parameters were the following: 160 mM NaCl, 2,5 mM KCl, 1 mM CaCl2, 2 mM MgCl2, 10 mM HEPES, 10 mM glucose, pH 7,3. For the treatment, we used the listed concentrations: 30 mU (SMase), 100 nM (Myr), 100 µM (C1), 10 mM MCD, and 40 µM LAURDAN, respectively.
4.2. Sample Preparation
Native CHO cells were placed on 24-well plates, and the cells were treated with the lipid raft disruptors in ECS at 37 °C in a humidified atmosphere with 5% CO2. The concentrations and the treatment durations were the following: 30 mU SMase, 100 µM C1, 10 mM MCD for 45 min, and 100 nM Myr for 24 h, respectively. Cells were then washed 3 times with phosphate-buffered saline (PBS) and incubated with 40 µM LAURDAN solution in ECS for 40 min at the same condition. Cells were then washed 3 times with PBS, scraped from the plates, and transferred into 1 mL PBS. For the fluorescent measurement, two samples were prepared simultaneously, and before the measurements, the samples were pooled. For every single treatment, a self-control (non-treated) sample was used. Treated and control samples originating from the same preparation were measured within a few hours. This ensures proper background for observation of the effects of disruptors. Due to the different cell numbers in our samples, the control samples were different from day to day, and therefore the comparison can be made between the coupled control and treated samples.
4.3. Spectrofluorometer Setup
To record time-resolved fluorescence decays and anisotropy decays, a HORIBA Jobin-Yvon Nanolog FL3-2iHR spectrofluorometer equipped with NanoLEDs as excitation sources were used. The wavelength of NanoLED pulses was 369 nm, which fits very well with LAURDAN’s excitation spectrum. The typical temporal pulse width was 1.0 ns. Built-in deconvolution software of Nanolog was used to analyze fluorescence and anisotropy decays. On the emission side, in front of the entrance slit of the emission monochromator, a long pass glass filter transparent over 399 nm was applied to reduce the flux of the excitation photons scattered from the samples. Samples were measured in a 4 mm path length quartz cuvette (Hellma 104F-QS), and their temperature was set and controlled by a Thermo Scientific circulating bath AC200-A25 to 20 °C.
4.4. Determination of Membrane Fluidity Parameters
To study the membrane fluidity, both fluorescence decays and anisotropy decays were measured. In this section, we describe how parameters characterizing the membrane fluidity was determined from the raw measured data.
4.4.1. Fluorescence Decays, Time-Emission Matrices
Fluorescence decay curves were measured through the whole emission range of LAURDAN (400–540 nm, 14 decays, Δλ = 10 nm). In a deconvolution procedure, they were fitted by the 4-exponential function; this gave a satisfying fit at all wavelengths. It was necessary because—over the intrinsic non-exponential decay nature of LAURDAN—there was a strong spectral shift of emission in time, which appeared as complexity of decay. The lifetime components were only proper fitting parameters describing precisely enough this complex decay shape; they were not attributed to any separate emission species. The non-exponential fluorescence decay of LAURDAN at several wavelengths can be described very well using the calculated fitting parameters. With these determined decay parameters, the original fluorescence decay curves of LAURDAN can be reproduced within 0.03%.
From the series of decay curves, Time-Emission Matrices (TEM) were constructed. In the vertical direction of TEM (Time) there are decay curves. In the horizontal direction of TEM (Emission wavelength) there are time-resolved emission spectra that could be constructed from the intensity data of the consecutive decay curves at the same time point.
4.4.2. Characteristic Time of CoG
The speed of solvent relaxation can be described by the time evolution of the Center-of-Gravity [CoG(t)] function of the time-resolved emission spectra [44]. CoG(t) can be calculated with the following equation (Equation (1)):
It is important to mention that the fluorescence decays were collected in wavelength scale; thus the following transformation (Equation (2)) is needed for the precise calculation:
In our calculations, data from all of the measured decays were used (14 decays, 410–540 nm).
A higher value of CoG(t) means faster conformational change of LAURDAN followed by solvent relaxation of neighboring water molecules. This is a consequence of higher membrane stiffness.
4.4.3. Time-Resolved Area-Normalized Spectra
Time-resolved spectra show the spectral shapes of the emission of LAURDAN at different time points. The temporal evolution of the shape and spectral position of these spectra reflects the temporal change of energetic distance of the excited and ground states involved in the emission. Time-Resolved Area-Normalized Spectra (TRANES) are special versions of time-resolved spectra and could be used well in spectral analysis [IAN(λ,t)] [44]. TRANES were constructed from the time-resolved spectra of TEM as their area under the spectra were normalized to the same value. Equation (3) gives the mathematical formula for producing TRANES:
where
If the spectra cross each other at the same point, we have a so-called isoemissive point, which is clear evidence of a two-state reversible process within the excited states of the molecule studied. The lack of the isoemissive point indicates a continuous shift in the excited state rather than a two-state reaction.
4.4.4. Generalized Polarization
To quantify the spectral changes, Generalized Polarization function (GP) is widely used [23,24,33], too. From emission data, we calculated the emission GP function with Equation (5):
where I430 and I500 stand for the intensities in fluorescence emission spectrum at 430 nm and 500 nm, respectively. These steady-state intensity data were calculated as integrals of fluorescence decays of LAURDAN with Equation (6):
The samples were handled for roughly 3 h as fresh; thus, there was not enough time to measure both time-resolved and steady-state data one after another from the same sample. That is why steady-state intensity data were calculated rather than measured.
The higher value of GP reflects a blue-shifted spectrum, which is an indication of a more restricted motion of LAURDAN in the membrane. The lower value of GP reflects a red-shifted spectrum, and it is an indication of less restricted motion of LAURDAN in the membrane.
Please note that the name “Generalized Polarization” has no connection to any optical polarization. This quantity is widely used in articles and describes spectral changes. Its name just remembers that its definition is analogous to the definition of physical quantity “polarization”; there is just a mathematical similarity of definitions.
4.4.5. Rotational Correlation Time
Anisotropy decay r(t) was calculated as follows:
where G = IHV/IHH is a correction factor [41]. IVV(t) and IVH(t) are the emission decays measured in the presence of horizontal and vertical polarizers on excitation and emission sides.
τrot was determined from the time-resolved anisotropy decay measurements made at the spectral maximum of the emission (450 nm). It provides information on the mobility of LAURDAN molecules in the phospholipid bilayer, i.e., their confinement in the membrane [35,36].
In the time-resolved anisotropy measurements τrot was determined using the following formula (Equation (8)):
where r(t) is the calculated anisotropy decay. This expression can even be applied at hindered rotors when the anisotropy does not decay to zero.
A higher value of τrot means slower rotation of LAURDAN, which is clear evidence for increased microviscosity around it within the membrane.
4.4.6. Steady-State Spectra
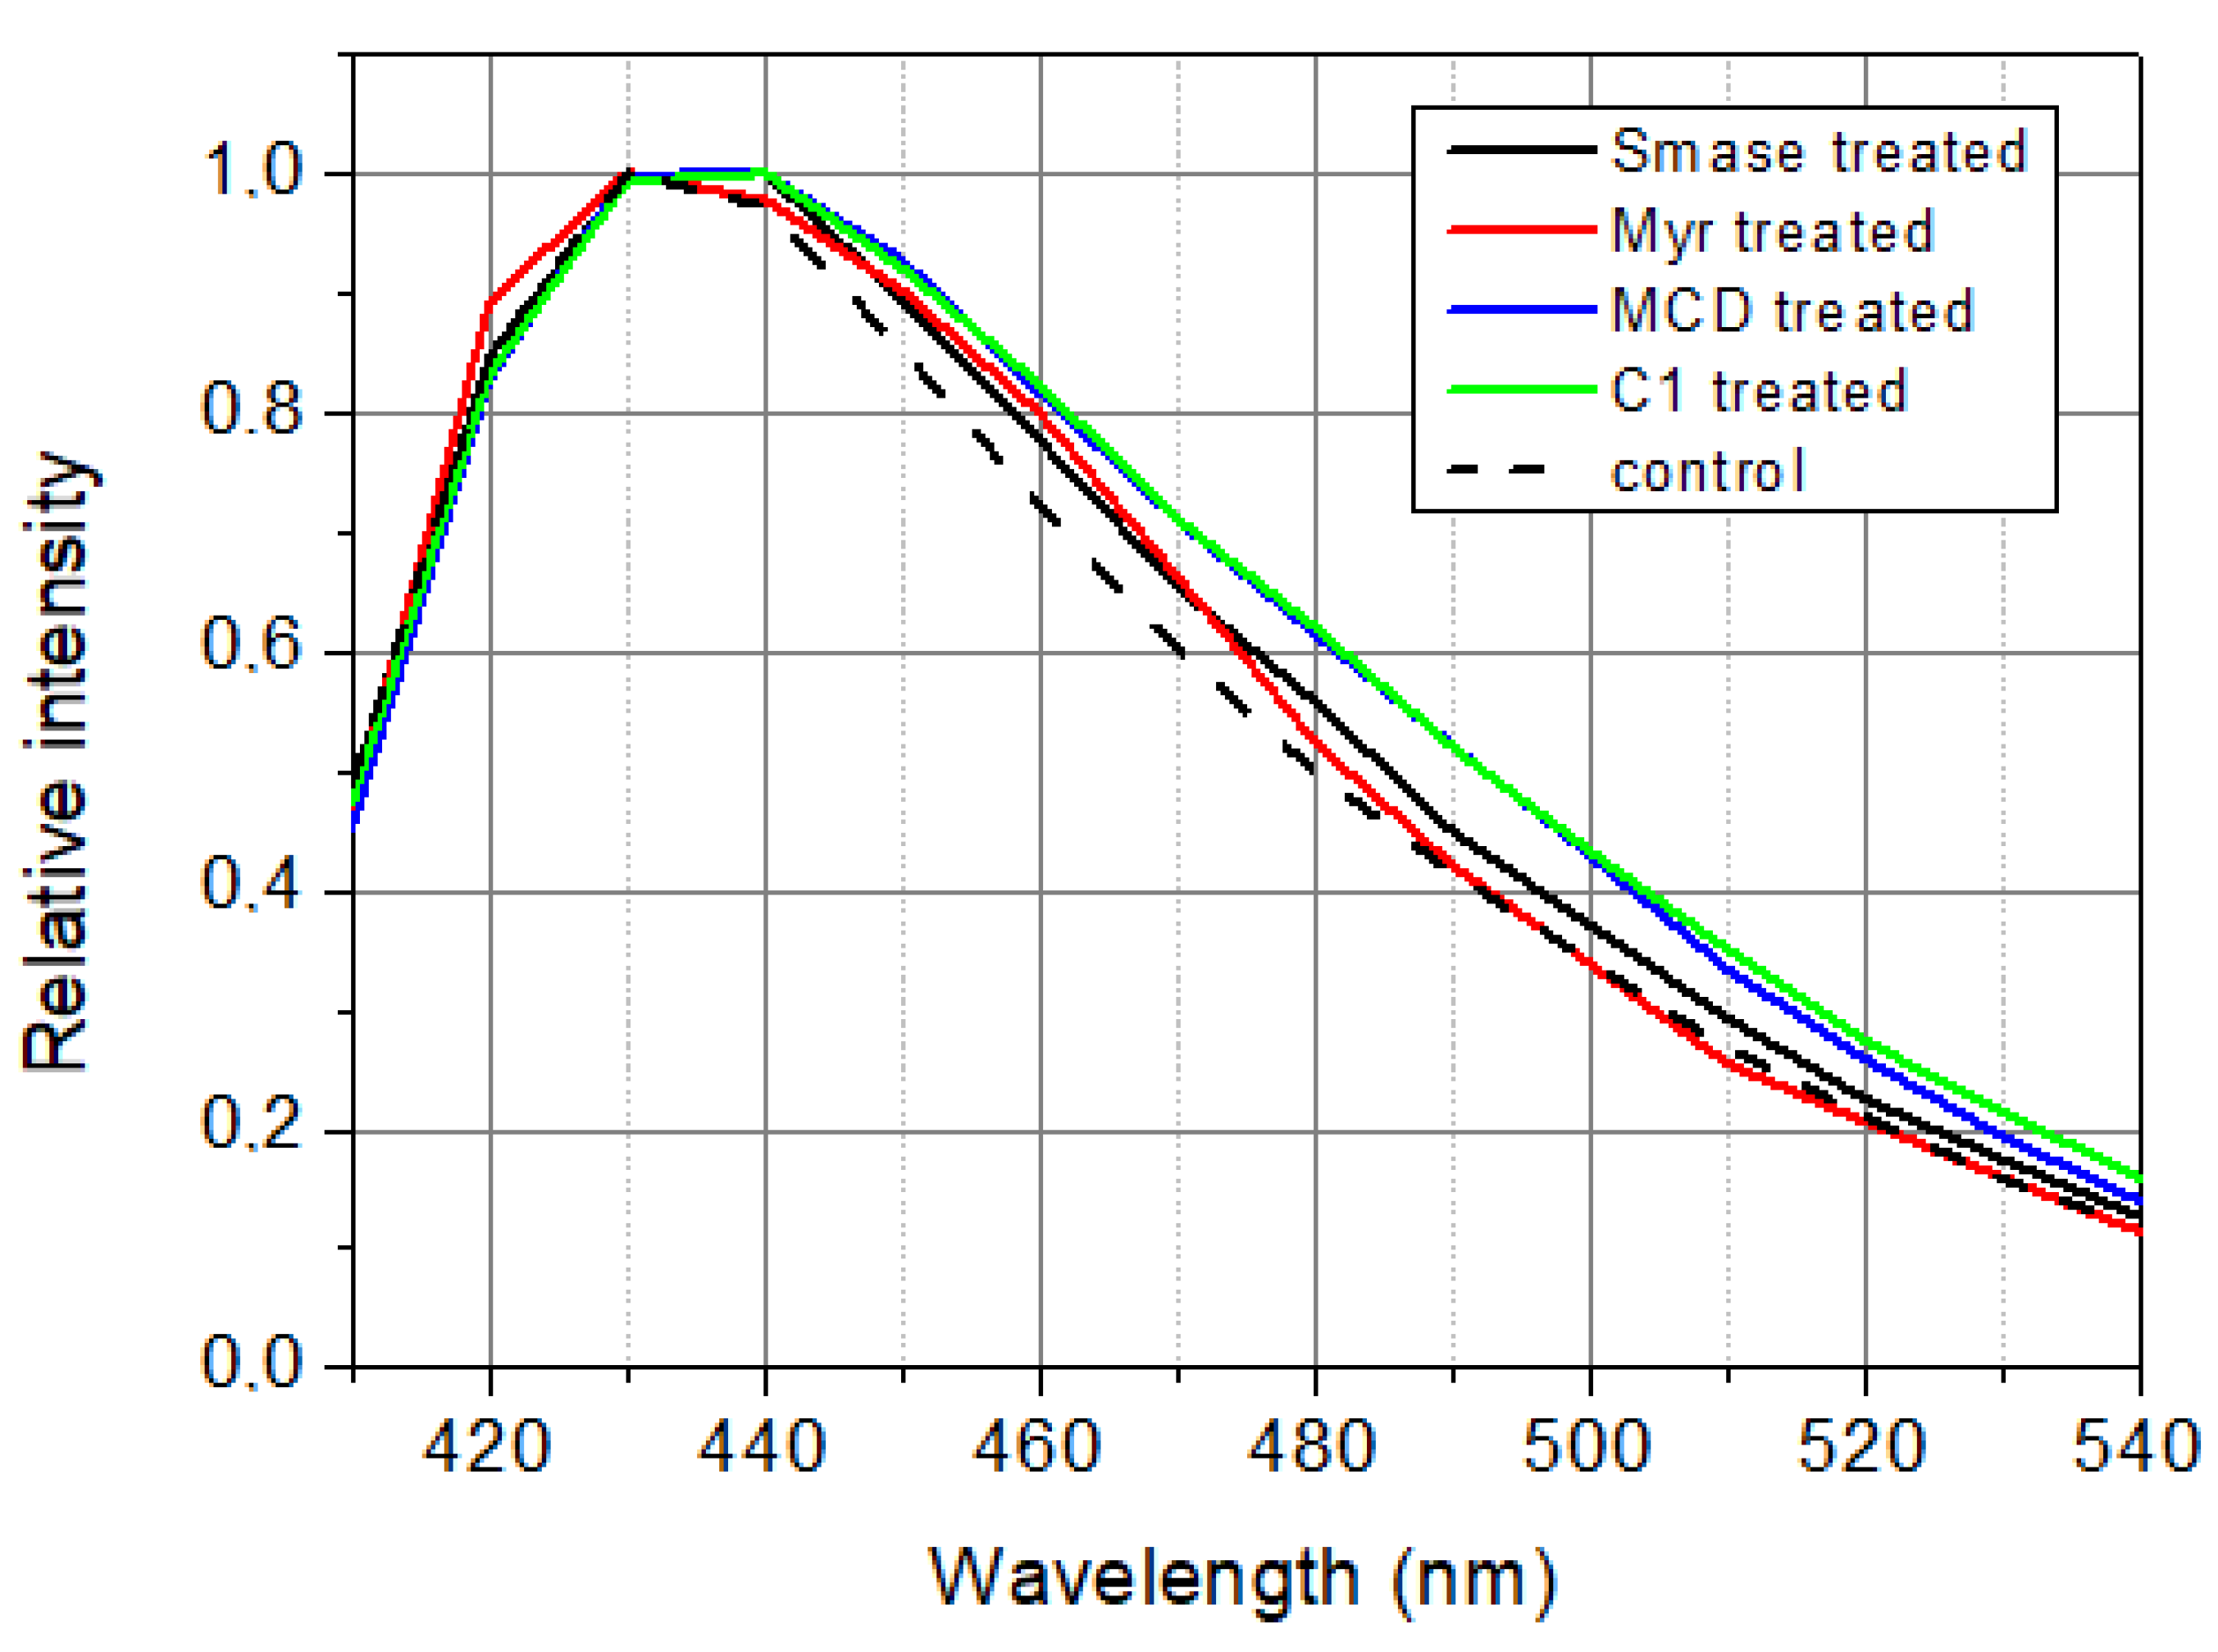
Samples studied were used in fluorescence measurements for not more than three hours after preparation because of the degradation of cells. Under this time window, both treated and control samples had to be measured. It means that there was time only for time-resolved measurements but not for steady-state measurements. That is why steady-state spectra (Figure 6) have been calculated from lifetime and pre-exponential decay parameters as time integral of the decay at a certain wavelength:
where an and τn are the pre-exponential and the lifetime for the n-th decay component.
5. Conclusions
Based on our previous fluorescent spectroscopy result [17,18,22] and the current data, we conclude that treatment with lipid raft disruptors—SMase, Myr, MCD, C1—can modify membrane fluidity and stiffness and therefore, this effect can lead to modification of different membrane and membrane-related protein functions, such as the inhibition of TRPV1 and TRPA1 activation.
Author Contributions
Conceptualization É.S. and J.E.; methodology Á.H. and J.E.; formal analysis J.E.; investigation Á.H. and J.E.; resources É.S. and Á.H.; writing—original draft preparation Á.H. and J.E.; writing—review and editing É.S.; visualization Á.H. and J.E.; supervision É.S.; project administration Á.H.; funding acquisition É.S. and Á.H. All authors have read and agreed to the published version of the manuscript.
Funding
This work was supported by the National Brain Research Program 2021-1.2.1.-NKP-2021-00002. Project no. TKP2021-EGA-16, TKP2021-EGA-17 and TKP2021-EGA-13 have been implemented with the support provided by the National Research, Development, and Innovation Fund of Hungary, financed under the EGA 16, EGA 17, and EGA 13 funding scheme. É. Szőke was supported by PTE-ÁOK-KA-2021-09, NKFIH-138936. Á. Horváth was supported by the Gedeon Richter Talentum Foundation. This work was SUPPORTED BY THE ÚNKP-21-3-II New National Excellence Program of the Ministry for Innovation and Technology from the source of the National Research, Development, and Innovation Fund. This project was supported by National Research, Development, and Innovation Office (PharmaLab, RRF-2.3.1-21-2022-00015).
Institutional Review Board Statement
Not applicable.
Informed Consent Statement
Not applicable.
Data Availability Statement
The original data presented in the study are included in the article. Further inquiries can be directed to the corresponding author.
Acknowledgments
The authors thank Rita Skoda-Földes and Dávid Ispán for the synthesis of the C1 compound and also thank Cecília Disztl for expert technical assistance. The fluorescence spectroscopy measurements were performed at the Fluorescence Spectroscopy Laboratory of Histology and Light Microscopy core facility of the János Szentágothai Research Centre and Centre for Neuroscience.
Conflicts of Interest
The authors declare no conflict of interest.
Abbreviations
| AMPA | 2-amino-3-(5-methyl-3-oxo-1,2-oxazol-4-yl)propanoic-acid |
| C1 | carboxamido-steroid compound |
| CHO | Chinese Hamster Ovary |
| CT | charge transfer |
| DMSO | dimethyl sulfoxide |
| DOPC | 1,2-dioleoyl-sn-glycero-3-phosphocholine |
| DPPC | Dipalmitoylphosphatidylcholine |
| ECS | extracellular solution |
| GABA | Gamma-aminobutyric-acid |
| GP | generalized polarization |
| GUV | giant unilamellar vesicles |
| LAURDAN | 6-dodecanoyl-N,N-dimethyl-naphthylamine |
| LE | locally excited |
| LUV | large unilamellar vesicles |
| MCD | methyl-beta-cyclodextrin |
| Myr | myriocin |
| PBS | phosphate-buffered saline |
| POPC | 2-Oleoyl-1-palmitoyl-sn-glycero-3-phosphocholine |
| SMase | sphingomyelinase |
| TEM | Time Emission Matrix |
| TRANES | Time-Resolved Are-Normalized Spectra |
| TRP | Transient Receptor Potential |
| TRPA1 | Transient Receptor Potential Ankyrin 1 |
| TRPV1 | Transient Receptor Potential Vanilloid 1 |
| τrot | rotational correlation time |
| τCoG | characteristic time of Center of Gravity |
References
- Karnovsky, M.J.; Kleinfeld, A.M.; Hoover, R.L.; Klausner, R.D. The Concept of Lipid Domains in Membranes. J. Cell Biol. 1982, 94, 1–6. [Google Scholar] [CrossRef] [PubMed]
- Simons, K.; Ikonen, E. Functional Rafts in Cell Membranes. Nature 1997, 387, 569–572. [Google Scholar] [CrossRef] [PubMed]
- Kobayashi, T.; Takahashi, M.; Nagatsuka, Y.; Hirabayashi, Y. Lipid Rafts: New Tools and a New Component. Biol. Pharm. Bull. 2006, 29, 1526–1531. [Google Scholar] [CrossRef] [PubMed] [Green Version]
- Kannan, K.B.; Barlos, D.; Hauser, C.J. Free Cholesterol Alters Lipid Raft Structure and Function Regulating Neutrophil Ca 2+ Entry and Respiratory Burst: Correlations with Calcium Channel Raft Trafficking. J. Immunol. 2007, 178, 5253–5261. [Google Scholar] [CrossRef] [PubMed] [Green Version]
- Parton, R.G.; Richards, A.A. Lipid Rafts and Caveolae as Portals for Endocytosis: New Insights and Common Mechanisms: Caveolae/Lipid Raft-Dependent Endocytosis. Traffic 2003, 4, 724–738. [Google Scholar] [CrossRef] [PubMed] [Green Version]
- Sonnino, S.; Aureli, M.; Grassi, S.; Mauri, L.; Prioni, S.; Prinetti, A. Lipid Rafts in Neurodegeneration and Neuroprotection. Mol. Neurobiol. 2014, 50, 130–148. [Google Scholar] [CrossRef] [PubMed]
- Sezgin, E.; Levental, I.; Mayor, S.; Eggeling, C. The Mystery of Membrane Organization: Composition, Regulation and Roles of Lipid Rafts. Nat. Rev. Mol. Cell Biol. 2017, 18, 361–374. [Google Scholar] [CrossRef] [Green Version]
- Staubach, S.; Razawi, H.; Hanisch, F.-G. Proteomics of MUC1-Containing Lipid Rafts from Plasma Membranes and Exosomes of Human Breast Carcinoma Cells MCF-7. Proteomics 2009, 9, 2820–2835. [Google Scholar] [CrossRef]
- Larsen, J.B.; Jensen, M.B.; Bhatia, V.K.; Pedersen, S.L.; Bjørnholm, T.; Iversen, L.; Uline, M.; Szleifer, I.; Jensen, K.J.; Hatzakis, N.S.; et al. Membrane Curvature Enables N-Ras Lipid Anchor Sorting to Liquid-Ordered Membrane Phases. Nat. Chem. Biol. 2015, 11, 192–194. [Google Scholar] [CrossRef]
- Cuesta-Marbán, Á.; Botet, J.; Czyz, O.; Cacharro, L.M.; Gajate, C.; Hornillos, V.; Delgado, J.; Zhang, H.; Amat-Guerri, F.; Acuña, A.U.; et al. Drug Uptake, Lipid Rafts, and Vesicle Trafficking Modulate Resistance to an Anticancer Lysophosphatidylcholine Analogue in Yeast. J. Biol. Chem. 2013, 288, 8405–8418. [Google Scholar] [CrossRef]
- Hering, H.; Lin, C.-C.; Sheng, M. Lipid Rafts in the Maintenance of Synapses, Dendritic Spines, and Surface AMPA Receptor Stability. J. Neurosci. 2003, 23, 3262–3271. [Google Scholar] [CrossRef] [PubMed] [Green Version]
- Guirland, C.; Suzuki, S.; Kojima, M.; Lu, B.; Zheng, J.Q. Lipid Rafts Mediate Chemotropic Guidance of Nerve Growth Cones. Neuron 2004, 42, 51–62. [Google Scholar] [CrossRef] [Green Version]
- Zhu, D. Lipid Rafts Serve as a Signaling Platform for Nicotinic Acetylcholine Receptor Clustering. J. Neurosci. 2006, 26, 4841–4851. [Google Scholar] [CrossRef] [Green Version]
- Liu, B.; Hui, K.; Qin, F. Thermodynamics of Heat Activation of Single Capsaicin Ion Channels VR1. Biophys. J. 2003, 85, 2988–3006. [Google Scholar] [CrossRef] [Green Version]
- Liu, M.; Huang, W.; Wu, D.; Priestley, J.V. TRPV1, but Not P2X 3, Requires Cholesterol for Its Function and Membrane Expression in Rat Nociceptors. Eur. J. Neurosci. 2006, 24, 1–6. [Google Scholar] [CrossRef]
- Szőke, É.; Börzsei, R.; Tóth, D.M.; Lengl, O.; Helyes, Z.; Sándor, Z.; Szolcsányi, J. Effect of Lipid Raft Disruption on TRPV1 Receptor Activation of Trigeminal Sensory Neurons and Transfected Cell Line. Eur. J. Pharmacol. 2010, 628, 67–74. [Google Scholar] [CrossRef]
- Sághy, É.; Szőke, É.; Payrits, M.; Helyes, Z.; Börzsei, R.; Erostyák, J.; Jánosi, T.Z.; Sétáló Jr, G.; Szolcsányi, J. Evidence for the Role of Lipid Rafts and Sphingomyelin in Ca2+-Gating of Transient Receptor Potential Channels in Trigeminal Sensory Neurons and Peripheral Nerve Terminals. Pharmacol. Res. 2015, 100, 101–116. [Google Scholar] [CrossRef]
- Sághy, É.; Payrits, M.; Bíró-Sütő, T.; Skoda-Földes, R.; Szánti-Pintér, E.; Erostyák, J.; Makkai, G.; Sétáló, G.; Kollár, L.; Kőszegi, T.; et al. Carboxamido Steroids Inhibit the Opening Properties of Transient Receptor Potential Ion Channels by Lipid Raft Modulation. J. Lipid Res. 2018, 59, 1851–1863. [Google Scholar] [CrossRef] [Green Version]
- Ilangumaran, S.; Hoessli, D.C. Effects of Cholesterol Depletion by Cyclodextrin on the Sphingolipid Microdomains of the Plasma Membrane. Biochem. J. 1998, 335, 433–440. [Google Scholar] [CrossRef]
- Chao, L.; Chen, F.; Jensen, K.F.; Hatton, T.A. Two-Dimensional Solvent-Mediated Phase Transformation in Lipid Membranes Induced by Sphingomyelinase. Langmuir 2011, 27, 10050–10060. [Google Scholar] [CrossRef]
- Miyake, Y.; Kozutsumi, Y.; Nakamura, S.; Fujita, T.; Kawasaki, T. Serine Palmitoyltransferase Is the Primary Target of a Sphingosine-like Immunosuppressant, ISP-1/Myriocin. Biochem. Biophys. Res. Commun. 1995, 211, 396–403. [Google Scholar] [CrossRef] [PubMed]
- Horváth, Á.; Payrits, M.; Steib, A.; Kántás, B.; Biró-Süt, T.; Erostyák, J.; Makkai, G.; Sághy, É.; Helyes, Z.; Szőke, É. Analgesic Effects of Lipid Raft Disruption by Sphingomyelinase and Myriocin via Transient Receptor Potential Vanilloid 1 and Transient Receptor Potential Ankyrin 1 Ion Channel Modulation. Front. Pharmacol. 2021, 11, 593319. [Google Scholar] [CrossRef] [PubMed]
- Gaus, K.; Gratton, E.; Kable, E.P.W.; Jones, A.S.; Gelissen, I.; Kritharides, L.; Jessup, W. Visualizing Lipid Structure and Raft Domains in Living Cells with Two-Photon Microscopy. Proc. Natl. Acad. Sci. USA 2003, 100, 15554–15559. [Google Scholar] [CrossRef] [PubMed] [Green Version]
- Harris, F.M.; Best, K.B.; Bell, J.D. Use of Laurdan Fluorescence Intensity and Polarization to Distinguish between Changes in Membrane Fluidity and Phospholipid Order. Biochim. Et Biophys. Acta (BBA)—Biomembr. 2002, 1565, 123–128. [Google Scholar] [CrossRef] [Green Version]
- Urbančič, I.; Brun, J.; Shrestha, D.; Waithe, D.; Eggeling, C.; Chojnacki, J. Lipid Composition but Not Curvature Is a Determinant of a Low Molecular Mobility within HIV-1 Lipid Envelope. bioRxiv 2018, 315168. [Google Scholar]
- Startek, J.B.; Talavera, K.; Voets, T.; Alpizar, Y.A. Differential Interactions of Bacterial Lipopolysaccharides with Lipid Membranes: Implications for TRPA1-Mediated Chemosensation. Sci. Rep. 2018, 8, 12010. [Google Scholar] [CrossRef] [Green Version]
- Sezgin, E.; Waithe, D.; Bernardino de la Serna, J.; Eggeling, C. Spectral Imaging to Measure Heterogeneity in Membrane Lipid Packing. ChemPhysChem 2015, 16, 1387–1394. [Google Scholar] [CrossRef] [Green Version]
- Parasassi, T.; Krasnowska, E.K.; Bagatolli, L.; Gratton, E. LAURDAN and PRODAN as Polarity-Sensitive Fluorescent Membrane Probes. J. Fluoresc. 1998, 8, 365–373. [Google Scholar] [CrossRef]
- Parasassi, T.; Conti, F.; Gratton, E. Time-Resolved Fluorescence Emission Spectra of Laurdan in Phospholipid Vesicles by Multifrequency Phase and Modulation Fluorometry. Cell Mol. Biol. 1986, 32, 103–108. [Google Scholar]
- Jay, A.G.; Hamilton, J.A. Disorder Amidst Membrane Order: Standardizing Laurdan Generalized Polarization and Membrane Fluidity Terms. J. Fluoresc. 2017, 27, 243–249. [Google Scholar] [CrossRef]
- Balogh, G.; Maulucci, G.; Gombos, I.; Horváth, I.; Török, Z.; Péter, M.; Fodor, E.; Páli, T.; Benkő, S.; Parasassi, T.; et al. Heat Stress Causes Spatially-Distinct Membrane Re-Modelling in K562 Leukemia Cells. PLoS ONE 2011, 6, e21182. [Google Scholar] [CrossRef] [Green Version]
- Barrantes, F.J. Fluorescence Sensors for Imaging Membrane Lipid Domains and Cholesterol. In Current Topics in Membranes; Elsevier: Amsterdam, The Netherlands, 2021; Volume 88, pp. 257–314. ISBN 978-0-323-91114-6. [Google Scholar]
- Golfetto, O.; Hinde, E.; Gratton, E. Laurdan Fluorescence Lifetime Discriminates Cholesterol Content from Changes in Fluidity in Living Cell Membranes. Biophys. J. 2013, 104, 1238–1247. [Google Scholar] [CrossRef]
- Sanchez, S.A.; Tricerri, M.A.; Gratton, E. Laurdan Generalized Polarization Fluctuations Measures Membrane Packing Micro-Heterogeneity in Vivo. Proc. Natl. Acad. Sci. USA 2012, 109, 7314–7319. [Google Scholar] [CrossRef] [Green Version]
- Steinmark, I.E.; Chung, P.; Ziolek, R.M.; Cornell, B.; Smith, P.; Levitt, J.A.; Tregidgo, C.; Molteni, C.; Yahioglu, G.; Lorenz, C.D.; et al. Time-Resolved Fluorescence Anisotropy of a Molecular Rotor Resolves Microscopic Viscosity Parameters in Complex Environments. Small 2020, 16, 1907139. [Google Scholar] [CrossRef]
- Ma, Y.; Benda, A.; Kwiatek, J.; Owen, D.M.; Gaus, K. Time-Resolved Laurdan Fluorescence Reveals Insights into Membrane Viscosity and Hydration Levels. Biophys. J. 2018, 115, 1498–1508. [Google Scholar] [CrossRef] [Green Version]
- Weber, P.; Wagner, M.; Schneckenburger, H. Fluorescence Imaging of Membrane Dynamics in Living Cells. J. Biomed. Opt. 2010, 15, 046017. [Google Scholar] [CrossRef] [Green Version]
- Startek, J.B.; Boonen, B.; López-Requena, A.; Talavera, A.; Alpizar, Y.A.; Ghosh, D.; Van Ranst, N.; Nilius, B.; Voets, T.; Talavera, K. Mouse TRPA1 Function and Membrane Localization Are Modulated by Direct Interactions with Cholesterol. eLife 2019, 8, e46084. [Google Scholar] [CrossRef]
- Monasterio, B.G.; Jiménez-Rojo, N.; García-Arribas, A.B.; Riezman, H.; Goñi, F.M.; Alonso, A. CHO/LY-B Cell Growth under Limiting Sphingolipid Supply: Correlation between Lipid Composition and Biophysical Properties of Sphingolipid-restricted Cell Membranes. FASEB J. 2021, 35, e21657. [Google Scholar] [CrossRef]
- Monasterio, B.G.; Jiménez-Rojo, N.; García-Arribas, A.B.; Riezman, H.; Goñi, F.M.; Alonso, A. Plasma Membrane Effects of Sphingolipid-Synthesis Inhibition by Myriocin in CHO Cells: A Biophysical and Lipidomic Study. Sci. Rep. 2022, 12, 955. [Google Scholar] [CrossRef]
- Merrill, A.H.; Schmelz, E.-M.; Dillehay, D.L.; Spiegel, S.; Shayman, J.A.; Schroeder, J.J.; Riley, R.T.; Voss, K.A.; Wang, E. Sphingolipids—The Enigmatic Lipid Class: Biochemistry, Physiology, and Pathophysiology. Toxicol. Appl. Pharmacol. 1997, 142, 208–225. [Google Scholar] [CrossRef] [PubMed]
- Jiang, X.-C.; Li, Z.; Yazdanyar, A. Sphingolipids and HDL Metabolism. In The HDL Handbook; Elsevier: Amsterdam, The Netherlands, 2014; pp. 133–158. ISBN 978-0-12-407867-3. [Google Scholar]
- Merrill, A.H. De Novo Sphingolipid Biosynthesis: A Necessary, but Dangerous, Pathway. J. Biol. Chem. 2002, 277, 25843–25846. [Google Scholar] [CrossRef] [PubMed]
- Lakowicz, J.R. Principles of Fluorescence Spectroscopy, 3rd ed.; Springer: New York, NY, USA, 2006; ISBN 978-0-387-31278-1. [Google Scholar]
Figure 1.
LAURDAN emission decays at 420 nm (violet), 460 nm (blue), and 530 nm (green). LAURDAN in cell suspension, treated with Smase. λex = 369 nm.
Figure 1.
LAURDAN emission decays at 420 nm (violet), 460 nm (blue), and 530 nm (green). LAURDAN in cell suspension, treated with Smase. λex = 369 nm.

Figure 2.
CoG function of LAURDAN. Black line is the CoG function of LAURDAN and red dashed line is a mono-exponential fit giving excellent cover with the measured CoG function.
Figure 2.
CoG function of LAURDAN. Black line is the CoG function of LAURDAN and red dashed line is a mono-exponential fit giving excellent cover with the measured CoG function.

Figure 3.
TRANES of LAURDAN. (A), Laurdan in cell suspension; (B), Laurdan in non-cell solution. λex = 369 nm.
Figure 3.
TRANES of LAURDAN. (A), Laurdan in cell suspension; (B), Laurdan in non-cell solution. λex = 369 nm.

Figure 4.
Anisotropy decay of LAURDAN. λ = 450 nm. Black—Anisotropy data. Red—1-exponential fit.

Figure 5.
Structure of C1 compound and cholesterol.

Figure 6.
Calculated steady-state spectra of LAURDAN. λex = 369 nm.


Table 1.
τCoG values determining the rate of change of CoG in control and treated samples. Errors are the intrinsic measurement errors.
Table 1.
τCoG values determining the rate of change of CoG in control and treated samples. Errors are the intrinsic measurement errors.
| Sample Name | Control τCoG (ns) | Treated τCoG (ns) | Direction of Change |
|---|---|---|---|
| 30 mU SMase | 3.93 ± 0.12 | 4.17 ± 0.13 | Increase |
| 100 nM Myr | 3.32 ± 0.10 | 3.53 ± 0.11 | Increase |
| 10 mM MCD | 3.37 ± 0.10 | 3.07 ± 0.09 | Decrease |
| 100 µM C1 | 4.64 ± 0.14 | 5.45 ± 0.16 | Increase |
Table 2.
GP values in control (non-treated) and treated samples. Errors are the intrinsic measurement errors.
Table 2.
GP values in control (non-treated) and treated samples. Errors are the intrinsic measurement errors.
| Sample Name | Control GP | Treated GP | Direction of Change |
|---|---|---|---|
| 30 mU SMase | 0.49 ± 0.01 | 0.46 ± 0.01 | more Disordered |
| 100 nM Myr | 0.46 ± 0.01 | 0.49 ± 0.01 | more Ordered |
| 10 mM MCD | 0.45 ± 0.01 | 0.40 ± 0.01 | more Disordered |
| 100 µM C1 | 0.54 ± 0.02 | 0.39 ± 0.01 | more Disordered |
Table 3.
τrot values in control and treated samples. Errors are the intrinsic measurement errors.
| Sample Name | Control τrot (ns) | Treated τrot (ns) | Direction of Change |
|---|---|---|---|
| 30 mU SMase | 1.60 ± 0.05 | 1.40 ± 0.04 | Faster |
| 100 nM Myr | 1.45 ± 0.04 | 1.69 ± 0.05 | Slower |
| 10 mM MCD | 1.60 ± 0.05 | 1.55 ± 0.05 | Faster |
| 100 µM C1 | 1.71 ± 0.05 | 1.56 ± 0.05 | Faster |
Publisher’s Note: MDPI stays neutral with regard to jurisdictional claims in published maps and institutional affiliations. |
© 2022 by the authors. Licensee MDPI, Basel, Switzerland. This article is an open access article distributed under the terms and conditions of the Creative Commons Attribution (CC BY) license (https://creativecommons.org/licenses/by/4.0/).
Share and Cite
MDPI and ACS Style
Horváth, Á.; Erostyák, J.; Szőke, É. Effect of Lipid Raft Disruptors on Cell Membrane Fluidity Studied by Fluorescence Spectroscopy. Int. J. Mol. Sci. 2022, 23, 13729. https://doi.org/10.3390/ijms232213729
AMA Style
Horváth Á, Erostyák J, Szőke É. Effect of Lipid Raft Disruptors on Cell Membrane Fluidity Studied by Fluorescence Spectroscopy. International Journal of Molecular Sciences. 2022; 23(22):13729. https://doi.org/10.3390/ijms232213729
Chicago/Turabian StyleHorváth, Ádám, János Erostyák, and Éva Szőke. 2022. "Effect of Lipid Raft Disruptors on Cell Membrane Fluidity Studied by Fluorescence Spectroscopy" International Journal of Molecular Sciences 23, no. 22: 13729. https://doi.org/10.3390/ijms232213729
Note that from the first issue of 2016, this journal uses article numbers instead of page numbers. See further details here.