
Transcriptional Responses of Copper-Transport-Related Genes ctr1, ctr2 and atox1 and Their Roles in the Regulation of Cu Homeostasis in Yellow Catfish Pelteobagrus fulvidraco
 , and
, and 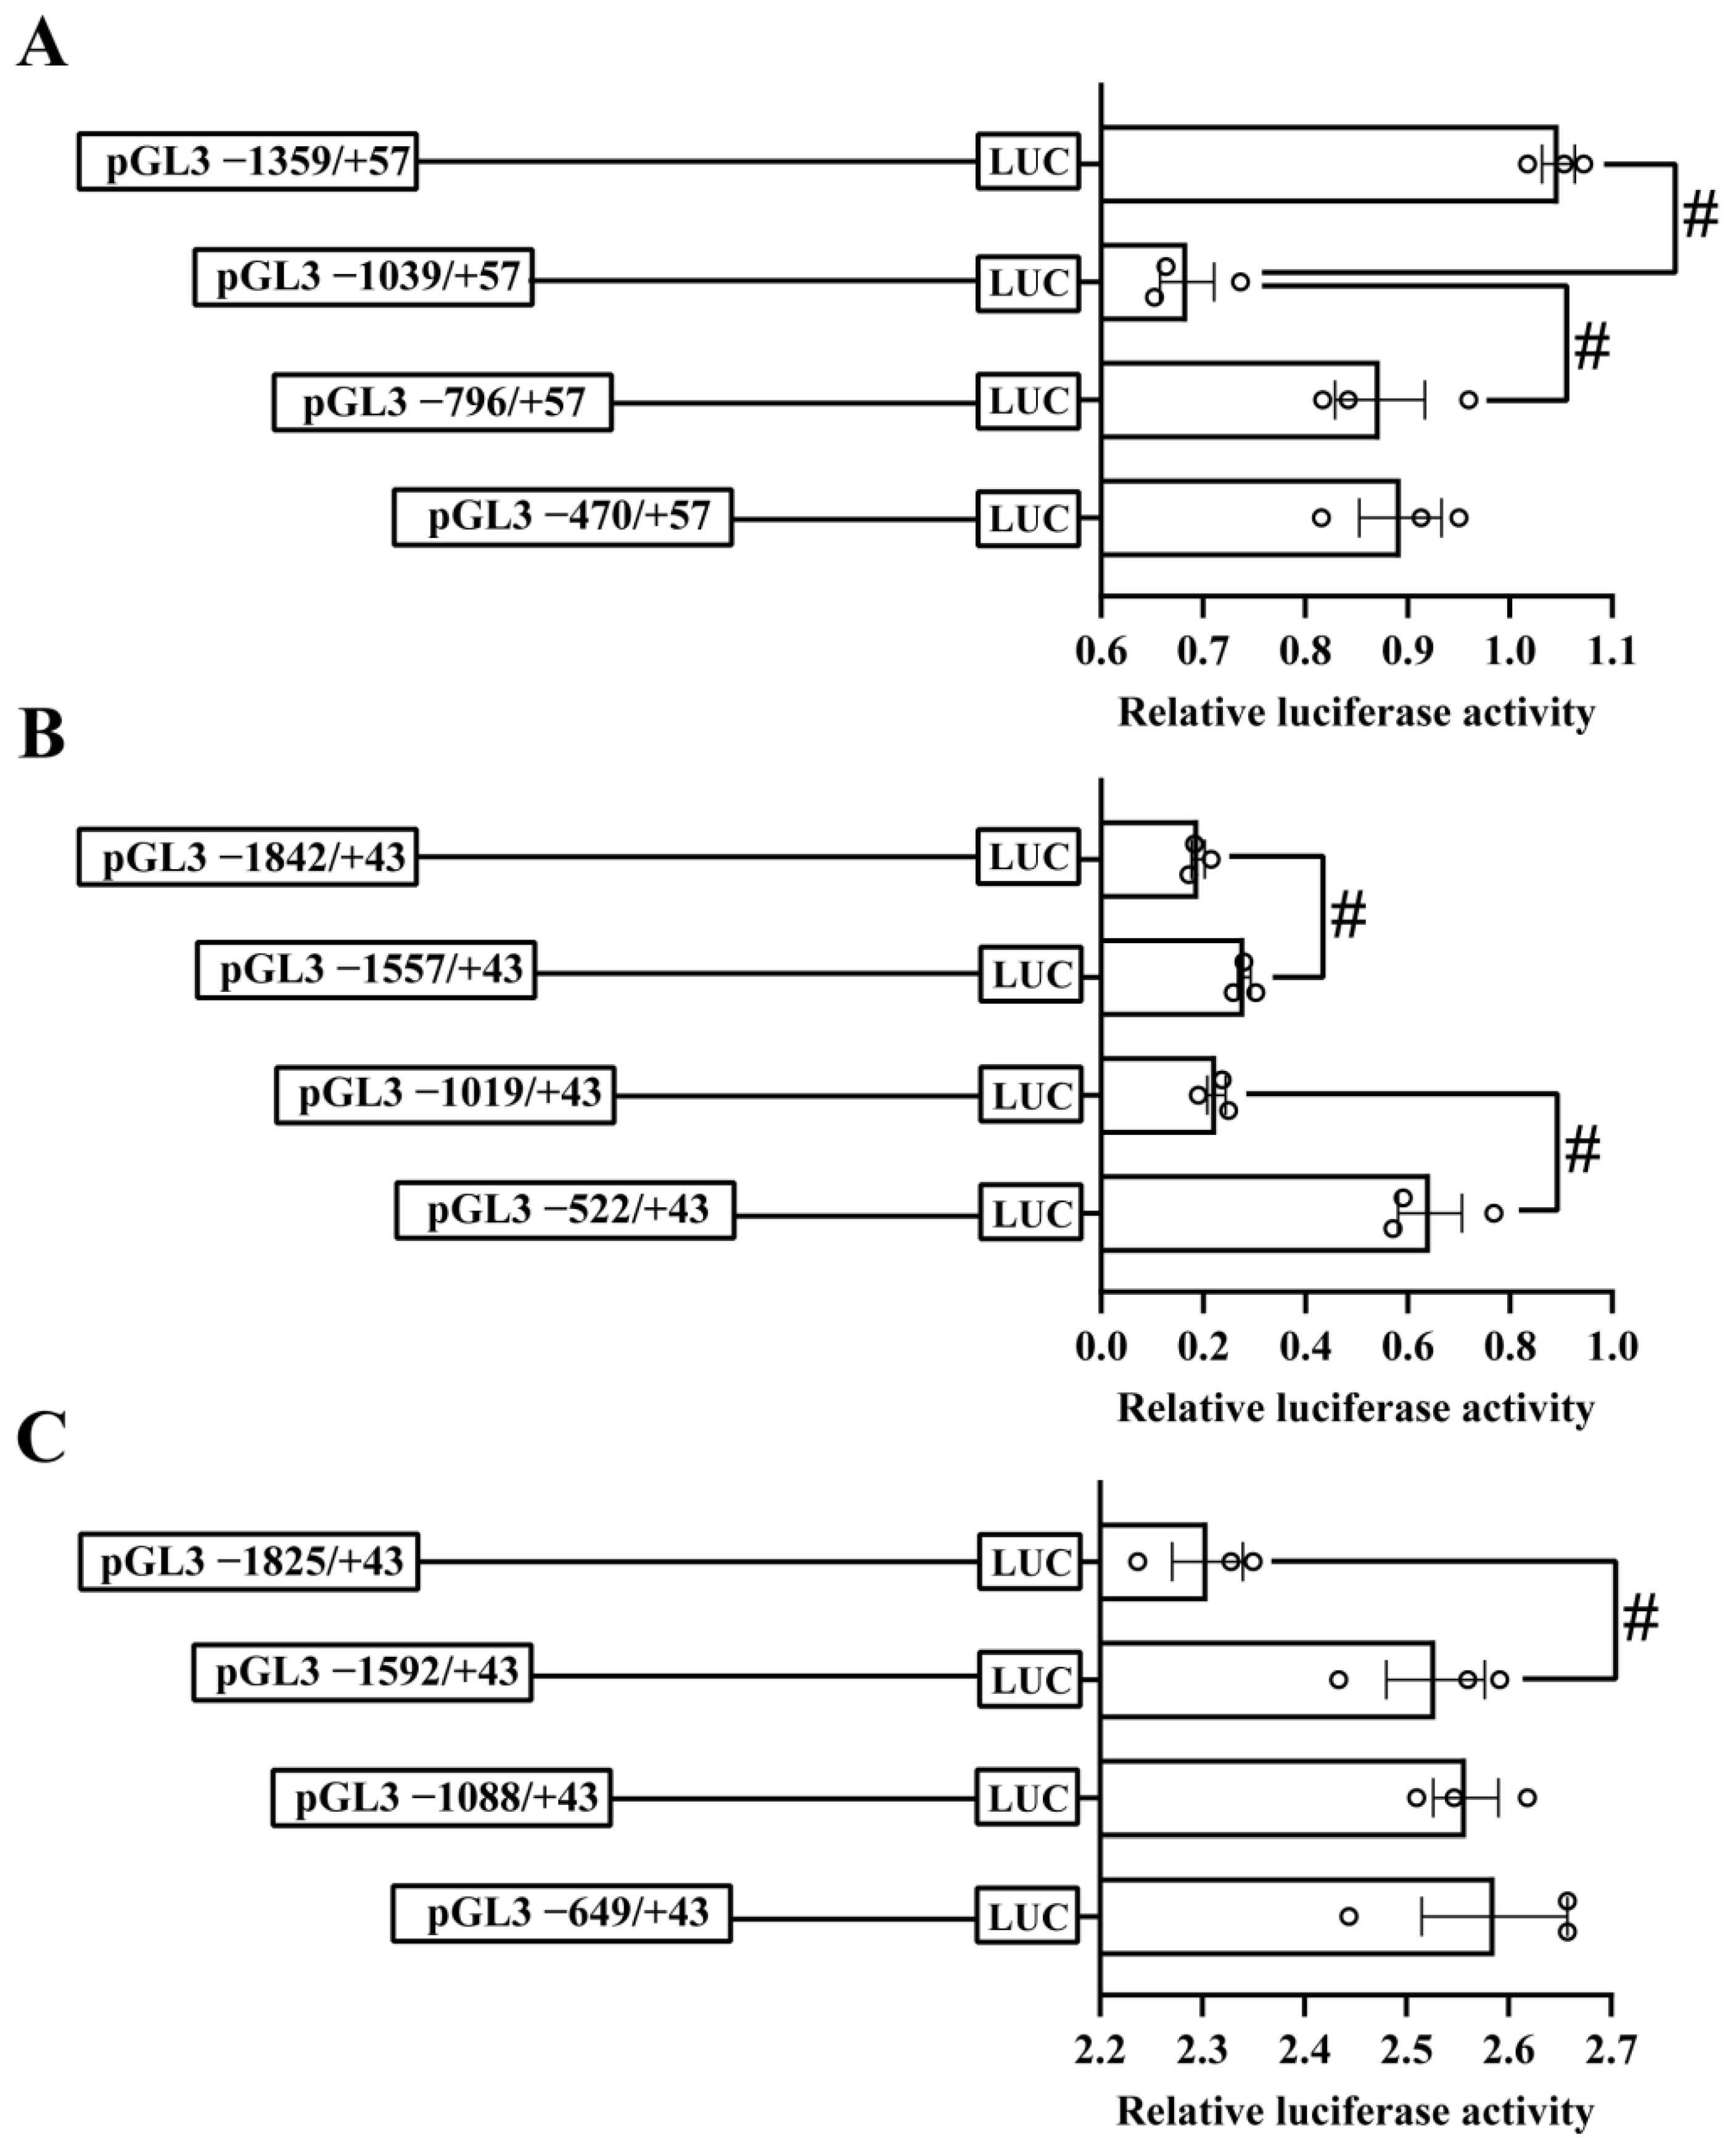
Abstract
:1. Introduction
2. Results
2.1. Sequence Analysis of the ctr1, ctr2 and atox1 Promoters
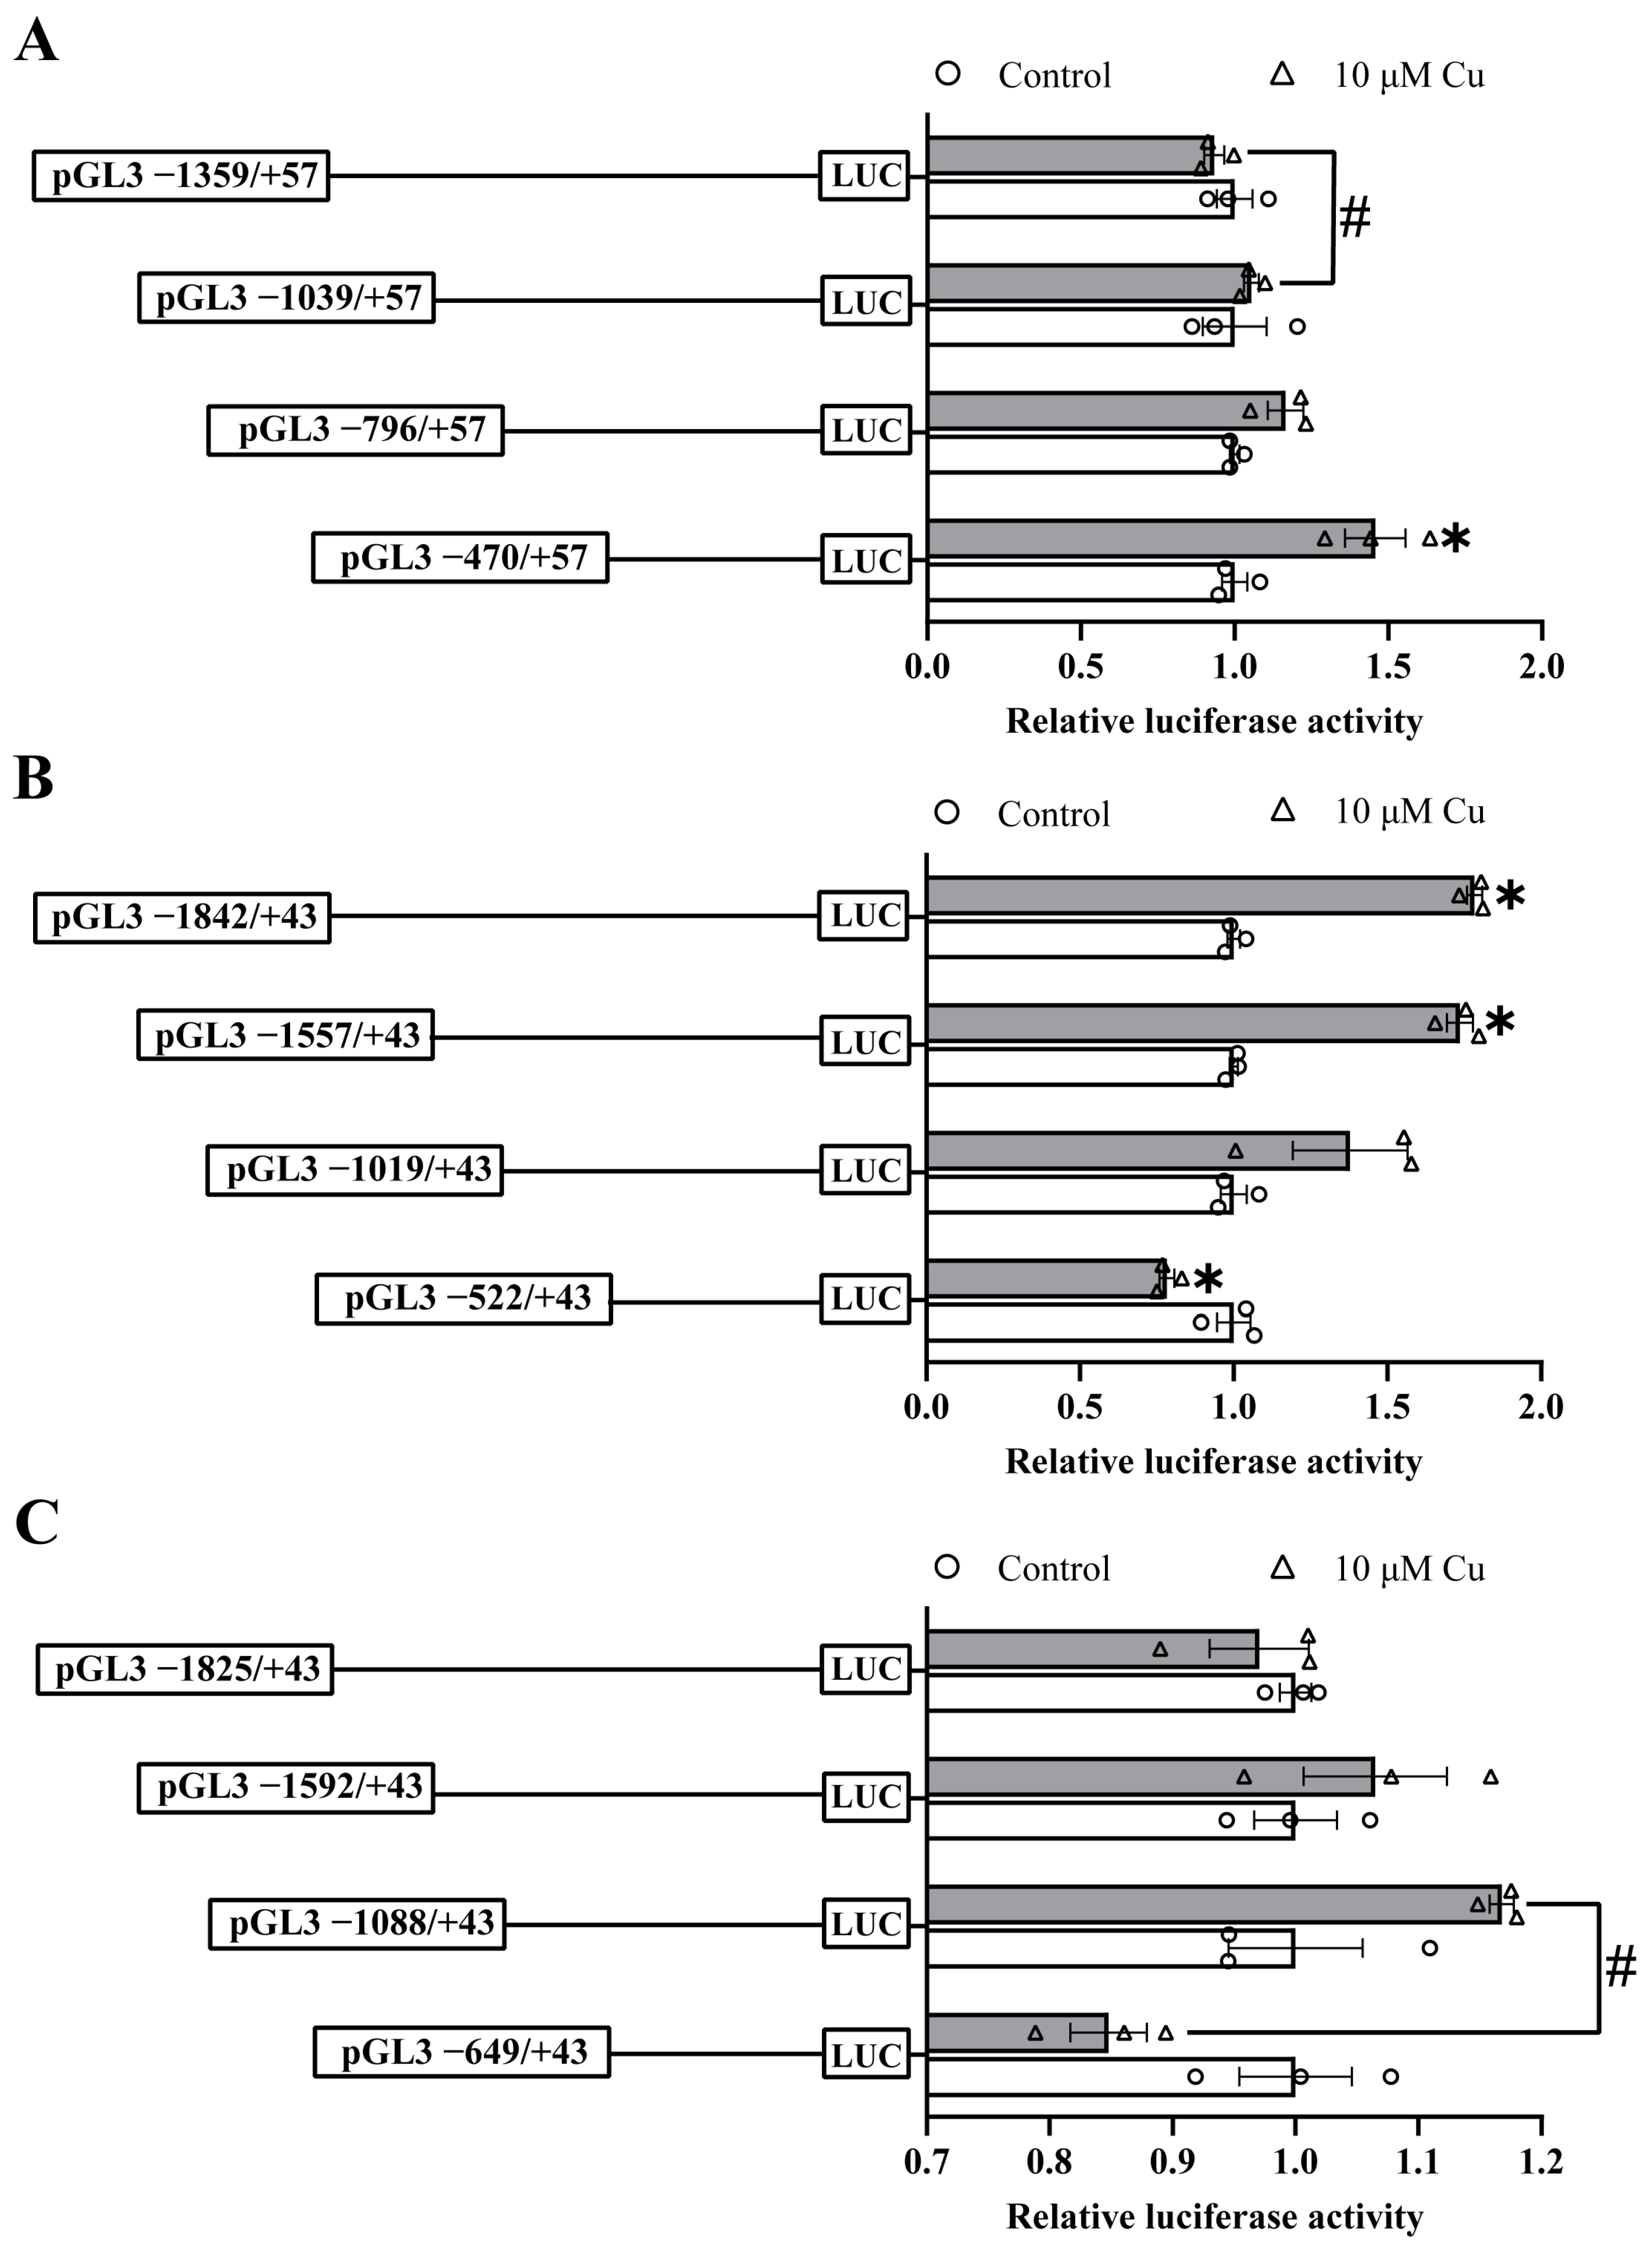
2.2. Analysis of the 5′-Sequence Deletion of the ctr1, ctr2 and atox1 Promoters
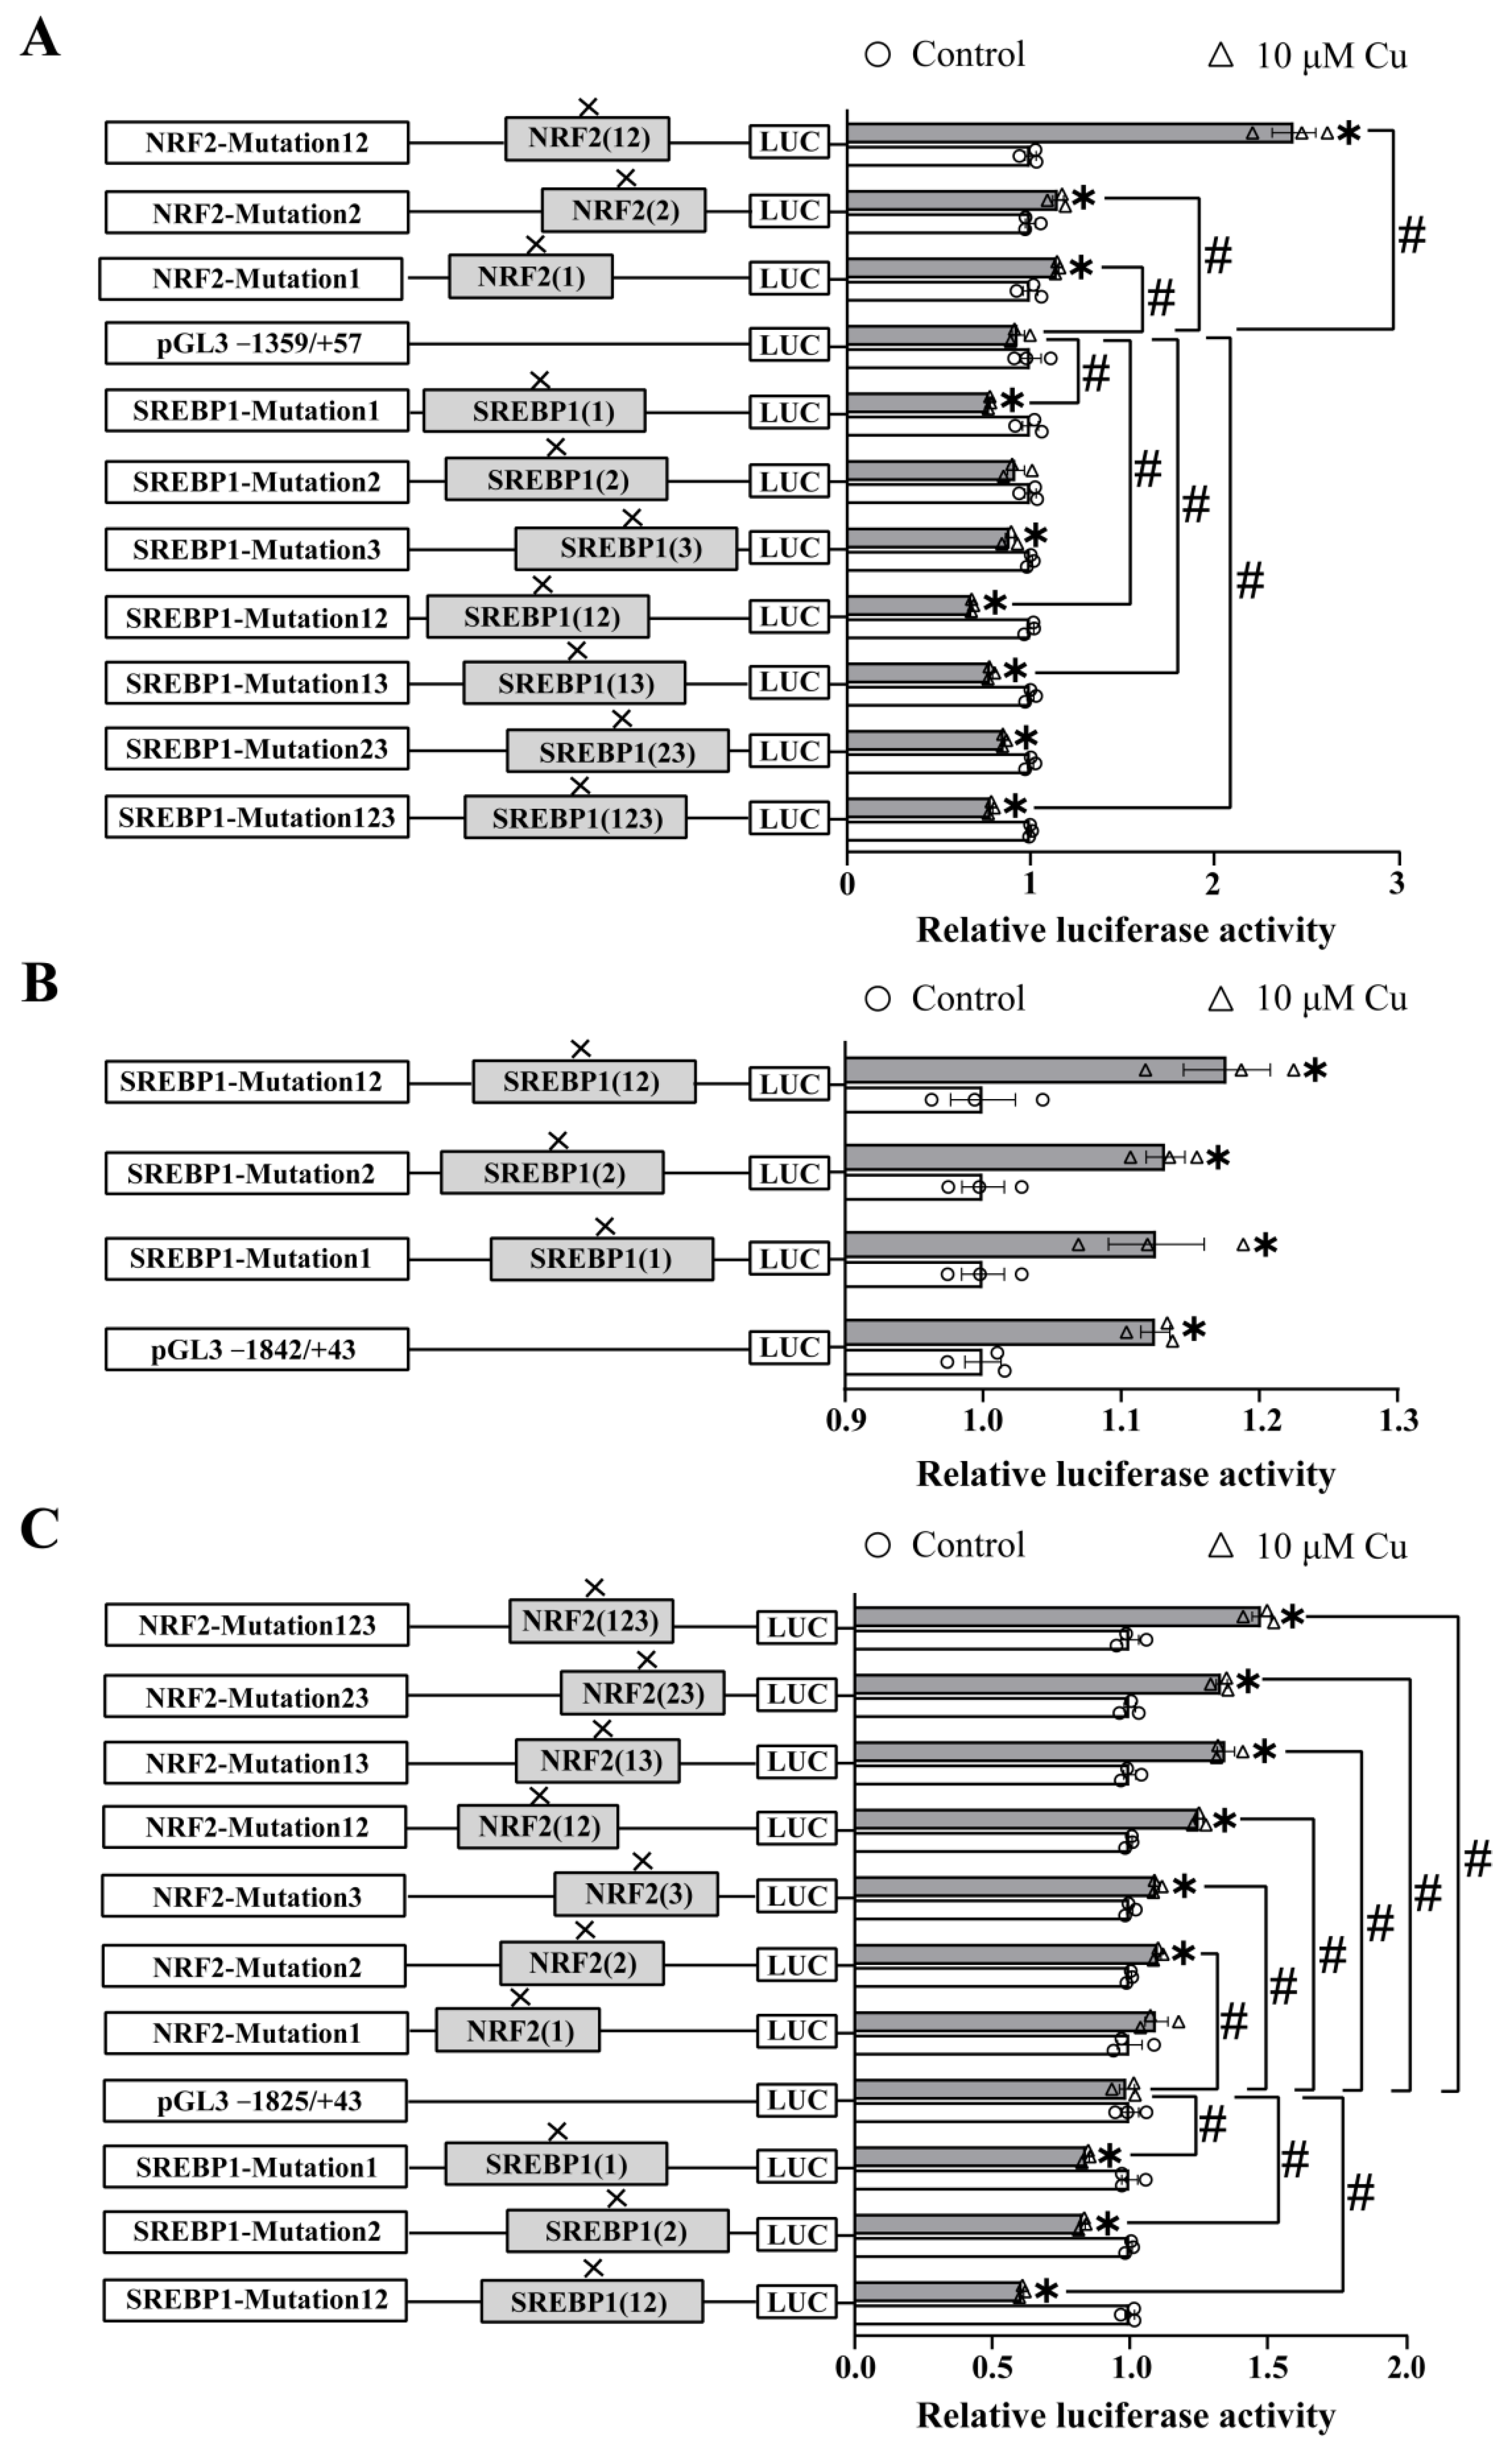
2.3. Site-Mutation Analysis of the NRF2 and SREBP1 Binding Sites on ctr1, ctr2 and atox1 Promoters
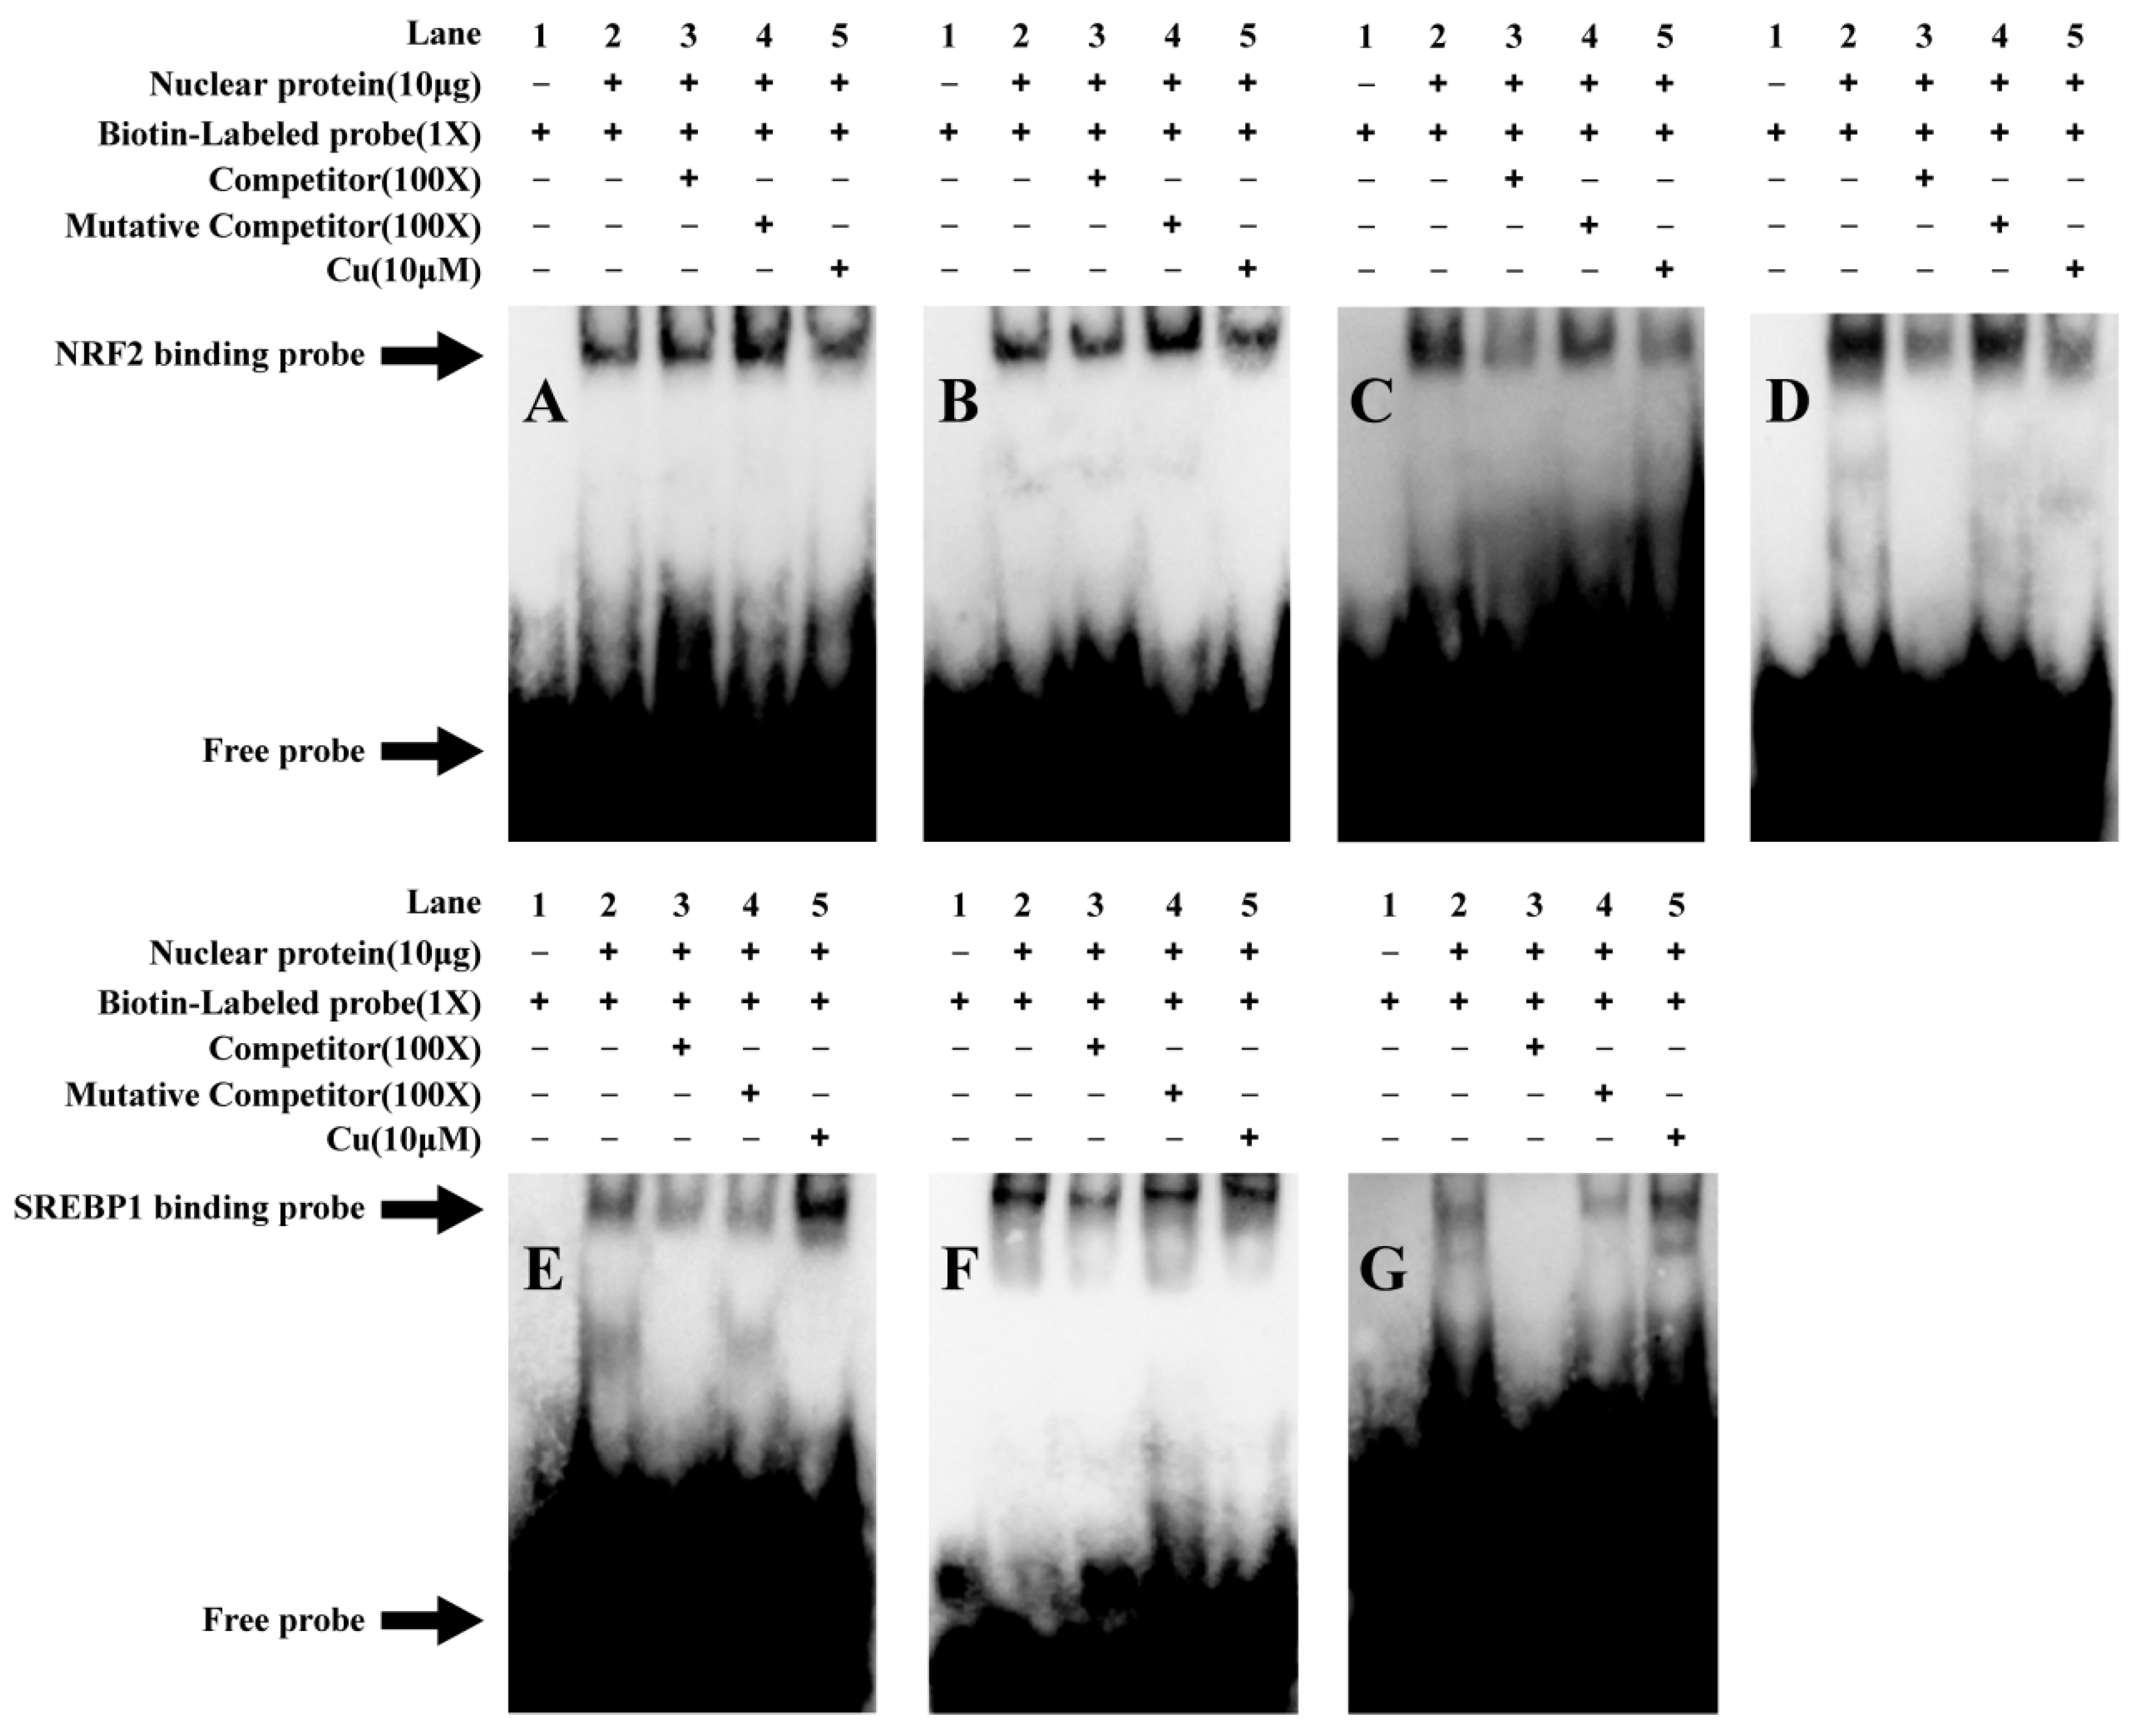
2.4. Analysis of the Functional Binding Sites Based on EMSA
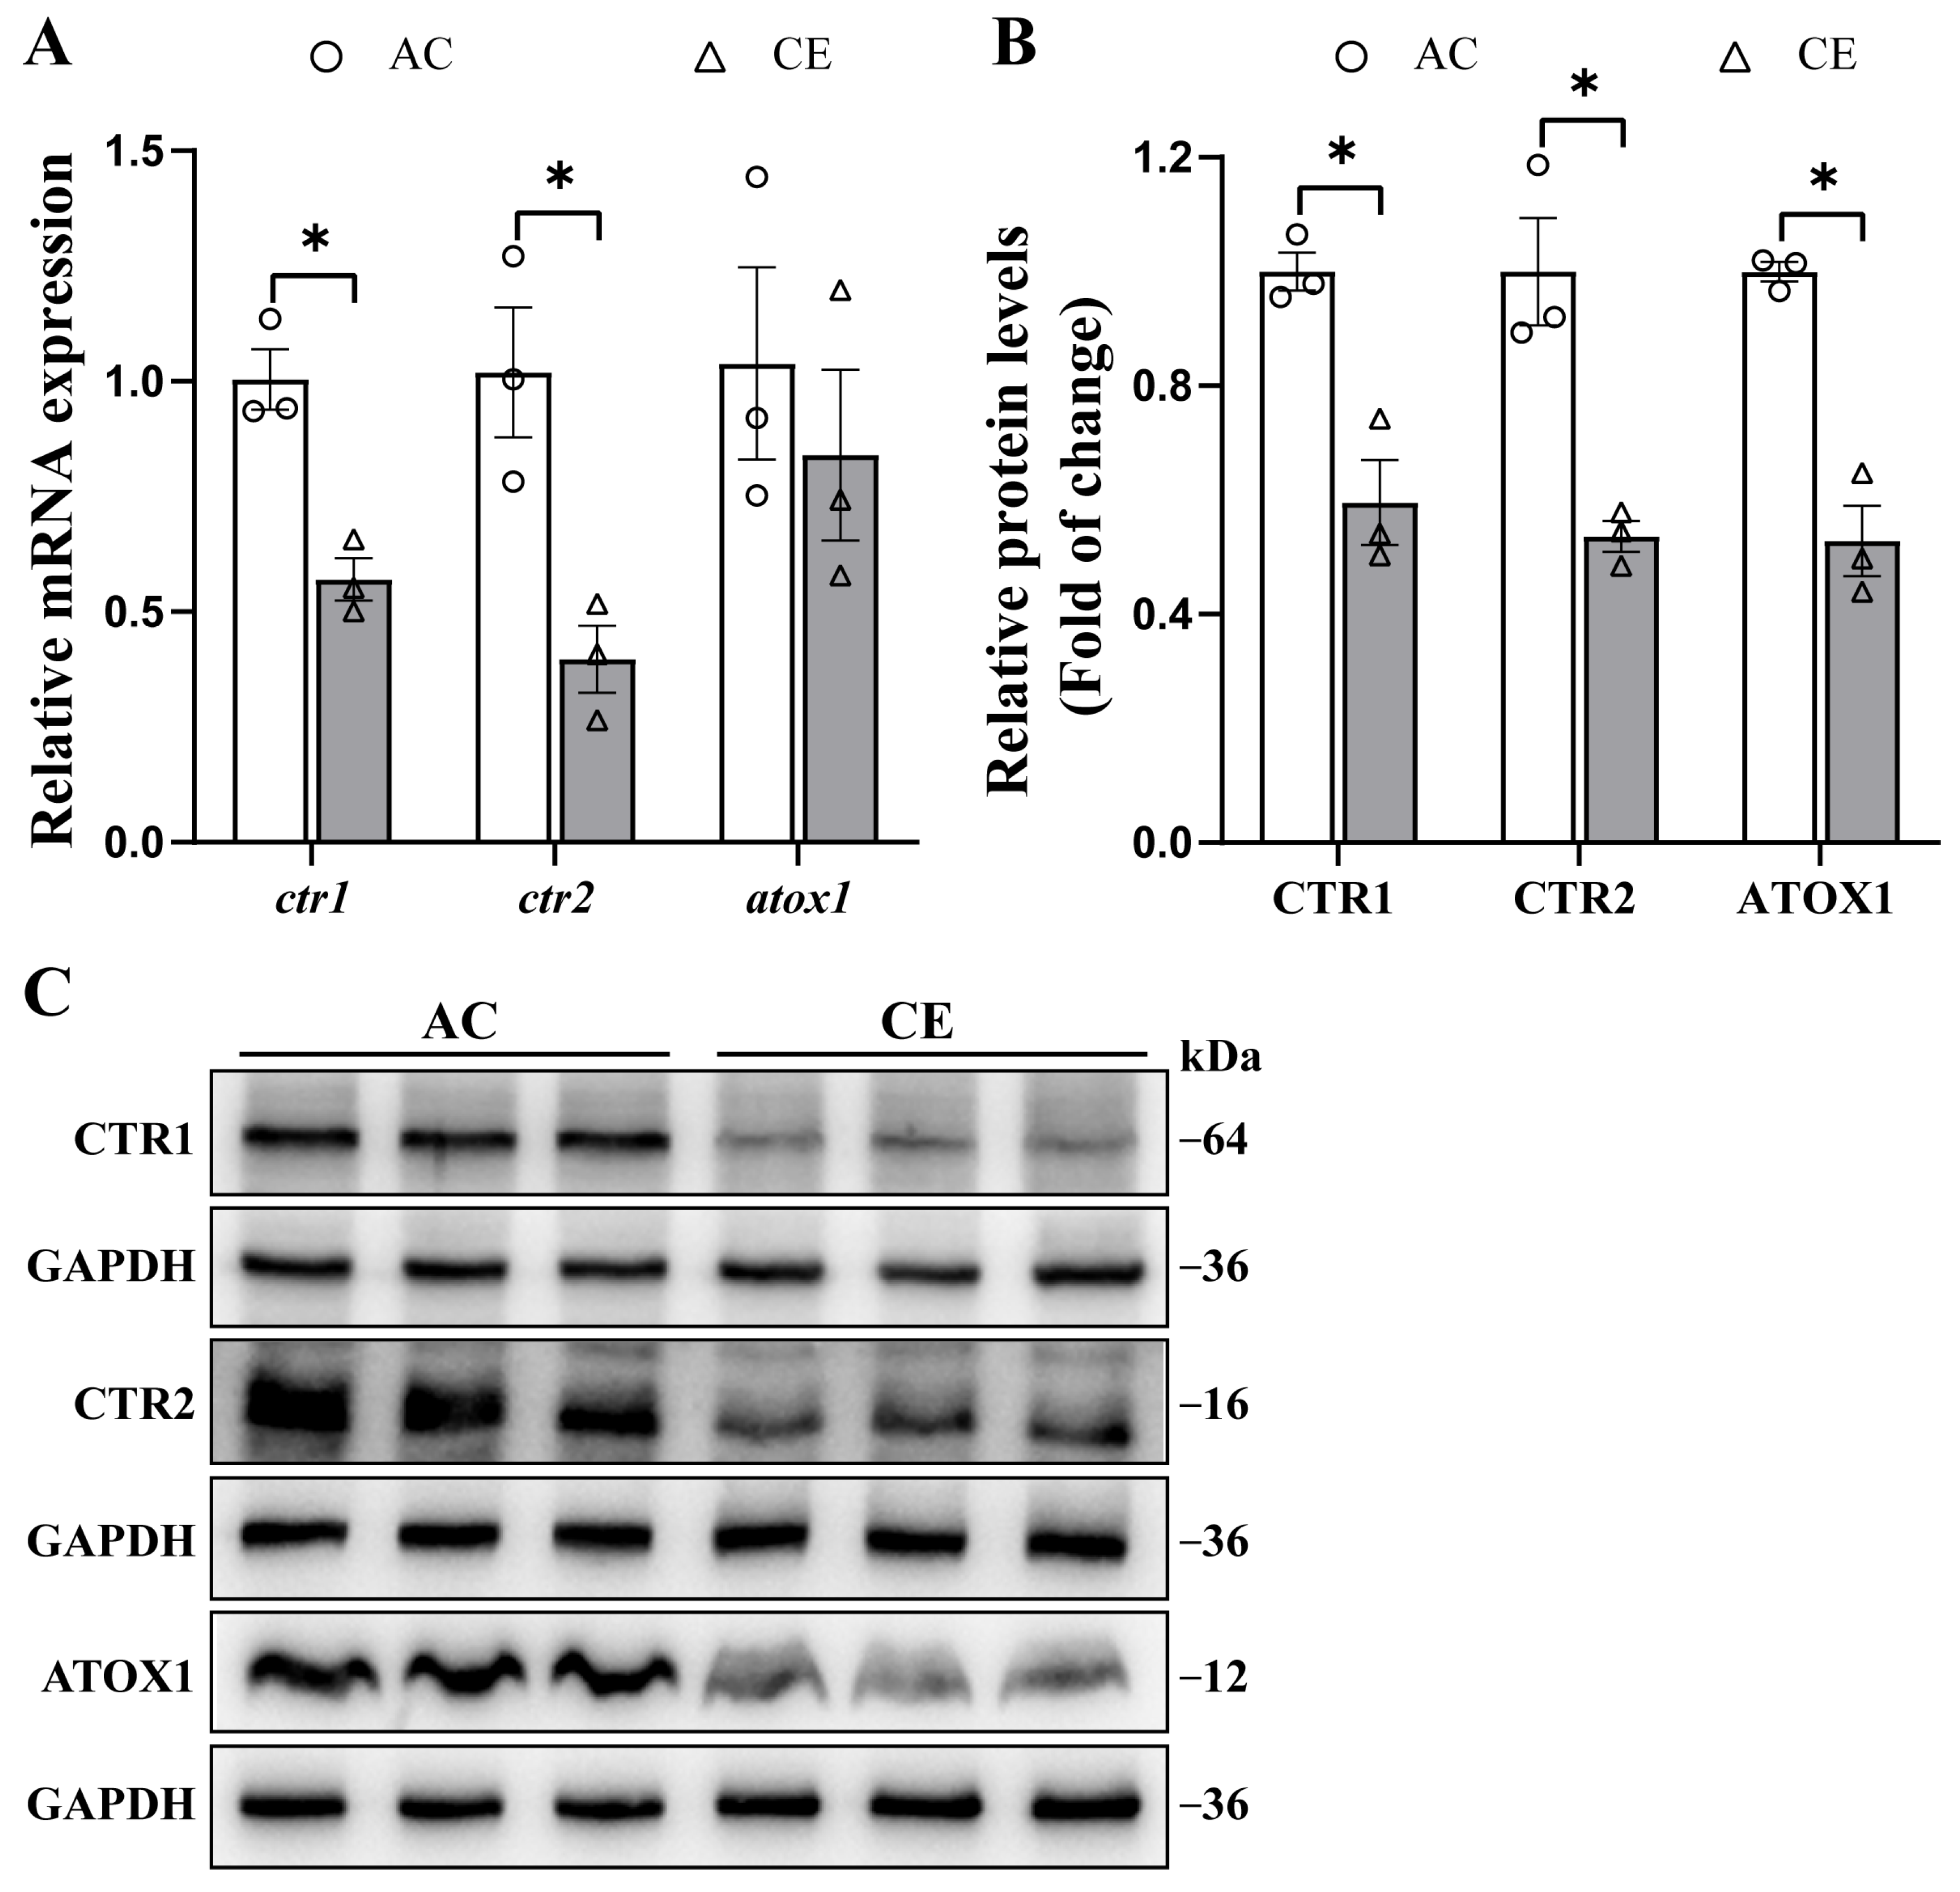
2.5. The Effects of Dietary Cu Levels on ctr1, ctr2 and atox1 mRNA and Protein Expressions in Yellow Catfish Liver Tissues
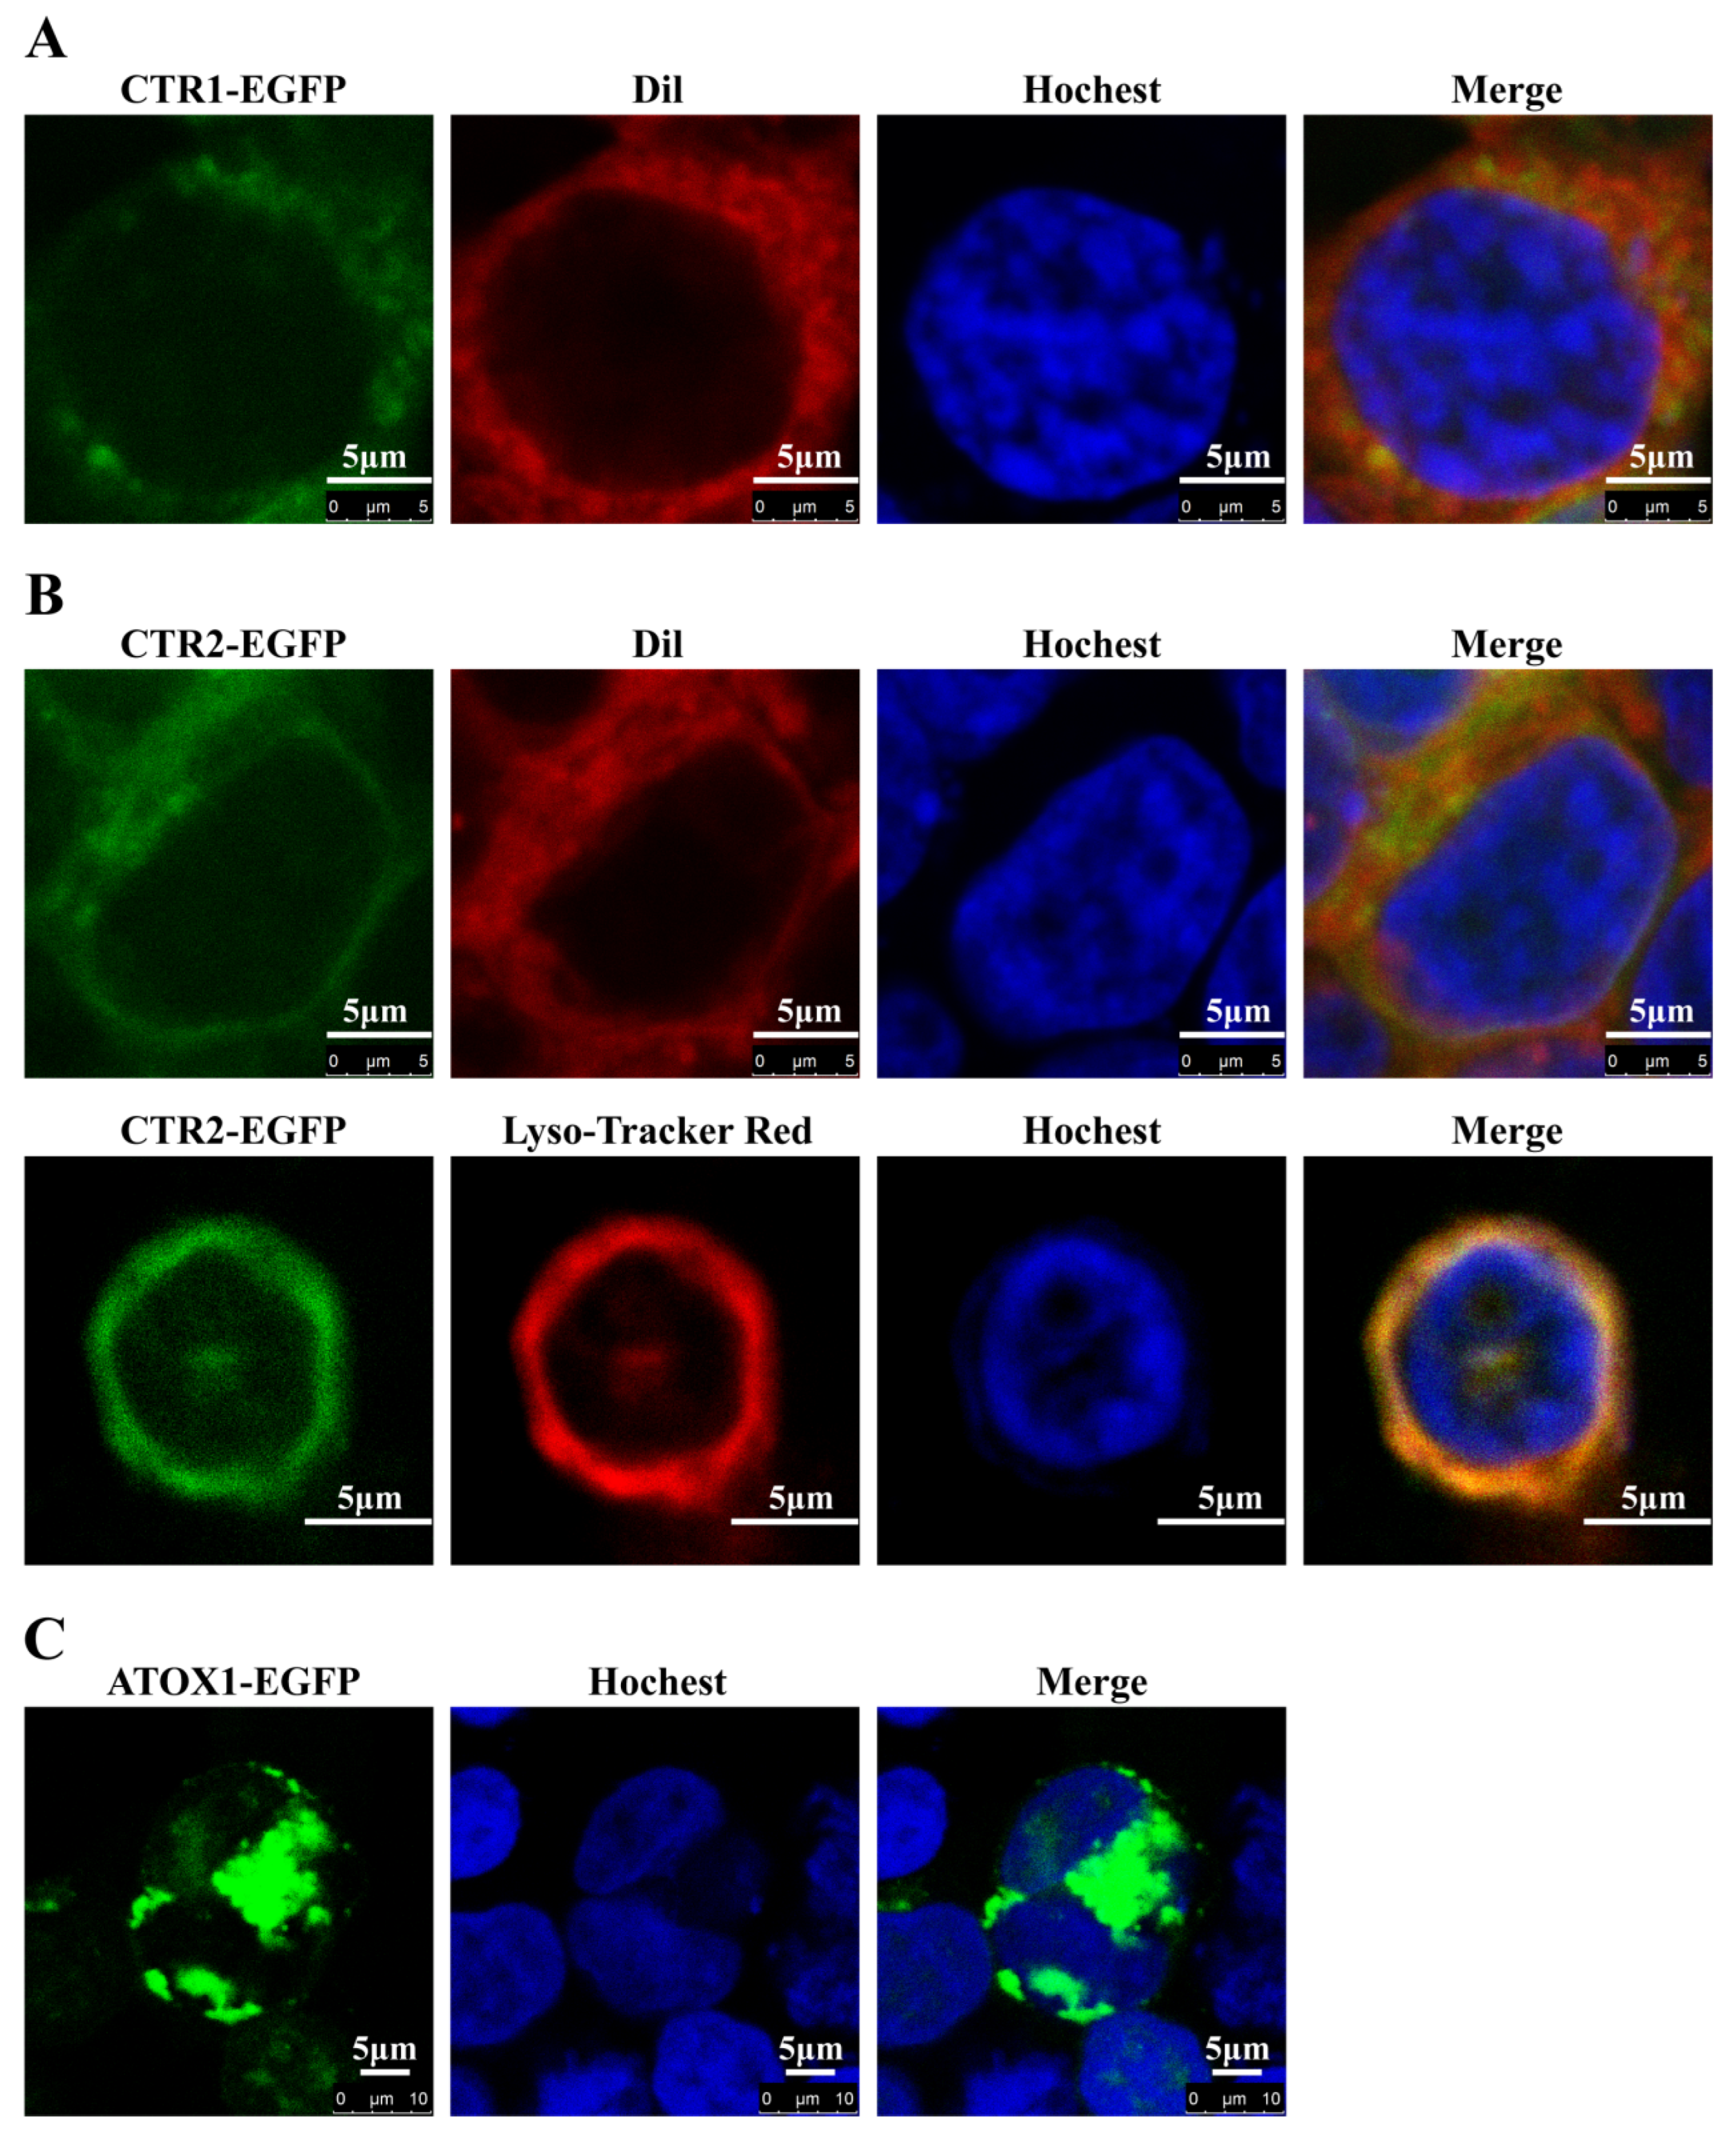
2.6. Subcellular Localization of CTR1, CTR2 and ATOX1 in HEK293T Cells
3. Discussion
4. Materials and Methods
4.1. Ethical Statement
4.2. Experimental Animals, Cells and Reagents
4.3. Exp. 1: Identification and Functional Analysis of Ctr1, Ctr2 and Atox1 Promoters
4.3.1. Promoter Identification and Plasmid Construction
4.3.2. Sequence Analysis
4.3.3. Analysis of the 5′-Sequence Deletion of ctr1, ctr2 and atox1 Promoters
4.3.4. Site-Mutation Analysis of NRF2 and SREBP1 Binding Sites on ctr1, ctr2 and atox1 Promoters
4.3.5. Primary Hepatocyte Culture and Treatments
4.3.6. EMSA
4.4. Exp. 2: Effects of Dietary Cu Levels on Ctr1, Ctr2 and Atox1 Transcriptional Responses in Yellow Catfish Liver Tissues
4.4.1. Animals’ Feeding, Management and Sampling
4.4.2. qPCR
4.4.3. Western Blot Analysis
4.5. Exp. 3: Intracellular Co-Location Analysis of Ctr1, Ctr2 and Atox1
Immunofluorescence
4.6. Statistical Analysis
5. Conclusions
Supplementary Materials
Author Contributions
Funding
Institutional Review Board Statement
Informed Consent Statement
Data Availability Statement
Conflicts of Interest
Abbreviations
References
- Watanabe, T.; Kiron, V.; Satoh, S. Trace minerals in fish nutrition. Aquaculture 1997, 151, 185–207. [Google Scholar] [CrossRef]
- Shike, M. Copper in parenteral nutrition. Gastroenterology 2009, 137, S13–S17. [Google Scholar] [CrossRef] [PubMed] [Green Version]
- Nevitt, T.; Ohrvik, H.; Thiele, D.J. Charting the travels of copper in eukaryotes from yeast to mammals. Biochim. Biophys. Acta 2012, 182, 1580–1593. [Google Scholar] [CrossRef] [PubMed] [Green Version]
- Ohrvik, H.; Thiele, D.J. How copper traverses cellular membranes through the mammalian copper transporter 1, ctr1. Ann. N. Y. Acad. Sci. 2014, 1314, 32–41. [Google Scholar] [CrossRef] [Green Version]
- Cheng, J.; Luo, Z.; Chen, G.H.; Wei, C.C.; Zhuo, M.Q. Identifification of eight copper (Cu) uptake related genes from yellow catfifish Pelteobagrus fulvidraco, and their tissue expression and transcriptional responses to dietborne Cu exposure. J. Trace Elem. Med. Biol. 2017, 44, 256–265. [Google Scholar] [CrossRef]
- Larson, C.A.; Adams, P.L.; Jandial, D.D.; Blair, B.G.; Safaei, R.; Howell, S.B. The role of the N-terminus of mammalian copper transporter 1 in the cellular accumulation of cisplatin. Biochem. Pharmacol. 2010, 80, 448–454. [Google Scholar] [CrossRef] [Green Version]
- Van den Berghe, P.V.; Folmer, D.E.; Malingré, H.E.; van Beurden, E.; Klomp, A.E.; van de Sluis, B.; Merkx, M.; Berger, R.; Klomp, L.W. Human transporter 2 is localized in late endosomes and lysosomes and facilitates cellular copper uptake. Biochem. J. 2007, 407, 49–59. [Google Scholar] [CrossRef]
- Chen, L.; Li, N.; Zhang, M.; Sun, M.; Bian, J.; Yang, B.; Li, Z.; Wang, J.; Li, F.; Shi, X.; et al. APEX2-based proximity labeling of atox1 identifies CRIP2 as a nuclear copper-binding protein that regulates autophagy activation. Angew. Chem. Int. Ed. Engl. 2021, 60, 25346–25355. [Google Scholar] [CrossRef]
- Festa, R.A.; Thiele, D.J. Copper: An essential metal in biology. Curr. Biol. 2011, 21, 877–883. [Google Scholar] [CrossRef] [Green Version]
- Öhrvik, H.; Logeman, B.; Noguchi, G.; Eriksson, I.; Kjellén, L.; Thiele, D.J.; Pejler, G. Ctr2 regulates mast cell maturation by affecting the storage and expression of tryptase and proteoglycans. J. Immunol. 2015, 195, 3654–3664. [Google Scholar] [CrossRef]
- Li, S.J.; Khan, R.; Raza, S.; Hong, J.Y.; Mei, C.G.; Kaster, N.; Cheng, G.; Zhao, C.P.; Schreurs, N.; Zan, L.S. Function and characterization of the promoter region of perilipin 1 (PLIN1): Roles of E2F1, PLAG1, C/EBPβ, and SMAD3 in bovine adipocytes. Genomics 2020, 112, 2400–2409. [Google Scholar] [CrossRef]
- Jiang, W.D.; Liu, Y.; Jiang, J. Copper exposure induces toxicity to the antioxidant system via the destruction of Nrf2/ARE signaling and caspase-3-regulated DNA damage in fish muscle: Amelioration by myo-inositol. Aquat. Toxicol. 2015, 159, 245–255. [Google Scholar] [CrossRef] [PubMed]
- Raghow, R.; Yellaturu, C.; Deng, X.; Park, E.A.; Elam, M.B. SREBPs: The cross-roads of physiological and pathological lipid homeostasis. Trends Endocrinol. Metabol. 2008, 19, 65–73. [Google Scholar] [CrossRef] [PubMed]
- Pan, Y.X.; Zhuo, M.Q.; Li, D.D.; Xu, Y.H.; Wu, K.; Luo, Z. SREBP-1 and LXRα pathways mediated Cu-induced hepatic lipid metabolism in zebrafish Danio rerio. Chemosphere 2019, 215, 370–379. [Google Scholar] [CrossRef]
- Song, M.O.; Mattie, M.D.; Lee, C.H.; Freedman, J.H. The role of Nrf1 and Nrf2 in the regulation of copper-responsive transcription. Exp. Cell. Res. 2014, 322, 39–50. [Google Scholar] [CrossRef] [Green Version]
- Zeng, L.; Wang, Y.H.; Ai, C.X.; Zhang, J.S. Differential effects of β-glucan on oxidative stress, inflammation and copper transport in two intestinal regions of large yellow croaker Larimichthys crocea under acute copper stress. Ecotoxicol. Environ. Saf. 2018, 165, 78–87. [Google Scholar] [CrossRef]
- Chen, G.H.; Luo, Z.; Hogstrand, C.; Wu, K.; Ling, S.C. SREBP1, PPARG and AMPK pathways mediated the Cu-induced change in intestinal lipogenesis and lipid transport of yellow catfish Pelteobagrus fulvidraco. Food Chem. 2018, 269, 595–602. [Google Scholar] [CrossRef] [Green Version]
- Yamamoto, M.; Kensler, T.W.; Motohashi, H. The KEAP1-NRF2 System: A thiol-based sensor-Eeffector apparatus for maintaining redox homeostasis. Physiol. Rev. 2018, 98, 1169–1203. [Google Scholar] [CrossRef] [Green Version]
- Yi, J.; Zhu, J.; Wu, J.; Thompson, C.B.; Jiang, X. Oncogenic activation of PI3K-AKT-mTOR signaling suppresses ferroptosis via SREBP-mediated lipogenesis. Proc. Natl. Acad. Sci. USA 2020, 117, 31189–31197. [Google Scholar] [CrossRef]
- Gong, G.; Dan, C.; Xiao, S.; Guo, W.; Huang, P.; Xiong, Y.; Wu, J.; He, Y.; Zhang, J.; Li, X.; et al. Chromosomal-level assembly of yellow catfish genome using third-generation DNA sequencing and Hi-C analysis. Gigascience 2018, 7, 1–9. [Google Scholar] [CrossRef]
- Goodrich, J.A.; Tjian, R. Unexpected roles for core promoter recognition factors in cell-type-specific transcription and gene regulation. Nat. Rev. Genet. 2010, 11, 549–558. [Google Scholar] [CrossRef] [PubMed] [Green Version]
- Marvin, M.E.; Williams, P.H.; Cashmore, A.M. The Candida albicans ctr1 gene encodes a functional copper transporter. Microbiology 2003, 149, 1461–1474. [Google Scholar] [CrossRef] [PubMed] [Green Version]
- Voutsina, A.; Fragiadakis, G.S.; Gkouskou, K.; Alexandraki, D. Synergy of Hir1, Ssn6, and Snf2 global regulators is the functional determinant of a Mac1 transcriptional switch in S. cerevisiae copper homeostasis. Curr. Genet. 2019, 65, 799–816. [Google Scholar] [CrossRef] [PubMed]
- Beneš, V.; Lookover, K.; Matěnová, M.; Borovička, J.; Kotrba, P. Accumulation of Ag and Cu in Amanita strobiliformis and characterization of its Cu and Ag uptake transporter genes AsCTR2 and AsCTR3. Biometals 2016, 29, 249–264. [Google Scholar] [CrossRef]
- Huang, C.P.; Fofana, M.; Chan, J.; Chang, C.J.; Howell, S.B. Copper transporter 2 regulates intracellular copper and sensitivity to cisplatin. Metallomics 2014, 6, 654–661. [Google Scholar] [CrossRef] [Green Version]
- Maung, M.T.; Carlson, A.; Olea-Flores, M.; Elkhadragy, L.; Schachtschneider, K.M.; Navarro-Tito, N.; Padilla-Benavides, T. The molecular and cellular basis of copper dysregulation and its relationship with human pathologies. FASEB. J. 2021, 35, e21810. [Google Scholar] [CrossRef]
- Roy, A.L.; Singer, D.S. Core promoters in transcription: Old problem, new insights. Trends Biochem. Sci. 2015, 40, 165–171. [Google Scholar] [CrossRef] [Green Version]
- Zhuo, M.Q.; Luo, Z.; Xu, Y.H.; Li, D.D.; Pan, Y.X.; Wu, K. Functional analysis of promoters from three subtypes of the PI3K family and their roles in the regulation of lipid metabolism by insulin in yellow catfish Pelteobagrus fulvidraco. Int. J. Mol. Sci. 2018, 19, 265. [Google Scholar] [CrossRef] [Green Version]
- Han, J.; Li, E.; Chen, L.; Zhang, Y.; Wei, F.; Liu, J.; Deng, H.; Wang, Y. The CREB coactivator CRTC2 controls hepatic lipid metabolism by regulating SREBP1. Nature 2015, 524, 243–246. [Google Scholar] [CrossRef]
- Dong, Q.; Kuefner, M.S.; Deng, X.; Bridges, D.; Park, E.A.; Elam, M.B.; Raghow, R. Sex-specific differences in hepatic steatosis in obese spontaneously hypertensive (SHROB) rats. Biol. Sex. Differ. 2018, 9, 40. [Google Scholar] [CrossRef]
- Zhong, C.C.; Zhao, T.; Hogstrand, C.; Chen, F.; Song, C.C.; Luo, Z. Copper (Cu) induced changes of lipid metabolism through oxidative stress-mediated autophagy and Nrf2/PPARγ pathways. J. Nutr. Biochem. 2022, 100, 108883. [Google Scholar] [CrossRef] [PubMed]
- Yu, H.; Liang, H.; Ren, M.; Ji, K.; Yang, Q.; Ge, X.; Xi, B.; Pan, L. Effects of dietary fenugreek seed extracts on growth performance, plasma biochemical parameters, lipid metabolism, Nrf2 antioxidant capacity and immune response of juvenile blunt snout bream (Megalobrama amblycephala). Fish Shellfish Immunol. 2019, 94, 211–219. [Google Scholar] [CrossRef] [PubMed]
- Battino, M.; Giampieri, F.; Pistollato, F.; Sureda, A.; de Oliveira, M.R.; Pittalà, V.; Fallarino, F.; Nabavi, S.F.; Atanasov, A.G.; Nabavi, S.M. Nrf2 as regulator of innate immunity: A molecular Swiss army knife. Biotechnol. Adv. 2018, 36, 358–370. [Google Scholar] [CrossRef] [PubMed]
- Huang, C.; Chen, Q.L.; Luo, Z.; Shi, X.; Pan, Y.X.; Song, Y.F.; Zhuo, M.Q.; Wu, K. Time-dependent effects of waterborne copper exposure influencing hepatic lipid deposition and metabolism in javelin goby Synechogobius hasta and their mechanism. Aquat. Toxicol. 2014, 155, 291–300. [Google Scholar] [CrossRef] [PubMed]
- Tang, Z.; Gasperkova, D.; Xu, J.; Baillie, R.; Lee, J.H.; Clarke, S.D. Copper deficiency induces hepatic fatty acid synthase gene transcription in rats by increasing the nuclear content of mature sterol regulatory element binding protein 1. J. Nutr. 2000, 130, 2915–2921. [Google Scholar] [CrossRef] [PubMed] [Green Version]
- Meng, X.L.; Li, S.; Qin, C.B.; Zhu, Z.X.; Hu, W.P.; Yang, L.P.; Lu, R.H.; Li, W.J.; Nie, G.X. Intestinal microbiota and lipid metabolism responses in the common carp (Cyprinus carpio L.) following copper exposure. Ecotoxicol. Environ. Saf. 2018, 160, 257–264. [Google Scholar] [CrossRef]
- Da Silva, E.S.; Abril, S.I.; Zanette, J.; Bianchini, A. Salinity-dependent copper accumulation in the guppy Poecilia vivipara is associated with CTR1 and ATP7B transcriptional regulation. Aquat. Toxicol. 2014, 152, 300–307. [Google Scholar] [CrossRef]
- Zhao, D.; Zhang, X.; Liu, D.; Ru, S. Cu accumulation, detoxification and tolerance in the red swamp crayfish Procambarus clarkii. Ecotoxicol. Environ. Saf. 2019, 175, 201–207. [Google Scholar] [CrossRef]
- Lutsenko, S. Human copper homeostasis: A network of interconnected pathways. Curr. Opin. Chem. Biol. 2010, 14, 211–217. [Google Scholar] [CrossRef]
- Hamza, I.; Prohaska, J.; Gitlin, J.D. Essential role for atox1 in the copper-mediated intracellular trafficking of the Menkes ATPase. Proc. Natl. Acad. Sci. USA 2003, 100, 1215–1220. [Google Scholar] [CrossRef]
- McRae, R.; Lai, B.; Fahrni, C.J. Copper redistribution in atox1-deficient mouse fibroblast cells. J. Biol. Inorg. Chem. 2010, 15, 99–105. [Google Scholar] [CrossRef] [PubMed] [Green Version]
- Bertinato, J.; Swist, E.; Plouffe, L.J.; Brooks, S.P.; L’abbé, M.R. Ctr2 is partially localized to the plasma membrane and stimulates copper uptake in COS-7 cells. Biochem. J. 2008, 409, 731–740. [Google Scholar] [CrossRef] [PubMed]
- Hatori, Y.; Inouye, S.; Akagi, R. Thiol-based copper handling by the copper chaperone Atox1. IUBMB Life 2017, 69, 246–254. [Google Scholar] [CrossRef] [PubMed] [Green Version]
- Xu, Y.H.; Luo, Z.; Wu, K.; Fan, Y.F.; You, W.J.; Zhang, L.H. Structure and functional analysis of promoters from two liver isoforms of CPT I in grass carp Ctenopharyngodon idella. Int. J. Mol. Sci. 2017, 18, 2405. [Google Scholar] [CrossRef] [PubMed] [Green Version]
- Zhuo, M.Q.; Lv, W.H.; Xu, Y.H.; Luo, Z. Isolation and characterization of three sodium-phosphate cotransporter genes and their transcriptional regulation in the grass carp Ctenopharyngodon Idella. Int. J. Mol. Sci. 2020, 21, 8228. [Google Scholar] [CrossRef]
- Chen, G.H.; Lv, W.; Xu, Y.H.; Wei, X.L.; Xu, Y.C.; Luo, Z. Functional analysis of MTF-1 and MT promoters and their transcriptional response to zinc (Zn) and copper (Cu) in yellow catfish Pelteobagrus fulvidraco. Chemosphere 2020, 246, 125792. [Google Scholar] [CrossRef]
- Wu, K.; Luo, Z.; Hogstrand, C.; Chen, G.H.; Wei, C.C.; Li, D.D. Zn stimulates the phospholipids biosynthesis via the pathways of oxidative and endoplasmic reticulum stress in the intestine of freshwater teleost yellow catfish. Environ. Sci. Technol. 2018, 52, 9206–9214. [Google Scholar] [CrossRef] [Green Version]
- Zhao, T.; Wu, K.; Hogstrand, C.; Xu, Y.H.; Chen, G.H.; Wei, C.C.; Luo, Z. Lipophagy mediated carbohydrate-induced changes of lipid metabolism via oxidative stress, endoplasmic reticulum (ER) stress and ChREBP/PPARγ pathways. Cell. Mol. Life Sci. 2020, 77, 1987–2003. [Google Scholar] [CrossRef]
- Tan, X.Y.; Luo, Z.; Liu, X.; Xie, C.X. Dietary copper requirement of juvenile yellow catfish Pelteobagrus fulvidraco. Aquacult. Nutr. 2011, 17, 170–176. [Google Scholar] [CrossRef]
- Wei, C.C.; Luo, Z.; Hogstrand, C.; Xu, Y.H.; Wu, L.X.; Chen, G.H.; Pan, Y.X.; Song, Y.F. Zinc reduces hepatic lipid deposition and activates lipophagy via Zn2+/MTF-1/PPARα and Ca2+/CaMKKβ/AMPK pathways. FASEB J. 2018, 32, 6666–6680. [Google Scholar] [CrossRef]
- Pang, Y.; Xu, X.; Xiang, X.; Li, Y.; Zhao, Z.; Li, J.; Gao, S.; Liu, Q.; Mai, K.; Ai, Q. High fat activates O-GlcNAcylation and affects AMPK/ACC pathway to regulate lipid metabolism. Nutrients 2021, 13, 1740. [Google Scholar] [CrossRef] [PubMed]


Publisher’s Note: MDPI stays neutral with regard to jurisdictional claims in published maps and institutional affiliations. |
© 2022 by the authors. Licensee MDPI, Basel, Switzerland. This article is an open access article distributed under the terms and conditions of the Creative Commons Attribution (CC BY) license (https://creativecommons.org/licenses/by/4.0/).
Share and Cite
Yang, H.; Zhong, C.; Tan, X.; Chen, G.; He, Y.; Liu, S.; Luo, Z. Transcriptional Responses of Copper-Transport-Related Genes ctr1, ctr2 and atox1 and Their Roles in the Regulation of Cu Homeostasis in Yellow Catfish Pelteobagrus fulvidraco. Int. J. Mol. Sci. 2022, 23, 12243. https://doi.org/10.3390/ijms232012243
Yang H, Zhong C, Tan X, Chen G, He Y, Liu S, Luo Z. Transcriptional Responses of Copper-Transport-Related Genes ctr1, ctr2 and atox1 and Their Roles in the Regulation of Cu Homeostasis in Yellow Catfish Pelteobagrus fulvidraco. International Journal of Molecular Sciences. 2022; 23(20):12243. https://doi.org/10.3390/ijms232012243
Chicago/Turabian StyleYang, Hong, Chongchao Zhong, Xiaoying Tan, Guanghui Chen, Yang He, Shengzan Liu, and Zhi Luo. 2022. "Transcriptional Responses of Copper-Transport-Related Genes ctr1, ctr2 and atox1 and Their Roles in the Regulation of Cu Homeostasis in Yellow Catfish Pelteobagrus fulvidraco" International Journal of Molecular Sciences 23, no. 20: 12243. https://doi.org/10.3390/ijms232012243