
Gene Networks of Hyperglycemia, Diabetic Complications, and Human Proteins Targeted by SARS-CoV-2: What Is the Molecular Basis for Comorbidity?


Abstract
:1. Introduction
2. Results and Discussion
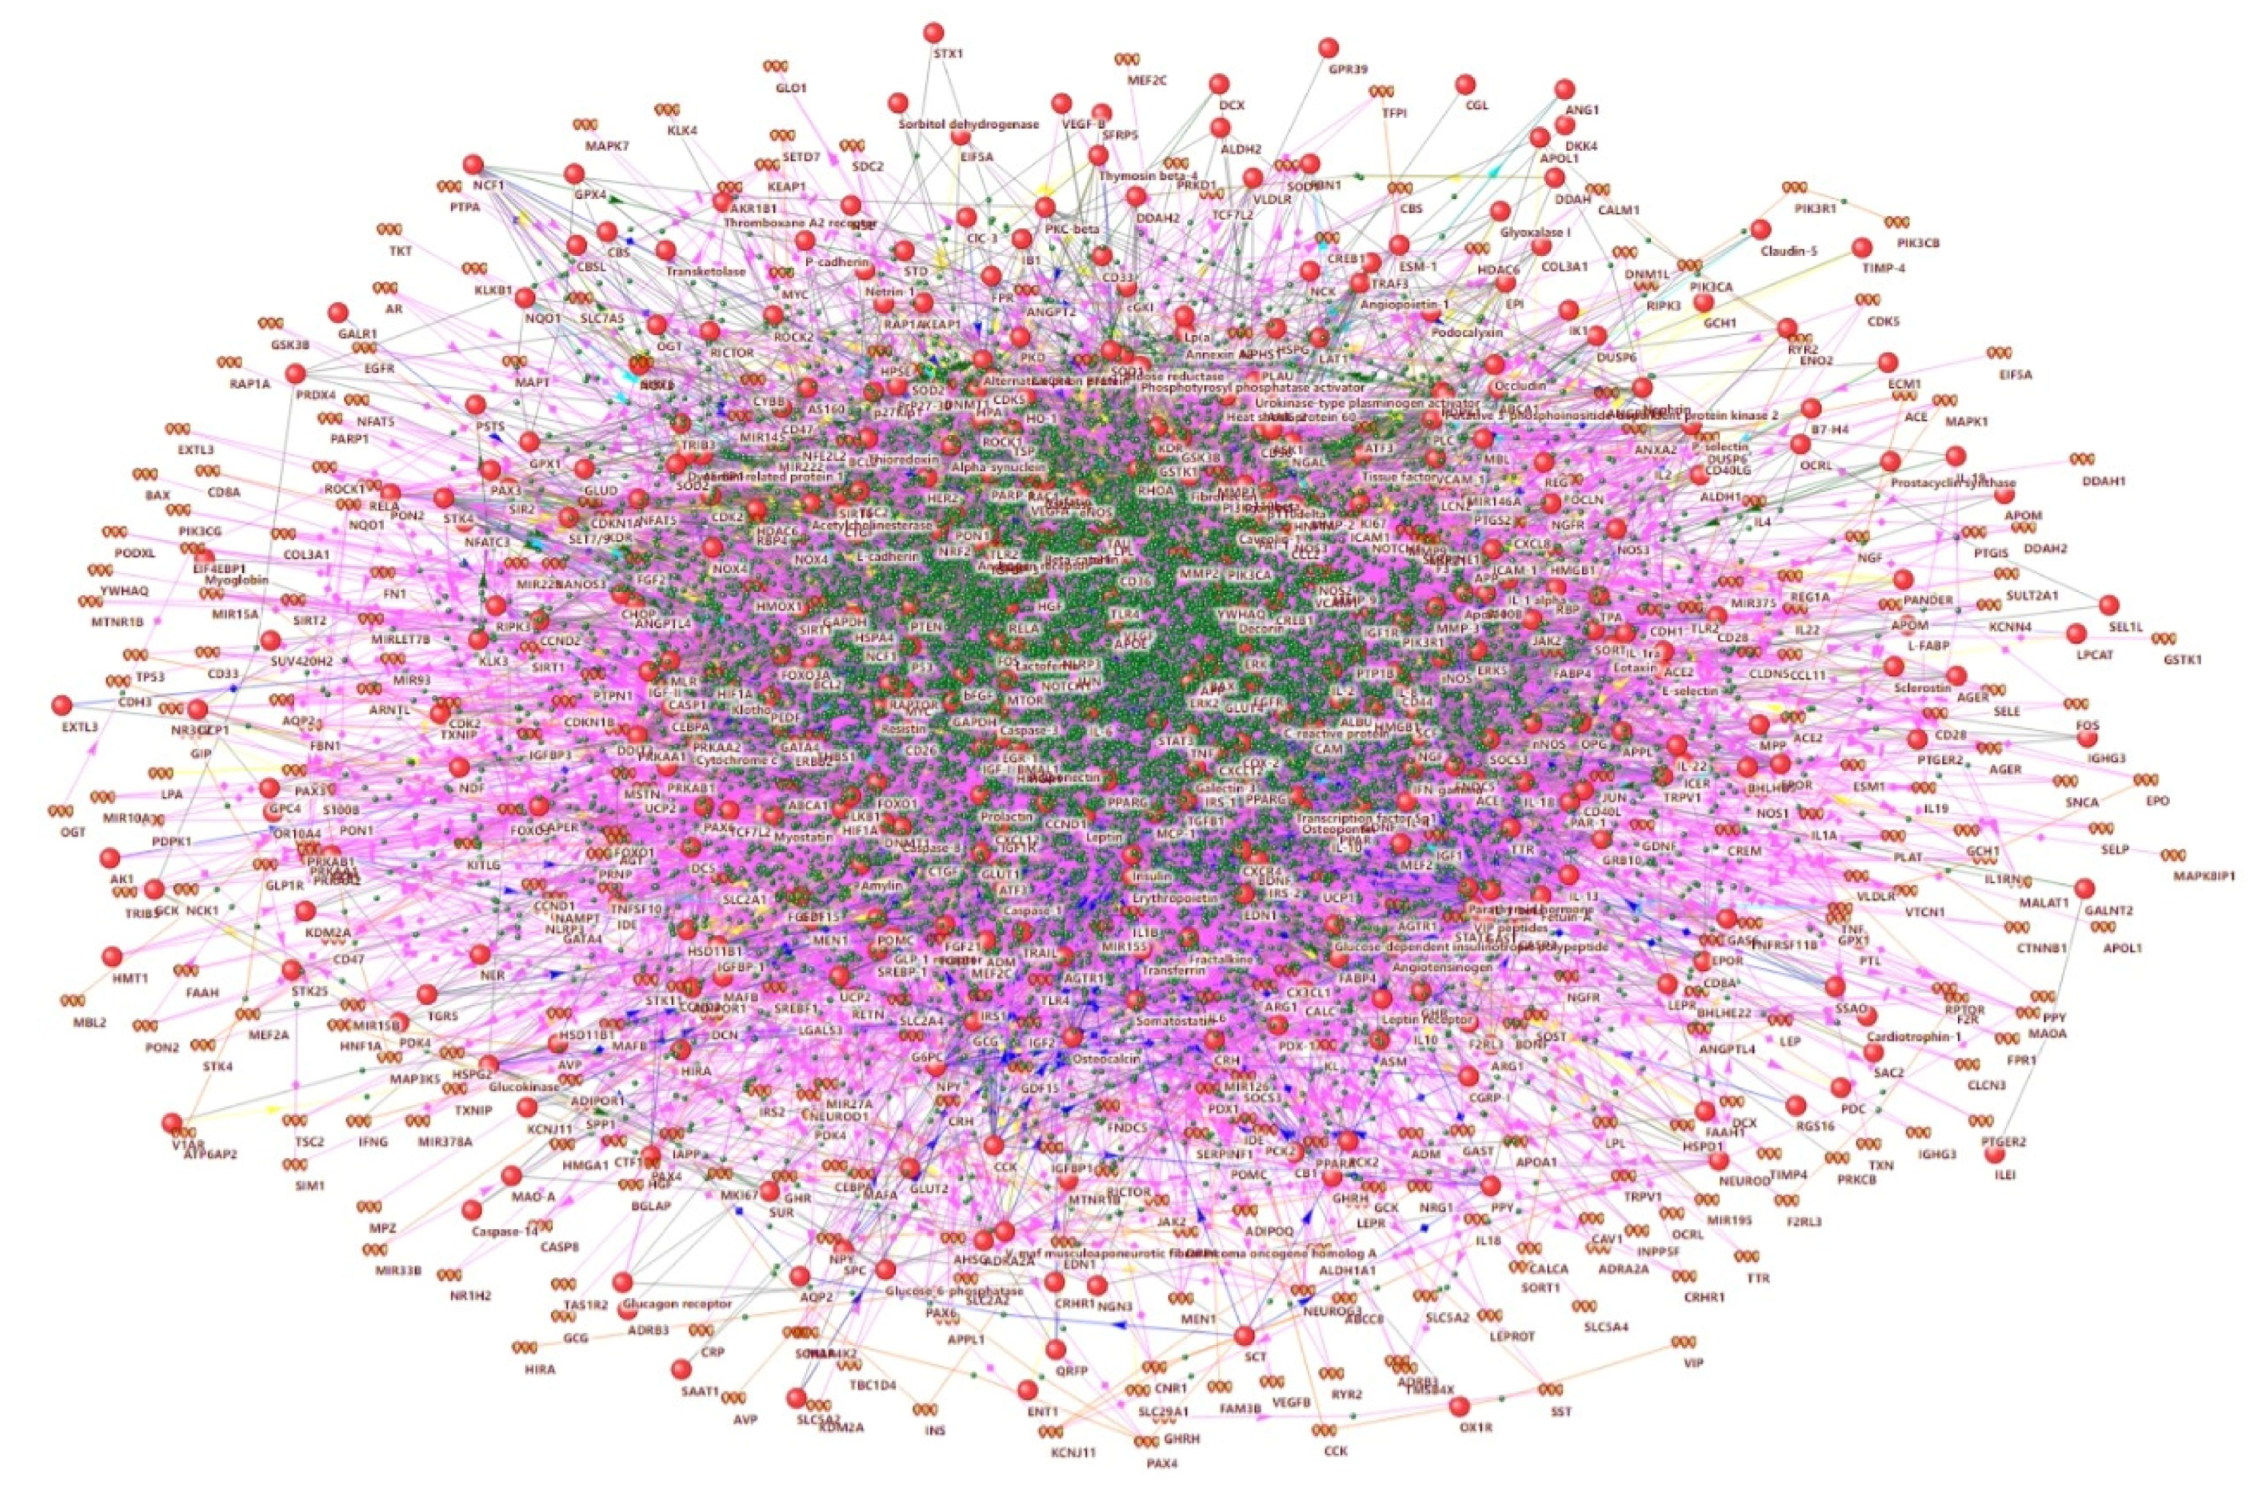
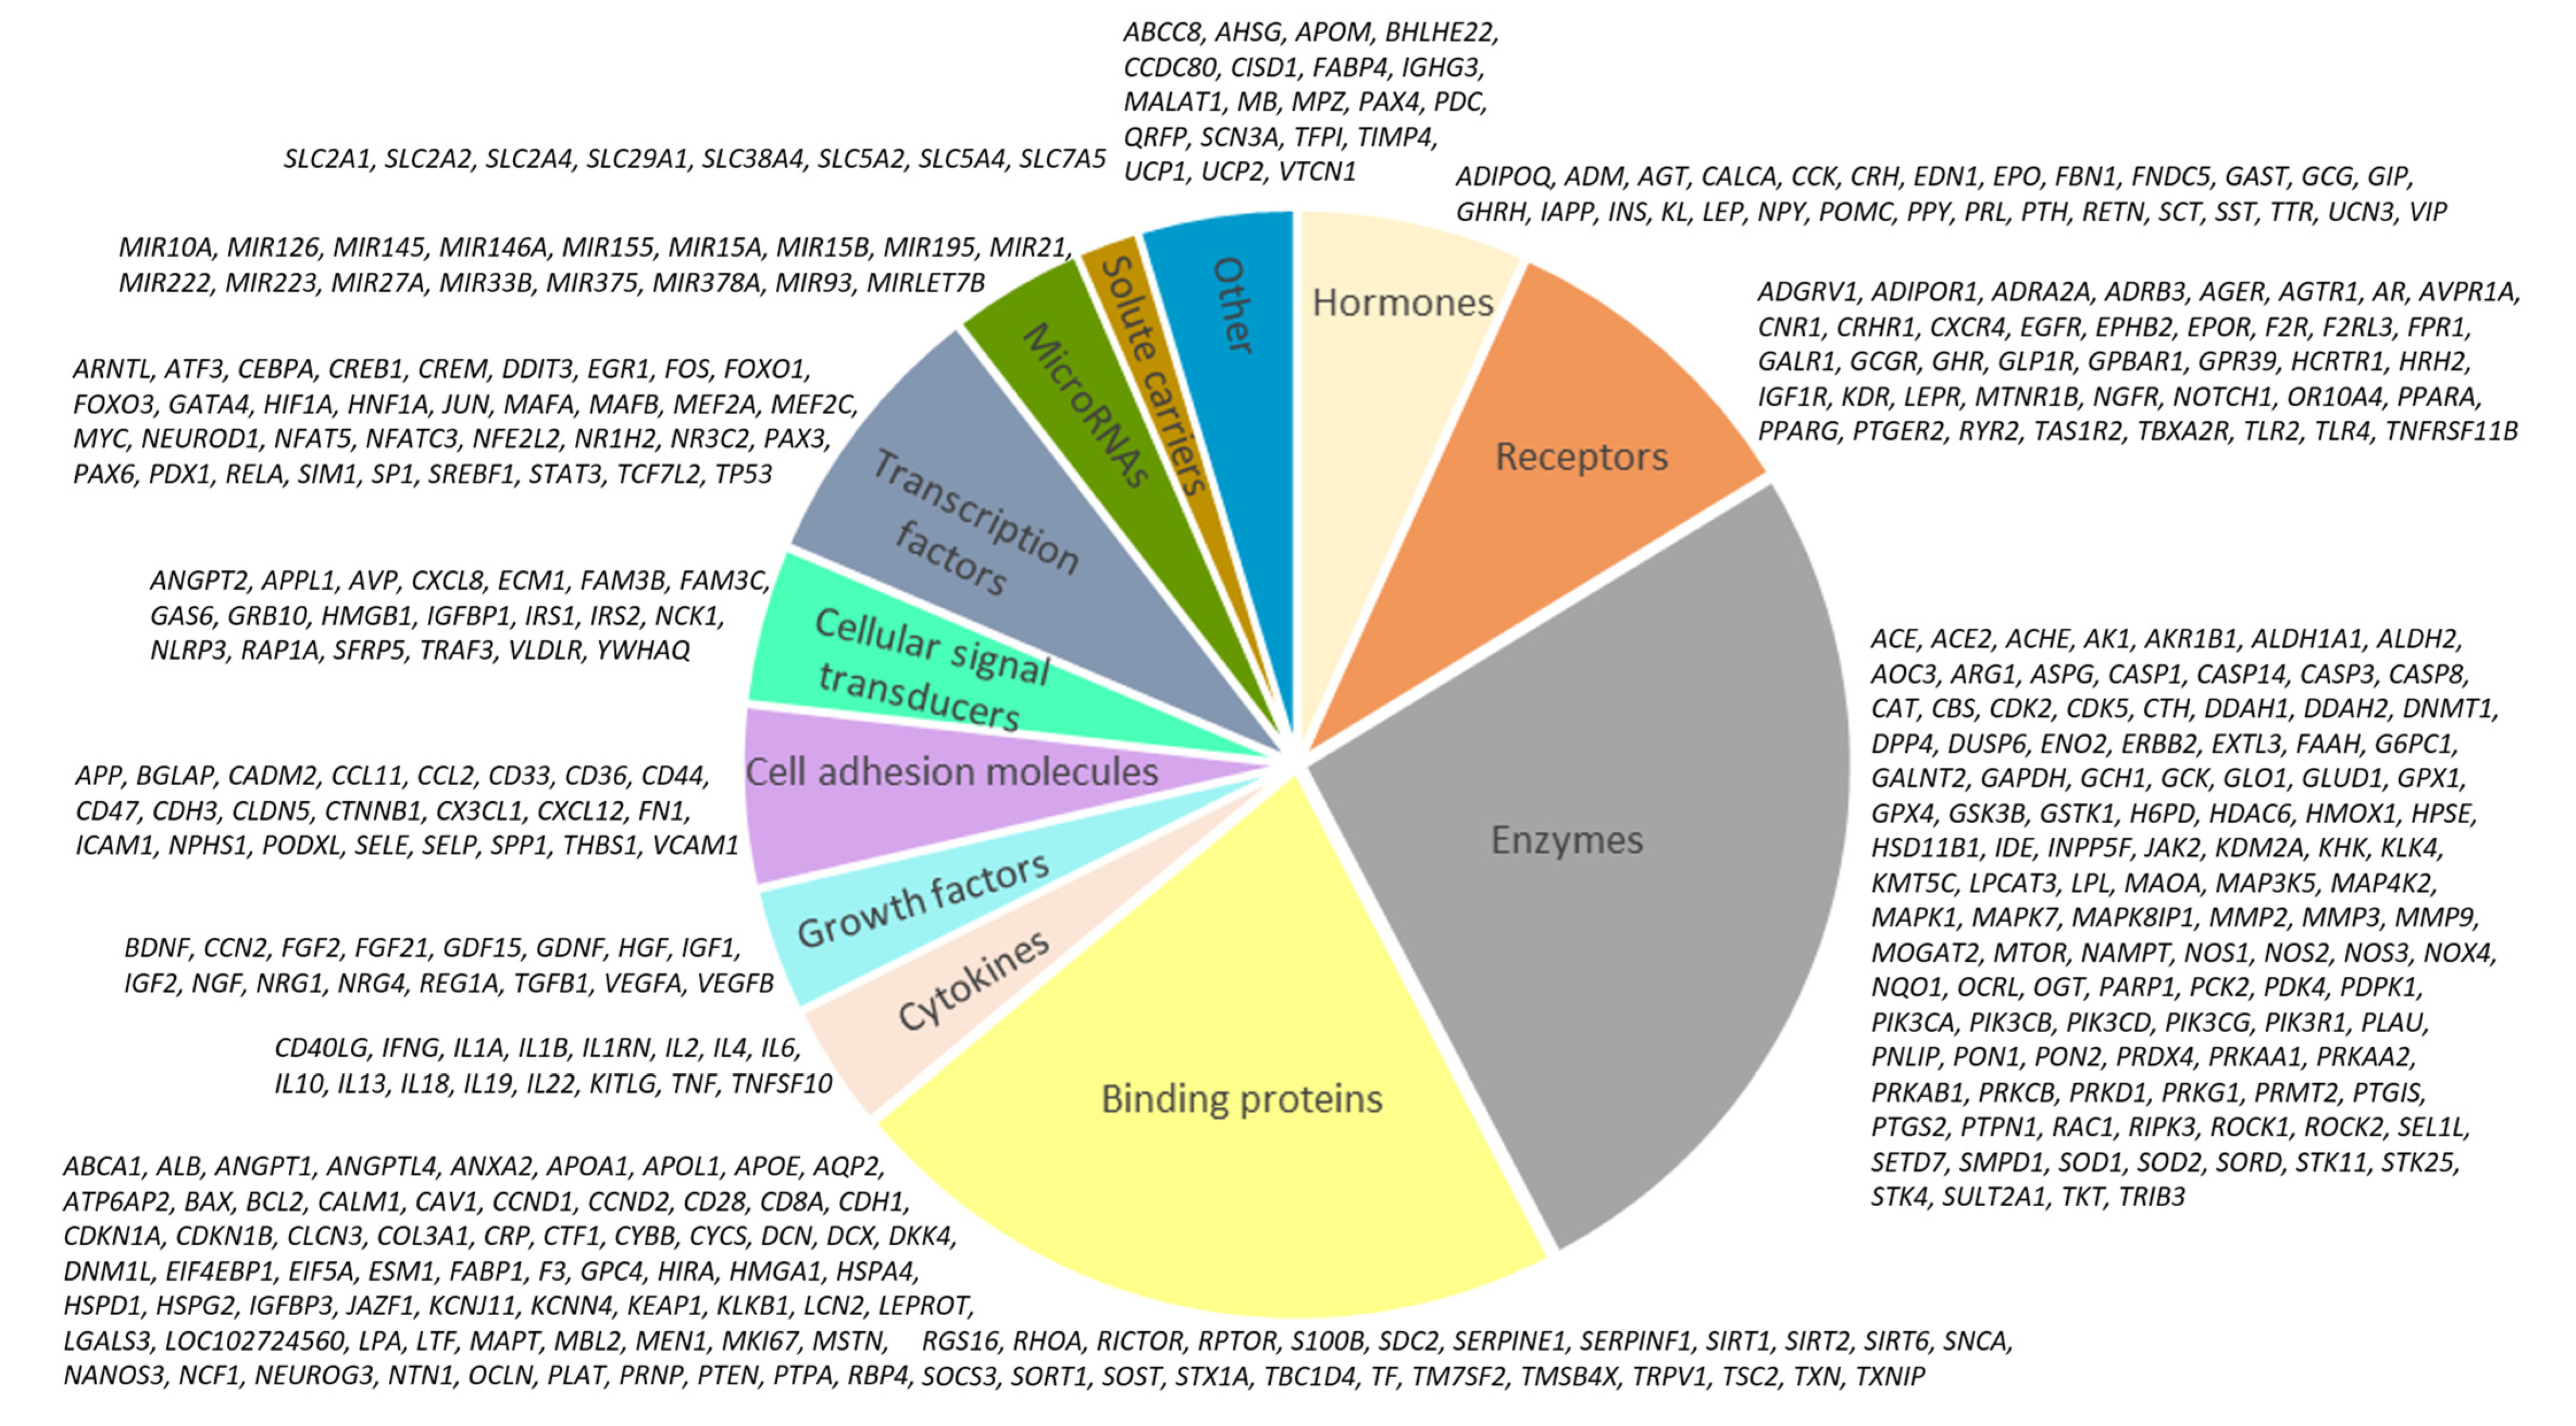
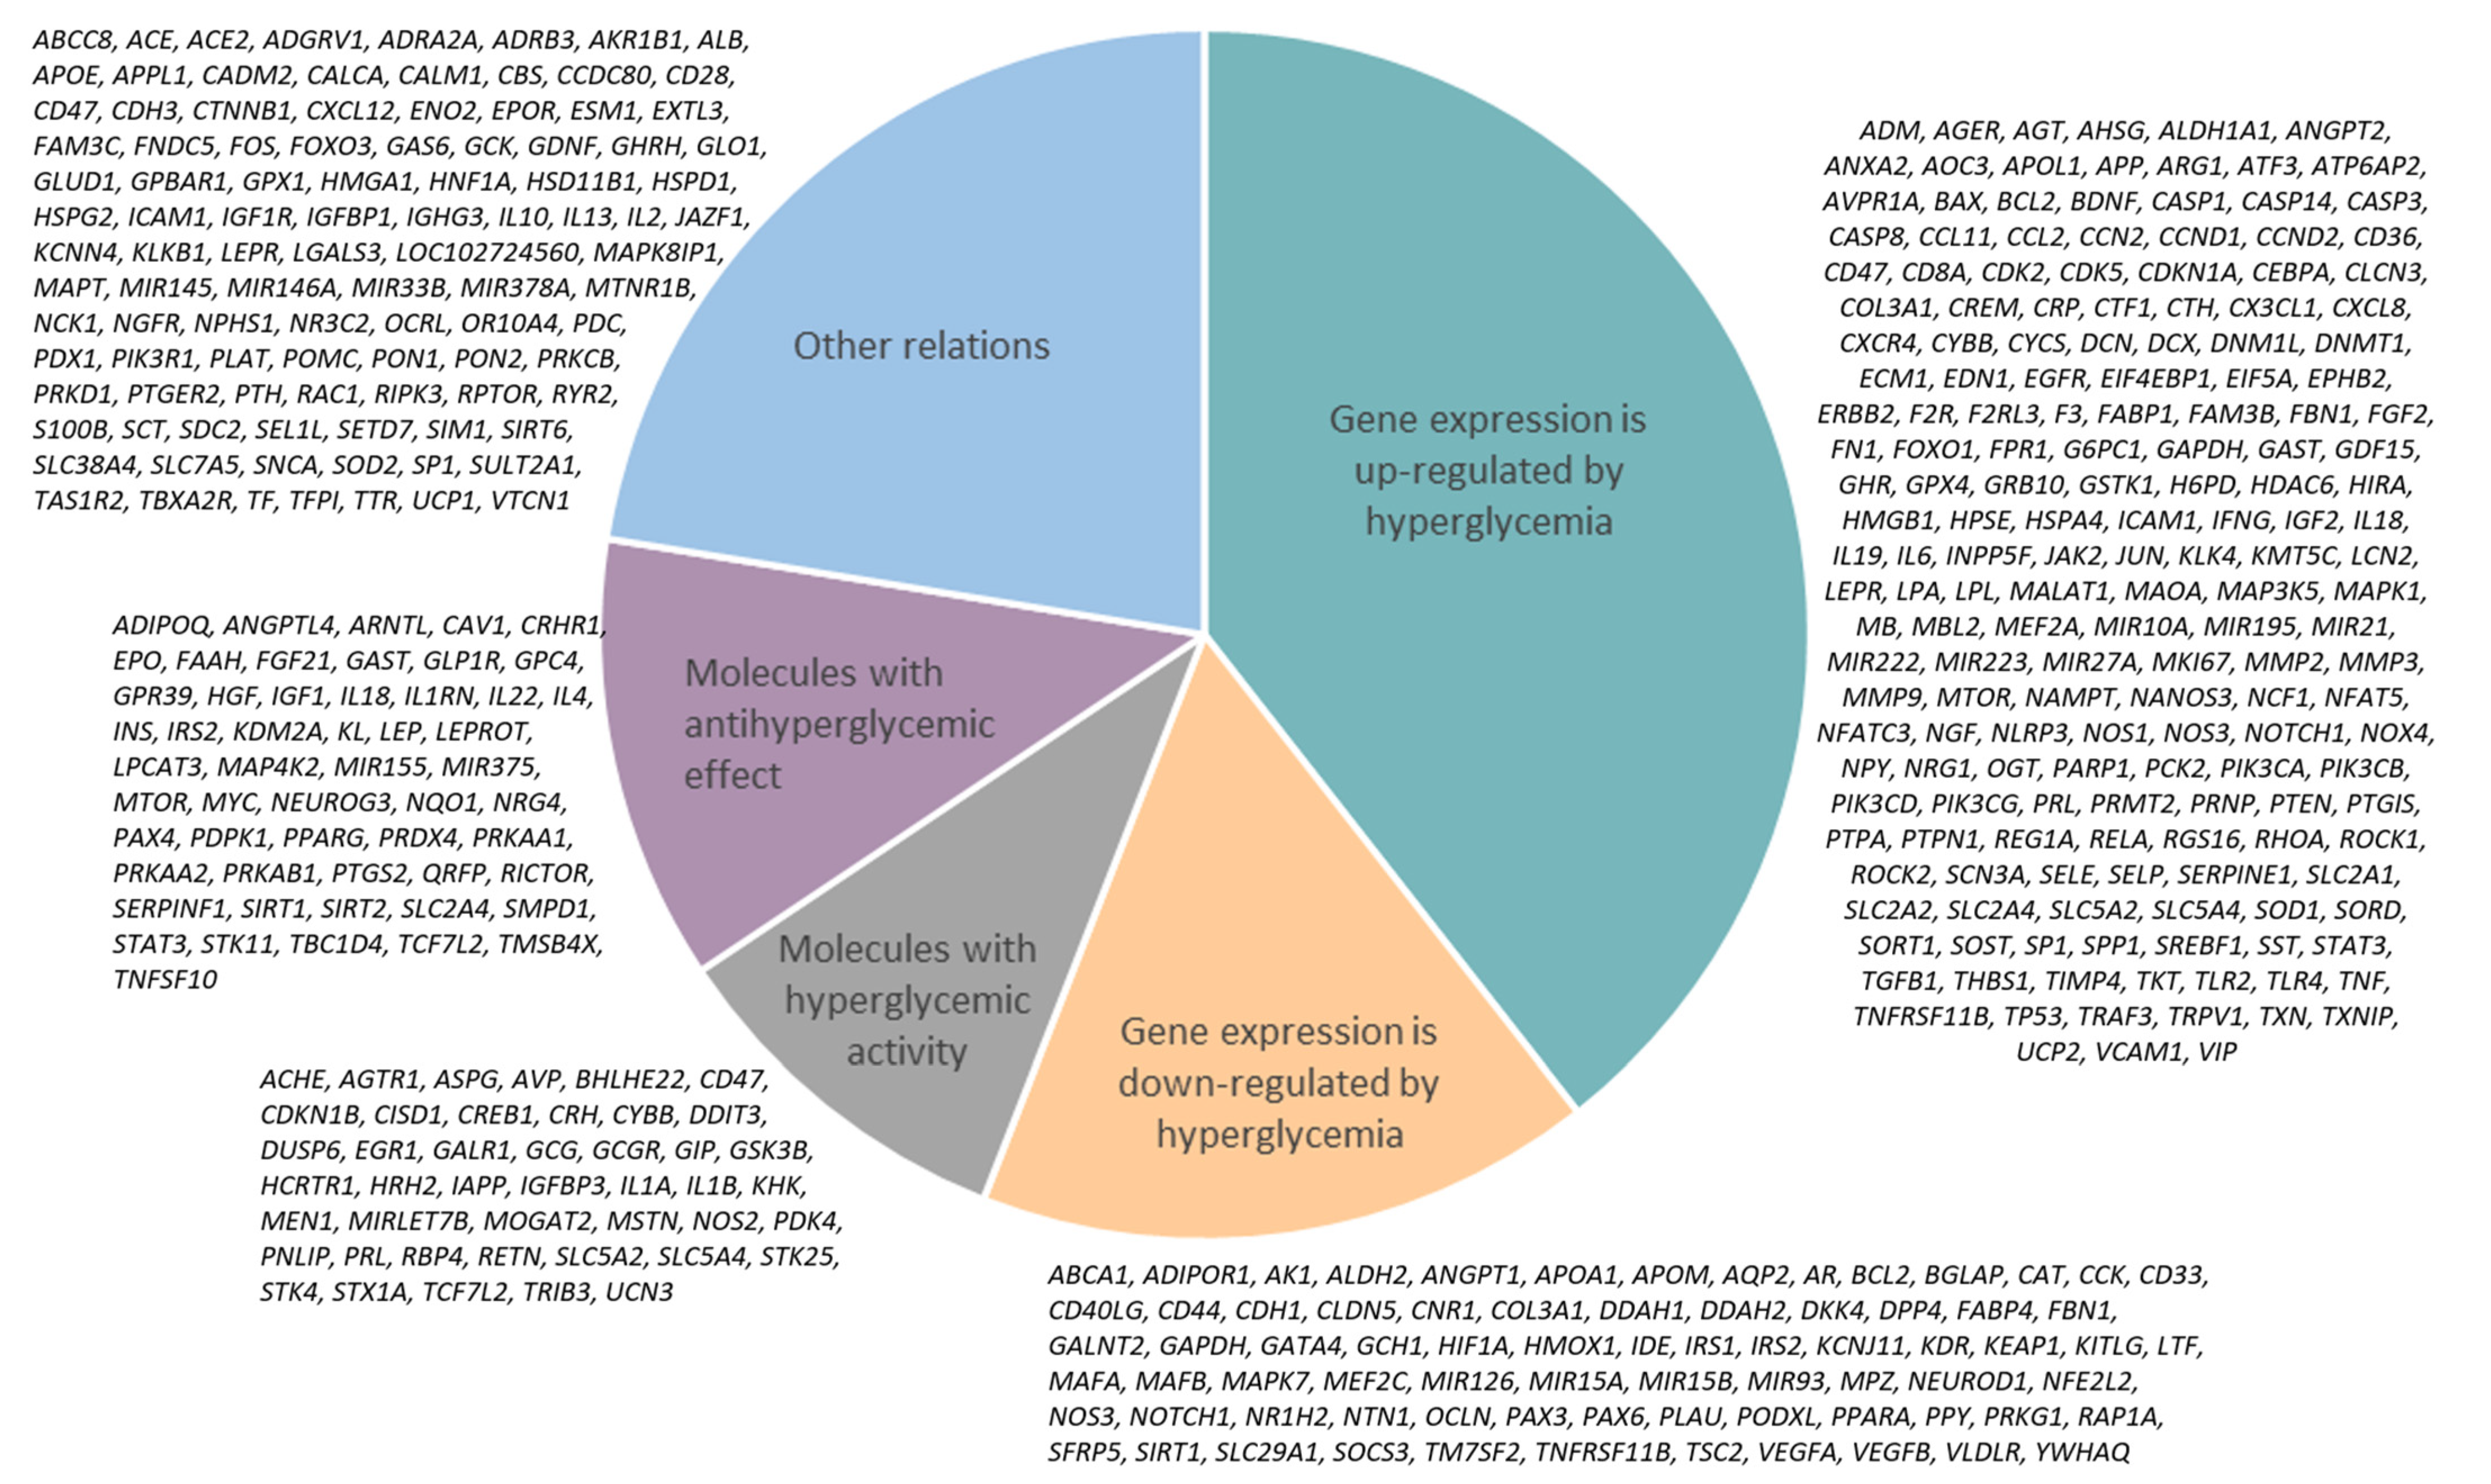
2.1. Network Associated with Hyperglycemia
2.2. Networks Associated with Diabetic Complications, Insulin Resistance, and Beta-Cell Dysfunction
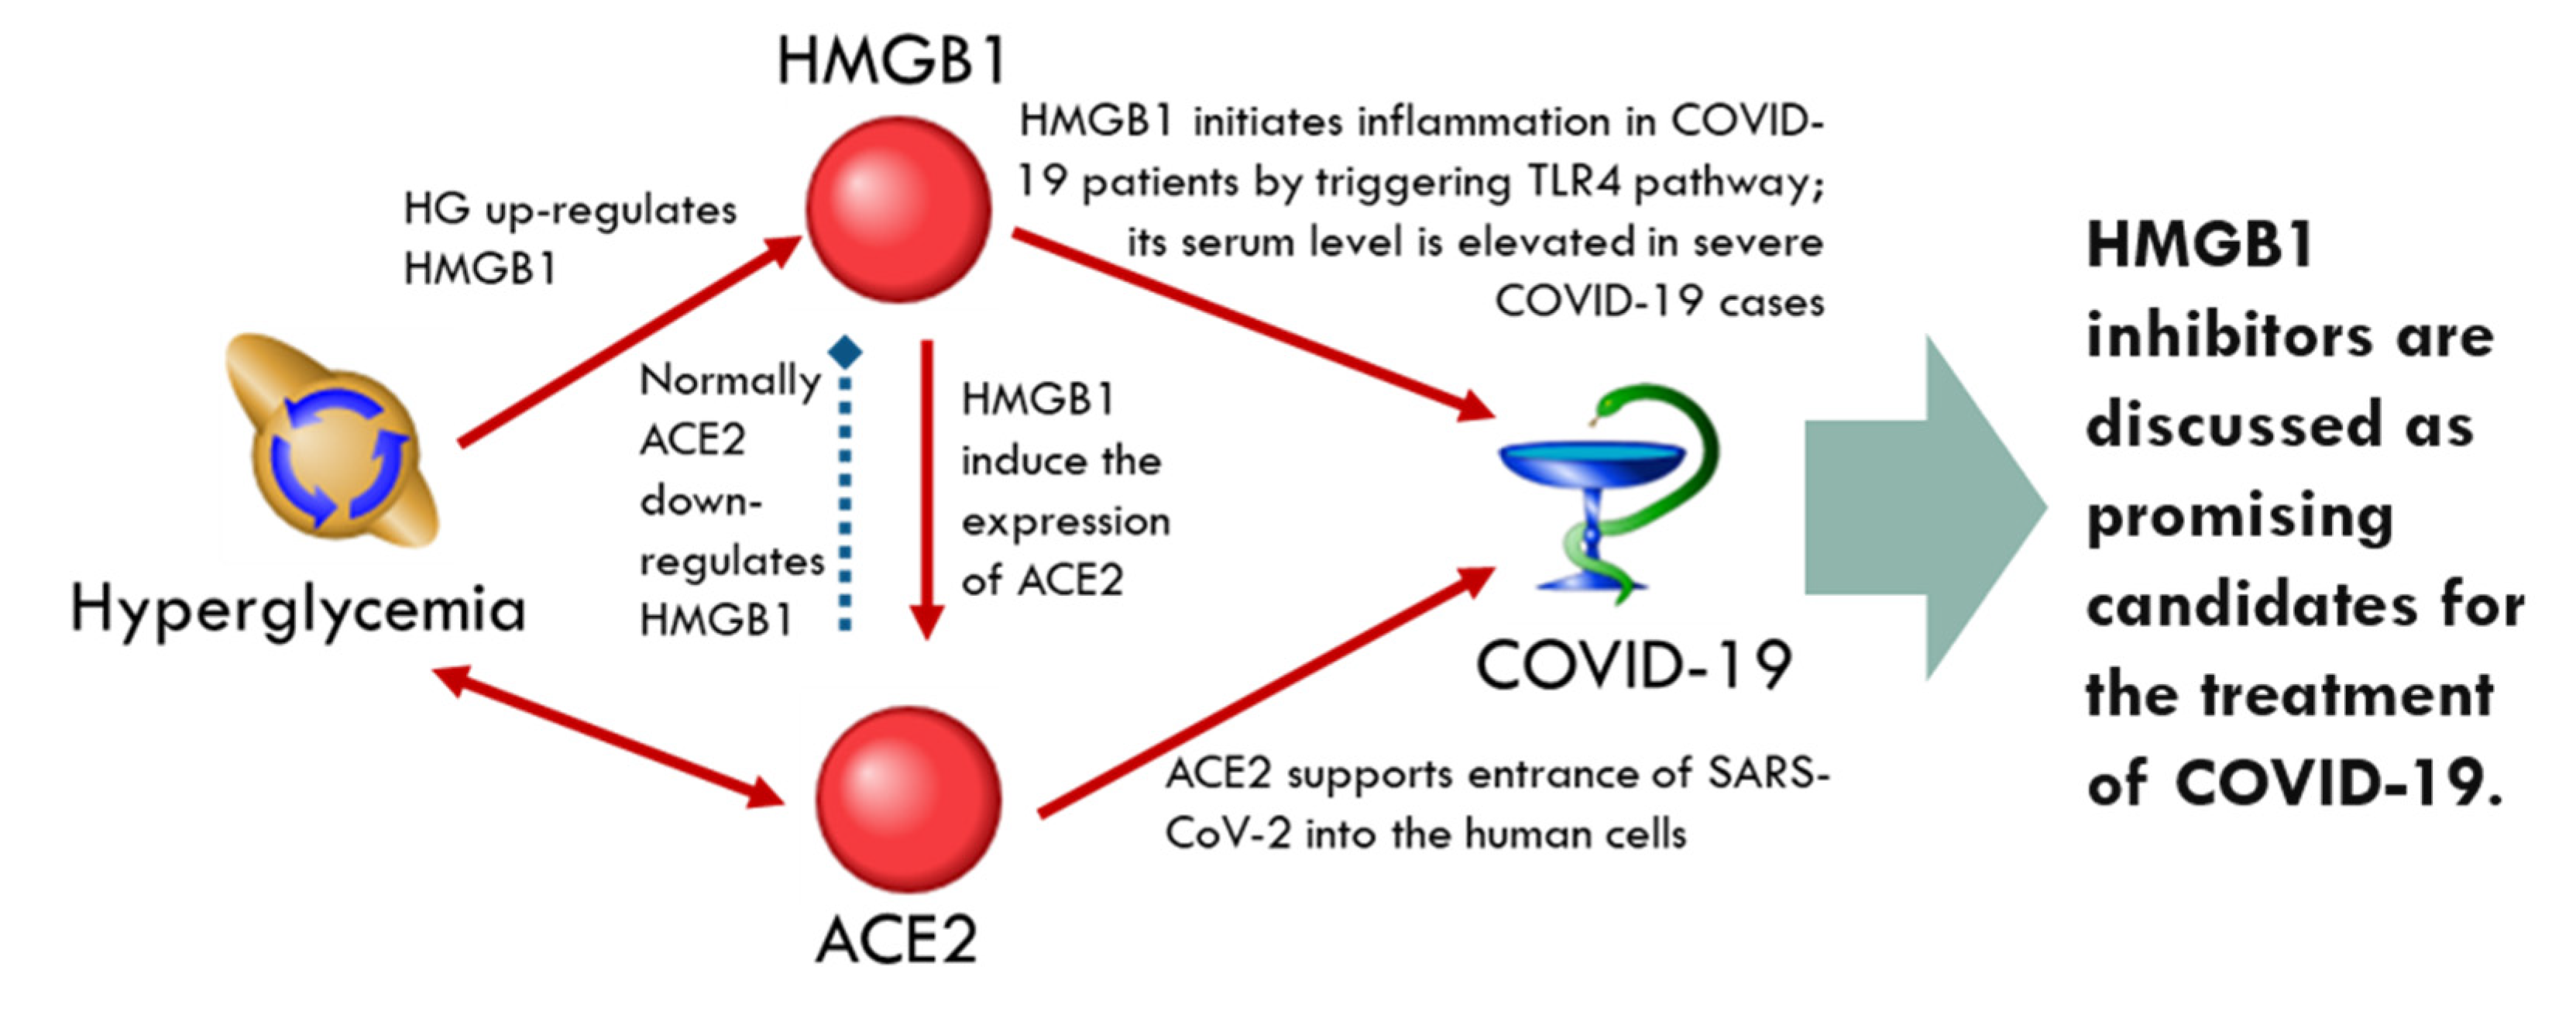
2.3. Networks of Human Proteins Related to SARS-CoV-2
2.3.1. SARS-CoV-2 Entry Receptors
ACE2-Related Network
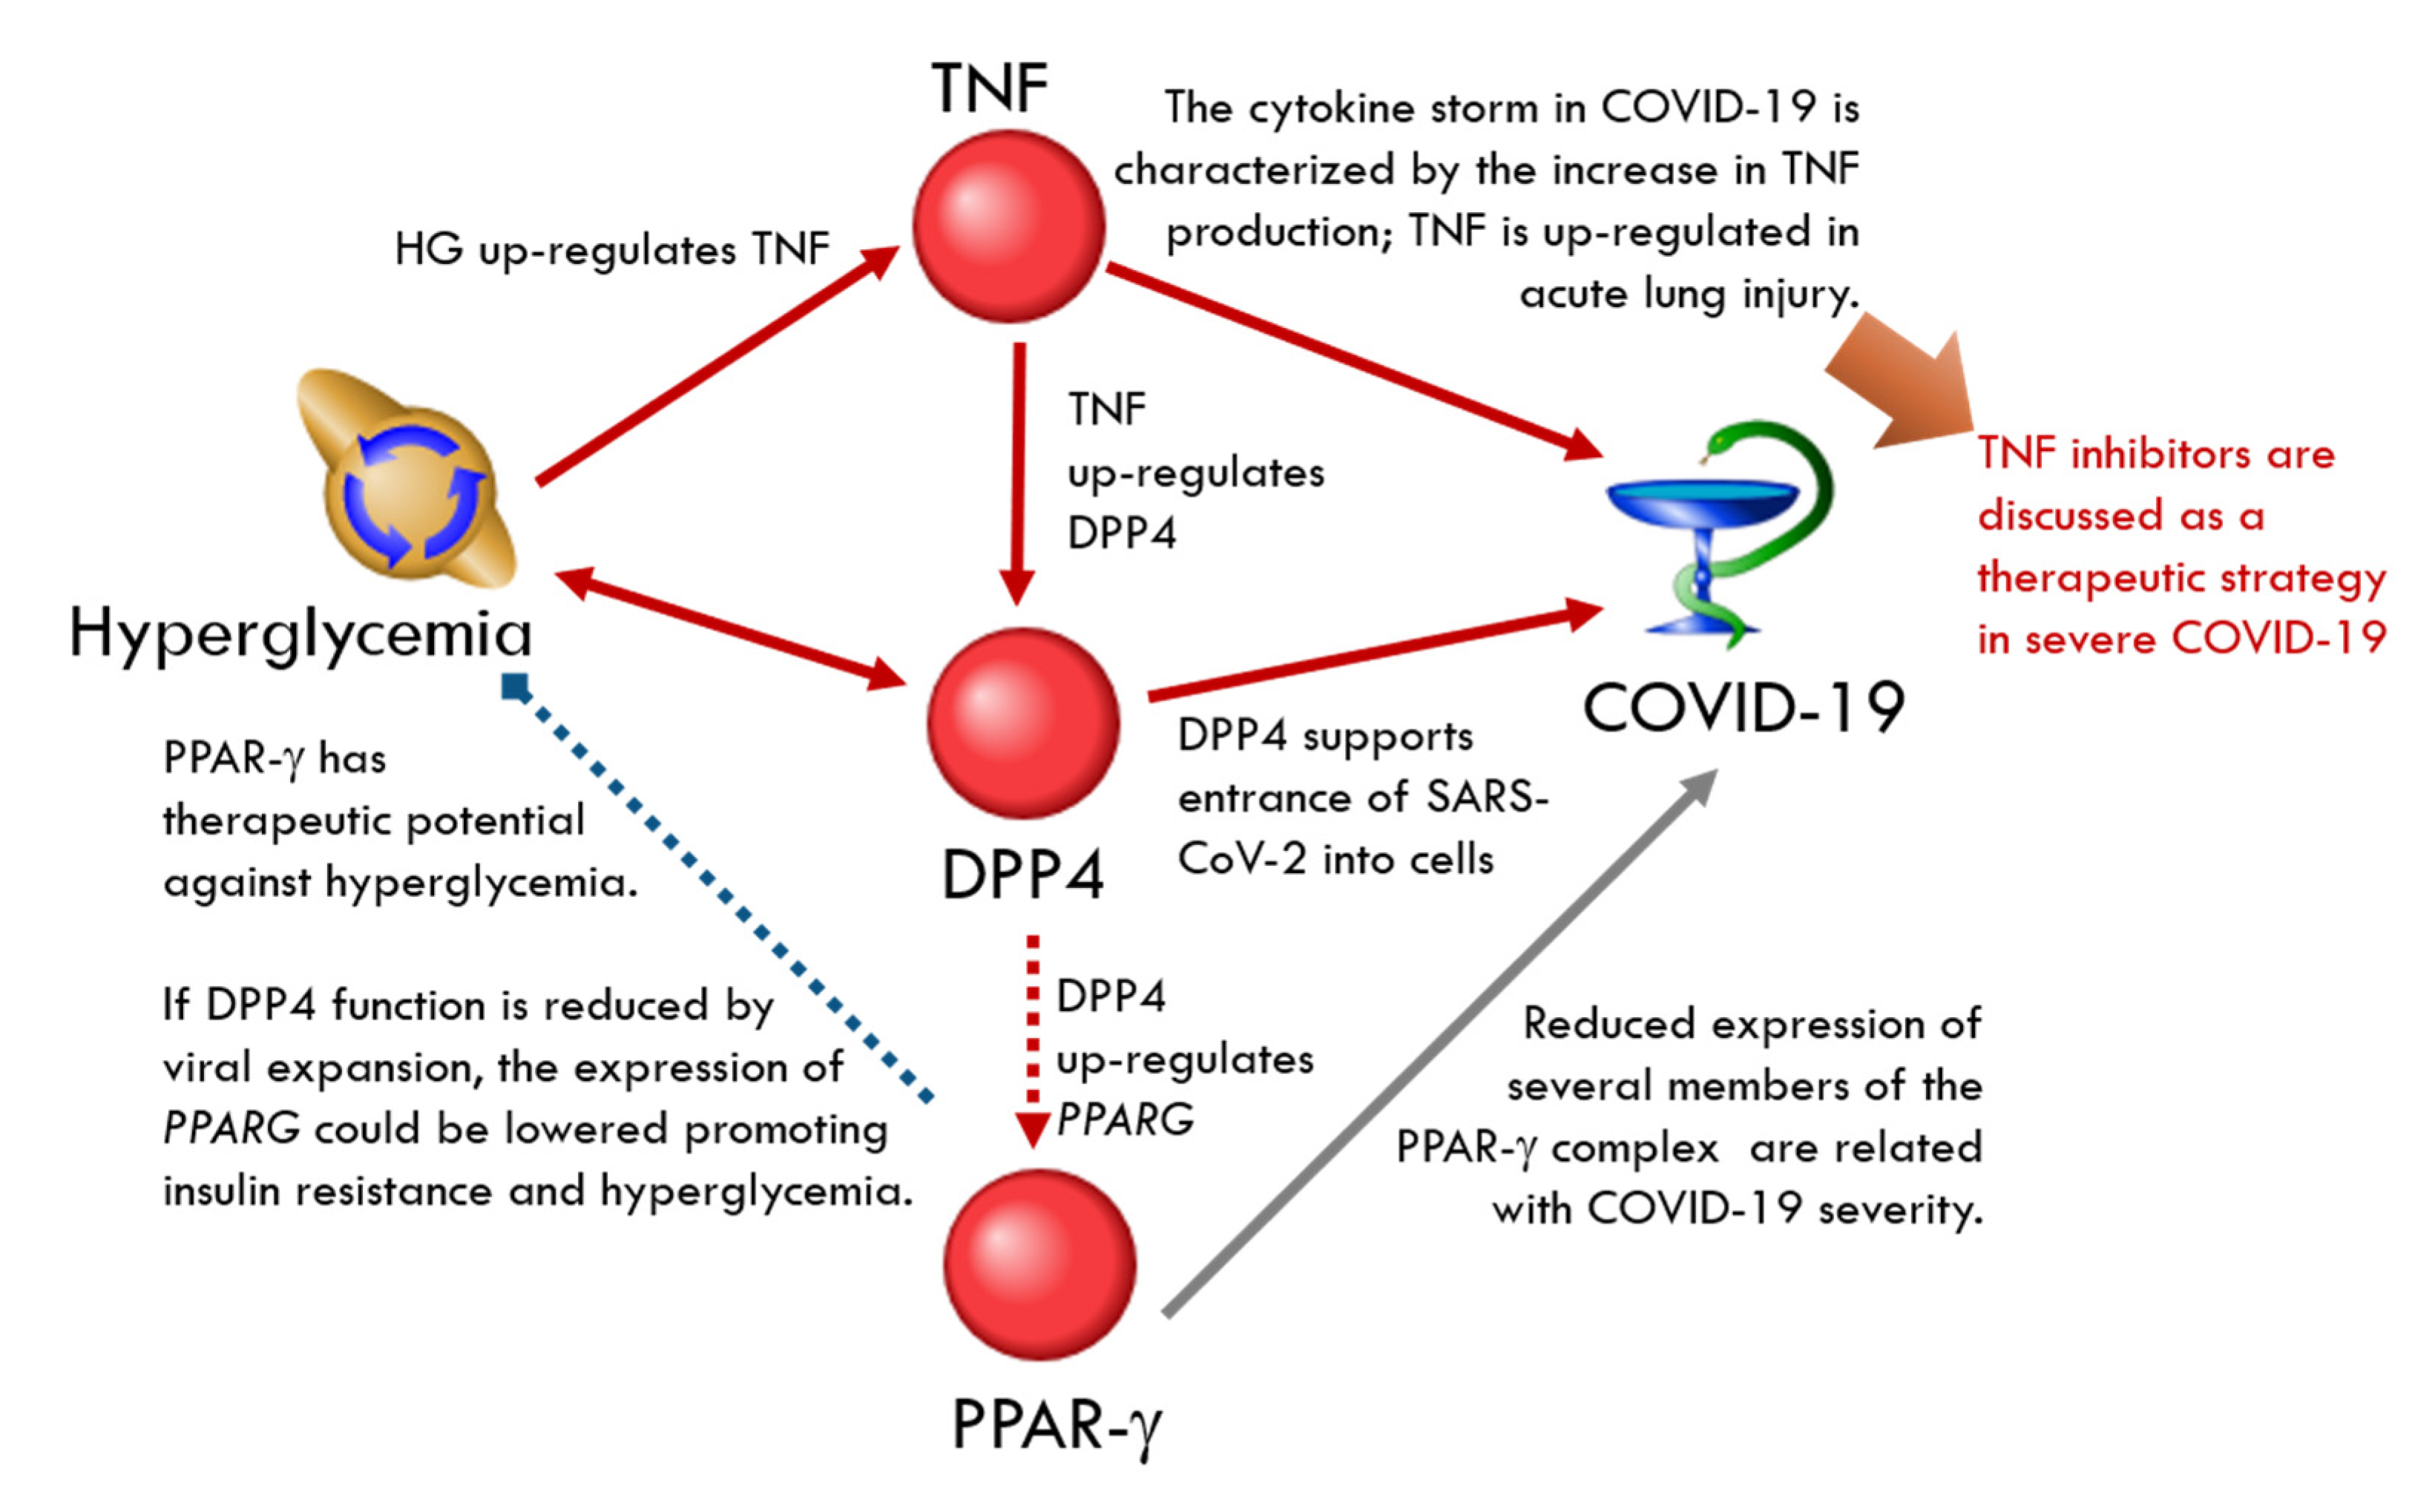
DPP4-Related Network
2.3.2. SARS-CoV-2 Entry-Associated Protease Receptors
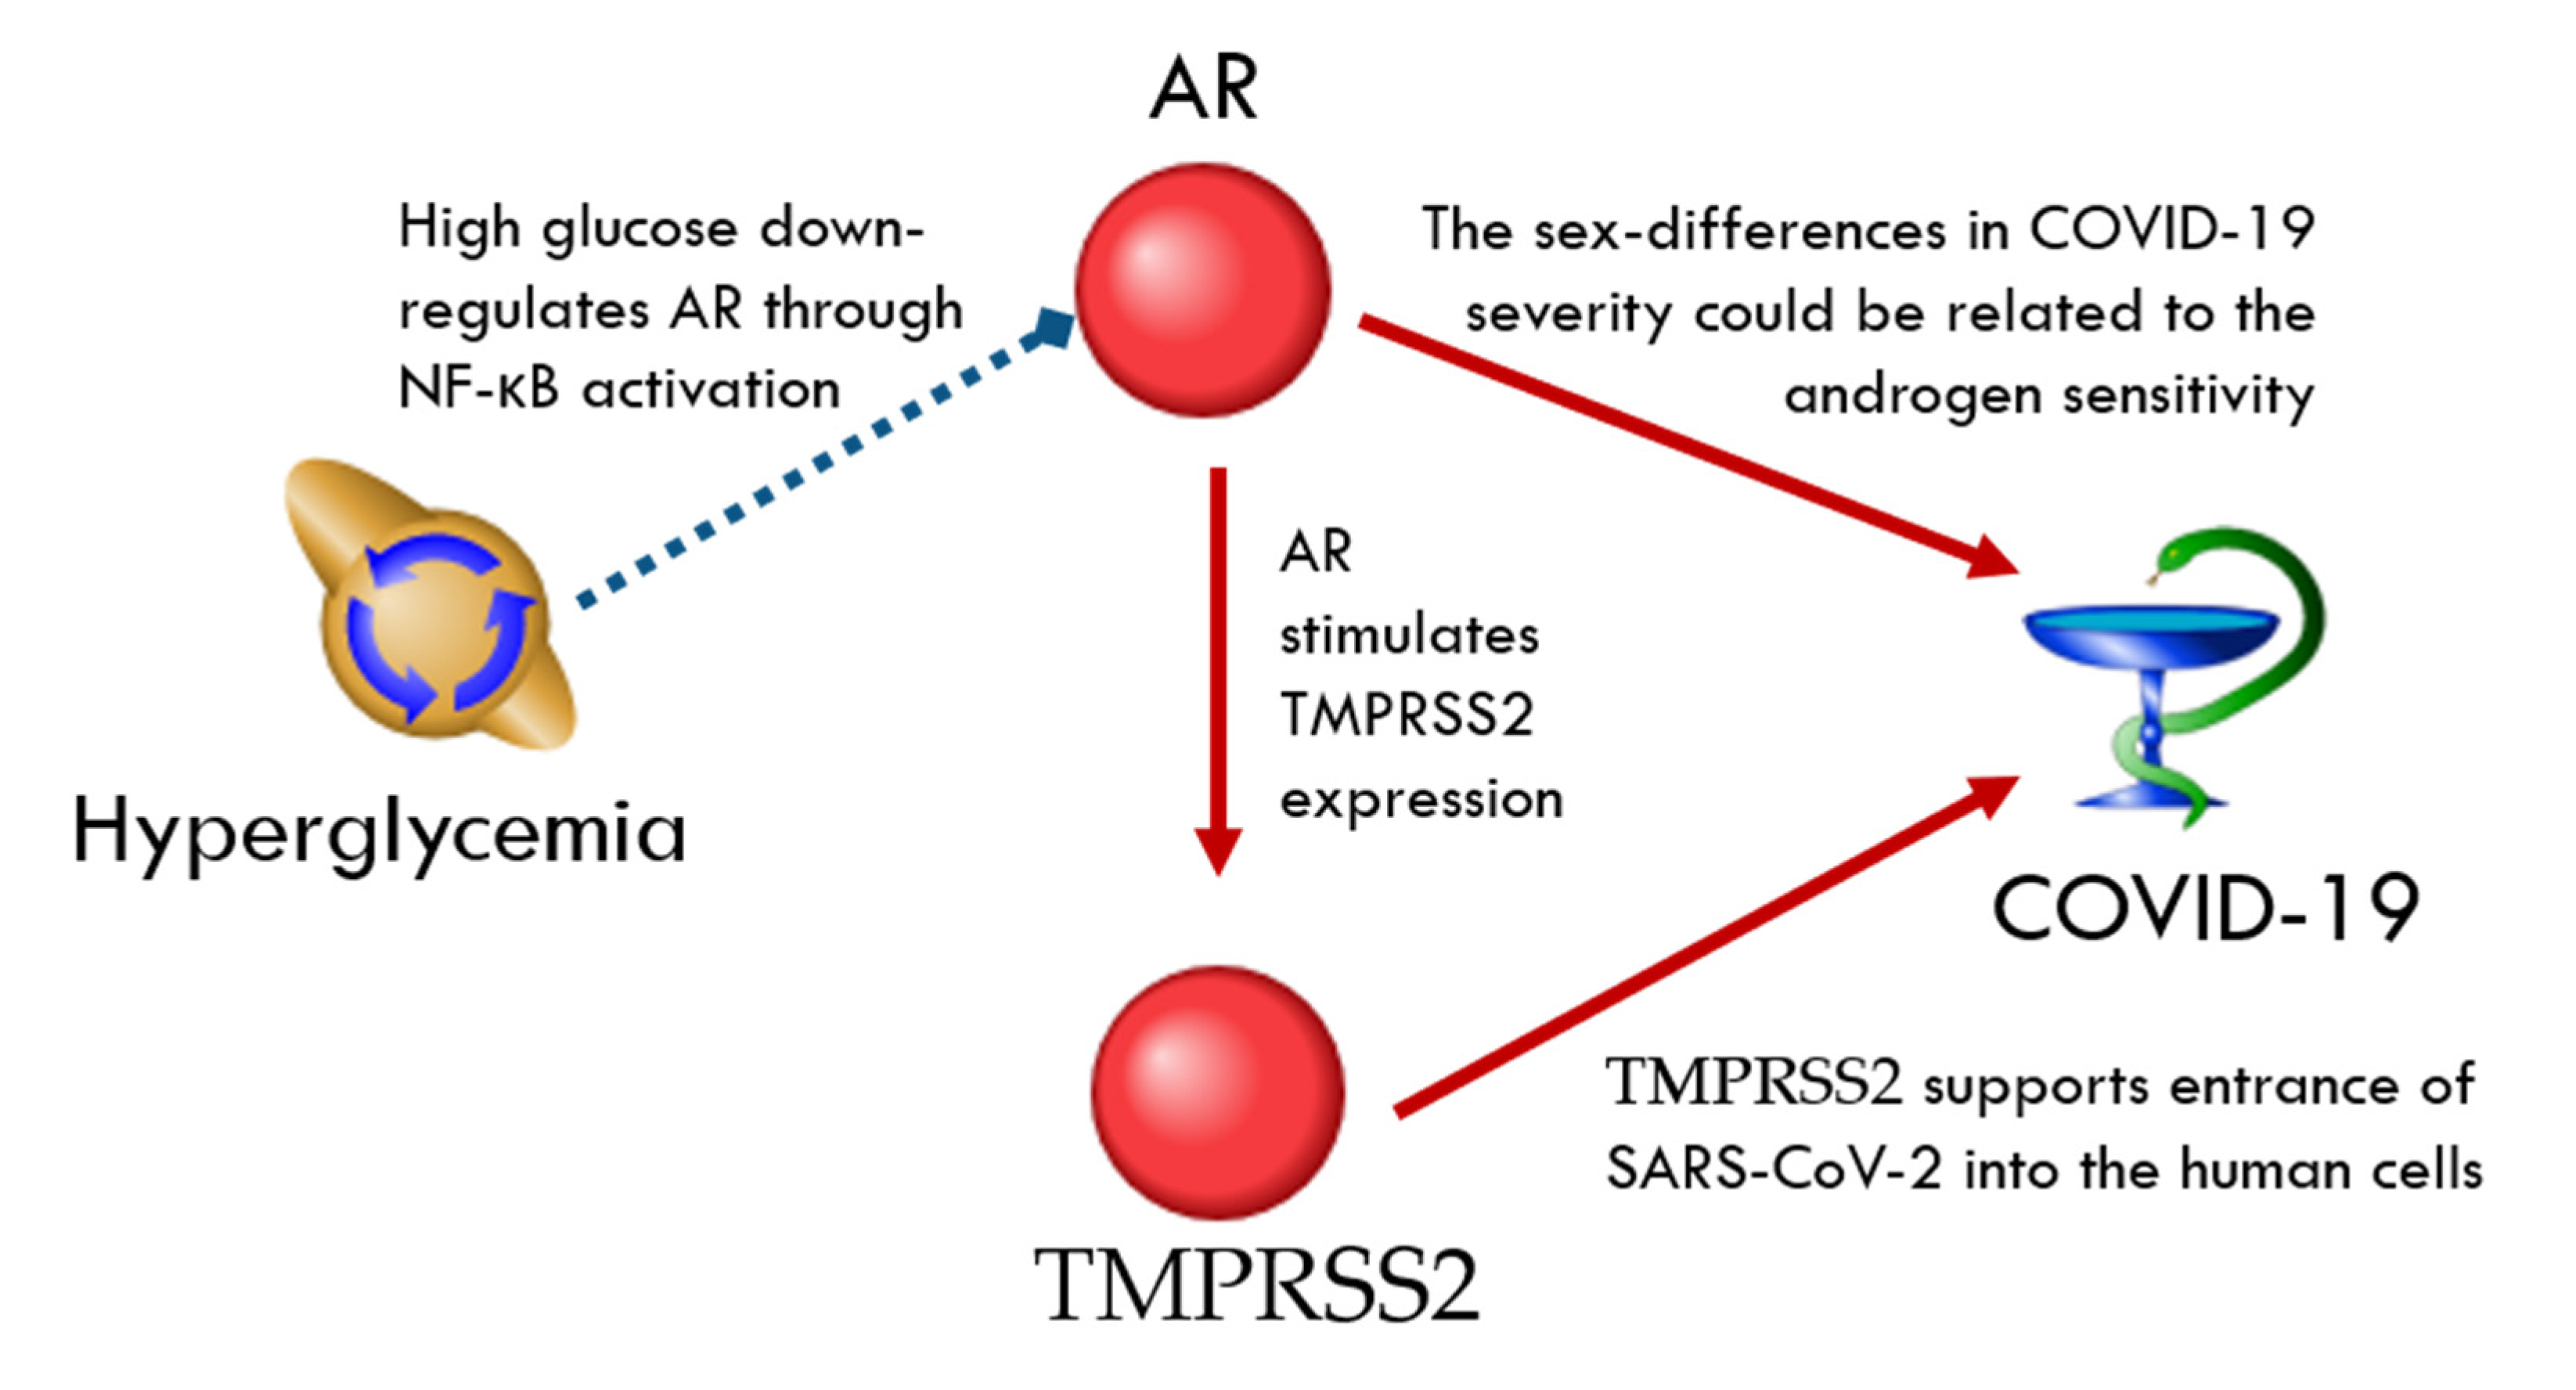
TMPRSS2-Related Network
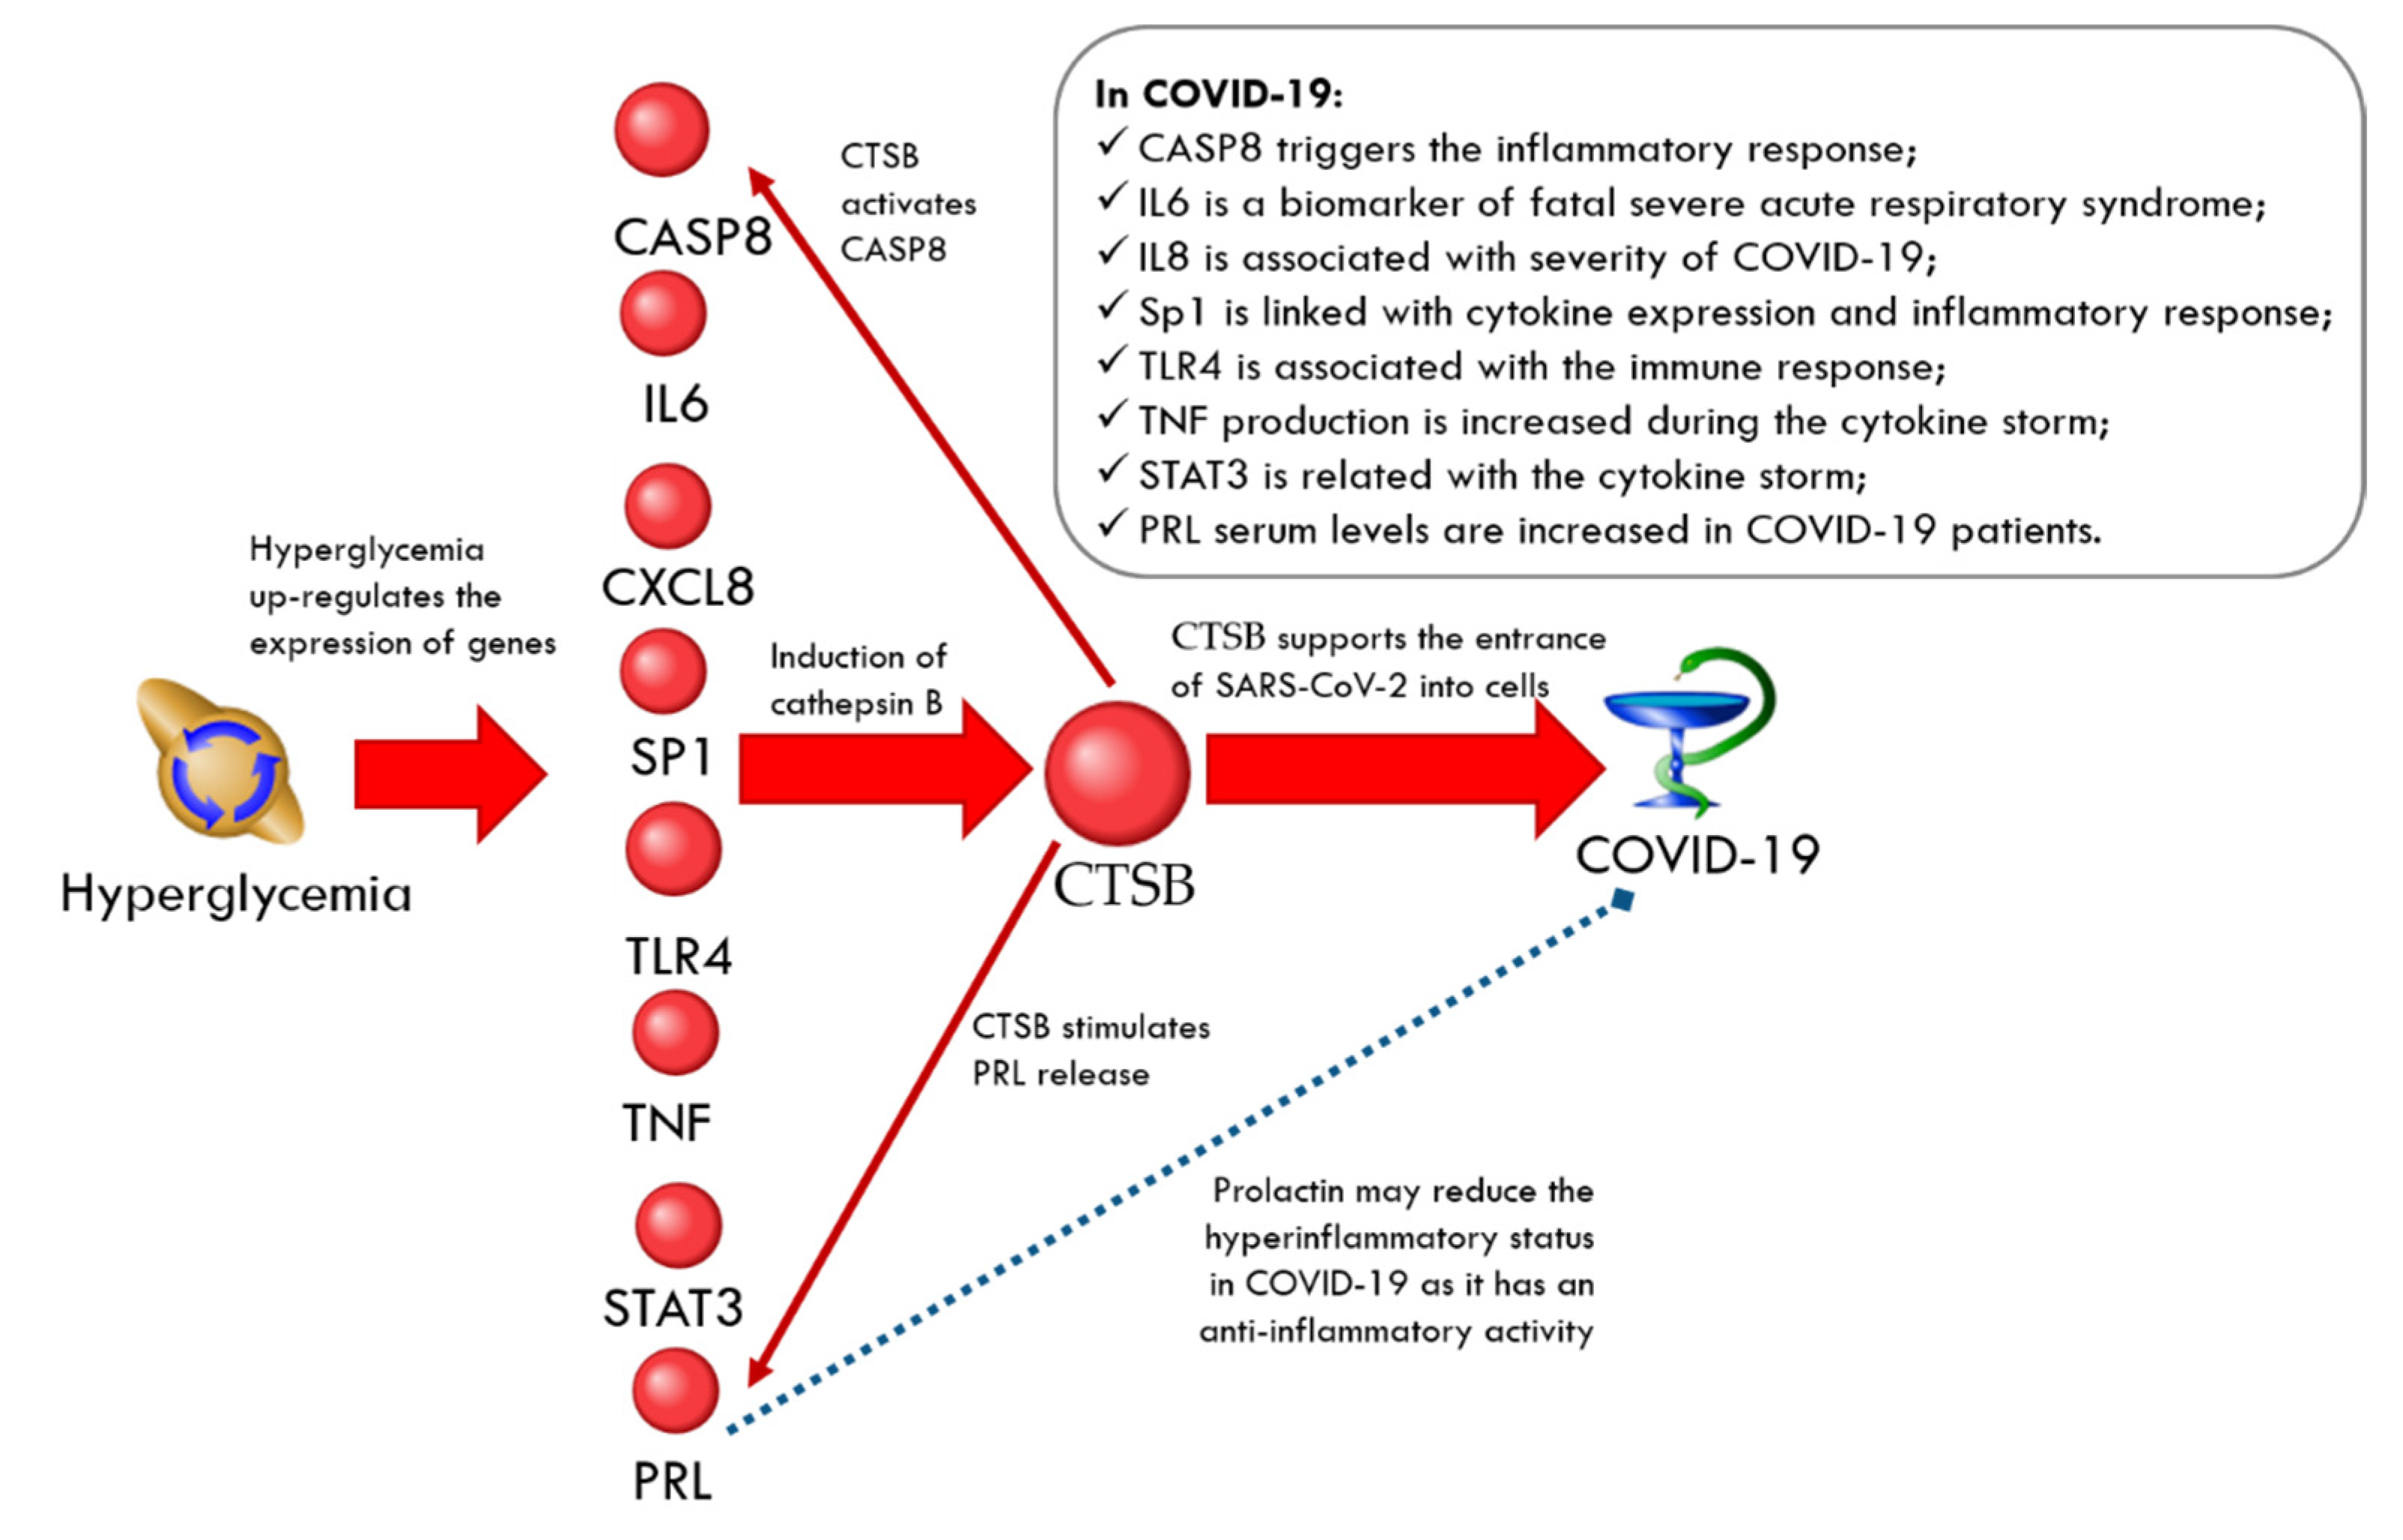
CTSB-Related Network
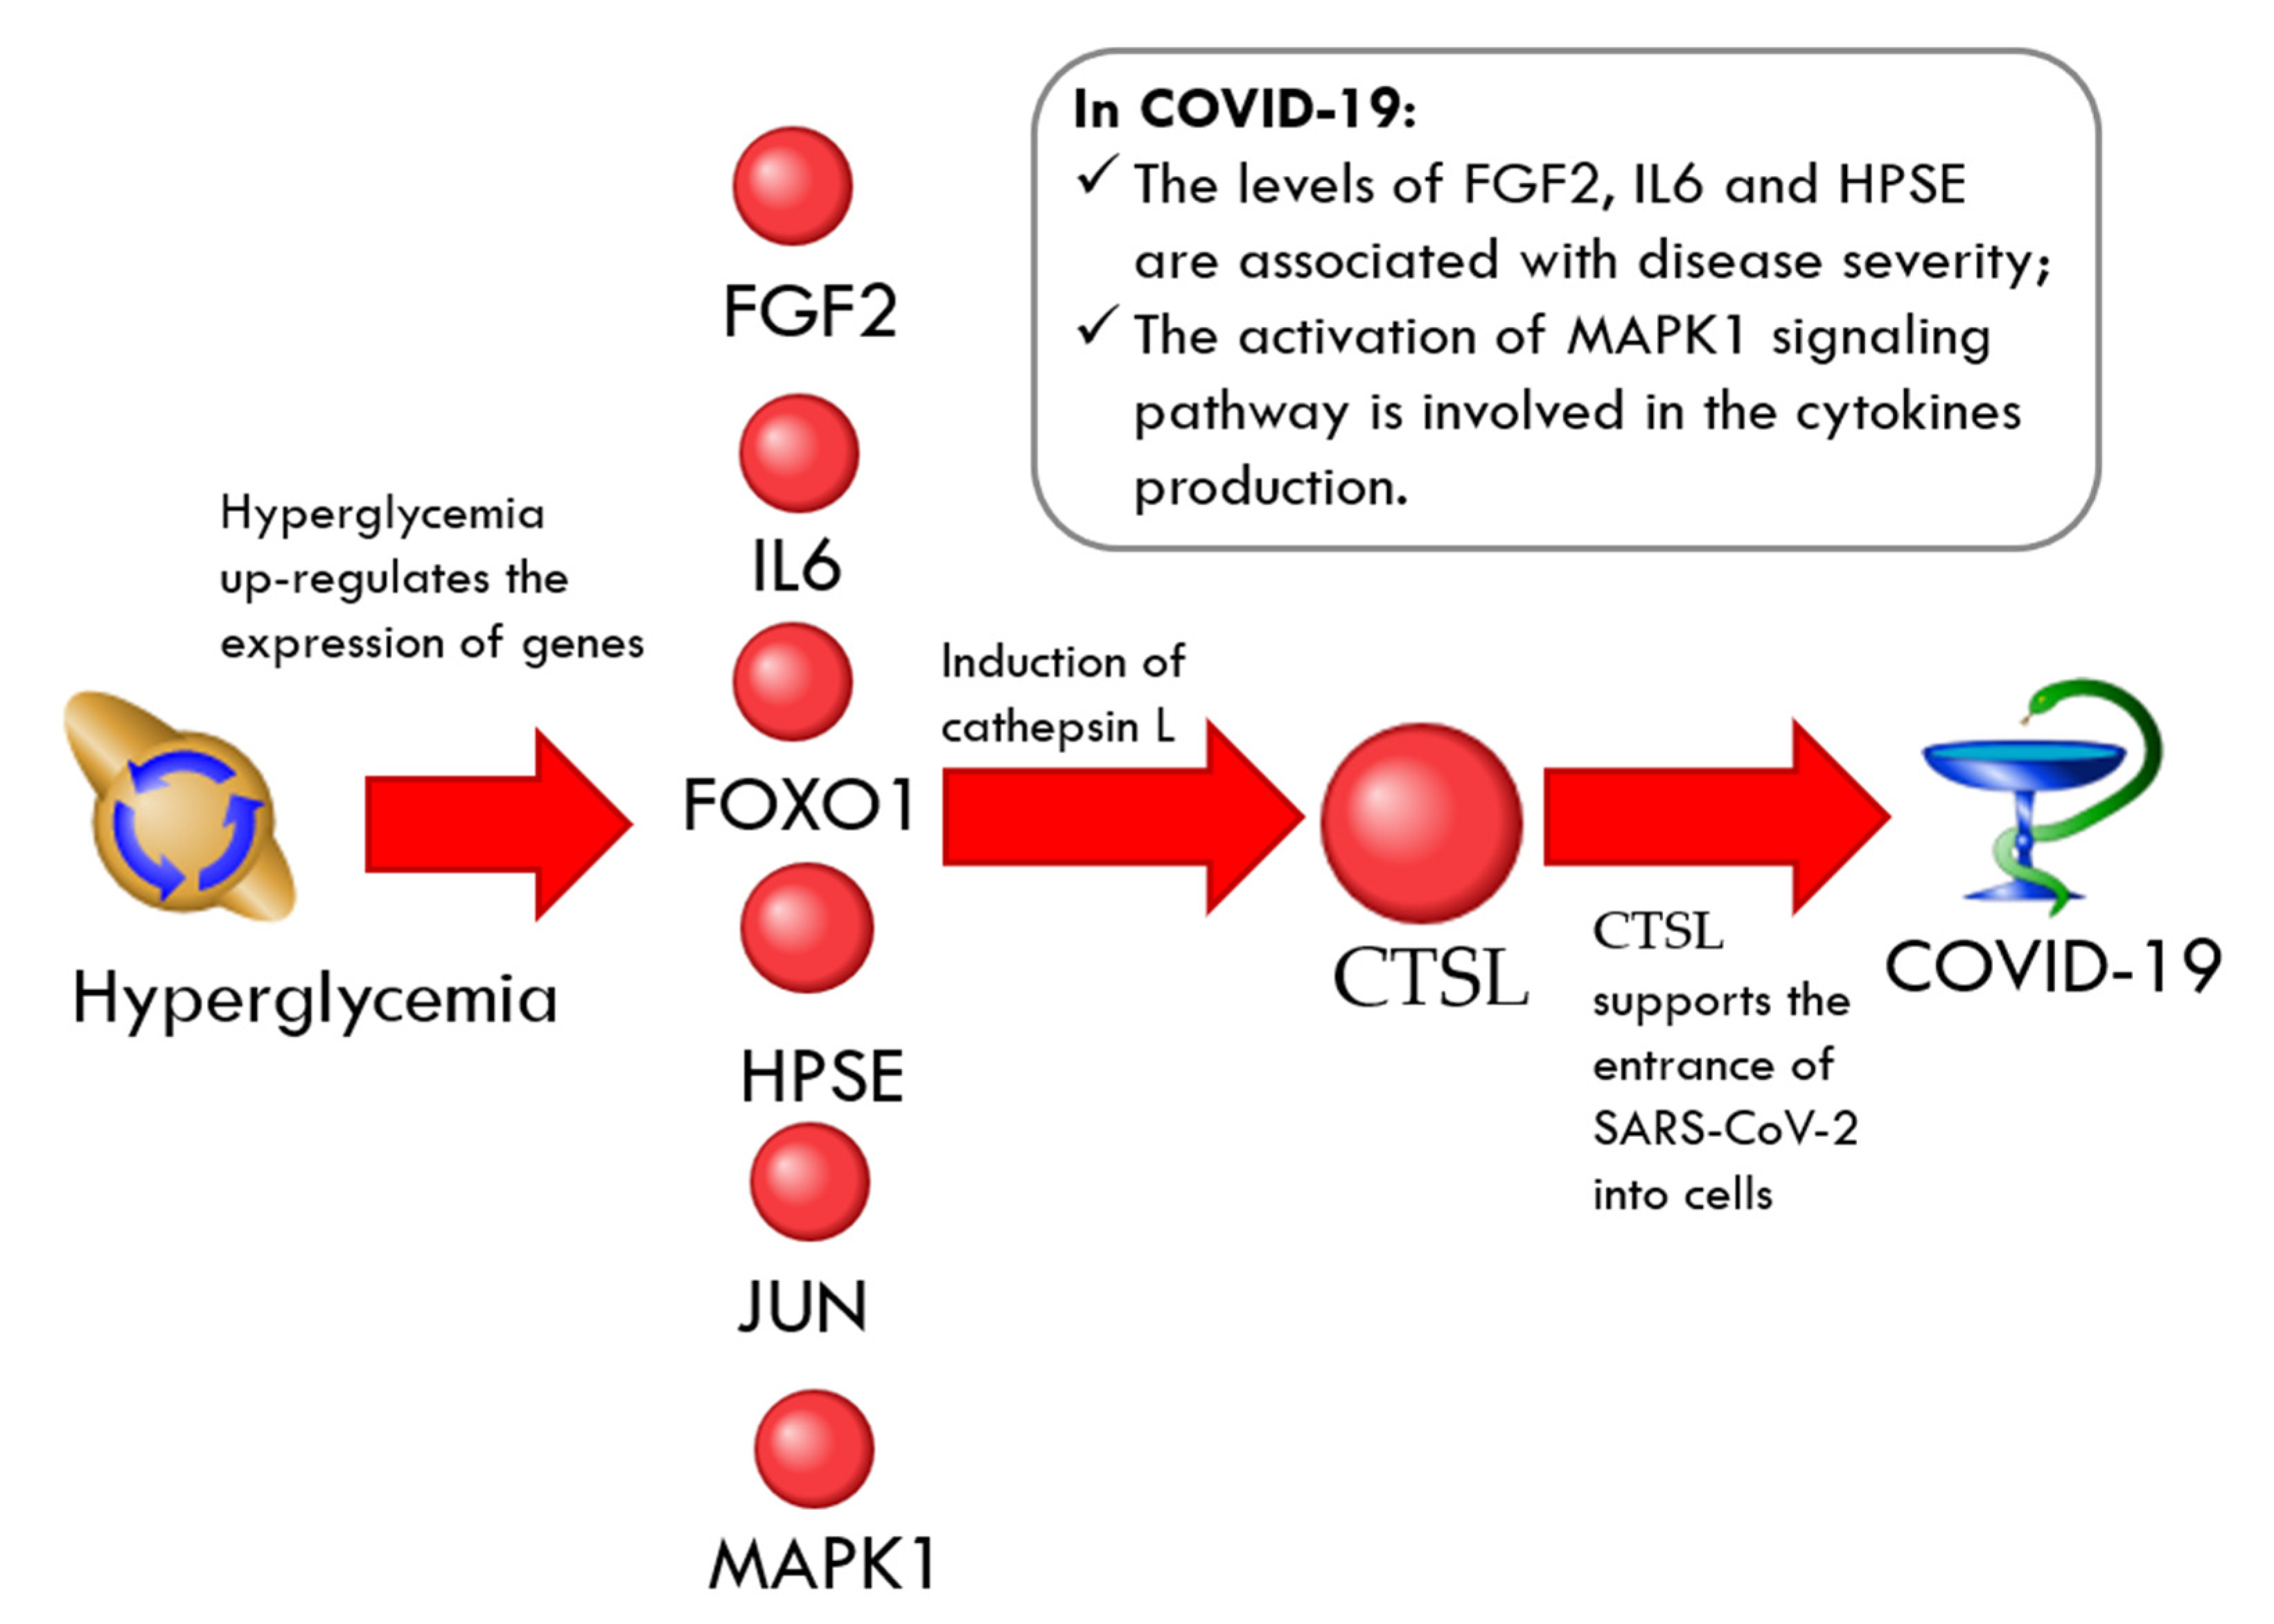
CTSL-Related Network
2.3.3. Intracellular Proteins Targeted by SARS-CoV-2
Network of Intracellular Proteins Targeted by SARS-CoV-2
Comparative Analysis of the Network of Hyperglycemia and Network of Human Proteins Targeted by SARS-CoV-2
Comparative Analysis of the Networks of Diabetic Complications and Network of Human Proteins Targeted by SARS-CoV-2
Comparative Analysis of the Networks of Insulin Resistance, Beta-Cell Dysfunction, and Human Proteins Targeted by SARS-CoV-2
2.4. Discussion
2.5. Study Limitations
3. Materials and Methods
4. Conclusions
Supplementary Materials
Author Contributions
Funding
Institutional Review Board Statement
Informed Consent Statement
Data Availability Statement
Acknowledgments
Conflicts of Interest
Abbreviations
| ACE | Angiotensin-converting enzyme |
| AR | Androgen receptor |
| CTS | Crosstalk specificity |
| CTSB | Cathepsin B |
| CTSL | Cathepsin L |
| CVD | Cardiovascular disease |
| DPP-4 | Dipeptidyl peptidase-4 |
| EGF | Epidermal growth factor |
| ERK | Extracellular signal-regulated kinase |
| GDF15 | Growth differentiation factor 15 |
| GO | Gene ontology |
| GPX1 | Glutathione peroxidase 1 |
| HG | High glucose |
| HMGB1 | High-mobility group protein B1 |
| HO-1 | Heme oxygenase 1 |
| IDF | Insulin-degrading enzyme |
| MAPK | Mitogen-activated protein kinase |
| PPARγ | Peroxisome proliferator-activated receptor gamma |
| RhoA | Ras homolog family member A |
| TGF-β | Transforming growth factor beta |
| TMPRSS2 | Transmembrane protease, serine 2 |
| TNF | Tumor necrosis factor |
| tPA | Tissue-type plasminogen activator |
| UCP2 | Uncoupling protein 2 |
References
- WHO Coronavirus (COVID-19) Dashboard. Available online: https://covid19.who.int/ (accessed on 30 May 2022).
- Buscemi, S.; Corleo, D.; Randazzo, C. Risk Factors for COVID-19: Diabetes, Hypertension, and Obesity. Adv. Exp. Med. Biol. 2021, 1353, 115–129. [Google Scholar] [CrossRef] [PubMed]
- Hartmann-Boyce, J.; Rees, K.; Perring, J.C.; Kerneis, S.A.; Morris, E.M.; Goyder, C.; Otunla, A.A.; James, O.A.; Syam, N.R.; Seidu, S.; et al. Risks of and from SARS-CoV-2 Infection and COVID-19 in People with Diabetes: A Systematic Review of Reviews. Diabetes Care 2021, 44, 2790–2811. [Google Scholar] [CrossRef] [PubMed]
- Prattichizzo, F.; de Candia, P.; Nicolucci, A.; Ceriello, A. Elevated HbA1c levels in pre-COVID-19 infection increases the risk of mortality: A sistematic review and meta-analysis. Diabetes Metab. Res. Rev. 2022, 38, e3476. [Google Scholar] [CrossRef] [PubMed]
- Zhu, Z.; Mao, Y.; Chen, G. Predictive value of HbA1c for in-hospital adverse prognosis in COVID-19: A systematic review and meta-analysis. Prim. Care Diabetes 2021, 15, 910–917. [Google Scholar] [CrossRef]
- Govender, N.; Khaliq, O.P.; Moodley, J.; Naicker, T. Insulin resistance in COVID-19 and diabetes. Prim. Care Diabetes 2021, 15, 629–634. [Google Scholar] [CrossRef]
- Abramczyk, U.; Nowaczyński, M.; Słomczyński, A.; Wojnicz, P.; Zatyka, P.; Kuzan, A. Consequences of COVID-19 for the Pancreas. Int. J. Mol. Sci. 2022, 23, 864. [Google Scholar] [CrossRef]
- Feldman, E.L.; Savelieff, M.G.; Hayek, S.S.; Pennathur, S.; Kretzler, M.; Pop-Busui, R. COVID-19 and Diabetes: A Collision and Collusion of Two Diseases. Diabetes 2020, 69, 2549–2565. [Google Scholar] [CrossRef]
- National Institute for Health and Care Excellence (NICE). COVID-19 Rapid Guideline: Managing the Long-Term Effects of COVID-19; NICE: London, UK, 2020. [Google Scholar]
- Michelen, M.; Manoharan, L.; Elkheir, N.; Cheng, V.; Dagens, A.; Hastie, C.; O’Hara, M.; Suett, J.; Dahmash, D.; Bugaeva, P.; et al. Characterising long COVID: A living systematic review. BMJ Glob. Health 2021, 6, e005427. [Google Scholar] [CrossRef]
- Fernández-de-Las-Peñas, C.; Guijarro, C.; Torres-Macho, J.; Velasco-Arribas, M.; Plaza-Canteli, S.; Hernández-Barrera, V.; Arias-Navalón, J.A. Diabetes and the Risk of Long-term Post-COVID Symptoms. Diabetes 2021, 70, 2917–2921. [Google Scholar] [CrossRef]
- Raveendran, A.V.; Misra, A. Post COVID-19 Syndrome (“Long COVID”) and Diabetes: Challenges in Diagnosis and Management. Diabetes Metab. Syndr. 2021, 15, 102235. [Google Scholar] [CrossRef]
- Østergaard, L. SARS-CoV-2 related microvascular damage and symptoms during and after COVID-19: Consequences of capillary transit-time changes, tissue hypoxia and inflammation. Physiol. Rep. 2021, 9, e14726. [Google Scholar] [CrossRef]
- Mohiuddin Chowdhury, A.T.M.; Karim, M.R.; Ali, M.A.; Islam, J.; Li, Y.; He, S. Clinical Characteristics and the Long-Term Post-recovery Manifestations of the COVID-19 Patients-A Prospective Multicenter Cross-Sectional Study. Front. Med. 2021, 8, 663670. [Google Scholar] [CrossRef]
- Uhlén, M.; Fagerberg, L.; Hallström, B.M.; Lindskog, C.; Oksvold, P.; Mardinoglu, A.; Sivertsson, Å.; Kampf, C.; Sjöstedt, E.; Asplund, A.; et al. Tissue-based map of the human proteome. Science 2015, 347, 1260419. [Google Scholar] [CrossRef]
- Vargas-Rodriguez, J.R.; Garza-Veloz, I.; Flores-Morales, V.; Badillo-Almaraz, J.I.; Rocha-Pizaña, M.R.; Valdés-Aguayo, J.J.; Martinez-Fierro, M.L. Hyperglycemia and Angiotensin-Converting Enzyme 2 in Pulmonary Function in the Context of SARS-CoV-2 Infection. Front. Med. 2022, 8, 758414. [Google Scholar] [CrossRef]
- Gao, Q.; Zhang, W.; Li, T.; Yang, G.; Zhu, W.; Chen, N.; Jin, H. Interrelationship between 2019-nCov receptor DPP4 and diabetes mellitus targets based on protein interaction network. Sci. Rep. 2022, 12, 188. [Google Scholar] [CrossRef]
- Hoffmann, M.; Kleine-Weber, H.; Schroeder, S.; Krüger, N.; Herrler, T.; Erichsen, S.; Schiergens, T.S.; Herrler, G.; Wu, N.H.; Nitsche, A.; et al. SARS-CoV-2 cell entry depends on ACE2 and TMPRSS2 and is blocked by a clinically proven protease inhibitor. Cell 2020, 181, 271–280. [Google Scholar] [CrossRef]
- Padmanabhan, P.; Desikan, R.; Dixit, N.M. Targeting TMPRSS2 and Cathepsin B/L together may be synergistic against SARS-CoV-2 infection. PLoS Comput. Biol. 2020, 16, e1008461. [Google Scholar] [CrossRef]
- Zhao, M.M.; Yang, W.L.; Yang, F.Y.; Zhang, L.; Huang, W.J.; Hou, W.; Fan, C.F.; Jin, R.H.; Feng, Y.M.; Wang, Y.C.; et al. Cathepsin L plays a key role in SARS-CoV-2 infection in humans and humanized mice and is a promising target for new drug development. Signal Transduct. Target. Ther. 2021, 6, 134. [Google Scholar] [CrossRef]
- Gordon, D.E.; Jang, G.M.; Bouhaddou, M.; Xu, J.; Obernier, K.; White, K.M.; O’Meara, M.J.; Rezelj, V.V.; Guo, J.Z.; Swaney, D.L.; et al. A SARS-CoV-2 protein interaction map reveals targets for drug repurposing. Nature 2020, 583, 459–468. [Google Scholar] [CrossRef]
- Farina, L. Network as a language for precision medicine. Ann. Dell’istituto Super. Sanità 2021, 57, 330–342. [Google Scholar]
- Ivanisenko, V.A.; Saik, O.V.; Ivanisenko, N.V.; Tiys, E.S.; Ivanisenko, T.V.; Demenkov, P.S.; Kolchanov, N.A. ANDSystem: An Associative Network Discovery System for automated literature mining in the field of biology. BMC Syst. Biol. 2015, 9 (Suppl. S2), S2. [Google Scholar] [CrossRef] [Green Version]
- Ivanisenko, V.A.; Demenkov, P.S.; Ivanisenko, T.V.; Mishchenko, E.L.; Saik, O.V. A new version of the ANDSystem tool for automatic extraction of knowledge from scientific publications with expanded functionality for reconstruction of associative gene networks by considering tissue-specific gene expression. BMC Bioinform. 2019, 20 (Suppl. S1), 34. [Google Scholar] [CrossRef]
- Saik, O.V.; Demenkov, P.S.; Ivanisenko, T.V.; Bragina, E.Y.; Freidin, M.B.; Goncharova, I.A.; Dosenko, V.E.; Zolotareva, O.I.; Hofestaedt, R.; Lavrik, I.N.; et al. Novel candidate genes important for asthma and hypertension comorbidity revealed from associative gene networks. BMC Med. Genom. 2018, 11 (Suppl. S1), 15. [Google Scholar] [CrossRef] [Green Version]
- Saik, O.V.; Nimaev, V.V.; Usmonov, D.B.; Demenkov, P.S.; Ivanisenko, T.V.; Lavrik, I.N.; Ivanisenko, V.A. Prioritization of genes involved in endothelial cell apoptosis by their implication in lymphedema using an analysis of associative gene networks with ANDSystem. BMC Med. Genom. 2019, 12 (Suppl. S2), 47. [Google Scholar] [CrossRef]
- Saik, O.V.; Klimontov, V.V. Bioinformatic Reconstruction and Analysis of Gene Networks Related to Glucose Variability in Diabetes and Its Complications. Int. J. Mol. Sci. 2020, 21, 8691. [Google Scholar] [CrossRef]
- Saik, O.V.; Klimontov, V.V. Hypoglycemia, Vascular Disease and Cognitive Dysfunction in Diabetes: Insights from Text Mining-Based Reconstruction and Bioinformatics Analysis of the Gene Networks. Int. J. Mol. Sci. 2021, 22, 12419. [Google Scholar] [CrossRef]
- Durón, C.; Pan, Y.; Gutmann, D.H.; Hardin, J.; Radunskaya, A. Variability of betweenness centrality and its effect on identifying essential genes. Bull. Math. Biol. 2019, 81, 3655–3673. [Google Scholar] [CrossRef]
- Klimontov, V.V.; Saik, O.V.; Korbut, A.I. Glucose variability: How does it work? Int. J. Mol. Sci. 2021, 22, 7783. [Google Scholar] [CrossRef]
- Friederich, M.; Olerud, J.; Fasching, A.; Liss, P.; Hansell, P.; Palm, F. Uncoupling protein-2 in diabetic kidneys: Increased protein expression correlates to increased non-transport related oxygen consumption. Adv. Exp. Med. Biol. 2008, 614, 37–43. [Google Scholar] [CrossRef]
- Noble, E.G.; Shen, G.X. Impact of exercise and metabolic disorders on heat shock proteins and vascular inflammation. Autoimmune Dis. 2012, 2012, 836519. [Google Scholar] [CrossRef] [Green Version]
- Zheng, Z.; Chen, H.; Ke, G.; Fan, Y.; Zou, H.; Sun, X.; Gu, Q.; Xu, X.; Ho, P.C. Protective Effect of Perindopril on Diabetic Retinopathy Is Associated with Decreased Vascular Endothelial Growth Factor–to–Pigment Epithelium–Derived Factor Ratio: Involvement of a Mitochondria–Reactive Oxygen Species Pathway. Diabetes 2009, 58, 954–964. [Google Scholar] [CrossRef] [PubMed] [Green Version]
- Zhang, C.Y.; Baffy, G.; Perret, P.; Krauss, S.; Peroni, O.; Grujic, D.; Hagen, T.; Vidal-Puig, A.J.; Boss, O.; Kim, Y.B.; et al. Uncoupling protein-2 negatively regulates insulin secretion and is a major link between obesity, β cell dysfunction, and type 2 diabetes. Cell 2001, 105, 745–755. [Google Scholar] [CrossRef] [Green Version]
- Andrews, R.C.; Herlihy, O.; Livingstone, D.E.; Andrew, R.; Walker, B.R. Abnormal cortisol metabolism and tissue sensitivity to cortisol in patients with glucose intolerance. J. Clin. Endocrinol. Metab. 2002, 87, 5587–5593. [Google Scholar] [CrossRef] [PubMed] [Green Version]
- Li, L.; Jiang, X.G.; Hu, J.Y.; Yu, Z.Q.; Xu, J.Y.; Liu, F.; Zhao, G.C.; Zhang, L.; Gu, H.M.; Zhang, S.J.; et al. The association between interleukin-19 concentration and diabetic nephropathy. BMC Nephrol. 2017, 18, 65. [Google Scholar] [CrossRef] [Green Version]
- Ito, H.; Yamashita, H.; Nakashima, M.; Takaki, A.; Yukawa, C.; Matsumoto, S.; Omoto, T.; Shinozaki, M.; Nishio, S.; Abe, M.; et al. Current metabolic status affects urinary liver-type fatty-acid binding protein in normoalbuminuric patients with type 2 diabetes. J. Clin. Med. Res. 2017, 9, 366. [Google Scholar] [CrossRef] [Green Version]
- Chartrel, N.; Picot, M.; El Medhi, M.; Arabo, A.; Berrahmoune, H.; Alexandre, D.; Maucotel, J.; Anouar, Y.; Prévost, G. The neuropeptide 26RFa (QRFP) and its role in the regulation of energy homeostasis: A mini-review. Front. Neurosci. 2016, 10, 549. [Google Scholar] [CrossRef]
- Kim, J.E.; Kim, J.S.; Jo, M.J.; Cho, E.; Ahn, S.Y.; Kwon, Y.J.; Ko, G.J. The Roles and Associated Mechanisms of Adipokines in Development of Metabolic Syndrome. Molecules 2022, 27, 334. [Google Scholar] [CrossRef]
- Amin, M.M.; Asaad, G.F.; Abdel Salam, R.M.; El-Abhar, H.S.; Arbid, M.S. Novel CoQ10 antidiabetic mechanisms underlie its positive effect: Modulation of insulin and adiponectine receptors, Tyrosine kinase, PI3K, glucose transporters, sRAGE and visfatin in insulin resistant/diabetic rats. PLoS ONE 2014, 9, e89169. [Google Scholar] [CrossRef] [Green Version]
- Fujikawa, T.; Coppari, R. Hypothalamic-mediated control of glucose balance in the presence and absence of insulin. Aging 2014, 6, 92. [Google Scholar] [CrossRef] [Green Version]
- Qiu, C.; Sui, J.; Zhang, Q.; Wei, P.; Wang, P.; Fu, Q. Relationship of endothelial cell–specific molecule 1 level in stress hyperglycemia patients with acute ST-segment elevation myocardial infarction: A pilot study. Angiology 2016, 67, 829–834. [Google Scholar] [CrossRef]
- Rushakoff, R.A.; Goldfine, I.D.; Beccaria, L.J.; Mathur, A.; Brand, R.J.; Liddle, R.A. Reduced postprandial cholecystokinin (CCK) secretion in patients with noninsulin-dependent diabetes mellitus: Evidence for a role for CCK in regulating postprandial hyperglycemia. J. Clin. Endocrinol. Metab. 1993, 76, 489–493. [Google Scholar] [CrossRef]
- Lam, W.F.; Gielkens, H.A.; De Boer, S.Y.; Lamers, C.B.; Masclee, A.A. Influence of hyperglycemia on the satiating effect of CCK in humans. Physiol. Behav. 1998, 65, 505–511. [Google Scholar] [CrossRef]
- Huang, D.W.; Sherman, B.T.; Lempicki, R. Systematic and integrative analysis of large gene lists using DAVID bioinformatics resources. Nat. Protoc. 2008, 4, 44–57. [Google Scholar] [CrossRef]
- Batlle, D.; Jose Soler, M.; Ye, M. ACE2 and diabetes: ACE of ACEs? Diabetes 2010, 59, 2994–2996. [Google Scholar] [CrossRef] [Green Version]
- Chhabra, K.H.; Chodavarapu, H.; Lazartigues, E. Angiotensin converting enzyme 2: A new important player in the regulation of glycemia. IUBMB Life 2013, 65, 731–738. [Google Scholar] [CrossRef] [Green Version]
- Hultstrom, M.; Fromell, K.; Larsson, A.; Quaggin, S.E.; Betsholtz, C.; Frithiof, R.; Lipcsey, M.; Jeansson, M. Elevated Angiopoietin-2 inhibits thrombomodulin-mediated anticoagulation in critically ill COVID-19 patients. medRxiv 2021. [Google Scholar] [CrossRef]
- Villa, E.; Critelli, R.; Lasagni, S.; Melegari, A.; Curatolo, A.; Celsa, C.; Romagnoli, D.; Melegari, G.; Pivetti, A.; Di Marco, L.; et al. Dynamic angiopoietin-2 assessment predicts survival and chronic course in hospitalized patients with COVID-19. Blood Adv. 2021, 5, 662–673. [Google Scholar] [CrossRef]
- Khalil, B.A.; Elemam, N.M.; Maghazachi, A.A. Chemokines and chemokine receptors during COVID-19 infection. Comput. Struct. Biotechnol. J. 2021, 19, 976–988. [Google Scholar] [CrossRef]
- Rayego-Mateos, S.; Morgado-Pascual, J.L.; Lavoz, C.; Rodrigues-Díez, R.R.; Márquez-Expósito, L.; Tejera-Muñoz, A.; Tejedor-Santamaría, L.; Rubio-Soto, I.; Marchant, V.; Ruiz-Ortega, M. CCN2 Binds to Tubular Epithelial Cells in the Kidney. Biomolecules 2022, 12, 252. [Google Scholar] [CrossRef]
- Tong, M.; Jiang, Y.; Xia, D.; Xiong, Y.; Zheng, Q.; Chen, F.; Zou, L.; Xiao, W.; Zhu, Y. Elevated expression of serum endothelial cell adhesion molecules in COVID-19 patients. J. Infect. Dis. 2020, 222, 894–898. [Google Scholar] [CrossRef]
- Kaur, S.; Hussain, S.; Kolhe, K.; Kumar, G.; Tripathi, D.M.; Tomar, A.; Kale, P.; Narayanan, A.; Bihari, C.; Bajpai, M.; et al. Elevated plasma ICAM1 levels predict 28-day mortality in cirrhotic patients with COVID-19 or bacterial sepsis. JHEP Rep. 2021, 3, 100303. [Google Scholar] [CrossRef]
- Garg, A.; Seeliger, B.; Derda, A.A.; Xiao, K.; Gietz, A.; Scherf, K.; Sonnenschein, K.; Pink, I.; Hoeper, M.M.; Welte, T.; et al. Circulating cardiovascular microRNAs in critically ill COVID-19 patients. Eur. J. Heart Fail. 2021, 23, 468–475. [Google Scholar] [CrossRef]
- Ueland, T.; Holter, J.C.; Holten, A.R.; Müller, K.E.; Lind, A.; Bekken, G.K.; Dudman, S.; Aukrust, P.; Dyrhol-Riise, A.M.; Heggelund, L. Distinct and early increase in circulating MMP-9 in COVID-19 patients with respiratory failure. J. Infect. 2020, 81, e41–e43. [Google Scholar] [CrossRef]
- Carolina, D.; Couto, A.E.; Campos, L.C.; Vasconcelos, T.F.; Michelon-Barbosa, J.; Corsi, C.A.; Mestriner, F.; Petroski-Moraes, B.C.; Garbellini-Diab, M.J.; Couto, D.M.; et al. MMP-2 and MMP-9 levels in plasma are altered and associated with mortality in COVID-19 patients. Biomed. Pharmacother. 2021, 142, 112067. [Google Scholar] [CrossRef]
- Jafarzadeh, A.; Nemati, M.; Jafarzadeh, S. Contribution of STAT3 to the pathogenesis of COVID-19. Microb. Pathog. 2021, 154, 104836. [Google Scholar] [CrossRef]
- Sivakorn, C.; Dechsanga, J.; Jamjumrus, L.; Boonnak, K.; Schultz, M.J.; Dondorp, A.M.; Phumratanaprapin, W.; Ratanarat, R.; Naorungroj, T.; Wattanawinitchai, P.; et al. High mobility group box 1 and interleukin 6 at intensive care unit admission as biomarkers in critically ill COVID-19 Patients. Am. J. Trop. Med. Hyg. 2021, 105, 73. [Google Scholar] [CrossRef]
- Chen, R.; Huang, Y.; Quan, J.; Liu, J.; Wang, H.; Billiar, T.R.; Lotze, M.T.; Zeh, H.J.; Kang, R.; Tang, D. HMGB1 as a potential biomarker and therapeutic target for severe COVID-19. Heliyon 2020, 6, e05672. [Google Scholar] [CrossRef]
- Ghoshal, K.; Bhattacharyya, M. Overview of platelet physiology: Its hemostatic and nonhemostatic role in disease pathogenesis. Sci. World J. 2014, 2014, 781857. [Google Scholar] [CrossRef] [Green Version]
- Nunes-Souza, V.; Alenina, N.; Qadri, F.; Penninger, J.M.; Santos, R.A.S.; Bader, M.; Rabelo, L.A. CD36/sirtuin 1 axis impairment contributes to hepatic steatosis in ACE2-deficient mice. Oxid. Med. Cell. Longev. 2016, 2016, 6487509. [Google Scholar] [CrossRef]
- Miller, R.; Wentzel, A.R.; Richards, G.A. COVID-19: NAD+ deficiency may predispose the aged, obese and type2 diabetics to mortality through its effect on SIRT1 activity. Med. Hypotheses 2020, 144, 110044. [Google Scholar] [CrossRef]
- Bordoni, V.; Tartaglia, E.; Sacchi, A.; Fimia, G.M.; Cimini, E.; Casetti, R.; Notari, S.; Grassi, G.; Marchioni, L.; Bibas, M.; et al. The unbalanced p53/SIRT1 axis may impact lymphocyte homeostasis in COVID-19 patients. Int. J. Infect. Dis. 2021, 105, 49–53. [Google Scholar] [CrossRef] [PubMed]
- Sriramula, S.; Cardinale, J.P.; Lazartigues, E.; Francis, J. ACE2 overexpression in the paraventricular nucleus attenuates angiotensin II-induced hypertension. Cardiovasc. Res. 2011, 92, 401–408. [Google Scholar] [CrossRef] [PubMed] [Green Version]
- Hashikawa-Hobara, N.; Hashikawa, N.; Inoue, Y.; Sanda, H.; Zamami, Y.; Takatori, S.; Kawasaki, H. Candesartan cilexetil improves angiotensin II type 2 receptor–mediated neurite outgrowth via the PI3K-Akt pathway in fructose-induced insulin-resistant rats. Diabetes 2012, 61, 925–932. [Google Scholar] [CrossRef] [PubMed] [Green Version]
- Sabater Molina, M.; Nicolás Rocamora, E.; Bendicho, A.I.; Vázquez, E.G.; Zorio, E.; Rodriguez, F.D.; Gil Ortuño, C.; Rodríguez, A.I.; Sánchez-López, A.J.; Jara Rubio, R.; et al. Polymorphisms in ACE, ACE2, AGTR1 genes and severity of COVID-19 disease. PLoS ONE 2022, 17, e0263140. [Google Scholar] [CrossRef] [PubMed]
- Kehoe, P.G.; Wong, S.; Al Mulhim, N.; Palmer, L.E.; Miners, J.S. Angiotensin-converting enzyme 2 is reduced in Alzheimer’s disease in association with increasing amyloid-β and tau pathology. Alzheimer’s Res. Ther. 2016, 8, 50. [Google Scholar] [CrossRef] [PubMed] [Green Version]
- Ban, C.X.; Zhong, L.; Wang, T.; Zhu, M.J.; Wang, J.H.; Zhang, Z.L.; Wang, Z.; Su, N.; Liu, Y.Y.; Shi, Y.C.; et al. Enhanced diabetes susceptibility in community dwelling Han elders carrying the Apolipoprotein E 3/3 genotype. PLoS ONE 2016, 11, e0151336. [Google Scholar] [CrossRef]
- Kurki, S.N.; Kantonen, J.; Kaivola, K.; Hokkanen, L.; Mäyränpää, M.I.; Puttonen, H.; Martola, J.; Pöyhönen, M.; Kero, M.; Tuimala, J.; et al. APOE ε4 associates with increased risk of severe COVID-19, cerebral microhaemorrhages and post-COVID mental fatigue: A Finnish biobank, autopsy and clinical study. Acta Neuropathol. Commun. 2021, 9, 199. [Google Scholar] [CrossRef]
- Xiong, N.; Schiller, M.R.; Li, J.; Chen, X.; Lin, Z. Severe COVID-19 in Alzheimer’s disease: APOE4’s fault again? Alzheimer’s Res. Ther. 2021, 13, 111. [Google Scholar] [CrossRef]
- Velkoska, E.; Dean, R.G.; Burchill, L.; Levidiotis, V.; Burrell, L.M. Reduction in renal ACE2 expression in subtotal nephrectomy in rats is ameliorated with ACE inhibition. Clin. Sci. 2010, 118, 269–279. [Google Scholar] [CrossRef] [Green Version]
- Burrell, L.M.; Johnston, C.I.; Tikellis, C.; Cooper, M.E. ACE2, a new regulator of the renin–angiotensin system. Trends Endocrinol. Metab. 2004, 15, 166–169. [Google Scholar] [CrossRef]
- Kouhpayeh, H.R.; Tabasi, F.; Dehvari, M.; Naderi, M.; Bahari, G.; Khalili, T.; Clark, C.; Ghavami, S.; Taheri, M. Association between angiotensinogen (AGT), angiotensin-converting enzyme (ACE) and angiotensin-II receptor 1 (AGTR1) polymorphisms and COVID-19 infection in the southeast of Iran: A preliminary case-control study. Transl. Med. Commun. 2021, 6, 26. [Google Scholar] [CrossRef]
- Raizada, M.K.; Ferreira, A.J. ACE2: A new target for cardiovascular disease therapeutics. J. Cardiovasc. Pharmacol. 2007, 50, 112–119. [Google Scholar] [CrossRef]
- Oudit, G.Y.; Liu, G.C.; Zhong, J.; Basu, R.; Chow, F.L.; Zhou, J.; Loibner, H.; Janzek, E.; Schuster, M.; Penninger, J.M.; et al. Human recombinant ACE2 reduces the progression of diabetic nephropathy. Diabetes 2010, 59, 529–538. [Google Scholar] [CrossRef] [Green Version]
- Duan, Y.; Beli, E.; Li Calzi, S.; Quigley, J.L.; Miller, R.C.; Moldovan, L.; Feng, D.; Salazar, T.E.; Hazra, S.; Al-Sabah, J.; et al. Loss of angiotensin-converting enzyme 2 exacerbates diabetic retinopathy by promoting bone marrow dysfunction. Stem. Cells 2018, 36, 1430–1440. [Google Scholar] [CrossRef] [Green Version]
- Takeda, M.; Yamamoto, K.; Takemura, Y.; Takeshita, H.; Hongyo, K.; Kawai, T.; Hanasaki-Yamamoto, H.; Oguro, R.; Takami, Y.; Tatara, Y.; et al. Loss of ACE2 exaggerates high-calorie diet–induced insulin resistance by reduction of GLUT4 in mice. Diabetes 2013, 62, 223–233. [Google Scholar] [CrossRef] [Green Version]
- Cherney, D.Z.; Scholey, J.W.; Sochett, E.; Bradley, T.J.; Reich, H.N. The acute effect of clamped hyperglycemia on the urinary excretion of inflammatory cytokines/chemokines in uncomplicated type 1 diabetes: A pilot study. Diabetes Care 2011, 34, 177–180. [Google Scholar] [CrossRef] [Green Version]
- Conte, C.; Riant, E.; Toutain, C.; Pujol, F.; Arnal, J.F.; Lenfant, F.; Prats, A.C. FGF2 translationally induced by hypoxia is involved in negative and positive feedback loops with HIF-1α. PLoS ONE 2008, 3, e3078. [Google Scholar] [CrossRef]
- Hagiwara, S.; Iwasaka, H.; Hasegawa, A.; Koga, H.; Noguchi, T. Effects of hyperglycemia and insulin therapy on high mobility group box 1 in endotoxin-induced acute lung injury in a rat model. Crit. Care Med. 2008, 36, 2407–2413. [Google Scholar] [CrossRef]
- Yu, A.P.; Tam, B.T.; Yau, W.Y.; Chan, K.S.; Yu, S.S.; Chung, T.L.; Siu, P.M. Association of endothelin-1 and matrix metallopeptidase-9 with metabolic syndrome in middle-aged and older adults. Diabetol. Metab. Syndr. 2015, 7, 111. [Google Scholar] [CrossRef] [Green Version]
- Pala, L.; Rotella, C.M. The role of DPP4 activity in cardiovascular districts: In vivo and in vitro evidence. J. Diabetes Res. 2013, 2013, 590456. [Google Scholar] [CrossRef] [Green Version]
- Suda, M.; Shimizu, I.; Yoshida, Y.; Hayashi, Y.; Ikegami, R.; Katsuumi, G.; Wakasugi, T.; Yoshida, Y.; Okuda, S.; Soga, T.; et al. Inhibition of dipeptidyl peptidase-4 ameliorates cardiac ischemia and systolic dysfunction by up-regulating the FGF-2/EGR-1 pathway. PLoS ONE 2017, 12, e0182422. [Google Scholar] [CrossRef] [PubMed] [Green Version]
- Marchetti, C.; Di Carlo, A.; Facchiano, F.; Senatore, C.; De Cristofaro, R.; Luzi, A.; Federici, M.; Romani, M.; Napolitano, M.; Capogrossi, M.C.; et al. High mobility group box 1 is a novel substrate of dipeptidyl peptidase-IV. Diabetologia 2012, 55, 236–244. [Google Scholar] [CrossRef] [PubMed] [Green Version]
- Arscott, W.T.; LaBauve, A.E.; May, V.; Wesley, U.V. Suppression of neuroblastoma growth by dipeptidyl peptidase IV: Relevance of chemokine regulation and caspase activation. Oncogene 2009, 28, 479–491. [Google Scholar] [CrossRef] [PubMed] [Green Version]
- Xu, Z.S.; Shu, T.; Kang, L.; Wu, D.; Zhou, X.; Liao, B.W.; Sun, X.L.; Zhou, X.; Wang, Y.Y. Temporal profiling of plasma cytokines, chemokines and growth factors from mild, severe and fatal COVID-19 patients. Signal Transduct. Target. Ther. 2020, 5, 100. [Google Scholar] [CrossRef]
- Fernández-Castañeda, A.; Lu, P.; Geraghty, A.C.; Song, E.; Lee, M.H.; Wood, J.; Yalcin, B.; Taylor, K.R.; Dutton, S.; Acosta-Alvarez, L.; et al. Mild respiratory SARS-CoV-2 infection can cause multi-lineage cellular dysregulation and myelin loss in the brain. bioRxiv 2022. [Google Scholar] [CrossRef]
- Forssmann, U.; Stoetzer, C.; Stephan, M.; Kruschinski, C.; Skripuletz, T.; Schade, J.; Schmiedl, A.; Pabst, R.; Wagner, L.; Hoffmann, T.; et al. Inhibition of CD26/dipeptidyl peptidase IV enhances CCL11/eotaxin-mediated recruitment of eosinophils in vivo. J. Immunol. 2008, 181, 1120–1127. [Google Scholar] [CrossRef] [Green Version]
- You, J.; Li, H.; Fan, P.; Yang, X.; Wei, Y.; Zheng, L.; Li, Z.; Yi, C. Inspiration for COVID-19 treatment: Network analysis and experimental validation of baicalin for cytokine storm. Front. Pharmacol. 2022, 13, 853496. [Google Scholar] [CrossRef]
- Gonzalez, Y.; Herrera, M.T.; Soldevila, G.; Garcia-Garcia, L.; Fabián, G.; Pérez-Armendariz, E.M.; Bobadilla, K.; Guzmán-Beltrán, S.; Sada, E.; Torres, M. High glucose concentrations induce TNF-α production through the down-regulation of CD33 in primary human monocytes. BMC Immunol. 2012, 13, 19. [Google Scholar] [CrossRef] [Green Version]
- Anoop, S.; Misra, A.; Bhatt, S.P.; Gulati, S.; Pandey, R.M.; Mahajan, H. High circulating plasma dipeptidyl peptidase-4 levels in non-obese Asian Indians with type 2 diabetes correlate with fasting insulin and LDL-C levels, triceps skinfolds, total intra-abdominal adipose tissue volume and presence of diabetes: A case–control study. BMJ Open Diabetes Res. Care 2017, 5, e000393. [Google Scholar] [CrossRef] [Green Version]
- Guo, Y.; Hu, K.; Li, Y.; Lu, C.; Ling, K.; Cai, C.; Wang, W.; Ye, D. Targeting TNF-α for COVID-19: Recent Advanced and Controversies. Front. Public Health 2022, 10, 833967. [Google Scholar] [CrossRef]
- Yang, G.; Jia, Z.; Aoyagi, T.; McClain, D.; Mortensen, R.M.; Yang, T. Systemic PPARγ deletion impairs circadian rhythms of behavior and metabolism. PLoS ONE 2012, 7, e38117. [Google Scholar] [CrossRef] [Green Version]
- Baumeier, C.; Schlüter, L.; Saussenthaler, S.; Laeger, T.; Rödiger, M.; Alaze, S.A.; Fritsche, L.; Häring, H.U.; Stefan, N.; Fritsche, A.; et al. Elevated hepatic DPP4 activity promotes insulin resistance and non-alcoholic fatty liver disease. Mol. Metab. 2017, 6, 1254–1263. [Google Scholar] [CrossRef]
- Desterke, C.; Turhan, A.G.; Bennaceur-Griscelli, A.; Griscelli, F. PPARγcistrome repression during activation of lung monocyte-macrophages in severe COVID-19. Iscience 2020, 23, 101611. [Google Scholar] [CrossRef]
- Barbosa-Desongles, A.; Hernández, C.; De Torres, I.; Munell, F.; Poupon, M.F.; Simó, R.; Selva, D.M. Diabetes protects from prostate cancer by downregulating androgen receptor: New insights from LNCaP cells and PAC120 mouse model. PLoS ONE 2013, 8, e74179. [Google Scholar] [CrossRef]
- Lin, H.P.; Lin, C.Y.; Liu, C.C.; Su, L.C.; Huo, C.; Kuo, Y.Y.; Tseng, J.C.; Hsu, J.M.; Chen, C.K.; Chuu, C.P. Caffeic acid phenethyl ester as a potential treatment for advanced prostate cancer targeting akt signaling. Int. J. Mol. Sci. 2013, 14, 5264–5283. [Google Scholar] [CrossRef] [Green Version]
- Mohamed, M.S.; Moulin, T.C.; Schiöth, H.B. Sex differences in COVID-19: The role of androgens in disease severity and progression. Endocrine 2021, 71, 3–8. [Google Scholar] [CrossRef]
- Arroba, A.I.; Mazzeo, A.; Cazzoni, D.; Beltramo, E.; Hernández, C.; Porta, M.; Simó, R.; Valverde, Á.M. Somatostatin protects photoreceptor cells against high glucose–induced apoptosis. Mol. Vis. 2016, 22, 1522. [Google Scholar]
- Temming, P.; Tröger, B.; Thonnissen, S.; Holterhus, P.M.; Schultz, C.; Härtel, C. The effect of hyperglycemia on neonatal immune responses in-vitro. J. Matern.-Fetal Neonatal Med. 2012, 25, 94–98. [Google Scholar] [CrossRef]
- Zeng, X.; Wang, H.; Xing, X.; Wang, Q.; Li, W. Dexmedetomidine protects against transient global cerebral ischemia/reperfusion induced oxidative stress and inflammation in diabetic rats. PLoS ONE 2016, 11, e0151620. [Google Scholar] [CrossRef] [Green Version]
- Ekinci, E.I.; Torkamani, N.; Ramchand, S.K.; Churilov, L.; Sikaris, K.A.; Lu, Z.X.; Houlihan, C.A. Higher maternal serum prolactin levels are associated with reduced glucose tolerance during pregnancy. J. Diabetes Investig. 2017, 8, 697–700. [Google Scholar] [CrossRef] [Green Version]
- Wu, Y.; Tang, L.; Chen, B. Oxidative stress: Implications for the development of diabetic retinopathy and antioxidant therapeutic perspectives. Oxidative Med. Cell. Longev. 2014, 2014, 752387. [Google Scholar] [CrossRef] [Green Version]
- Dai, H.; Liu, Q.; Liu, B. Research progress on mechanism of podocyte depletion in diabetic nephropathy. J. Diabetes Res. 2017, 2017, 2615286. [Google Scholar] [CrossRef]
- Kaur, H.; Chien, A.; Jialal, I. Hyperglycemia induces Toll like receptor 4 expression and activity in mouse mesangial cells: Relevance to diabetic nephropathy. Am. J. Physiol.-Ren. Physiol. 2012, 303, F1145–F1150. [Google Scholar] [CrossRef] [Green Version]
- Morey, M.; O’Gaora, P.; Pandit, A.; Hélary, C. Hyperglycemia acts in synergy with hypoxia to maintain the pro-inflammatory phenotype of macrophages. PLoS ONE 2019, 14, e0220577. [Google Scholar] [CrossRef] [Green Version]
- Rodriguez-Cerdeira, C.; Sanchez-Blanco, E.; Molares-Vila, A.; Alba, A. Unveiling new molecular factors useful for detection of pelvic inflammatory disease due to Chlamydia trachomatis infection. Int. Sch. Res. Not. 2012, 2012, 581725. [Google Scholar] [CrossRef] [Green Version]
- Mishiro, T.; Nakano, S.; Takahara, S.; Miki, M.; Nakamura, Y.; Yasuoka, S.; Nikawa, T.; Yasui, N. Relationship between cathepsin B and thrombin in rheumatoid arthritis. J. Rheumatol. 2004, 31, 1265–1273. [Google Scholar]
- Klemm, C.; Bruchhagen, C.; Van Krüchten, A.; Niemann, S.; Löffler, B.; Peters, G.; Ludwig, S.; Ehrhardt, C. Mitogen-activated protein kinases (MAPKs) regulate IL-6 over-production during concomitant influenza virus and Staphylococcus aureus infection. Sci. Rep. 2017, 7, 42473. [Google Scholar] [CrossRef] [Green Version]
- Steinfeld, S.; Maho, A.; Chaboteaux, C.; Daelemans, P.; Pochet, R.; Appelboom, T.; Kiss, R. Prolactin up-regulates cathepsin B and D expression in minor salivary glands of patients with Sjögren’s syndrome. Lab. Investig. 2000, 80, 1711–1720. [Google Scholar] [CrossRef] [PubMed] [Green Version]
- Yan, S.; Berquin, I.M.; Troen, B.R.; Sloane, B.F. Transcription of human cathepsin B is mediated by Sp1 and Ets family factors in glioma. DNA Cell Biol. 2000, 19, 79–91. [Google Scholar] [CrossRef] [PubMed]
- Koblansky, A.A.; Truax, A.D.; Liu, R.; Montgomery, S.A.; Ding, S.; Wilson, J.E.; Brickey, W.J.; Mühlbauer, M.; McFadden, R.M.T.; Hu, P.; et al. The innate immune receptor NLRX1 functions as a tumor suppressor by reducing colon tumorigenesis and key tumor-promoting signals. Cell Rep. 2016, 14, 2562–2575. [Google Scholar] [CrossRef] [PubMed] [Green Version]
- Barnes, T.C.; Cross, A.; Anderson, M.E.; Edwards, S.W.; Moots, R.J. Relative α1-anti-trypsin deficiency in systemic sclerosis. Rheumatology 2011, 50, 1373–1378. [Google Scholar] [CrossRef] [Green Version]
- Foghsgaard, L.; Wissing, D.; Mauch, D.; Lademann, U.; Bastholm, L.; Boes, M.; Elling, F.; Leist, M.; Jäättelä, M. Cathepsin B acts as a dominant execution protease in tumor cell apoptosis induced by tumor necrosis factor. J. Cell Biol. 2001, 153, 999–1010. [Google Scholar] [CrossRef] [Green Version]
- Li, S.; Zhang, Y.; Guan, Z.; Li, H.; Ye, M.; Chen, X.; Shen, J.; Zhou, Y.; Shi, Z.L.; Zhou, P.; et al. SARS-CoV-2 triggers inflammatory responses and cell death through caspase-8 activation. Signal Transduct. Target. Ther. 2020, 5, 235. [Google Scholar] [CrossRef]
- Lin, C.F.; Tsai, C.C.; Huang, W.C.; Wang, Y.C.; Tseng, P.C.; Tsai, T.T.; Chen, C.L. Glycogen synthase kinase-3β and caspase-2 mediate ceramide-and etoposide-induced apoptosis by regulating the lysosomal-mitochondrial axis. PLoS ONE 2016, 11, e0145460. [Google Scholar] [CrossRef]
- Park, J.H.; Lee, H.K. Re-analysis of single cell transcriptome reveals that the NR3C1-CXCL8-neutrophil axis determines the severity of COVID-19. Front. Immunol. 2020, 11, 2145. [Google Scholar] [CrossRef]
- Santa Cruz, A.; Mendes-Frias, A.; Oliveira, A.I.; Dias, L.; Matos, A.R.; Carvalho, A.; Capela, C.; Pedrosa, J.; Castro, A.G.; Silvestre, R. Interleukin-6 is a biomarker for the development of fatal severe acute respiratory syndrome coronavirus 2 pneumonia. Front. Immunol. 2021, 12, 263. [Google Scholar] [CrossRef]
- Al-Kuraishy, H.M.; Al-Gareeb, A.I.; Butnariu, M.; Batiha, G.E.S. The crucial role of prolactin-lactogenic hormone in COVID-19. Mol. Cell. Biochem. 2022, 477, 1381–1392. [Google Scholar] [CrossRef]
- Yoshimura, K.; Tsuchida, T.; Kawamoto, K. Expression of cathepsin B and cystatin C in the human adenohypophysis and in pituitary adenomas. Oncol. Rep. 2000, 7, 27–58. [Google Scholar] [CrossRef]
- Auriemma, R.S.; De Alcubierre, D.; Pirchio, R.; Pivonello, R.; Colao, A. Glucose abnormalities associated to prolactin secreting pituitary adenomas. Front. Endocrinol. 2019, 10, 327. [Google Scholar] [CrossRef] [Green Version]
- Khokhar, M.; Tomo, S.; Purohit, P. MicroRNAs based regulation of cytokine regulating immune expressed genes and their transcription factors in COVID-19. Meta Gene 2022, 31, 100990. [Google Scholar] [CrossRef]
- Mukherjee, S. Toll-like receptor 4 in COVID-19: Friend or foe? Future Virol. 2022, 17, 415–417. [Google Scholar] [CrossRef]
- Minuzzi, L.G.; Seelaender, M.; Silva, B.S.D.A.; Cunha, E.D.B.B.; Deus, M.D.C.; Vasconcellos, F.T.F.; Marqueze, L.F.B.; Gadotti, A.C.; Baena, C.P.; Pereira, T.; et al. COVID-19 outcome relates with circulating BDNF, according to patient adiposity and age. Front. Nutr. 2021, 8, 784429. [Google Scholar] [CrossRef]
- Ferreira, A.C.; Soares, V.C.; de Azevedo-Quintanilha, I.G.; Dias, S.D.S.G.; Fintelman-Rodrigues, N.; Sacramento, C.Q.; Mattos, M.; de Freitas, C.S.; Temerozo, J.R.; Teixeira, L.; et al. SARS-CoV-2 engages inflammasome and pyroptosis in human primary monocytes. Cell Death Discov. 2021, 7, 43. [Google Scholar] [CrossRef]
- Plassmeyer, M.; Alpan, O.; Corley, M.J.; Premeaux, T.A.; Lillard, K.; Coatney, P.; Vaziri, T.; Michalsky, S.; Pang, A.P.; Bukhari, Z.; et al. Caspases and therapeutic potential of caspase inhibitors in moderate–severe SARS-CoV-2 infection and long COVID. Allergy 2022, 77, 118–129. [Google Scholar] [CrossRef]
- Gulhan, P.Y.; Eroz, R.; Ataoglu, O.; Ince, N.; Davran, F.; Öztürk, C.E.; Gamsızkan, Z.; Balbay, O.A. The evaluation of both the expression and serum protein levels of Caspase-3 gene in patients with different degrees of SARS-CoV-2 infection. J. Med. Virol. 2022, 94, 897–905. [Google Scholar] [CrossRef]
- Tjan, L.H.; Furukawa, K.; Nagano, T.; Kiriu, T.; Nishimura, M.; Arii, J.; Hino, Y.; Iwata, S.; Nishimura, Y.; Mori, Y. Early differences in cytokine production by severity of coronavirus disease 2019. J. Infect. Dis. 2021, 223, 1145–1149. [Google Scholar] [CrossRef]
- Islam, H.; Chamberlain, T.C.; Mui, A.L.; Little, J.P. Elevated interleukin-10 levels in COVID-19: Potentiation of pro-inflammatory responses or impaired anti-inflammatory action? Front. Immunol. 2021, 12, 677008. [Google Scholar] [CrossRef]
- Ferreira-Gomes, M.; Kruglov, A.; Durek, P.; Heinrich, F.; Tizian, C.; Heinz, G.A.; Pascual-Reguant, A.; Du, W.; Mothes, R.; Fan, C.; et al. SARS-CoV-2 in severe COVID-19 induces a TGF-β-dominated chronic immune response that does not target itself. Nat. Commun. 2021, 12, 1961. [Google Scholar] [CrossRef]
- Zuniga, M.; Gomes, C.; Carsons, S.E.; Bender, M.T.; Cotzia, P.; Miao, Q.R.; Lee, D.C.; Rodriguez, A. Autoimmunity to Annexin A2 predicts mortality among hospitalised COVID-19 patients. Eur. Respir. J. 2021, 58, 2100918. [Google Scholar] [CrossRef]
- Patil, P.; Shetty, P.; Kuriakose, N.; Gollapalli, P.; Shetty, S.; Bhandary, R.; Vishwanatha, J.K.; Ghate, S.D. Molecular Insights on the Possible Role of Annexin A2 in COVID-19 Pathogenesis and Post-Infection Complications. Int. J. Mol. Sci. 2021, 22, 11028. [Google Scholar] [CrossRef]
- Klein, R.; Soung, A.; Sissoko, C.; Nordvig, A.; Canoll, P.; Mariani, M.; Jiang, X.; Bricker, T.; Goldman, J.; Rosoklija, G.; et al. COVID-19 induces neuroinflammation and loss of hippocampal neurogenesis. Res. Sq. 2021. [Google Scholar] [CrossRef]
- Aneva, I.Y.; Habtemariam, S.; Banach, M.; Sil, P.C.; Sarkar, K.; Sahebnasagh, A.; Kamal, M.A.; Khayatkashani, M.; Kashani, H.R.K. Can We Use mTOR Inhibitors for COVID-19 Therapy? Comb. Chem. High Throughput Screen. 2021. [Google Scholar] [CrossRef] [PubMed]
- Zeng, J.; Xie, X.; Feng, X.L.; Xu, L.; Han, J.B.; Yu, D.; Zou, Q.C.; Liu, Q.; Li, X.; Ma, G.; et al. Specific inhibition of the NLRP3 inflammasome suppresses immune overactivation and alleviates COVID-19 like pathology in mice. eBioMedicine 2022, 75, 103803. [Google Scholar] [CrossRef] [PubMed]
- Sarma, A.; Christenson, S.A.; Byrne, A.; Mick, E.; Pisco, A.O.; DeVoe, C.; Deiss, T.; Ghale, R.; Zha, B.S.; Tsitsiklis, A.; et al. Tracheal aspirate RNA sequencing identifies distinct immunological features of COVID-19 ARDS. Nat. Commun. 2021, 12, 5152. [Google Scholar] [CrossRef]
- Vaz de Paula, C.B.; de Azevedo, M.L.V.; Nagashima, S.; Martins, A.P.C.; Malaquias, M.A.S.; Miggiolaro, A.F.R.D.S.; da Silva Motta Júnior, J.; Avelino, G.; do Carmo, L.A.P.; Carstens, L.B.; et al. IL-4/IL-13 remodeling pathway of COVID-19 lung injury. Sci. Rep. 2020, 10, 18689. [Google Scholar] [CrossRef]
- Leng, L.; Cao, R.; Ma, J.; Mou, D.; Zhu, Y.; Li, W.; Lv, L.; Gao, D.; Zhang, S.; Gong, F.; et al. Pathological features of COVID-19-associated lung injury: A preliminary proteomics report based on clinical samples. Signal Transduct. Target. Ther. 2020, 5, 240. [Google Scholar] [CrossRef]
- Ziff, O.J.; Ashton, N.J.; Mehta, P.R.; Brown, R.; Athauda, D.; Heaney, J.; Heslegrave, A.J.; Benedet, A.L.; Blennow, K.; Checkley, A.M.; et al. Amyloid processing in COVID-19-associated neurological syndromes. J. Neurochem. 2022, 161, 146–157. [Google Scholar] [CrossRef]
- Kohli, A.; Sauerhering, L.; Fehling, S.K.; Klann, K.; Geiger, H.; Becker, S.; Koch, B.; Baer, P.C.; Strecker, T.; Münch, C. Proteomic landscape of SARS-CoV-2–and MERS-CoV–infected primary human renal epithelial cells. Life Sci. Alliance 2022, 5, e202201371. [Google Scholar] [CrossRef]
- Ackermann, M.; Mentzer, S.J.; Kolb, M.; Jonigk, D. Inflammation and intussusceptive angiogenesis in COVID-19: Everything in and out of flow. Eur. Respir. J. 2020, 56, 2003147. [Google Scholar] [CrossRef]
- Ren, X.; Wen, W.; Fan, X.; Hou, W.; Su, B.; Cai, P.; Li, J.; Liu, Y.; Tang, F.; Zhang, F.; et al. COVID-19 immune features revealed by a large-scale single-cell transcriptome atlas. Cell 2021, 184, 1895–1913. [Google Scholar] [CrossRef]
- Harford, J.B.; Kim, S.S.; Pirollo, K.F.; Chang, E.H. TP53 Gene Therapy as a Potential Treatment for Patients with COVID-19. Viruses 2022, 14, 739. [Google Scholar] [CrossRef]
- Yu, X.; Xu, X.; Wu, T.; Huang, W.; Xu, C.; Xie, W.; Long, X. APOA1 Level is Negatively Correlated with the Severity of COVID-19. Int. J. Gen. Med. 2022, 15, 689. [Google Scholar] [CrossRef]
- Bell, L.C.; Meydan, C.; Kim, J.; Foox, J.; Butler, D.; Mason, C.E.; Shapira, S.D.; Noursadeghi, M.; Pollara, G. Transcriptional response modules characterize IL-1β and IL-6 activity in COVID-19. Iscience 2021, 24, 101896. [Google Scholar] [CrossRef]
- Perreau, M.; Suffiotti, M.; Marques-Vidal, P.; Wiedemann, A.; Levy, Y.; Laouénan, C.; Ghosn, J.; Fenwick, C.; Comte, D.; Roger, T.; et al. The cytokines HGF and CXCL13 predict the severity and the mortality in COVID-19 patients. Nat. Commun. 2021, 12, 4888. [Google Scholar] [CrossRef]
- Wu, P.; Chen, D.; Ding, W.; Wu, P.; Hou, H.; Bai, Y.; Zhou, Y.; Li, K.; Xiang, S.; Liu, P.; et al. The trans-omics landscape of COVID-19. Nat. Commun. 2021, 12, 4543. [Google Scholar] [CrossRef]
- Dai, J.; Zhang, Q.; Wan, C.; Liu, J.; Zhang, Q.; Yu, Y.; Wang, J. Significances of viable synergistic autophagy-associated cathepsin B and cathepsin D (CTSB/CTSD) as potential biomarkers for sudden cardiac death. BMC Cardiovasc. Disord. 2021, 21, 233. [Google Scholar] [CrossRef]
- Liu, C.; Cai, Z.; Hu, T.; Yao, Q.; Zhang, L. Cathepsin B aggravated doxorubicin-induced myocardial injury via NF-κBsignalling. Mol. Med. Rep. 2020, 22, 4848–4856. [Google Scholar] [CrossRef]
- Niu, R.; Wang, J.; Geng, C.; Li, Y.; Dong, L.; Liu, L.; Chang, Y.; Shen, J.; Nie, Z.; Zhang, Y.; et al. Tandem mass tag-based proteomic analysis reveals cathepsin-mediated anti-autophagic and pro-apoptotic effects under proliferative diabetic retinopathy. Aging 2021, 13, 973. [Google Scholar] [CrossRef]
- Mittal, K.; Mani, R.J.; Katare, D.P. Type 3 diabetes: Cross talk between differentially regulated proteins of type 2 diabetes mellitus and Alzheimer’s disease. Sci. Rep. 2016, 6, 25589. [Google Scholar] [CrossRef]
- Tanaka, J.; Qiang, L.; Banks, A.S.; Welch, C.L.; Matsumoto, M.; Kitamura, T.; Ido-Kitamura, Y.; DePinho, R.A.; Accili, D. Foxo1 links hyperglycemia to LDL oxidation and endothelial nitric oxide synthase dysfunction in vascular endothelial cells. Diabetes 2009, 58, 2344–2354. [Google Scholar] [CrossRef] [Green Version]
- Zhang, D.; Wan, A.; Chiu, A.P.L.; Wang, Y.; Wang, F.; Neumaier, K.; Lal, N.; Bround, M.J.; Johnson, J.D.; Vlodavsky, I.; et al. Hyperglycemia-induced secretion of endothelial heparanase stimulates a vascular endothelial growth factor autocrine network in cardiomyocytes that promotes recruitment of lipoprotein lipase. Arterioscler. Thromb. Vasc. Biol. 2013, 33, 2830–2838. [Google Scholar] [CrossRef] [PubMed] [Green Version]
- Li, X.; Weng, H.; Xu, C.; Reece, E.A.; Yang, P. Oxidative stress–induced JNK1/2 activation triggers proapoptotic signaling and apoptosis that leads to diabetic embryopathy. Diabetes 2012, 61, 2084–2092. [Google Scholar] [CrossRef] [PubMed] [Green Version]
- Hayashi, Y.; Toyomasu, Y.; Saravanaperumal, S.A.; Bardsley, M.R.; Smestad, J.A.; Lorincz, A.; Eisenman, S.T.; Cipriani, G.; Holte, M.H.N.; Al Khazal, F.J.; et al. Hyperglycemia increases interstitial cells of Cajal via MAPK1 and MAPK3 signaling to ETV1 and KIT, leading to rapid gastric emptying. Gastroenterology 2017, 153, 521–535. [Google Scholar] [CrossRef] [PubMed] [Green Version]
- Tohda, C.; Tohda, M. Extracellular cathepsin L stimulates axonal growth in neurons. BMC Res. Notes 2017, 10, 613. [Google Scholar] [CrossRef] [PubMed] [Green Version]
- Gerber, A.; Welte, T.; Ansorge, S.; Bühling, F. Expression of cathepsins B and L in human lung epithelial cells is regulated by cytokines. Adv. Exp. Med. Biol. 2000, 477, 287–292. [Google Scholar] [CrossRef]
- Castets, P.; Frank, S.; Sinnreich, M.; Rüegg, M.A. “Get the balance right”: Pathological significance of autophagy perturbation in neuromuscular disorders. J. Neuromuscul. Dis. 2016, 3, 127–155. [Google Scholar] [CrossRef] [Green Version]
- Khamaysi, I.; Singh, P.; Nasser, S.; Awad, H.; Chowers, Y.; Sabo, E.; Hammond, E.; Gralnek, I.; Minkov, I.; Noseda, A.; et al. The role of heparanase in the pathogenesis of acute pancreatitis: A potential therapeutic target. Sci. Rep. 2017, 7, 715. [Google Scholar] [CrossRef] [Green Version]
- Xu, Q.F.; Zheng, Y.; Chen, J.; Xu, X.Y.; Gong, Z.J.; Huang, Y.F.; Lu, C.; Maibach, H.I.; Lai, W. Ultraviolet A enhances cathepsin L expression and activity via JNK pathway in human dermal fibroblasts. Chin. Med. J. 2016, 129, 2853–2860. [Google Scholar] [CrossRef]
- Fiebiger, E.; Maehr, R.; Villadangos, J.; Weber, E.; Erickson, A.; Bikoff, E.; Ploegh, H.L.; Lennon-Duménil, A.M. Invariant chain controls the activity of extracellular cathepsin L. J. Exp. Med. 2002, 196, 1263–1270. [Google Scholar] [CrossRef] [Green Version]
- Buijsers, B.; Yanginlar, C.; de Nooijer, A.; Grondman, I.; Maciej-Hulme, M.L.; Jonkman, I.; Janssen, N.A.; Rother, N.; de Graaf, M.; Pickkers, P.; et al. Increased plasma heparanase activity in COVID-19 patients. Front. Immunol. 2020, 11, 575047. [Google Scholar] [CrossRef]
- Goel, S.; Sharif-Askari, F.S.; Askari, N.S.S.; Madkhana, B.; Alwaa, A.M.; Mahboub, B.; Zakeri, A.M.; Ratemi, E.; Hamoudi, R.; Hamid, Q.; et al. SARS-CoV-2 Switches ‘on’MAPK and NFκB Signaling via the Reduction of Nuclear DUSP1 and DUSP5 Expression. Front. Pharmacol. 2021, 12, 631879. [Google Scholar] [CrossRef]
- Li, W.; Zhang, L.; Chen, X.; Jiang, Z.; Zong, L.; Ma, Q. Hyperglycemia promotes the epithelial-mesenchymal transition of pancreatic cancer via hydrogen peroxide. Oxidative Med. Cell. Longev. 2016, 2016, 5190314. [Google Scholar] [CrossRef] [Green Version]
- Yu, S.; Yu, Y.; Zhang, W.; Yuan, W.; Zhao, N.; Li, Q.; Cui, Y.; Wang, Y.; Li, W.; Sun, Y.; et al. FOXO3a promotes gastric cancer cell migration and invasion through the induction of cathepsin L. Oncotarget 2016, 7, 34773. [Google Scholar] [CrossRef] [Green Version]
- Osman, I.O.; Garrec, C.; de Souza, G.A.P.; Zarubica, A.; Belhaouari, D.B.; Baudoin, J.P.; Lepidi, H.; Mege, J.L.; Malissen, B.; Scola, B.L.; et al. Control of CDH1/E-Cadherin Gene Expression and Release of a Soluble Form of E-Cadherin in SARS-CoV-2 Infected Caco-2 Intestinal Cells: Physiopathological Consequences for the Intestinal Forms of COVID-19. Front. Cell. Infect. Microbiol. 2022, 12, 798767. [Google Scholar] [CrossRef]
- Garsen, M.; Rops, A.L.; Dijkman, H.; Willemsen, B.; van Kuppevelt, T.H.; Russel, F.G.; Rabelink, T.J.; Berden, J.H.; Reinheckel, T.; van der Vlag, J. Cathepsin L is crucial for the development of early experimental diabetic nephropathy. Kidney Int. 2016, 90, 1012–1022. [Google Scholar] [CrossRef]
- Brings, S.; Fleming, T.; Herzig, S.; Nawroth, P.P.; Kopf, S. Urinary cathepsin L is predictive of changes in albuminuria and correlates with glucosepane in patients with type 2 diabetes in a closed-cohort study. J. Diabetes Its Complicat. 2020, 34, 107648. [Google Scholar] [CrossRef]
- Piwkowska, A.; Zdrojewski, Ł.; Heleniak, Z.; Dębska-Ślizień, A. Novel Markers in Diabetic Kidney Disease—Current State and Perspectives. Diagnostics 2022, 12, 1205. [Google Scholar] [CrossRef]
- Safran, M.; Rosen, N.; Twik, M.; BarShir, R.; Stein, T.I.; Dahary, D.; Fishilevich, S.; Lancet, D. The GeneCards Suite Chapter. In Practical Guide to Life Science Databases; Springer: Berlin/Heidelberg, Germany, 2022; pp. 27–56. [Google Scholar] [CrossRef]
- Lawyer, G. Understanding the influence of all nodes in a network. Sci. Rep. 2015, 5, srep08665. [Google Scholar] [CrossRef] [Green Version]
- Tay, M.Z.; Poh, C.M.; Rénia, L.; MacAry, P.A.; Ng, L.F. The trinity of COVID-19: Immunity, inflammation and intervention. Nat. Rev. Immunol. 2020, 20, 363–374. [Google Scholar] [CrossRef]
- Zhang, Q.; Xiang, R.; Huo, S.; Zhou, Y.; Jiang, S.; Wang, Q.; Yu, F. Molecular mechanism of interaction between SARS-CoV-2 and host cells and interventional therapy. Signal Transduct. Target. Ther. 2021, 6, 233. [Google Scholar] [CrossRef]
- Kowluru, R.A.; Shan, Y.; Mishra, M. Dynamic DNA methylation of matrix metalloproteinase-9 in the development of diabetic retinopathy. Lab. Investig. 2016, 96, 1040–1049. [Google Scholar] [CrossRef] [PubMed] [Green Version]
- Mishra, M.; Kowluru, R.A. The Role of DNA Methylation in the Metabolic Memory Phenomenon Associated with the Continued Progression of Diabetic Retinopathy. Investig. Ophthalmol. Vis Sci. 2016, 57, 5748–5757. [Google Scholar] [CrossRef] [PubMed] [Green Version]
- Zhao, J.; Yang, S.; Shu, B.; Chen, L.; Yang, R.; Xu, Y.; Xie, J.; Liu, X.; Qi, S. Transient High Glucose Causes Persistent Vascular Dysfunction and Delayed Wound Healing by the DNMT1-Mediated Ang-1/NF-κB Pathway. J. Investig. Dermatol. 2021, 141, 1573–1584. [Google Scholar] [CrossRef] [PubMed]
- Muhammad, J.S.; Saheb Sharif-Askari, N.; Cui, Z.G.; Hamad, M.; Halwani, R. SARS-CoV-2 Infection-Induced Promoter Hypomethylation as an Epigenetic Modulator of Heat Shock Protein A1L (HSPA1L) Gene. Front. Genet. 2021, 12, 622271. [Google Scholar] [CrossRef]
- Romere, C.; Duerrschmid, C.; Bournat, J.; Constable, P.; Jain, M.; Xia, F.; Saha, P.K.; Del Solar, M.; Zhu, B.; York, B.; et al. Asprosin, a Fasting-Induced Glucogenic Protein Hormone. Cell 2016, 165, 566–579. [Google Scholar] [CrossRef] [Green Version]
- Gaikwad, A.B.; Gupta, J.; Tikoo, K. Epigenetic changes and alteration of Fbn1 and Col3A1 gene expression under hyperglycaemic and hyperinsulinaemic conditions. Biochem. J. 2010, 432, 333–341. [Google Scholar] [CrossRef] [Green Version]
- Seyhanli, E.S.; Koyuncu, I.; Yasak, I.H.; Demir, H.A.; Temiz, E. Asprosin and Oxidative Stress Level in COVID-19 Patients. Clin. Lab. 2022, 68, 1. [Google Scholar] [CrossRef]
- Eddy, A.C.; Trask, A.J. Growth differentiation factor-15 and its role in diabetes and cardiovascular disease. Cytokine Growth Factor Rev. 2021, 57, 11–18. [Google Scholar] [CrossRef]
- Teng, X.; Zhang, J.; Shi, Y.; Liu, Y.; Yang, Y.; He, J.; Luo, S.; Huang, Y.; Liu, Y.; Liu, D.; et al. Comprehensive Profiling of Inflammatory Factors Revealed That Growth Differentiation Factor-15 Is an Indicator of Disease Severity in COVID-19 Patients. Front. Immunol. 2021, 12, 662465. [Google Scholar] [CrossRef]
- Ebihara, T.; Matsumoto, H.; Matsubara, T.; Togami, Y.; Nakao, S.; Matsuura, H.; Kojima, T.; Sugihara, F.; Okuzaki, D.; Hirata, H.; et al. Cytokine Elevation in Severe COVID-19 From Longitudinal Proteomics Analysis: Comparison with Sepsis. Front. Immunol. 2022, 12, 798338. [Google Scholar] [CrossRef]
- Yang, W.H.; Park, S.Y.; Ji, S.; Kang, J.G.; Kim, J.E.; Song, H.; Mook-Jung, I.; Choe, K.M.; Cho, J.W. O-GlcNAcylation regulates hyperglycemia-induced GPX1 activation. Biochem. Biophys. Res. Commun. 2010, 391, 756–761. [Google Scholar] [CrossRef]
- Sultan, C.S.; Saackel, A.; Stank, A.; Fleming, T.; Fedorova, M.; Hoffmann, R.; Wade, R.C.; Hecker, M.; Wagner, A.H. Impact of carbonylation on glutathione peroxidase-1 activity in human hyperglycemic endothelial cells. Redox Biol. 2018, 16, 113–122. [Google Scholar] [CrossRef]
- Huang, J.Q.; Zhou, J.C.; Wu, Y.Y.; Ren, F.Z.; Lei, X.G. Role of glutathione peroxidase 1 in glucose and lipid metabolism-related diseases. Free Radic. Biol. Med. 2018, 127, 108–115. [Google Scholar] [CrossRef]
- Maamoun, H.; Benameur, T.; Pintus, G.; Munusamy, S.; Agouni, A. Crosstalk Between Oxidative Stress and Endoplasmic Reticulum (ER) Stress in Endothelial Dysfunction and Aberrant Angiogenesis Associated With Diabetes: A Focus on the Protective Roles of Heme Oxygenase (HO)-1. Front Physiol. 2019, 10, 70. [Google Scholar] [CrossRef] [Green Version]
- Toro, A.; Ruiz, M.S.; Lage-Vickers, S.; Sanchis, P.; Sabater, A.; Pascual, G.; Seniuk, R.; Cascardo, F.; Ledesma-Bazan, S.; Vilicich, F.; et al. A Journey into the Clinical Relevance of Heme Oxygenase 1 for Human Inflammatory Disease and Viral Clearance: Why Does It Matter on the COVID-19 Scene? Antioxidants 2022, 11, 276. [Google Scholar] [CrossRef]
- Singh, R.D.; Barry, M.A.; Croatt, A.J.; Ackerman, A.W.; Grande, J.P.; Diaz, R.M.; Vile, R.G.; Agarwal, A.; Nath, K.A. The spike protein of SARS-CoV-2 induces heme oxygenase-1: Pathophysiologic implications. Biochim. Biophys. Acta Mol. Basis Dis. 2022, 1868, 166322. [Google Scholar] [CrossRef]
- Abraham, N.G.; Kushida, T.; McClung, J.; Weiss, M.; Quan, S.; Lafaro, R.; Darzynkiewicz, Z.; Wolin, M. Heme oxygenase-1 attenuates glucose-mediated cell growth arrest and apoptosis in human microvessel endothelial cells. Circ. Res. 2003, 93, 507–514. [Google Scholar] [CrossRef] [Green Version]
- Maamoun, H.; Zachariah, M.; McVey, J.H.; Green, F.R.; Agouni, A. Heme oxygenase (HO)-1 induction prevents Endoplasmic Reticulum stress-mediated endothelial cell death and impaired angiogenic capacity. Biochem. Pharmacol. 2017, 127, 46–59. [Google Scholar] [CrossRef]
- Tiwari, S.; Ndisang, J.F. The heme oxygenase system and type-1 diabetes. Curr. Pharm. Des. 2014, 20, 1328–1337. [Google Scholar] [CrossRef]
- Al-Hamodi, Z.; Saif-Ali, R.; Ismail, I.S.; Ahmed, K.A.; Muniandy, S. Effect of plasminogen activator inhibitor-1 and tissue plasminogen activator polymorphisms on susceptibility to type 2 diabetes in Malaysian subjects. J. Biomed. Biotechnol. 2012, 2012, 234937. [Google Scholar] [CrossRef] [Green Version]
- Venkat, P.; Chopp, M.; Chen, J. Blood–brain barrier disruption, vascular impairment, and ischemia/reperfusion damage in diabetic stroke. J. Am. Heart Assoc. 2017, 6, e005819. [Google Scholar] [CrossRef]
- Kelliher, S.; Weiss, L.; Cullivan, S.; O’Rourke, E.; Murphy, C.A.; Toolan, S.; Lennon, Á.; Szklanna, P.B.; Comer, S.P.; Macleod, H.; et al. Non-severe COVID-19 is associated with endothelial damage and hypercoagulability despite pharmacological thromboprophylaxis. J. Thromb. Haemost. 2022, 20, 1008–1014. [Google Scholar] [CrossRef]
- Liu, N.; Long, H.; Sun, J.; Li, H.; He, Y.; Wang, Q.; Pan, K.; Tong, Y.; Wang, B.; Wu, Q.; et al. New laboratory evidence for the association between endothelial dysfunction and COVID-19 disease progression. J. Med. Virol. 2022, 94, 3112–3120. [Google Scholar] [CrossRef]
- Rubina, K.; Shmakova, A.; Shabanov, A.; Andreev, Y.; Borovkova, N.; Kulabukhov, V.; Evseev, A.; Popugaev, K.; Petrikov, S.; Semina, E. Novel prognostic determinants of COVID-19-related mortality: A pilot study on severely-ill patients in Russia. PLoS ONE 2022, 17, e0264072. [Google Scholar] [CrossRef]
- Tundo, G.R.; Sbardella, D.; Ciaccio, C.; Grasso, G.; Gioia, M.; Coletta, A.; Polticelli, F.; Di Pierro, D.; Milardi, D.; Van Endert, P.; et al. Multiple functions of insulin-degrading enzyme: A metabolic crosslight? Crit. Rev. Biochem. Mol. Biol. 2017, 52, 554–582. [Google Scholar] [CrossRef]
- González-Casimiro, C.M.; Merino, B.; Casanueva-Álvarez, E.; Postigo-Casado, T.; Cámara-Torres, P.; Fernández-Díaz, C.M.; Leissring, M.A.; Cózar-Castellano, I.; Perdomo, G. Modulation of Insulin Sensitivity by Insulin-Degrading Enzyme. Biomedicines 2021, 9, 86. [Google Scholar] [CrossRef]
- Flentje, A.; Kalsi, R.; Monahan, T.S. Small GTPases and Their Role in Vascular Disease. Int. J. Mol. Sci. 2019, 20, 917. [Google Scholar] [CrossRef] [Green Version]
- Huang, Z.; Peng, Y.; Yu, H.; Yu, X.; Zhou, J.; Xiao, J. RhoA protects the podocytes against high glucose-induced apoptosis through YAP and plays critical role in diabetic nephropathy. Biochem. Biophys. Res. Commun. 2018, 504, 949–956. [Google Scholar] [CrossRef]
- Mahavadi, S.; Sriwai, W.; Manion, O.; Grider, J.R.; Murthy, K.S. Diabetes-induced oxidative stress mediates upregulation of RhoA/Rho kinase pathway and hypercontractility of gastric smooth muscle. PLoS ONE 2017, 12, e0178574. [Google Scholar] [CrossRef]
- Hasankhani, A.; Bahrami, A.; Sheybani, N.; Aria, B.; Hemati, B.; Fatehi, F.; Farahani, H.G.M.; Javanmard, G.; Rezaee, M.; Kastelic, J.P.; et al. Differential Co-Expression Network Analysis Reveals Key Hub-High Traffic Genes as Potential Therapeutic Targets for COVID-19 Pandemic. Front. Immunol. 2021, 12, 789317. [Google Scholar] [CrossRef] [PubMed]
- Sardar, R.; Satish, D.; Gupta, D. Identification of Novel SARS-CoV-2 Drug Targets by Host MicroRNAs and Transcription Factors Co-regulatory Interaction Network Analysis. Front. Genet. 2020, 11, 571274. [Google Scholar] [CrossRef] [PubMed]
- Ryter, S.W. Heme Oxygenase-1: An Anti-Inflammatory Effector in Cardiovascular, Lung, and Related Metabolic Disorders. Antioxidants 2022, 11, 555. [Google Scholar] [CrossRef] [PubMed]
- Chen, Y.H.; Lin, S.J.; Lin, M.W.; Tsai, H.L.; Kuo, S.S.; Chen, J.W.; Charng, M.J.; Wu, T.C.; Chen, L.C.; Ding, Y.A.; et al. Microsatellite polymorphism in promoter of heme oxygenase-1 gene is associated with susceptibility to coronary artery disease in type 2 diabetic patients. Hum. Genet. 2002, 111, 1–8. [Google Scholar] [CrossRef]
- Wu, R.; Zhu, Z.; Zhou, D. VEGF, apelin and HO-1 in diabetic patients with retinopathy: A correlation analysis. BMC Ophthalmol. 2020, 20, 326. [Google Scholar] [CrossRef]
- Lenoir, O.; Gaillard, F.; Lazareth, H.; Robin, B.; Tharaux, P.L. Hmox1 deficiency sensitizes mice to peroxynitrite formation and diabetic glomerular microvascular injuries. J. Diabetes Res. 2017, 2017, 9603924. [Google Scholar] [CrossRef] [Green Version]
- Negi, G.; Nakkina, V.; Kamble, P.; Sharma, S.S. Heme oxygenase-1, a novel target for the treatment of diabetic complications: Focus on diabetic peripheral neuropathy. Pharmacol. Res. 2015, 102, 158–167. [Google Scholar] [CrossRef]
- Rossi, M.; Piagnerelli, M.; Van Meerhaeghe, A.; ZouaouiBoudjeltia, K. Heme oxygenase-1 (HO-1) cytoprotective pathway: A potential treatment strategy against coronavirus disease 2019 (COVID-19)-induced cytokine storm syndrome. Med. Hypotheses 2020, 144, 110242. [Google Scholar] [CrossRef]
- Kearney, K.; Tomlinson, D.; Smith, K.; Ajjan, R. Hypofibrinolysis in diabetes: A therapeutic target for the reduction of cardiovascular risk. Cardiovasc. Diabetol. 2017, 16, 34. [Google Scholar] [CrossRef] [Green Version]
- Hoteit, L.; Deeb, A.P.; Andraska, E.A.; Kaltenmeier, C.; Yazdani, H.O.; Tohme, S.; Neal, M.D.; Mota, R.I. The Pathobiological Basis for Thrombotic Complications in COVID-19: A Review of the Literature. Curr. Pathobiol. Rep. 2021, 9, 107–117. [Google Scholar] [CrossRef]
- Carlsson, A.C.; Nowak, C.; Lind, L.; Östgren, C.J.; Nyström, F.H.; Sundström, J.; Carrero, J.J.; Riserus, U.; Ingelsson, E.; Fall, T.; et al. Growth differentiation factor 15 (GDF-15) is a potential biomarker of both diabetic kidney disease and future cardiovascular events in cohorts of individuals with type 2 diabetes: A proteomics approach. Upsala J. Med. Sci. 2020, 125, 37–43. [Google Scholar] [CrossRef] [Green Version]
- Xiao, Q.A.; He, Q.; Zeng, J.; Xia, X. GDF-15, a future therapeutic target of glucolipid metabolic disorders and cardiovascular disease. Biomed. Pharmacother. 2022, 146, 112582. [Google Scholar] [CrossRef]
- Boraldi, F.; Lofaro, F.D.; Cossarizza, A.; Quaglino, D. The “Elastic Perspective” of SARS-CoV-2 Infection and the Role of Intrinsic and Extrinsic Factors. Int. J. Mol. Sci. 2022, 23, 1559. [Google Scholar] [CrossRef]
- Guo, X.; Xiang, Y.; Yang, H.; Yu, L.; Peng, X.; Guo, R. Association of the LOX-1 rs1050283 polymorphism with risk for atherosclerotic cerebral infarction and its effect on sLOX-1 and LOX-1 expression in a Chinese population. J. Atheroscler. Thromb. 2016, 24, 572–582. [Google Scholar] [CrossRef] [Green Version]
- Mehta, J.L.; Khaidakov, M.; Hermonat, P.L.; Mitra, S.; Wang, X.; Novelli, G.; Sawamura, T. LOX-1: A new target for therapy for cardiovascular diseases. Cardiovasc. Drugs Ther. 2011, 25, 495–500. [Google Scholar] [CrossRef]
- Chen, J.; Ren, J.; Loo, W.T.; Hao, L.; Wang, M. Lysyl oxidases expression and histopathological changes of the diabetic rat nephron. Mol. Med. Rep. 2018, 17, 2431–2441. [Google Scholar] [CrossRef] [Green Version]
- Yu, S.S.; Du, J.L. Selenoprotein S: A therapeutic target for diabetes and macroangiopathy? Cardiovasc. Diabetol. 2017, 16, 101. [Google Scholar] [CrossRef] [Green Version]
- Ye, Y.; Fu, F.; Li, X.; Yang, J.; Liu, H. Selenoprotein S is highly expressed in the blood vessels and prevents vascular smooth muscle cells from apoptosis. J. Cell. Biochem. 2016, 117, 106–117. [Google Scholar] [CrossRef]
- Waasdorp, M.; Duitman, J.; Florquin, S.; Spek, A.C. Protease activated receptor 2 in diabetic nephropathy: A double edged sword. Am. J. Transl. Res. 2017, 9, 4512. [Google Scholar]
- Subramaniam, S.; Ruf, W.; Bosmann, M. Advocacy of targeting protease-activated receptors in severe coronavirus disease 2019. Br. J. Pharmacol. 2022, 179, 2086–2099. [Google Scholar] [CrossRef]
- Noh, H.; Oh, E.Y.; Seo, J.Y.; Yu, M.R.; Kim, Y.O.; Ha, H.; Lee, H.B. Histone deacetylase-2 is a key regulator of diabetes-and transforming growth factor-β1-induced renal injury. Am. J. Physiol.-Ren. Physiol. 2009, 297, F729–F739. [Google Scholar] [CrossRef] [Green Version]
- Sun, J.; Wang, Y.; Cui, W.; Lou, Y.; Sun, G.; Zhang, D.; Miao, L. Role of epigenetic histone modifications in diabetic kidney disease involving renal fibrosis. J. Diabetes Res. 2017, 2017, 7242384. [Google Scholar] [CrossRef] [PubMed] [Green Version]
- Lindenmeyer, M.T.; Rastaldi, M.P.; Ikehata, M.; Neusser, M.A.; Kretzler, M.; Cohen, C.D.; Schlöndorff, D. Proteinuria and hyperglycemia induce endoplasmic reticulum stress. J. Am. Soc. Nephrol. 2008, 19, 2225–2236. [Google Scholar] [CrossRef] [PubMed] [Green Version]
- Li, B.; Zhang, H.Q.; Shi, Y.; Min, Y.B.; Lin, S.F.; Wu, K.L.; Hu, J.; Tang, S.B. Overexpression of nuclear transport factor 2 may protect against diabetic retinopathy. Mol. Vis. 2009, 15, 861. [Google Scholar]
- Kwak, H.J.; Yang, D.; Hwang, Y.; Jun, H.S.; Cheon, H.G. Baicalein protects rat insulinoma INS-1 cells from palmitate-induced lipotoxicity by inducing HO-1. PLoS ONE 2017, 12, e0176432. [Google Scholar] [CrossRef]
- Raffaele, M.; Li Volti, G.; Barbagallo, I.A.; Vanella, L. Therapeutic efficacy of stem cells transplantation in diabetes: Role of heme oxygenase. Front. Cell Dev. Biol. 2016, 4, 80. [Google Scholar] [CrossRef] [Green Version]
- Grant, P.J. The genetics of atherothrombotic disorders: A clinician’s view. J. Thromb. Haemost. 2003, 1, 1381–1390. [Google Scholar] [CrossRef] [Green Version]
- Al-Hamodi, Z.; Ismail, I.S.; Saif-Ali, R.; Ahmed, K.A.; Muniandy, S. Association of plasminogen activator inhibitor-1 and tissue plasminogen activator with type 2 diabetes and metabolic syndrome in Malaysian subjects. Cardiovasc. Diabetol. 2011, 10, 23. [Google Scholar] [CrossRef] [Green Version]
- Schernthaner-Reiter, M.H.; Kasses, D.; Tugendsam, C.; Riedl, M.; Peric, S.; Prager, G.; Krebs, M.; Promintzer-Schifferl, M.; Clodi, M.; Luger, A.; et al. Growth differentiation factor 15 increases following oral glucose ingestion: Effect of meal composition and obesity. Eur. J. Endocrinol. 2016, 175, 623–631. [Google Scholar] [CrossRef] [Green Version]
- You, D.; Nilsson, E.; Tenen, D.E.; Lyubetskaya, A.; Lo, J.C.; Jiang, R.; Deng, J.; Dawes, B.A.; Vaag, A.; Ling, C.; et al. Dnmt3a is an epigenetic mediator of adipose insulin resistance. Elife 2017, 6, e30766. [Google Scholar] [CrossRef]
- Badeanlou, L.; Furlan-Freguia, C.; Yang, G.; Ruf, W.; Samad, F. Tissue factor–protease-activated receptor 2 signaling promotes diet-induced obesity and adipose inflammation. Nat. Med. 2011, 17, 1490–1497. [Google Scholar] [CrossRef]
- Alleman, R.J.; Katunga, L.A.; Nelson, M.A.; Brown, D.A.; Anderson, E.J. The “Goldilocks Zone” from a redox perspective—Adaptive vs. deleterious responses to oxidative stress in striated muscle. Front. Physiol. 2014, 5, 358. [Google Scholar] [CrossRef] [Green Version]
- Wang, X.L.; Yang, T.B.; Wei, J.; Lei, G.H.; Zeng, C. Association between serum selenium level and type 2 diabetes mellitus: A non-linear dose–response meta-analysis of observational studies. Nutr. J. 2015, 15, 48. [Google Scholar] [CrossRef] [Green Version]
- Olsson, M.; Olsson, B.; Jacobson, P.; Thelle, D.S.; Björkegren, J.; Walley, A.; Froguel, P.; Carlsson, L.M.; Sjöholm, K. Expression of the selenoprotein S (SELS) gene in subcutaneous adipose tissue and SELS genotype are associated with metabolic risk factors. Metabolism 2011, 60, 114–120. [Google Scholar] [CrossRef]
- Costa-Junior, J.M.; Ferreira, S.M.; Protzek, A.O.; Santos, G.J.; Cappelli, A.P.; Silveira, L.R.; Zoppi, C.; de Oliveira, C.A.; Boschero, A.C.; Carneiro, E.M.; et al. Endurance training inhibits insulin clearance and IDE expression in Swiss mice. PLoS ONE 2015, 10, e0118809. [Google Scholar] [CrossRef] [Green Version]
- Wei, X.; Ke, B.; Zhao, Z.; Ye, X.; Gao, Z.; Ye, J. Regulation of insulin degrading enzyme activity by obesity-associated factors and pioglitazone in liver of diet-induced obese mice. PLoS ONE 2014, 9, e95399. [Google Scholar] [CrossRef] [Green Version]
- Sun, R.; Wu, Y.; Hou, W.; Sun, Z.; Wang, Y.; Wei, H.; Mo, W.; Yu, M. Bromodomain-containing protein 2 induces insulin resistance via the mTOR/Akt signaling pathway and an inflammatory response in adipose tissue. Cell. Signal. 2017, 30, 92–103. [Google Scholar] [CrossRef]
- Briggs, D.B.; Giron, R.M.; Malinowski, P.R.; Nuñez, M.; Tsao, T.S. Role of redox environment on the oligomerization of higher molecular weight adiponectin. BMC Biochem. 2011, 12, 24. [Google Scholar] [CrossRef] [Green Version]
- Huang-Doran, I.; Bicknell, L.S.; Finucane, F.M.; Rocha, N.; Porter, K.M.; Tung, Y.L.; Szekeres, F.; Krook, A.; Nolan, J.J.; O’Driscoll, M.; et al. Genetic defects in human pericentrin are associated with severe insulin resistance and diabetes. Diabetes 2011, 60, 925–935. [Google Scholar] [CrossRef] [Green Version]
- Vazirani, R.P.; Verma, A.; Sadacca, L.A.; Buckman, M.S.; Picatoste, B.; Beg, M.; Torsitano, C.; Bruno, J.H.; Patel, R.T.; Simonyte, K.; et al. Disruption of adipose Rab10-dependent insulin signaling causes hepatic insulin resistance. Diabetes 2016, 65, 1577–1589. [Google Scholar] [CrossRef] [Green Version]
- McCarthy, J.J.; Somji, A.; Weiss, L.A.; Steffy, B.; Vega, R.; Barrett-Connor, E.; Talavera, G.; Glynne, R. Polymorphisms of the scavenger receptor class B member 1 are associated with insulin resistance with evidence of gene by sex interaction. J. Clin. Endocrinol. Metab. 2009, 94, 1789–1796. [Google Scholar] [CrossRef] [Green Version]
- Vardarlı, A.T.; Harman, E.; Çetintaş, V.B.; Kayıkçıoğlu, M.; Vardarlı, E.; Zengi, A.; Küçükaslan, A.Ş.; Eroğlu, Z. Polymorphisms of lipid metabolism enzyme-coding genes in patients with diabetic dyslipidemia. Anatol. J. Cardiol. 2017, 17, 313. [Google Scholar] [CrossRef]
- Virtanen, P.; Gommers, R.; Oliphant, T.E.; Haberland, M.; Reddy, T.; Cournapeau, D.; Burovski, E.; Peterson, P.; Weckesser, W.; Bright, J.; et al. SciPy 1.0: Fundamental algorithms for scientific computing in Python. Nat. Methods 2020, 17, 261–272. [Google Scholar] [CrossRef] [Green Version]


| Gene Ontology Biological Process | Gene Ontology ID | Genes | p-Values with FDR Correction |
|---|---|---|---|
| Glucose homeostasis | GO:0042593 | ADIPOQ, ADIPOR1, ADRA2A, CEBPA, CNR1, FBN1, G6PC1, GCGR, GCK, HIF1A, HNF1A, IL6, INS, IRS1, LEP, LEPR, MTNR1B, NEUROD1, NGFR, PAX6, PDK4, PDX1, POMC, PPARG, PRKAA1, PRKAA2, RBP4, SIRT6, SLC2A4, STAT3, STK11, TCF7L2 | 7.92 × 10⁻²³ |
| Inflammatory response | GO:0006954 | AGER, AOC3, CALCA, CCL11, CCL2, CD40LG, CRH, CRP, CXCL12, CXCL8, CXCR4, CYBB, ECM1, F2R, FOS, FPR1, HMGB1, IL10, IL13, IL18, IL19, IL1A, IL1B, IL22, IL6, NFATC3, NFE2L2, NGFR, NLRP3, NOX4, PIK3CD, PIK3CG, PRKD1, PTGER2, PTGS2, RAC1, RELA, SELE, SELP, SPP1, TBXA2R, TGFB1, THBS1, TLR2, TLR4, TNF, TNFRSF11B | 6.69 × 10⁻¹⁷ |
| Response to hypoxia | GO:0001666 | ADIPOQ, ADM, AGER, ANGPT2, ANGPTL4, CASP1, CASP3, CAT, CAV1, CCL2, CDKN1B, CREB1, CXCL12, CXCR4, DPP4, EGR1, EPO, HIF1A, HMOX1, HSPD1, LEP, MB, MMP2, NOS1, NOS2, NOX4, PLAT, PLAU, PPARA, PRKAA1, PRKCB, RYR2, SOD2, TGFB1, THBS1, TLR2, UCP2, VCAM1, VEGFA, VEGFB | 1.41 × 10⁻²³ |
| Positive regulation of angiogenesis | GO:0045766 | ADM, ANGPT2, ANGPTL4, CCL11, CX3CL1, CXCL8, CYBB, DDAH1, ECM1, F3, FGF2, GATA4, HGF, HIF1A, HMOX1, IL1A, IL1B, KDR, NFE2L2, NOS3, PRKCB, PRKD1, PTGIS, SERPINE1, SIRT1, TBXA2R, THBS1, VEGFA | 9.5 × 10⁻¹⁷ |
| Positive regulation of cell proliferation | GO:0008284 | ADM, ADRA2A, AR, ATF3, AVP, AVPR1A, BCL2, CCK, CCN2, CCND2, CD47, CDK2, CDKN1B, CRH, CTF1, DPP4, EDN1, EGFR, EIF5A, EPO, ESM1, F2R, FABP1, FGF2, FGF21, FN1, GDNF, GHRH, HGF, IFNG, IGF1, IGF1R, IGF2, IL2, IL6, INS, IRS1, IRS2, KDR, LEP, MAPK1, MYC, NAMPT, NOTCH1, NRG1, NTN1, PDX1, PRKAA1, PTEN, REG1A, RELA, S100B, SIRT1, STAT3, TGFB1, THBS1, VEGFA, VIP | 2.86 × 10⁻²¹ |
| Negative regulation of apoptotic process | GO:0043066 | ALB, ANGPT1, ANGPTL4, AVP, BCL2, CASP3, CAT, CCND2, CD40LG, CD44, CDKN1A, CDKN1B, DDAH2, EGFR, FABP1, FOXO1, GAS6, GCG, GDNF, GLO1, GSK3B, HSPD1, IGF1, IGF1R, IL10, IL2, IL4, IL6, KDR, LEP, LTF, MAPK7, MMP9, MPZ, MYC, NGF, NGFR, NQO1, PAX4, PIK3R1, PRKAA1, PRKAA2, PRNP, PTEN, RELA, SIRT1, SNCA, SOCS3, SOD2, STAT3, THBS1, TP53, UCP2, VEGFA, VEGFB | 1.69 × 10⁻¹⁹ |
| Positive regulation of protein kinase B signaling | GO:0051897 | ANGPT1, CD28, EGFR, F3, FGF2, GAS6, GPX1, HPSE, IGF2, IL18, IL6, INS, LEP, MTOR, NOX4, NRG1, PIK3CG, RICTOR, TCF7L2, TGFB1, THBS1, TNF, TXN, VEGFB | 8.49 × 10⁻¹⁶ |
| Positive regulation of transcription from RNA polymerase II promoter | GO:0045944 | APP, AR, ARNTL, ATF3, CD28, CEBPA, CREB1, CREM, CTNNB1, DCN, DDIT3, EDN1, EGFR, EGR1, FGF2, FOS, FOXO1, FOXO3, GALR1, GATA4, GDNF, GSK3B, HGF, HIF1A, HMGA1, HMGB1, HNF1A, IFNG, IGF1, IL10, IL18, IL1A, IL1B, IL2, IL4, IL6, JUN, MAFA, MAFB, MAPK7, MEF2A, MEF2C, MEN1, MYC, NAMPT, NCK1, NEUROD1, NEUROG3, NFAT5, NFATC3, NFE2L2, NLRP3, NOS1, NOTCH1, NR1H2, NRG1, OGT, PARP1, PAX3, PAX6, PDX1, PIK3R1, POMC, PPARA, PPARG, PRKD1, PTH, RELA, SERPINE1, SIRT1, SIRT2, SP1, SREBF1, STAT3, TCF7L2, TGFB1, TLR2, TLR4, TNF, TP53, VEGFA | 2.25 × 10⁻¹⁹ |
| Aging | GO:0007568 | ADM, ADRB3, AGT, ARG1, CALCA, CAT, CCL2, CCN2, CNR1, COL3A1, CREB1, DCN, EPO, FGF2, FOS, FOXO3, IGFBP1, IL10, IL6, JUN, KL, NFE2L2, NQO1, PTEN, RELA, RETN, SERPINF1, SNCA, SOD1, SREBF1, STAT3, TGFB1, UCP2, VCAM1 | 2.47 × 10⁻¹⁸ |
| Response to drug | GO:0042493 | ABCA1, ABCC8, APOA1, ARG1, BCL2, BGLAP, CASP3, CAT, CCND1, CDH1, CDH3, CDKN1A, CDKN1B, CREB1, CRH, CTNNB1, CYBB, DUSP6, FOS, GATA4, GIP, HSPD1, ICAM1, IFNG, IL10, IL4, IL6, JUN, KCNJ11, LCN2, LPL, MYC, NEUROD1, PAX4, PDX1, PPARG, PTEN, PTGS2, PTH, RELA, SMPD1, SNCA, SOD1, SOD2, SORD, SREBF1, SST, STAT3, TBXA2R, TGFB1, THBS1, TIMP4, TNFRSF11B, TXNIP, VEGFB | 1.44 × 10⁻²⁷ |
| HG | Gene Expression is Upregulated by HG | Gene Expression is Downregulated by HG | Molecules with Hyperglycemic Activity | Molecules with Antihyperglycemic Effect | Other Relations | |
|---|---|---|---|---|---|---|
| ACE2 | ||||||
| Molecules are upregulated by ACE2 | BCL2, CCND1, MMP2, NOS1, NOS3, SOD1, UCP2 | BCL2, CDH1, NOS3 | IL1B, NOS2 | NPHS1, SIRT6 | ||
| Molecules are downregulated by ACE2 | ANGPT2, CCL2, CCN2, HMGB1, ICAM1, MIR21, MMP9, STAT3, VCAM1 | VEGFA | AGTR1 | STAT3 | ACE, ICAM1 | |
| Molecules upregulating ACE2 | HMGB1 | INS | ||||
| Molecules downregulating ACE2 | EDN1 | SIRT1 | AGTR1 | INS, SIRT1 | ACE, ALB, APOE | |
| Other relations | AGT | CAT, IRS1 | GCG | CALM1 | ||
| Gene Ontology Biological Process | Gene Ontology ID | p-Values with FDR Correction | |||||
|---|---|---|---|---|---|---|---|
| Hyperglycemia | CVD | Diabetic Neuropathy | Diabetic Nephropathy | Diabetic Retinopathy | Insulin Resistance | ||
| Positive regulation of cell migration | GO:0030335 | 3.28 × 10⁻⁵ | 9.10 × 10⁻⁴ | 1.11 × 10⁻⁵ | 3.60 × 10⁻⁵ | 7.24 × 10⁻⁶ | 3.46 × 10⁻⁴ |
| Negative regulation of gene expression | GO:0010629 | 6.51 × 10⁻⁷ | 2.68 × 10⁻⁷ | 0.0155 | 6.72 × 10⁻⁹ | 1.93 × 10⁻⁸ | 6.51 × 10⁻⁷ |
| Positive regulation of vascular smooth muscle cell proliferation | GO:1904707 | 1.28 × 10⁻⁴ | 3.12 × 10⁻⁴ | 0.0155 | 4.46 × 10⁻⁴ | 2.53 × 10⁻⁴ | 0.0213 |
| Positive regulation of phosphatidylinositol 3-kinase signaling | GO:0014068 | 3.28 × 10⁻⁵ | 0.0121 | 0.0277 | 1.62 × 10⁻⁴ | 8.03 × 10⁻⁵ | 8.51 × 10⁻⁴ |
| Positive regulation of cell proliferation | GO:0008284 | 1.45 × 10⁻⁴ | 1.68 × 10⁻⁴ | 0.0494 | 4.29 × 10⁻⁴ | 0.0032 | 5.49 × 10⁻⁵ |
| Negative regulation of apoptotic process | GO:0043066 | 1.32 × 10⁻⁴ | 0.0028 | 0.0489 | 6.47 × 10⁻⁵ | 0.0122 | 4.01 × 10⁻⁵ |
| Response to hypoxia | GO:0001666 | 5.05 × 10⁻⁷ | 8.51 × 10⁻⁷ | 1.20 × 10⁻⁹ | 6.91 × 10⁻⁷ | 4.30 × 10⁻⁸ | |
| Response to lipopolysaccharide | GO:0032496 | 3.28 × 10⁻⁵ | 3.43 × 10⁻⁷ | 4.43 × 10⁻⁹ | 3.81 × 10⁻⁷ | 1.82 × 10⁻⁸ | |
| Nitric oxide mediated signal transduction | GO:0007263 | 6.11 × 10⁻⁶ | 1.63 × 10⁻⁷ | 2.08 × 10⁻⁵ | 3.63 × 10⁻⁴ | 1.85 × 10⁻⁶ | |
| Positive regulation of vascular endothelial cell proliferation | GO:1905564 | 4.15 × 10⁻⁴ | 3.52 × 10⁻⁵ | 1.48 × 10⁻⁶ | 2.49 × 10⁻⁵ | 1.70 × 10⁻⁴ | |
| HG | Gene Expression Is Upregulated by HG | Gene Expression Is Downregulated by HG | Molecules with Hyperglycemic Activity | Molecules with Antihyperglycemic Effect | Other Relations | |
|---|---|---|---|---|---|---|
| DPP4 | ||||||
| Genes are upregulated by DPP4 | CD36, CD8A, CRP, IL6, MMP2, SPP1 | CD44, HIF1A, VEGFA | PPARG | PLAT | ||
| Genes are downregulated by DPP4 | CCL11, FGF2, HMGB1, MMP9, NPY, THBS1, VIP | PPY | CREB1, EGR1, GCG, GIP | ADIPOQ, EPO, GLP1R, INS, SERPINF1 | CXCL12, GHRH, NPHS1 | |
| Molecules that upregulate DPP4 | CCL11, EGFR, IFNG, TNF | INS | IL2, IL13 | |||
| Molecules that downregulate DPP4 | NPY, TLR4 | MYC | PTH, TFPI | |||
| Other relations | CXCR4, FN1 | CDH1 | GCG, NOS2 | CAV1, KL | HNF1A, LGALS3 | |
| Gene Ontology Biological Process | Gene Ontology ID | p-Values with FDR Correction | ||||||
|---|---|---|---|---|---|---|---|---|
| Hyperglycemia | CVD | Diabetic Neuropathy | Diabetic Nephropathy | Diabetic Retinopathy | Insulin Resistance | Beta-Cell Dysfunction | ||
| Response to hypoxia | GO:0001666 | 3.68 × 10⁻¹³ | 2.00 × 10⁻⁷ | 1.50 × 10⁻⁵ | 8.14 × 10⁻¹³ | 1.93 × 10⁻⁹ | 3.71 × 10⁻¹⁰ | |
| Positive regulation of ERK1 and ERK2 cascade | GO:0070374 | 1.78 × 10⁻⁹ | 7.39 × 10⁻⁵ | 3.06 × 10⁻⁶ | 2.13 × 10⁻¹⁰ | 1.14 × 10⁻⁸ | 1.10 × 10⁻¹⁰ | |
| Positive regulation of smooth muscle cell proliferation | GO:0048661 | 1.78 × 10⁻⁹ | 2.23 × 10⁻⁴ | 1.55 × 10⁻⁴ | 1.47 × 10⁻⁶ | 2.11 × 10⁻⁷ | 2.41 × 10⁻⁴ | |
| Response to activity | GO:0014823 | 1.28 × 10⁻⁸ | 8.42 × 10⁻⁵ | 1.03 × 10⁻⁴ | 7.24 × 10⁻⁶ | 5.26 × 10⁻⁴ | 9.71 × 10⁻⁴ | |
| Positive regulation of interleukin-8 production | GO:0032757 | 3.34 × 10⁻⁵ | 9.36 × 10⁻⁶ | 0.0022 | 4.08 × 10⁻⁸ | 1.48 × 10⁻⁷ | 1.20 × 10⁻⁶ | |
| Aging | GO:0007568 | 2.59 × 10⁻⁴ | 0.0016 | 1.94 × 10⁻⁴ | 5.18 × 10⁻⁵ | 5.14 × 10⁻⁶ | 1.87 × 10⁻⁴ | |
| Positive regulation of phosphatidylinositol 3-kinase signaling | GO:0014068 | 0.0012 | 4.54 × 10⁻⁴ | 1.94 × 10⁻⁴ | 1.09 × 10⁻⁸ | 5.43 × 10⁻⁷ | 5.45 × 10⁻⁴ | 3.07 × 10⁻⁴ |
| Negative regulation of lipid storage | GO:0010888 | 8.41 × 10⁻⁵ | 5.31 × 10⁻⁶ | 0.0022 | 4.58 × 10⁻⁶ | 1.71 × 10⁻⁶ | 2.52 × 10⁻⁵ | |
| Cellular response to lipopolysaccharide | GO:0071222 | 2.59 × 10⁻⁴ | 2.00 × 10⁻⁷ | 0.0022 | 7.19 × 10⁻⁷ | 5.14 × 10⁻⁶ | 6.64 × 10⁻⁸ | |
| Acute-phase response | GO:0006953 | 1.51 × 10⁻⁴ | 6.18 × 10⁻⁴ | 8.12 × 10⁻⁴ | 4.08 × 10⁻⁵ | 8.33 × 10⁻⁶ | 0.0039 | |
| HG | Gene Expression Is Upregulated by HG | Gene Expression Is Downregulated by HG | Molecules with Hyperglycemic Activity | Molecules with Antihyperglycemic Effect | Other Relations | |
|---|---|---|---|---|---|---|
| CTSB | ||||||
| Genes are upregulated by cathepsin B | BAX, BCL2, BDNF, CASP1, CASP3, CASP8, CCL2, CXCL8, DCX, IL18, MMP9, MTOR, NLRP3, PRL, PTEN | BCL2, CCK, VEGFA | PRL | IL4, IL18, MTOR | APOE, HSPG2 | |
| Genes are downregulated by cathepsin B | APP, FN1 | BGLAP, SIRT1 | CDKN1B | SIRT1 | ||
| Molecules that upregulate CTSB | CASP8, CXCL8, IL6, PRL, SP1, STAT3, TLR4, TNF | CCK, NTN1 | PRL | SMPD1, STAT3 | CXCL12, SNCA, SP1 | |
| Molecules that downregulate CTSB | TGFB1 | VEGFA | IL10 | |||
| Other relations | ANXA2, EGFR, HMGB1, MKI67, TP53 | APOA1, KDR, PLAU | IL1B | CAV1, HGF | FOXO3 | |
| Gene Ontology Biological Process | Gene Ontology ID | p-Values with FDR Correction | ||||||
|---|---|---|---|---|---|---|---|---|
| Hyperglycemia | CVD | Diabetic Neuropathy | Diabetic Nephropathy | Diabetic Retinopathy | Insulin Resistance | Beta-Cell Dysfunction | ||
| Positive regulation of cell proliferation | GO:0008284 | 4.03 × 10⁻⁹ | 1.92 × 10⁻⁵ | 0.0011 | 2.85 × 10⁻¹⁰ | 6.20 × 10⁻⁹ | 1.92 × 10⁻¹¹ | 1.03 × 10⁻⁴ |
| Positive regulation of gene expression | GO:0010628 | 5.24 × 10⁻¹⁰ | 4.48 × 10⁻⁸ | 7.49 × 10⁻⁸ | 1.68 × 10⁻¹¹ | 5.09 × 10⁻¹⁰ | 4.75 × 10⁻¹¹ | 0.006 |
| Positive regulation of protein phosphorylation | GO:0001934 | 8.99 × 10⁻⁹ | 8.17 × 10⁻⁷ | 2.68*10−4 | 1.31 × 10⁻⁸ | 6.19 × 10⁻⁸ | 6.81 × 10⁻⁸ | 0.0062 |
| Lipopolysaccharide-mediated signaling pathway | GO:0031663 | 2.08 × 10⁻⁶ | 4.81 × 10⁻⁶ | 6.83 × 10⁻⁴ | 2.57 × 10⁻⁵ | 5.29 × 10⁻⁶ | 3.06 × 10⁻⁷ | 0.0062 |
| Negative regulation of apoptotic process | GO:0043066 | 3.53 × 10⁻⁹ | 1.75 × 10⁻⁶ | 0.0011 | 3.36 × 10⁻¹³ | 2.88 × 10⁻⁷ | 4.87 × 10⁻¹¹ | 0.006 |
| Positive regulation of glial cell proliferation | GO:0060252 | 5.50 × 10⁻⁶ | 2.71 × 10⁻⁷ | 0.0052 | 3.82 × 10⁻⁵ | 1.23 × 10⁻⁵ | 1.13 × 10⁻⁷ | 0.0031 |
| Protein kinase B signaling | GO:0043491 | 3.02 × 10⁻⁶ | 2.13 × 10⁻⁴ | 8.72 × 10⁻⁴ | 1.63 × 10⁻⁶ | 8.27 × 10⁻⁶ | 1.93 × 10⁻⁴ | 0.0074 |
| Response to drug | GO:0042493 | 1.38 × 10⁻⁹ | 1.20 × 10⁻⁶ | 0.0072 | 3.64 × 10⁻⁶ | 9.35 × 10⁻⁵ | 6.81 × 10⁻⁸ | 0.0017 |
| Positive regulation of protein kinase B signaling | GO:0051897 | 2.83 × 10⁻⁵ | 4.95 × 10⁻⁷ | 0.0085 | 2.60 × 10⁻⁸ | 1.51 × 10⁻⁹ | 6.81 × 10⁻⁸ | 0.0031 |
| Positive regulation of interleukin-8 production | GO:0032757 | 2.09 × 10⁻⁵ | 6.03 × 10⁻⁹ | 0.002 | 9.11 × 10⁻⁷ | 3.52 × 10⁻⁹ | 7.49 × 10⁻¹¹ | 0.0139 |
| HG | Gene Expression Is Upregulated by HG | Gene Expression Is Downregulated by HG | Molecules with Hyperglycemic Activity | Molecules with Antihyperglycemic Effect | Other Relations | |
|---|---|---|---|---|---|---|
| CTSL | ||||||
| Genes are upregulated by cathepsin L | BCL2, CXCL8, HPSE | BCL2 | ||||
| Genes are downregulated by cathepsin L | CDKN1A, LEPR | CDH1 | IGFBP3 | LEPR, TF | ||
| Molecules that upregulate CTSL | FGF2, FOXO1, HPSE, IL6, JUN, MAPK1 | INS, MYC | FOS | |||
| Molecules that downregulate CTSL | CDKN1A, TGFB1 | |||||
| Other relations | CCL2, F3, TP53 | PLAU | POMC | |||
| Gene Ontology Biological Process | Gene Ontology ID | p-Values with FDR Correction | |||||
|---|---|---|---|---|---|---|---|
| Hyperglycemia | CVD | Diabetic Neuropathy | Diabetic Nephropathy | Diabetic Retinopathy | Insulin Resistance | ||
| Positive regulation of gene expression | GO:0010628 | 7.19 × 10⁻⁶ | 0.0012 | 0.003 | 7.98 × 10⁻⁴ | 1.25 × 10⁻⁴ | 4.44 × 10⁻⁴ |
| Chemotaxis | GO:0006935 | 8.06 × 10⁻⁴ | 0.0033 | 0.0021 | 0.0027 | 0.0146 | |
| Positive regulation of protein phosphorylation | GO:0001934 | 0.0167 | 0.0115 | 1.25 × 10⁻⁴ | 5.80 × 10⁻⁴ | ||
| Positive regulation of MAPK cascade | GO:0043410 | 0.0165 | 0.0069 | 0.012 | 0.006 | 4.87 × 10⁻⁵ | 0.0086 |
| Negative regulation of cell proliferation | GO:0008285 | 5.96 × 10⁻⁵ | 0.0414 | 0.0123 | 6.86 × 10⁻⁴ | 0.0041 | |
| Positive regulation of protein kinase B signaling | GO:0051897 | 8.49 × 10⁻⁴ | 0.023 | 0.0184 | 2.07 × 10⁻⁴ | 0.0163 | |
| Positive regulation of cell migration | GO:0030335 | 0.0058 | 0.0271 | 0.026 | 0.0027 | ||
| Lipopolysaccharide-mediated signaling pathway | GO:0031663 | 0.0173 | 0.0128 | 0.0103 | 0.033 | ||
| Positive regulation of protein import into nucleus | GO:0042307 | 0.0195 | 0.0167 | 7.98 × 10⁻⁴ | 0.0438 | ||
| Positive regulation of production of miRNAs involved in gene silencing by miRNA | GO:1903800 | 0.0034 | 0.0271 | 0.0039 | 0.0228 | 0.048 | |
| Gene Ontology Biological Process | Gene Ontology ID | Genes | p-Values with FDR Correction |
|---|---|---|---|
| Viral process | GO:0016032 | BRD4, CCDC86, CRTC3, CUL2, EIF4H, ELOC, MFGE8, NLRX1, NUP210, NUP214, NUP54, NUP58, NUP62, NUP88, NUP98, POLA1, RAE1, RALA, RBX1, RHOA | 0.0011 |
| Intracellular transport of virus | GO:0075733 | NUP210, NUP214, NUP54, NUP58, NUP62, NUP88, NUP98, RAE1 | 0.0079 |
| Protein transport | GO:0015031 | AKAP8, ARF6, CENPF, CHMP2A, ERC1, GORASP1, HOOK1, JAKMIP1, LMAN2, NUP210, PLEKHF2, PPT1, RAB14, RAB18, RAB2A, RAB5C, RAB7A, TIMM10B, TIMM8B, TIMM9, TMED5, WASHC4, YIF1A | 0.0013 |
| Protein folding | GO:0006457 | BAG5, CSNK2A2, CSNK2B, CWC27, DNAJC19, ERO1B, ERP44, FKBP10, FKBP15, FKBP7, GNB1, GRPEL1, MOGS, PPIL3, QSOX2, SIL1, TBCA | 4.05 × 10⁻⁴ |
| Regulation of glucose transport | GO:0010827 | NUP210, NUP214, NUP54, NUP58, NUP62, NUP88, NUP98, RAE1 | 7.74 × 10⁻⁴ |
| Mitotic nuclear envelope disassembly | GO:0007077 | NEK9, NUP210, NUP214, NUP54, NUP58, NUP62, NUP88, NUP98, RAE1 | 7.74 × 10⁻⁴ |
| tRNA export from nucleus | GO:0006409 | NUP210, NUP214, NUP54, NUP58, NUP62, NUP88, NUP98, RAE1 | 7.74 × 10⁻⁴ |
| Regulation of cellular response to heat | GO:1900034 | BAG5, HSBP1, NUP210, NUP214, NUP54, NUP58, NUP62, NUP88, NUP98, RAE1 | 0.0022 |
| G2/M transition of mitotic cell cycle | GO:0000086 | AKAP9, CDK5RAP2, CEP135, CEP250, CEP43, CIT, CNTRL, NINL, PCNT, PRKACA, PRKAR2B, RAB8A | 0.0087 |
| Protein heterotrimerization | GO:0070208 | COL6A1, GNB1, NUP54, NUP58, NUP62 | 0.0142 |
| mRNA export from nucleus | GO:0006406 | NUP210, NUP214, NUP54, NUP58, NUP62, NUP88, NUP98, RAE1, SLU7, UPF1 | 0.0142 |
| U4 snRNA 3’-end processing | GO:0034475 | EXOSC2, EXOSC3, EXOSC5, EXOSC8 | 0.0387 |
| Chaperone-mediated protein transport | GO:0072321 | TIMM10, TIMM8B, TIMM9, TOR1A | 0.0387 |
| Protein targeting to mitochondrion | GO:0006626 | DNAJC19, TIMM10, TIMM10B, TIMM8B, TIMM9, TOMM70 | 0.0418 |
| Nuclear-transcribed mRNA catabolic process, exonucleolytic, 3’-5’ | GO:0034427 | EXOSC2, EXOSC3, EXOSC5, EXOSC8 | 0.0497 |
| Gene Ontology Biological Process | Gene Ontology ID | p-Values with FDR Correction | |||
|---|---|---|---|---|---|
| CVD | Diabetic Neuropathy | Diabetic Nephropathy | Diabetic Retinopathy | ||
| Cytokine-mediated signaling pathway | GO:0019221 | 3.79 × 10⁻²³ | 1.92 × 10⁻¹¹ | 4.53 × 10−37 | 2.35 × 10⁻²⁰ |
| Response to hypoxia | GO:0001666 | 3.16 × 10⁻¹⁶ | 7.16 × 10⁻¹⁰ | 3.50 × 10⁻²⁷ | 5.42 × 10⁻²⁵ |
| Positive regulation of gene expression | GO:0010628 | 1.25 × 10⁻¹⁸ | 1.71 × 10⁻⁹ | 1.59 × 10⁻³⁰ | 2.56 × 10⁻²⁴ |
| Positive regulation of phosphatidylinositol 3-kinase signaling | GO:0014068 | 4.48 × 10⁻¹⁷ | 1.89 × 10⁻⁸ | 2.91 × 10⁻²⁴ | 7.80 × 10⁻²² |
| Inflammatory response | GO:0006954 | 7.23 × 10⁻²⁵ | 1.53 × 10⁻³³ | 3.86 × 10⁻²⁶ | |
| Positive regulation of cell proliferation | GO:0008284 | 1.86 × 10⁻⁸ | 6.54 × 10⁻²⁵ | 1.09 × 10⁻²² | |
| Positive regulation of smooth muscle cell proliferation | GO:0048661 | 1.01 × 10⁻¹⁶ | 2.09 × 10⁻⁸ | 8.79 × 10⁻²³ | |
| Positive regulation of protein kinase B signaling | GO:0051897 | 2.57 × 10⁻¹⁶ | 4.87 × 10⁻²³ | ||
| Aging | GO:0007568 | 1.14 × 10⁻¹⁶ | 9.23 × 10⁻¹¹ | ||
| Positive regulation of ERK1 and ERK2 cascade | GO:0070374 | 6.15 × 10⁻⁹ | 6.70 × 10⁻²⁴ | ||
| Negative regulation of apoptotic process | GO:0043066 | 4.70 × 10⁻²⁸ | |||
| Positive regulation of angiogenesis | GO:0045766 | 1.47 × 10⁻²⁵ | |||
| Cellular response to lipopolysaccharide | GO:0071222 | 3.00 × 10⁻¹⁹ | |||
| Positive regulation of protein phosphorylation | GO:0001934 | 4.30 × 10⁻¹⁹ | |||
| Positive regulation of cell migration | GO:0030335 | 5.16 × 10⁻¹⁹ | |||
| Response to xenobiotic stimulus | GO:0009410 | 3.10 × 10⁻¹⁷ | |||
| Regulation of blood pressure | GO:0008217 | 3.16 × 10⁻¹⁶ | |||
| Positive regulation of peptidyl-tyrosine phosphorylation | GO:0050731 | 1.71 × 10⁻⁹ | |||
| Positive regulation of apoptotic process | GO:0043065 | 6.15 × 10⁻⁹ | |||
Publisher’s Note: MDPI stays neutral with regard to jurisdictional claims in published maps and institutional affiliations. |
© 2022 by the authors. Licensee MDPI, Basel, Switzerland. This article is an open access article distributed under the terms and conditions of the Creative Commons Attribution (CC BY) license (https://creativecommons.org/licenses/by/4.0/).
Share and Cite
Saik, O.V.; Klimontov, V.V. Gene Networks of Hyperglycemia, Diabetic Complications, and Human Proteins Targeted by SARS-CoV-2: What Is the Molecular Basis for Comorbidity? Int. J. Mol. Sci. 2022, 23, 7247. https://doi.org/10.3390/ijms23137247
Saik OV, Klimontov VV. Gene Networks of Hyperglycemia, Diabetic Complications, and Human Proteins Targeted by SARS-CoV-2: What Is the Molecular Basis for Comorbidity? International Journal of Molecular Sciences. 2022; 23(13):7247. https://doi.org/10.3390/ijms23137247
Chicago/Turabian StyleSaik, Olga V., and Vadim V. Klimontov. 2022. "Gene Networks of Hyperglycemia, Diabetic Complications, and Human Proteins Targeted by SARS-CoV-2: What Is the Molecular Basis for Comorbidity?" International Journal of Molecular Sciences 23, no. 13: 7247. https://doi.org/10.3390/ijms23137247