
Transcriptional and Distributional Profiling of Microglia in Retinal Angiomatous Proliferation

 , , and
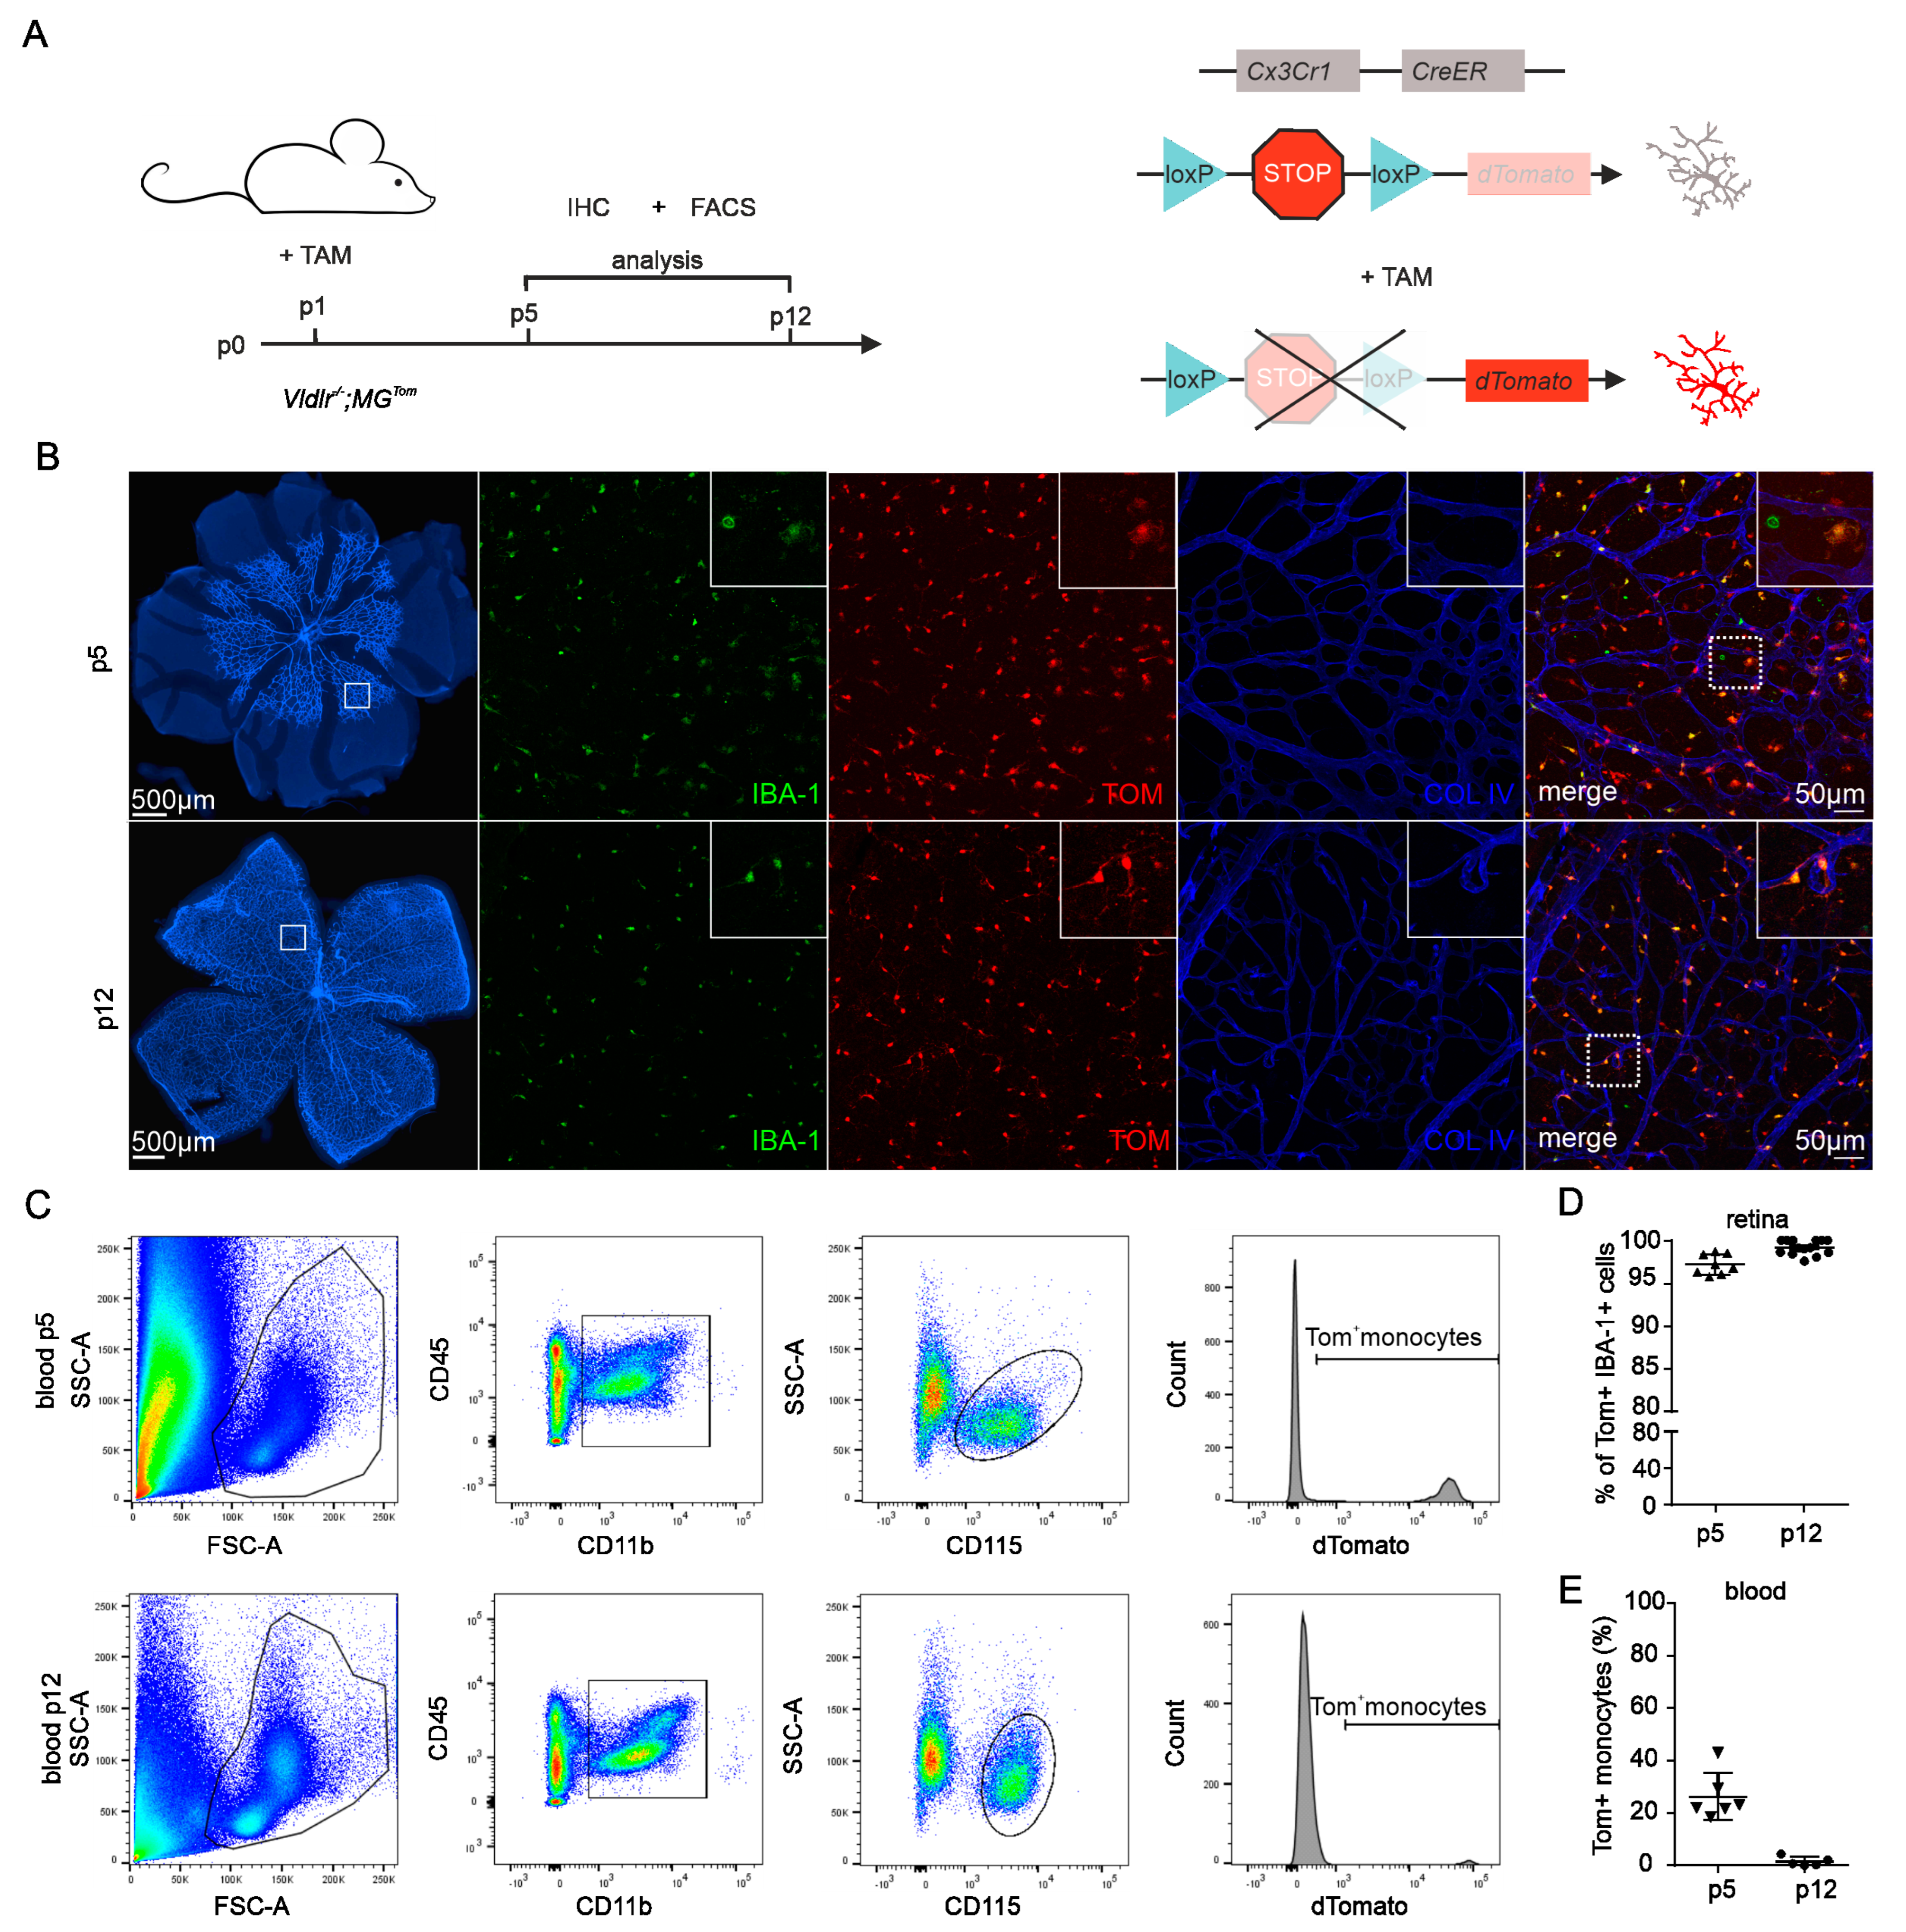
Abstract
:1. Introduction
2. Results
2.1. Recombination Efficiency in Retinal Microglia and Blood of Vldlr−/−; MGTom Mice
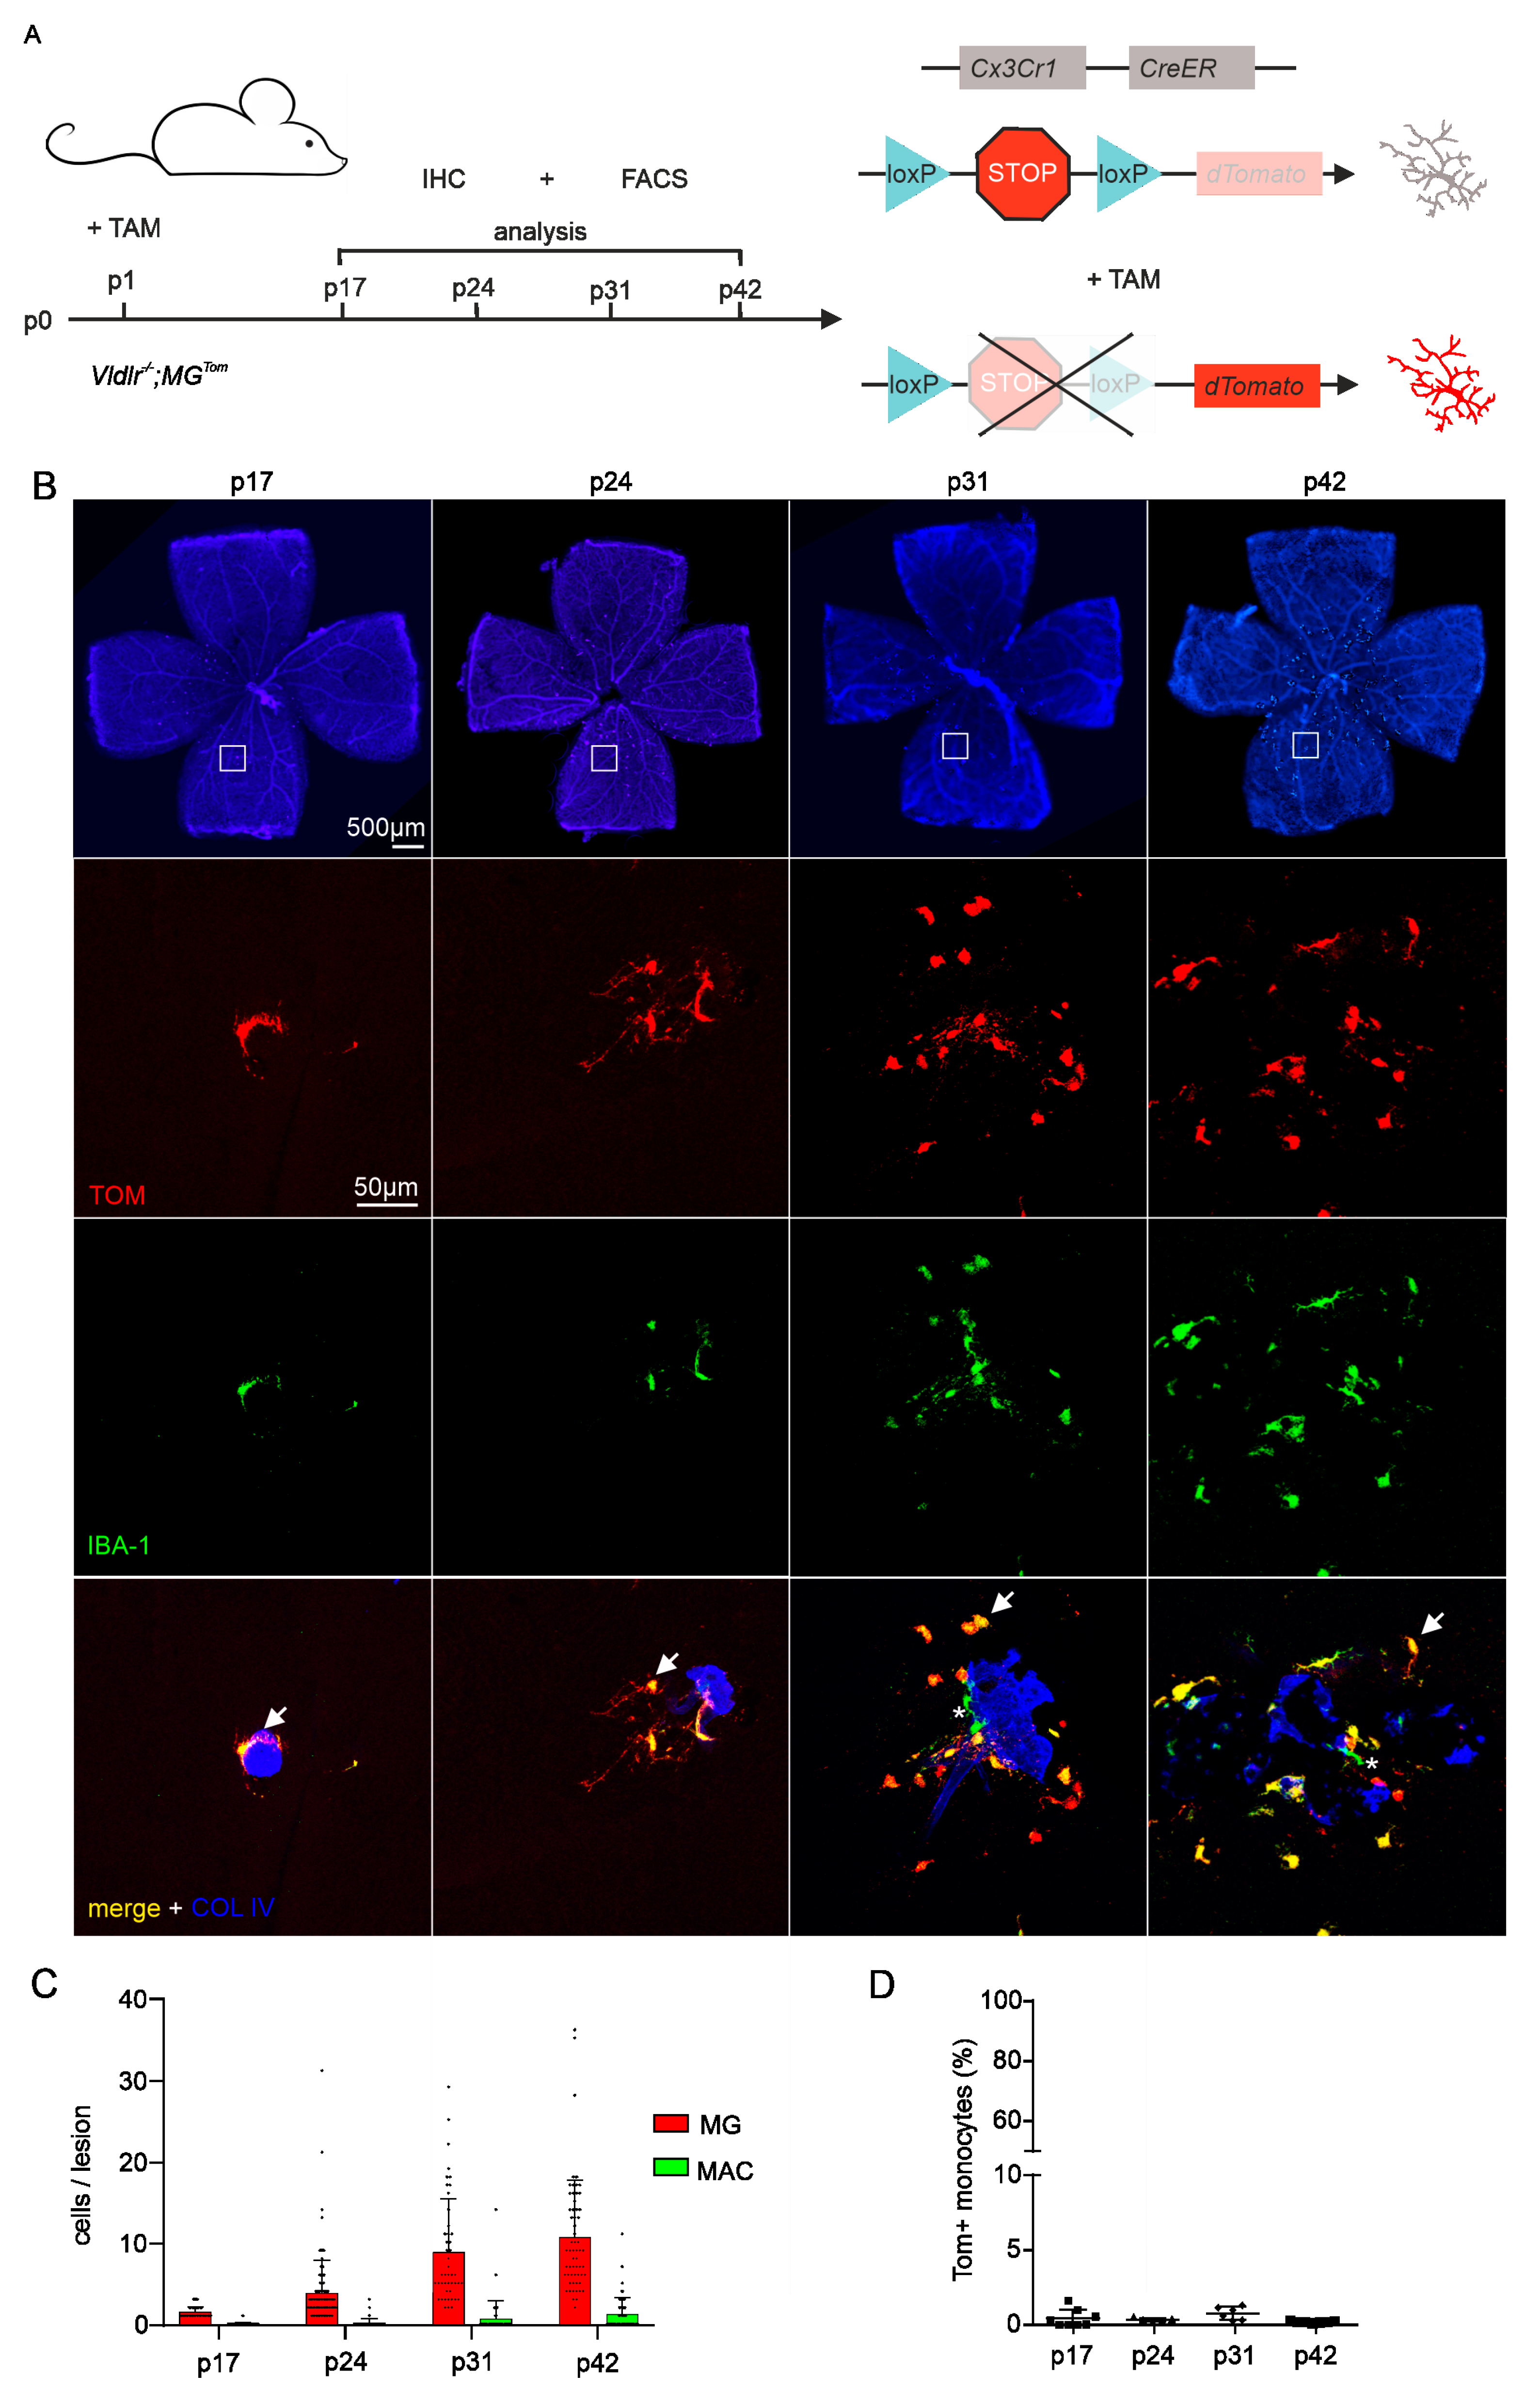
2.2. Distributional Profiling of MG and MAC during Retinal Angiomatous Proliferation
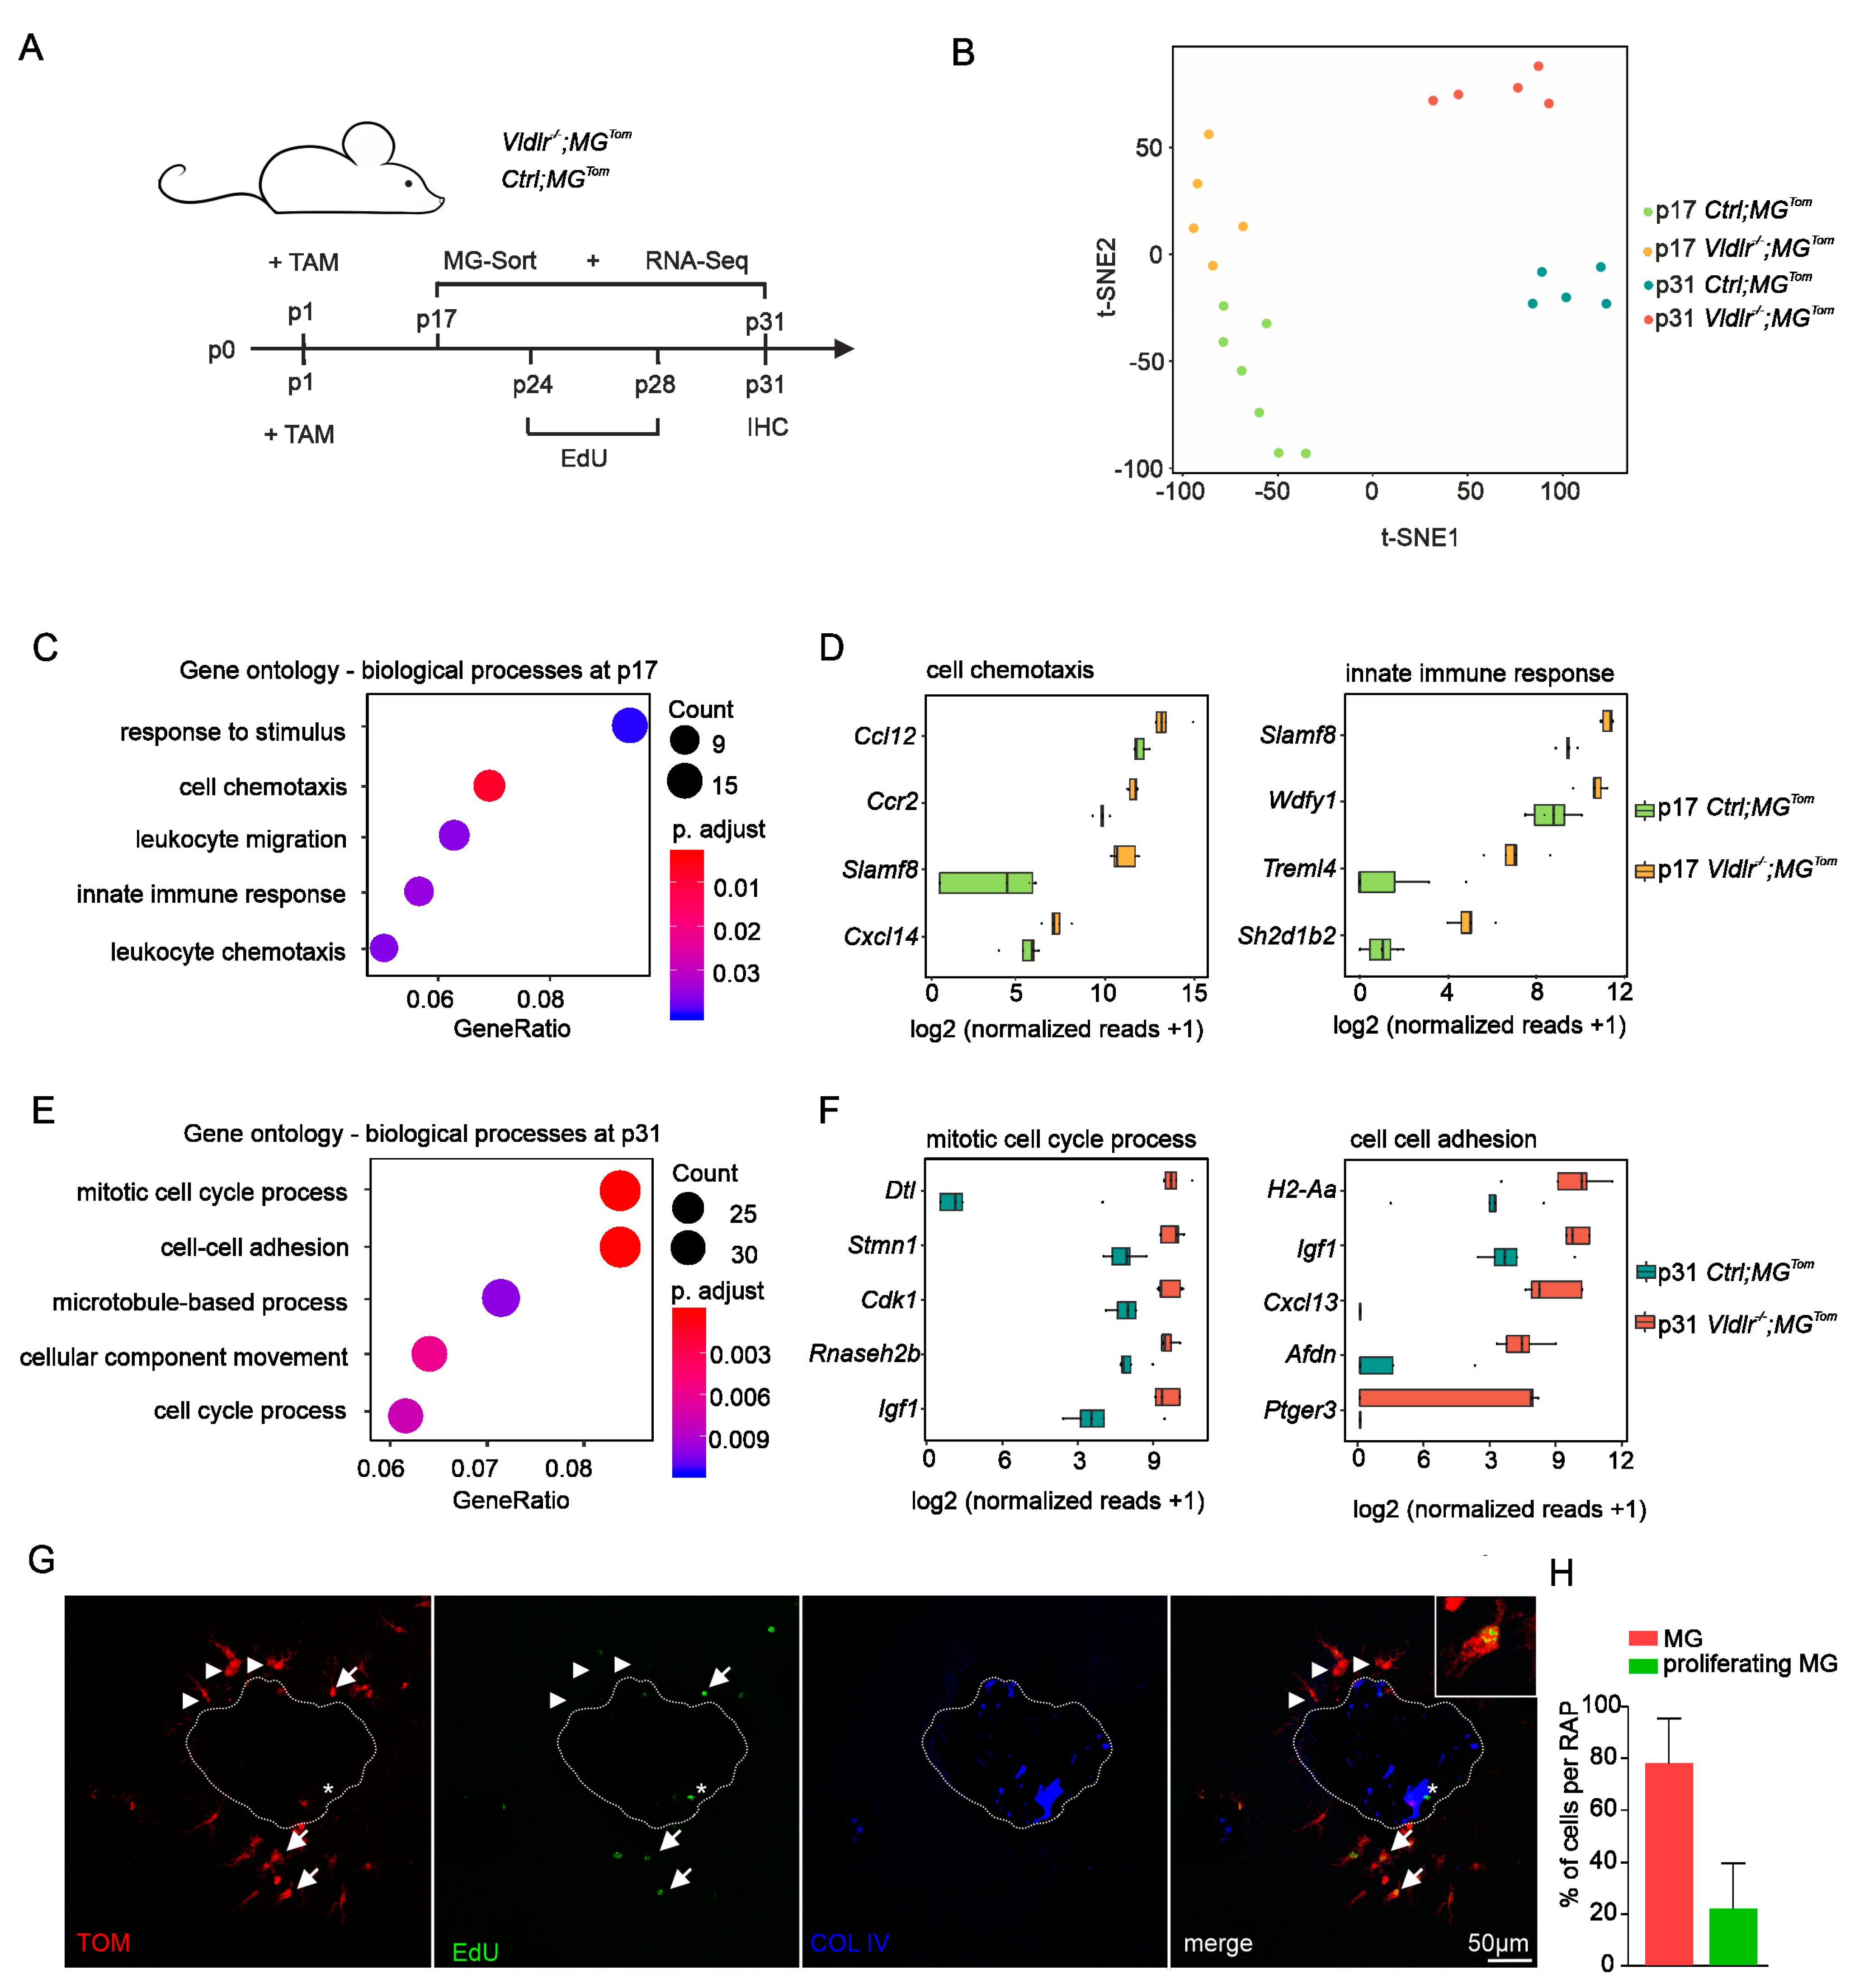
2.3. Transcriptional Profiling of Retinal Microglia during Early and Late RAP Formation
2.4. Proliferation of Retinal Microglia at Sites of RAP
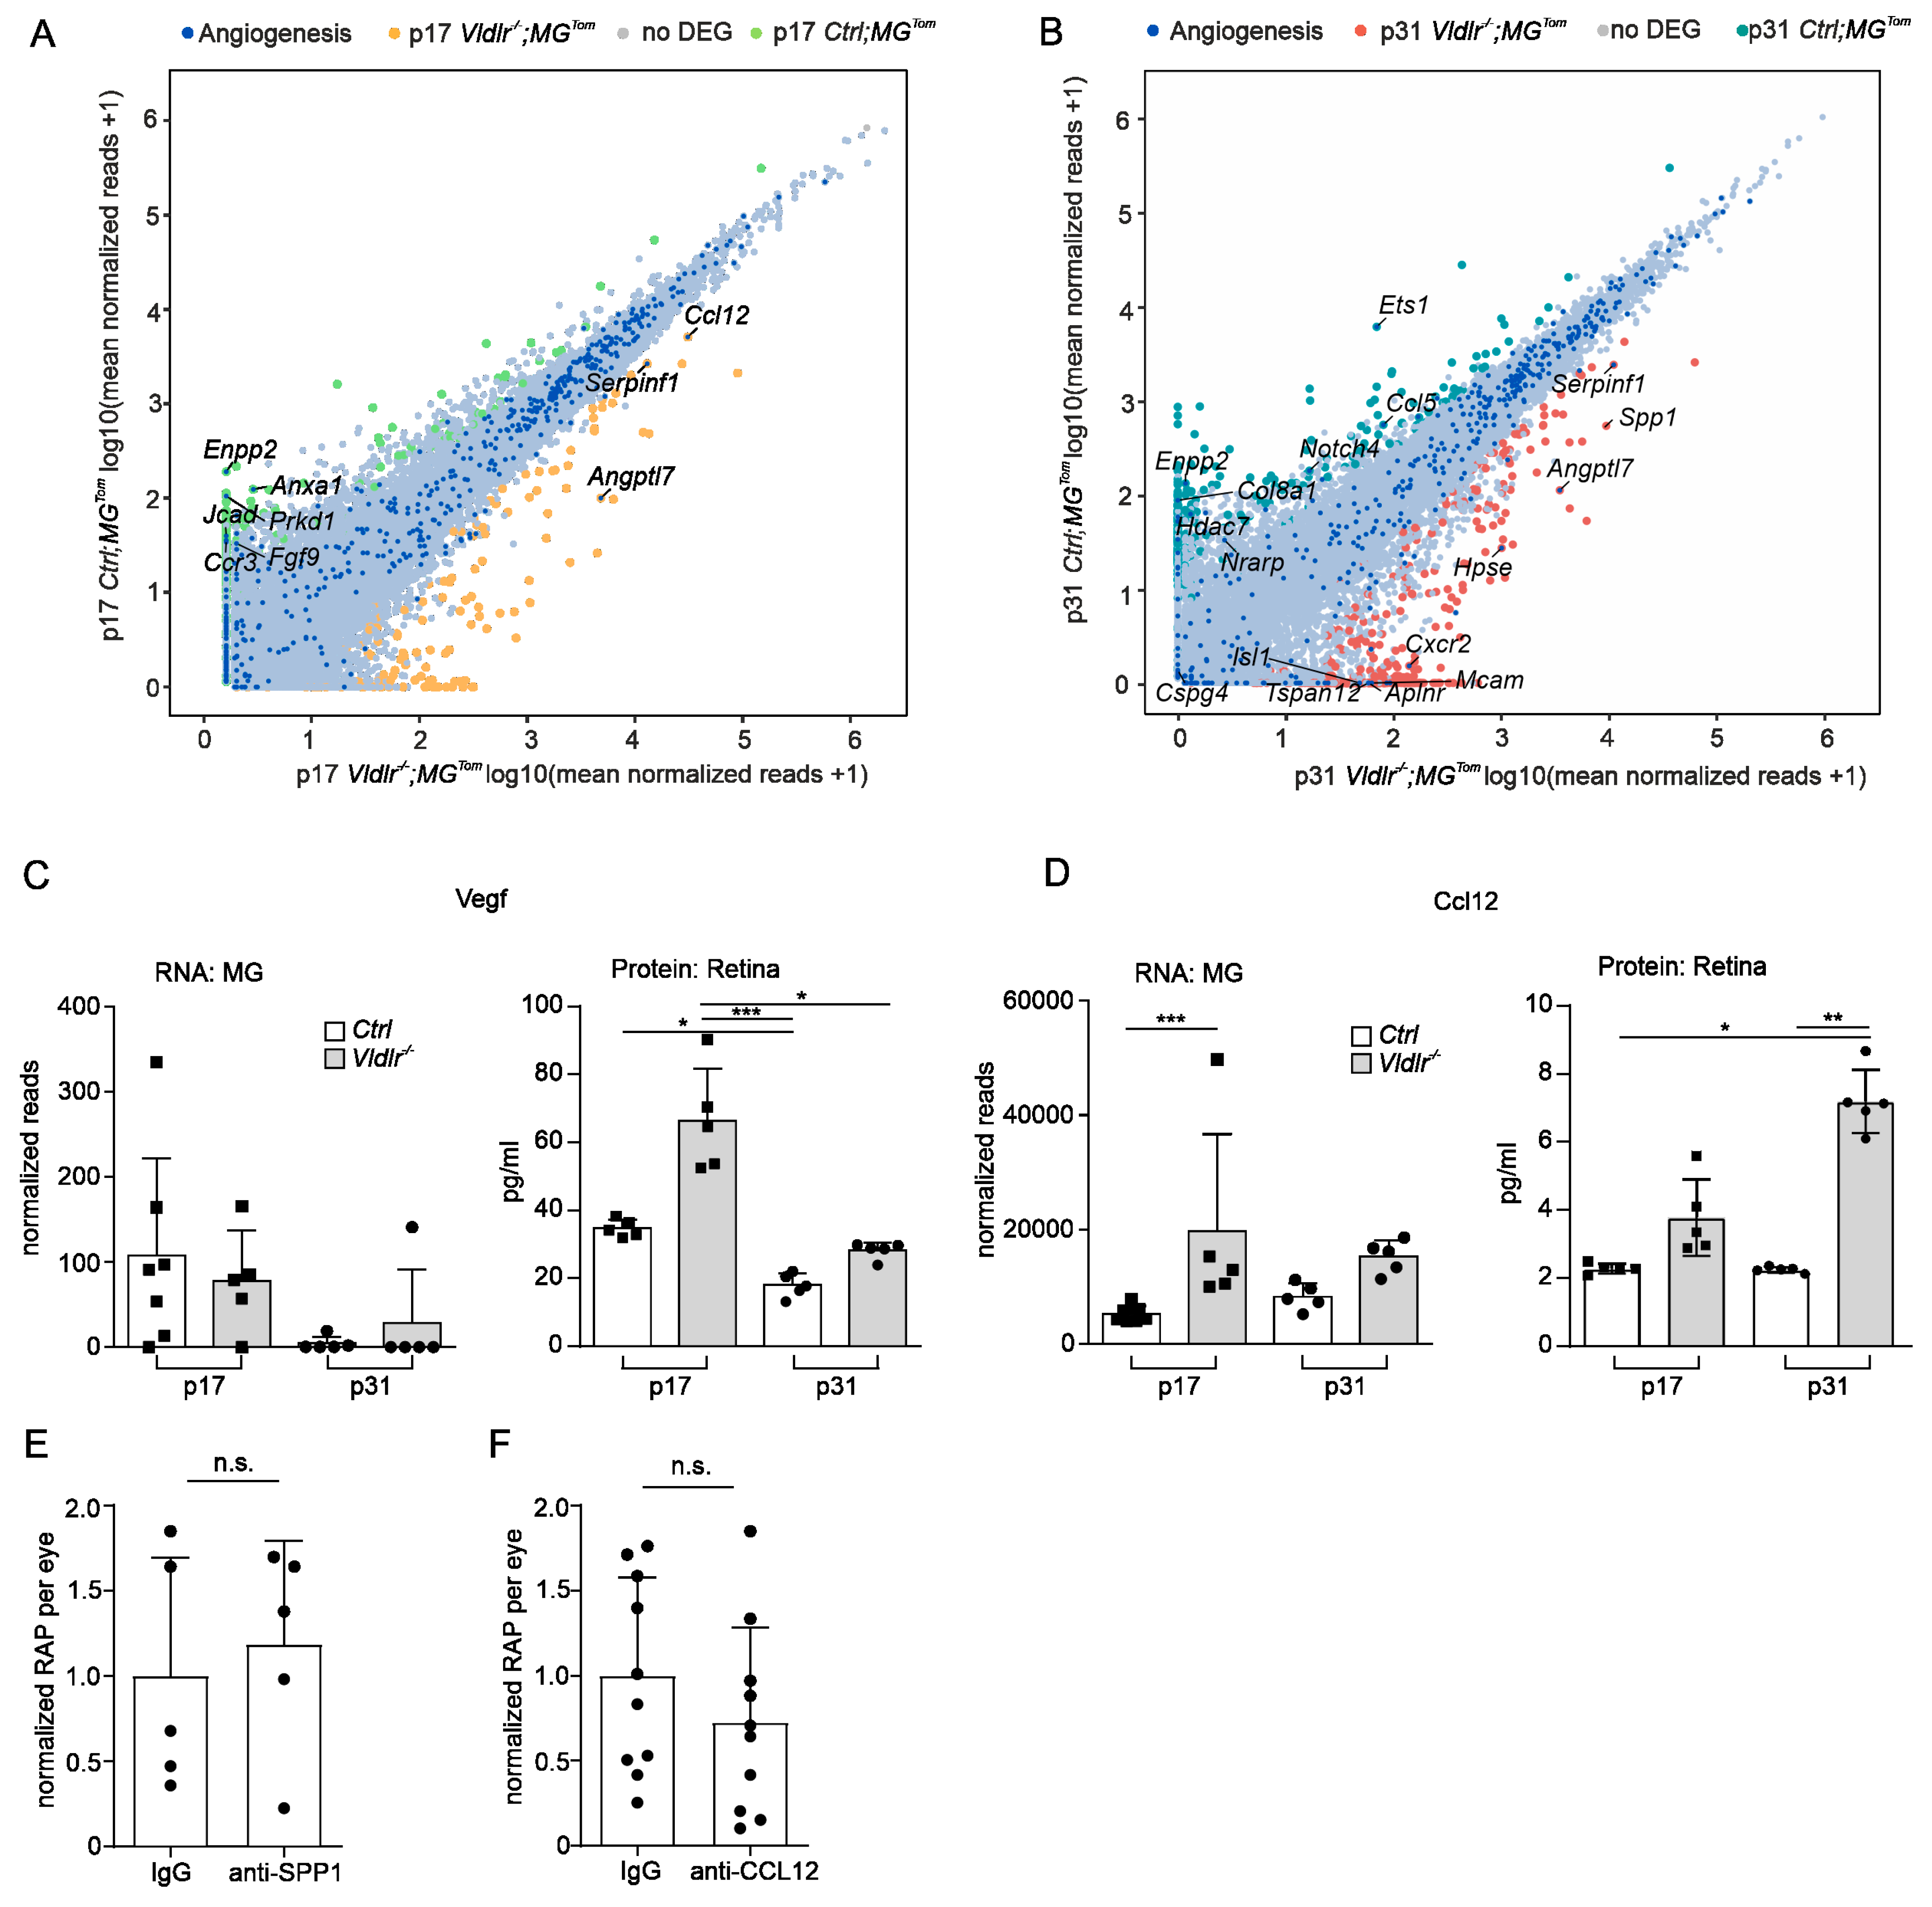
2.5. Angiogenic Potential of Retinal Microglia during RAP
3. Discussion
4. Materials and Methods
4.1. Mice
4.2. Tamoxifen Treatment
4.3. Fluorescence Microscopy
4.4. Identification of Microglia and Blood-Derived Macrophages
4.5. In Vivo EdU Proliferation Assay
4.6. Flow Cytometry
4.7. RNA Extraction
4.8. RNA Sequencing
4.9. Bioinformatics and Data Visualization
4.10. Protein Analysis
4.11. Antibody Treatment
4.12. Statistical Analysis
Author Contributions
Funding
Institutional Review Board Statement
Informed Consent Statement
Data Availability Statement
Acknowledgments
Conflicts of Interest
References
- Wong, W.L.; Su, X.; Li, X.; Cheung, C.M.G.; Klein, R.; Cheng, C.-Y.; Wong, T.Y. Global Prevalence of Age-Related Macular Degeneration and Disease Burden Projection for 2020 and 2040: A Systematic Review and Meta-Analysis. Lancet Glob. Health 2014, 2, e106–e116. [Google Scholar] [CrossRef] [Green Version]
- Gheorghe, A.; Mahdi, L.; Musat, O. Age-related macular degeneration. Rom. J. Ophthalmol. 2015, 59, 74–77. [Google Scholar] [PubMed]
- Chakravarthy, U.; Wong, T.Y.; Fletcher, A.; Piault, E.; Evans, C.; Zlateva, G.; Buggage, R.; Pleil, A.; Mitchell, P. Clinical Risk Factors for Age-Related Macular Degeneration: A Systematic Review and Meta-Analysis. BMC Ophthalmol. 2010, 10, 31. [Google Scholar] [CrossRef]
- Hartnett, M.E.; Weiter, J.J.; Staurenghi, G.; Elsner, A.E. Deep Retinal Vascular Anomalous Complexes in Advanced Age-Related Macular Degeneration. Ophthalmology 1996, 103, 2042–2053. [Google Scholar] [CrossRef]
- Spaide, R.F.; Jaffe, G.J.; Sarraf, D.; Freund, K.B.; Sadda, S.R.; Staurenghi, G.; Waheed, N.K.; Chakravarthy, U.; Rosenfeld, P.J.; Holz, F.G.; et al. Consensus Nomenclature for Reporting Neovascular Age-Related Macular Degeneration Data: Consensus on Neovascular Age-Related Macular Degeneration Nomenclature Study Group. Ophthalmology 2020, 127, 616–636. [Google Scholar] [CrossRef]
- Kuhn, D.; Meunier, I.; Soubrane, G.; Coscas, G. Imaging of Chorioretinal Anastomoses in Vascularized Retinal Pigment Epithelium Detachments. Arch. Ophthalmol. 1995, 113, 1392–1398. [Google Scholar] [CrossRef] [PubMed]
- Yannuzzi, L.A.; Negrão, S.; Iida, T.; Carvalho, C.; Rodriguez-Coleman, H.; Slakter, J.; Freund, K.B.; Sorenson, J.; Orlock, D.; Borodoker, N. Retinal Angiomatous Proliferation in Age-Related Macular Degeneration. Retina 2001, 21, 416–434. [Google Scholar] [CrossRef] [PubMed]
- Wang, C.; Zhang, R.; Zhang, Q.; Jin, H.; Wei, C.; Wu, C.; Mei, L.; Liu, Y.; Zhang, P. Cytokine Profiles and the Effect of Intravitreal Aflibercept Treatment on Experimental Choroidal Neovascularization. Ophthalmic Res. 2022, 65, 68–76. [Google Scholar] [CrossRef]
- Rosenfeld, P.J.; Brown, D.M.; Heier, J.S.; Boyer, D.S.; Kaiser, P.K.; Chung, C.Y.; Kim, R.Y.; MARINA Study Group. Ranibizumab for Neovascular Age-Related Macular Degeneration. N. Engl. J. Med. 2006, 355, 1419–1431. [Google Scholar] [CrossRef] [Green Version]
- Brown, D.M.; Kaiser, P.K.; Michels, M.; Soubrane, G.; Heier, J.S.; Kim, R.Y.; Sy, J.P.; Schneider, S.; ANCHOR Study Group. Ranibizumab versus Verteporfin for Neovascular Age-Related Macular Degeneration. N. Engl. J. Med. 2006, 355, 1432–1444. [Google Scholar] [CrossRef] [Green Version]
- Wecker, T.; Ehlken, C.; Bühler, A.; Lange, C.; Agostini, H.; Böhringer, D.; Stahl, A. Five-Year Visual Acuity Outcomes and Injection Patterns in Patients with pro-Re-Nata Treatments for AMD, DME, RVO and Myopic CNV. Br. J. Ophthalmol. 2017, 101, 353–359. [Google Scholar] [CrossRef] [PubMed] [Green Version]
- Krzystolik, M.G.; Afshari, M.A.; Adamis, A.P.; Gaudreault, J.; Gragoudas, E.S.; Michaud, N.A.; Li, W.; Connolly, E.; O’Neill, C.A.; Miller, J.W. Prevention of Experimental Choroidal Neovascularization with Intravitreal Anti-Vascular Endothelial Growth Factor Antibody Fragment. Arch. Ophthalmol. 2002, 120, 338–346. [Google Scholar] [CrossRef] [PubMed]
- Chang, Y.S.; Kim, J.H.; Kim, K.M.; Kim, J.W.; Lee, T.G.; Kim, C.G.; Cho, S.W. Long-Term Outcomes of Anti-Vascular Endothelial Growth Factor Therapy for Polypoidal Choroidal Vasculopathy. J. Ocul. Pharmacol. Ther. 2016, 32, 219–224. [Google Scholar] [CrossRef] [PubMed]
- Cho, H.J.; Lee, T.G.; Han, S.Y.; Kim, H.S.; Kim, J.H.; Han, J.I.; Lew, Y.J.; Kim, J.W. Long-Term Visual Outcome and Prognostic Factors of Intravitreal Anti-Vascular Endothelial Growth Factor Treatment for Retinal Angiomatous Proliferation. Graefe’s Arch. Clin. Exp. Ophthalmol. 2016, 254, 23–30. [Google Scholar] [CrossRef] [PubMed]
- Kim, J.H.; Chang, Y.S.; Kim, J.W.; Kim, C.G.; Lee, D.W.; Kim, Y.J. Morphologic Features Associated with Fibrotic Scarring after Anti-Vascular Endothelial Growth Factor Therapy in Polypoidal Choroidal Vasculopathy. Retina 2018, 38, 2168–2176. [Google Scholar] [CrossRef] [PubMed]
- Tenbrock, L.; Wolf, J.; Boneva, S.; Schlecht, A.; Agostini, H.; Wieghofer, P.; Schlunck, G.; Lange, C. Subretinal Fibrosis in Neovascular Age-Related Macular Degeneration: Current Concepts, Therapeutic Avenues, and Future Perspectives. Cell Tissue Res. 2021, 1–15. [Google Scholar] [CrossRef]
- Shimada, H.; Kawamura, A.; Mori, R.; Yuzawa, M. Clinicopathological Findings of Retinal Angiomatous Proliferation. Graefe’s Arch. Clin. Exp. Ophthalmol. 2007, 245, 295–300. [Google Scholar] [CrossRef]
- Tsai, A.S.H.; Cheung, N.; Gan, A.T.L.; Jaffe, G.J.; Sivaprasad, S.; Wong, T.Y.; Cheung, C.M.G. Retinal Angiomatous Proliferation. Surv. Ophthalmol. 2017, 62, 462–492. [Google Scholar] [CrossRef]
- Goldmann, T.; Wieghofer, P.; Müller, P.F.; Wolf, Y.; Varol, D.; Yona, S.; Brendecke, S.M.; Kierdorf, K.; Staszewski, O.; Datta, M.; et al. A New Type of Microglia Gene Targeting Shows TAK1 to Be Pivotal in CNS Autoimmune Inflammation. Nat. Neurosci. 2013, 16, 1618–1626. [Google Scholar] [CrossRef]
- Boeck, M.; Thien, A.; Wolf, J.; Hagemeyer, N.; Laich, Y.; Yusuf, D.; Backofen, R.; Zhang, P.; Boneva, S.; Stahl, A.; et al. Temporospatial Distribution and Transcriptional Profile of Retinal Microglia in the Oxygen-Induced Retinopathy Mouse Model. Glia 2020, 68, 1859–1873. [Google Scholar] [CrossRef]
- Wieghofer, P.; Hagemeyer, N.; Sankowski, R.; Schlecht, A.; Staszewski, O.; Amann, L.; Gruber, M.; Koch, J.; Hausmann, A.; Zhang, P.; et al. Mapping the Origin and Fate of Myeloid Cells in Distinct Compartments of the Eye by Single-Cell Profiling. EMBO J. 2021, 40, e105123. [Google Scholar] [CrossRef] [PubMed]
- Heckenlively, J.R.; Hawes, N.L.; Friedlander, M.; Nusinowitz, S.; Hurd, R.; Davisson, M.; Chang, B. Mouse Model of Subretinal Neovascularization with Choroidal Anastomosis. Retina 2003, 23, 518–522. [Google Scholar] [CrossRef] [PubMed]
- Zhang, P.; Schlecht, A.; Wolf, J.; Boneva, S.; Laich, Y.; Koch, J.; Ludwig, F.; Boeck, M.; Thien, A.; Härdtner, C.; et al. The Role of Interferon Regulatory Factor 8 for Retinal Tissue Homeostasis and Development of Choroidal Neovascularisation. J. Neuroinflamm. 2021, 18, 215. [Google Scholar] [CrossRef] [PubMed]
- Dai, J.; Peng, L.; Fan, K.; Wang, H.; Wei, R.; Ji, G.; Cai, J.; Lu, B.; Li, B.; Zhang, D.; et al. Osteopontin Induces Angiogenesis through Activation of PI3K/AKT and ERK1/2 in Endothelial Cells. Oncogene 2009, 28, 3412–3422. [Google Scholar] [CrossRef] [PubMed] [Green Version]
- Beguier, F.; Housset, M.; Roubeix, C.; Augustin, S.; Zagar, Y.; Nous, C.; Mathis, T.; Eandi, C.; Benchaboune, M.; Drame-Maigné, A.; et al. The 10q26 Risk Haplotype of Age-Related Macular Degeneration Aggravates Subretinal Inflammation by Impairing Monocyte Elimination. Immunity 2020, 53, 429–441.e8. [Google Scholar] [CrossRef] [PubMed]
- Schlecht, A.; Zhang, P.; Wolf, J.; Thien, A.; Rosmus, D.-D.; Boneva, S.; Schlunck, G.; Lange, C.; Wieghofer, P. Secreted Phosphoprotein 1 Expression in Retinal Mononuclear Phagocytes Links Murine to Human Choroidal Neovascularization. Front. Cell Dev. Biol. 2020, 8, 618598. [Google Scholar] [CrossRef] [PubMed]
- Dorrell, M.I.; Aguilar, E.; Jacobson, R.; Yanes, O.; Gariano, R.; Heckenlively, J.; Banin, E.; Ramirez, G.A.; Gasmi, M.; Bird, A.; et al. Antioxidant or Neurotrophic Factor Treatment Preserves Function in a Mouse Model of Neovascularization-Associated Oxidative Stress. J. Clin. Investig. 2009, 119, 611–623. Available online: https://www.jci.org/articles/view/35977/figure/4 (accessed on 30 May 2018). [CrossRef] [Green Version]
- Sun, Y.; Lin, Z.; Liu, C.-H.; Gong, Y.; Liegl, R.; Fredrick, T.W.; Meng, S.S.; Burnim, S.B.; Wang, Z.; Akula, J.D.; et al. Inflammatory Signals from Photoreceptor Modulate Pathological Retinal Angiogenesis via C-Fos. J. Exp. Med. 2017, 214, 1753–1767. [Google Scholar] [CrossRef]
- Chen, Y.; Hu, Y.; Lu, K.; Flannery, J.G.; Ma, J.-X. Very Low Density Lipoprotein Receptor, a Negative Regulator of the Wnt Signaling Pathway and Choroidal Neovascularization. J. Biol. Chem. 2007, 282, 34420–34428. [Google Scholar] [CrossRef] [Green Version]
- Usui-Ouchi, A.; Usui, Y.; Kurihara, T.; Aguilar, E.; Dorrell, M.I.; Ideguchi, Y.; Sakimoto, S.; Bravo, S.; Friedlander, M. Retinal Microglia Are Critical for Subretinal Neovascular Formation. JCI Insight 2020, 5, e137317. [Google Scholar] [CrossRef]
- Kataoka, K.; Nishiguchi, K.M.; Kaneko, H.; van Rooijen, N.; Kachi, S.; Terasaki, H. The Roles of Vitreal Macrophages and Circulating Leukocytes in Retinal Neovascularization. Investig. Ophthalmol. Vis. Sci. 2011, 52, 1431–1438. [Google Scholar] [CrossRef] [PubMed] [Green Version]
- O’Donnell, S.L.; Frederick, T.J.; Krady, J.K.; Vannucci, S.J.; Wood, T.L. IGF-I and Microglia/Macrophage Proliferation in the Ischemic Mouse Brain. Glia 2002, 39, 85–97. [Google Scholar] [CrossRef] [PubMed]
- Pepe, G.; De Maglie, M.; Minoli, L.; Villa, A.; Maggi, A.; Vegeto, E. Selective Proliferative Response of Microglia to Alternative Polarization Signals. J. Neuroinflamm. 2017, 14, 236. [Google Scholar] [CrossRef] [PubMed] [Green Version]
- Lange, C.; Ehlken, C.; Martin, G.; Konzok, K.; Moscoso Del Prado, J.; Hansen, L.L.; Agostini, H.T. Intravitreal Injection of the Heparin Analog 5-Amino-2-Naphthalenesulfonate Reduces Retinal Neovascularization in Mice. Exp. Eye Res. 2007, 85, 323–327. [Google Scholar] [CrossRef]
- Lange, C.; Mowat, F.; Sayed, H.; Mehad, M.; Duluc, L.; Piper, S.; Luhmann, U.; Nandi, M.; Kelly, P.; Smith, A.; et al. Dimethylarginine Dimethylaminohydrolase-2 Deficiency Promotes Vascular Regeneration and Attenuates Pathological Angiogenesis. Exp. Eye Res. 2016, 147, 148–155. [Google Scholar] [CrossRef] [Green Version]
- Schindelin, J.; Arganda-Carreras, I.; Frise, E.; Kaynig, V.; Longair, M.; Pietzsch, T.; Preibisch, S.; Rueden, C.; Saalfeld, S.; Schmid, B.; et al. Fiji: An Open-Source Platform for Biological-Image Analysis. Nat. Methods 2012, 9, 676–682. [Google Scholar] [CrossRef] [Green Version]
- Boneva, S.; Schlecht, A.; Böhringer, D.; Mittelviefhaus, H.; Reinhard, T.; Agostini, H.; Auw-Haedrich, C.; Schlunck, G.; Wolf, J.; Lange, C. 3′ MACE RNA-Sequencing Allows for Transcriptome Profiling in Human Tissue Samples after Long-Term Storage. Lab. Investig. 2020, 100, 1345–1355. [Google Scholar] [CrossRef]
- Schlecht, A.; Boneva, S.; Gruber, M.; Zhang, P.; Horres, R.; Bucher, F.; Auw-Haedrich, C.; Hansen, L.; Stahl, A.; Hilgendorf, I.; et al. Transcriptomic Characterization of Human Choroidal Neovascular Membranes Identifies Calprotectin as a Novel Biomarker for Patients with Age-Related Macular Degeneration. Am. J. Pathol. 2020, 190, 1632–1642. [Google Scholar] [CrossRef]
- Frankish, A.; Diekhans, M.; Ferreira, A.-M.; Johnson, R.; Jungreis, I.; Loveland, J.; Mudge, J.M.; Sisu, C.; Wright, J.; Armstrong, J.; et al. GENCODE Reference Annotation for the Human and Mouse Genomes. Nucleic Acids Res. 2019, 47, D766–D773. [Google Scholar] [CrossRef] [Green Version]
- Dobin, A.; Davis, C.A.; Schlesinger, F.; Drenkow, J.; Zaleski, C.; Jha, S.; Batut, P.; Chaisson, M.; Gingeras, T.R. STAR: Ultrafast Universal RNA-Seq Aligner. Bioinformatics 2013, 29, 15–21. [Google Scholar] [CrossRef]
- Liao, Y.; Smyth, G.K.; Shi, W. FeatureCounts: An Efficient General Purpose Program for Assigning Sequence Reads to Genomic Features. Bioinformatics 2014, 30, 923–930. [Google Scholar] [CrossRef] [PubMed] [Green Version]
- Yates, A.D.; Achuthan, P.; Akanni, W.; Allen, J.; Allen, J.; Alvarez-Jarreta, J.; Amode, M.R.; Armean, I.M.; Azov, A.G.; Bennett, R.; et al. Ensembl 2020. Nucleic Acids Res. 2020, 48, D682–D688. [Google Scholar] [CrossRef] [PubMed]
- Van der Maaten, L. Accelerating T-SNE Using Tree-Based Algorithms. J. Mach. Learn. Res. 2015, 15, 3221–3245. [Google Scholar]
- Love, M.I.; Huber, W.; Anders, S. Moderated Estimation of Fold Change and Dispersion for RNA-Seq Data with DESeq2. Genome Biol. 2014, 15, 550. [Google Scholar] [CrossRef] [Green Version]
- Yu, G.; Wang, L.-G.; Han, Y.; He, Q.-Y. ClusterProfiler: An R Package for Comparing Biological Themes among Gene Clusters. OMICS J. Integr. Biol. 2012, 16, 284–287. [Google Scholar] [CrossRef]
- Wickham, H. Ggplot2: Elegant Graphics for Data Analysis; Springer: New York, NY, USA, 2016. [Google Scholar]
- The Gene Ontology Consortium. The Gene Ontology Resource: 20 Years and Still GOing Strong. Nucleic Acids Res. 2019, 47, D330–D338. [Google Scholar] [CrossRef] [Green Version]


Publisher’s Note: MDPI stays neutral with regard to jurisdictional claims in published maps and institutional affiliations. |
© 2022 by the authors. Licensee MDPI, Basel, Switzerland. This article is an open access article distributed under the terms and conditions of the Creative Commons Attribution (CC BY) license (https://creativecommons.org/licenses/by/4.0/).
Share and Cite
Schlecht, A.; Wolf, J.; Boneva, S.; Prinz, G.; Braunger, B.M.; Wieghofer, P.; Agostini, H.; Schlunck, G.; Lange, C. Transcriptional and Distributional Profiling of Microglia in Retinal Angiomatous Proliferation. Int. J. Mol. Sci. 2022, 23, 3443. https://doi.org/10.3390/ijms23073443
Schlecht A, Wolf J, Boneva S, Prinz G, Braunger BM, Wieghofer P, Agostini H, Schlunck G, Lange C. Transcriptional and Distributional Profiling of Microglia in Retinal Angiomatous Proliferation. International Journal of Molecular Sciences. 2022; 23(7):3443. https://doi.org/10.3390/ijms23073443
Chicago/Turabian StyleSchlecht, Anja, Julian Wolf, Stefaniya Boneva, Gabriele Prinz, Barbara M. Braunger, Peter Wieghofer, Hansjürgen Agostini, Günther Schlunck, and Clemens Lange. 2022. "Transcriptional and Distributional Profiling of Microglia in Retinal Angiomatous Proliferation" International Journal of Molecular Sciences 23, no. 7: 3443. https://doi.org/10.3390/ijms23073443