Article

Biodiversity and Metabolic Potential of Bacteria in Bulk Soil from the Peri-Root Zone of Black Alder (Alnus glutinosa), Silver Birch (Betula pendula) and Scots Pine (Pinus sylvestris)

by
Anna Gałązka
1,*,
Anna Marzec-Grządziel
1,
Milan Varsadiya
2,
Jacek Niedźwiecki
3,
Karolina Gawryjołek
1,
Karolina Furtak
1,
Marcin Przybyś
4 and
Jarosław Grządziel
1
1
Department of Agricultural Microbiology, Institute of Soil Science and Plant Cultivation—State Research Institute, Czartoryskich St. 8, 24-100 Pulawy, Poland
2
Department of Ecosystems Biology, University of South Bohemia in České Budějovice, Branišovská 31, 370 05 České Budějovice, Czech Republic
3
Department of Soil Science Erosion and Land Conservation, Institute of Soil Science and Plant Cultivation—State Research Institute, Czartoryskich 8, 24-100 Pulawy, Poland
4
Department of Plant Breeding and Biotechnology, Institute of Soil Science and Plant Cultivation—State Research Institute, Czartoryskich St. 8, 24-100 Pulawy, Poland
*
Author to whom correspondence should be addressed.
Int. J. Mol. Sci. 2022, 23(5), 2633; https://doi.org/10.3390/ijms23052633
Submission received: 10 January 2022 / Revised: 24 February 2022 / Accepted: 25 February 2022 / Published: 27 February 2022

Abstract

:
The formation of specific features of forest habitats is determined by the physical, chemical, and biological properties of the soil. The aim of the study was to determine the structural and functional biodiversity of soil microorganisms inhabiting the bulk soil from the peri-root zone of three tree species: Alnus glutinosa, Betula pendula, and Pinus sylvestris. Soil samples were collected from a semi-deciduous forest located in an area belonging to the Agricultural Experimental Station IUNG-PIB in Osiny, Poland. The basic chemical and biological parameters of soils were determined, as well as the structural diversity of bacteria (16S ribosomal RNA (rRNA) sequencing) and the metabolic profile of microorganisms (Biolog EcoPlates). The bulk soils collected from peri-root zone of A. glutinosa were characterized by the highest enzymatic activities. Moreover, the highest metabolic activities on EcoPlates were observed in bulk soil collected in the proximity of the root system the A. glutinosa and B. pendula. In turn, the bulk soil collected from peri-root zone of P. sylvestris had much lower biological activity and a lower metabolic potential. The most metabolized compounds were L-phenylalanine, L-asparagine, D-mannitol, and gamma-hydroxy-butyric acid. The highest values of the diversity indicators were in the soils collected in the proximity of the root system of A. glutinosa and B. pendula. The bulk soil collected from P. sylvestris peri-root zone was characterized by the lowest Shannon’s diversity index. In turn, the evenness index (E) was the highest in soils collected from the P. sylvestris, which indicated significantly lower diversity in these soils. The most abundant classes of bacteria in all samples were Actinobacteria, Acidobacteria_Gp1, and Alphaproteobacteria. The classes Bacilli, Thermoleophilia, Betaproteobacteria, and Subdivision3 were dominant in the B. pendula bulk soil. Streptosporangiales was the most significantly enriched order in the B. pendula soil compared with the A. glutinosa and P. sylvestris. There was a significantly higher mean proportion of aerobic nitrite oxidation, nitrate reduction, sulphate respiration, and sulfur compound respiration in the bulk soil of peri-root zone of A. glutinosa. Our research confirms that the evaluation of soil biodiversity and metabolic potential of bacteria can be of great assistance in a quality and health control tool in the soils of forested areas and in the forest production. Identification of bacteria that promote plant growth and have a high biotechnological potential can be assume a substantial improvement in the ecosystem and use of the forest land.

1. Introduction

Forests are natural ecosystems with multi-layered plant communities, dominated by trees. Because forests have many functions—including production, ecological, and social—it is important to preserve their species diversity and good health of stands for future generations [1,2]. Soil is one of the basic elements of forest habitats that guarantees the proper growth and development of an ecosystem. The use of forest soil properties is the basis for sustainable and proper forest management [3].
One of the key elements of forest soil is microorganisms. Bacteria and fungi are an integral part of the soil environment and perform a number of positive functions in it. They affect the functioning of ecosystems, plant health, and soil structure and productivity [4,5]. In forest ecosystems, edaphic conditions, plants, and soil microorganisms are closely related [6,7]. These relationships are determined by the physical, chemical, and biological properties of the soil [8,9,10]. Moreover, the weather conditions in a given year and season have a significant impact on changes in the biological activity of soils. The properties of soils and their biochemical processes are regulated by soil microorganisms [11,12].
A forest habitat is defined as a set of relatively persistent climatic, topographic, water and soil factors creating conditions for forest life [3]. Undergrowth vegetation in forests deformed by humans often does not reflect the possibilities of habitats, but only the possibilities of surface soil levels, not taking into account their deeper layers, which are accessible to tree roots [13,14,15]. The relationships between soils and vegetation in forests have been the subject of many studies [16,17,18,19]. They mainly concern the search for relationships between soil types, subtypes, and types of natural vegetation, with much less focus on soil biology and the microbiological changes that occur there [20,21]. Moreover, significantly little research has been conducted in semi-deciduous forests. This type of forest accounts for a large percentage of forests in Poland. In our research, we chose the three most common tree species from a semi-deciduous forest: Alnus glutinosa, Betula pendula, and Pinus sylvestris.
Semi-deciduous forest soils are the result of many years of relationships with trees [3]. Organic matter systematically reaches the soil, and the specificity and rate of decomposition of organic matter depend on the tree species. Decomposition products, also differentiated depending on the nature of the stand, affect the soil in a natural way when they are introduced into the soil and participate in the formation of characteristic elements of its morphology. Organic matter and its decomposition products cause soil acidification, leaching of elements, supply of nutrients, and modification of sorption properties [22,23]. In turn, the effect of soil on vegetation is most notable in the characteristic species composition of the natural forest complex related to the properties of a given part of the soil [3,24]. In the almost common view of foresters, soil is the least changed, most stable indicator complex and could be used to diagnose a habitat in any case, even where there is no tree stand and typically developed forest floor vegetation [24,25].
The use of indicators of soil biological activity to assess its fertility and productivity is well known. The diversity of soil microorganisms could be considered for an overall assessment of the bacterial composition and comparison among samples, or it could be used to identify the composition of the soil microbial community [26]. If the goal is to understand the function of the microorganisms and possible changes in it, it is sufficient to use known fingerprint methods, such as Biolog EcoPlates. Detailed knowledge of the composition of the soil microorganism composition requires a different analytical approach compared with the DNA extracted from soil [16].
Metagenomic is a method of analyzing the structure of microorganisms inhabiting a given microbiome (e.g., forest soil) [27,28]. By sequencing variable fragments in genomes, one can understand the genetic diversity, population composition, and ecological impact of microorganisms in the studied environment [29,30]. Information obtained from sequencing, interpreted in terms of the bacterial composition and maintaining its homeostasis, may constitute valuable knowledge regarding environmental protection of the forest ecosystem [31,32]. The state of knowledge regarding research on the biological activity of soils in individual forest habitats is insufficient. Currently, in forest management, these indicators are used to a negligible extent [33,34]. Little is known in particular about the composition of microorganisms inhabiting the peri-root zone of trees and about their functions.
The aim of this study was to determine the structural and functional diversity of composition of microbial population of bacteria in the bulk soil from peri-root zone of three selected tree species: the black alder (Alnus glutinosa), the white birch (Betula pendula), and the Scots pine (Pinus sylvestris). The hypothesis is that each soil taken in the proximity of the root system of tree species has its own unique bacterial composition and related metabolic functions.

2. Results

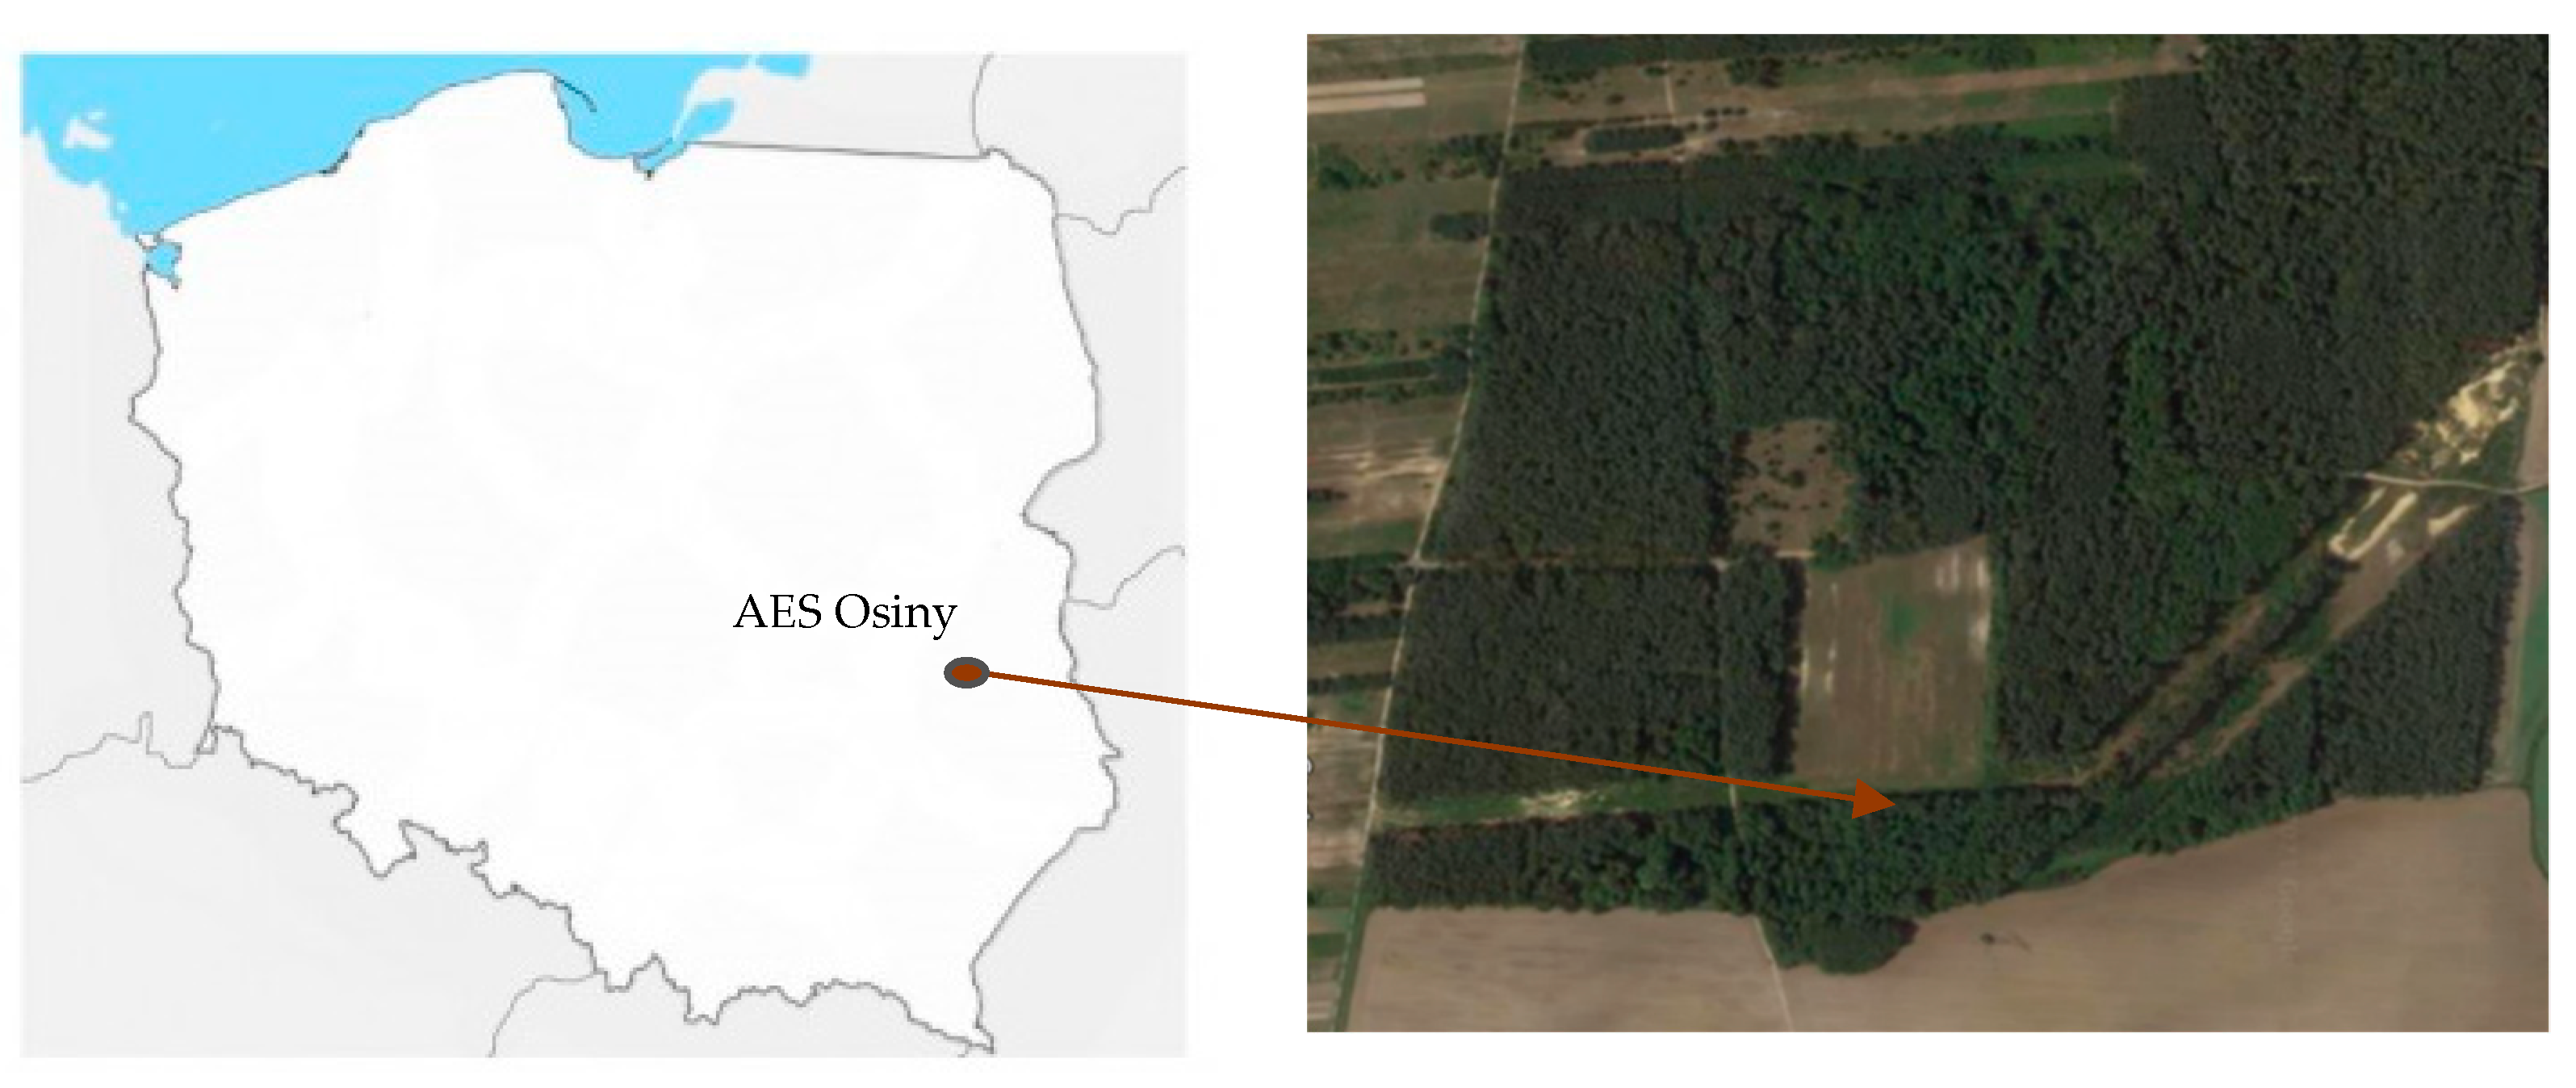
2.1. Field Site and Soil Chemical Analyses

Soil samples were collected in August 2019 and 2020 from a semi-deciduous forest located in an area belonging to the Agricultural Experimental Station IUNG-PIB in Osiny, Poland (51°27′57.3″ N 22°02′14.3″ E). The dominant tree species in the study area are P. sylvestris, B. pendula, and A. glutinosa. Samples were taken in the proximity of the root system tree root layers (0–20 cm) according to the Polish Standard [35]. The peri-root zone soil covers of the study area are mainly formed from postglacial sands. According to the World Reference Base soil classification system, the dominant soil types in this area are Arenosols and Brunic Arenosols.
Analysis of the particle size distribution showed that the sand fraction dominated all soil samples, with >90% in all samples (Table 1). The investigated soils had a very low clay fraction (<1%) (Table 1). The soils had a very low organic carbon content, with values ranging from 0.640% to 1.830% depending on the tree species (Table 1) [36]. The bulk soil from P. sylvestris had the lowest organic carbon content, while the soil from B. pendula had the highest content. The sandy forest soils were very poor in the macroelements phosphorus, potassium, and magnesium (Table 1). However, there was some difference in the phosphorus content depending on the stand type. There was a higher phosphorus content in B. pendula stands (10.192 mg P2O5 ∙ 100 mg−1 of soil) and A. glutinosa stands (6.170 mg P2O5 ∙ 100 mg−1 of soil) compared with P. sylvestris stands (1.115 mg P2O5 ∙100 mg−1 of soil) (Table 1). For potassium, B. pendula stands had the highest content (6.354 mg P2O5 ∙ 100 mg−1 of soil) compared with P. sylvestris stands (1.280 mg P2O5 ∙ 100 mg−1 of soil) and A. glutinosa stands (1.014 mg P2O5 ∙ 100 mg−1 of soil) (Table 1). In the case of magnesium, B. pendula stands had the highest content and A. glutinosa stands had the lowest (Table 1). The same relationship was noted for total nitrogen content: B. pendula stands had more of this component compared with the other tree species (Table 1). All investigated soil samples exhibited a clear acids pH. However, the lowest pH values were recorded under the pine stand (Table 1).

2.2. Enzymatic Activities

The soils collected from the peri-root zone of black alder, silver birch, and Scots pine had high enzymatic activities. Determination of DHA, AcP, and AlP in the soil samples provided us with a large amount of information about the biological characteristic of the soil. Table 2 shows the results of the dehydrogenase, acid, and alkaline phosphatase activities in soils collected from the bulk soils in 2019–2020. The years 2019 and 2020 were very similar in terms of weather conditions (temperature and rainfall). Nevertheless, the weather conditions were of great importance in determining the enzymatic activity of soils. The highest dehydrogenase activity was found in 2019 in soils collected from the A. glutinosa stands (26.270–51.504 μg formazan/g dry matter (d.m.) of soil/24 h). In 2020 also, the highest dehydrogenase activity was also found in the A. glutinosa stands (19.952–25.067 μg formazan/g d.m. of soil/24 h). The bulk soil collected from P. sylvestris stands had the lowest dehydrogenase activity in both 2019 and 2020. Similar results were obtained in the case of phosphatase activity. The bulk soils collected from the A. glutinosa stands in both 2019 and 2020 had the highest acid phosphatase activity. The P. sylvestris stands had significantly lower acid phosphatase activity (13.778–18.471 μg p-nitrophenol/g d.m. of soil/h). The phosphatase and dehydrogenase activities in the B. pendula bulk soil were between the A. glutinosa and P. sylvestris (Table 2).

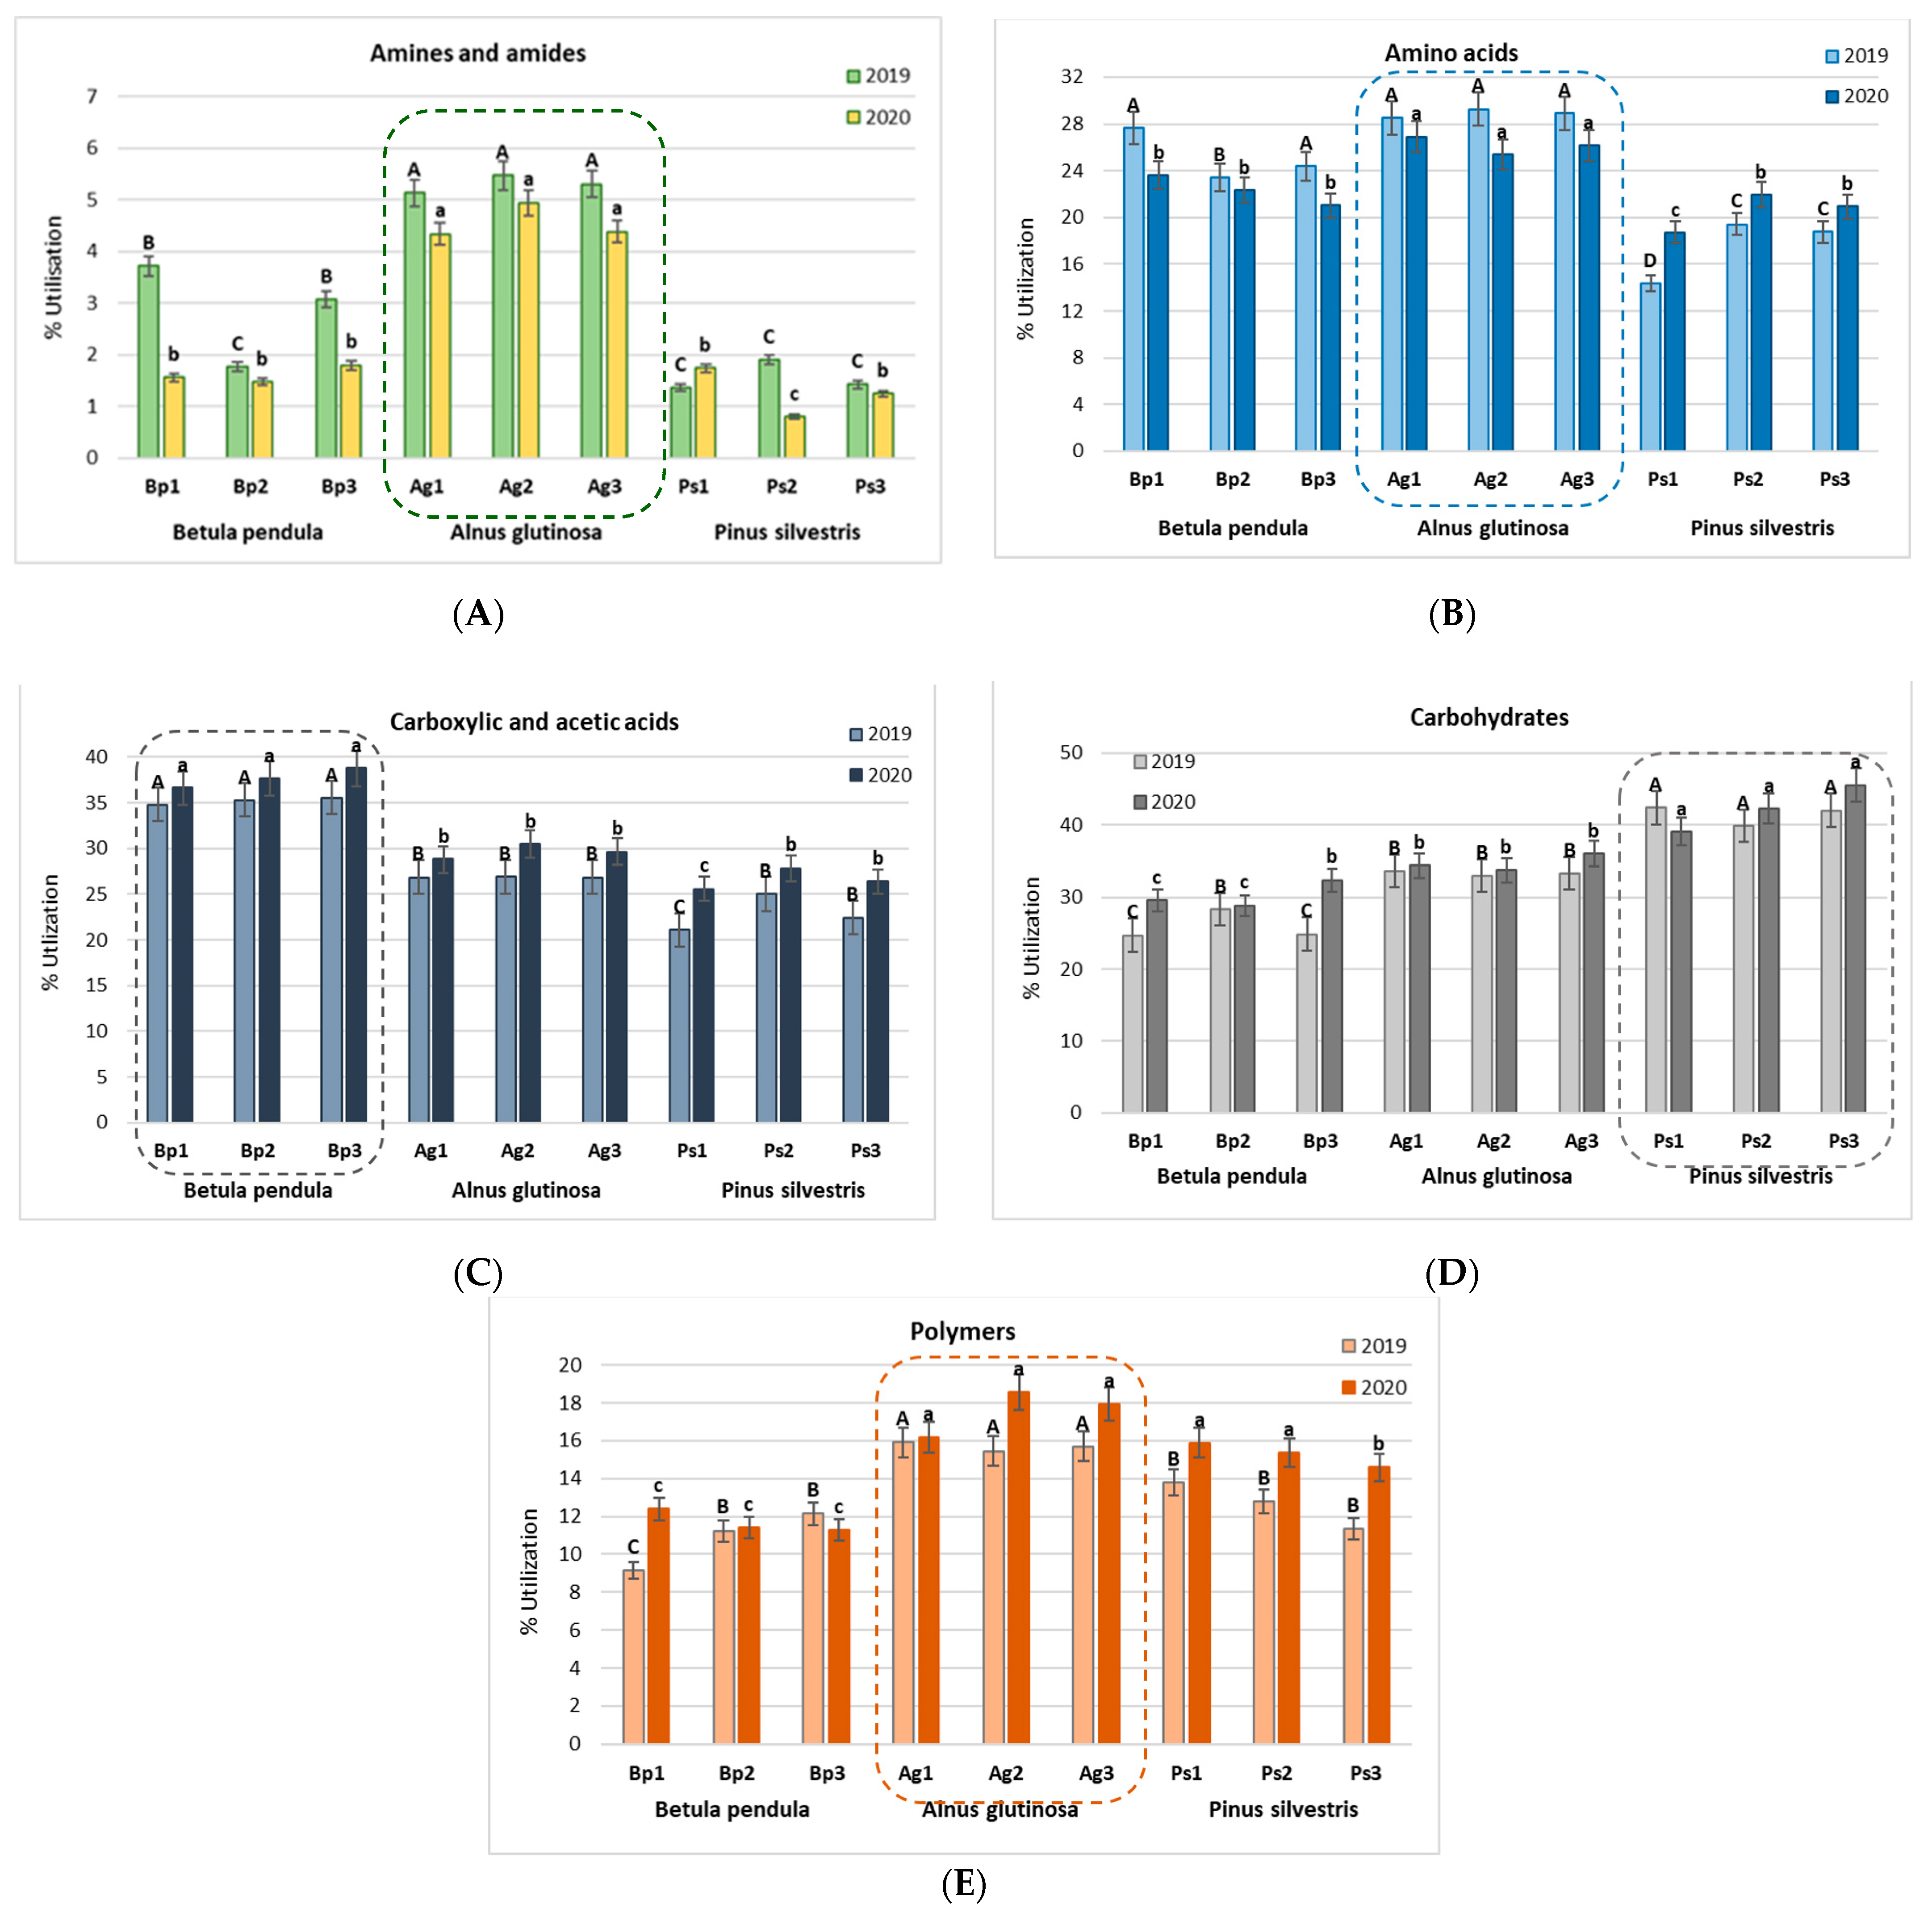
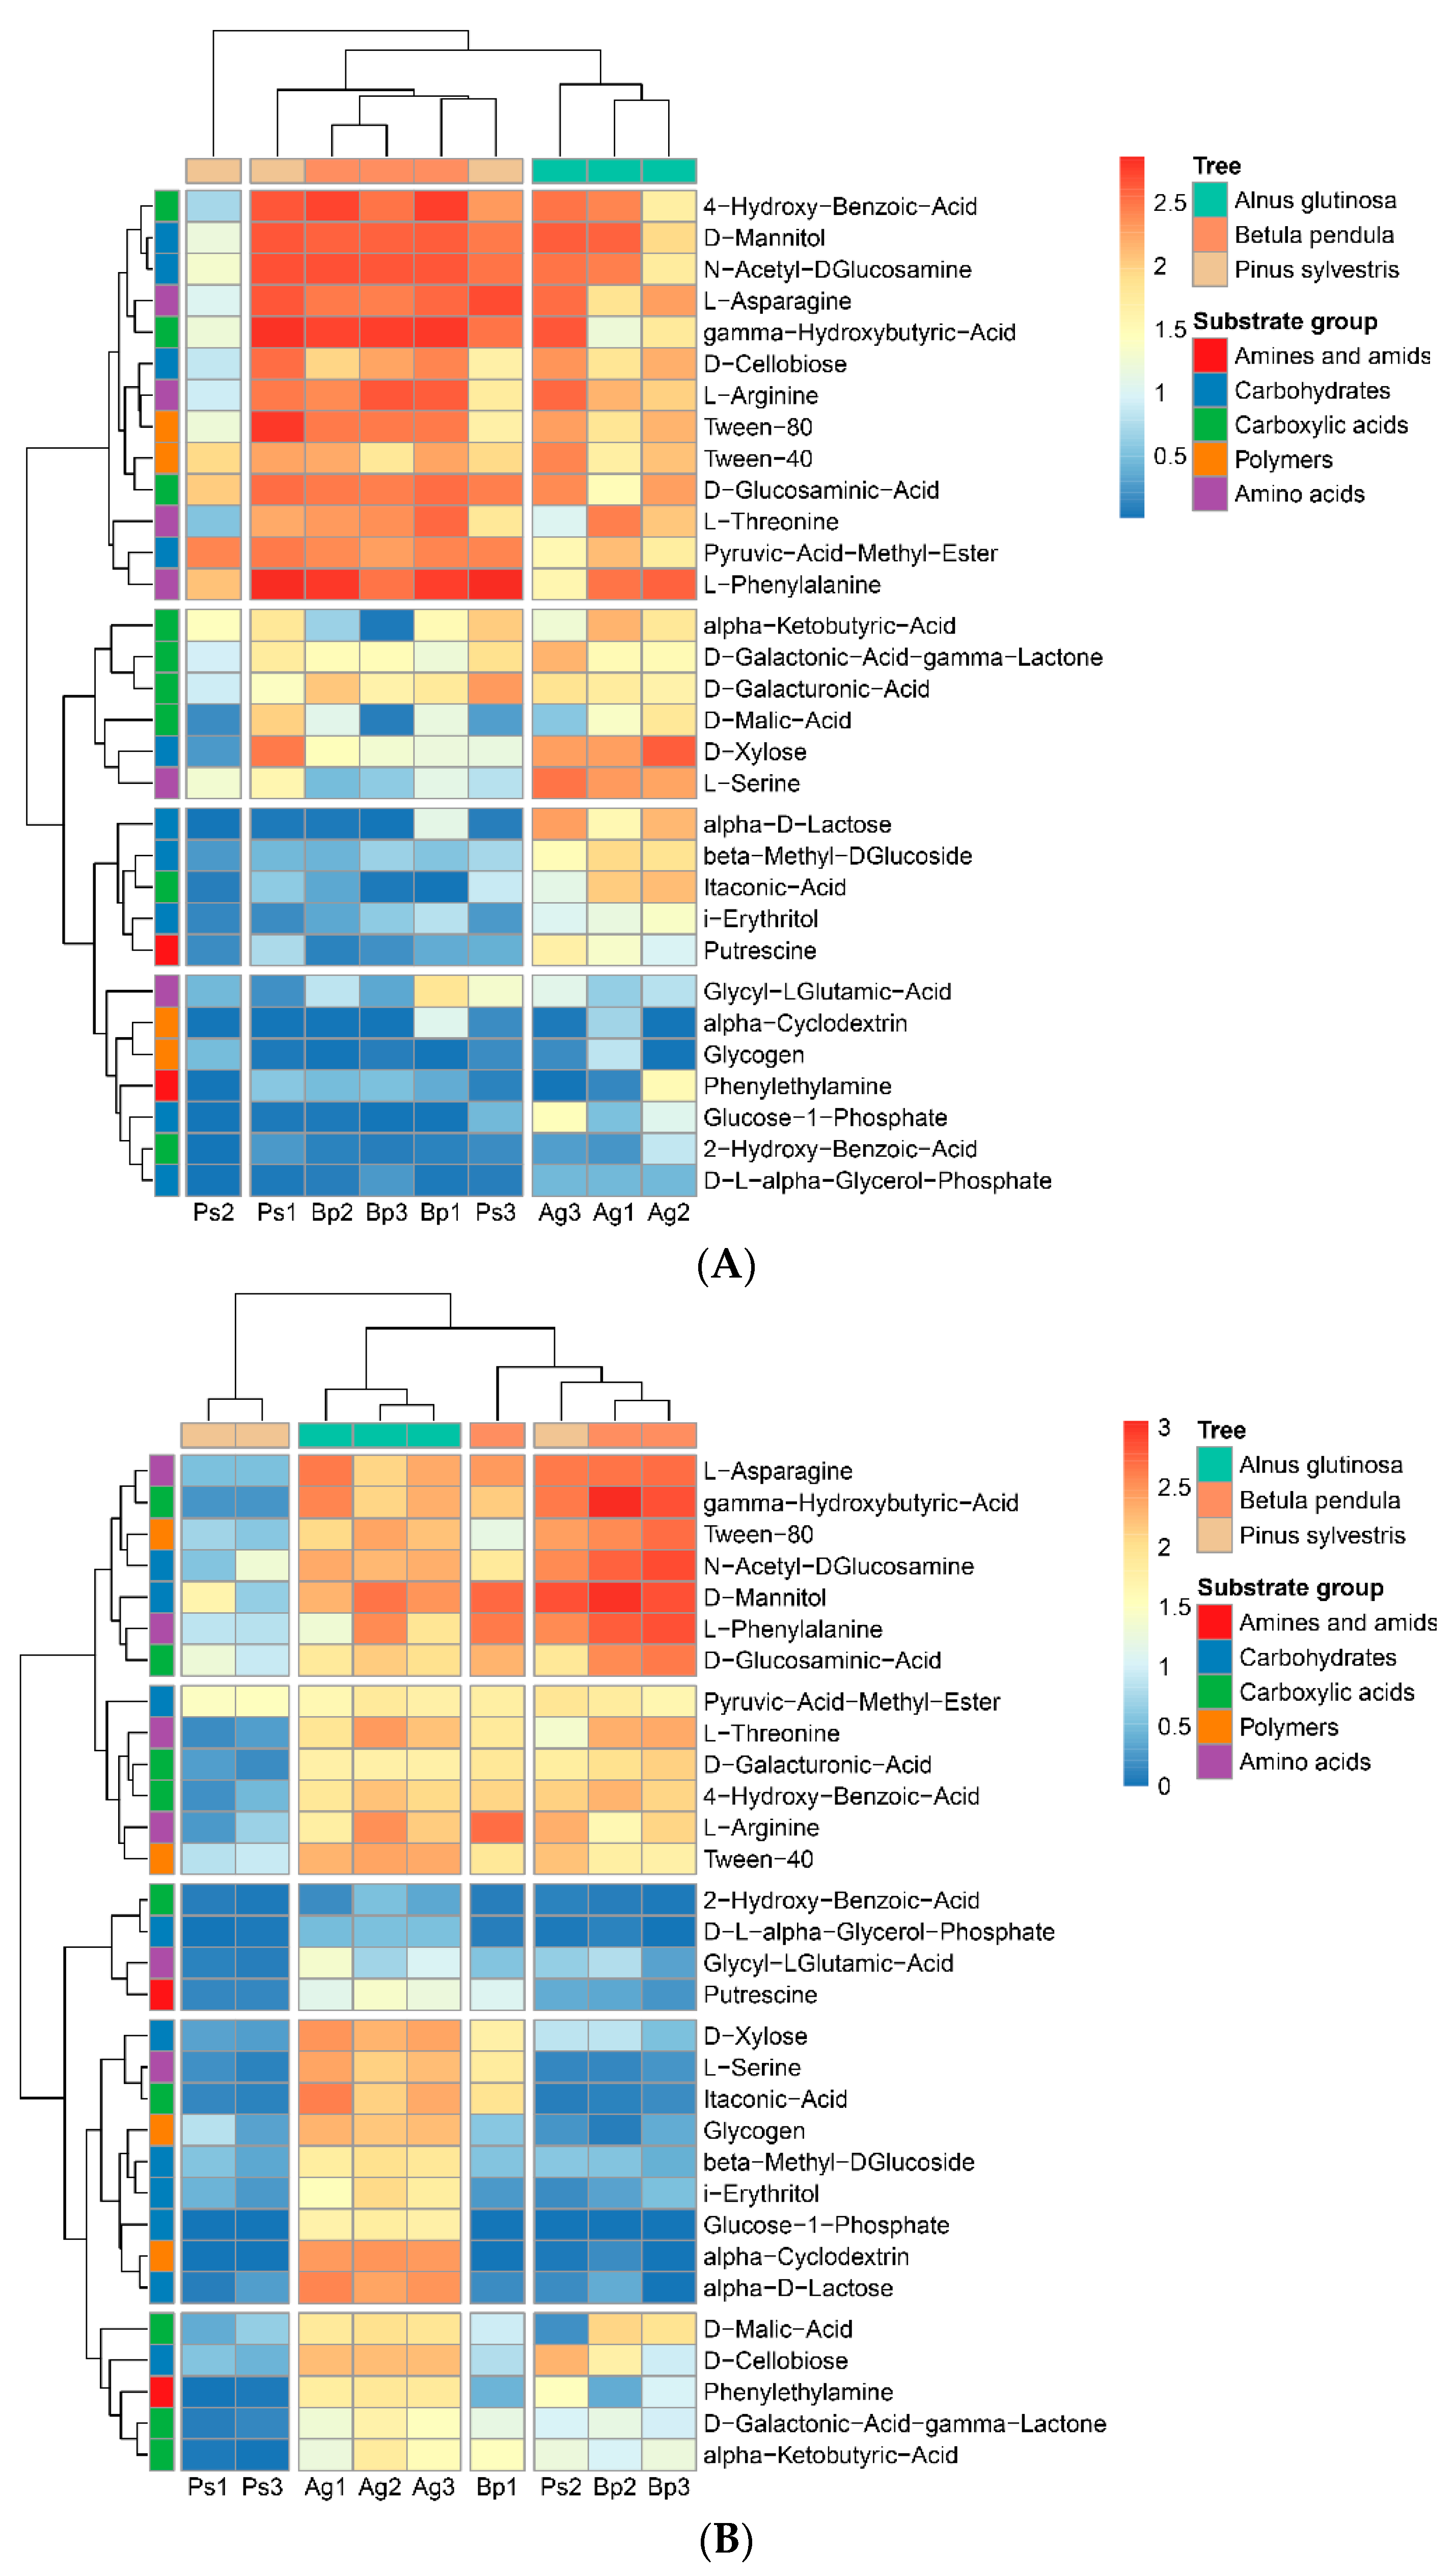
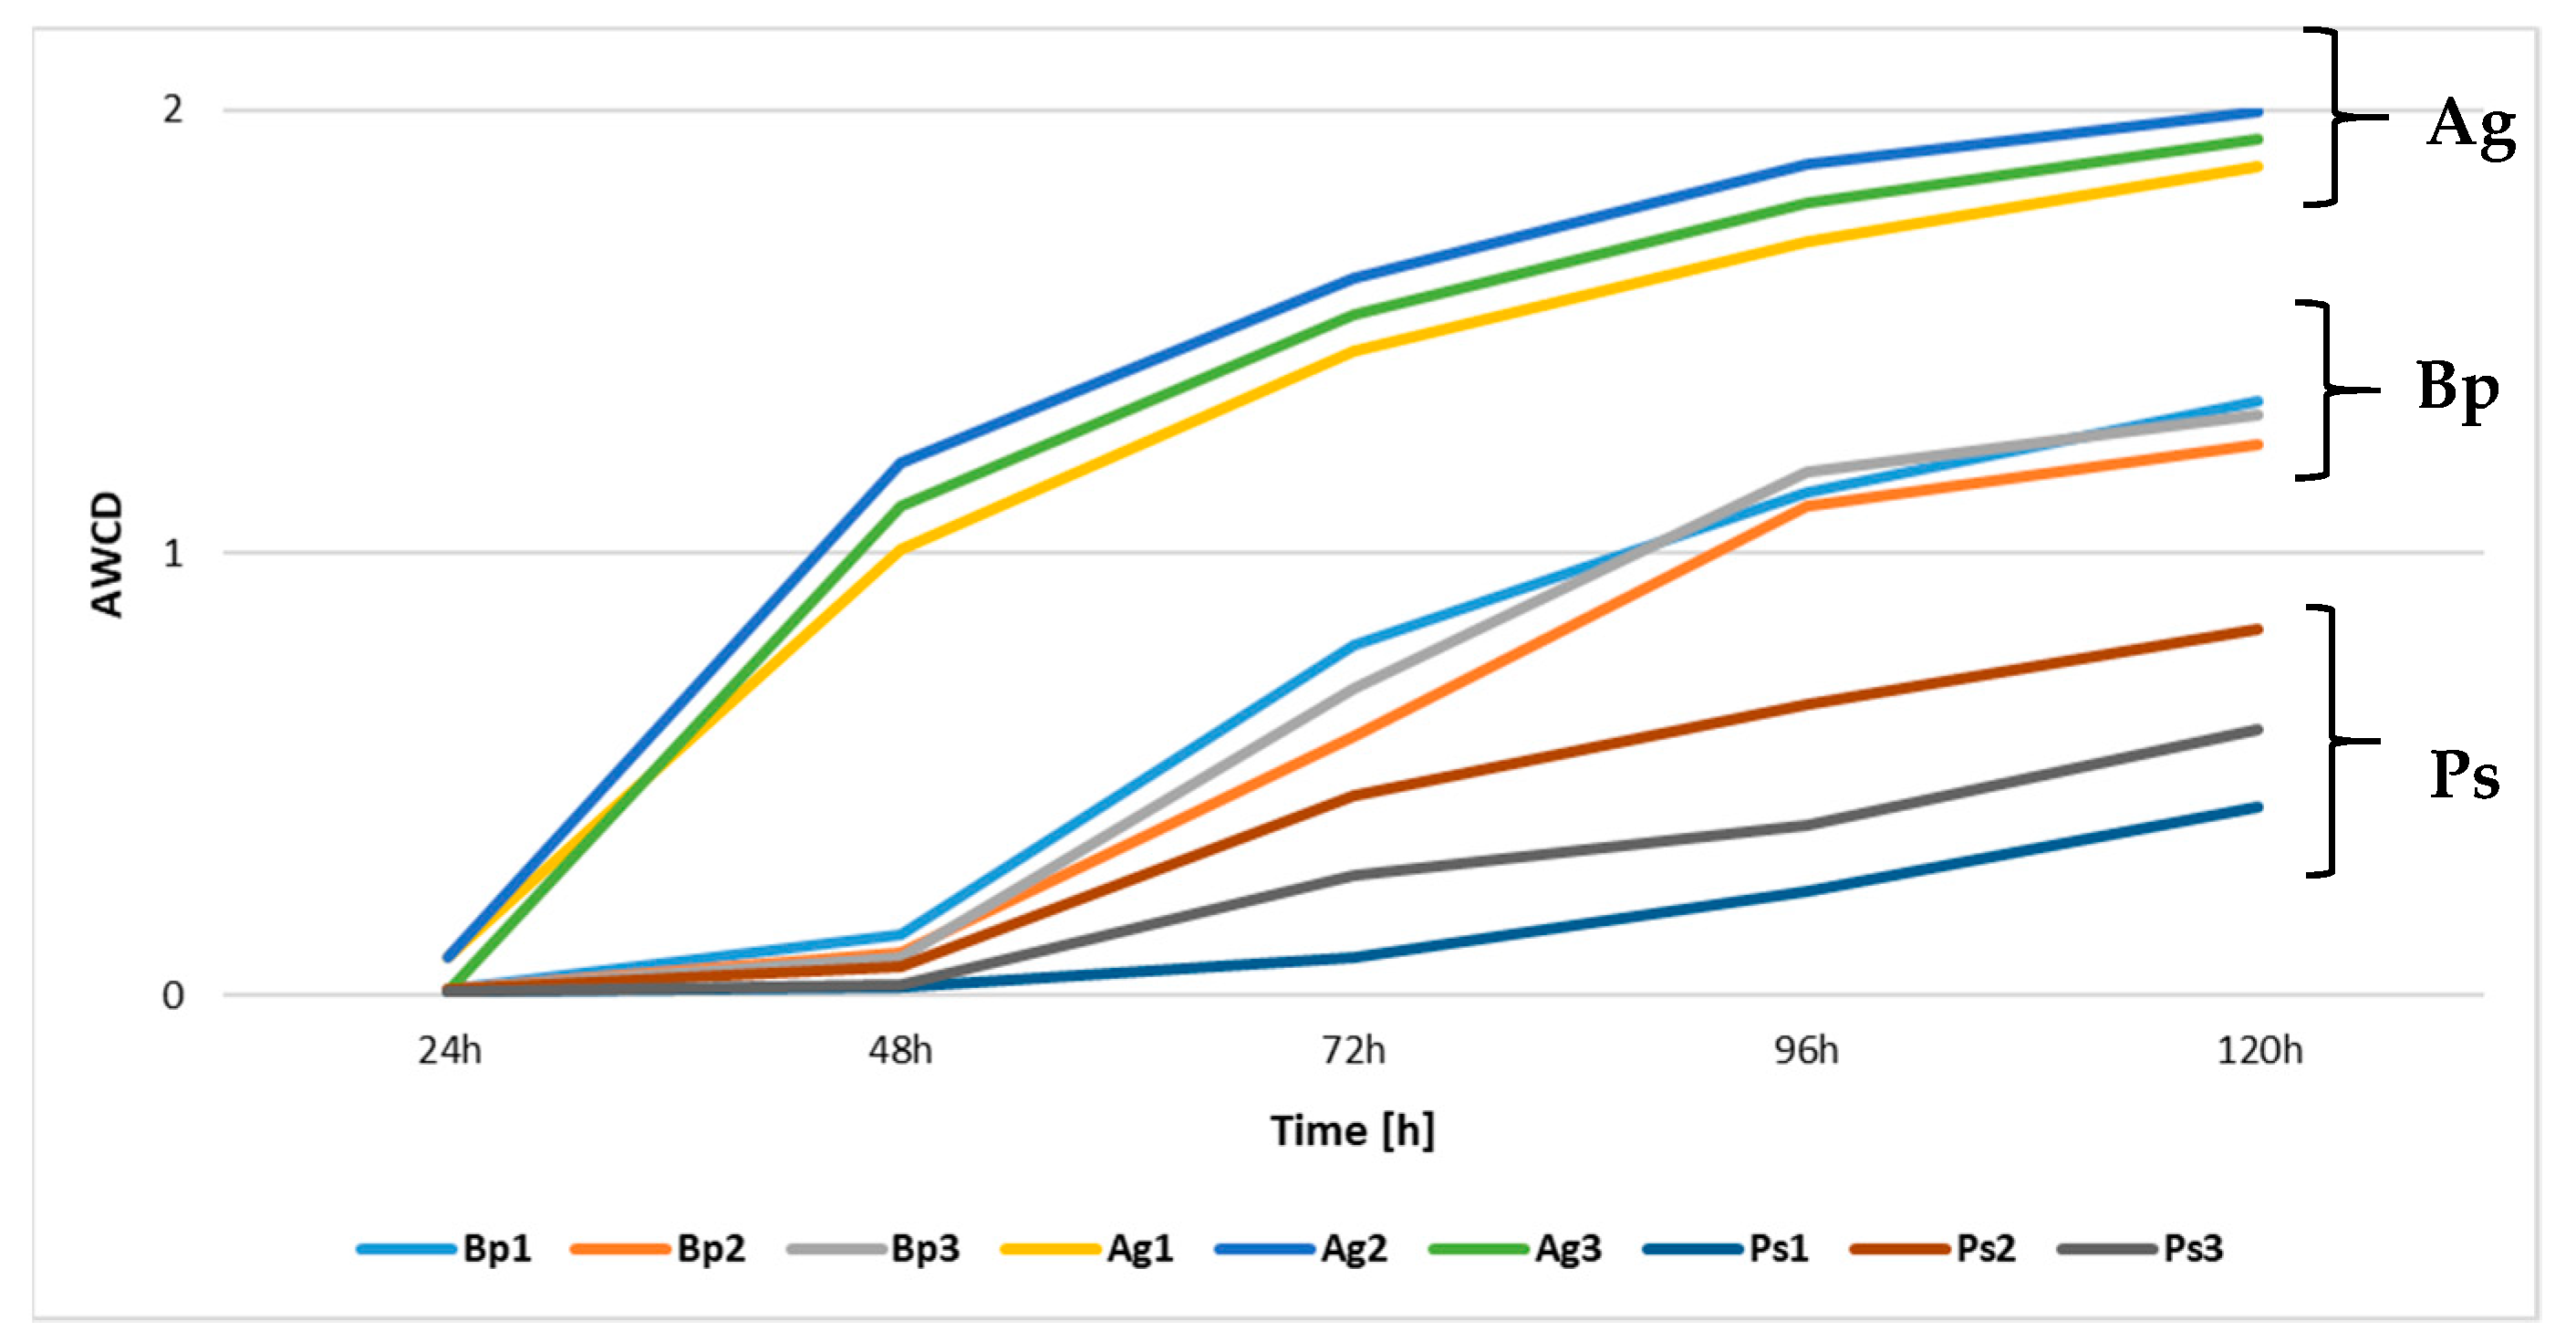
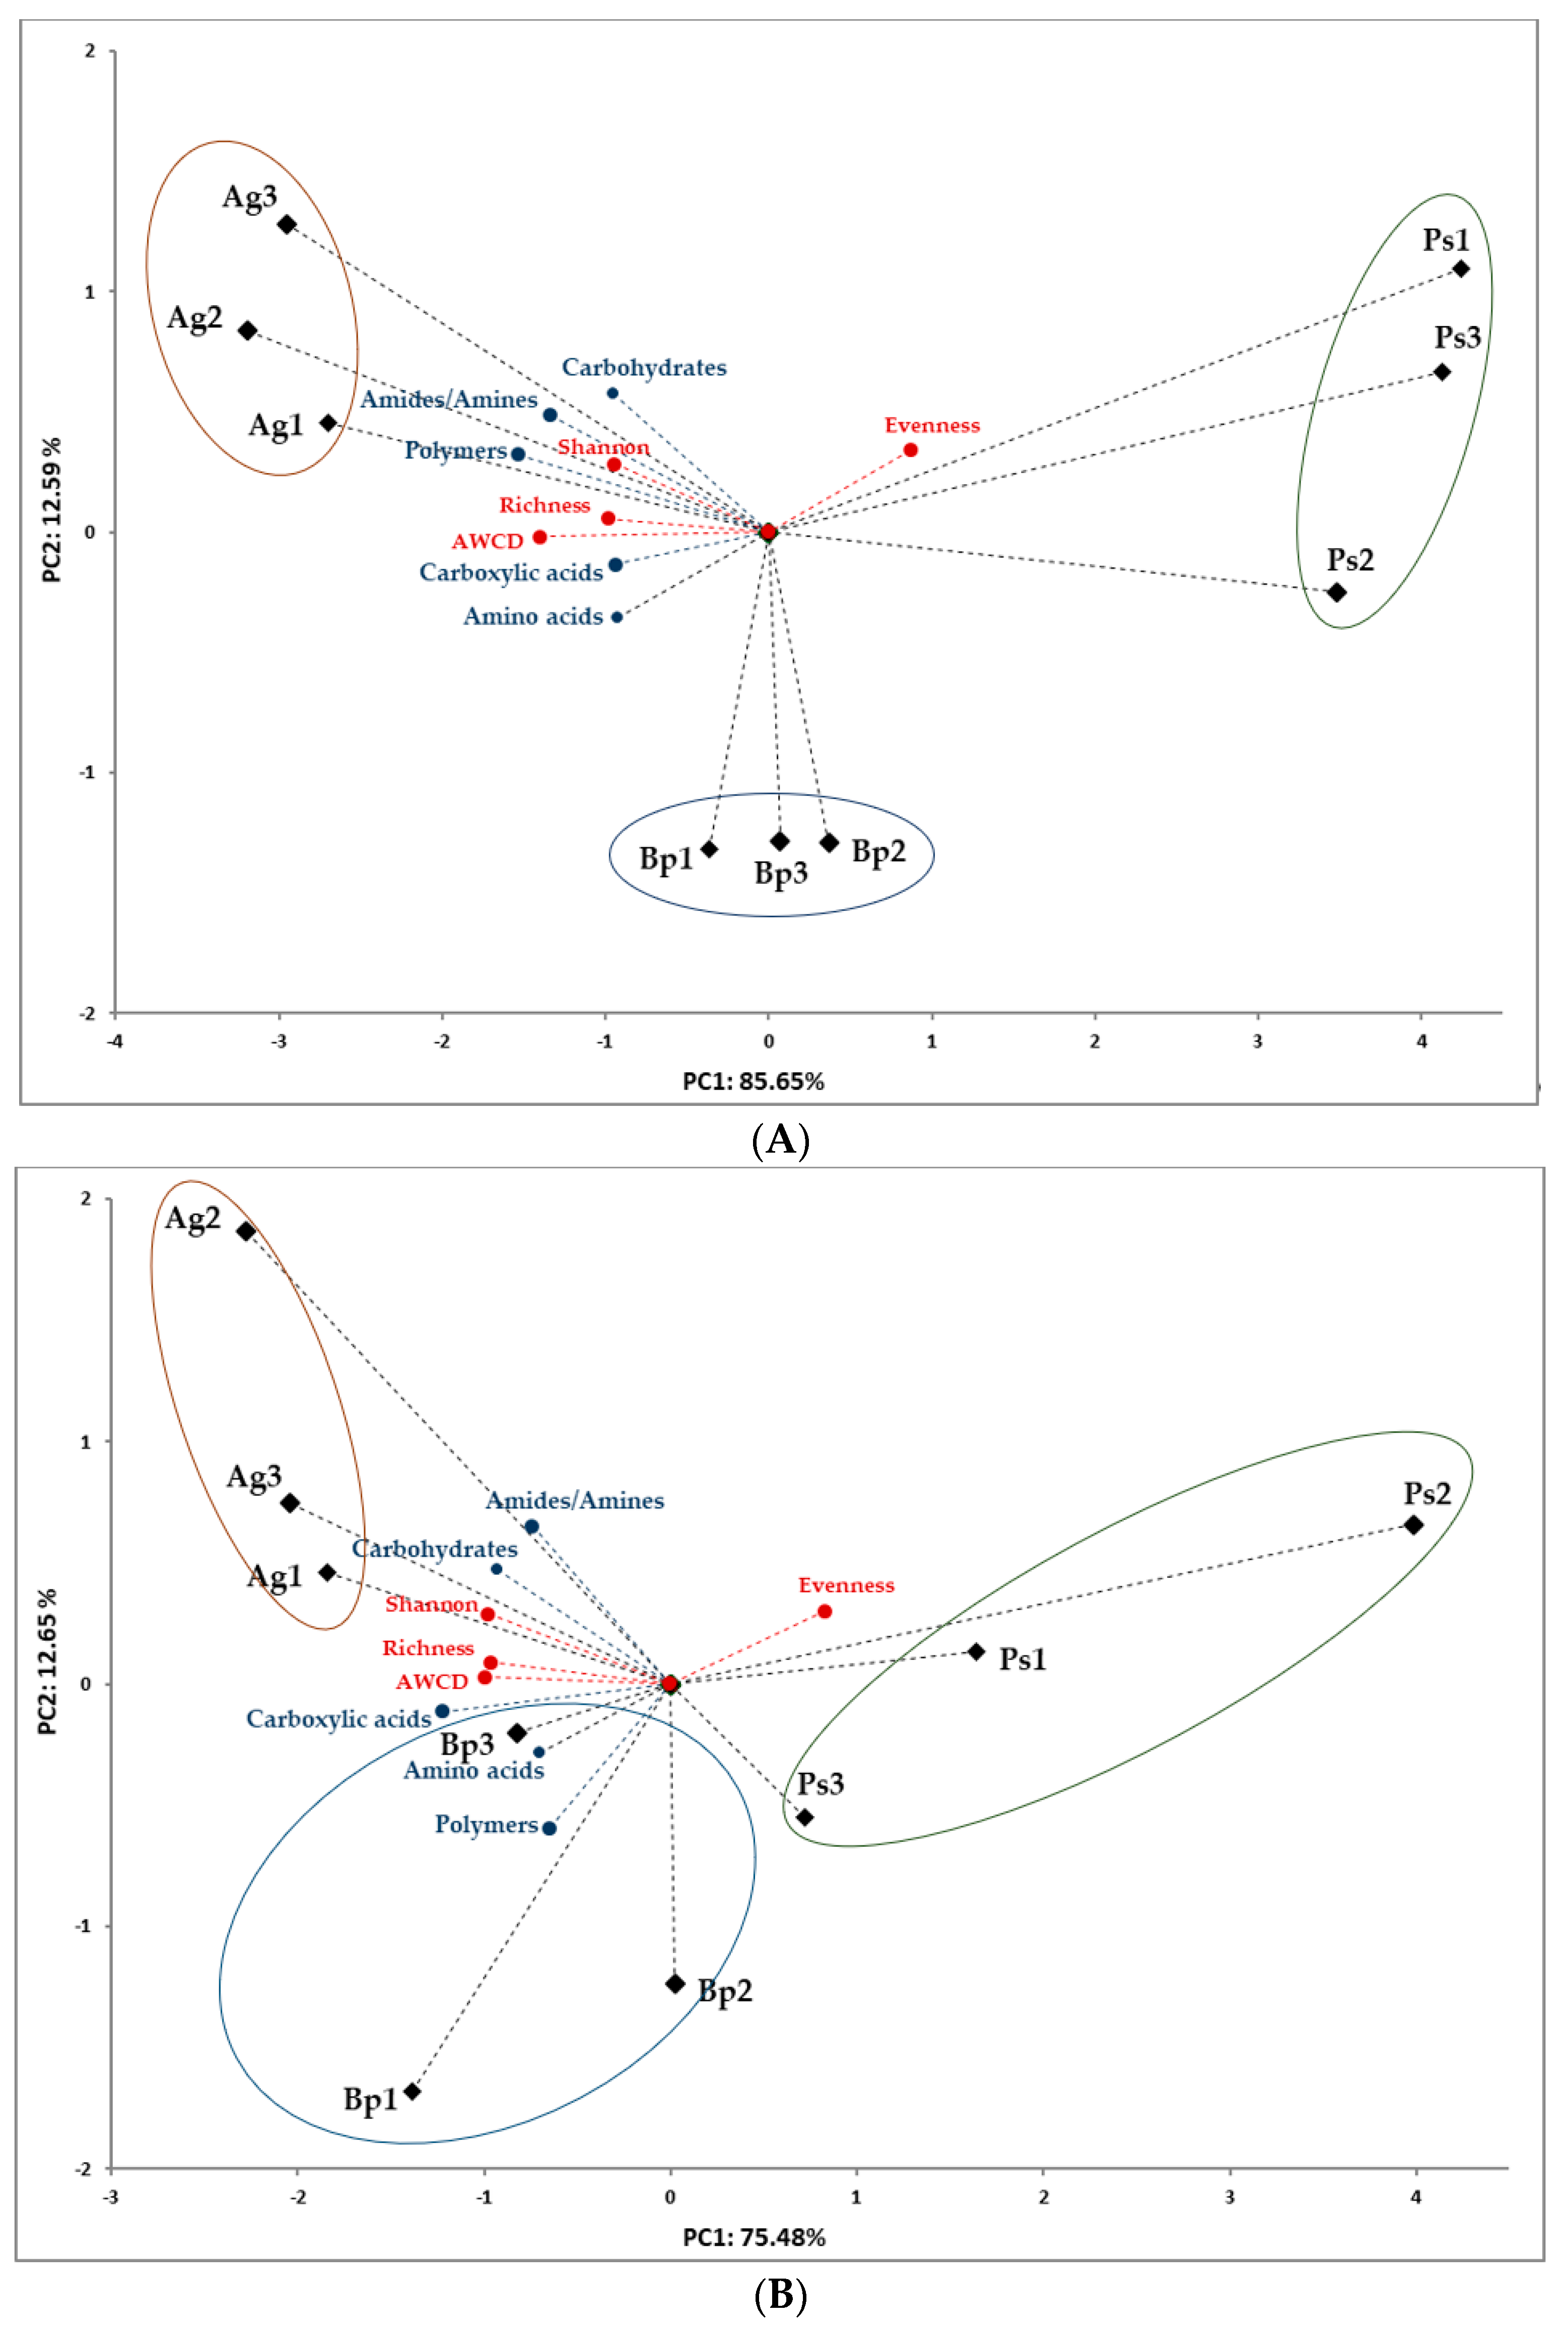
2.3. Metabolic Profiles of Bacterial Community Based on Biolog EcoPlates

Metabolic profiles of bacterial community based on Biolog EcoPlates provide useful information about environmental changes in the peri-root zone of trees. The utilization percent of use of selected groups of substrates obtained in the Biolog EcoPlates incubated for 120 h is presented in Figure 1.
The highest utilization percent of amines and amides (Figure 1A) and amino acids (Figure 1B) was observed in the bulk soil from A. glutinosa stands. In turn, in the bulk soil from B. pendula stands, the best utilized compounds were carboxylic and acetic acids (Figure 1C). The best utilized compounds in the bulk soil of P. sylvestris were carbohydrates (Figure 1D). Compounds belonging to the group of polymers were most effectively used by microorganisms in the bulk soil from A. glutinosa stands (Figure 1E).
Figure 2 shows heat maps based on the analysis of 31 carbon sources after 120 h of incubation of the Biolog EcoPlates. The soils collected from the peri-root zone of A. glutinosa were characterized as the most actively utilized such as compounds 2-hydroxy benzoic acids, i-erythritol, D-xylose, putrescine, beta-methyl-D-glucoside, alpha-cyclodextrin, glucose-1-phosphate, alpha-D-lactose, L-serine, and DL-alpha-glycerol-phosphate. These results were similar in 2019 and 2020. On the other hand, the slowest utilized compounds in bulk soil were D-mannitol, D-galacturonic acid, gamma-lactone, L-arginine, N-acetyl-D-glucosamine, and D-glucosaminenic acid (Figure 2). The soils collected from the peri-root zone of P. sylvestris stands were characterized as the lowest utilization of the 31 compounds. Determination of community-level physiological profiles using Biolog EcoPlates effectively distinguishes temporal changes in microbial communities, especially in terms of the year and place of sampling.
On the basis of the data obtained from the absorbance measurements during the utilization of 31 different carbon sources, we calculated the average well color development (AWCD) index (Figure 3). The highest AWCD values were obtained for samples collected from the bulk soil collected from the peri-root zone of A. glutinosa stands. The metabolic activity in these soils was high after 24 h of incubation of Biolog EcoPlates and remained at the highest level until 120 h of incubation. In the case of soils collected from the B. pendula and P. sylvestris stands, an increase in metabolic activity was observed only after 48 h. The soils collected from the bulk soil of P. sylvestris stands had the lowest metabolic activity.
Changes in diversity index values calculated on the basis of the absorbance values of Biolog EcoPlates after 120 h of incubation are presented in Table 3. For all selected indicators—Shannon’s general diversity index (H’), substrate richness (R), substrate evenness (E), and AWCD590—the same relationships were observed both in 2019 and 2020. The bulk soil collected from the peri-root zone of A. glutinosa and B. pendula stands had the highest diversity indicator values (Table 3). The soil collected from peri-root zone P. sylvestris had the lowest metabolic activity according to the above-mentioned indicators. In turn, the substrate evenness index (E) was highest in the P. sylvestris stands, which indicated a significantly lower metabolic biodiversity in these soils.
The correlation between samples, soil metabolic activity, and biodiversity indices were assessed by principal component analysis (PCA), which was performed separately for 2019 and 2020 to account for the variability in activity over time. A similar tendency was shown in the PCA analysis, regardless of the year of the study. In 2019, the first two principal components (PCs) accounted for 85.65% and 12.59%, respectively, of the total variance in the bulk soils samples from the A. glutinosa, B. pendula, and P. sylvestris stands (Figure 4A). In 2020, the first two PCs accounted for 75.48% and 12.65%, respectively, of the total variance (Figure 4B). The PCA plot of the first two PCs showed that the samples clustered by the tree species. All metabolic activity indices (Shannon, AWCD, richness, amines and amides, amino acids, carboxylic and acetic acids, carbohydrates, and polymers) were positively related to samples collected from the A. glutinosa and B. pendula stands. By contrast, samples collected from peri-root zone of P. sylvestris were negatively related to the soil metabolic activity and positively related to the evenness index (Figure 4).

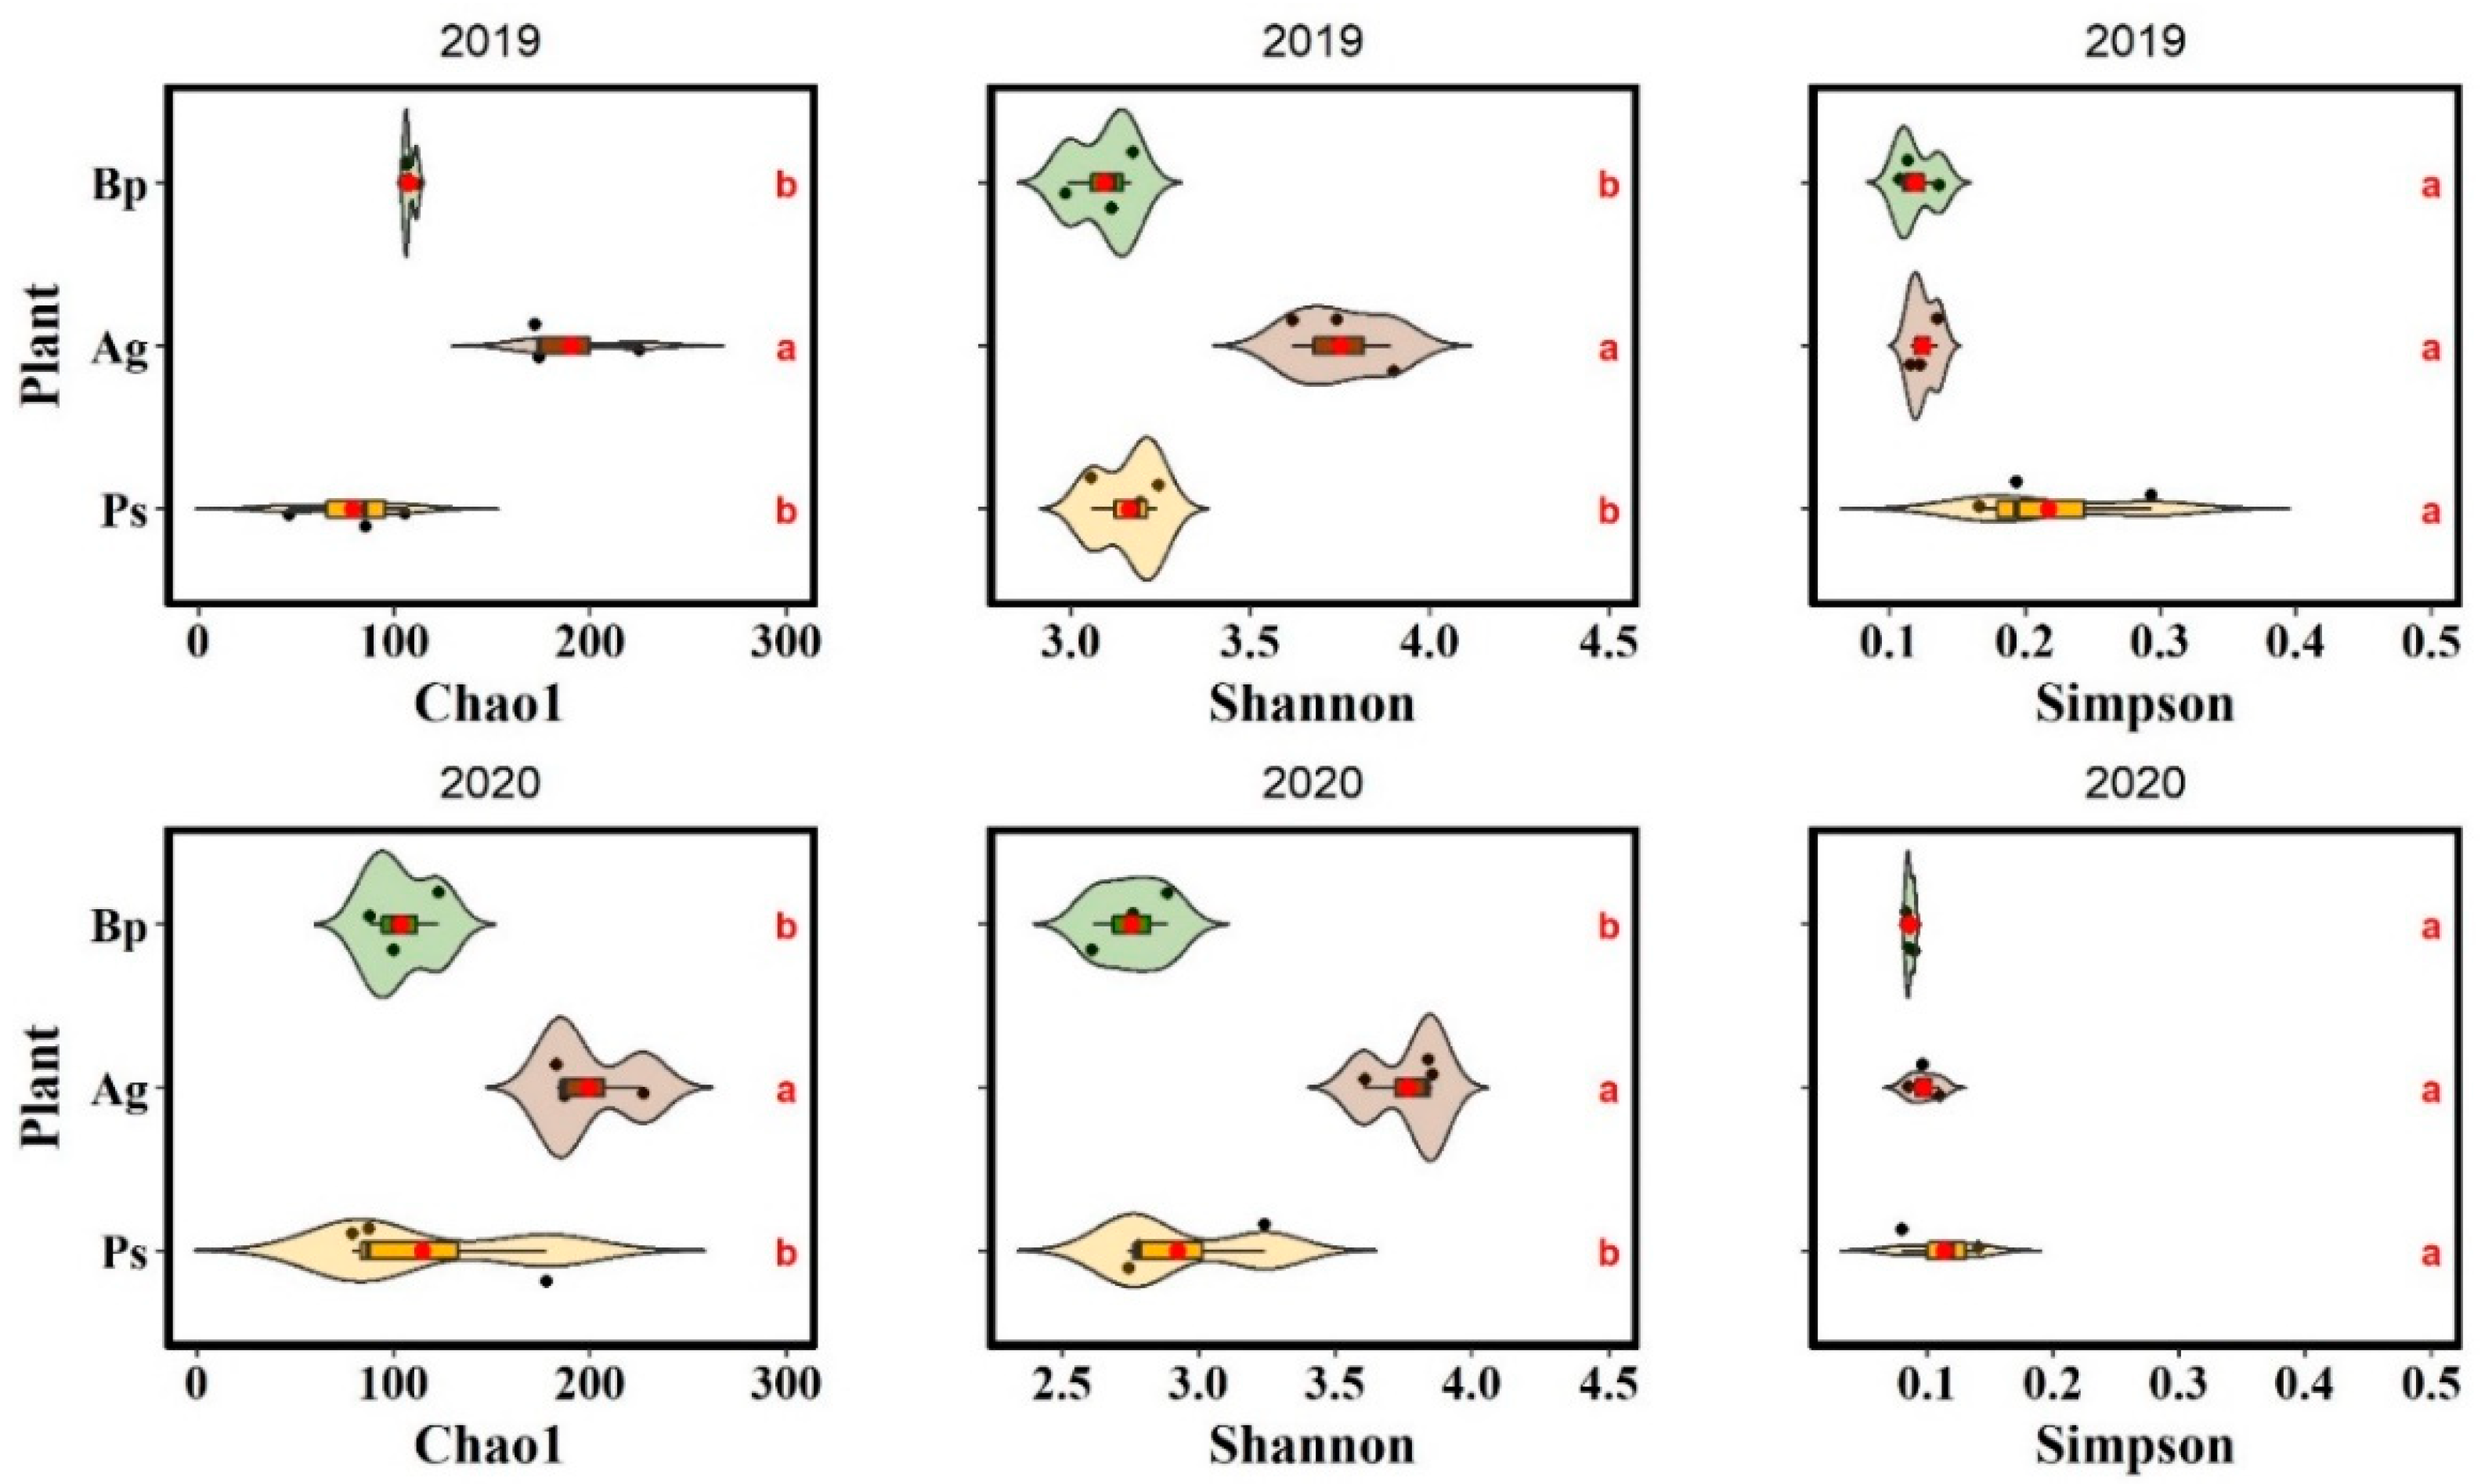
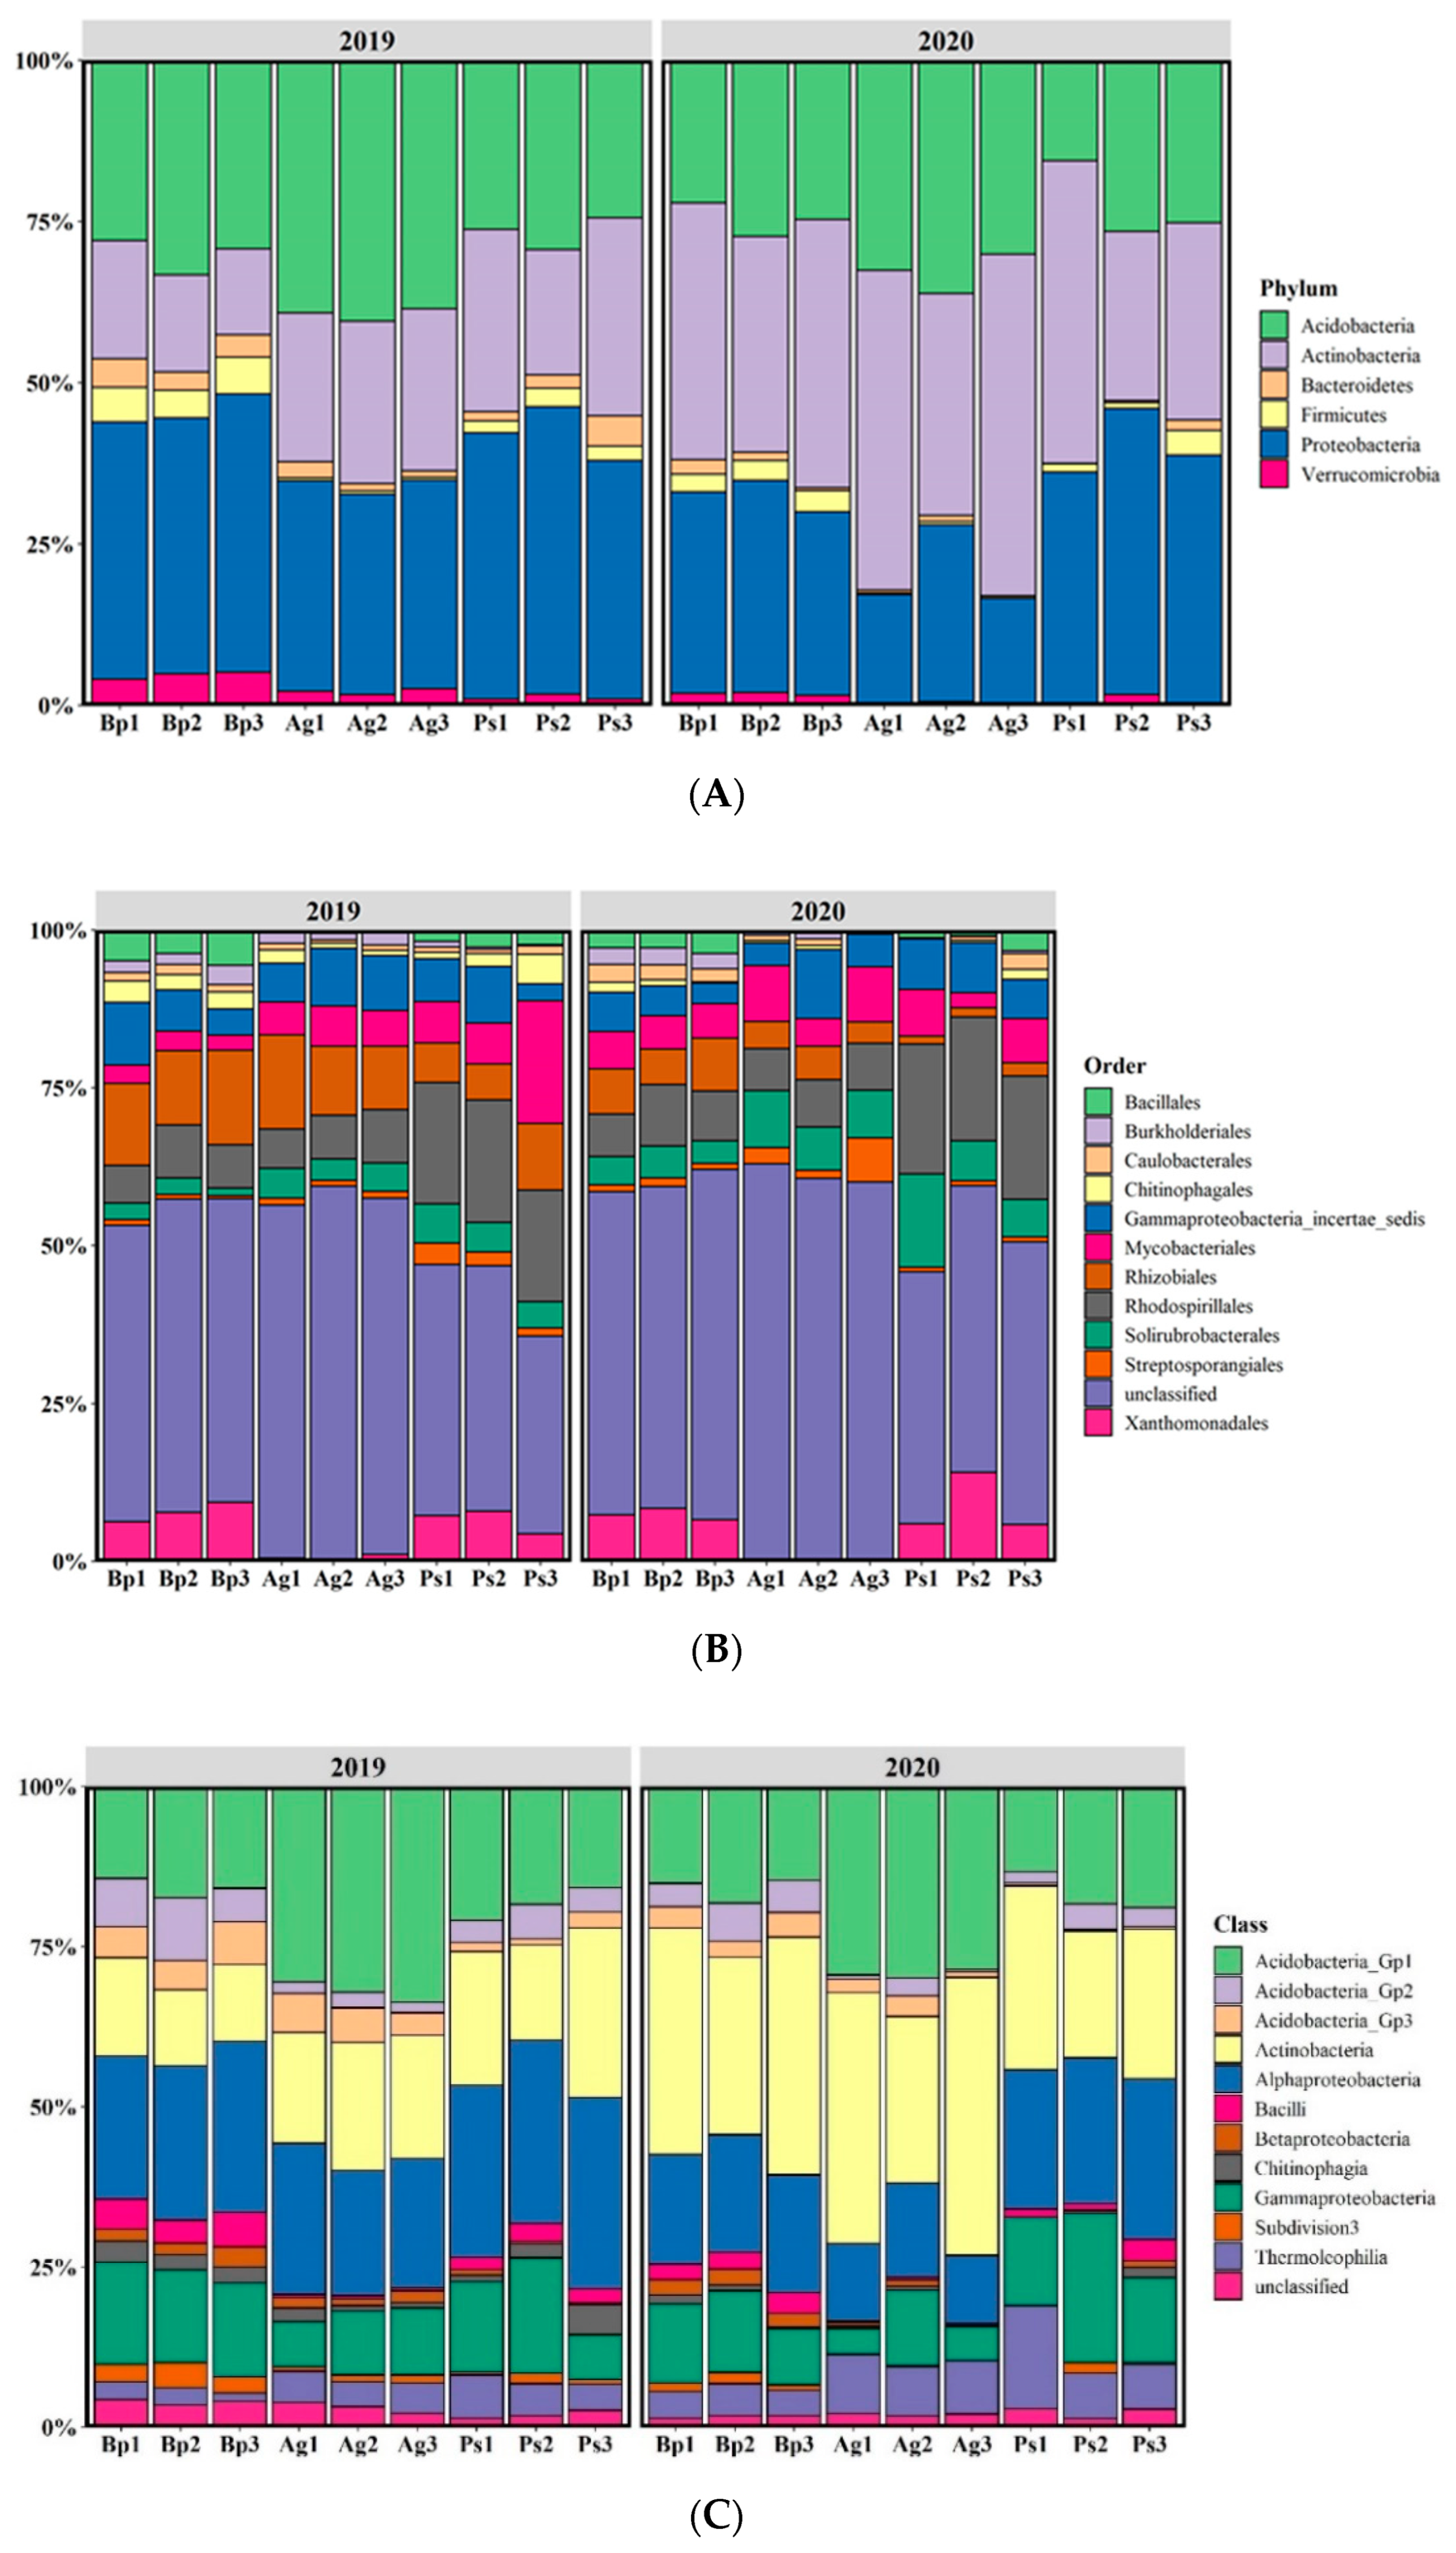
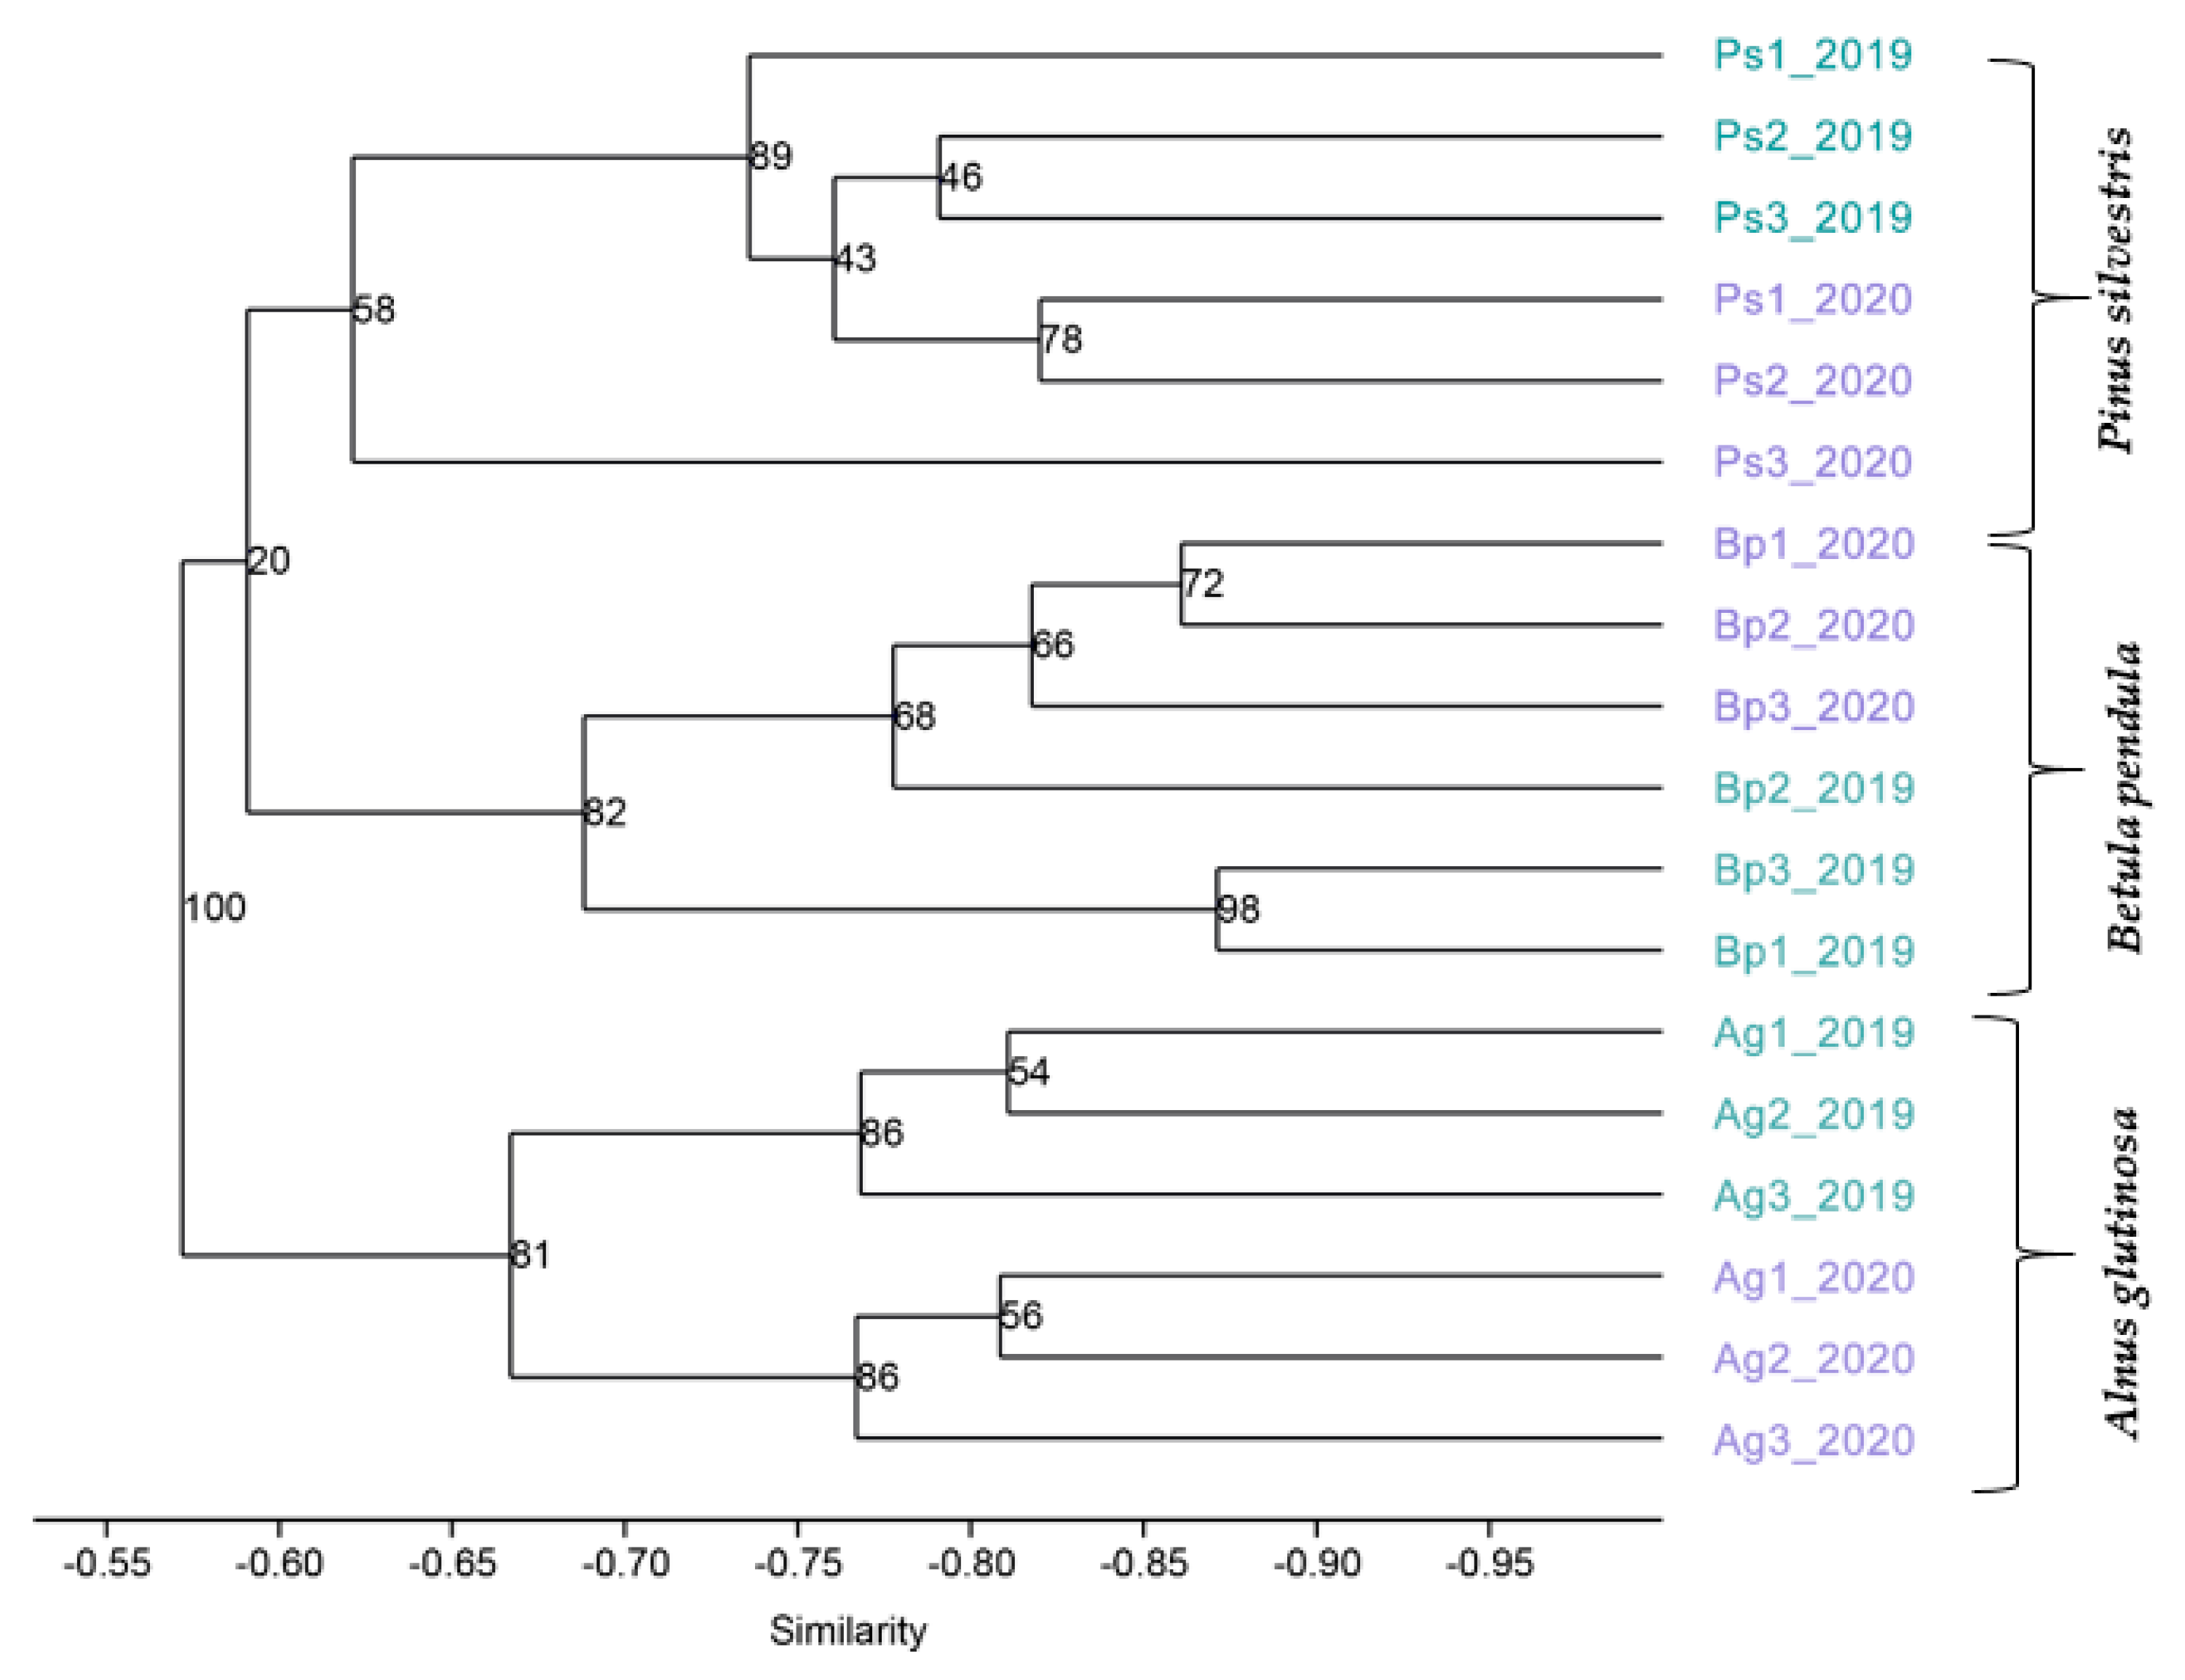
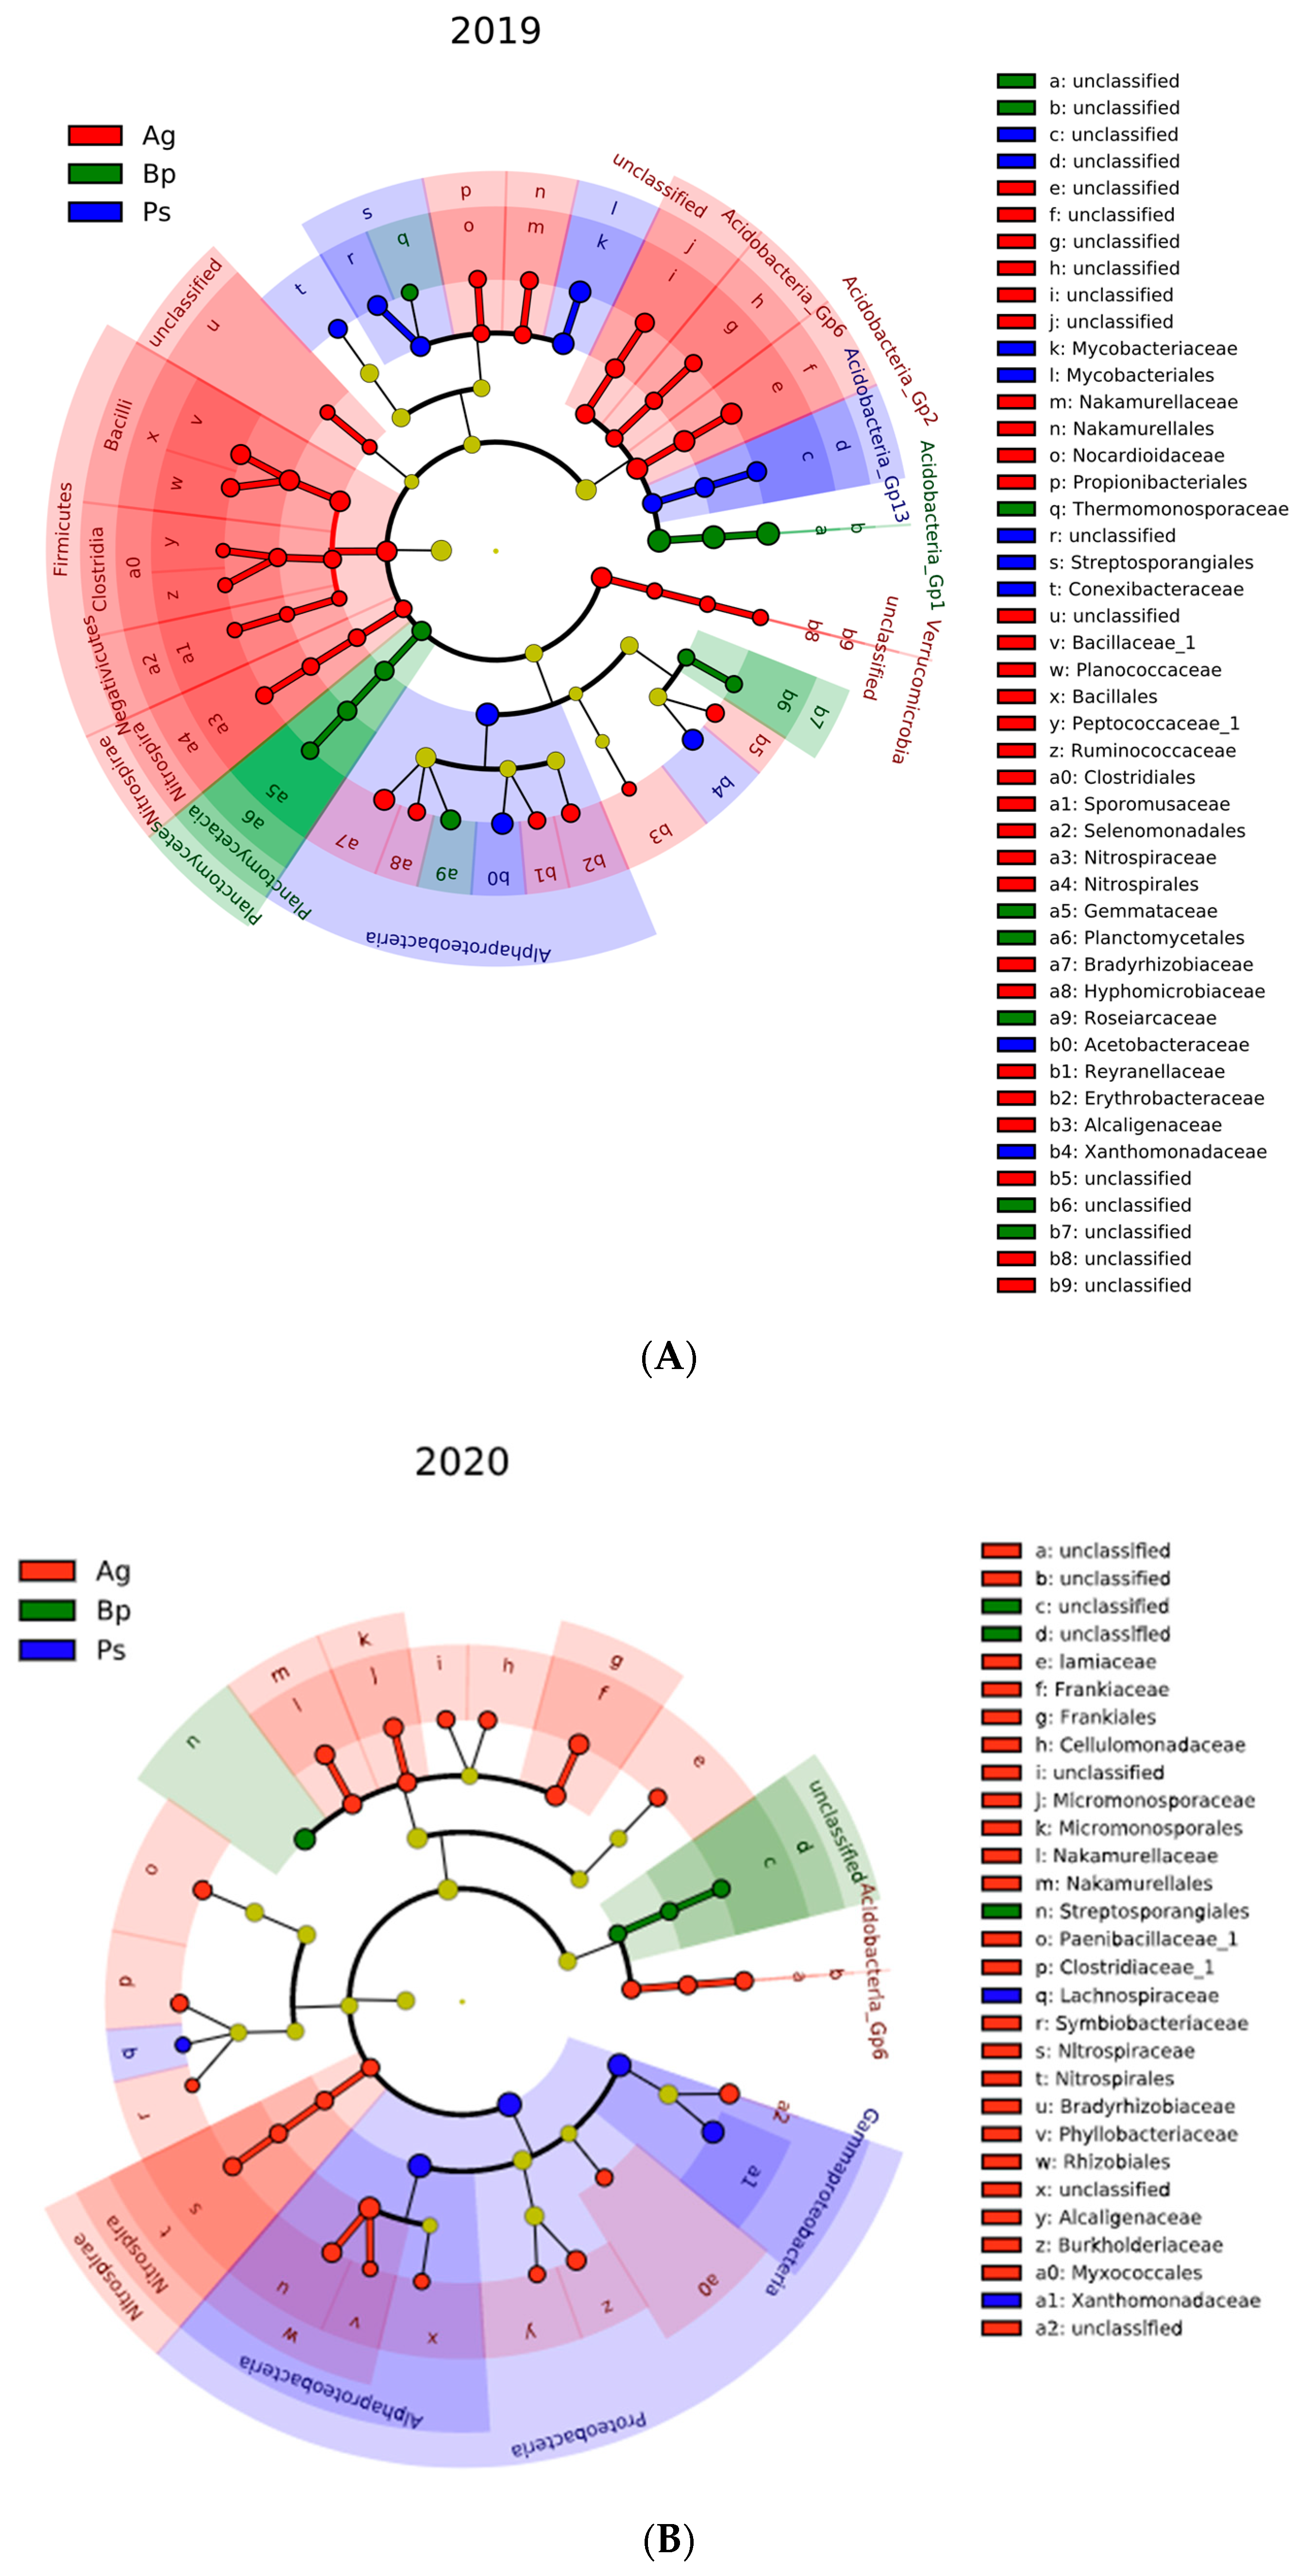
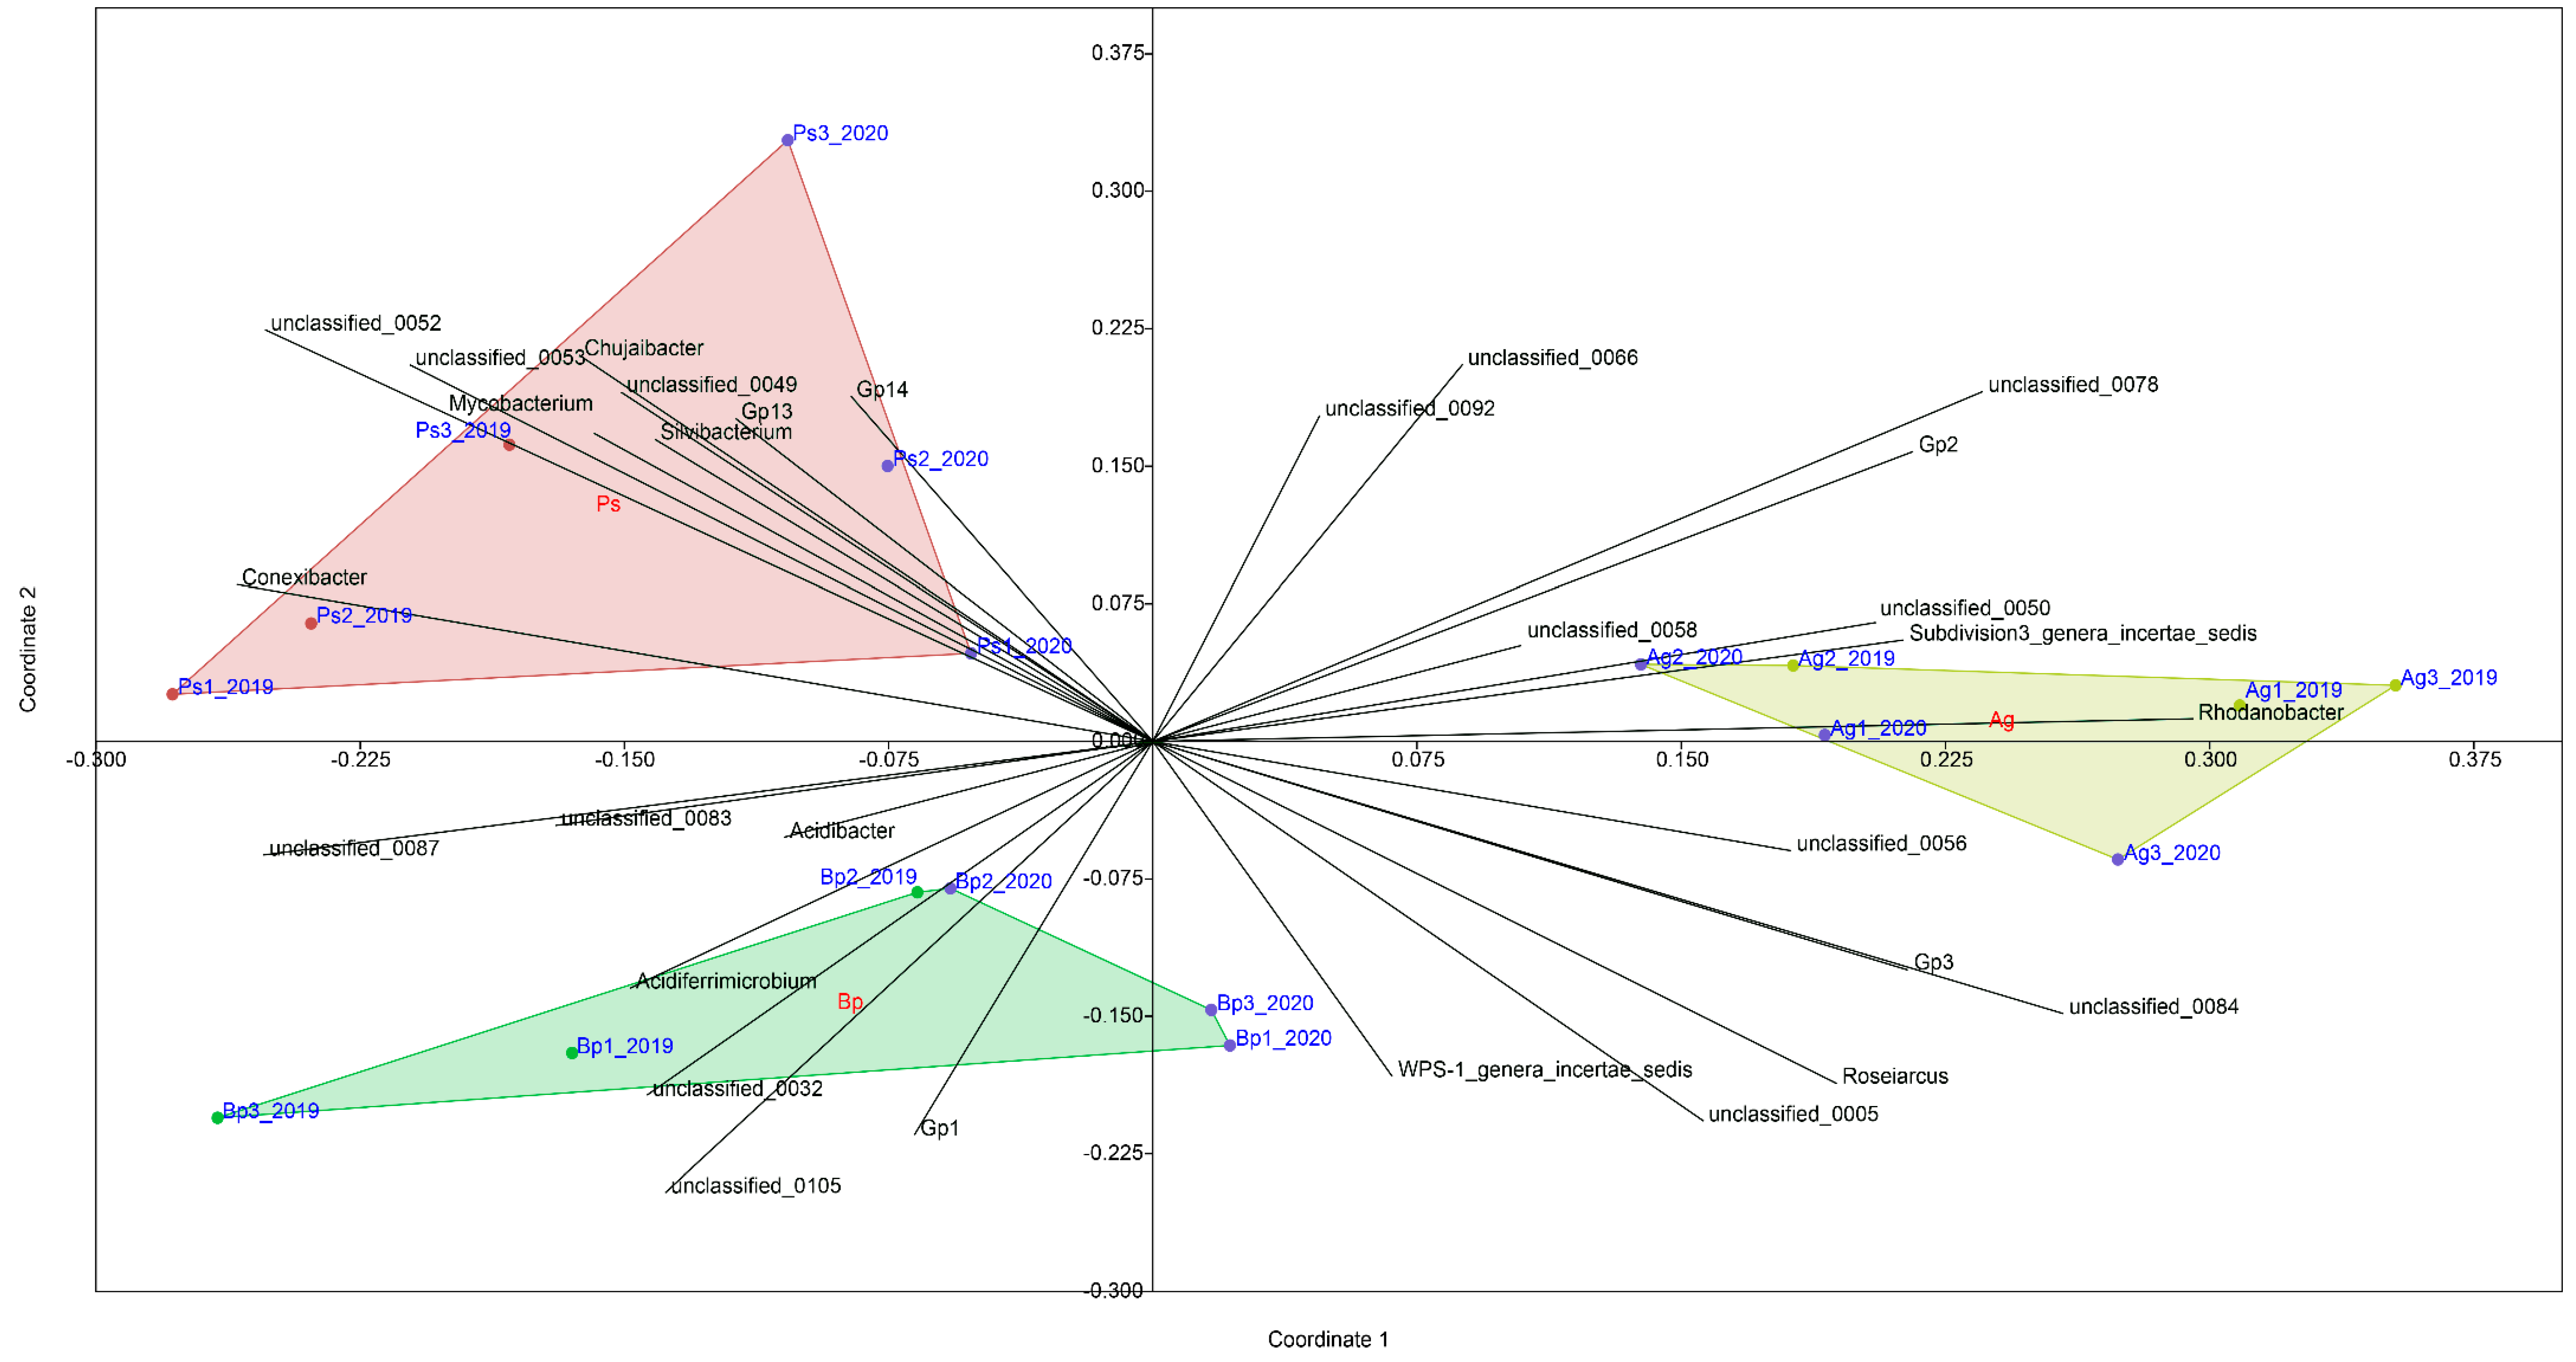
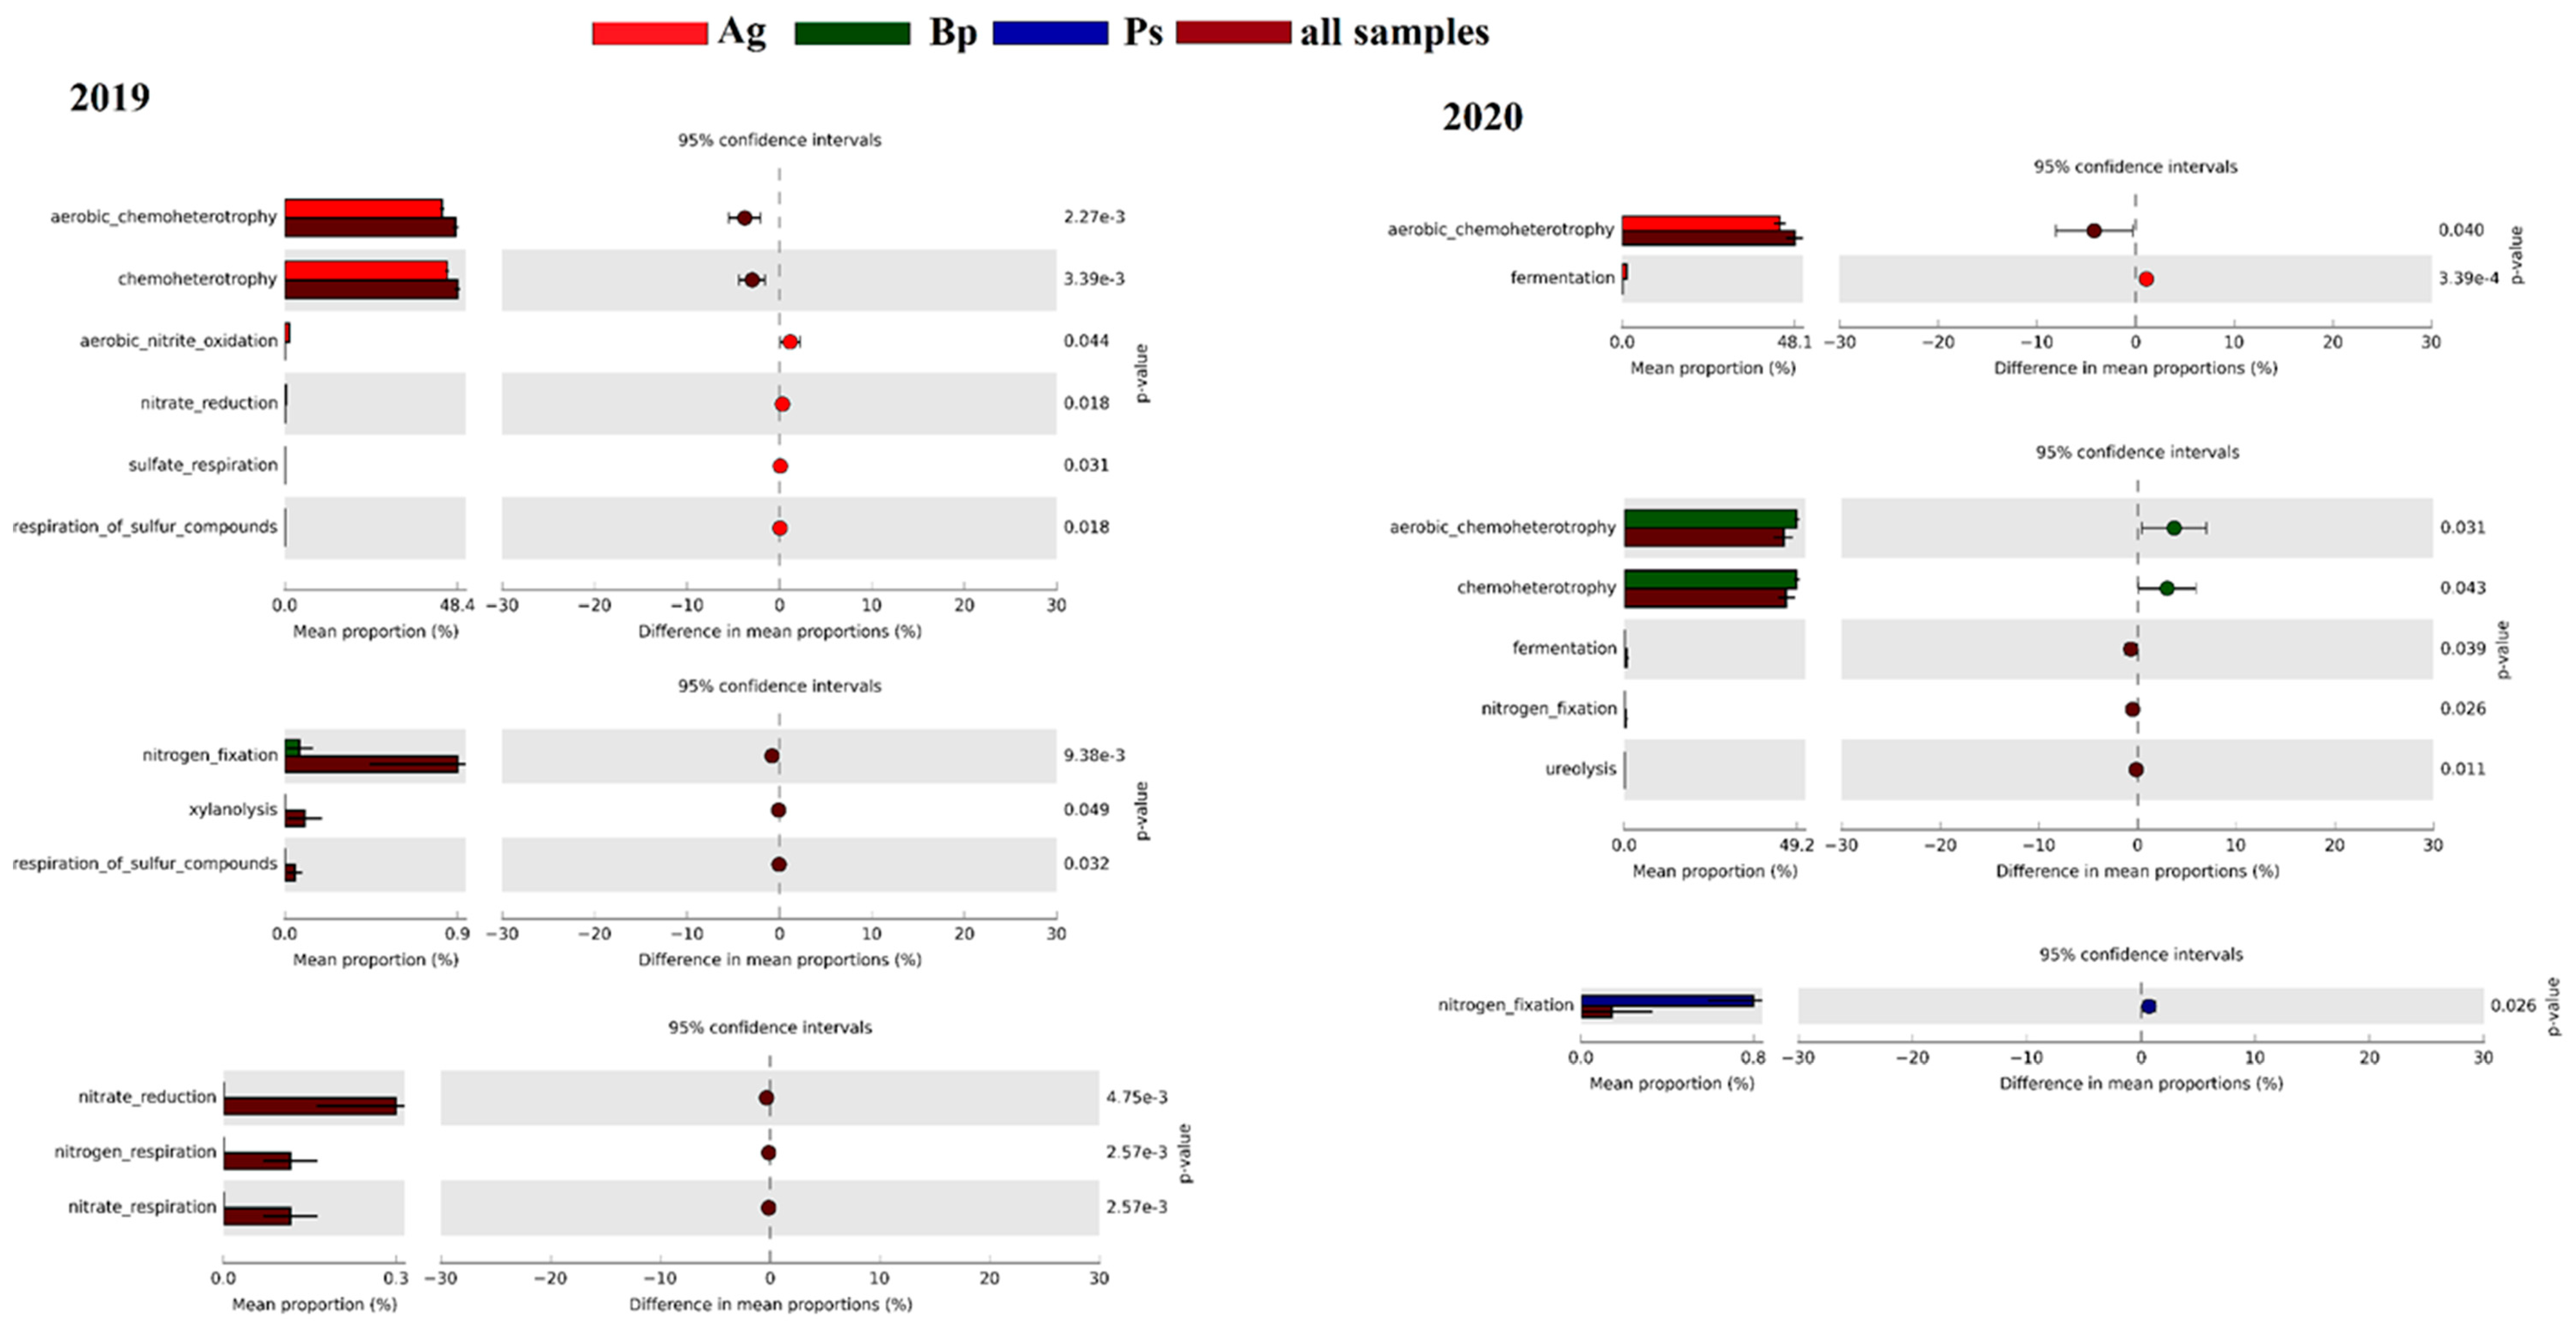
2.4. 16S rRNA Sequencing

Biodiversity indices were calculated on the basis of the data obtained from 16S rRNA sequencing. Figure 5 shows the alpha diversity index values for each of the bulk soil samples collected in 2019 and 2020. The A. glutinosa stands had the highest diversity (species richness and Shannon diversity). The biodiversity indicators were approximately the same in the B. pendula and P. sylvestris stands.
The most abundant phyla were Proteobacteria, Actinobacteria, and Acidobacteria, with a lower percentage of Bacteroidetes, Firmicutes, and Verrucomicrobia (Figure 6A).
Firmicutes was not found in soil collected from the peri-root zone of the A. glutinosa stands. On the other hand, Bacteroidetes and Verrucomicrobia were more abundant in the B. pendula and P. sylvestris stands. Rhodospirillales, Gammaproteobacteria, Mycobacteriales, Bacillales, and Rhizobiales were the most abundant orders (Figure 6B). Rhizobiales was most abundant in the A. glutinosa and B. pendula stands. The most abundant bacterial classes were Actinobacteria, Acidobacteria_Gp1, and Alphaproteobacteria (Figure 6C). The classes Bacilli, Thermoleophilia, Betaproteobacteria, and Subdivision3 were dominant in the B. pendula stands.
The dendrogram at the genus level was constructed by using the unweighted pair group method with arithmetic mean (UPGMA) algorithm (Figure 7). All soil samples, regardless of the sampling year, were grouped depending on the type of tree. The result may indicate a close relationship between the structure of the bacteria in soils collected from the peri-root zone and a tree species: A. glutinosa, B. pendula, and P. sylvestris.
The linear discriminant analysis effect size (LefSE) analysis revealed that samples collected in 2019 had more enriched bacterial taxa than samples collected in 2020. The phyla Firmicutes, Nitrospirae, and Verrucomicrobia and their members were significantly enriched in the A. glutinosa stands compared with other tree species in 2019. The Planc-tomycetes phylum and its member were significantly enriched in B. pendula samples. In the P. sylvestris stands, no phylum was significantly enriched, but the acidobacteria_Gp13 and Alphaproteobacteria classes were significantly enriched. Interestingly, the phylum Proteobacteria was significantly enriched considering all tree species, but the families from this phylum were differentially enriched: Bradyrhizobiaceae, Hyphomicrobiaceae, Rey-anellaceae, Erythrobacteraceae, and Alcaligenaceae in the soils collected from the peri-root zone of A. glutinosa, Roseiarcaceae in the B. pendula stands, and Acetobacteraceae and Xanthomona-daceae in the P. sylvestris stands.
Compared with 2019, the tree species of 2020 harbored fewer significantly different bacterial taxa. The number of significantly enriched bacterial taxa from 2020 was again highest from A. glutinosa samples, which included the phylum Nitrospirae and its member, class Acidobacteria_Gp6. Unlike 2019, the phylum Proteobacteria and its classes Alphaproteobacteria and Gammaproteobacteria were enriched in the P. sylvestris samples. The only order enriched in the B. pendula stands compared with A. glutinosa and P. sylvestris was Streptosporangiales (Figure 8).
The three main groups were distinguished according to the tree species on the basis of the analysis NMDS (non-metric multidimensional scaling dissimilarity) (Figure 9). Strong positive correlations were found between the tree species and selected types of bacteria. Regardless of the year of sampling, each tree species had its own characteristic bacterial composition. Bulk soil of Alnus glutinosa was characterized by strong positive correlations with the following genera of bacteria: Gp2, Subdivision3_genera_incertae_sedis, Rhodonobacter, Roseiarcus, unclassified_050, unclassified_056, and unclassified_058. The following genera dominated in the Betula pendula stands: Acidiferrimicrobium, Gp1, Acidibacter, WPS-1_genera_incertae_sedis, unclassified_0083, unclassified_0087, and unclassified_0105. The following genera showed strong correlation with addition to the Pinus silvestris samples: Mycobacterium, Silvibacterium, Chujaibacter, Conexibacter, Gp13, Gp14, unclassified_049, unclassified_052, and unclassified_053.
It was also very important to determine the functions that these bacteria can perform in a given soil. According to FAPROTAX, 28.6% of bacterial genera (178 of 622) were assigned to at least one function group (38 groups in total; Figure 10). The significantly higher mean proportion of aerobic nitrite oxidation, nitrate reduction, sulfate respiration, and sulfur compound respiration in Alnus glutinosa samples were found in comparison to other tree categories from the year 2019. However, from 2020, only fermentation was found to be significantly higher in samples of Alnus glutinosa. Unlike the bulk soil of Alnus glutinosa, we did not find any significant differences in the mean proportion of bacterial putative function in Betula pendula (Bp) and Pinus silvestris (Ps) compared to all other samples from year 2019. Interestingly, aerobic chemoheterotrophy and chemoheterotrophy had a higher mean proportion of bulk soil of Betula pendula in the year 2020, which was not evident in the year 2019. The nitrogen fixation had a significantly higher mean proportion in 2020 in samples of Pinus silvestris (Figure 10).

3. Discussion

Forests constitute one of the largest and most important ecosystems on Earth, covering over 40 million km2 and accounting for 30% of the total land area in the world [1,24]. The ecology of forest soils is an important area of research due to the role of forests as carbon sinks. Hence, a significant amount of information has accumulated regarding their ecology, especially for temperate climates and boreal forests [20]. Although most of the research has focused on fungi, soil bacteria also play an important role in this environment. In forest bulk soils, bacteria inhabit many habitats with specific properties, including soil, rhizosphere, litter, and deadwood habitats where their communities are shaped by nutrient availability and biotic interactions [20]. In the peri-root zone of forest trees, bacteria interact with plant roots and mycorrhizal fungi as commensalisms or mycorrhiza helpers. Understanding the ecology of bacteria in forest soils has advanced dramatically in recent years, but it is still incomplete [37].
Trees are associated with their own microbiome and mycobiome [10,17,21]. The peri-root zone of a tree comprises numerous bacteria that potentially promote plant growth, and it represents a valuable resource for sustainable and ecological agriculture [38,39]. Soil microorganisms play a major role in soil quality and functioning, largely determining soil structure and nutrient cycling, and ultimately impacting plant performance through nutrient mobilization, especially P, root growth, and plant health [40]. Previous studies have highlighted the importance of diverse belowground systems to maintain the stability and productivity of ecosystems and their multifunctionality [41].
Community-level physiological profiles using Biolog MicroPlates were originally described in 1991 by J. Garland and A. Mills [42]. This analysis effectively distinguishes spatial and temporal changes in microbial communities. In applied ecological research, EcoPlates have been used in many studies as both an assay of the stability of a normal population and to detect and assess changes following the onset of an environmental variable [43,44,45,46].
We found that the peri-root zone soils of each of the tree species differed significantly in terms of metabolic profile. The highest metabolic diversity was confirmed for the A. glutinosa and B. pendula samples. On the other hand, the P. sylvestris stands had the lowest metabolic activity. Other authors have confirmed the statistical dependence of soil metabolic activity on the plant species and the physicochemical and biological properties of soil [45]. The bulk soil is a special microenvironment with very active of nutrient circulation and microbial community formation [41,44].
Si et al. [47] examined the soils of eight common deciduous fruit trees in northern China and showed that the type of vegetation was the main factor influencing changes in biodiversity of bulk soils, calculated by soil physicochemical properties, enzyme activities, and the community-level physiology. Our research also confirmed that the bacterial composition of bulk soil from peri-root zone of selected tree is crucial. This is confirmed both by the results of the research on the biological activity of these soils as well as by the study of the metabolic profile and the structure of the microbiome.
As reported by other authors, many biotic and abiotic factors influence the biodiversity of forest soils [7,10,12,15]. Thiem et al. (2018) [48] showed that depending on the degree of salinity in the soil collected from A. glutinosa, the dominant genera were Rhodanobacter, Granulicella, and Sphingomonas (in saline sites), and Bradyrhizobium and Rhizobium (in non-saline sites). These genera also dominated in our study of the A. glutinosa samples (an actinorhizal plant). Many authors have confirmed that the forest soil microbiome may provide significant advantages to the plant [21,32,33]. These changes can be influenced by many factors, including moisture, temperature, soil pH, oxygen, salinity, soil contamination, drought, and trace elements. In addition, tree species can also be of great importance to the changes taking place in the bacterial composition of soils. This was confirmed by our research because, in the same type of soil, the microbiome differed significantly depending on the tree species. Tree roots attract their associated microbial partners from the local soil community. Accordingly, tree-root-associated microbial communities are shaped by both the host tree and local environmental variables [15,30]. The abundance of elements such as carbon, nitrogen, phosphorus, potassium, and magnesium in soils also affects the composition and functions of microorganisms in the bulk soil of trees [14]. Soil pH correlates with microbiome composition, with the microbial assemblages changing in more acidic soils [8,34,49].
Peng et al. [49] showed that factors such as soil pH, invertase activity, and nitrogen content had a significant impact on soil microbial community. Invertase activity was positively correlated with plant-beneficial microbes such as Mortierella, Geomyces, Lysobacter, and Chaetomium. In our research, there was high dehydrogenase and acid phosphatase activity in the A. glutinosa and B. pendula samples, which were dominated by Actinobacteria, Acidobacteria_Gp1, Alphaproteobacteria, Bacilli, Thermoleophilia, and Betaproteobacteria.
In our previous research, we conducted an assessment of soil biological activity, including enzymatic activity, in eight different soil types. These soils differed in physico-chemical and biological properties, including a pH range of 4–7.5 [50]. The soil profiles were collected with preserving the natural soil horizons. The microplot experiment was carried out on different soil types: Brunic Arenosol (Dystric I), Rendzic Leptosol, Fluvic Cambisol, Haplic Cambisol (Eutric), Gleyic Phaeozem, Brunic Arenosol (Dystric II), Haplic Cambisol (Eutric II), and Haplic Cambisol (Dystric). The enzymatic activity was strictly dependent on the type of soil and soil pH. The highest dehydrogenase and alkaline phosphatase activities were found in Gleyic Phaeozem (pH 7.4) and the lowest in Brunic Arenosol (Dystric I and II; pH 4, 4.5). The highest acid phosphatase was found in Brunic Arenosol (pH 4, 4.5). Other authors also confirmed this dependence in their research [51,52,53].
Lemanowicz and Bartkowiak [53] assessed the enymatic activity in salt-affected soils. The pH range of soils was 4.45–7.40. Alkaline phosphatase activity was much lower in soils with pH 4–5. It was confirmed that although oxygen and other electron acceptors can be utilized by dehydrogenases, most of the enzyme is produced by anaerobic microorganisms. The activity of acid phosphatase is related to the presence of soil microorganisms inhabiting a given soil [50,52]. On the other hand, the activity of alkaline phosphatase is related to plant enzymes. In acidic soils, a significant increase in the activity of acid phosphatase is observed, which is correlated with the activity of soil microorganisms. The activity of alkaline phosphatase in acidic soils is at a lower level, as it is mainly related to the activity of microorganisms preferring the neutral pH of the soil and is related to plants. In our research, we evaluated acid forest bulk soils that are not closely related to tree roots, and hence we showed a much lower activity of alkaline phosphatase compared to acid phosphatase activity.
Researchers suggest that plant types and species harbor partially different microbiomes [26,29]. These changes are mainly observed in the peri-root zone and rhizosphere of plant roots, which we have confirmed in this study. For example, grapevine rootstock genotypes in mature vineyard were associated with different microbiomes [41]. The authors proved during two years of research using 16S rRNA sequencing that bacterial microbiota across five grapevine rootstock genotypes cultivated in the same soil depended on the plant genotype [32,34,54].
Other studies have confirmed that the genus Bradyrhizobium is the dominant genus and symbiote of Australian acacia [14]. Acacia dealbata enriches bulk soils with potentially beneficial microbial taxa and members of the genus Bradyrhizobium may play an integral role in this process. In our study, the taxa Rhizobiales was most abundant in the A. glutinosa and B. pendula samples. As reported by other authors, soil samples collected from scots pine contained more Planctomycetia, Actinobacteria, Opitutae, and Deltaproteobacteria, whereas Sphingobacteriia, Gammaproteobacteria, Armatimonadia, and Betaproteobacteria were more common in the P. sylvestris samples [55]. Other research confirmed that the P. sylvestris endorhizosphere is enriched in the genera Pseudomonas, Burkholderia, and Bacillus [56]. This dependence was also confirmed in our research.
The health condition of a tree may also impact the biodiversity of the bacteria in soils. Pinho et al. [57] found significant changes in the biological activity and microbiome composition across oak health conditions. The authors evaluated three disease stages of plants (low, mid, and severe) and confirmed significant changes in the composition of the root bacterial microbiome depending on the stage of the disease. Members of the phyla Nitrospirae, Chloracidobacteria, and Acidobacteria subdivision 6 were consistently more abundant in healthy trees. We confirmed this finding in our research in which we also examined healthy trees. Moreover, Acidobacteria are active members in the peri-root zone of tree, a finding that confirms previous research.
Better understanding the changes in the composition of microbial population of bacteria in bulk soil from the peri-root zone of forest trees and their metabolic processes is key to providing in-depth knowledge to develop more efficient, handy, sustainable, and reliable forest management strategies. It is also crucial to follow these changes in a given climatic zone and a specific type of forest. This study had provided preliminary evidence of changes in the bulk soil of three tree species and confirms the uniqueness of the composition of bacteria depending on the species. In our future research, we will also explore the role of fungi in this process. The root zone of plants is a wealth of diversity not only of bacteria but also fungi.

4. Materials and Methods

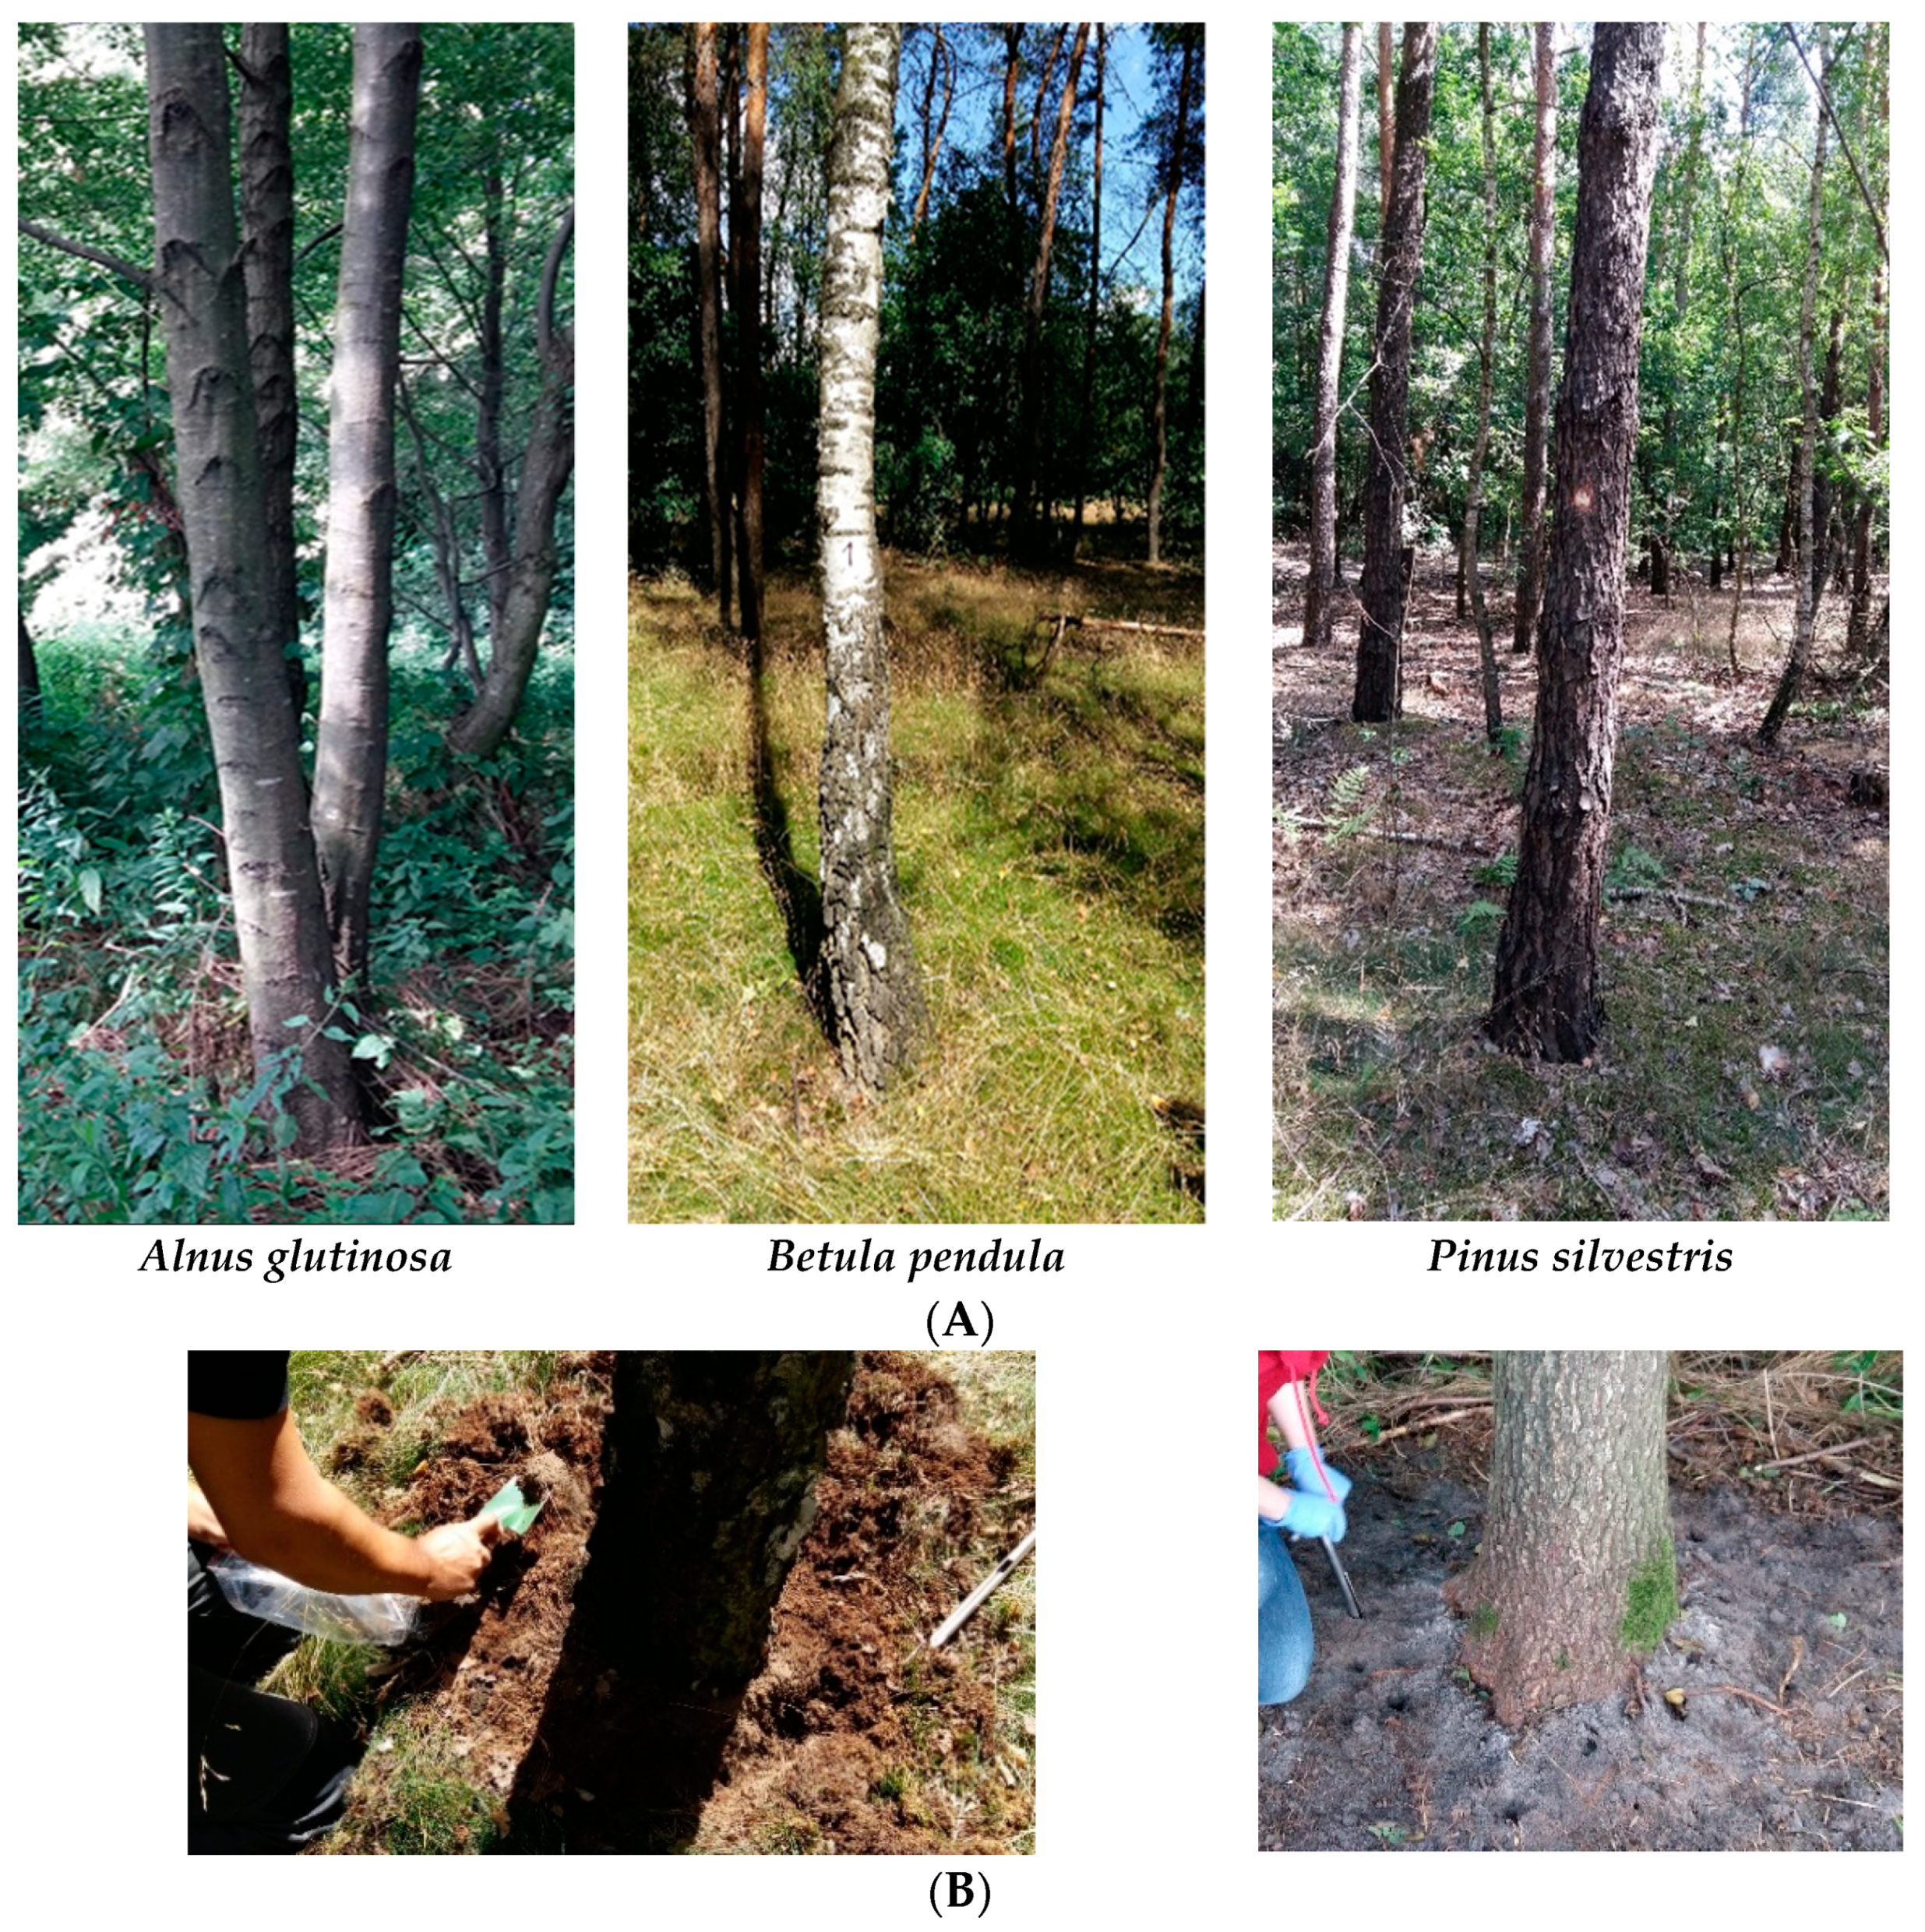
4.1. Sample Collection

Soil samples were collected from the semi-deciduous forest area belonging to Agricultural Experimental Station in Osiny, Puławy, in the southeast of Poland (51°27′57.3″ N 22°02′14″ E) (Figure 11). Semi-deciduous forest is characteristic of the habitat type and is found in mainly the lowlands. In Poland, this type of forest covers about 10.5% of the forest habitat area. This type of forest is found on various soil formations, but most commonly on sandy soils such as Brunic Arenosols and Arenosols. In mixed forests, there are mainly clay sands and sandy loams. In a semi-deciduous forest habitat, the main tree species are pine, birch, alder, oak, beech, spruce, fir, and larch. We chose the three most common tree species for our research: Alnus glutinosa (Ag), Betula pendula (Bp), and Pinus sylvestris (Ps). Temperate forests are characterized by temperature ranges between 20 and 30 °C, with hot summers and cold winters; the average annual temperature for the area is 6.5 °C, and average annual precipitation is 726 mm.
Three plants were selected for each tree species. Figure 12A shows the characteristic habitat for each tree species. The bulk soils from the peri-root zone were collected separately for each tree in summer (August) 2019 and 2020. First, the top layer of the leaf litter was removed. Then, a pooled sample of the rhizosphere soil within the tree roots was collected (Figure 12B). The soil samples were collected from the 0–20 cm layer in three replicates and sieved through a 2 mm sieve and stored in a refrigerator (4 °C) until analysis [35].

4.2. Soil Physico-Chemical Analysis

Several physicochemical properties were measured in the air-dried samples: texture using a Mastersizer 2000 laser diffraction particle size analyzer (Malvern Instruments, Worcestershire, UK); soil organic carbon (C) and total nitrogen (N) by combustion with a vario Macro 8 cube CN analyzer (Elementar, Langenselbold, Germany). The level of the exchangeable cation Mg was determined by using an AAnalyst 800 atomic absorption spectrometer (AAS) (Perkin Elmer, Waltham, MA, USA). The available P2O5 was determined by the Egner–Riehm colorimetric method, using extraction with 0.02 M calcium lactate in 0.01 M HCl, followed by colorimetric measurement in a Lambda 45 Spectrometer (Perkin Elmer, Waltham, MA, USA), on the basis of the reaction with ammonium molybdate and available K2O by the Egner–Riehm method, with K measurement using an AAnalyst 800 AAS. The ammonium and nitrate solubility were determined by flow spectrometry after extraction with 1M K2SO4 by using a QuAAtro39 analyzer (Seal Analytical, Norderstedt, Germany).

4.3. Enzymatic Activities

Enzymatic activity was determined spectrophotometrically: soil dehydrogenase activity using the 2,3,5-triphenyltetrazolium chloride (TTC) method [58] and phosphatase activity by the p-nitrophenyl phosphate (p-NPP) method [59]. Soil dehydrogenase activity (DHA) was determined in 6 g of soil by colorimetric measurement of the reduction of TTC solution to triphenylformazan (TPF) after incubation at 37 °C for 24 h. All microbial analyses were carried out as three replicates [56]. The acid phosphatase (AcP) and alkaline phosphatase (AlP) activities were analyzed by using 1 g of soil incubated for 1 h (37 °C) with p-nitrophenyl phosphate at their optimum pH of 6.5 and 11, respectively, using the spectrophotometric method.

4.4. Biolog EcoPlates

The Biolog EcoPlate system (Biolog Inc. Hayward, CA, USA) was used to determine the metabolic potential of microorganisms in the bulk soil from the peri-root zone of trees. The analysis was conducted by following the manufacturer’s instructions. Metabolic profiling of all soil samples was carried out by using the Biolog EcoPlates, which contain 31 different carbon sources divided into five compound groups: amines and amides, amino acids, carboxylic and acetic acids, carbohydrates, and polymers [38]. One gram of soil was suspended in 99 mL of sterile water, shaken for 20 min at 20 °C, and incubated at 4 °C for 30 min [42,60,61]. Next, each well of a Biolog EcoPlate was inoculated with 120 μL of the prepared suspension and incubated at 25 °C. Absorbance at 590 nm was measured on a Biolog Microstation after 24, 48, 72, 96, and 120 h of incubation. The analysis was carried out as three replicates.

4.5. DNA Extraction, Amplification, and Next-Generation Sequencing

Fresh soil samples were weighed, and 300–350 mg of fresh soil was collected into 1.5 mL tubes for extracting DNA with the FastDNA™ SPIN Kit for Soil (MP Biomedical, Hayward, CA, USA), according to the manufacturer’s instructions. DNA purity and concentration were measured with a NanoDrop 1000 Spectrophotometer (Thermo Scientific, USA). DNA was diluted with sterile MilliQ water to 10 ng µL−1. Soil samples collected in 2019 were sequenced at Genomed S.A (Warsaw, Poland) with 2 × 250 base pair (bp) paired-end technology using the Illumina MiSeq system. Soil samples collected in 2020 were sequenced at Department of Plant Breeding and Biotechnology IUNG-PIB in Puławy, Poland with the same methodology with 2 × 300 base pair (bp) paired-end technology using the Illumina MiSeq system.
The two-step PCR amplification was utilized. In the first-step PCR, we amplified hypervariable V3–V4 region of the 16S rRNA gene with using 341F and 785R primers [62]. The reaction was carried out in 50 µL volume containing 12.5 ng template DNA, 0.1µM of each primer, and KAPA HiFi HotStart ReadyMix (2X) (Roche, Kapa Biosystems, Cape Town, South Africa). The thermocycling conditions were initial denaturing at 95 °C for 3 min, followed by 25 cycles of denaturation at 95 °C for 30 s, 55 °C for 30 s, 72 °C for 30 s, and final extension at 72 °C for 5 min. In second step, we attached dual indices and Illumina sequencing adapters using the Nextera XT Index Kit (Illumina, San Diego, CA, USA), according to the manufacturer’s instructions. The clean-up procedure using AMPure XP beads (Beckman Coulter, Indianapolis, IN, USA) was applied after every PCR step. Final library size validation was performed using the 2100 Bioanalyzer, 1000 DNA chip (Agilent Technologies, Santa Clara, CA, USA). Libraries were quantified using QuantiFluor® dsDNA System on Quantus Fluorometer (Promega, Madison, WI, USA).
Sequencing of pooled libraries was carried out using Illumina 2 × 300 bp kit on a full run of the Miseq instrument (Illumina, San Diego, CA, USA). PhiX control at 5% was spiked into the run to add base diversity.
The 16S rRNA amplicon sequencing data generated in this study was deposited in the NCBI Sequence Read Archive (SRA) under the BioProject number PRJNA779918 (Table 4).

4.6. Bioinformatic and Statistical Analysis

Demultiplexed fastq files were processed using the DADA2 (1.14) package [63] in R software (3.6.0) [64]. On the basis of the quality plots, we trimmed the last 20 and 70 bases off forward and reverse reads, respectively. Primers sequences were removed from all reads. Filter parameters were as follows: maxN = 0, maxEE for both reads = 2, truncQ = 2. The error rates were estimated by learnErrors using 1 million reads, and exact sequence variants were resolved using dada. Next removeBimeraDenovo was used to remove chimeric sequences. After the filtration steps, an average of 132,532 reads were left for further analysis. Taxonomy was assigned against the latest version of the modified RDP v18 database [65] (http://www2.decipher.codes/Classification/TrainingSets/RDP_v18-mod_July2020.RData, accessed on 19 July 2021) using IDTAXA [66] on the sequences table resulting from the DADA2 workflow described above. The results were converted and imported into the phyloseq (1.22.3) package [67]. Sequences belonging to the chloroplast or mitochondrial DNA were removed. Subsequently, for further analysis, the total number of reads for the individual taxa were converted to a percentage, assuming the sum of all taxa in the individual samples as 100%.
The microbiome package in R 3.5.3 was used to calculate bacterial alpha diversity indices, which included species richness (Chao1), diversity (Shannon), and evenness (Simpson) [28]. Each identified ASVs were also annotated to predictive functions potential of bacteria using the functional annotation of prokaryotic taxa (FAPROTAX) pipeline [68]. FAPROTAX is a manually constructed database that maps prokaryotic taxa (e.g., genera or species) to putative functions on the basis of the literature of cultured representatives. The STAMP bioinformatic package was used to identify the significant difference in mean proportion of bacterial putative functions between individual tree type with all other samples from each year [31].
Differences in bacterial family abundance among different tree types of each years were tested using the nonparametric Kruskal–Wallis sum-rank test and the unpaired Wilcoxon test. These tests were followed with linear discriminant analysis (LDA) to estimate the effect size of taxonomical covariates driving the group difference procedure implemented in LEfSe (linear discriminant analysis effect size) [32]. This tool allows the analysis of microbial community data at any clade (from phylum to species level); however, the analysis of the large number of ASVs detected in this study would be computationally too complex, and therefore statistical analysis was performed only from the domain to the family level, and only significant ASVs were used to plot the cladograms. For LEfSe analysis, statistically significant alpha values for the factorial Kruskal–Wallis test among classes and for the pairwise Wilcoxon test between subclasses were set to 0.05. The threshold on logarithmic LDA score for discriminative features was set to 3 to identify the bacterial families with a statistically significant difference. The all-against-all strategy was used for LEfSe.
The main statistical analyses for biological activity were performed using STATISTICA 10 (Stat. Soft. Inc., NY, USA). Collected data were subjected to analysis of variance (ANOVA) for comparison of means. Significant differences were calculated according to Tukey’s post hoc test at a p < 0.05 significance level. The cluster analyses were performed on standardized data from the average absorbance values at 120 h (Biolog EcoPlate). The results were also submitted to principal component analysis (PCA).

5. Conclusions

Our preliminary research has shown that the soil collected from the rhizosphere of selected tree species—black alder, silver birch, and Scots pine—had a unique bacterial microbiome. This microbiome was closely dependent on the tree species and the physicochemical properties of the soil. Soil biological activity and metabolic processes carried out by microorganisms also depended on soil properties and plant species. Understanding the diversity of bacteria in the rhizosphere and the interactions between microbiota and trees will facilitate the development of future strategies for forest protection and finding the appropriate indicators for reliable assessment of forest soils.

Author Contributions

Conceptualization, A.G.; methodology, A.G., A.M.-G., J.G., K.G., and J.N.; formal analysis, A.G., A.M.-G., J.G., K.G., J.N., and M.P.; soil sampling: A.G., A.M.-G., J.G., K.G., K.F., and J.N.; bioinformatics analyses: J.G., and M.V.; writing—original draft preparation, A.G., A.M.-G., J.G., M.V., and J.N.; writing—review and editing, A.G., A.M.-G., J.G., M.V., M.P., and J.N.; visualization, A.G., M.V., and J.G.; supervision, A.G.; project administration, A.G.; funding acquisition, A.G. All authors have read and agreed to the published version of the manuscript.

Funding

The research was carried out as part of the implementation of the project no. 1.27 “Structural and functional characteristics of the biodiversity of soil microorganisms in the forest and agricultural ecosystem”, (2019–2022).

Institutional Review Board Statement

Not applicable.

Informed Consent Statement

Not applicable.

Data Availability Statement

Not applicable.

Acknowledgments

We thank Jarosław Ciepiel for technical support.

Conflicts of Interest

The authors declare no conflict of interest.

References

  1. Bonan, G.B. Forests and climate change: Forcings, feedbacks, and the climate benefits of forests. Science 2008, 320, 1444–1449. [Google Scholar] [CrossRef] [Green Version]
  2. Pawlik, Ł.; Buma, B.; Šamonil, P.; Kvaček, J.; Gałązka, A.; Kohout, P.; Malik, I. Impact of trees and forests on the Devonian landscape and weathering processes with implications to the global Earth’s system properties—A critical review. Earth-Sci. Rev. 2021, 205, 103200. [Google Scholar] [CrossRef]
  3. Brożek, S.; Zwydak, M.; Lasota, J.; Różański, W. Założenia metodyczne badań związków między glebą a zespołami roślinnymi w lasach. Rocz. Glebozn. 2011, 62, 16–38. (In Polish) [Google Scholar]
  4. Nannipieri, P.; Ascher, J.; Ceccherini, M.T.; Landi, L.; Pietramellara, G.; Renella, G. Microbial diversity and soil functions. Eur. J. Soil Sci. 2003, 54, 655–670. [Google Scholar] [CrossRef]
  5. Prescott, C.E.; Grayston, S.J. Tree species influence on microbial communities in litter and soil: Current knowledge and research needs. For. Ecol. Manag. 2013, 309, 19–27. [Google Scholar] [CrossRef]
  6. Abramczyk, K.; Gałązka, A. Różnorodność mikroorganizmów glebowych obszarów chronionych i o znaczących walorach przyrodniczych. Sylwan 2017, 161, 496–503. (In Polish) [Google Scholar]
  7. Buée, M.; de Boer, W.; Martin, F.; van Overbeek, L.; Jurkevitch, E. The rhizosphere zoo: An overview of plant-associated communities of microorganisms, including phages, bacteria, archaea, and fungi, and of some of their structuring factors. Plant Soil 2009, 321, 189–212. [Google Scholar] [CrossRef]
  8. Chemidlin, A.; Prevost-Boure, N.; Maron, P.-A.; Ranjard, L.; Nowak, V.; Dufrene, E.; Damesin, C.; Soudani, K.; Lata, J.-C. Seasonal dynamics of the bacterial community in forest soils under different quantities of leaf litter. Appl. Soil Ecol. 2011, 47, 14–23. [Google Scholar] [CrossRef]
  9. Fierer, N.; Jackson, R.B. The diversity and biogeography of soil bacterial communities. Proc. Natl. Acad. Sci. USA 2006, 103, 626–631. [Google Scholar] [CrossRef] [Green Version]
  10. Hardoim, P.R.; Van Overbeek, L.S.; Berg, G.; Pirttilä, A.M.; Compant, S.; Campisano, A.; Döring, M.; Sessitsch, A. The hidden world within plants: Ecological and evolutionary considerations for defining functioning of microbial endophytes. Microbiol. Mol. Biol. Rev. 2015, 79, 293–320. [Google Scholar] [CrossRef] [Green Version]
  11. Kuzyakov, Y.; Blagodatskaya, E. Microbial hotspots and hot moments in soil: Concept & review. Soil Biol. Biochem. 2015, 83, 184–199. [Google Scholar] [CrossRef]
  12. Liu, H.; Carvalhais, L.C.; Crawford, M.; Singh, E.; Dennis, P.G.; Pieterse, C.M.J.; Schenk, P.M. Inner plant values: Diversity, colonization and benefits from endophytic bacteria. Front. Microbiol. 2017, 19, 2552. [Google Scholar] [CrossRef]
  13. Baldrian, P. Forest microbiome: Diversity, complexity and dynamics. nFEMS Microbiol. Rev. 2017, 41, 109–130. [Google Scholar] [CrossRef] [Green Version]
  14. Abdul Rahman, N.S.N.; Abdul Hamid, N.W.; Nadarajah, K. Effects of Abiotic Stress on Soil Microbiome. Int. J. Mol. Sci. 2021, 22, 9036. [Google Scholar] [CrossRef]
  15. Bergkemper, F.; Scholer, A.; Engel, M.; Lang, F.; Kruger, J.; Schloter, M.; Schulz, S. Phosphorus depletion in forest soils shapes bacterial communities towards phosphorus recycling systems. Environ. Microbiol. 2016, 18, 1988–2000. [Google Scholar] [CrossRef]
  16. Habiyaremye, J.D.; Goldmann, K.; Reitz, T.; Herrmann, S.; Buscot, F. Tree Root Zone Microbiome: Exploring the Magnitude of Environmental Conditions and Host Tree Impact. Front. Microbiol. 2020, 11, 749. [Google Scholar] [CrossRef]
  17. Kim, M.; Kim, W.S.; Tripathi, B.M.; Adams, J. Distinct bacterial communities dominate tropical and temperate zone leaf litter. Microb. Ecol. 2014, 67, 837–848. [Google Scholar] [CrossRef]
  18. Kuźniar, A.; Włodarczyk, K.; Grządziel, J.; Goraj, W.; Gałązka, A.; Wolińska, A. Culture-independent analysis of an endophytic core microbiome in two species of wheat: Triticum aestivum L. (cv. ‘Hondia’) and the first report of microbiota in Triticum spelta L. (cv. ‘Rokosz’). Syst. Appl. Microbiol. 2019, 43, 126025. [Google Scholar] [CrossRef]
  19. Uroz, S.; Courty, P.E.; Pierrat, J.C.; Peter, M.; Buéé, M.; Turpault, M.P.; Garbaye, J.; Frey-Klett, P. Functional profiling and distribution of the forest soil bacterial communities along the soil mycorrhizosphere continuum. Microb. Ecol. 2013, 66, 404–415. [Google Scholar] [CrossRef]
  20. Štursová, M.; Bárta, J.; Šantrùcková, H.; Baldrian, P. Small-scale spatial heterogeneity of ecosystem properties, microbial community composition and microbial activities in a temperate mountain forest soil. FEMS Microbiol. Ecol. 2016, 92, fiw185. [Google Scholar] [CrossRef] [Green Version]
  21. Lladó, S.; López-Mondéjar, R.; Baldrian, P. Forest soil bacteria: Diversity, involvement in ecosystem processes, and response to global change. Microbiol. Mol. Biol. Rev. 2017, 81, e00063-16. [Google Scholar] [CrossRef] [Green Version]
  22. Furtak, K.; Grządziel, J.; Gałązka, A.; Niedźwiecki, J. Analysis of Soil Properties, Bacterial Community Composition, and Metabolic Diversity in Fluvisols of a Floodplain Area. Sustainability 2019, 11, 3929. [Google Scholar] [CrossRef] [Green Version]
  23. Gałązka, A.; Grzęda, E.; Jończyk, K. Changes of Microbial Diversity in Rhizosphere Soils of New Quality Varieties of Winter Wheat Cultivation in Organic Farming. Sustainability 2019, 11, 4057. [Google Scholar] [CrossRef] [Green Version]
  24. Lasota, J.; Błońska, E.; Babiak, T.; Piaszczyk, W.; Stępniewska, H.; Jankowiak, R.; Boroń, P.; Lenart-Boroń, A. Effect of Charcoal on the Properties, Enzyme Activities and Microbial Diversity of Temperate Pine Forest Soils. Forests 2021, 12, 1488. [Google Scholar] [CrossRef]
  25. Torsvik, V.; Øvreås, L. Microbial diversity and function in soil: From genes to ecosystems. Curr. Opin. Microbiol. 2002, 5, 240–245. [Google Scholar] [CrossRef]
  26. Cong, J.; Yang, Y.; Liu, X.; Lu, H.; Liu, X.; Zhou, J.; Li, D.; Yin, H.; Ding, J.; Zhang, Y. Analyses of soil microbial community compositions and functional genes reveal potential consequences of natural forest succession. Sci. Rep. 2015, 5, 10007. [Google Scholar] [CrossRef] [Green Version]
  27. Xu, J. Metagenomics and Ecosystems Biology: Conceptual Frameworks, Tools and Methods (w) Metagenomics. Theory, Methods and Applications, Red; Marco, D., Ed.; Caister Academic Press: Norfolk, UK, 2010; pp. 1–14. [Google Scholar]
  28. Lahti, L.; Shetty, S. Tools for Microbiome Analysis in R. 2017. Available online: http://microbiome.github.com/microbiome (accessed on 19 July 2021).
  29. Lebeis, S.L. Greater than the sum of their parts: Characterizing plant microbiomes at the community-level. Curr. Opin. Plant Biol. 2015, 24, 82–86. [Google Scholar] [CrossRef]
  30. Levy-Booth, D.J.; Prescott, C.E.; Grayston, S.J. Microbial functional genes involved in nitrogen fixation, nitrification and denitrification in forest ecosystems. Soil Biol. Biochem. 2014, 75, 11–25. [Google Scholar] [CrossRef]
  31. Parks, D.H.; Beiko, R.G. Identifying biologically relevant differences between metagenomic communities. Bioinformatics 2010, 26, 715–721. [Google Scholar] [CrossRef] [Green Version]
  32. Segata, N.; Izard, J.; Waldron, L. Metagenomic biomarker discovery and explanation. Genome Biol. 2011, 12, R60. [Google Scholar] [CrossRef] [Green Version]
  33. Thomas, T.; Gilbert, J.; Meyer, F. Metagenomics—A guide from sampling to data analysis. BMC Microb. 2012, Inf. Exp. 2, 3. [Google Scholar] [CrossRef] [Green Version]
  34. Torres-Cortés, G.; Millán, V.; Ramírez-Saad, H.C.; Nisa-Martínez, R.; Toro, N.; Martínez-Abarca, F. Characterization of novel antibiotic resistance genes identified by functional metagenomics on soil samples. Environ. Microbiol. 2011, 13, 1101–1114. [Google Scholar] [CrossRef] [PubMed]
  35. PN-ISO 10381-6; Quality of Soil Collected Samples—Principles of Collected and Kept of Soil Samples to the Microbiological Research in Laboratory Conditions. Polish Standard. ISO: Geneva, Switzerland, 1998.
  36. Kononowa, M. Substancje Organiczne Gleby ich Budowa, Właściwości i Metody Badań; Wydawnictwo Rolnicze i Leśne Warszawa: Warsaw, Poland, 1968. (In Polish) [Google Scholar]
  37. Kędziora, A. Przyrodnicze podstawy ochrony ekosystemów rolniczych. Frag. Agronom. 2007, 3, 213–223. (In Polish) [Google Scholar]
  38. Yadav, A.N.; Verma, P.; Singh, B.; Chauhan, V.S.; Suman, A.; Saxena, A.K. Plant growth promoting bacteria: Biodiversity and multifunctional attributes for sustainable agriculture. Adv. Biotechnol. Microbiol. 2017, 5, 1–16. [Google Scholar] [CrossRef]
  39. Baldrian, P.; Kolarˇík, M.; Štursová, M.; Kopecký, J.; Valaskova, V.; Větrovský, T.; Žifčáková, L.; Šnajdr, J.; Rídl, J.; Vlček, C.; et al. Active and total microbial communities in forest soil are largely different and highly stratified during decomposition. ISME J. 2012, 6, 248–258. [Google Scholar] [CrossRef] [Green Version]
  40. Brzostek, E.R.; Greco, A.; Drake, J.E.; Finzi, A.C. Root carbon inputs to the rhizosphere stimulate extracellular enzyme activity and increase nitrogen availability in temperate forest soil. Biogeochemistry 2012, 115, 65–76. [Google Scholar] [CrossRef]
  41. Woźniak, M.; Gałązka, A. The rhizosphere microbiome and its beneficial effects on plants. Postępy Mikrobiol. 2019, 58, 59–69. [Google Scholar] [CrossRef] [Green Version]
  42. Garland, J.L.; Mills, A.L. Classification and characterization of heterotrophic microbial communities on the basis of patterns of community-level sole-carbon-source utilization. Appl. Environ. Microbiol. 1991, 57, 2351–2359. [Google Scholar] [CrossRef] [Green Version]
  43. Lladó, S.; Baldrian, P. Community-level physiological profiling analyses show potential to identify the copiotrophic bacteria present in soil environments. PLoS ONE 2017, 12, e0171638. [Google Scholar] [CrossRef]
  44. Grządziel, J.; Furtak, K.; Gałązka, A. Community-level physiological profiles of microorganisms from different types of soil characteristic to Poland—A long-term microplot experiment. Sustainability 2019, 11, 56. [Google Scholar] [CrossRef] [Green Version]
  45. Wolińska, A.; Kuźniar, A.; Gałązka, A. Biodiversity in the Rhizosphere of Selected Winter Wheat (Triticum aestivum L.) Cultivars—Genetic and Catabolic Fingerprinting. Agronomy 2020, 10, 953. [Google Scholar] [CrossRef]
  46. Woźniak, M.; Gałązka, A.; Tyśkiewicz, R.; Jaroszuk-Ściseł, J. Endophytic Bacteria Potentially Promote Plant Growth by Synthesizing Different Metabolites and their Phenotypic/Physiological Profiles in the Biolog GEN III MicroPlateTM Test. Int. J. Mol. Sci. 2019, 20, 5283. [Google Scholar] [CrossRef] [Green Version]
  47. Si, P.; Shao, W.; Yu, H.; Yang, X.; Gao, D.; Qiao, X.; Wang, Z.; Wu, G. Rhizosphere Microenvironments of Eight Common Deciduous Fruit Trees Were Shaped by Microbes in Northern China. Front. Microbiol. 2018, 9, 3147. [Google Scholar] [CrossRef]
  48. Thiem, D.; Gołębiewski, M.; Hulisz, P.; Piernik, A.; Hrynkiewicz, K. How Does Salinity Shape Bacterial and Fungal Microbiomes of Alnus glutinosa Roots? Front. Microbiol. 2018, 9, 651. [Google Scholar] [CrossRef]
  49. Rosier, C.L.; Polson, S.W.; D’Amico, V., III; Kan, J.; Trammell, T.L.E. Urbanization pressures alter tree rhizosphere microbiomes. Sci. Rep. 2021, 11, 9447. [Google Scholar] [CrossRef]
  50. Gałazka, A.; Niedźwiecki, J.; Grządziel, J.; Gawryjołek, K. Evaluation of Changes in Glomalin-Related Soil Proteins (GRSP) Content, Microbial Diversity and Physical Properties Depending on the Type of Soil as the Important Biotic Determinants of Soil Quality. Agronomy 2020, 10, 1279. [Google Scholar] [CrossRef]
  51. Warren, D.A.; Cheng, L.; Wang, P. Soil acid and alkaline phosphatase activity as pH adjustment indicators. Soil Biol. Biochem. 2020, 32, 1915–1919. [Google Scholar] [CrossRef]
  52. Margalef, O.; Sardans, J.; Fernández-Martínez, M.; Molowny-Horas, R.; Janssens, I.A.; Ciais, P.; Goll, D.; Richter, A.; Obersteiner, M.; Asensio, D.; et al. Global patterns of phosphatase activity in natural soils. Sci. Rep. 2017, 7, 1337. [Google Scholar] [CrossRef] [Green Version]
  53. Lemanowicz, A.; Bartkowiak, A. Changes in the activity of phosphatase and the content of phosphorus in salt-affected soils grassland habitat Natura 2000. Pol. J. Soil Sci. 2016, 49, 149. [Google Scholar] [CrossRef] [Green Version]
  54. Kamutando, C.N.; Vikram, S.; Kamgan-Nkuekam, G.; Makhalanyane, T.P.; Greve, M.; Le Roux, J.J.; Richardson, D.M.; Cowan, D.A.; Valverde, A. The Functional Potential of the Rhizospheric Microbiome of an Invasive Tree Species, Acacia dealbata. Microb. Ecol. 2019, 77, 191–200. [Google Scholar] [CrossRef] [Green Version]
  55. Marupakula, S.; Mahmood, S.; Finlay, R.D. Analysis of single root tip microbiomes suggests that distinctive bacterial communities are selected by Pinus sylvestris roots colonized by different ectomycorrhizal fungi. Environ. Microbiol. 2016, 18, 1470–1483. [Google Scholar] [CrossRef]
  56. Izumi, H.; Anderson, I.C.; Alexander, I.J.; Killham, K.; Moore, E.R. Endobacteria in some ectomycorrhiza of Scots pine (Pinus sylvestris). FEMS Microbiol. Ecol. 2006, 56, 34–43. [Google Scholar] [CrossRef] [Green Version]
  57. Pinho, D.; Barroso, C.; Froufe, H.; Brown, N.; Vanguelova, E.; Egas, C.; Denman, S. Linking Tree Health, Rhizosphere Physicochemical Properties, and Microbiome in Acute Oak Decline. Forests 2020, 11, 1153. [Google Scholar] [CrossRef]
  58. Casida, L.E.J.; Klein, D.A.; Santoro, T. Soil dehydrogenases activity. Soil Sei. 1964, 98, 371–376. [Google Scholar] [CrossRef]
  59. Tabatabai, M.A.; Bremner, J.M. Use of p-nitrophenyl phosphate for assay of soil phosphate activity. Soil Biol. Biochem. 1969, 1, 301–307. [Google Scholar] [CrossRef]
  60. Gałązka, A.; Gawryjołek, K.; Perzyński, A.; Gałązka, R.; Księżak, J. Changes of enzymatic activities and microbial communities in soil under long-term maize monoculture and crop rotation. Pol. J. Environ. 2017, 26, 39–46. [Google Scholar] [CrossRef]
  61. Grządziel, J.; Gałązka, A. Microplot long-term experiment reveals strong soil type influence on bacteria composition and its functional diversity. Appl. Soil Ecol. 2017. [Google Scholar] [CrossRef]
  62. Klindworth, A.; Pruesse, E.; Schweer, T.; Peplies, J.; Quast, C.; Horn, M.; Glöckner, F. Evaluation of general 16S ribosomal RNA gene PCR primers for classical and next-generation sequencing-based diversity studies. Nucleic Acids Res. 2013, 41. [Google Scholar] [CrossRef]
  63. Callahan, B.J.; McMurdie, P.J.; Rosen, M.J.; Han, A.W.; Johnson, A.J.A.; Holmes, S.P. DADA2: High-resolution sample inference from Illumina amplicon data. Nat. Methods 2016, 13, 581–583. [Google Scholar] [CrossRef] [Green Version]
  64. R Core Team. R: A Language and Environment for Statistical Computing; R Foundation for Statistical Computing: Vienna, Austria, 2016. [Google Scholar]
  65. Wright, E.S. RDP v16 Modified Training Set for 16S rRNA Classification, 2019, [WWW Document]. (Udostępniono 2.1.19). Available online: http://www2.decipher.codes/Classification/TrainingSets/RDP_v16-mod_March2018.RData (accessed on 19 July 2021).
  66. Murali, A.; Bhargava, A.; Wright, E.S. IDTAXA: A novel approach for accurate taxonomic classification of microbiome sequences. Microbiome 2018, 6, 140. [Google Scholar] [CrossRef]
  67. McMurdie, P.J.; Holmes, S. Phyloseq: An R Package for Reproducible Interactive Analysis and Graphics of Microbiome Census Data. PLoS ONE 2013, 8, e61217. [Google Scholar]
  68. Louca, S.; Parfrey, L.W.; Doebeli, M. Decoupling function and taxonomy in the global ocean microbiome. Science 2016, 353, 1272–1277. [Google Scholar] [CrossRef] [PubMed]
Figure 1. Utilization percent of selected groups of substrates obtained in the Biolog EcoPlates incubated for 120 h (n = 3): (A) amines and amides, (B) amino acids, (C) carboxylic and acetic acids, (D) carbohydrates, and (E) polymers. Treatment means separated by different letters (A, B, C, D for 2019 and a, b, c for 2020) are significantly different (Tukey’s mean separation test, p < 0.05); n = 3.
Ijms 23 02633 g001
Figure 2. Heatmap based on the analysis of 31 carbon sources after 120 h of incubation of the Biolog EcoPlates. (A) The data obtained from samples collected in 2019. (B). The data obtained from samples collected in 2020. The results illustrate the difference in microbial communities in each sample according to the substrate utilization. The data were standardized (n = 3).
Ijms 23 02633 g002
Figure 3. AWCD index values, two-year mean (n = 9), wavelength 590 nm.
Ijms 23 02633 g003
Figure 4. Principal component analysis (PCA). (A) Results obtained in 2019. (B) Results obtained in 2020.
Ijms 23 02633 g004
Figure 5. Alpha diversity indices: species richness (Chao1), diversity (Shannon), and evenness (Simpson).
Ijms 23 02633 g005
Figure 6. Relative proportion of dominant bacterial taxa in the bulk soils (percentage of sequences) according to next-generation sequencing (16S rRNA) by sampling site. (A) At the phylum level; (B) at the order level; (C) at the class level.
Ijms 23 02633 g006
Figure 7. The UPGMA algorithm; the dendrogram with the pairwise similarity matrix, Bray Curtis dissimilarity.
Ijms 23 02633 g007
Figure 8. The LEfSe analysis representing differentially abundance families between groups: Alnus glutinosa (Ag), Betula pendula (Bp), and Pinus silvestris (Ps). (A) Summary for 2019; (B) summary for 2020.
Ijms 23 02633 g008
Figure 9. NMDS—non-metric multidimensional scaling dissimilarity measure among samples collected in 2019 and 2020.
Ijms 23 02633 g009
Figure 10. Significant difference in mean proportion of bacterial putative functions between individual tree type with the rest of the tree types from different years. Distinct colors represent different tree types: red, Ag; green, Bp; blue, Ps; brown, all samples.
Ijms 23 02633 g010
Figure 11. Place of sampling—Agricultural Experimental Station in Osiny, Puławy, Poland.
Ijms 23 02633 g011
Figure 12. (A) Ecosystem of the selected tree species. (B) Soil sampling.
Ijms 23 02633 g012
Table 1. Classification and basic characteristic of soil samples collected from peri-root zone of trees in summer 2019 and 2020.
TreeSymbolSoil Texture Class (USDA) *Particle Size Distribution [%]Corg
(%)
Humus
(%)
Ctot (%)Ntot
(%)
C/NPKMgpH
Sand (2.0–0.05 mm)Silt (0.05–0.002 mm)Clay
(<0.002 mm)
Betula pendulaBp1sand96.623.360.021.8303.1552.1210.17312.2606.9796.3541.6403.235
Bp2sand95.684.120.191.3762.3721.5870.12712.4925.5324.9070.8903.225
Bp3sand95.734.170.091.3572.3391.5360.13111.77010.1925.6921.3303.190
Alnus glutinosaAg1sand91.858.000.160.9881.7031.1330.06517.5023.1831.2900.3803.500
Ag2sand93.526.450.021.0931.8841.2360.07117.4736.1701.0140.3003.190
Ag3sand92.987.000.020.6401.1030.7160.03918.3465.4781.0860.3503.710
Pinus sylvestrisPs1sand95.584.400.021.1571.9941.2840.08016.0441.1151.5530.8103.080
Ps2sand92.946.540.520.9991.7231.1170.06816.4191.4581.2800.4003.020
Ps3sand93.645.860.501.2512.1571.4220.08816.2511.3521.6430.2802.985
* Determined on the basis of the United States Department of Agriculture (USDA) Natural Resources Conservation Service; Soil Taxonomy A Basic System of Soil Classification for Making and Interpreting Soil Surveys.
Table 2. Enzymatic activities in soil samples collected from peri-root zone of tree: silver birch (Bp; Betula pendula), black alder (Ag, Alnus glutinosa), and Scots pine (Ps, Pinus sylvestris).
SampleDHAAlPAcP
2019
Bp16.283 b ± 0.7059.535 b ± 0.29841.633 b ± 2.033
Bp28.044 b ± 0.8069.337 b ± 0.34641.442 b ± 3.828
Bp35.262 b ± 0.3058.611 b ± 0.70435.007 b ± 0.388
Ag151.504 a ± 2.61816.113 a ± 0.39696.383 a ± 2.454
Ag235.676 a ± 2.83514.667 a ± 0.40979.701 a ± 2.715
Ag326.270 a ± 1.50413.359 a ± 0.28082.302 a ± 6.598
Ps10.931 c ± 0.1157.874 c ± 0.85616.934 c ± 1.614
Ps21.151 c ± 0.1196.591 c ± 0.35718.471 c ± 1.016
Ps30.607 c ± 0.0056.670 c ± 0.41713.778 c ± 1.120
2020
Bp112.064 b ± 0.64911.513 b ± 1.08938.436 b ± 2.565
Bp212.027 b ± 0.61710.585 b ± 1.30044.292 b ± 1.347
Bp39.473 b ± 0.72510.142 b ± 0.26937.711 b ± 2.937
Ag125.067 c ± 0.42715.077 a ± 0.69781.241 a ± 5.076
Ag219.952 c ± 0.32014.232 a ± 0.13680.230 a ± 1.743
Ag324.525 c ± 0.20613.109 a ± 0.44374.925 a ± 1.951
Ps11.875 c ± 0.1187.085 c ± 0.56716.252 c ± 0.695
Ps21.145 c ± 0.1187.740 c ± 0.25615.009 c ± 1.023
Ps31.377 c ± 0.0616.704 c ± 0.21114.571 c ± 1.567
DHA—dehydrogenases (μg formazan/g dry matter (d.m.) of soil/24 h); AlP—alkaline phosphatase (μg p-nitrophenol/g d.m. of soil/h); AcP—acid phosphatase (μg p-nitrophenol/g d.m. of soil/h). Treatment means with different letters are significantly different (Tukey’s mean separation test, p < 0.05; n = 3).
Table 3. Changes in microorganism metabolic diversity in bulk soils from the peri-root zone of trees as evaluated by Shannon’s general diversity index (H), substrate richness (R), substrate evenness (E), and average well-color development (AWCD590) obtained in the Biolog EcoPlates incubated for 120 h. Treatment means separated by different letters are significantly different (Tukey’s mean separation test, p < 0.05); n = 3.
Sample IDH’REAWCD590
2019
Bp13.148 b ± 0.01626.000 b ± 0.5770.986 b ± 0.0051.342 b ± 0.057
Bp23.052 b ± 0.03123.333 b ± 0.3770.979 b ± 0.0061.345 b ± 0.133
Bp33.122 b ± 0.02823.000 b ± 1.7320.975 b ± 0.0181.310 b ± 0.069
Ag13.355 a ± 0.02130.000 a ± 0.3770.957 c ± 0.0061.873 a ± 0.048
Ag23.374 a ± 0.01330.333 a ± 0.5770.959 c ± 0.0021.997 a ± 0.080
Ag33.379 a ± 0.01330.333 a ± 0.5770.960 c ± 0.0021.935 a ± 0.060
Ps12.609 c ± 0.03316.333 c ± 1.0821.045 a ± 0.0390.424 c ± 0.030
Ps22.735 c ± 0.00318.333 c ± 0.5770.992 a ± 0.0090.763 c ± 0.036
Ps32.921 b ± 1.12817.000 c ± 1.0001.032 a ± 0.0490.403 c ± 0.064
2020
Bp13.144 b ± 0.02525.333 b ± 1.1550.973 b ± 0.0101.338 b ± 0.061
Bp23.138 b ± 0.04222.000 b ± 1.7320.984 b ± 0.0121.363 b ± 0.084
Bp32.993 b ± 0.01023.667 b ± 0.5770.988 b ± 0.0061.278 b ± 0.072
Ag13.361 a ± 0.01929.667 a ± 0.5770.962 c ± 0.0061.792 a ± 0.173
Ag23.292 a ± 0.00628.333 a ± 0.5770.954 c ± 0.0061.752 a ± 0.021
Ag33.344 a ± 0.01929.667 a ± 0.5770.977 c ± 0.0011.832 a ± 0.075
Ps12.607 c ± 0.02616.667 c ± 1.5280.992 a ± 0.0120.539 c ± 0.055
Ps22.740 c ± 0.11515.667 c ± 0.5280.998 a ± 0.0660.776 c ± 0.076
Ps33.005 b ± 0.03118.333 c ± 1.5280.964 a ± 0.0120.660 c ± 0.039
Table 4. Number of amplicon sequence variants detected in each sample.
Sample IDASVsClassified ASVs (%)Sequence Read Archive (SRA)
NCBI ID
2019
Bp110059SRR16926273
Bp212362SRR16926272
Bp38859SRR16926271
Ag122766SRR16926270
Ag218364SRR16926269
Ag318764SRR16926267
Ps18762SRR16926266
Ps27961SRR16926265
Ps317865SRR16926264
2020
Bp110655SPR16962104
Bp210657SPR16962103
Bp311157SPR16962102
Ag117265SPR16962101
Ag217461SPR16962100
Ag322565SPR16962098
Ps18560SPR16962097
Ps210564SPR16962096
Ps34652SPR16962095
Publisher’s Note: MDPI stays neutral with regard to jurisdictional claims in published maps and institutional affiliations.

