
Combination of Genomic and Transcriptomic Approaches Highlights Vascular and Circadian Clock Components in Multiple Sclerosis

 , ,
, ,
Abstract
:1. Introduction
2. Results
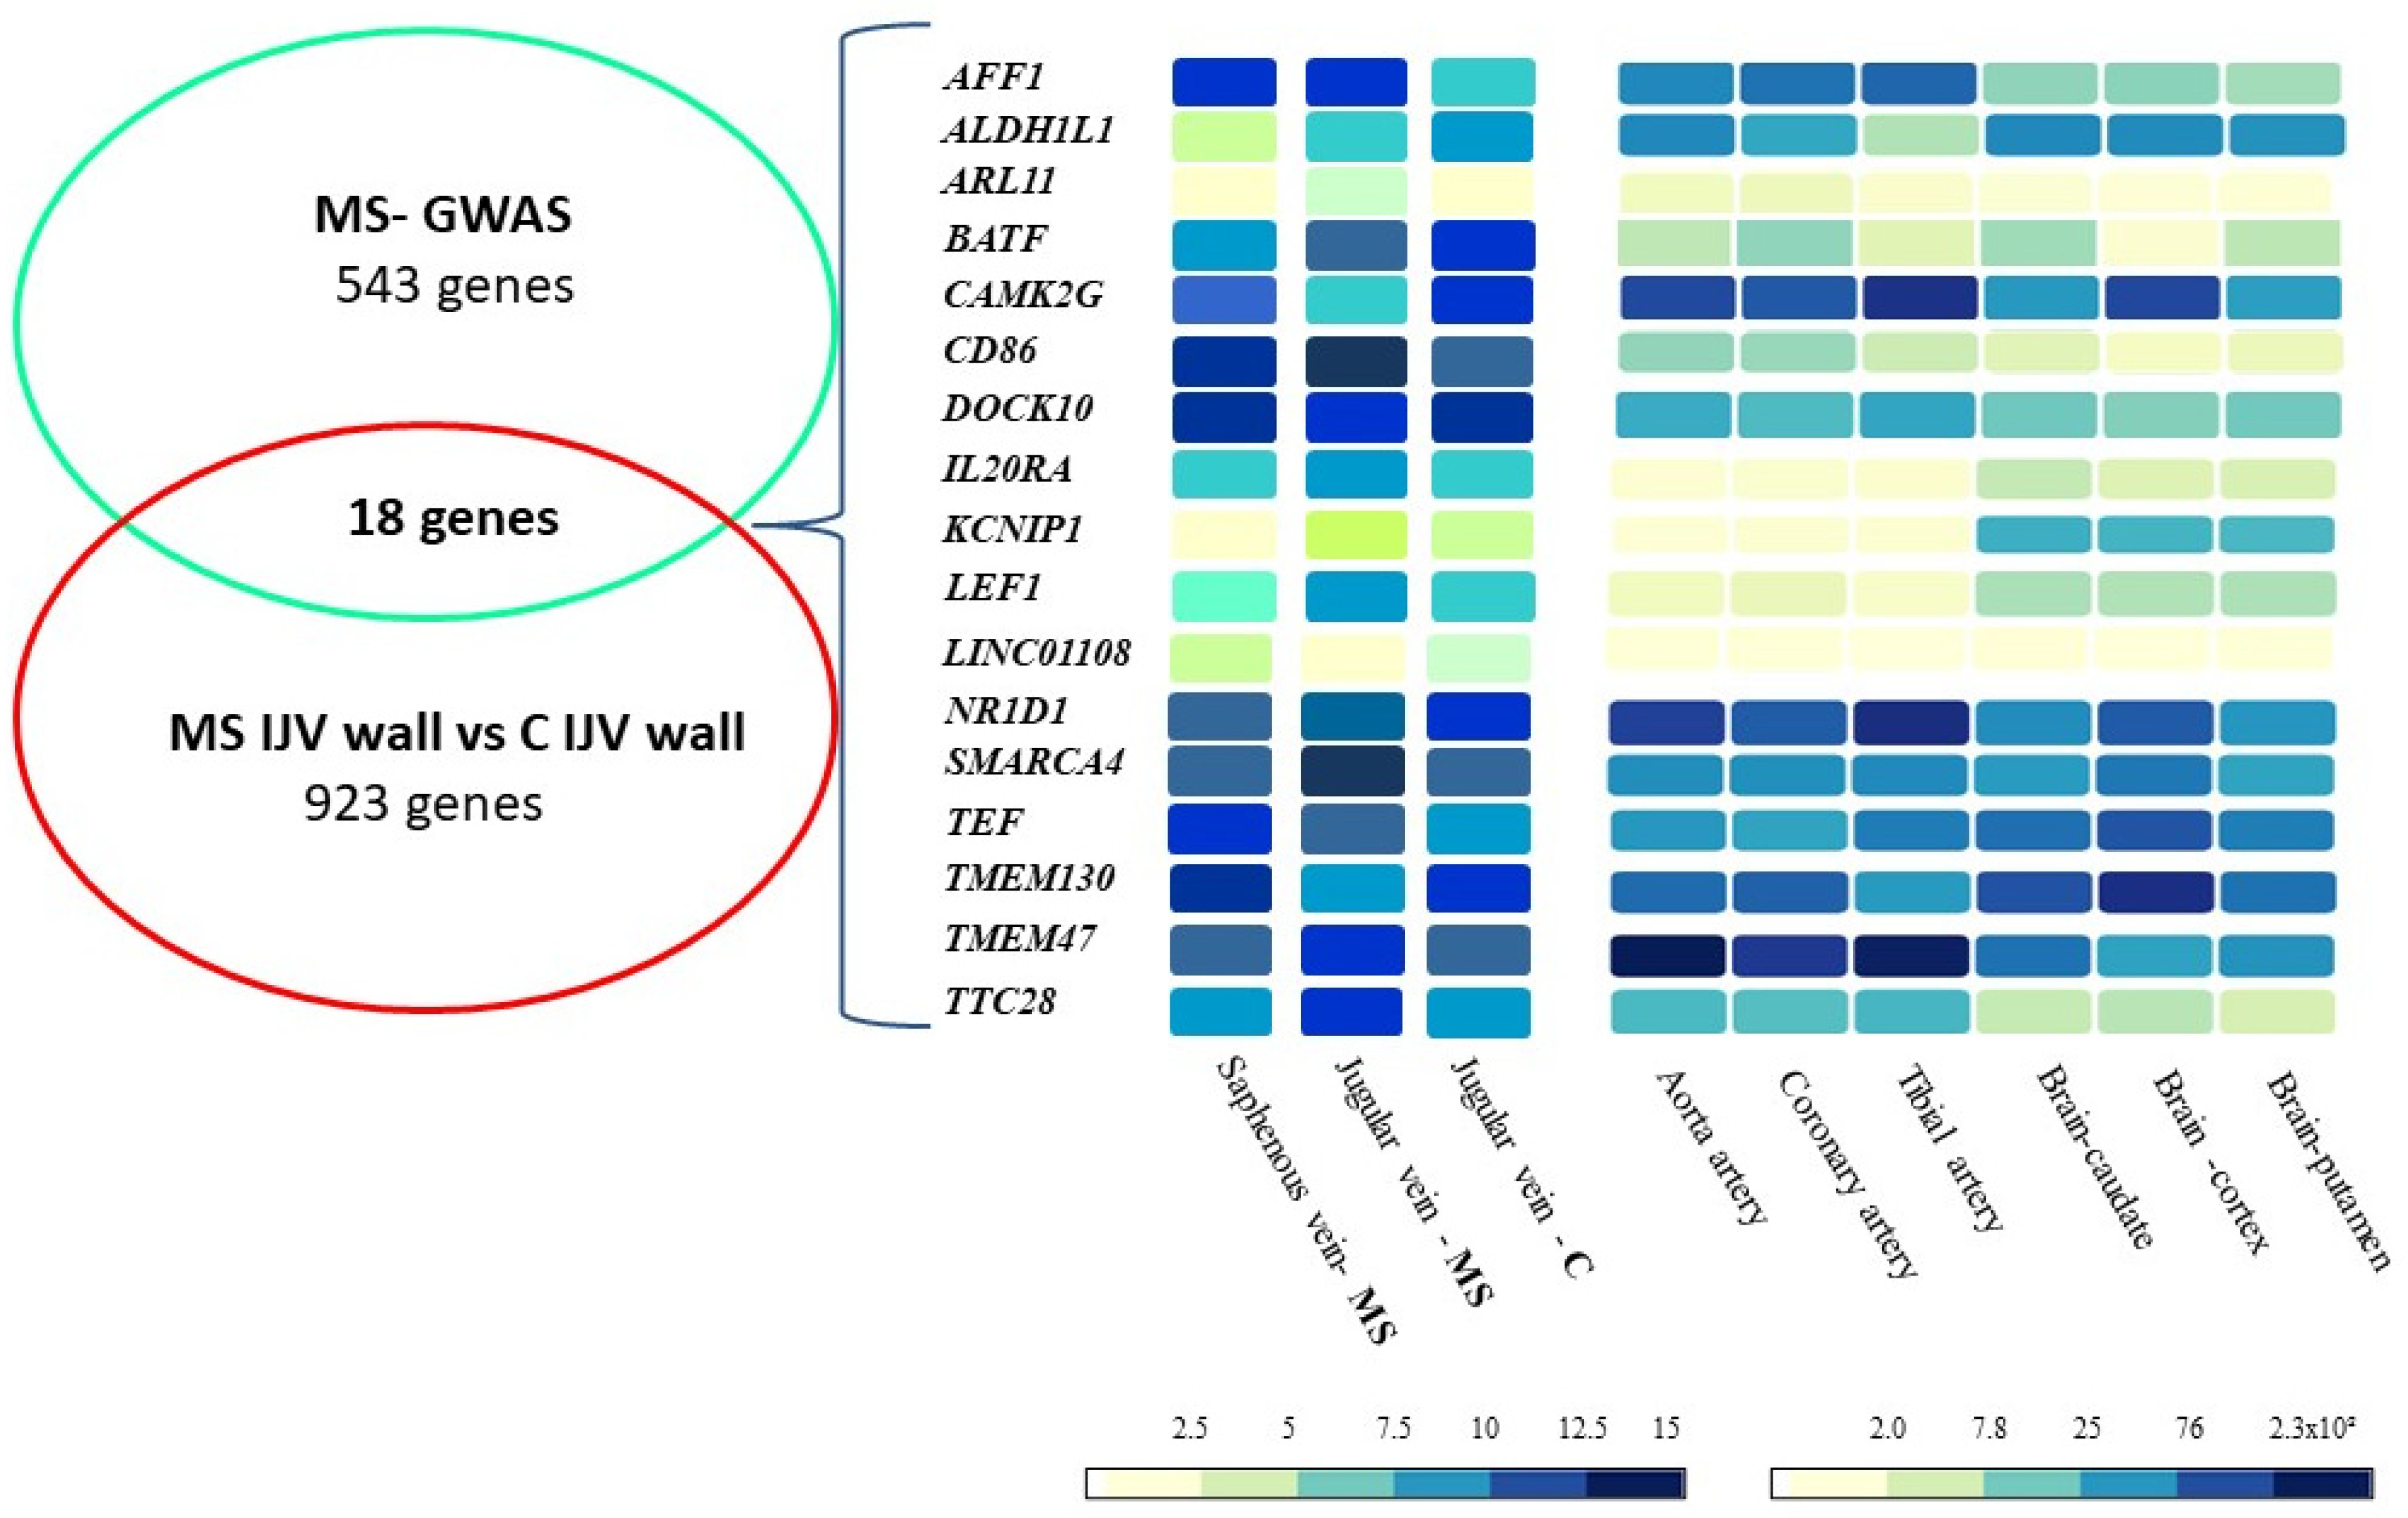
2.1. The Transcriptomic Approach: Expression Profile of MS-GWAS Genes in Vascular Tissues
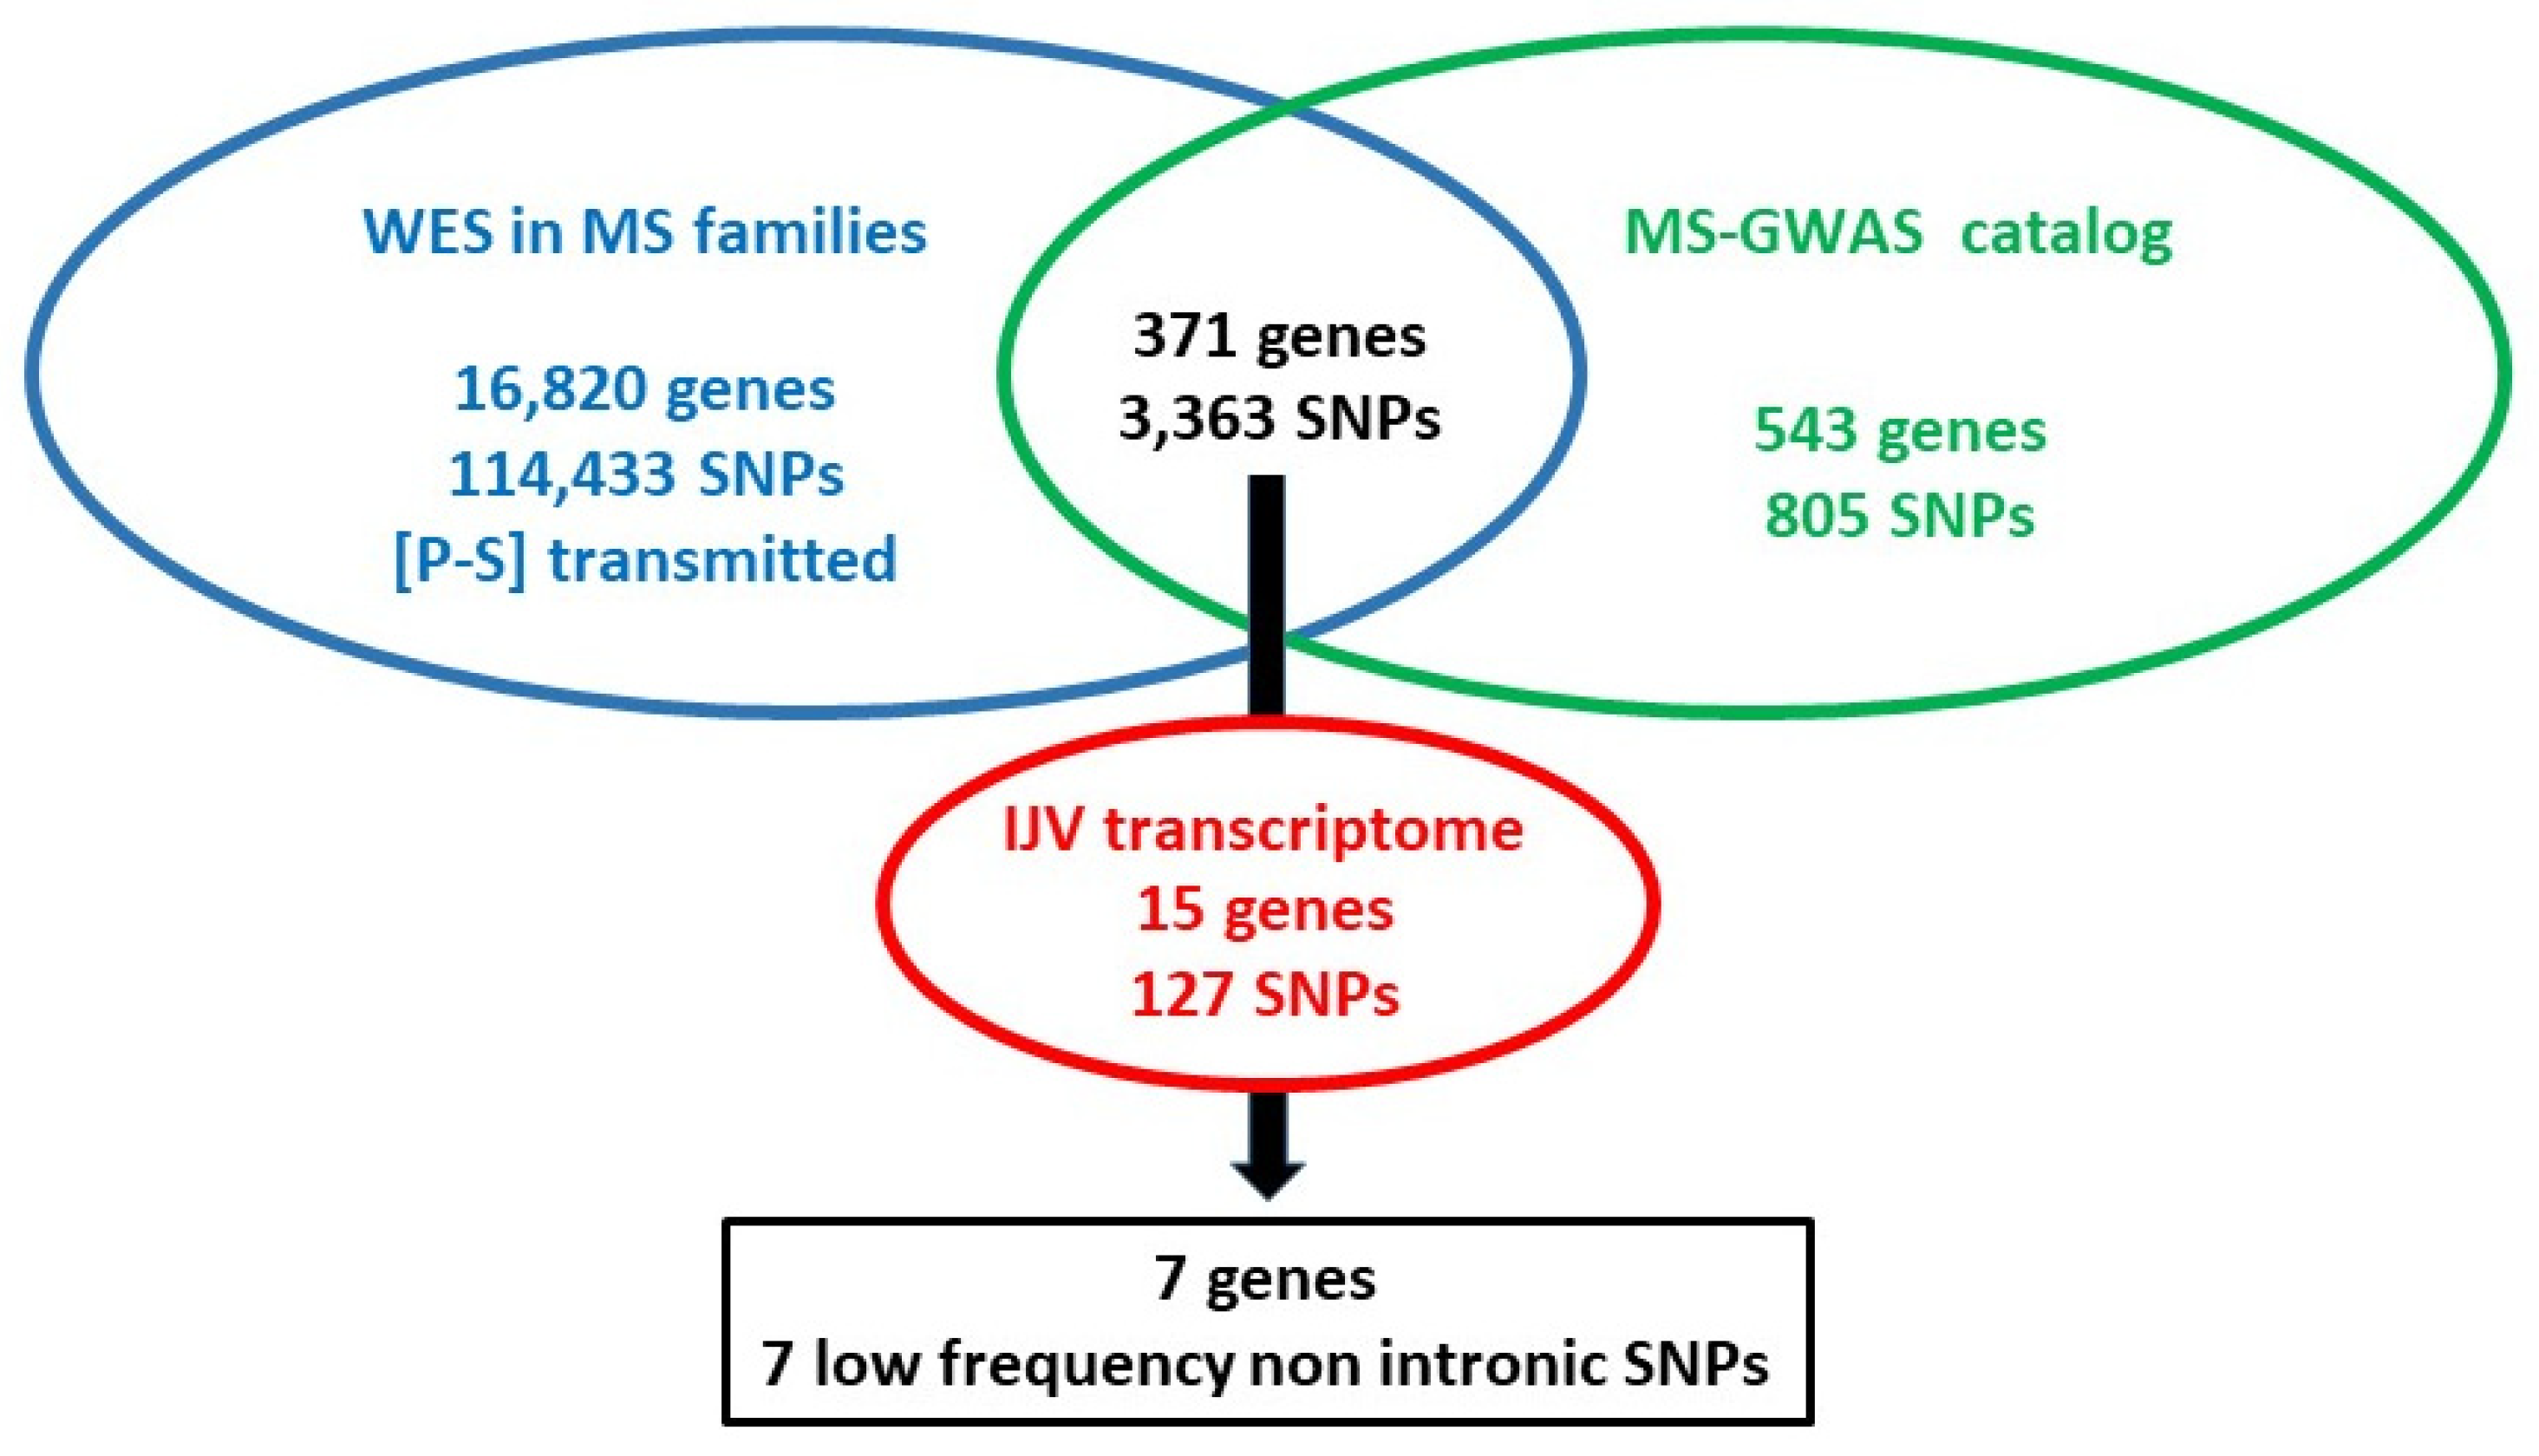
2.2. The Genomic–Transcriptomic Approach: WES in MS Families—Expression Profile of MS-GWAS Genes
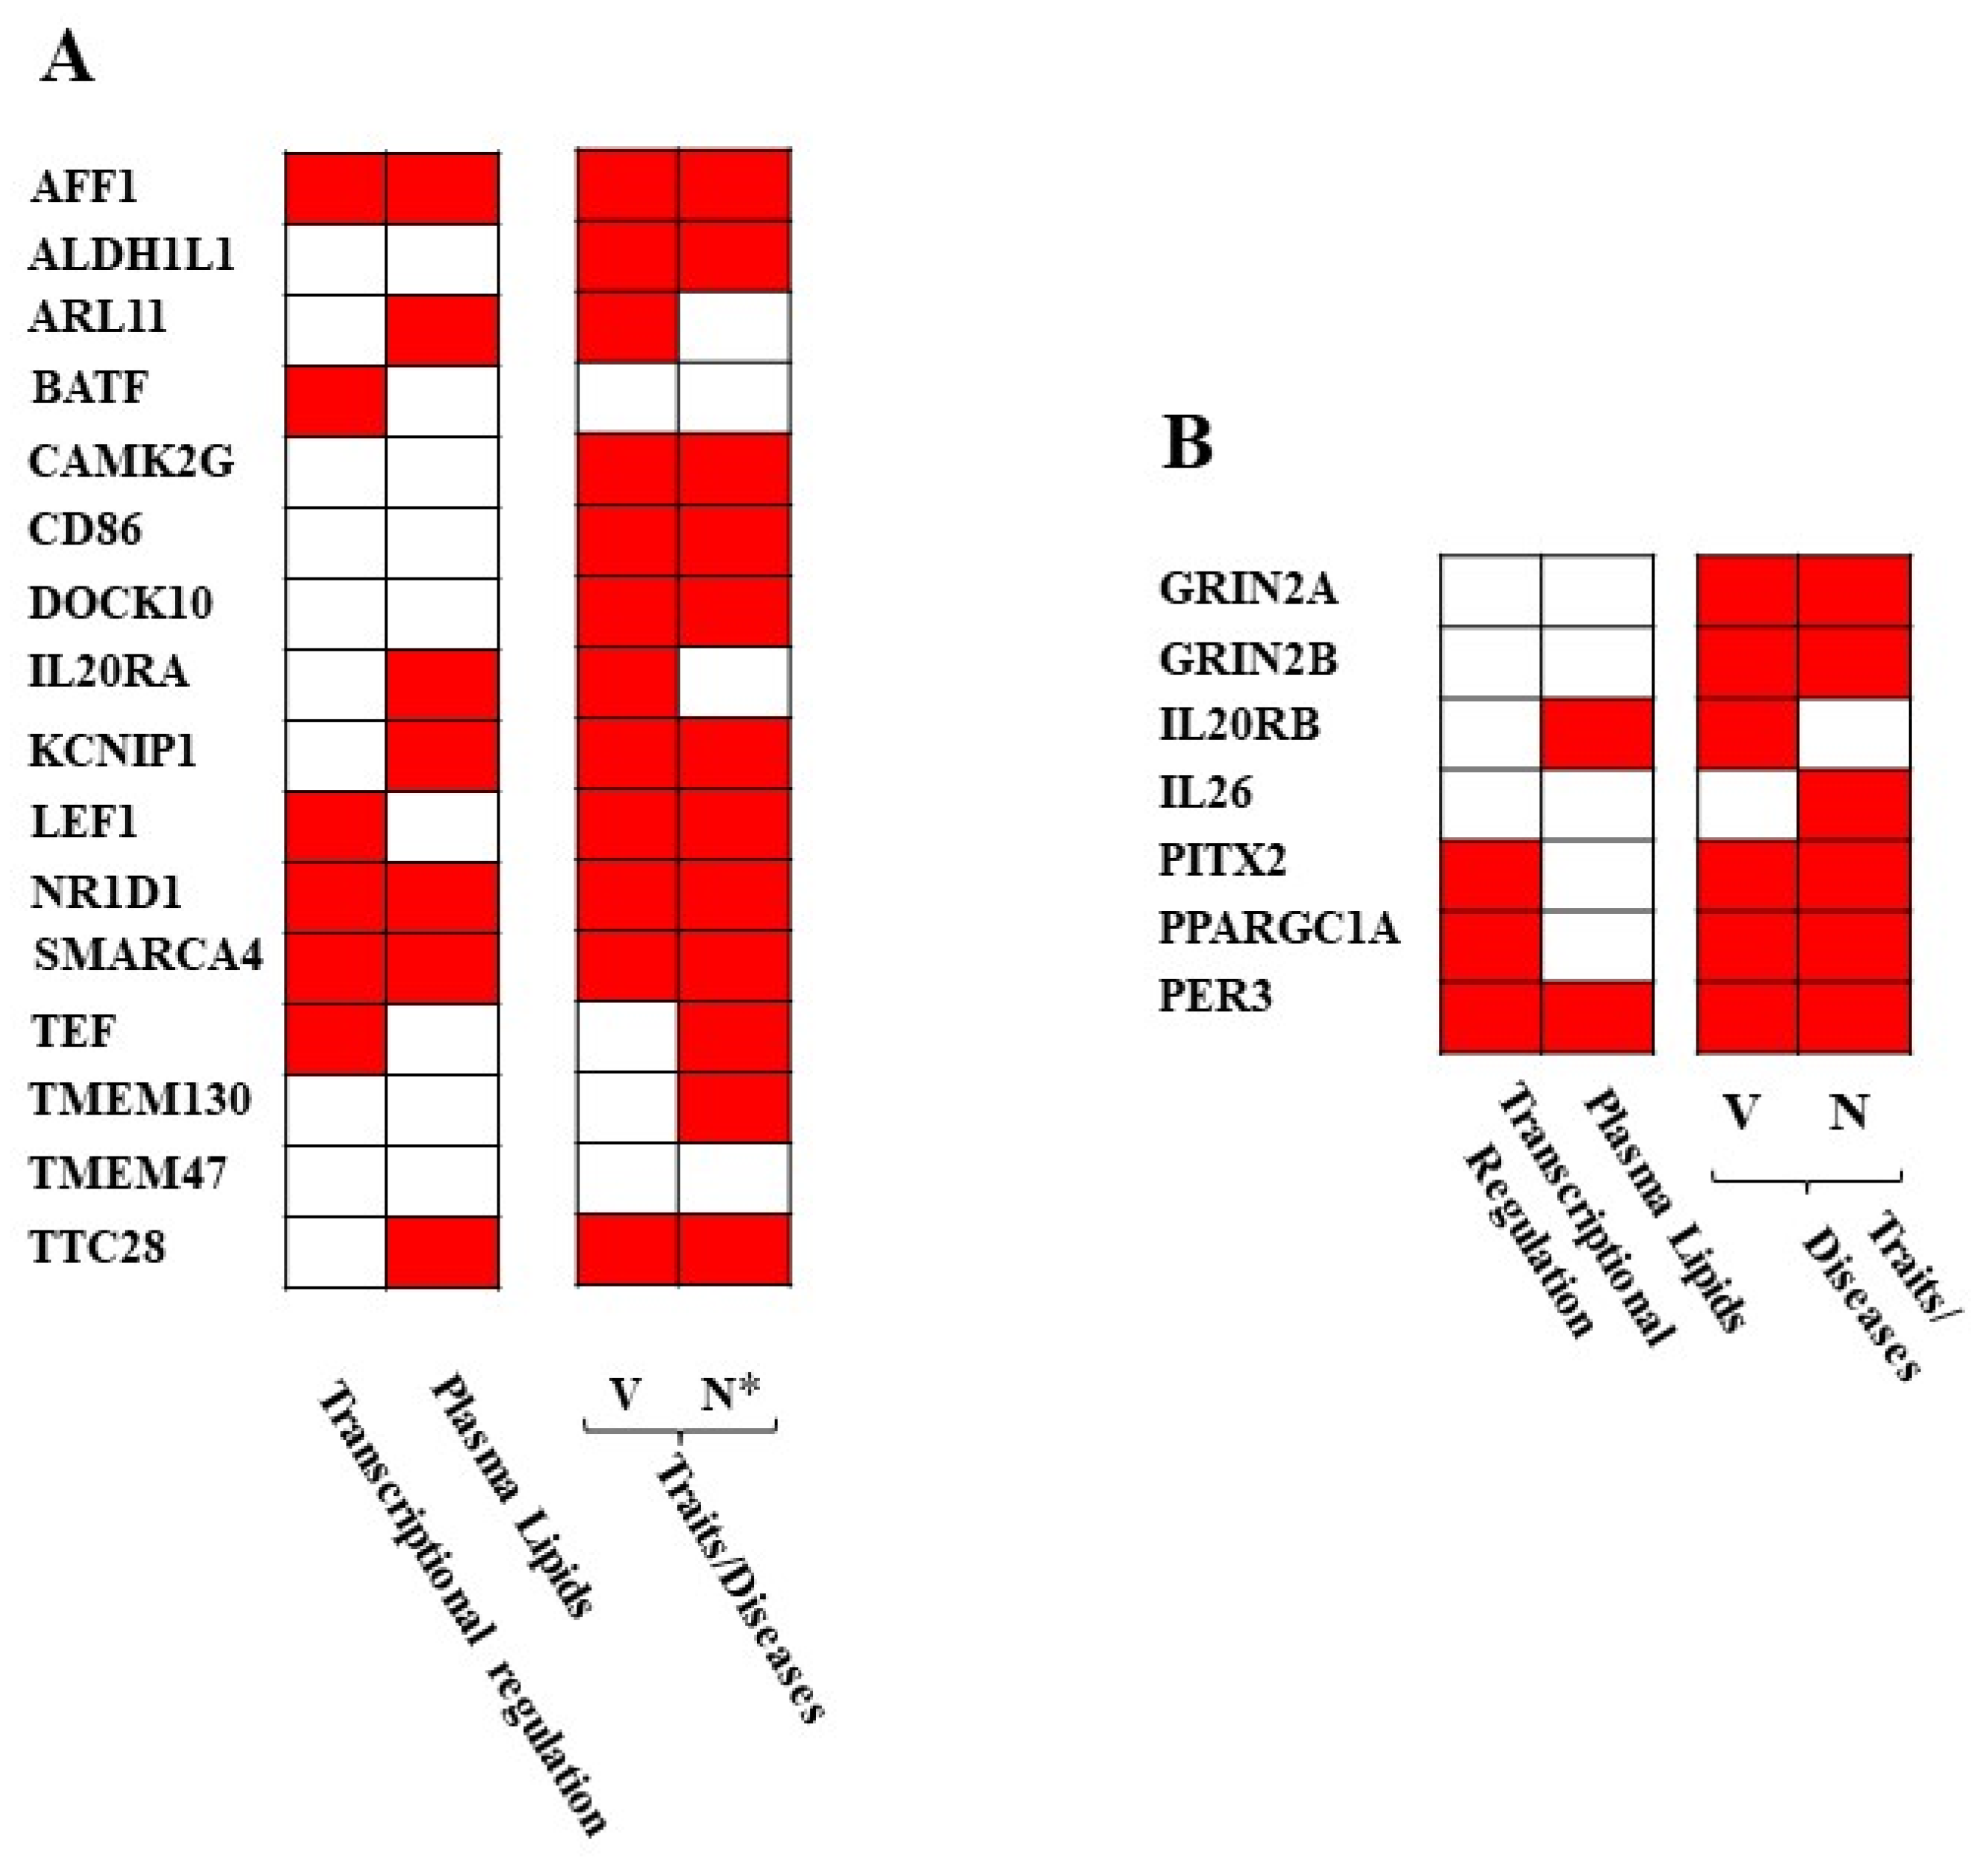
2.3. Associations with Vascular/Neuronal Traits/Diseases
3. Discussion
3.1. Transcription Factor Expression—Vascular Function Alteration in MS-Cardiovascular Risk Traits
3.2. NR1D1–PPARGC1A–PER3 Expression: Vascular and Circadian Clock Components in MS
4. Conclusions
5. Materials and Methods
Supplementary Materials
Author Contributions
Funding
Institutional Review Board Statement
Informed Consent Statement
Data Availability Statement
Acknowledgments
Conflicts of Interest
References
- D’Haeseleer, M.; Cambron, M.; Vanopdenbosch, L.; De Keyser, J. Vascular Aspects of Multiple Sclerosis. Lancet Neurol. 2011, 10, 657–666. [Google Scholar] [CrossRef]
- Spencer, J.I.; Bell, J.S.; DeLuca, G.C. Vascular Pathology in Multiple Sclerosis: Reframing Pathogenesis around the Blood-Brain Barrier. J. Neurol. Neurosurg. Psychiatry 2018, 89, 42–52. [Google Scholar] [CrossRef] [PubMed]
- Balasa, R.; Barcutean, L.; Mosora, O.; Manu, D. Reviewing the Significance of Blood-Brain Barrier Disruption in Multiple Sclerosis Pathology and Treatment. Int. J. Mol. Sci. 2021, 22, 8370. [Google Scholar] [CrossRef] [PubMed]
- Sati, P.J.; Oh, R.T.; Constable, N.; Evangelou, C.R.; Guttmann, R.G.; Henry, E.C.; Klawiter, C.; Mainero, L.; Massacesi, H.; McFarland, F.; et al. Reich, and Naims Cooperative. The Central Vein Sign and Its Clinical Evaluation for the Diagnosis of Multiple Sclerosis: A Consensus Statement from the North American Imaging in Multiple Sclerosis Cooperative. Nat. Rev. Neurol. 2016, 12, 714–722. [Google Scholar] [CrossRef] [PubMed] [Green Version]
- Suh, C.H.; Kim, S.J.; Jung, S.C.; Choi, C.G.; Kim, H.S. The “Central Vein Sign” on T2*-Weighted Images as a Diagnostic Tool in Multiple Sclerosis: A Systematic Review and Meta-Analysis Using Individual Patient Data. Sci. Rep. 2019, 9, 18188. [Google Scholar] [CrossRef] [PubMed] [Green Version]
- Zamboni, P.; Galeotti, R.; Menegatti, E.; Malagoni, A.M.; Tacconi, G.; Dall’Ara, S.; Bartolomei, I.; Salvi, F. Chronic Cerebrospinal Venous Insufficiency in Patients with Multiple Sclerosis. J. Neurol. Neurosurg. Psychiatry 2009, 80, 392–399. [Google Scholar] [CrossRef] [PubMed] [Green Version]
- Bateman, G.A.; Lechner-Scott, J.; Carey, M.F.; Bateman, A.R.; Lea, R.A. Does the Venous Pressure Theory of Multiple Sclerosis Pathophysiology Deserve a Second Chance? Mult. Scler. Relat. Disord. 2021, 56, 103262. [Google Scholar] [CrossRef]
- Sweeney, D.M.; Kisler, K.; Montagne, A.; Toga, A.W.; Zlokovic, B.V. The Role of Brain Vasculature in Neurodegenerative Disorders. Nat. Neurosci. 2018, 21, 1318–1331. [Google Scholar] [CrossRef] [PubMed]
- Presta, I.; Vismara, M.; Novellino, F.; Donato, A.; Zaffino, P.; Scali, E.; Pirrone, K.C.; Spadea, M.F.; Malara, N.; Donato, G. Innate Immunity Cells and the Neurovascular Unit. Int. J. Mol. Sci. 2018, 19, 3856. [Google Scholar] [CrossRef] [Green Version]
- Lendahl, U.; Nilsson, P.; Betsholtz, C. Emerging Links between Cerebrovascular and Neurodegenerative Diseases-a Special Role for Pericytes. EMBO Rep. 2019, 20, e48070. [Google Scholar] [CrossRef] [PubMed]
- Marrie, A.R.; Rudick, R.; Horwitz, R.; Cutter, G.; Tyry, T.; Campagnolo, D.; Vollmer, T. Vascular Comorbidity Is Associated with More Rapid Disability Progression in Multiple Sclerosis. Neurology 2010, 74, 1041–1047. [Google Scholar] [CrossRef] [PubMed] [Green Version]
- Karmon, Y.; Ramanathan, M.; Minagar, A.; Zivadinov, R.; Weinstock-Guttman, B. Arterial, Venous and Other Vascular Risk Factors in Multiple Sclerosis. Neurol. Res. 2012, 34, 754–760. [Google Scholar] [CrossRef]
- Kaplan, T.B.; Berkowitz, A.L.; Samuels, M.A. Cardiovascular Dysfunction in Multiple Sclerosis. Neurologist 2015, 20, 108–114. [Google Scholar] [CrossRef]
- Jakimovski, D.; Gandhi, S.; Paunkoski, I.; Bergsland, N.; Hagemeier, J.; Ramasamy, D.P.; Hojnacki, D.; Kolb, C.; Benedict, R.H.B.; Weinstock-Guttman, B.; et al. Hypertension and Heart Disease Are Associated with Development of Brain Atrophy in Multiple Sclerosis: A 5-Year Longitudinal Study. Eur. J. Neurol. 2019, 26, 87-e8. [Google Scholar] [CrossRef] [PubMed] [Green Version]
- Wang, Y.; Bos, S.D.; Harbo, H.F.; Thompson, W.K.; Schork, A.J.; Bettella, F.; Witoelar, A.; Lie, B.A.; Li, W.; McEvoy, L.K.; et al. Genetic Overlap between Multiple Sclerosis and Several Cardiovascular Disease Risk Factors. Mult. Scler. 2016, 22, 1783–1793. [Google Scholar] [CrossRef] [PubMed] [Green Version]
- Tseveleki, V.; Rubio, R.; Vamvakas, S.S.; White, J.; Taoufik, E.; Petit, E.; Quackenbush, J. Probert. Comparative Gene Expression Analysis in Mouse Models for Multiple Sclerosis, Alzheimer’s Disease and Stroke for Identifying Commonly Regulated and Disease-Specific Gene Changes. Genomics 2010, 96, 82–91. [Google Scholar] [CrossRef] [Green Version]
- Downton, P.; Early, J.O.; Gibbs, J.E. Circadian Rhythms in Adaptive Immunity. Immunology 2020, 161, 268–277. [Google Scholar] [CrossRef] [PubMed] [Green Version]
- Druzd, D.; Matveeva, O.; Ince, L.; Harrison, U.; He, W.; Schmal, C.; Herzel, H.; Tsang, A.H.; Kawakami, N.; Leliavski, A.O.; et al. Lymphocyte Circadian Clocks Control Lymph Node Trafficking and Adaptive Immune Responses. Immunity 2017, 46, 120–132. [Google Scholar] [CrossRef] [Green Version]
- Rijo-Ferreira, F.; Takahashi, J.S. Genomics of Circadian Rhythms in Health and Disease. Genome Med. 2019, 11, 82. [Google Scholar] [CrossRef] [Green Version]
- Leng, Y.; Musiek, E.S.; Hu, K.; Cappuccio, F.P.; Yaffe, K. Association between Circadian Rhythms and Neurodegenerative Diseases. Lancet Neurol. 2019, 18, 307–318. [Google Scholar] [CrossRef]
- Coogan, N.A.; Baird, A.L.; Popa-Wagner, A.; Thome, J. Circadian Rhythms and Attention Deficit Hyperactivity Disorder: The What, the When and the Why. Prog. Neuropsychopharmacol. Biol. Psychiatry 2016, 67, 74–81. [Google Scholar] [CrossRef] [Green Version]
- Li, D.M.; Xin, H.; Yuan, Y.; Yang, X.; Li, H.; Tian, D.; Zhang, H.; Zhang, Z.; Han, T.L.; Chen, Q.; et al. Circadian Clock-Controlled Checkpoints in the Pathogenesis of Complex Disease. Front. Genet. 2021, 12, 721231. [Google Scholar] [CrossRef] [PubMed]
- Zhang, L.S.; Lahens, N.F.; Yue, Z.; Arnold, D.M.; Pakstis, P.P.; Schwarz, J.E.; Sehgal, A. A Circadian Clock Regulates Efflux by the Blood-Brain Barrier in Mice and Human Cells. Nat. Commun. 2021, 12, 617. [Google Scholar] [CrossRef]
- Sutton, C.E.; Finlay, C.M.; Raverdeau, M.; Early, J.O.; DeCourcey, J.; Zaslona, Z.; O’Neill, L.A.J.; Mills, K.H.G.; Curtis, A.M. Loss of the Molecular Clock in Myeloid Cells Exacerbates T Cell-Mediated Cns Autoimmune Disease. Nat. Commun. 2017, 8, 1923. [Google Scholar] [CrossRef]
- Crnko, S.; Cour, M.; van Laake, L.W.; Lecour, S. Vasculature on the Clock: Circadian Rhythm and Vascular Dysfunction. Vascul. Pharmacol. 2018, 108, 1–7. [Google Scholar] [CrossRef] [PubMed]
- Wang, L.X.; Li, L. Circadian Clock Regulates Inflammation and the Development of Neurodegeneration. Front. Cell. Infect. Microbiol. 2021, 11, 696554. [Google Scholar] [CrossRef]
- Shepard, J.C.; Cline, S.G.; Hinds, D.; Jahanbakhsh, S.; Prokop, J.W. Breakdown of Multiple Sclerosis Genetics to Identify an Integrated Disease Network and Potential Variant Mechanisms. Physiol. Genom. 2019, 51, 562–577. [Google Scholar] [CrossRef] [PubMed]
- Marchetti, G.; Ziliotto, N.; Meneghetti, S.; Baroni, M.; Lunghi, B.; Menegatti, E.; Pedriali, M.; Salvi, F.; Bartolomei, I.; Straudi, S.; et al. Changes in Expression Profiles of Internal Jugular Vein Wall and Plasma Protein Levels in Multiple Sclerosis. Mol. Med. 2018, 24, 42. [Google Scholar] [CrossRef] [PubMed]
- Ziliotto, N.; Marchetti, G.; Scapoli, C.; Bovolenta, M.; Meneghetti, S.; Benazzo, A.; Lunghi, B.; Balestra, D.; Laino, L.A.; Bozzini, N.; et al. C6orf10 Low-Frequency and Rare Variants in Italian Multiple Sclerosis Patients. Front. Genet. 2019, 10, 573. [Google Scholar] [CrossRef] [Green Version]
- Ziliotto, N.; Meneghetti, S.; Menegatti, E.; Baroni, M.; Lunghi, B.; Salvi, F.; Ferracin, M.; Branchini, A.; Gemmati, D.; Mascoli, F.; et al. Expression Profiles of the Internal Jugular and Saphenous Veins: Focus on Hemostasis Genes. Thromb. Res. 2020, 191, 113–124. [Google Scholar] [CrossRef]
- Richardson, G.T.; Sanderson, E.; Palmer, T.M.; Ala-Korpela, M.; Ference, B.A.; Smith, G.D.; Holmes, M.V. Evaluating the Relationship between Circulating Lipoprotein Lipids and Apolipoproteins with Risk of Coronary Heart Disease: A Multivariable Mendelian Randomisation Analysis. PLoS Med. 2020, 17, e1003062. [Google Scholar] [CrossRef] [Green Version]
- Iourov, Y.I.; Zelenova, M.A.; Vorsanova, S.G.; Voinova, V.V.; Yurov, Y.B. 4q21.2q21.3 Duplication: Molecular and Neuropsychological Aspects. Curr. Genom. 2018, 19, 173–178. [Google Scholar] [CrossRef] [PubMed]
- Williams, R.S.; Yang, Q.; Chen, F.; Liu, X.; Keene, K.L.; Jacques, P.; Chen, W.M.; Weinstein, G.; Hsu, F.C.; Beiser, A.; et al. Genome-Wide Meta-Analysis of Homocysteine and Methionine Metabolism Identifies Five One Carbon Metabolism Loci and a Novel Association of Aldh1l1 with Ischemic Stroke. PLoS Genet. 2014, 10, e1004214. [Google Scholar] [CrossRef] [PubMed]
- Au, S.K.; Findley, T.O.; Northrup, H. Finding the Genetic Mechanisms of Folate Deficiency and Neural Tube Defects-Leaving No Stone Unturned. Am. J. Med. Genet. A 2017, 173, 3042–3057. [Google Scholar] [CrossRef] [PubMed]
- Klarin, D.; Damrauer, S.M.; Cho, K.; Sun, Y.V.; Teslovich, T.M.; Honerlaw, J.; Gagnon, D.R.; DuVall, S.L.; Li, J.; Peloso, G.M.; et al. Genetics of Blood Lipids among ~300,000 Multi-Ethnic Participants of the Million Veteran Program. Nat. Genet. 2018, 50, 1514–1523. [Google Scholar] [CrossRef] [PubMed]
- Akkad, A.D.; Bellenberg, B.; Esser, S.; Weiler, F.; Epplen, J.T.; Gold, R.; Lukas, C.; Haghikia, A. Multiple Sclerosis Risk Loci Correlate with Cervical Cord Atrophy and May Explain the Course of Disability. Neurogenetics 2015, 16, 161–168. [Google Scholar] [CrossRef]
- Saddouk, Z.F.; Sun, L.Y.; Liu, Y.F.; Jiang, M.; Singer, D.V.; Backs, J.; van Riper, D.; Ginnan, R.; Schwarz, J.J.; Singer, H.A. Ca2+/Calmodulin-Dependent Protein Kinase Ii-Gamma (Camkiigamma) Negatively Regulates Vascular Smooth Muscle Cell Proliferation and Vascular Remodeling. FASEB J. 2016, 30, 1051–1064. [Google Scholar] [CrossRef] [PubMed] [Green Version]
- Proietti Onori, M.; Koopal, B.; Everman, D.B.; Worthington, J.D.; Jones, J.R.; Ploeg, M.A.; Mientjes, E.; van Bon, B.W.; Kleefstra, T.; Schulman, H.; et al. The Intellectual Disability-Associated Camk2g P.Arg292pro Mutation Acts as a Pathogenic Gain-of-Function. Hum. Mutat. 2018, 39, 2008–2024. [Google Scholar] [CrossRef]
- Hosiawa, A.K.; Wang, H.; DeVries, M.E.; Garcia, B.; Liu, W.; Zhou, D.; Akram, A.; Jiang, J.; Sun, H.; Cameron, M.J.; et al. Cd80/Cd86 Costimulation Regulates Acute Vascular Rejection. J. Immunol. 2005, 175, 6197–6204. [Google Scholar] [CrossRef] [Green Version]
- Li, Z.; Liu, Y.; Jia, A.; Cui, Y.; Feng, J. Cerebrospinal Fluid Cells Immune Landscape in Multiple Sclerosis. J. Transl. Med. 2021, 19, 125. [Google Scholar] [CrossRef]
- Brynedal, B.; Khademi, M.; Wallstrom, E.; Hillert, J.; Olsson, T.; Duvefelt, K. Gene Expression Profiling in Multiple Sclerosis: A Disease of the Central Nervous System, but with Relapses Triggered in the Periphery? Neurobiol. Dis. 2010, 37, 613–621. [Google Scholar] [CrossRef]
- Yang, M.; Shi, X.Q.; Peyret, C.; Oladiran, O.; Wu, S.; Chambon, J.; Fournier, S.; Zhang, J. Effector/Memory Cd8(+) T Cells Synergize with Co-Stimulation Competent Macrophages to Trigger Autoimmune Peripheral Neuropathy. Brain Behav. Immun. 2018, 71, 142–157. [Google Scholar] [CrossRef] [PubMed]
- Stanne, M.T.; Olsson, M.; Lorentzen, E.; Pedersen, A.; Gummesson, A.; Gils, A.; Jood, K.; Engstrom, G.; Melander, O.; Declerck, P.J.; et al. A Genome-Wide Study of Common and Rare Genetic Variants Associated with Circulating Thrombin Activatable Fibrinolysis Inhibitor. Thromb. Haemost. 2018, 118, 298–308. [Google Scholar] [CrossRef] [Green Version]
- Jaudon, F.; Raynaud, F.; Wehrle, R.; Bellanger, J.M.; Doulazmi, M.; Vodjdani, G.; Gasman, S.; Fagni, L.; Dusart, I.; Debant, A.; et al. The Rhogef Dock10 Is Essential for Dendritic Spine Morphogenesis. Mol. Biol. Cell. 2015, 26, 2112–2127. [Google Scholar] [CrossRef] [PubMed]
- Namekata, K.; Guo, X.; Kimura, A.; Azuchi, Y.; Kitamura, Y.; Harada, C.; Harada, T. Roles of the Dock-D Family Proteins in a Mouse Model of Neuroinflammation. J. Biol. Chem. 2020, 295, 6710–6720. [Google Scholar] [CrossRef] [PubMed] [Green Version]
- Kathiresan, S.A.K.; Manning, S.; Demissie, R.B.; D’Agostino, A.; Surti, C.; Guiducci, L.; Gianniny, N.P.; Burtt, O.; Melander, M.; Orho-Melander, D.K.; et al. A Genome-Wide Association Study for Blood Lipid Phenotypes in the Framingham Heart Study. BMC Med. Genet. 2007, 8, S17. [Google Scholar] [CrossRef] [PubMed] [Green Version]
- Li, S.X.; Wang, Z.; Cajka, T.; Buffa, J.A.; Nemet, I.; Hurd, A.G.; Gu, X.; Skye, S.M.; Roberts, A.B.; Wu, Y.; et al. Untargeted Metabolomics Identifies Trimethyllysine, a Tmao-Producing Nutrient Precursor, as a Predictor of Incident Cardiovascular Disease Risk. JCI Insight 2018, 3, e99096. [Google Scholar] [CrossRef] [Green Version]
- Martin, P.; McGovern, A.; Massey, J.; Schoenfelder, S.; Duffus, K.; Yarwood, A.; Barton, A.; Worthington, J.; Fraser, P.; Eyre, S.; et al. Identifying Causal Genes at the Multiple Sclerosis Associated Region 6q23 Using Capture Hi-C. PLoS ONE 2016, 11, e0166923. [Google Scholar]
- Dayton, J.R.; Yuan, Y.; Pacumio, L.P.; Dorflinger, B.G.; Yoo, S.C.; Olson, M.J.; Hernandez-Suarez, S.I.; McMahon, M.M.; Cruz-Orengo, L. Expression of Il-20 Receptor Subunit Beta Is Linked to Eae Neuropathology and Cns Neuroinflammation. Front. Cell. Neurosci. 2021, 15, 683687. [Google Scholar] [CrossRef]
- Varga, T.V.; Kurbasic, A.; Aine, M.; Eriksson, P.; Ali, A.; Hindy, G.; Gustafsson, S.; Luan, J.; Shungin, D.; Chen, Y.; et al. Novel Genetic Loci Associated with Long-Term Deterioration in Blood Lipid Concentrations and Coronary Artery Disease in European Adults. Int. J. Epidemiol. 2017, 46, 1211–1222. [Google Scholar] [CrossRef] [PubMed]
- Tsai, T.C.; Hsieh, C.S.; Chang, S.N.; Chuang, E.Y.; Ueng, K.C.; Tsai, C.F.; Lin, T.H.; Wu, C.K.; Lee, J.K.; Lin, L.Y.; et al. Genome-Wide Screening Identifies a Kcnip1 Copy Number Variant as a Genetic Predictor for Atrial Fibrillation. Nat. Commun. 2016, 7, 10190. [Google Scholar] [CrossRef] [PubMed] [Green Version]
- Fransen, L.N.; Crusius, J.B.A.; Smolders, J.; Mizee, M.R.; van Eden, C.G.; Luchetti, S.; Remmerswaal, E.B.M.; Hamann, J.; Mason, M.R.J.; Huitinga, I. Post-Mortem Multiple Sclerosis Lesion Pathology Is Influenced by Single Nucleotide Polymorphisms. Brain Pathol. 2020, 30, 106–119. [Google Scholar] [CrossRef] [Green Version]
- Chattopadhyay, D.; Sengupta, S. First Evidence of Pathogenicity of V234i Mutation of Hvapb Found in Amyotrophic Lateral Sclerosis. Biochem. Biophys. Res. Commun. 2014, 448, 108–113. [Google Scholar] [CrossRef] [PubMed]
- Hupe, M.; Li, M.X.; Kneitz, S.; Davydova, D.; Yokota, C.; Kele, J.; Hot, B.; Stenman, J.M.; Gessler, M. Gene Expression Profiles of Brain Endothelial Cells During Embryonic Development at Bulk and Single-Cell Levels. Sci. Signal 2017, 10, 487. [Google Scholar] [CrossRef] [PubMed]
- Buga, M.A.; Margaritescu, C.; Scholz, C.J.; Radu, E.; Zelenak, C.; Popa-Wagner, A. Transcriptomics of Post-Stroke Angiogenesis in the Aged Brain. Front. Aging Neurosci. 2014, 6, 44. [Google Scholar] [CrossRef] [PubMed]
- Sferruzza, G.; Clarelli, F.; Mascia, E.; Ferre, L.; Ottoboni, L.; Sorosina, M.; Santoro, S.; Moiola, L.; Martinelli, V.; Comi, G.; et al. Transcriptomic Analysis of Peripheral Monocytes Upon Fingolimod Treatment in Relapsing Remitting Multiple Sclerosis Patients. Mol. Neurobiol. 2021, 58, 4816–4827. [Google Scholar] [CrossRef] [PubMed]
- Wisniewska, M.B. Physiological Role of Beta-Catenin/Tcf Signaling in Neurons of the Adult Brain. Neurochem. Res. 2013, 38, 1144–1155. [Google Scholar] [CrossRef] [PubMed] [Green Version]
- Coste, H.; Rodriguez, J.C. Orphan Nuclear Hormone Receptor Rev-Erbalpha Regulates the Human Apolipoprotein Ciii Promoter. J. Biol. Chem. 2002, 277, 27120–27129. [Google Scholar] [CrossRef] [PubMed] [Green Version]
- Wang, J.; Yin, L.; Lazar, M.A. The Orphan Nuclear Receptor Rev-Erb Alpha Regulates Circadian Expression of Plasminogen Activator Inhibitor Type 1. J. Biol. Chem. 2006, 281, 33842–33848. [Google Scholar] [CrossRef] [PubMed] [Green Version]
- Goto, M.; Mizuno, M.; Matsumoto, A.; Yang, Z.; Jimbo, E.F.; Tabata, H.; Yamagata, T.; Nagata, K.I. Role of a Circadian-Relevant Gene Nr1d1 in Brain Development: Possible Involvement in the Pathophysiology of Autism Spectrum Disorders. Sci. Rep. 2017, 7, 43945. [Google Scholar] [CrossRef] [Green Version]
- Myocardial Infarction Genetics, Consortium; Kathiresan, S.; Voight, B.F.; Purcell, S.; Musunuru, K.; Ardissino, D.; Mannucci, P.M.; Anand, S.; Engert, J.C.; Samani, N.J.; et al. Genome-Wide Association of Early-Onset Myocardial Infarction with Single Nucleotide Polymorphisms and Copy Number Variants. Nat. Genet. 2009, 41, 334–341. [Google Scholar]
- Deng, L.; Li, G.; Rao, B.; Li, H. Central Nervous System-Specific Knockout of Brg1 Causes Growth Retardation and Neuronal Degeneration. Brain Res. 2015, 1622, 186–195. [Google Scholar] [CrossRef] [PubMed]
- Tibshirani, M.; Zhao, B.; Gentil, B.J.; Minotti, S.; Marques, C.; Keith, J.; Rogaeva, E.; Zinman, L.; Rouaux, C.; Robertson, J.; et al. Dysregulation of Chromatin Remodelling Complexes in Amyotrophic Lateral Sclerosis. Hum. Mol. Genet. 2017, 26, 4142–4152. [Google Scholar] [CrossRef] [PubMed] [Green Version]
- Rao, S.; Leung, C.S.; Lam, M.H.; Wing, Y.K.; Waye, M.M.; Tsui, S.K. Resequencing Three Candidate Genes Discovers Seven Potentially Deleterious Variants Susceptibility to Major Depressive Disorder and Suicide Attempts in Chinese. Gene 2017, 603, 34–41. [Google Scholar] [CrossRef]
- Vincent, B.J.; Choufani, S.; Horike, S.; Stachowiak, B.; Li, M.; Dill, F.J.; Marshall, C.; Hrynchak, M.; Pewsey, E.; Ukadike, K.C.; et al. A Translocation T(6;7)(P11-P12;Q22) Associated with Autism and Mental Retardation: Localization and Identification of Candidate Genes at the Breakpoints. Psychiatr. Genet. 2008, 18, 101–109. [Google Scholar] [CrossRef]
- Li, S.Q.; Parrado, A.R.; Samtani, M.N.; Narayan, V.A.; Alzheimer’s Disease Neuroimaging Initiative. Variations in the Fra10ac1 Fragile Site and 15q21 Are Associated with Cerebrospinal Fluid Abeta1-42 Level. PLoS ONE 2015, 10, e0134000. [Google Scholar]
- Zivadinov, R.; Chung, C.P. Potential Involvement of the Extracranial Venous System in Central Nervous System Disorders and Aging. BMC Med. 2013, 11, 260. [Google Scholar] [CrossRef] [Green Version]
- Ramagopalan, S.V.; Dyment, D.A.; Cader, M.Z.; Morrison, K.M.; Disanto, G.; Morahan, J.M.; Berlanga-Taylor, A.J.; Handel, A.; De Luca, G.C.; Sadovnick, A.D.; et al. Rare Variants in the Cyp27b1 Gene Are Associated with Multiple Sclerosis. Ann. Neurol. 2011, 70, 881–886. [Google Scholar] [CrossRef] [PubMed]
- Vallee, A.; Vallee, J.N.; Guillevin, R.; Lecarpentier, Y. Interactions between the Canonical Wnt/Beta-Catenin Pathway and Ppar Gamma on Neuroinflammation, Demyelination, and Remyelination in Multiple Sclerosis. Cell. Mol. Neurobiol. 2018, 38, 783–795. [Google Scholar] [CrossRef]
- Griffin, C.T.; Curtis, C.D.; Davis, R.B.; Muthukumar, V.; Magnuson, T. The Chromatin-Remodeling Enzyme Brg1 Modulates Vascular Wnt Signaling at Two Levels. Proc. Natl. Acad. Sci. USA 2011, 108, 2282–2287. [Google Scholar] [CrossRef] [PubMed] [Green Version]
- Waterworth, M.D.; Ricketts, S.L.; Song, K.; Chen, L.; Zhao, J.H.; Ripatti, S.; Aulchenko, Y.S.; Zhang, W.; Yuan, X.; Lim, N.; et al. Genetic Variants Influencing Circulating Lipid Levels and Risk of Coronary Artery Disease. Arterioscler. Thromb. Vasc. Biol. 2010, 30, 2264–2276. [Google Scholar] [CrossRef]
- Andreassen, A.O.; Desikan, R.S.; Wang, Y.; Thompson, W.K.; Schork, A.J.; Zuber, V.; Doncheva, N.T.; Ellinghaus, E.; Albrecht, M.; Mattingsdal, M.; et al. Abundant Genetic Overlap between Blood Lipids and Immune-Mediated Diseases Indicates Shared Molecular Genetic Mechanisms. PLoS ONE 2015, 10, e0123057. [Google Scholar]
- Tian, Z.; Song, Y.; Yao, Y.; Guo, J.; Gong, Z.; Wang, Z. Genetic Etiology Shared by Multiple Sclerosis and Ischemic Stroke. Front. Genet. 2020, 11, 646. [Google Scholar] [CrossRef]
- Gerdes, N.; Zirlik, A. Co-Stimulatory Molecules in and Beyond Co-Stimulation—Tipping the Balance in Atherosclerosis? Thromb. Haemost. 2011, 106, 804–813. [Google Scholar] [CrossRef] [PubMed]
- Otto, A.E.; Loeys, B.; Khanna, H.; Hellemans, J.; Sudbrak, R.; Fan, S.; Muerb, U.; O’Toole, J.F.; Helou, J.; Attanasio, M.; et al. Nephrocystin-5, a Ciliary Iq Domain Protein, Is Mutated in Senior-Loken Syndrome and Interacts with Rpgr and Calmodulin. Nat. Genet. 2005, 37, 282–288. [Google Scholar] [CrossRef]
- Choi, S.; Guo, L.; Cordeiro, M.F. Retinal and Brain Microglia in Multiple Sclerosis and Neurodegeneration. Cells 2021, 10, 1507. [Google Scholar] [CrossRef] [PubMed]
- Gnanakkumaar, P.; Murugesan, R.; Ahmed, S. Gene Regulatory Networks in Peripheral Mononuclear Cells Reveals Critical Regulatory Modules and Regulators of Multiple Sclerosis. Sci. Rep. 2019, 9, 12732. [Google Scholar] [CrossRef] [Green Version]
- Liu, C.; Li, S.; Liu, T.; Borjigin, J.; Lin, J.D. Transcriptional Coactivator Pgc-1alpha Integrates the Mammalian Clock and Energy Metabolism. Nature 2007, 447, 477–481. [Google Scholar] [CrossRef]
- Kolic, I.; Stojkovic, L.; Stankovic, A.; Stefanovic, M.; Dincic, E.; Zivkovic, M. Association Study of Rs7799039, Rs1137101 and Rs8192678 Gene Variants with Disease Susceptibility/Severity and Corresponding Lep, Lepr and Pgc1a Gene Expression in Multiple Sclerosis. Gene 2021, 774, 145422. [Google Scholar] [CrossRef]
- Kolic, I.; Stojkovic, L.; Dincic, E.; Jovanovic, I.; Stankovic, A.; Zivkovic, M. Expression of Lep, Lepr and Pgc1a Genes Is Altered in Peripheral Blood Mononuclear Cells of Patients with Relapsing-Remitting Multiple Sclerosis. J. Neuroimmunol. 2020, 338, 577090. [Google Scholar] [CrossRef] [Green Version]
- Witte, E.M.; Nijland, P.G.; Drexhage, J.A.; Gerritsen, W.; Geerts, D.; Hof, B.v.; Reijerkerk, A.; de Vries, H.E.; van der Valk, P.; van Horssen, J. Reduced Expression of Pgc-1alpha Partly Underlies Mitochondrial Changes and Correlates with Neuronal Loss in Multiple Sclerosis Cortex. Acta Neuropathol. 2013, 125, 231–243. [Google Scholar] [CrossRef]
- Dijk, D.J.; Archer, S.N. Period3, Circadian Phenotypes, and Sleep Homeostasis. Sleep Med. Rev. 2010, 14, 151–160. [Google Scholar] [CrossRef] [PubMed]
- Mazzoccoli, G.; Palmieri, O.; Corritore, G.; Latiano, T.; Bossa, F.; Scimeca, D.; Biscaglia, G.; Valvano, M.R.; D’Inca, R.; Cucchiara, S.; et al. Association Study of a Polymorphism in Clock Gene Period3 and Risk of Inflammatory Bowel Disease. Chronobiol. Int. 2012, 29, 994–1003. [Google Scholar] [CrossRef]
- Zhu, J.J.; Jiang, Z.T.; Liu, C.; Xi, Y.F.; Wang, J.; Yang, F.F.; Yao, W.J.; Pang, W.; Han, L.L.; Zhang, Y.H.; et al. Vamp3 and Snap23 as Potential Targets for Preventing the Disturbed Flow-Accelerated Thrombus Formation. Front. Cell. Dev. Biol. 2020, 8, 576826. [Google Scholar] [CrossRef] [PubMed]
- Golalipour, M.; Maleki, Z.; Farazmandfar, T.; Shahbazi, M. Per3 Vntr Polymorphism in Multiple Sclerosis: A New Insight to Impact of Sleep Disturbances in Ms. Mult. Scler. Relat. Disord. 2017, 17, 84–86. [Google Scholar] [CrossRef] [PubMed]
- Ziliotto, N.; Lamberti, N.; Manfredini, F.; Straudi, S.; Tisato, V.; Carantoni, M.; Melloni, E.; Secchiero, P.; Basaglia, N.; Bernardi, F.; et al. Baseline and Overtime Variations of Soluble Adhesion Molecule Plasma Concentrations Are Associated with Mobility Recovery after Rehabilitation in Multiple Sclerosis Patients. J. Neuroimmunol. 2021, 352, 577473. [Google Scholar] [CrossRef] [PubMed]
- Ziliotto, N.; Lamberti, N.; Manfredini, F.; Straudi, S.; Baroni, M.; Tisato, V.; Carantoni, M.; Secchiero, P.; Basaglia, N.; Marchetti, G.; et al. Functional Recovery in Multiple Sclerosis Patients Undergoing Rehabilitation Programs Is Associated with Plasma Levels of Hemostasis Inhibitors. Mult. Scler. Relat. Disord. 2020, 44, 102319. [Google Scholar] [CrossRef] [PubMed]
- Buniello, A.; MacArthur, J.A.L.; Cerezo, M.; Harris, L.W.; Hayhurst, J.; Malangone, C.; McMahon, A.; Morales, J.; Mountjoy, E.; Sollis, E.; et al. The Nhgri-Ebi Gwas Catalog of Published Genome-Wide Association Studies, Targeted Arrays and Summary Statistics 2019. Nucleic Acids Res. 2019, 47, D1005–D1012. [Google Scholar] [CrossRef] [PubMed] [Green Version]
- Battle, A.; Brown, C.D.; Engelhardt, B.E.; Montgomery, S.B. Genetic Effects on Gene Expression across Human Tissues. Nature 2017, 550, 204–213. [Google Scholar] [PubMed]
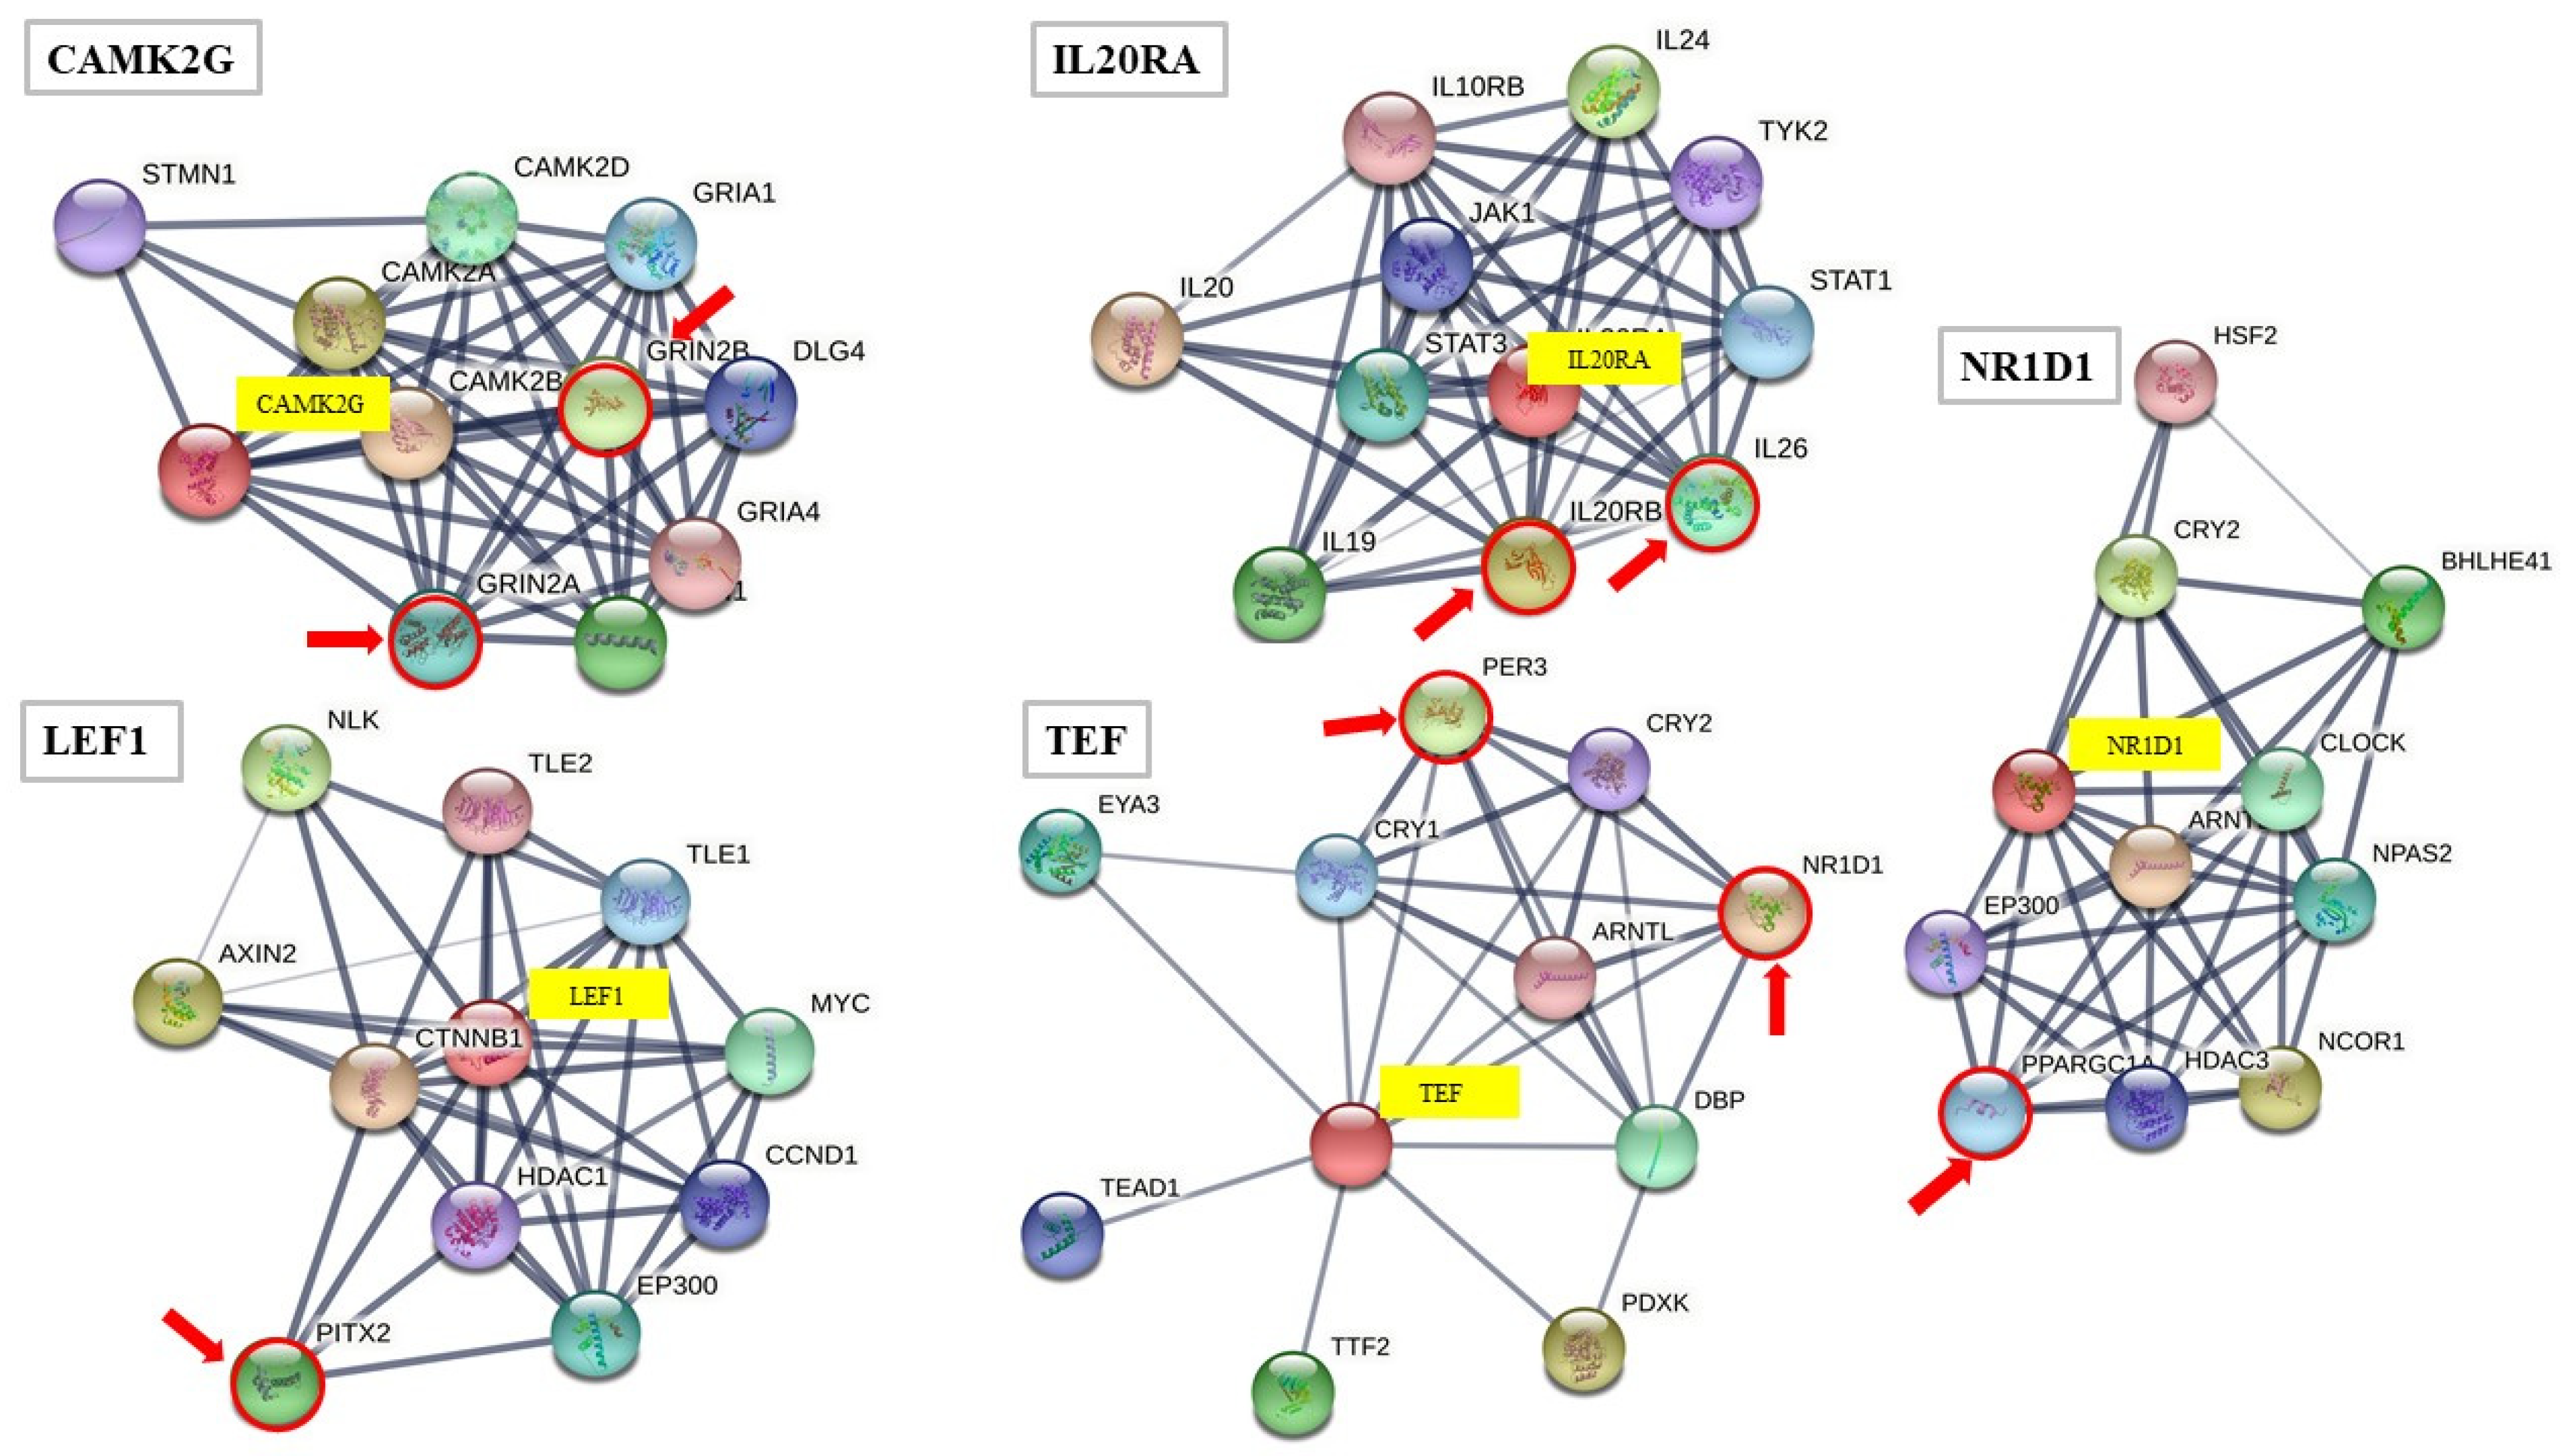
- Szklarczyk, D.; Gable, A.L.; Lyon, D.; Junge, A.; Wyder, S.; Huerta-Cepas, J.; Simonovic, M.; Doncheva, N.T.; Morris, J.H.; Bork, P. String V11: Protein-Protein Association Networks with Increased Coverage, Supporting Functional Discovery in Genome-Wide Experimental Datasets. Nucleic Acids Res. 2019, 47, D607–D613. [Google Scholar] [CrossRef] [Green Version]
- Huang, D.W.; Sherman, B.T.; Lempicki, R.A. Systematic and Integrative Analysis of Large Gene Lists Using David Bioinformatics Resources. Nat. Protoc. 2009, 4, 44–57. [Google Scholar] [CrossRef] [PubMed]
- Kanehisa, M.; Sato, Y.; Kawashima, M. Kegg Mapping Tools for Uncovering Hidden Features in Biological Data. Protein Sci. 2021. [Google Scholar] [CrossRef] [PubMed]
- Genomes Project Consortium; Auton, A.; Brooks, L.D.; Durbin, R.M.; Garrison, E.P.; Kang, H.M.; Korbel, J.O.; Marchini, J.L.; McCarthy, S.; McVean, G.A.; et al. A Global Reference for Human Genetic Variation. Nature 2015, 526, 68–74. [Google Scholar] [PubMed] [Green Version]
- Karczewski, K.J.; Francioli, L.C.; Tiao, G.; Cummings, B.B.; Alfoldi, J.; Wang, Q.; Collins, R.L.; Laricchia, K.M.; Ganna, A.; Birnbaum, D.P. The Mutational Constraint Spectrum Quantified from Variation in 141,456 Humans. Nature 2020, 581, 434–443. [Google Scholar] [CrossRef] [PubMed]
- Fiorito, G.; di Gaetano, C.; Guarrera, S.; Rosa, F.; Feldman, M.W.; Piazza, A.; Matullo, G. The Italian Genome Reflects the History of Europe and the Mediterranean Basin. Eur. J. Hum. Genet. 2016, 24, 1056–1062. [Google Scholar] [CrossRef] [PubMed] [Green Version]
- Raveane, A.; Aneli, S.; Montinaro, F.; Athanasiadis, G.; Barlera, S.; Birolo, G.; Boncoraglio, G.; di Blasio, A.M.; di Gaetano, C.; Pagani, L.S.; et al. Population Structure of Modern-Day Italians Reveals Patterns of Ancient and Archaic Ancestries in Southern Europe. Sci. Adv. 2019, 5, eaaw3492. [Google Scholar] [CrossRef] [Green Version]
- Birolo, G.; Aneli, S.; di Gaetano, C.; Cugliari, G.; Russo, A.; Allione, A.; Casalone, E.; Giorgio, E.; Paraboschi, E.M.; Ardissino, D.S. Functional and Clinical Implications of Genetic Structure in 1686 Italian Exomes. Hum. Mutat. 2021, 42, 272–289. [Google Scholar] [CrossRef] [PubMed]
- Bezzini, D.; Policardo, L.; Meucci, G.; Ulivelli, M.; Bartalini, S.; Profili, F.; Battaglia, M.A.; Francesconi, P. Prevalence of Multiple Sclerosis in Tuscany (Central Italy): A Study Based on Validated Administrative Data. Neuroepidemiology 2016, 46, 37–42. [Google Scholar] [CrossRef]


| Gene Symbol | Gene Name | Regulation | MS-IJV | C-IJV | FC | p * |
|---|---|---|---|---|---|---|
| AFF1 | AF4/FMR2 family member 1 | up | 9.95 ± 0.30 | 8.84 ± 0.29 | 2.17 | 0.005 |
| ALDH1L1 | Aldehyde dehydrogenase 1 family member L1 | down | 6.03 ± 0.22 | 7.23 ± 0.36 | 2.29 | 0.004 |
| ARL11 | ADP ribosylation factor-like GTPase 11 | up | 3.11 ± 0.42 | 2.07 ± 0.32 | 2.06 | 0.010 |
| BATF | Basic leucine zipper ATF-like transcription factor | up | 10.52 ± 1.39 | 8.94 ± 0.46 | 2.99 | 0.049 |
| CAMK2G | Calcium/calmodulin dependent protein kinase II gamma | down | 6.80 ± 0.57 | 8.01 ± 0.48 | 2.31 | 0.019 |
| CD86 | CD86 molecule | up | 14.38 ± 0.89 | 11.30 ± 0.38 | 8.48 | 0.002 |
| DOCK10 | Dedicator of cytokinesis 10 | down | 8.71 ± 0.98 | 10.01 ± 0.44 | 2.47 | 0.038 |
| IL20RA | Interleukin 20 receptor subunit alpha | up | 7.57 ± 1.23 | 5.97 ± 0.39 | 3.00 | 0.034 |
| KCNIP1 | Potassium voltage-gated channel interacting protein 1 | up | 3.84 ± 0.66 | 2.65 ± 0.70 | 2.28 | 0.042 |
| LEF1 | Lymphoid enhancer binding factor 1 | up | 7.64 ± 0.44 | 6.29 ± 0.96 | 2.55 | 0.042 |
| LINC01108 | ncRNA | down | 2.09 ± 0.54 | 3.17 ± 0.60 | 2.12 | 0.034 |
| LOC100130476 | ncRNA | up | 3.33 ± 0.15 | 2.16 ± 0.35 | 2.24 | 0.047 |
| NR1D1 | Nuclear receptor subfamily 1 group D member 1 | up | 8.31 ± 0.97 | 6.45 ± 1.16 | 3.63 | 0.042 |
| SMARCA4 | SWI/SNF related, matrix associated, actin dependent regulator of chromatin, A4 | up | 14.07 ± 0.86 | 12.12 ± 0.33 | 3.86 | 0.007 |
| TEF | Thyrotroph embryonic factor | up | 9.02 ± 0.47 | 7.76 ± 0.91 | 2.40 | 0.045 |
| TMEM130 | Transmembrane protein 130 | down | 6.73 ± 0.31 | 7.94 ± 0.60 | 2.32 | 0.016 |
| TMEM47 | Transmembrane protein 47 | down | 9.60 ± 0.82 | 10.70 ± 0.54 | 2.21 | 0.043 |
| TTC28 | Tetratricopeptide repeat domain 28 | up | 8.72 ± 0.54 | 7.52 ± 0.33 | 2.30 | 0.011 |
| Gene Symbol | Protein Name (Short Name) | Protein Function |
|---|---|---|
| AFF1 | AF4/FMR2 family member 1 (AF4) | Transcription factor, elongation complex of RNA pol II (https://www.ncbi.nlm.nih.gov/gene/4299) |
| ALDH1L1 | Cytosolic 10-formyltetrahydrofolate dehydrogenase (ALDH1L1, FDH) | Enzyme of folate metabolism (https://www.ncbi.nlm.nih.gov/gene/10840) |
| ARL11 | ADP ribosylation factor-like protein 11 (ARLTS1) | GTP-binding protein (https://www.ncbi.nlm.nih.gov/gene/115761) |
| BATF | Basic leucine zipper transcriptional factor ATF-like (B-ATF) | Transcription factor (https://www.ncbi.nlm.nih.gov/gene/10538) |
| CAMK2G | Calcium/calmodulin-dependent protein kinase type II subunit gamma (CAMK-II gamma) | Enzyme, serine/threonine protein kinase, calcium signaling (https://www.ncbi.nlm.nih.gov/gene/818) |
| CD86 | T-lymphocyte activation antigen CD86 (CD86) | Receptor, type 1 membrane protein https://www.ncbi.nlm.nih.gov/gene/942 |
| DOCK10 | Dedicator of cytokinesis 10 (DOC-10) | Guanosine nucleotide exchange factor (https://www.ncbi.nlm.nih.gov/gene/55619) |
| IL20RA | Interleukin-20 receptor subunit alpha (IL-20R-alpha) | Receptor of IL20, membrane protein (https://www.ncbi.nlm.nih.gov/gene/53832) |
| KCNIP1 | Kv channel-interacting protein 1(KChIP1) | Neuronal membrane excitability (https://www.ncbi.nlm.nih.gov/gene/30820) |
| LEF1 | Lymphoid enhancer-binding factor 1 (LEF1) | Transcription factor, WNT-signaling (https://www.ncbi.nlm.nih.gov/gene/51176) |
| NR1D1 | Nuclear receptor subfamily 1 group D member 1 (EAR-1) Rev-erbA-alpha | Heme-dependent transcriptional repressor (https://www.ncbi.nlm.nih.gov/gene/9572) |
| SMARCA4 | Transcription activator BRG1 (BAF190A) | Enzyme, helicase and ATPase activities, regulator of transcription (https://www.ncbi.nlm.nih.gov/gene/6597) |
| TEF | Thyrotroph embryonic factor | Transcription factor that binds to and transactivates the TSHB promoter (https://www.ncbi.nlm.nih.gov/gene/7008) |
| TMEM130 | Transmembrane protein 130 | Membrane-bound signaling protein (https://www.ncbi.nlm.nih.gov/gene/222865) |
| TMEM47 | Transmembrane protein 47 | Adherens junction, cell–cell adhesion (https://www.ncbi.nlm.nih.gov/gene/83604) |
| TTC28 | Tetratricopeptide repeat protein 28 | Scaffold-adaptor protein (https://www.ncbi.nlm.nih.gov/gene/23331) |
| Gene | Chr: Position GRCh38 dbSNP | Ref. Allele | mRNA Molecular Consequences | mRNA Level Affected by SNP eQTL | CADD (°) (Ensembl) | NIG-IT MAF | 1000G TSI MAF | gnomAD 3.1.1 (nfe) MAF | p-Value ($) NIG-IT vs. 1000G TSI | p-Value ($) NIG-IT vs. gnomAD 3.1.1 |
| MS-GWAS genes | ||||||||||
| DOCK10 | chr2:224795011:G:A/C rs113265459 | A | caC/caT p.His1674His | ns | A:5.937 | 0.0224 | 0 | 0.0165 | 6.87 × 10⁻⁷ | 0.1296 |
| NR1D1 | chr17:40100148:G:A rs17616365 | A | c.-54C > T 5′-UTR | CASC3, WIPF2 | A:16.11 | 0.0119 | 0.00485 | 0.0283 | 0.00083 | 0.0011 |
| TMEM130 | chr7:98863351:C:T rs199556348 | T | gcG/gcA p.Ala45Ala | ns | T:1.532 | 0.00046 | 0.00002 | 0.00003 | 0.0013 | 0.0094 |
| Functional partners | ||||||||||
| GRIN2B | chr12:13611840:G:A rs1805482 | A | agC/agT p.Ser555Ser | ns | A:0.955 | 0.3215 | 0.3786 | 0.3377 | 0.00011 | 0.2569 |
| GRIN2B | chr12:13865843:G:C/T rs7301328 | C | ccC/ccG p.Pro122Pro | ns | C:7.840 | 0.3646 | 0.4126 | 0.3892 | 0.00131 | 0.0958 |
| PER3 | chr1:7829881:C:T rs2640908 | T | acC/acT (+) p.Thr978Thr | VAMP3, UTS2 | T:0.757 | 0.2044 | 0.2379 | 0.1918 | 0.0093 | 0.2884 |
| PER3 | chr1:7830057:T:C rs2640909 | C | aTg/aCg (+) p.Met1037Thr | VAMP3 | C:0.161 | 0.2500 | 0.3204 | 0.2872 | 7.27 × 10⁻⁷ | 0.0067 |
| PPARGC1A | chr4:23814301:T:C/A rs2970847 | C | acA/acG p.Thr394Thr | ns | C:1.605 | 0.1763 | 0.1408 | 0.1923 | 0.00077 | 0.1791 |
| PPARGC1A | chr4:23814039:C:T rs8192678 | T | Ggt/Agt p.Gly482Ser | ns | T:16.24 | 0.3572 | 0.4272 | 0.3450 | 3.33 × 10⁻⁶ | 0.3964 |
| PPARGC1A | chr4:23813899:C:T/A/G rs3755863 | T | acG/acA p.Thr528Thr | ns | T:9.102 | 0.4380 | 0.5097 | 0.4054 | 2.42 × 10⁻⁶ | 0.0287 |
| Gene | Protein Function | Gene/SNPs-Associated Processes/Traits/Diseases | |
|---|---|---|---|
| Vascular | Neuronal | ||
| AFF1 | Transcription factor; elongation complex RNA pol II | TG, HDL-LDL cholesterol levels, CAD [31] | Cognitive decline in AD, glioblastoma [32] |
| ALDH1L1 | Enzyme; folate metabolism | Aortic stenosis, ischemic stroke [33] | Neural tube defects [34] |
| ARL11 | GTP- binding protein, tumor suppressor gene | Total cholesterol levels [35] | nr |
| BATF | Transcription factor | Blood pressure [15] | MS* [36] |
| CAMK2G | Enzyme; calcium signaling | VSMC proliferation and vascular remodeling [37] | AD, intellectual developmental disorder [38] |
| CD86 | Receptor, immune-inflammatory response | HDL-cholesterol, atherogenic process, stroke, vascular rejection [15,39] | MS* [40,41], autoimmune peripheral neuropathy [42] |
| DOCK10 | Guanyl–nucleotide exchange factor activity | Circulating thrombin activatable fibrinolysis inhibitor [43], platelet count | Dendritic spine morphogenesis, innate immunity and neuroinflammation in EAE, autism [44,45] |
| IL20RA | Receptor of IL20, membrane protein | HDL-LDL cholesterol levels, plasma trimethyllysine # [46,47] | MS* [48], neuroinflammation in EAE [49] |
| KCNIP1 | Ion transmembrane transport | TG levels; atrial fibrillation, hypertension, heart rate in heart failure [50,51] | MS* [52], neuronal calcium sensor, neuronal membrane excitability, ALS, schizophrenia [53] |
| LEF1 | Transcription factor; WNT-signaling | Maturation of the blood–brain barrier, vascular remodeling, and angiogenesis [54,55] | MS* [56], schizophrenia, sporadic ALS [57] |
| NR1D1 | Transcription factor (REV-ERBα); transcriptional repressor, circadian clock component | Lipoproteins levels, anti-inflammatory and atheroprotective action, negative regulation of PAI-1 [58,59] | Neuroinflammation -neurodegeneration, autism [26,60] |
| SMARCA4 | Enzyme, helicase and ATPase activities, regulator of transcription | LDL cholesterol levels, CAD, MI, stroke, carotid atherosclerosis, PAD [31,61] | Growth retardation and neuronal degeneration, ALS [62,63] |
| TEF | Transcription factor | nr | Depressive disorders, PD [64] |
| TMEM130 | Membrane-bound signaling protein | nr | Autism [65] |
| TMEM47 | Adherens junction, cell–cell adhesion | nr | nr |
| TTC28 | scaffold- adaptor protein | TG levels, systolic blood pressure [31] | Cerebrospinal T-tau levels [66] |
Publisher’s Note: MDPI stays neutral with regard to jurisdictional claims in published maps and institutional affiliations. |
© 2021 by the authors. Licensee MDPI, Basel, Switzerland. This article is an open access article distributed under the terms and conditions of the Creative Commons Attribution (CC BY) license (https://creativecommons.org/licenses/by/4.0/).
Share and Cite
Scapoli, C.; Ziliotto, N.; Lunghi, B.; Menegatti, E.; Salvi, F.; Zamboni, P.; Baroni, M.; Mascoli, F.; Bernardi, F.; Marchetti, G. Combination of Genomic and Transcriptomic Approaches Highlights Vascular and Circadian Clock Components in Multiple Sclerosis. Int. J. Mol. Sci. 2022, 23, 310. https://doi.org/10.3390/ijms23010310
Scapoli C, Ziliotto N, Lunghi B, Menegatti E, Salvi F, Zamboni P, Baroni M, Mascoli F, Bernardi F, Marchetti G. Combination of Genomic and Transcriptomic Approaches Highlights Vascular and Circadian Clock Components in Multiple Sclerosis. International Journal of Molecular Sciences. 2022; 23(1):310. https://doi.org/10.3390/ijms23010310
Chicago/Turabian StyleScapoli, Chiara, Nicole Ziliotto, Barbara Lunghi, Erica Menegatti, Fabrizio Salvi, Paolo Zamboni, Marcello Baroni, Francesco Mascoli, Francesco Bernardi, and Giovanna Marchetti. 2022. "Combination of Genomic and Transcriptomic Approaches Highlights Vascular and Circadian Clock Components in Multiple Sclerosis" International Journal of Molecular Sciences 23, no. 1: 310. https://doi.org/10.3390/ijms23010310