Disruption of Cell Adhesion and Cytoskeletal Networks by Thiol-Functionalized Silica-Coated Iron Oxide Nanoparticles

 , , and
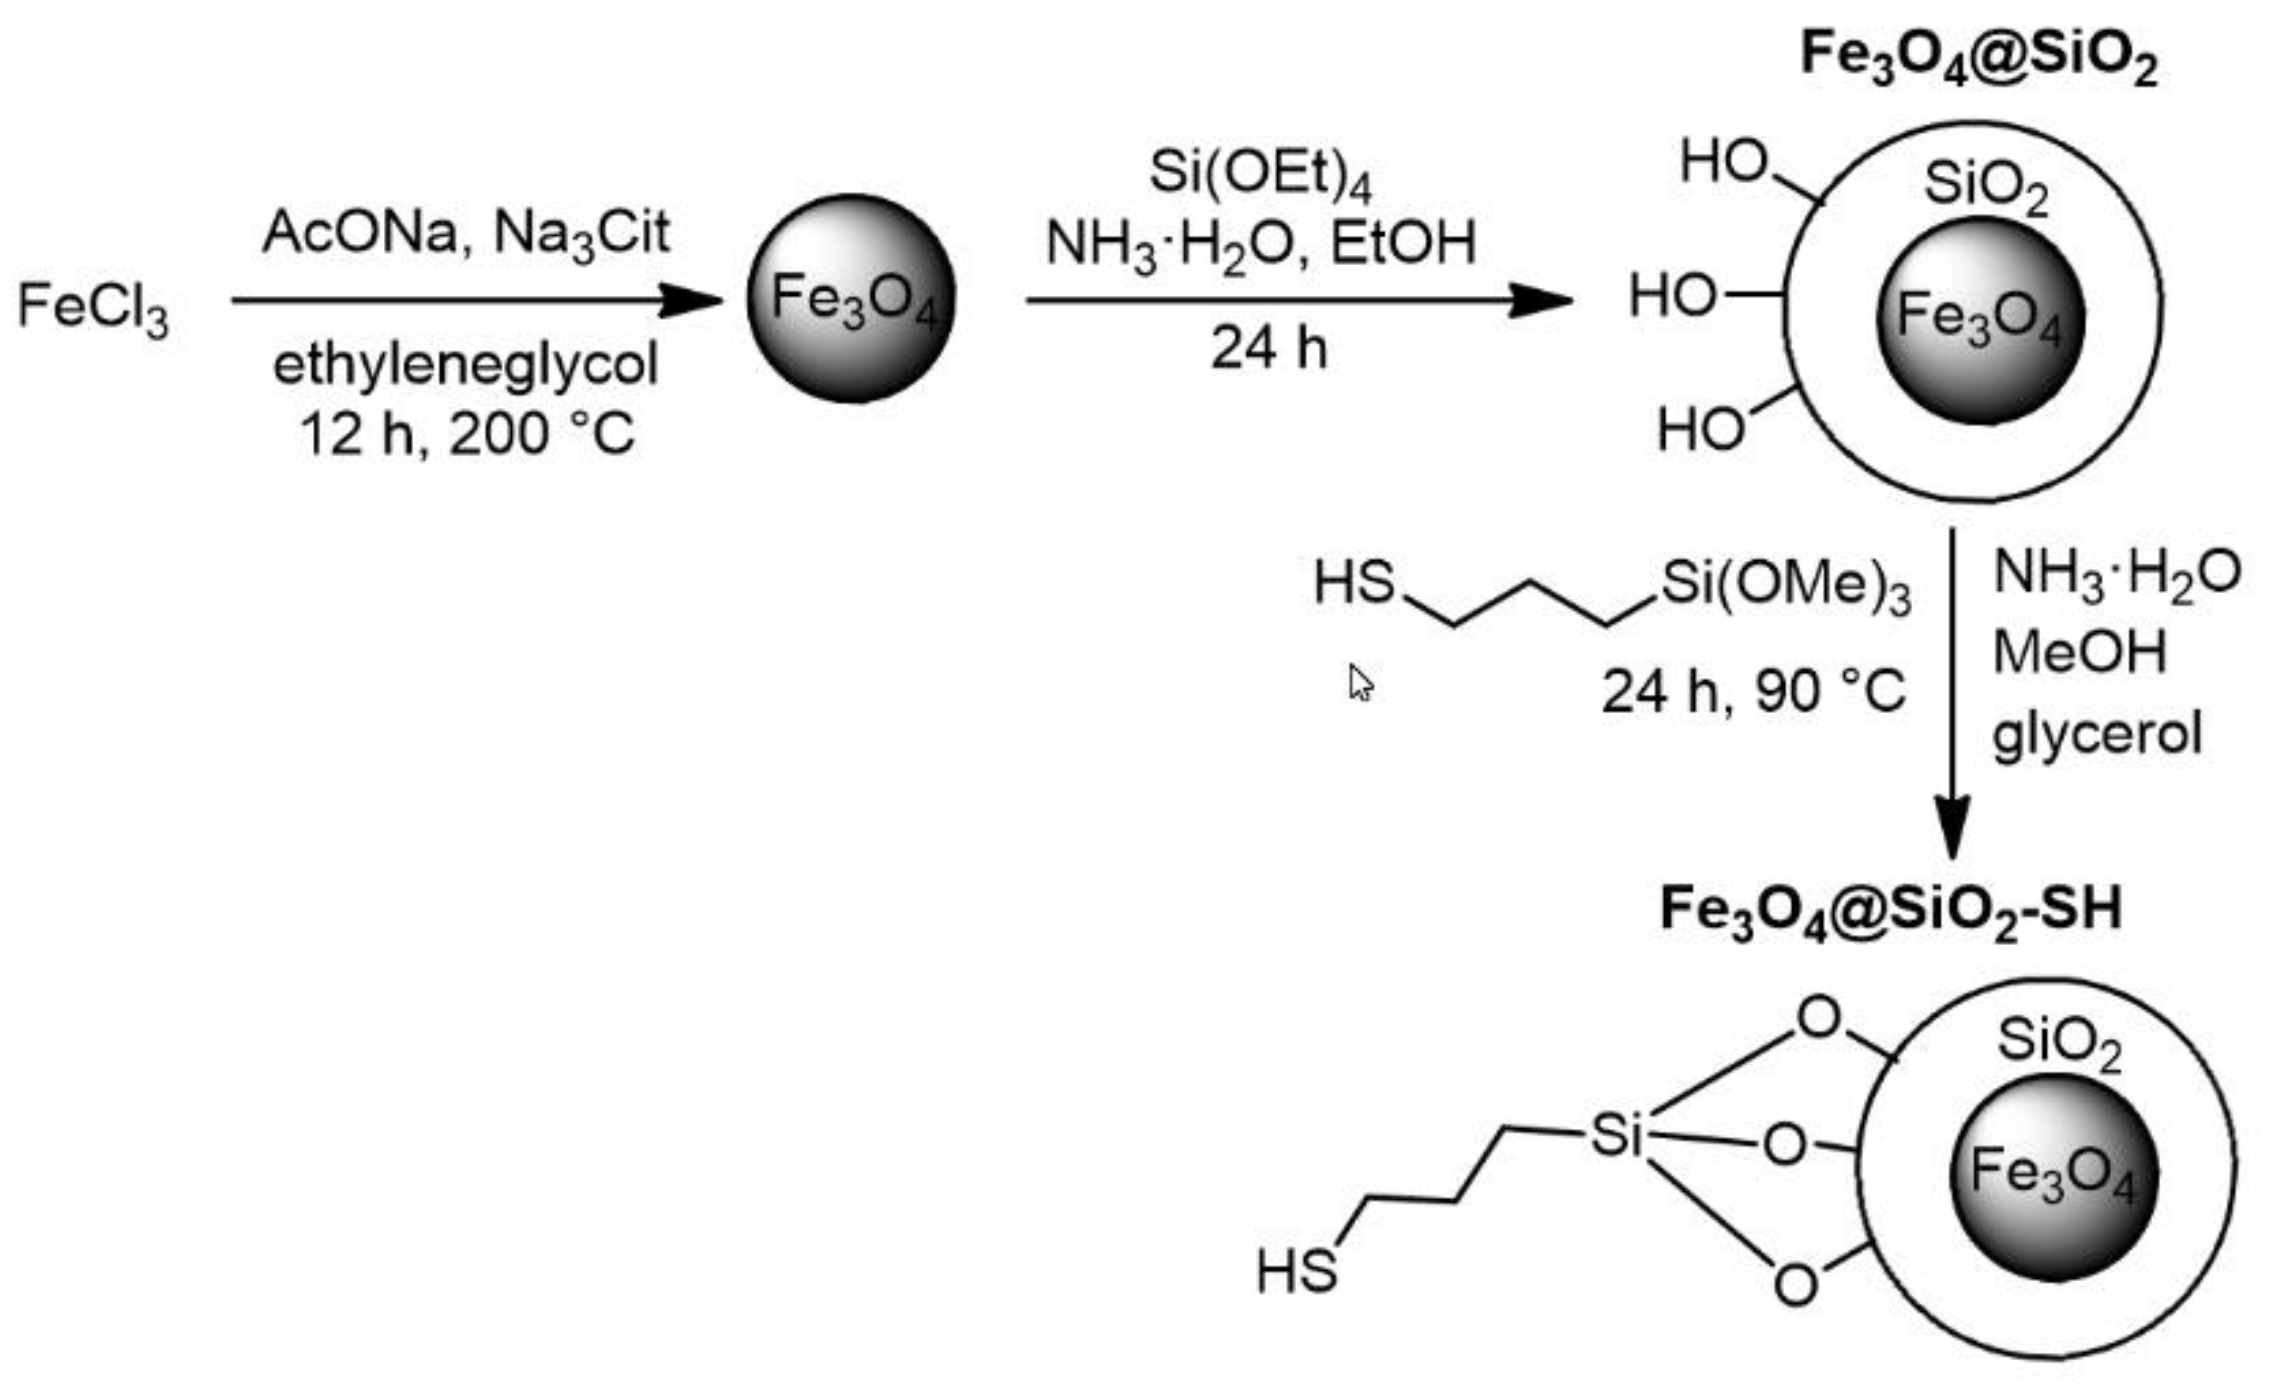
Abstract
:1. Introduction
2. Results
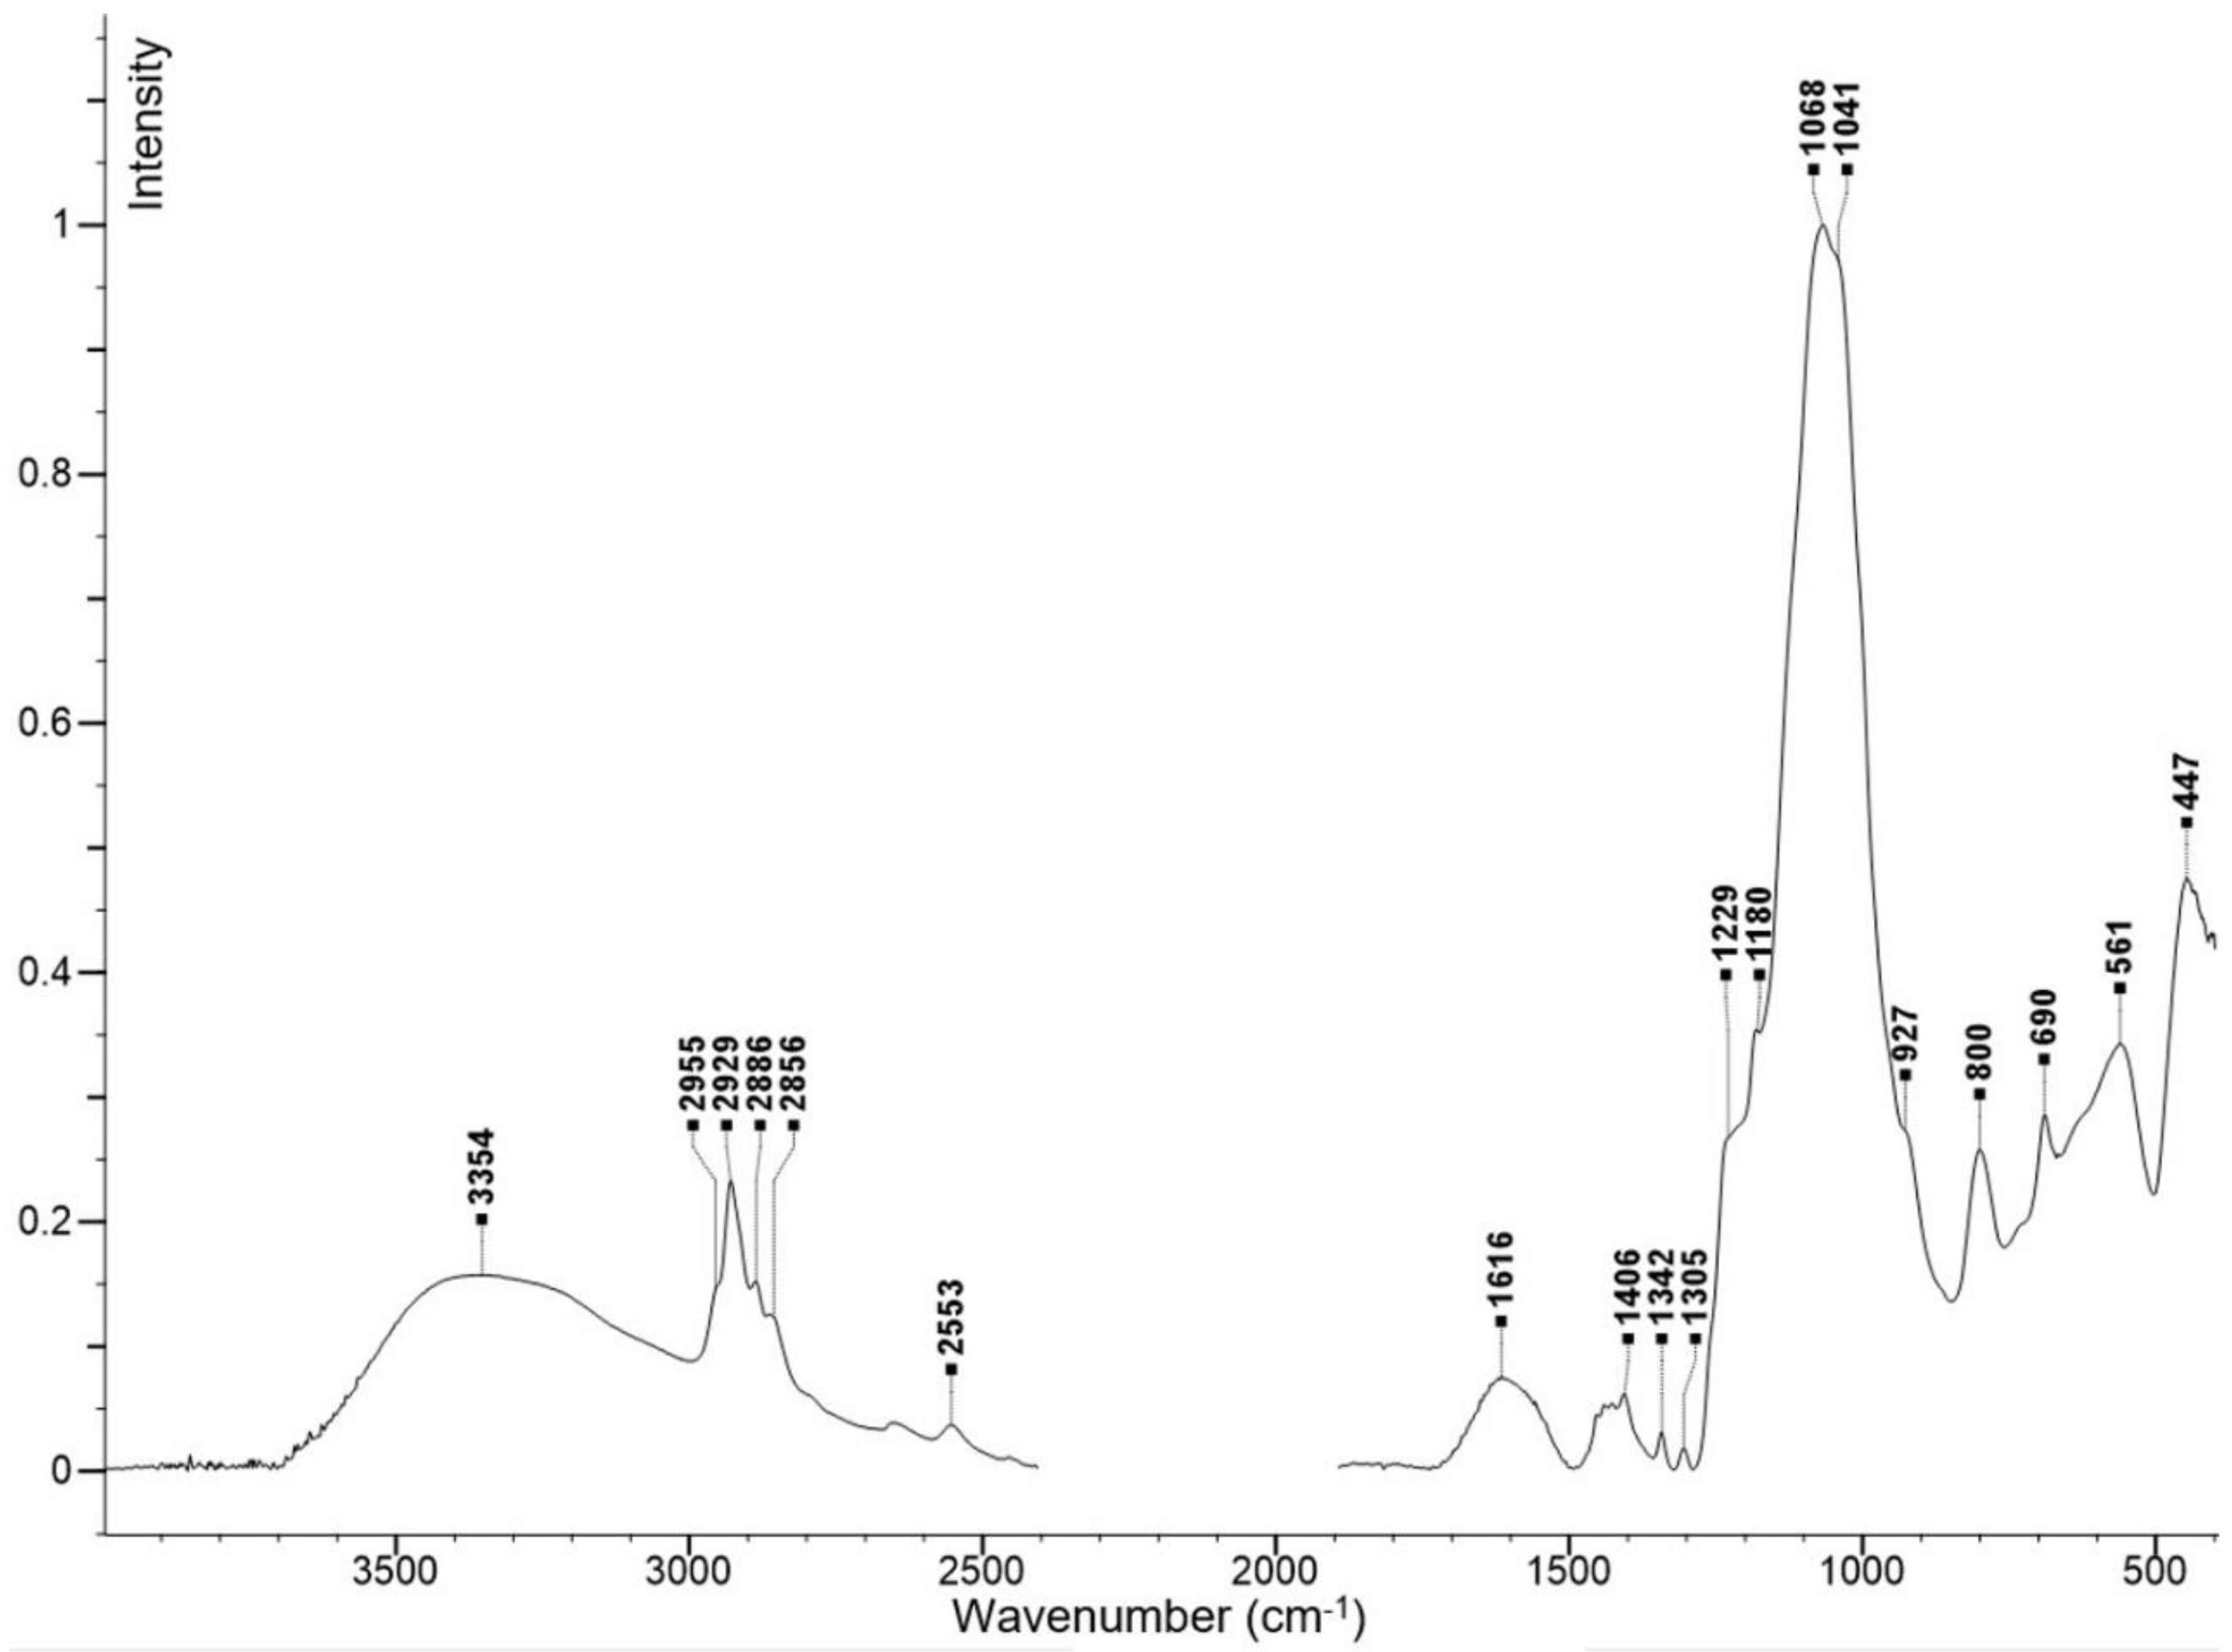
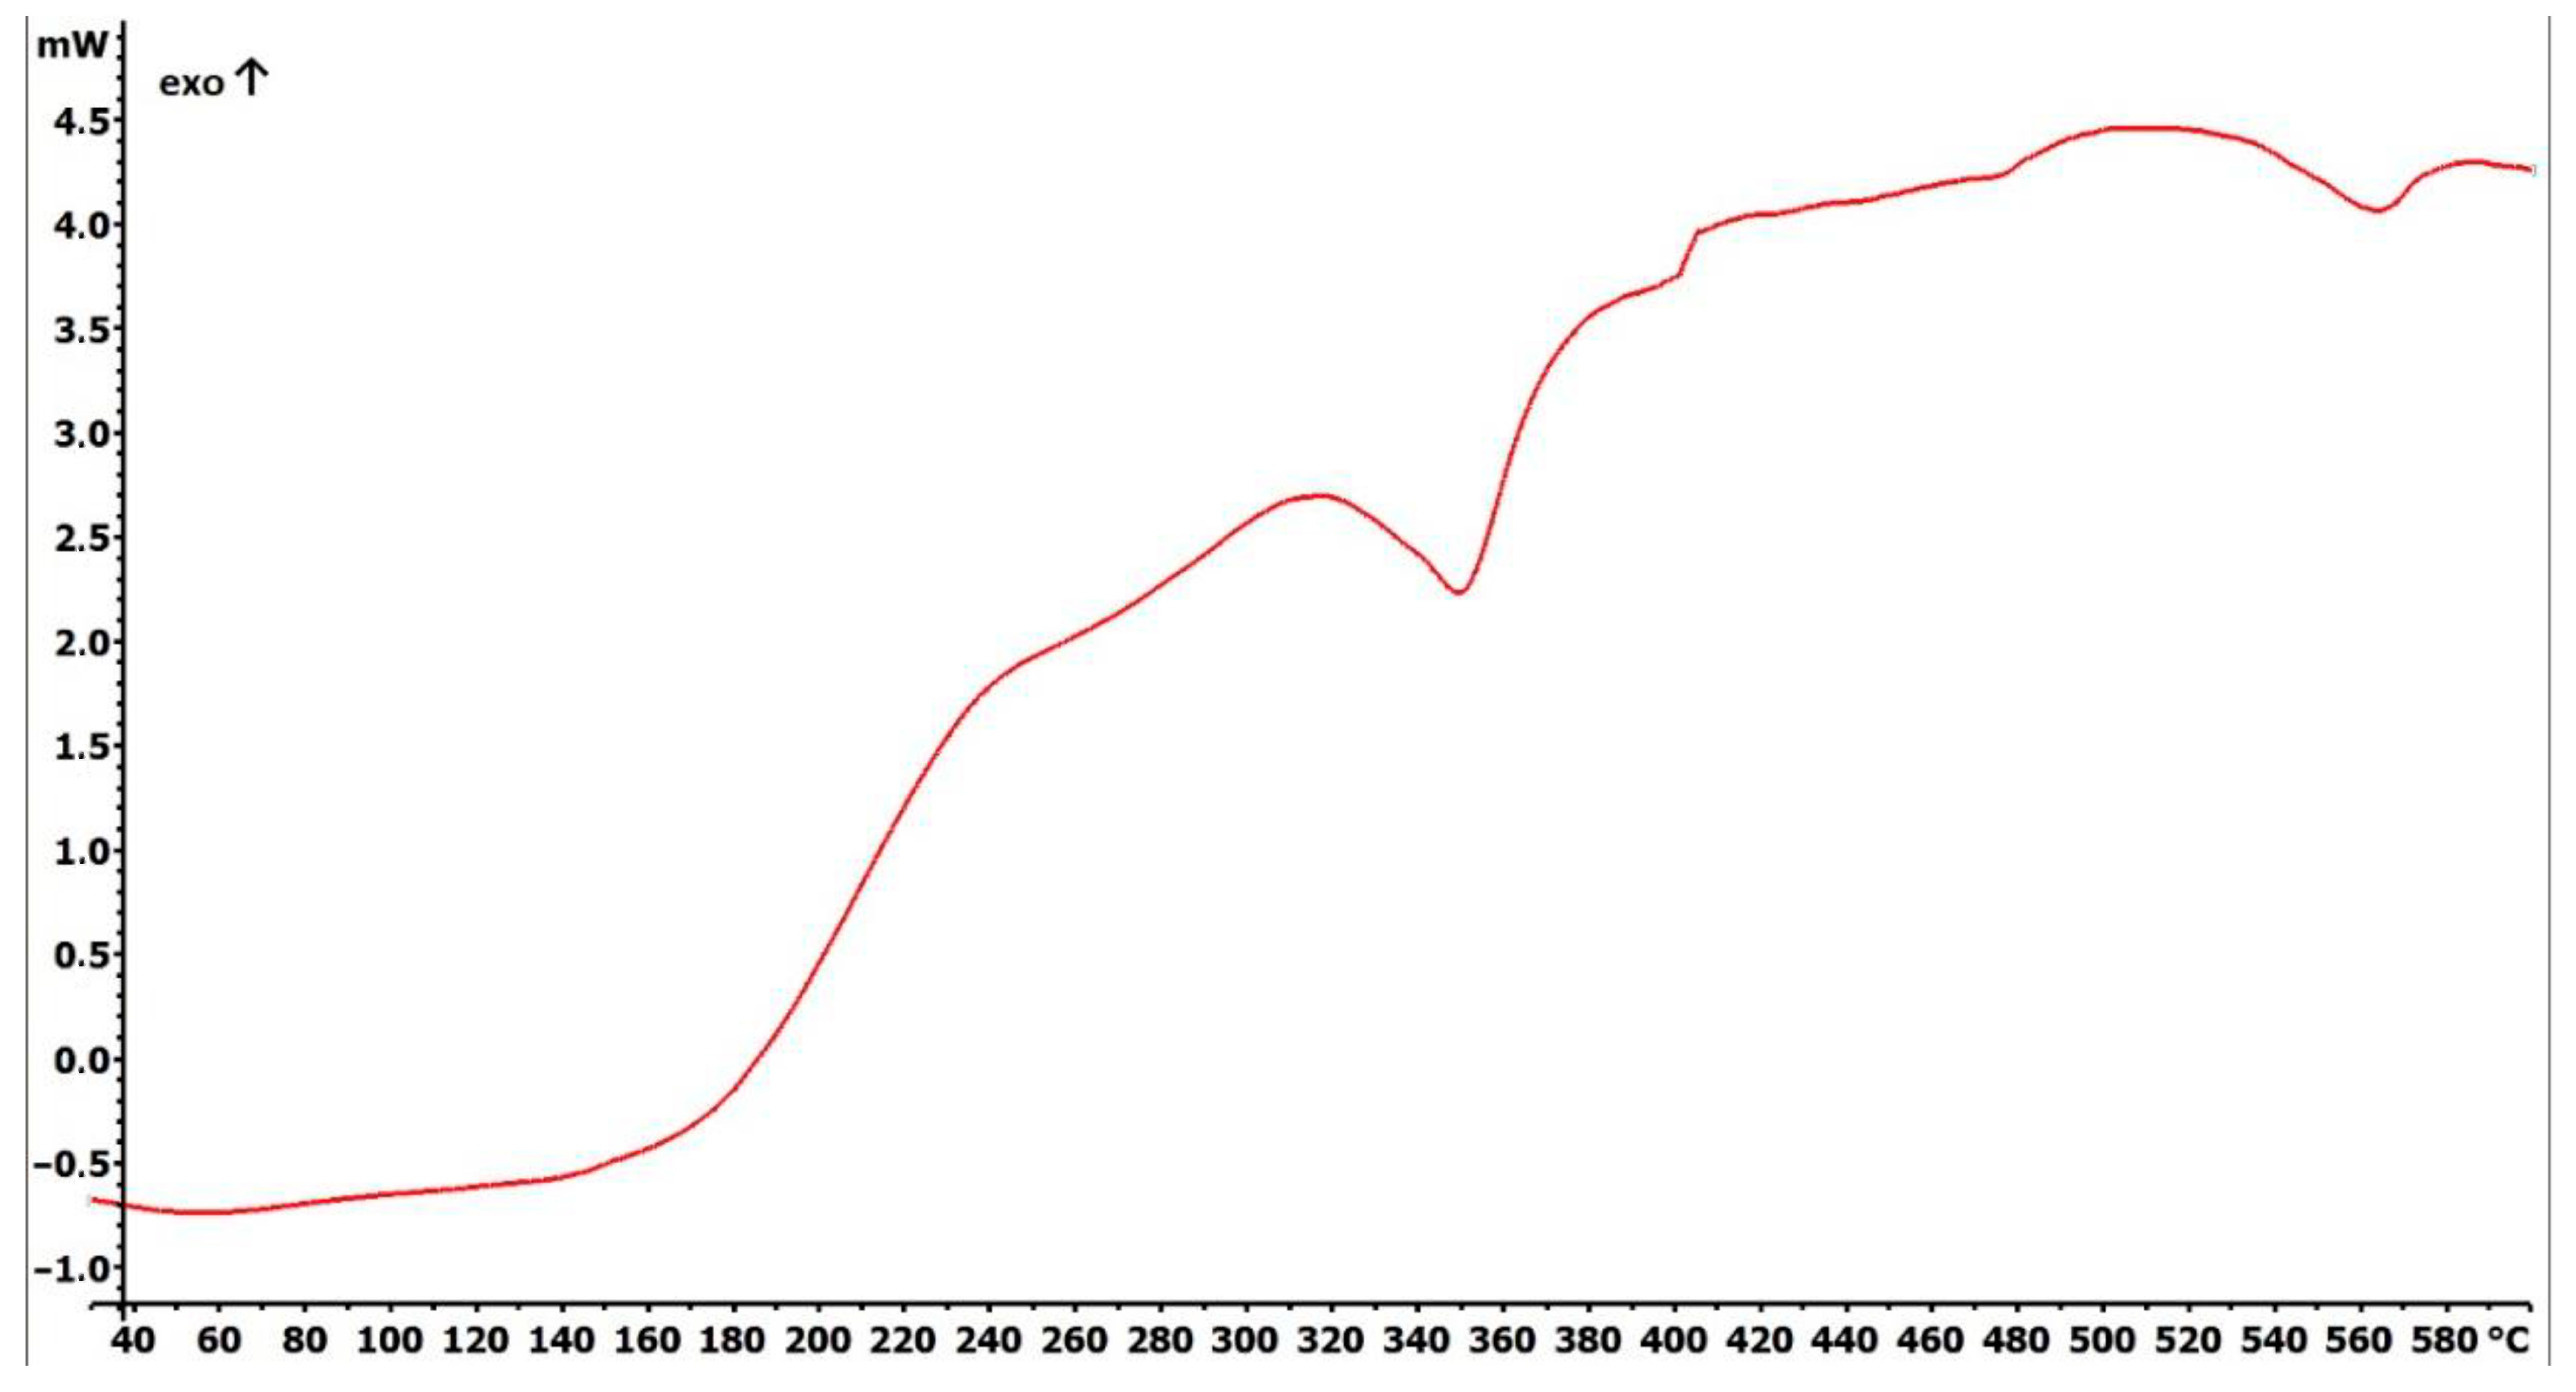
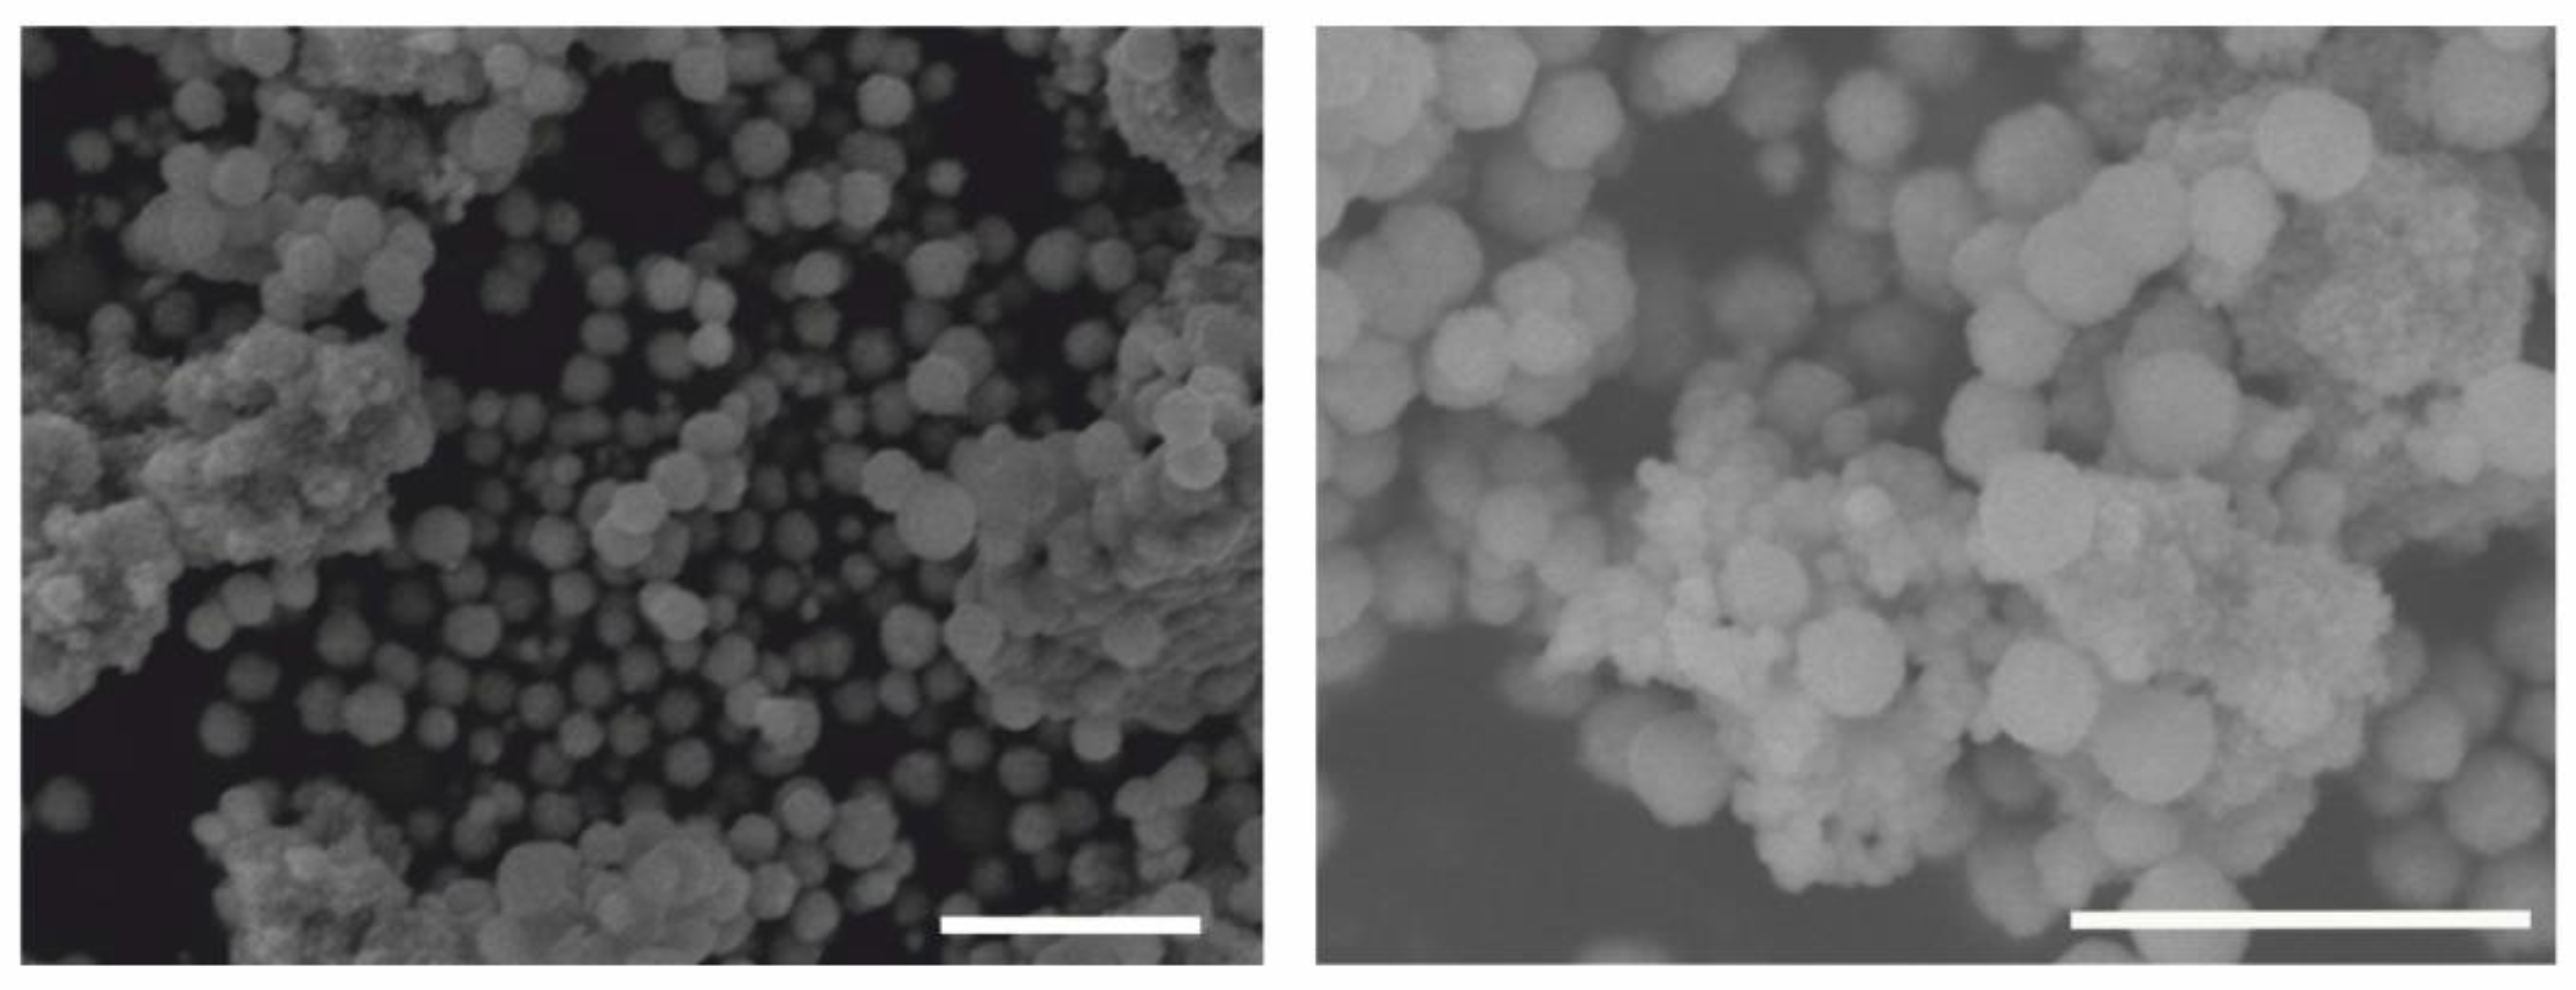
2.1. Preparation and Characterization of Fe3O4@SiO2-SH Nanoparticles
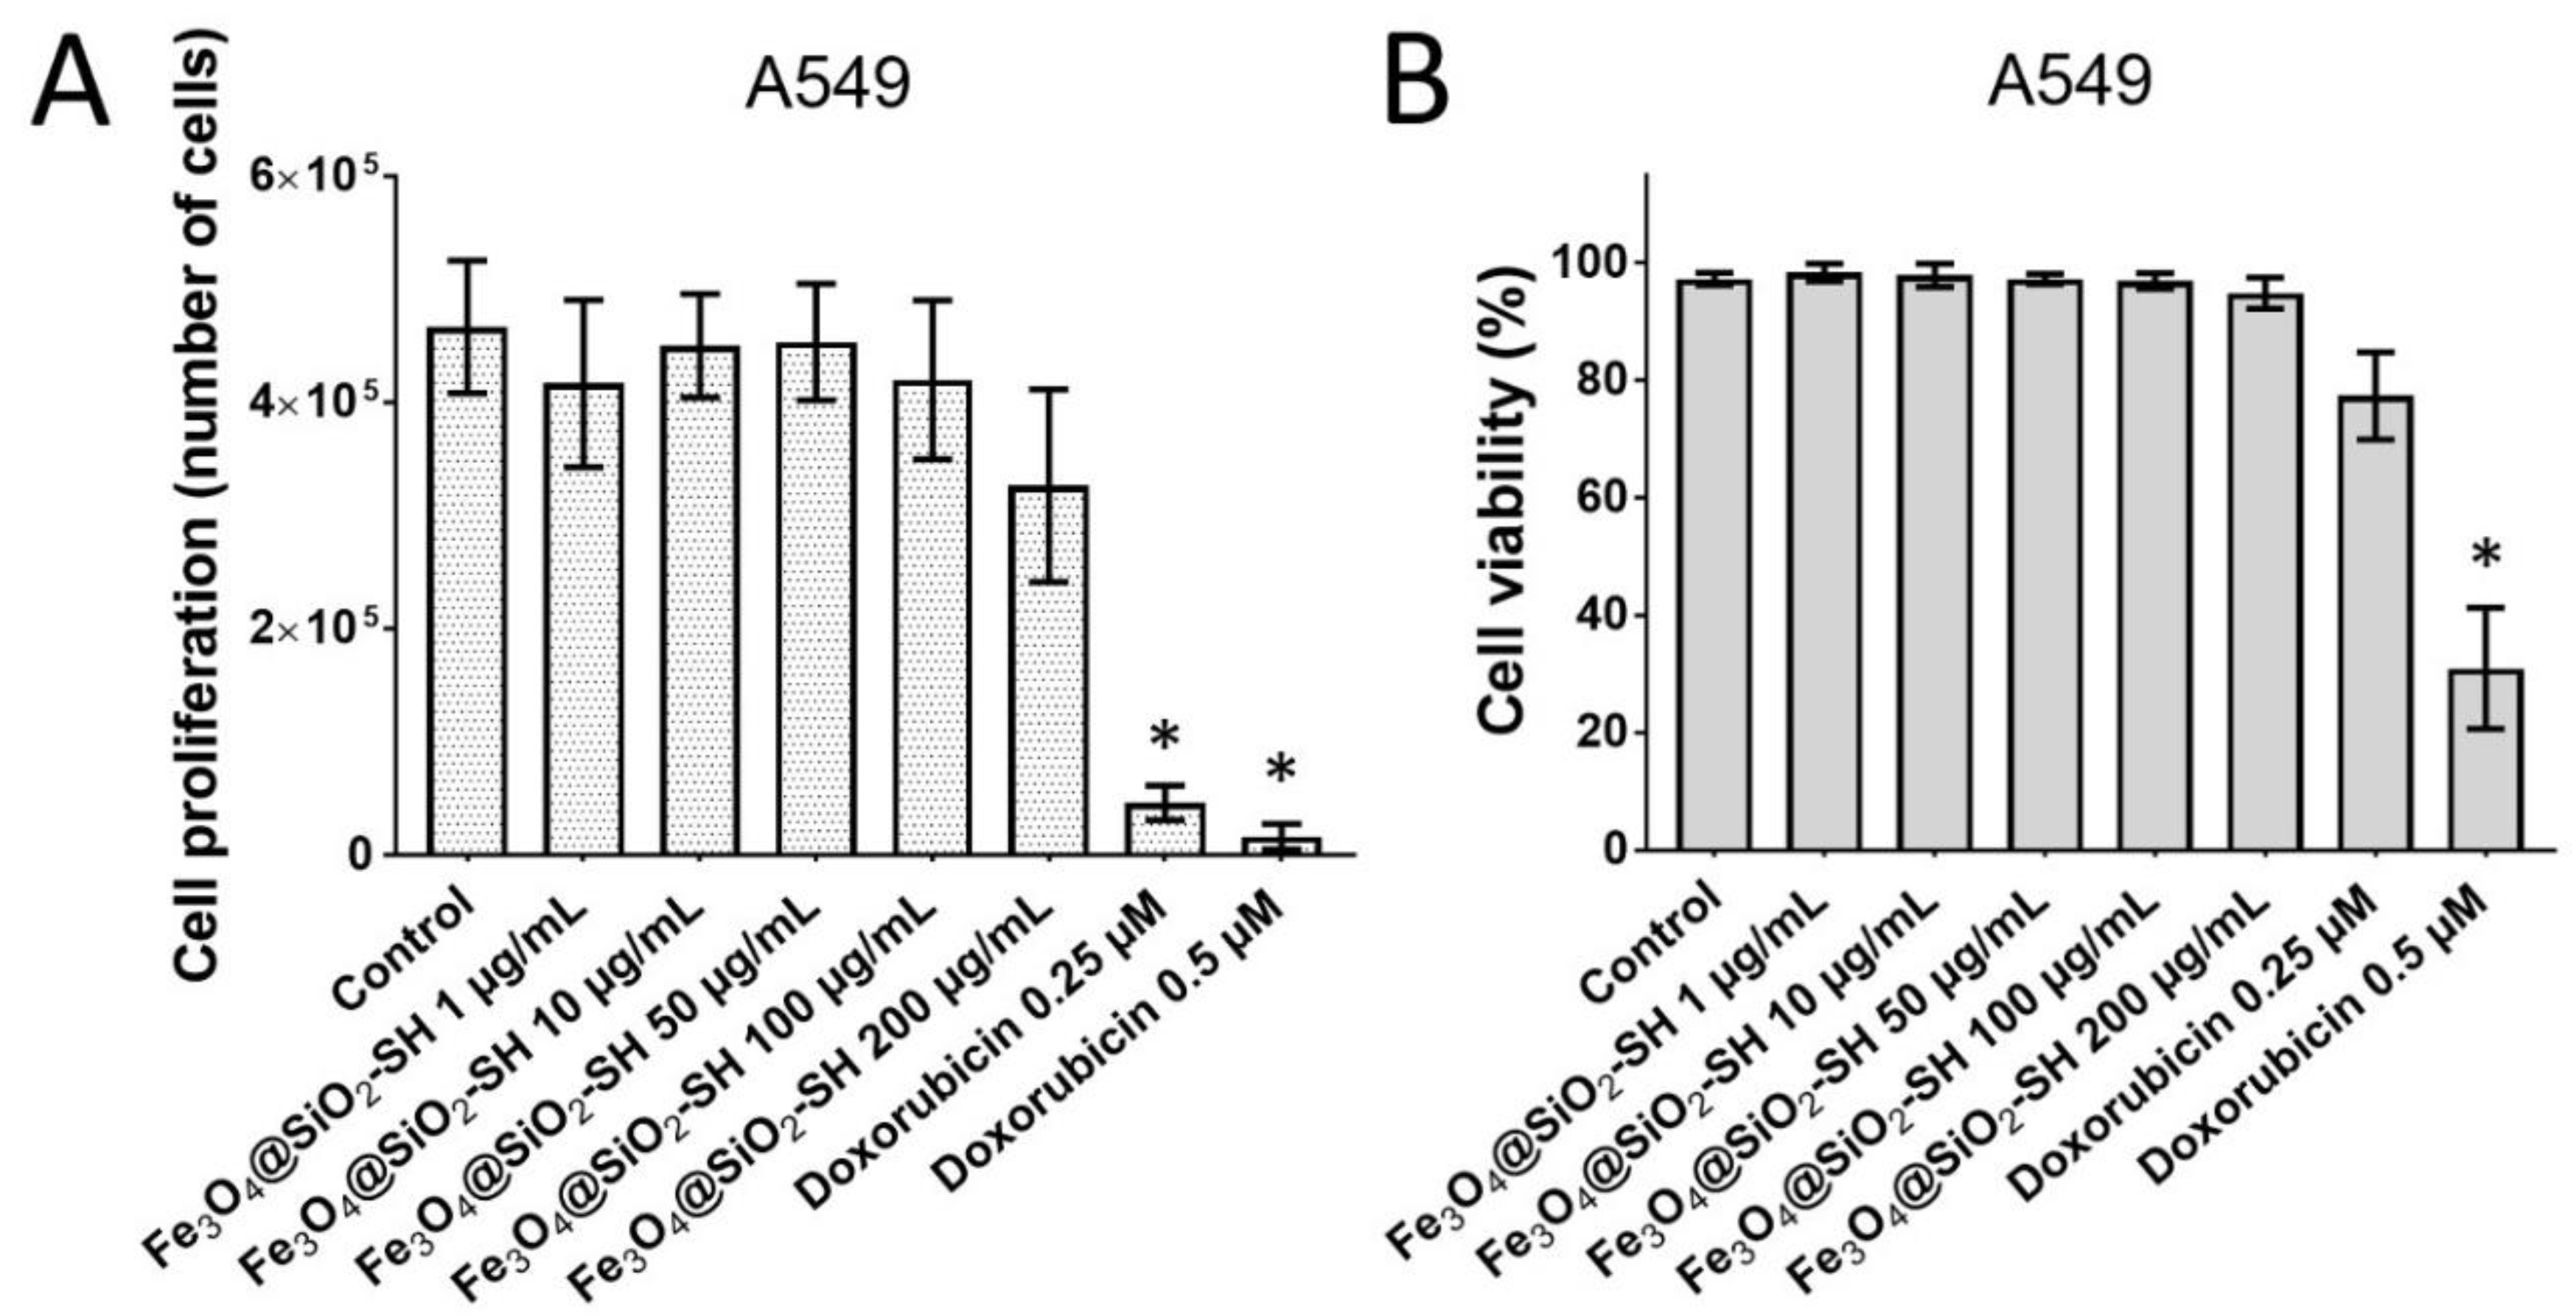
2.2. Effects of Fe3O4@SiO2-SH Nanoparticles on Proliferation and Viability
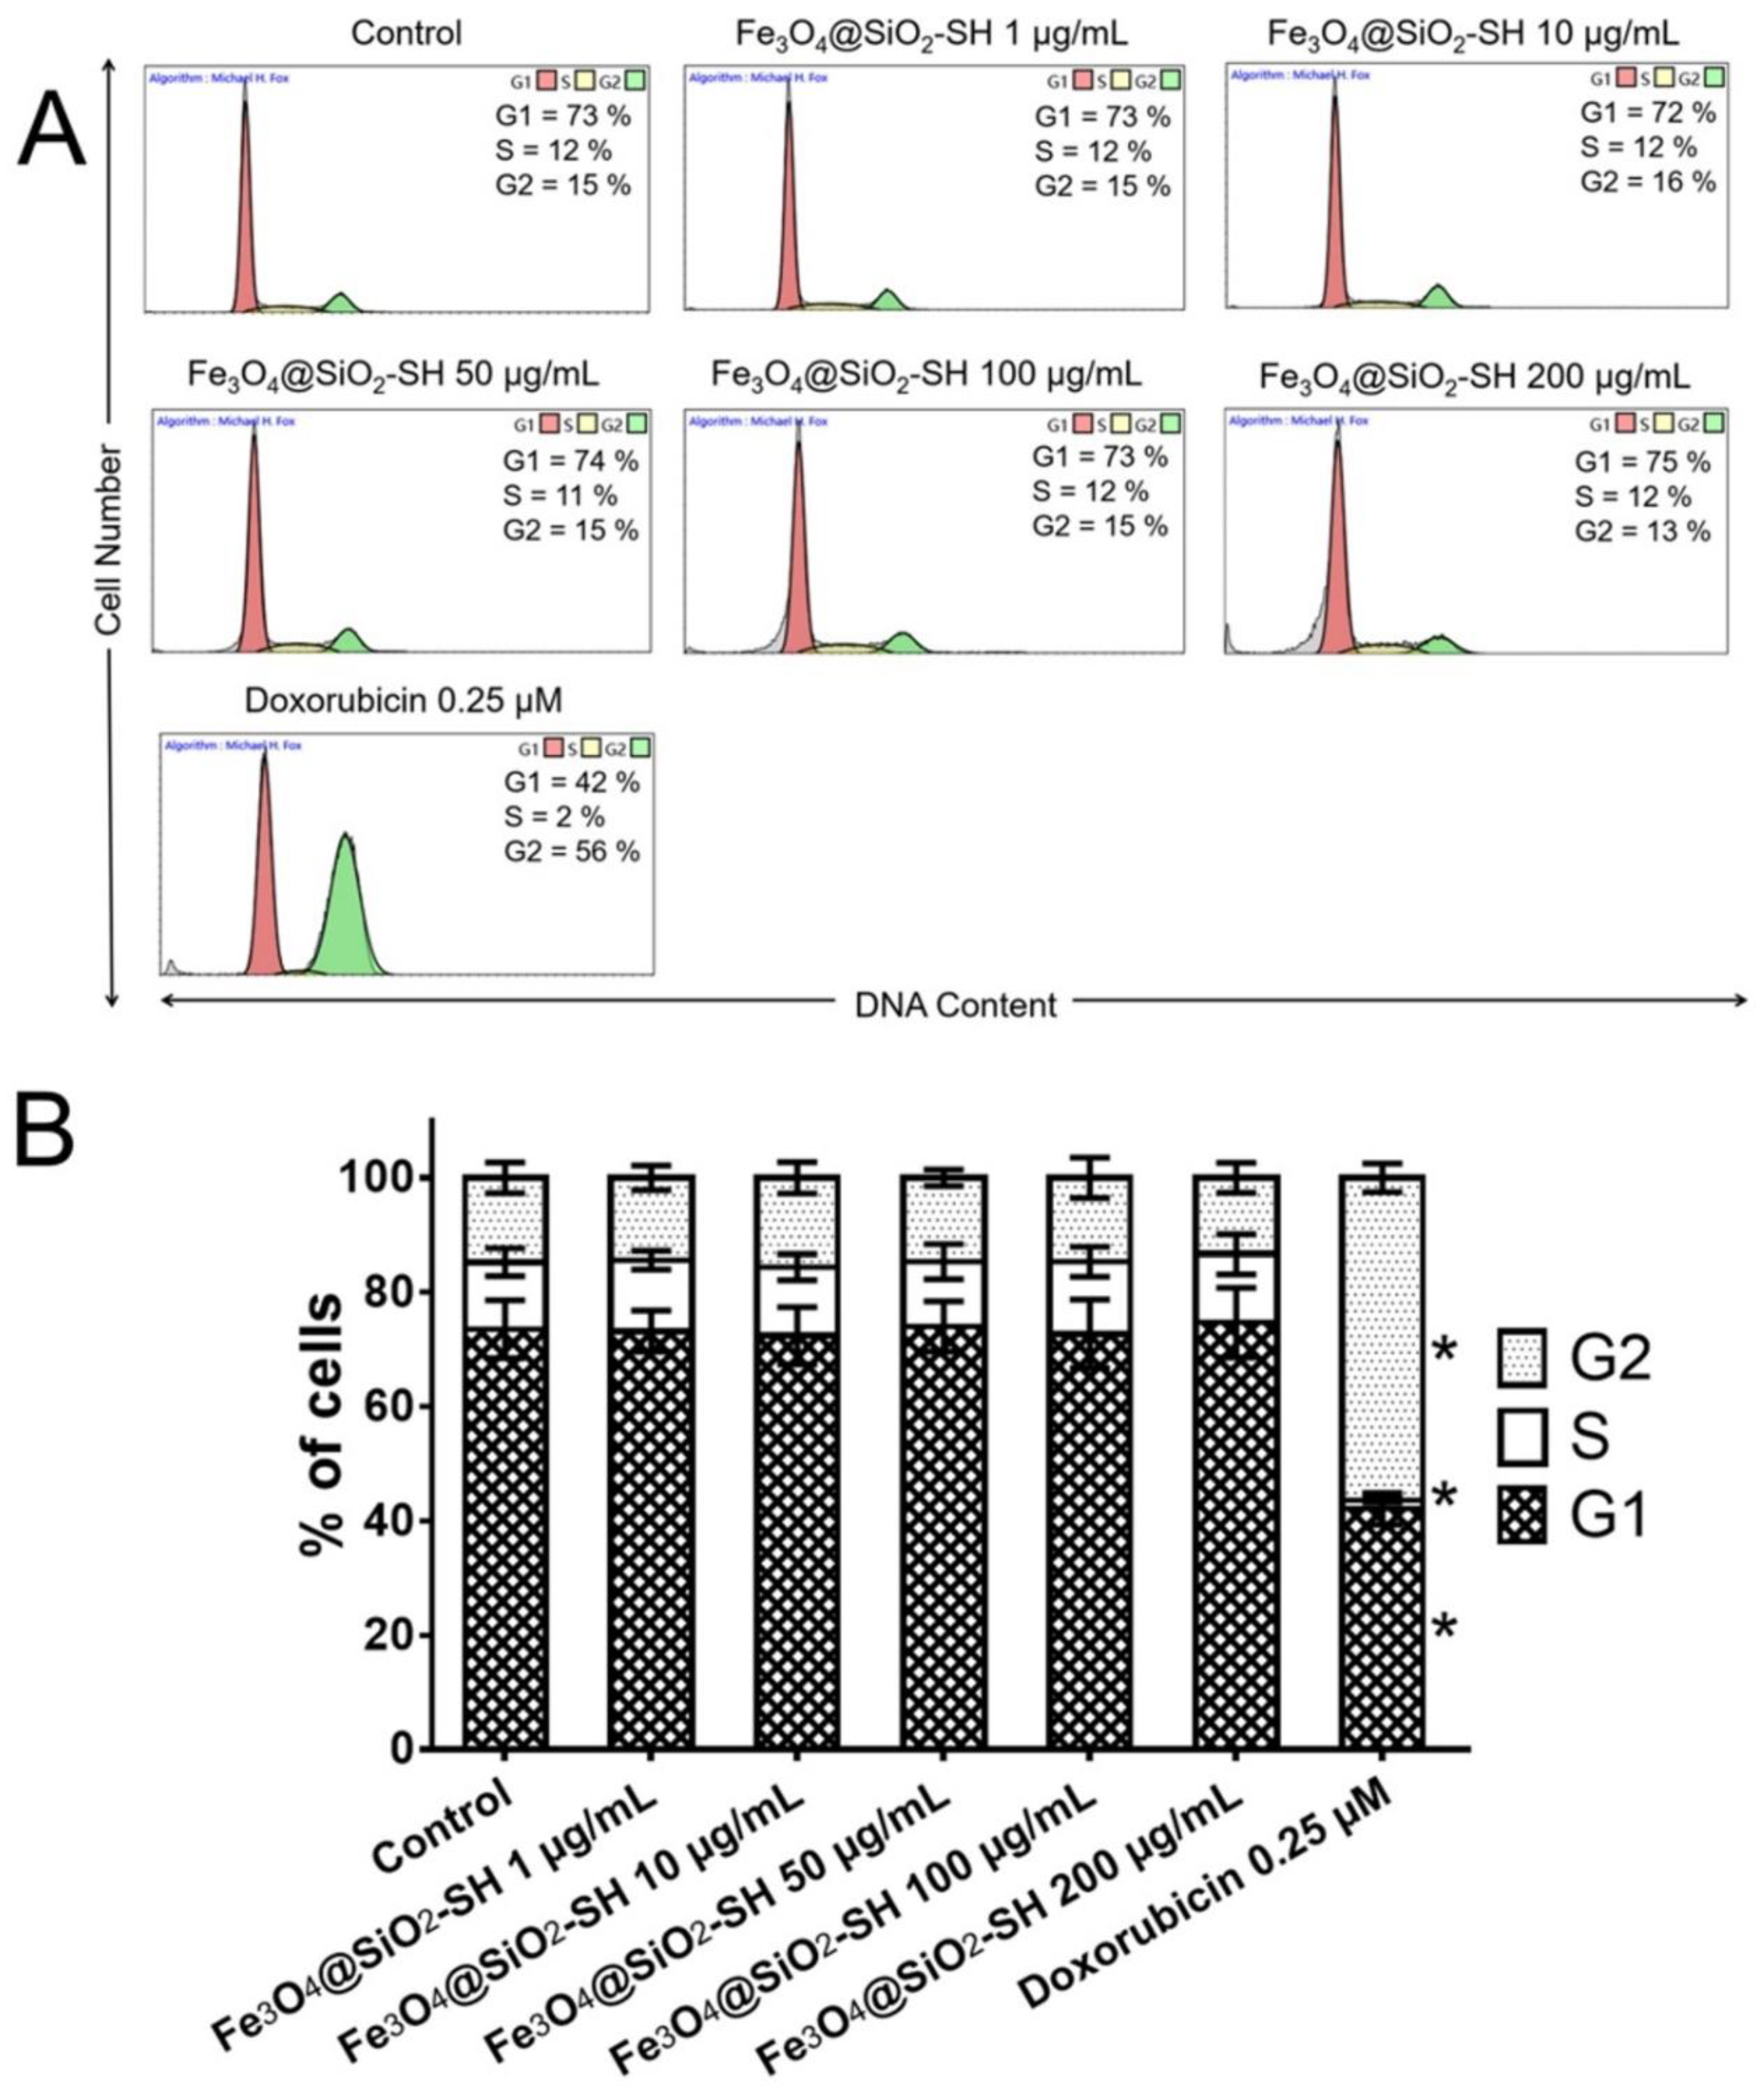
2.3. Effects of Fe3O4@SiO2-SH Nanoparticles on the Cell Cycle Progression of A549 Cells
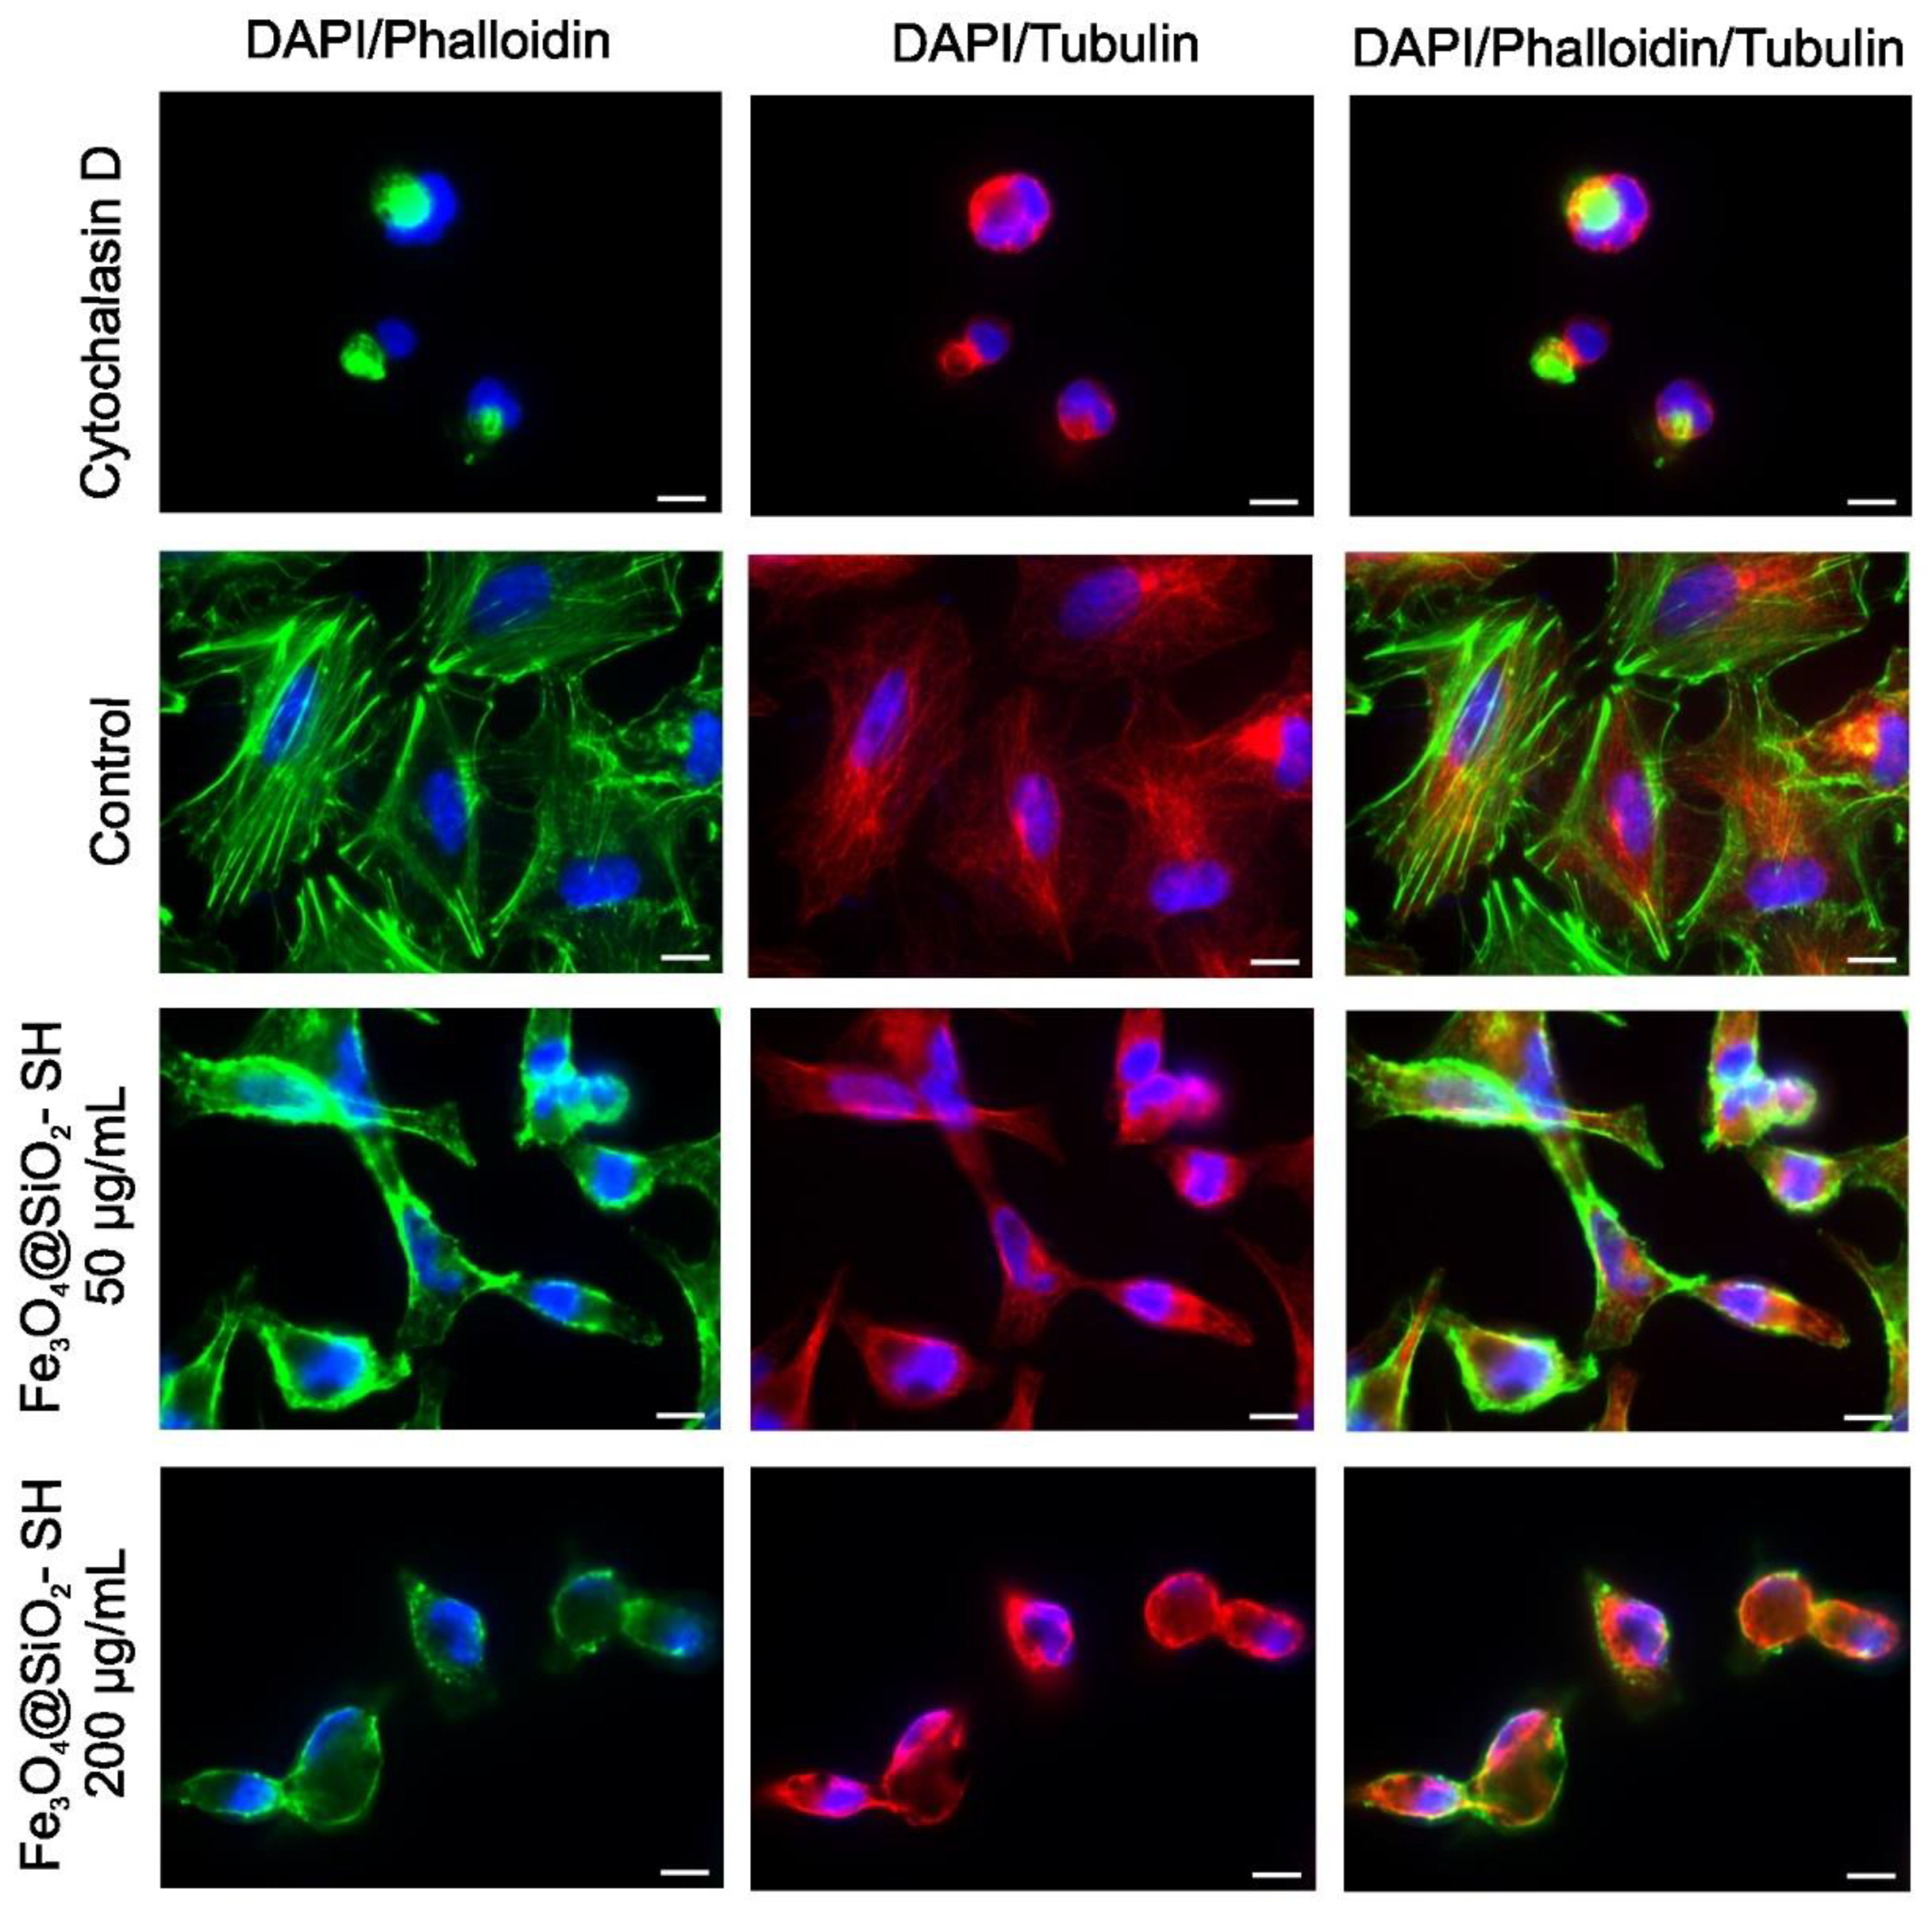
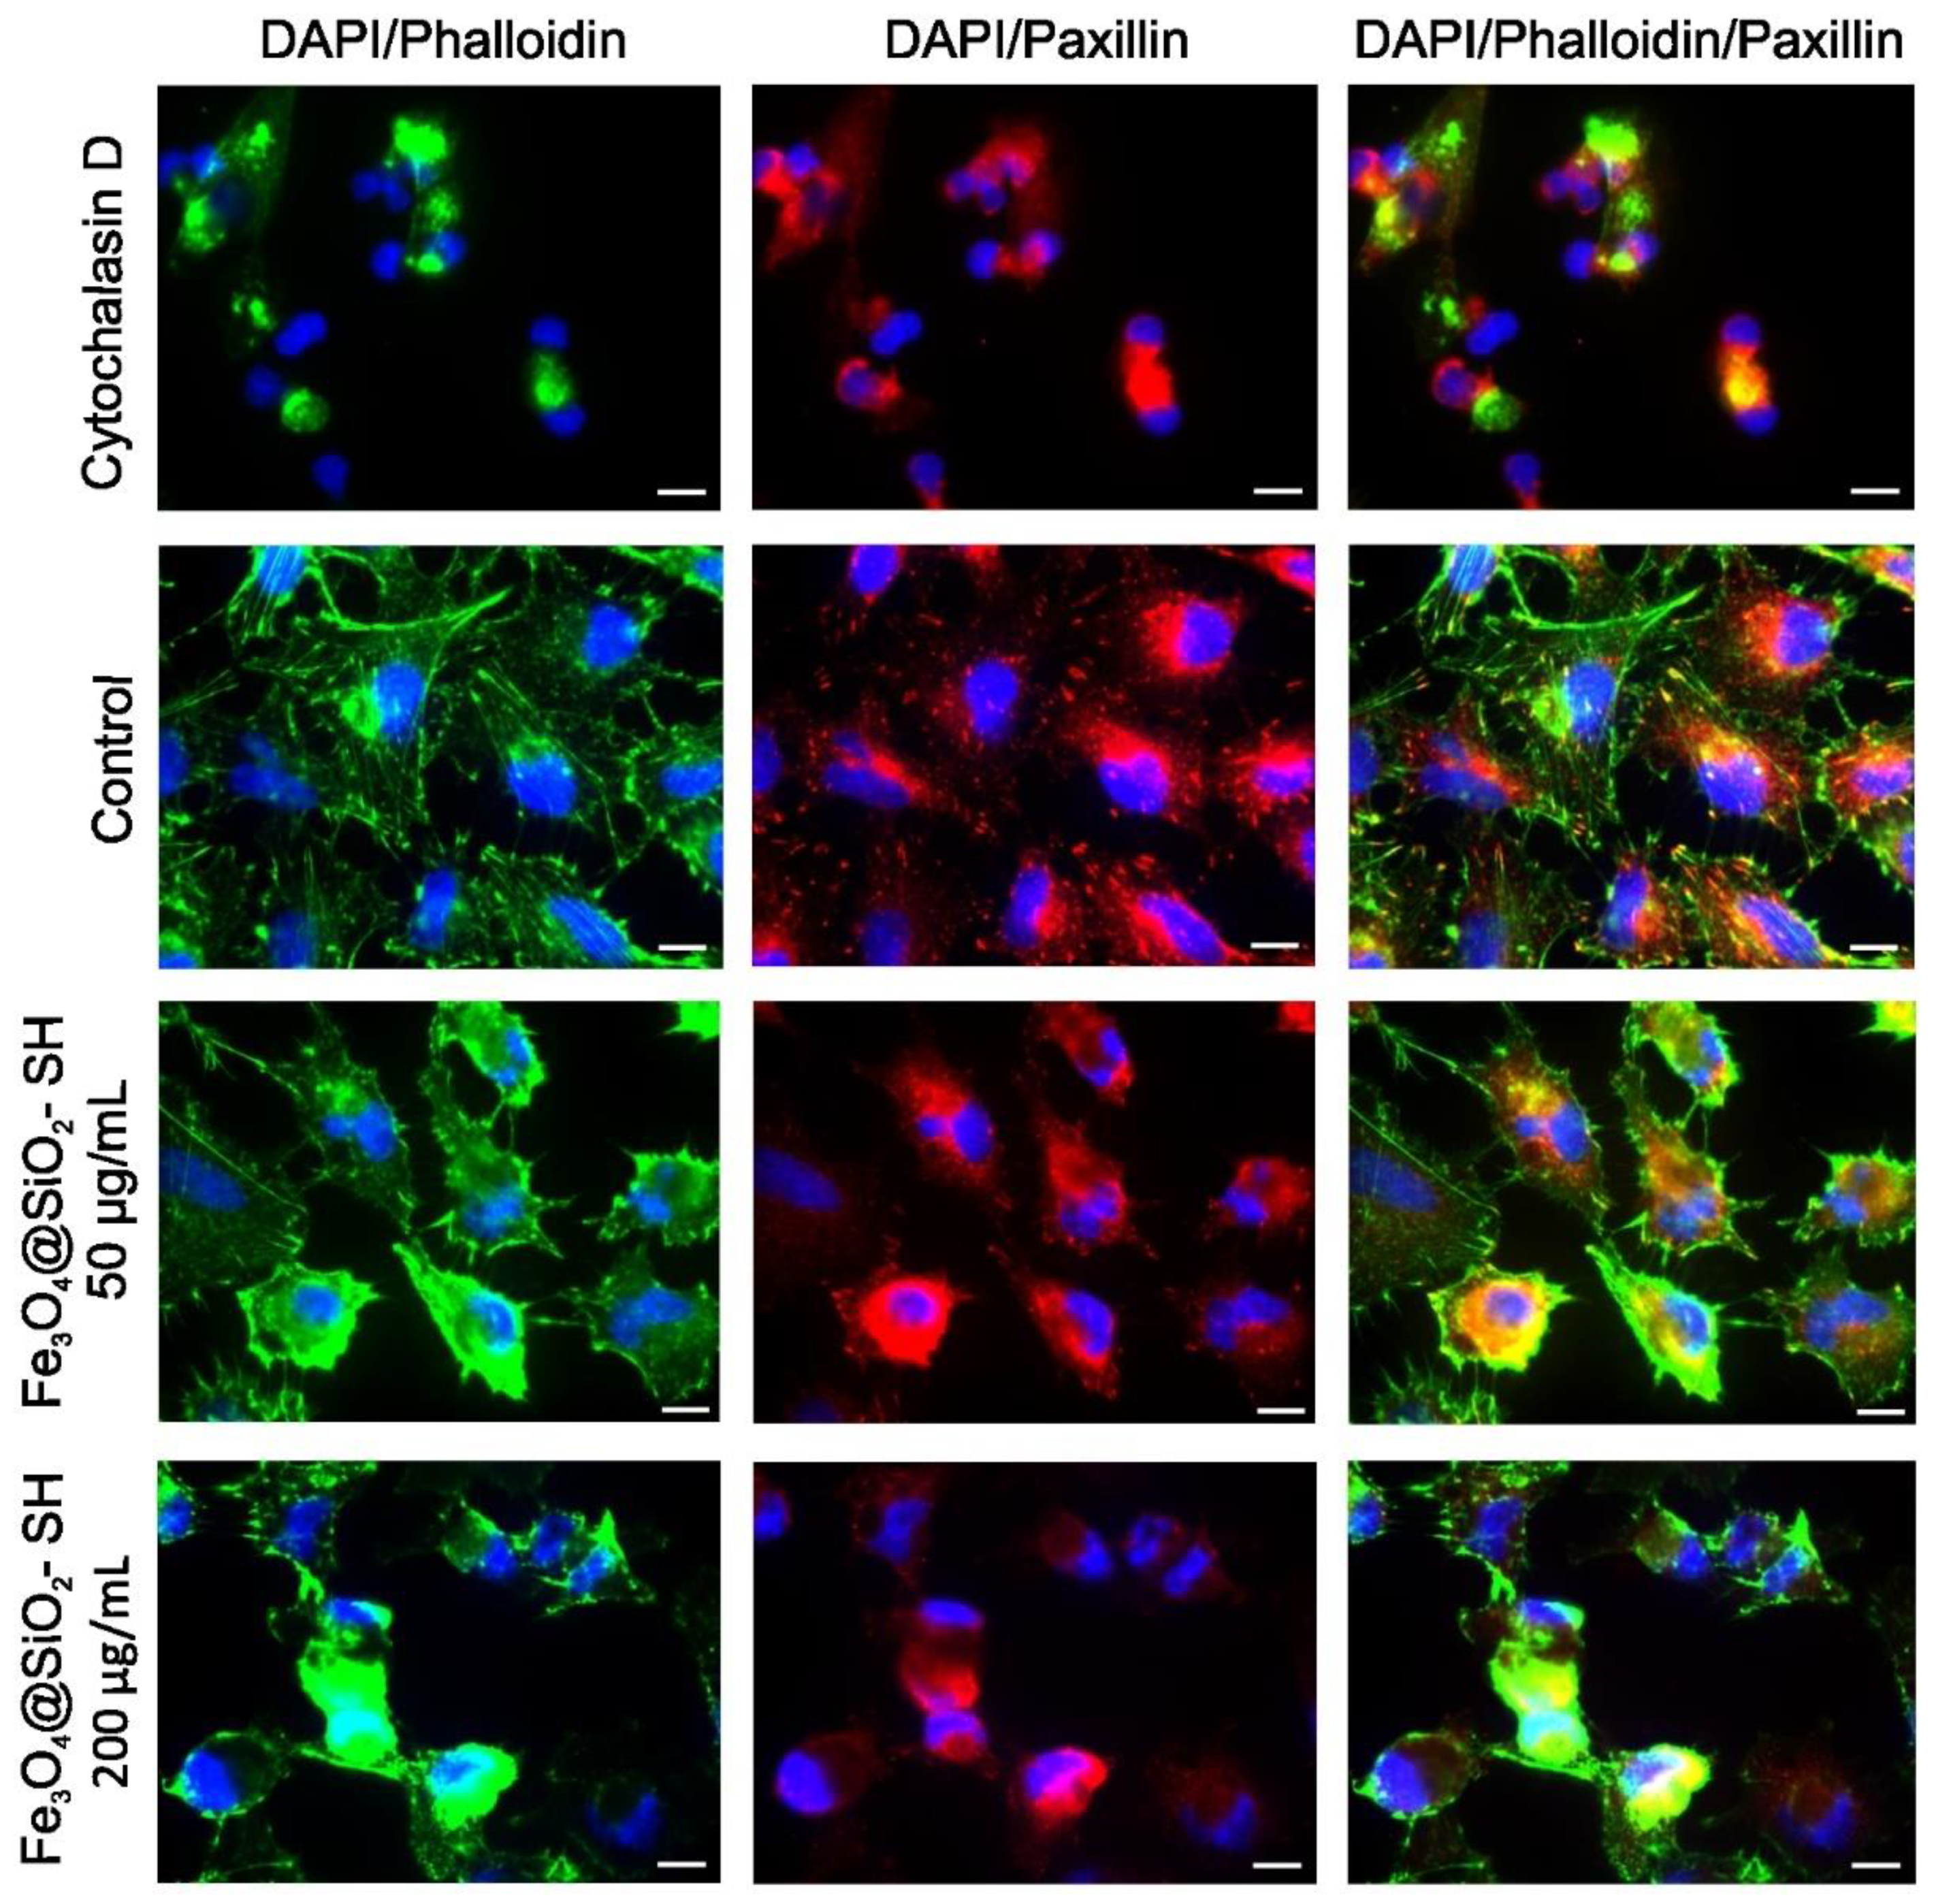
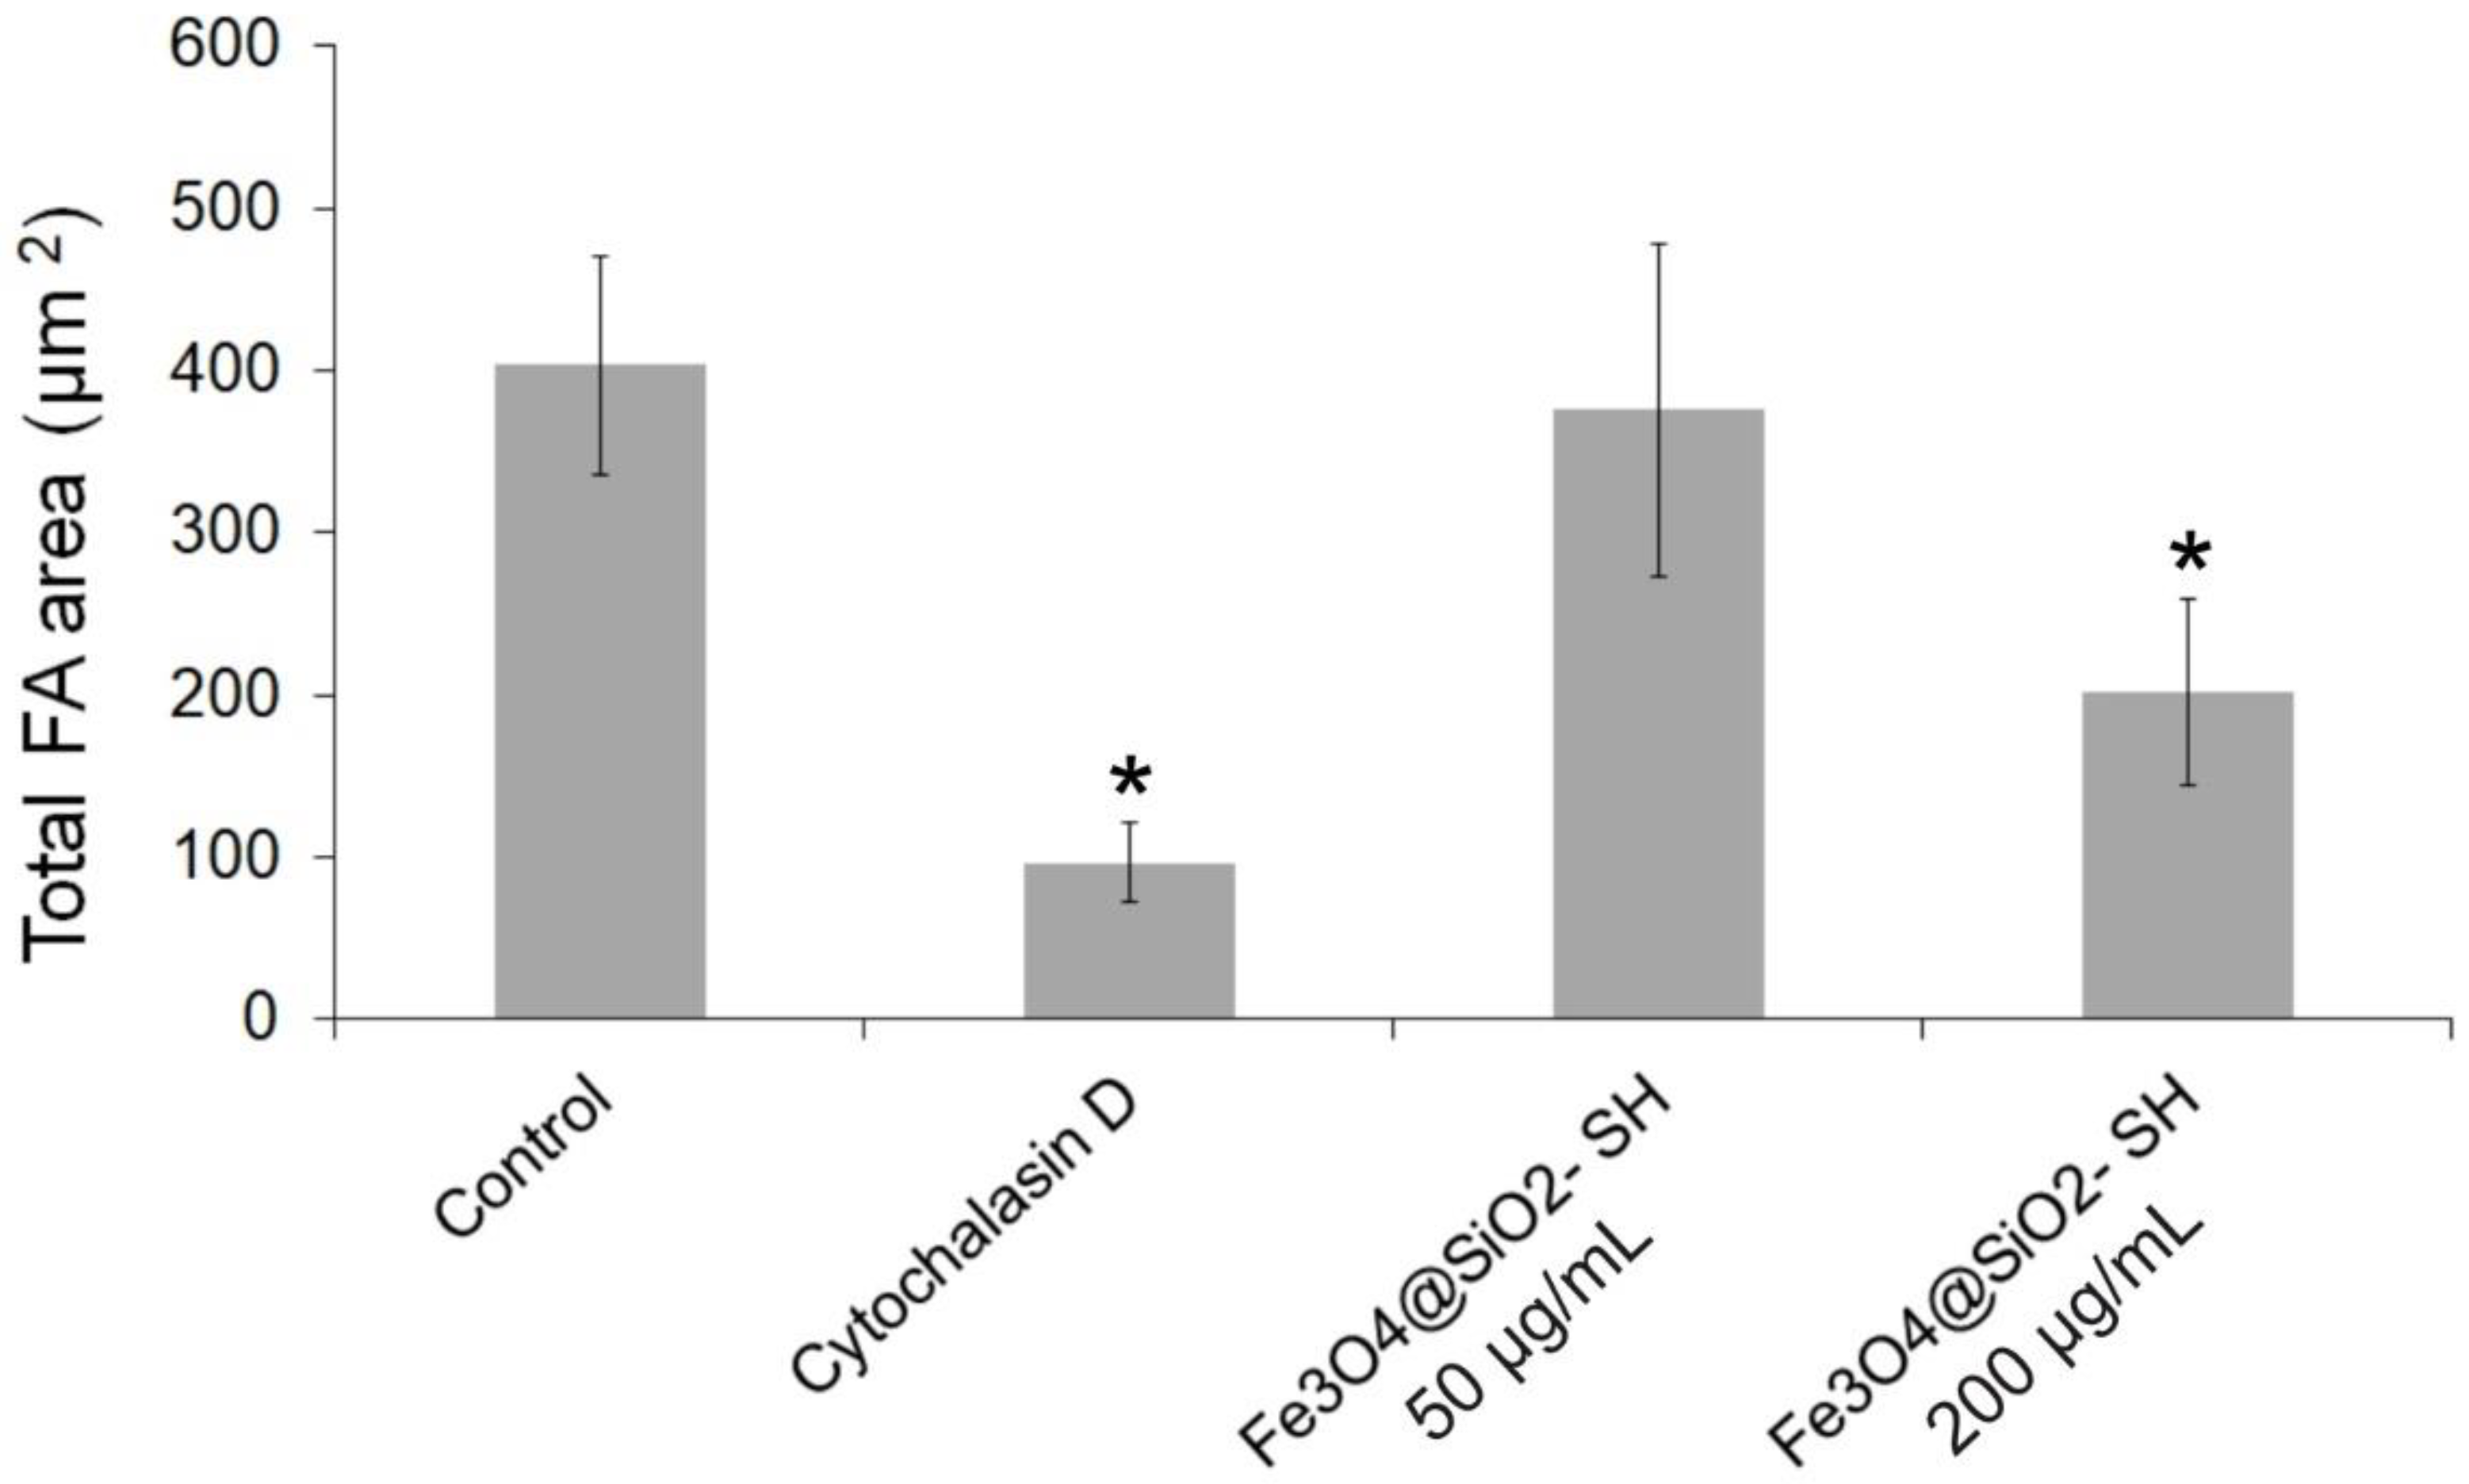
2.4. Effect of Fe3O4@SiO2-SH Nanoparticles on Cell Cytoskeleton and Focal Adhesions (FAs)
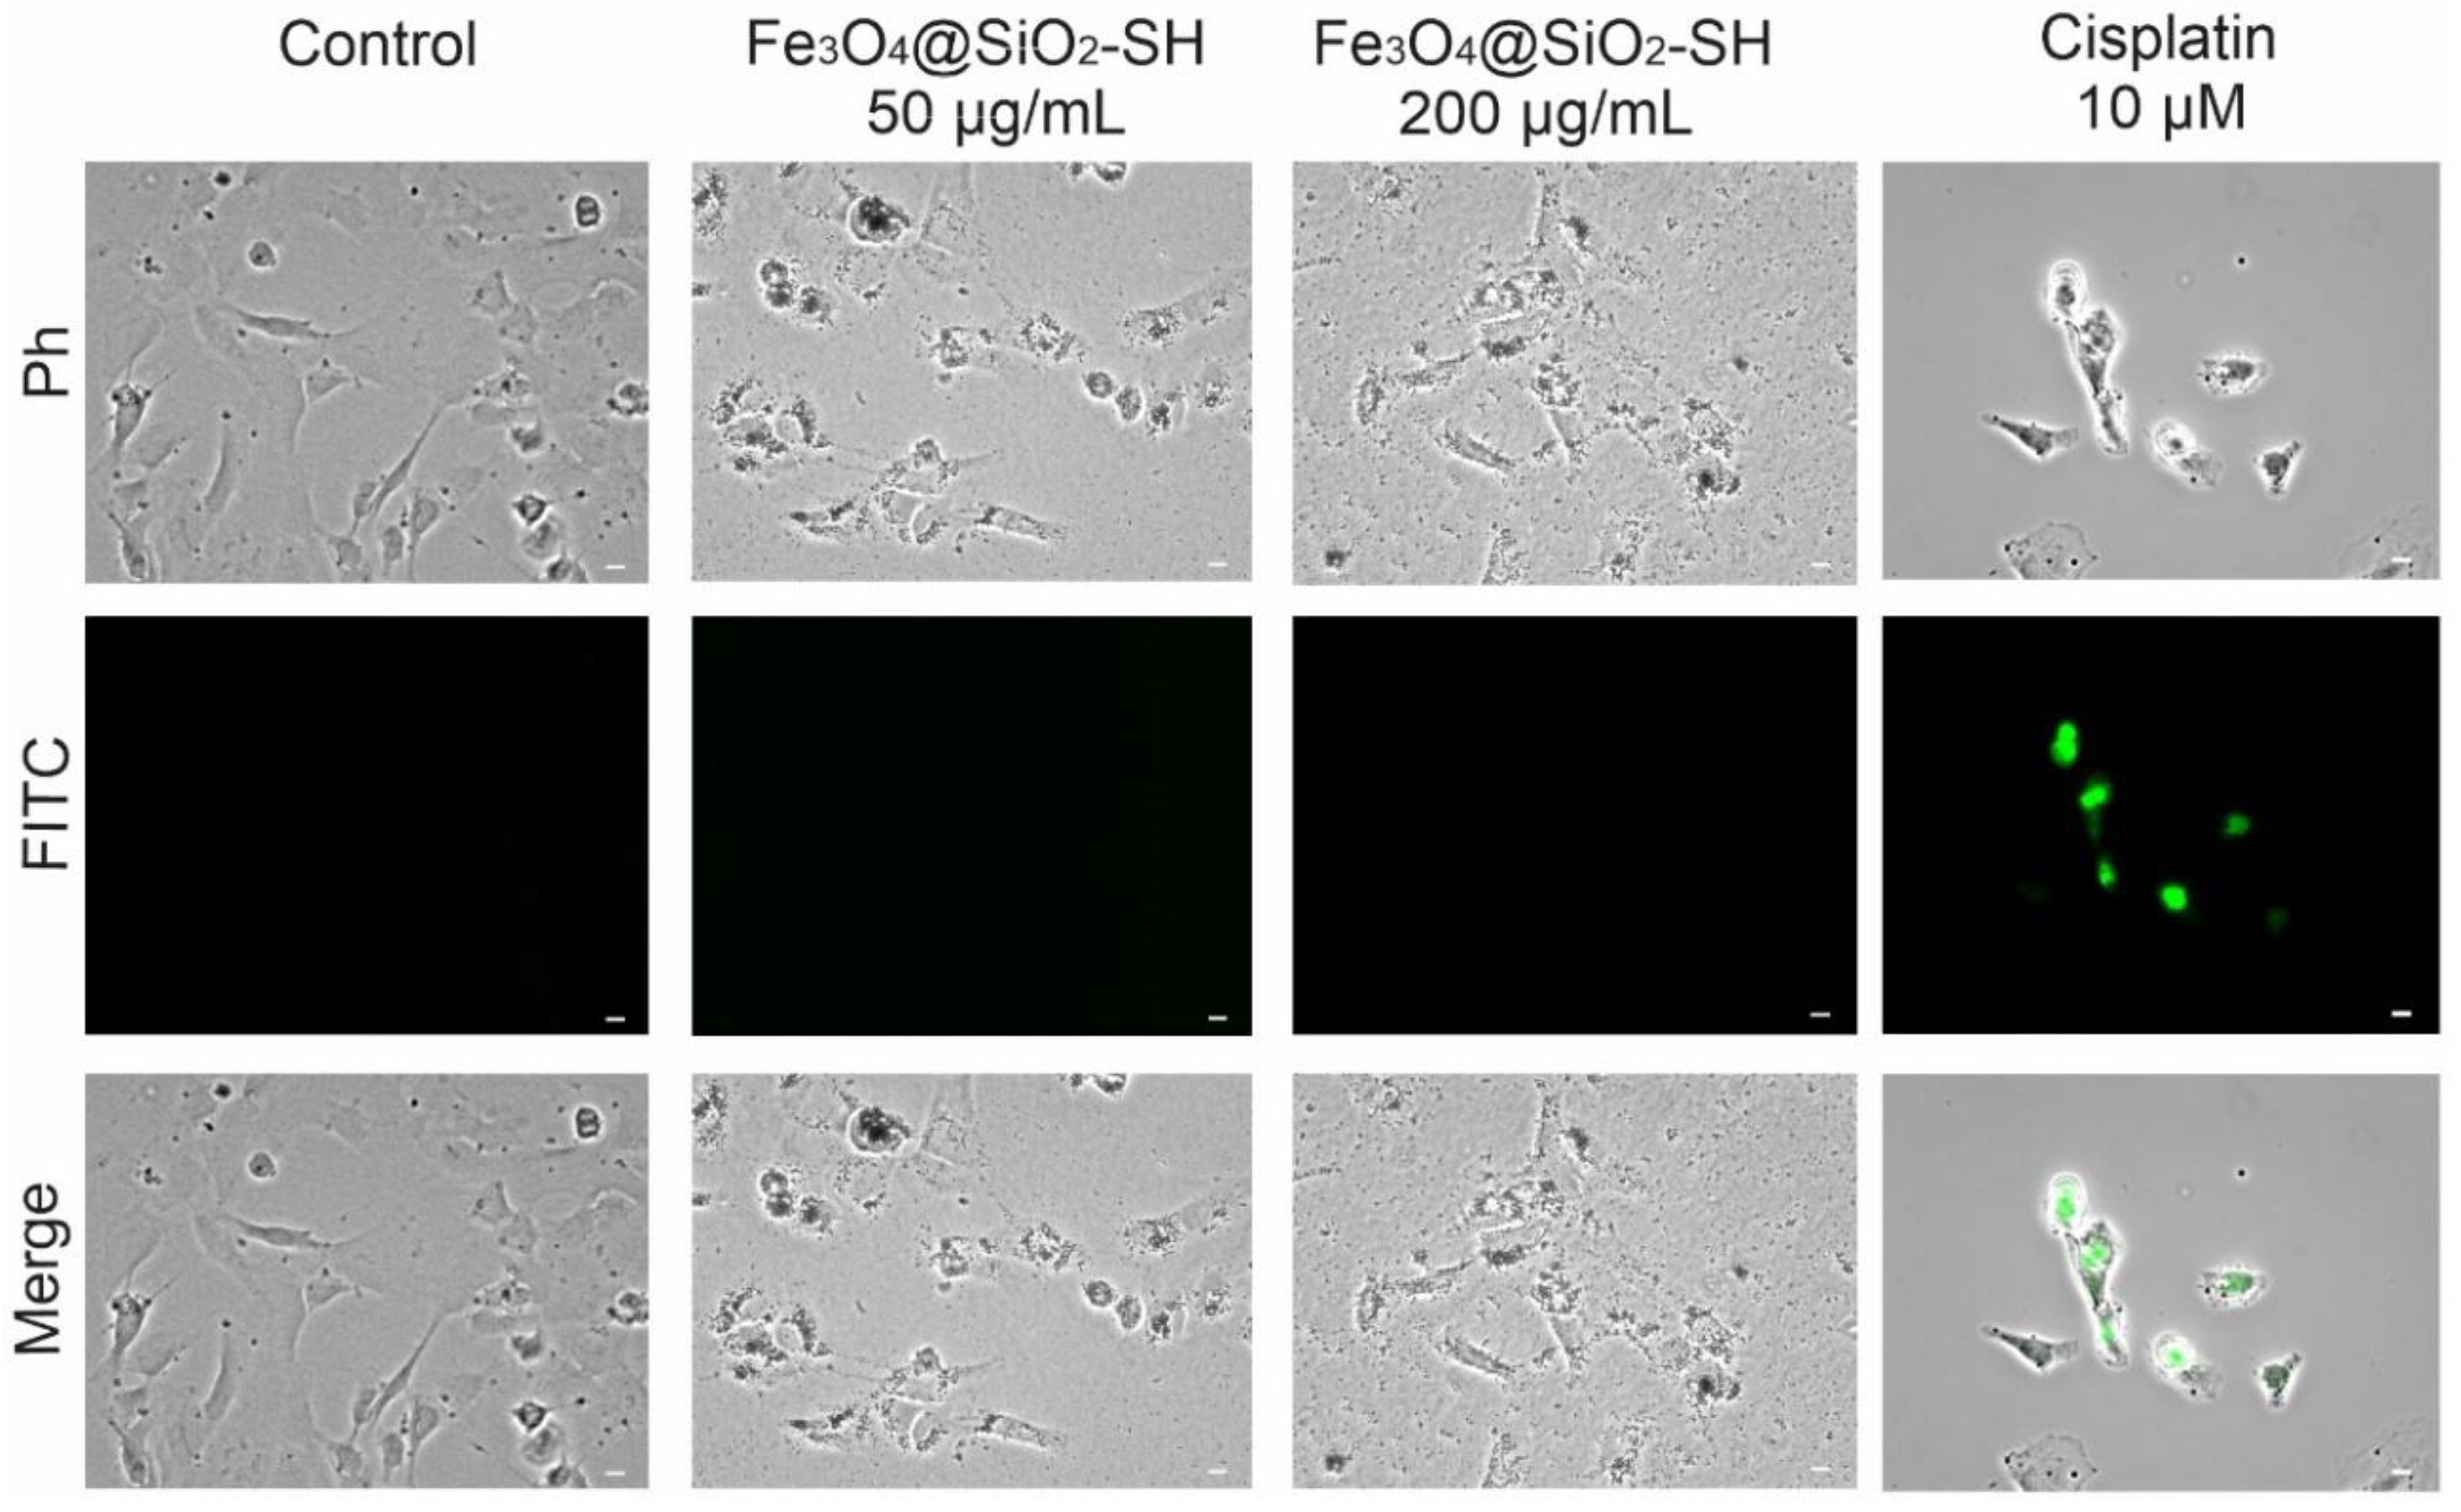
2.5. Detection of Apoptosis
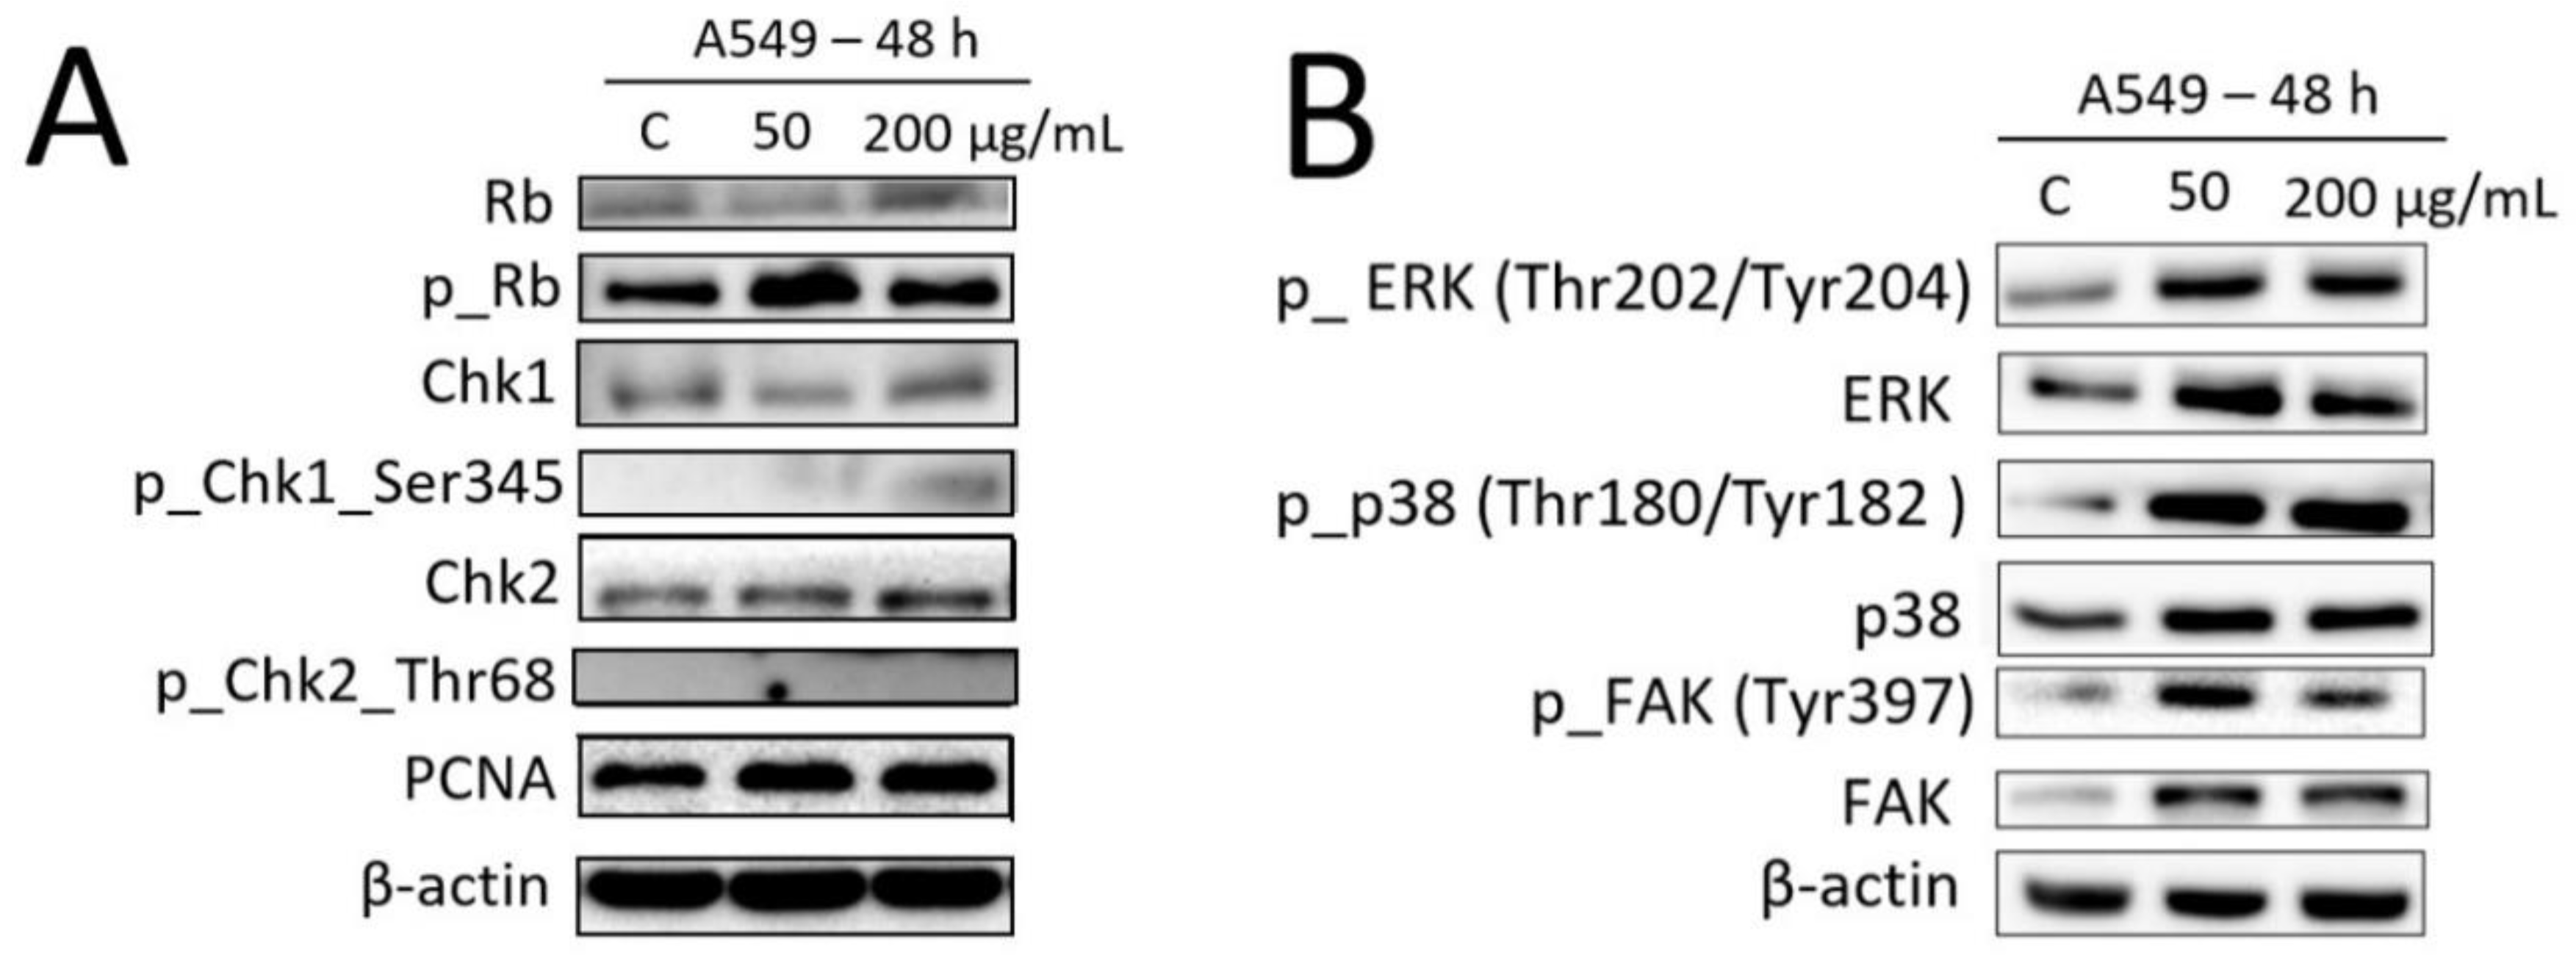
2.6. Effects of Fe3O4@SiO2-SH Nanoparticles on the Selected Proteins Involved in Cell Cycle Progression and FA Signaling
3. Discussion and Conclusions
4. Materials and Methods
4.1. Preparation of Fe3O4@SiO2-SH Nanoparticles
4.2. Fundamental Characterizations of Fe3O4@SiO2-SH Nanoparticles
4.3. Cell Cultures and Culture Conditions
4.4. Real-Time Cell Proliferation and Adhesion Assays with the xCELLigence System
4.5. Trypan Blue Exclusion Test for Cell Proliferation and Viability
4.6. Cell Cycle Distribution and Internucleosomal DNA Fragmentation Analysis
4.7. Immunofluorescence Staining of β-Tubulin, Paxillin, and Actin
4.8. Analysis of Apoptosis
4.9. Western Blot Analysis
4.10. Statistical Analysis
Author Contributions
Funding
Acknowledgments
Conflicts of Interest
Abbreviations
| MNPs | Magnetic nanoparticles |
| MPI | Magnetic particle imaging |
| MSA | Mercaptosuccinic acid |
| DMSA | Dimercaptosuccinic acid |
| FT-IR | Fourier transform infrared spectroscopy |
| DSC | Differential scanning calorimetry |
| SEM | Scanning electron microscopy |
| DMSO | Dimethyl sulfoxide |
| DAPI | 4’,6-diamidino-2-phenylindole |
| ECM | Extracellular matrix |
| DLS | Dynamic light scattering |
| PI | Polydispersity index |
| FAK | Focal adhesion kinase |
| FAs | Focal adhesions |
| Ph | Optical phase-contrast microscopy |
| MAPK | Mitogen-activated protein kinases |
| ERK | Extracellular signal regulated kinase |
| p38 | p38 MAP kinase |
| ATR/Chk1 | Ataxia telangiectasia and Rad3-related protein kinase/checkpoint kinase 1 |
| ATM/Chk2 | Ataxia-telangiectasia mutated kinase/checkpoint kinase 2 |
| Rb | Retinoblastoma protein |
| PBS | Phosphate-buffered saline |
| TBS | Tris-buffered salineMinimum Essential Medium Eagle |
| MEM | Dulbecco’s Modified Eagle’s Medium |
| DMEMTRITC | Tetramethylrhodamine |
| BSA | Bovie serum albumin |
| PVDF | Polyvinylidene fluoride |
References
- Wang, Y.; Xu, C.; Ow, H. Commercial Nanoparticles for Stem cell labeling and tracking. Theranostics 2013, 3, 544–560. [Google Scholar] [CrossRef]
- Wilhelm, C.; Gazeau, F. Universal cell labelling with anionic magnetic nanoparticles. Biomaterials 2008, 29, 3161–3174. [Google Scholar] [CrossRef]
- Malvindi, M.A.; Greco, A.; Conversano, F.; Figuerola, A.; Corti, M.; Bonora, M.; Lascialfari, A.; Doumari, H.A.; Moscardini, M.; Cingolani, R.; et al. Magnetic/Silica nanocomposites as dual-mode contrast agents for combined magnetic resonance imaging and ultrasonography. Adv. Funct. Mater. 2011, 21, 2548–2555. [Google Scholar] [CrossRef]
- Yi, P.; Chen, G.; Zhang, H.; Tian, F.; Tana, B.; Dai, J.; Wang, Q.; Deng, Z. Magnetic resonance imaging of Fe3O4@SiO2-labeled human mesenchymal stem cells in mice at 11.7 T. Biomaterials 2013, 34, 3010–3019. [Google Scholar] [CrossRef] [PubMed]
- Talebloo, N.; Gudi, M.; Robertson, N.; Wang, P. Magnetic Particle Imaging: Current Applications in Biomedical Research. J. Magn. Reson. Imaging. 2020, 51, 1659–1668. [Google Scholar] [CrossRef] [PubMed]
- Klostergaard, J.; Seeney, C.E. Magnetic nanovectors for drug delivery. Nanomedicine 2012, 8, S37–S50. [Google Scholar] [CrossRef]
- Rudzka, K.; Viota, J.L.; Muñoz-Gamez, J.A.; Carazo, A.; Ruiz-Extremera, A.; Delgado, Á.V. Nanoengineering of doxorubicin delivery systems with functionalized maghemite nanoparticles. Colloids Surf. B Biointerfaces 2013, 111, 88–96. [Google Scholar] [CrossRef] [PubMed]
- Olsvik, O.; Popovic, T.; Skjerve, E.; Cudjoe, K.S.; Hornes, E.; Ugelstad, J.; Uhlen, M. Magnetic separation techniques in diagnostic microbiology. Clin. Microbiol. Rev. 1994, 7, 43–54. [Google Scholar] [CrossRef]
- Haik, Y.; Pai, V.; Chen, C.-J. Development of magnetic device for cell separation. J. Magn. Magn. Mater. 1999, 194, 254–261. [Google Scholar] [CrossRef]
- Brero, F.; Albino, M.; Antoccia, A.; Arosio, P.; Avolio, M.; Berardinelli, F.; Bettega, D.; Calzolari, P.; Ciocca, M.; Corti, M.; et al. Hadron Therapy, Magnetic Nanoparticles and Hyperthermia: A Promising Combined Tool for Pancreatic Cancer Treatment. Nanomaterials 2020, 10, 1919. [Google Scholar] [CrossRef]
- Nemec, S.; Kralj, S.; Wilhelm, C.; Abou-Hassan, A.; Rols, M.-P.; Kolosnjaj-Tabi, J. Comparison of Iron Oxide Nanoparticles in Photothermia and Magnetic Hyperthermia: Effects of Clustering and Silica Encapsulation on Nanoparticles’ Heating Yield. Appl. Sci. 2020, 10, 7322. [Google Scholar] [CrossRef]
- McBain, S.C.; Yiu, H.H.; Dobson, J. Magnetic nanoparticles for gene and drug delivery. Int. J. Nanomed. 2008, 3, 169–180. [Google Scholar]
- Wu, W.; He, Q.; Jiang, C. Magnetic iron oxide nanoparticles: Synthesis and surface functionalization strategies. Nanoscale Res. Lett. 2008, 3, 397–415. [Google Scholar] [CrossRef] [PubMed] [Green Version]
- Kunzmann, A.; Andersson, B.; Vogt, C.; Feliu, N.; Ye, F.; Gabrielsson, S.; Toprak, M.S.; Buerki-Thurnherr, T.; Laurent, S.; Vahter, M.; et al. Efficient internalization of silica-coated iron oxide nanoparticles of different sizes by primary human macrophages and dendritic cells. Toxicol. Appl. Pharmacol. 2011, 25, 81–93. [Google Scholar] [CrossRef] [Green Version]
- Davila-Ibanez, A.B.; Salgueirino, V.; Martinez-Zorzano, V.; Marino-Fernandez, R.; Garcia-Lorenzo, A.; Maceira-Campos, M.; Muñoz-Ubeda, M.; Junquera, E.; Aicart, E.; Rivas, J.; et al. Magnetic Silica Nanoparticle Cellular Uptake and Cytotoxicity regulated by Electrostatic Polyelectrolytes-DNA Loading at their Surface. ACS Nano 2012, 6, 747–759. [Google Scholar] [CrossRef]
- Biju, V. Chemical modifications and bioconjugate reactions of nanomaterials for sensing, imaging, drug delivery and therapy. Chem. Soc. Rev. 2014, 43, 744–764. [Google Scholar] [CrossRef]
- Liberman, A.; Mendez, N.; Trogler, W.C.; Kummel, A.C. Synthesis and surface functionalization of silica nanoparticles for nanomedicine. Surf. Sci. Rep. 2014, 69, 132–158. [Google Scholar] [CrossRef] [Green Version]
- Nakamura, M.; Ishimura, K. Synthesis and characterization of organosilica nanoparticles prepared from 3-mercaptopropyltrimethoxysilane as the single silica source. J. Phys. Chem. C 2007, 111, 18892–18898. [Google Scholar] [CrossRef]
- Mun, E.A.; Williams, A.C.; Khutoryanskiy, V.V. Adhesion of thiolated silica nanoparticles to urinary bladder mucosa: Effects of PEGylation, thiol content and particle size. Int. J. Pharmaceut. 2016, 512, 32–38. [Google Scholar] [CrossRef] [Green Version]
- Yan, Y.; Fu, J.; Wang, T.F.; Lu, X.Y. Controlled release of silyl ether camptothecin from thiol-ene click chemistry-functionalized mesoporous silica nanoparticles. Acta Biomater. 2017, 51, 471–478. [Google Scholar] [CrossRef]
- Mejias, R.; Gutierrez, L.; Salas, G.; Perez-Yague, S.; Zotes, T.M.; Lazaro, F.J.; Morales, M.P.; Barber, D.F. Long term biotransformation and toxicity of dimercaptosuccinic acid-coated magnetic nanoparticles support their use in biomedical applications. J. Control. Release 2013, 171, 225–233. [Google Scholar] [CrossRef] [PubMed] [Green Version]
- De Lima, R.; Oliveira, J.L.; Murakami, P.S.K.; Molina, M.M.; Itri, R.; Haddad, P.S.; Seabra, A.B. Iron oxide nanoparticles show no toxicity in the comet assay in lymphocytes: A promising vehicle as a nitric oxide releasing nanocarrier in biomedical applications. J. Phys. Conf. Ser. 2013, 429, 012021. [Google Scholar] [CrossRef] [Green Version]
- Seabra, A.B.; Pasquôto, T.; Ferrarini, A.C.F.; da Cruz Santos, M.; Haddad, P.S.; de Lima, R. Preparation, Characterization, Cytotoxicity, and Genotoxicity Evaluations of Thiolated-and S-Nitrosated Superparamagnetic Iron Oxide Nanoparticles: Implications for Cancer Treatment. Chem. Res. Toxicol. 2014, 27, 1207–1218. [Google Scholar] [CrossRef] [PubMed]
- Liu, Y.; Chen, Z.; Gu, N.; Wang, J. Effects of DMSA coated Fe3O4 magnetic nanoparticles on global gene expression of mouse macrophage RAW264.7 cells. Toxicol. Lett. 2011, 205, 130–139. [Google Scholar] [CrossRef]
- Ge, G.; Wu, H.; Xiong, F.; Zhang, Y.; Guo, Z.; Bian, Z.; Xu, J.; Gu, C.; Gu, N.; Chen, X.; et al. The cytotoxicity evaluation of magnetic iron oxide nanoparticles on human aortic endothelial cells. Nanoscale Res. Lett. 2013, 8, 215. [Google Scholar] [CrossRef] [Green Version]
- Oh, Y.; Je, J.Y.; Moorthy, M.S.; Seo, H.; Cho, W.H. pH and NIR-light-responsive magnetic iron oxide nanoparticles for mitochondria-mediated apoptotic cell death induced by chemo-photothermal therapy. Int. J. Pharm. 2017, 531, 1–3. [Google Scholar] [CrossRef]
- Pisanic, T.R., 2nd; Blackwell, J.D.; Shubayev, V.I.; Finones, R.R.; Jin, S. Nanotoxicity of iron oxide nanoparticle internalization in growing neurons. Biomaterials 2007, 28, 2572–2581. [Google Scholar] [CrossRef]
- Zhang, J.M.; Zhai, S.R.; Zhai, B.; An, Q.D.; Tian, G. Crucial Factors Affecting the Physicochemical Properties of Sol–gel Produced Fe3O4@SiO2–NH2 Core–shell Nanomaterials. J. Sol. Gel Sci. Technol. 2012, 64, 347–357. [Google Scholar] [CrossRef]
- Stöber, W.; Fink, A.; Bohn, E. Controlled Growth of Monodisperse Silica Spheres in the Micron Size Range. J. Colloid Interface Sci. 1968, 26, 62–69. [Google Scholar] [CrossRef]
- Wang, Z.; Xu, J.; Hu, Y.; Zhao, H.; Zhou, J.; Liu, Y.; Lou, Z.; Xu, X. Functional Nanomaterials: Study on Aqueous Hg(II) Adsorption by Magnetic Fe3O4@SiO2-SH Nanoparticles. J. Taiwan Inst. Chem. Eng. 2016, 60, 394–402. [Google Scholar] [CrossRef]
- Xing, Z.; Zhu, L.; Jackson, J.A.; Gabos, S.; Sun, X.J.; Wang, X.B.; Xu, X. Dynamic monitoring of cytotoxicity on microelectronic sensors. Chem. Res. Toxicol. 2005, 18, 154–161. [Google Scholar] [CrossRef] [PubMed]
- Xing, J.Z.; Zhu, L.; Gabos, S.; Xie, L. Microelectronic cell sensor assay for detection of cytotoxicity and prediction of acute toxicity. Toxicol. In Vitro 2006, 20, 995–1004. [Google Scholar] [CrossRef] [PubMed]
- Smith, J.; Tho, L.M.; Xu, N.; Gillespie, D.A. The ATM-Chk2 and ATR-Chk1 pathways in DNA damage signaling and cancer. Adv. Cancer Res. 2010, 108, 73–112. [Google Scholar] [PubMed]
- Giacinti, C.; Giordano, A. RB and cell cycle progression. Oncogene 2006, 25, 5220–5227. [Google Scholar] [CrossRef] [Green Version]
- Soenen, S.J.H.; Nuytten, N.; De Meyer, S.F.; De Smedt, S.C.; De Cuyper, M. High intracellular iron oxide nanoparticle concentrations affect cellular cytoskeleton and focal adhesion kinase-mediated signaling. Small 2010, 6, 832–842. [Google Scholar] [CrossRef]
- Choudhury, D.; Xavier, P.L.; Chaudhari, K.; John, R.; Dasgupta, A.K.; Pradeep, T.; Chakrabarti, G. Unprecedented inhibition of tubulin polymerization directed by gold nanoparticles inducing cell cycle arrest and apoptosis. Nanoscale 2013, 5, 4476–4489. [Google Scholar] [CrossRef]
- Schaller, M. Paxillin: A focal adhesion-associated adaptor protein. Oncogene 2001, 20, 6459–6472. [Google Scholar] [CrossRef] [Green Version]
- Yue, J.; Xie, M.; Gou, X.; Lee, P.; Schneider, M.D.; Wu, X. Microtubules regulate focal adhesion dynamics through MAP4K4. Dev. Cell. 2014, 31, 572–585. [Google Scholar] [CrossRef] [Green Version]
- Rodriguez, O.C.; Schaefer, A.W.; Mandato, C.A.; Forscher, P.; Bement, W.M.; Waterman-Storer, C.M. Conserved microtubule-actin interactions in cell movement and morphogenesis. Nat. Cell Biol. 2003, 5, 599–609. [Google Scholar] [CrossRef]
- Ibrahim, M.; Schoelermann, J.; Mustafa, K.; Cimpan, M.R. TiO2 nanoparticles disrupt cell adhesion and the architecture of cytoskeletal networks of human osteoblast-like cells in a size dependent manner. J. Biomed. Mater. Res. A 2018, 106, 2582–2593. [Google Scholar] [CrossRef]
- Královec, K.; Havelek, R.; Koutová, D.; Veverka, P.; Kubíčková, L.; Brázda, P.; Kohout, J.; Herynek, V.; Vosmanská, M.; Kaman, O. Magnetic nanoparticles of Ga-substituted ε-Fe2O3 for biomedical applications: Magnetic properties, transverse relaxivity, and effects of silica-coated particles on cytoskeletal networks. J. Biomed. Mater. Res. A 2020, 108, 1563–1578. [Google Scholar] [CrossRef] [PubMed]
- Salasznyk, R.M.; Klees, R.F.; Williams, W.A.; Boskey, A.; Plopper, G.E. Focal adhesion kinase signaling pathways regulate the osteogenic differentiation of human mesenchymal stem cells. Exp. Cell. Res. 2007, 313, 22–37. [Google Scholar] [CrossRef] [PubMed] [Green Version]
- Mitra, S.K.; Hanson, D.A.; Schlaepfer, D.D. Focal adhesion kinase: In command and control of cell motility. Nat. Rev. Mol. Cell. Biol. 2005, 6, 56–68. [Google Scholar] [CrossRef] [PubMed]
- Webb, D.J.; Donais, K.; Whitmore, L.A.; Thomas, S.M.; Turner, C.E.; Parsons, J.T.; Horwitz, A.F. FAK–Src signalling through paxillin, ERK and MLCK regulates adhesion disassembly. Nat. Cell. Biol. 2004, 6, 54–161. [Google Scholar] [CrossRef]
- Owen, J.D.; Ruest, P.J.; Fry, D.W.; Hanks, S.K. Induced focal adhesion kinase (FAK) expression in FAK-null cells enhances cell spreading and migration requiring both auto- and activation loop phosphorylation sites and inhibits adhesion-dependent tyrosine phosphorylation of Pyk2. Mol. Cell. Biol. 1999, 19, 4806–4818. [Google Scholar] [CrossRef] [Green Version]
- Seko, Y.; Takahashi, N.; Tobe, K.; Kadowaki, T.; Yazaki, Y. Pulsatile stretch activates mitogen-activated protein kinase (MAPK) family members and focal adhesion kinase [p125(FAK)] in cultured rat cardiac myocytes. Biochem. Biophys. Res. Commun. 1999, 259, 8–14. [Google Scholar] [CrossRef]
- Velarde, V.; Ullian, M.E.; Morinelli, T.A.; Mayfield, R.K.; Jaffa, A.A. Mechanisms of MAPK activation by bradykinin in vascular smooth muscle cells. Am. J. Physiol. Cell. Physiol. 1999, 277, C253–C261. [Google Scholar] [CrossRef]
- Sáenz-Morales, D.; Conde, E.; Escribese, M.M.; García-Martos, M.; Alegre, L.; Blanco-Sánchez, I.; García-Bermejo, M.L. ERK1/2 mediates cytoskeleton and focal adhesion impairment in proximal epithelial cells after renal ischemia. Cell. Physiol. Biochem. 2009, 23, 285–294. [Google Scholar] [CrossRef]


Publisher’s Note: MDPI stays neutral with regard to jurisdictional claims in published maps and institutional affiliations. |
© 2020 by the authors. Licensee MDPI, Basel, Switzerland. This article is an open access article distributed under the terms and conditions of the Creative Commons Attribution (CC BY) license (http://creativecommons.org/licenses/by/4.0/).
Share and Cite
Královec, K.; Melounková, L.; Slováková, M.; Mannová, N.; Sedlák, M.; Bartáček, J.; Havelek, R. Disruption of Cell Adhesion and Cytoskeletal Networks by Thiol-Functionalized Silica-Coated Iron Oxide Nanoparticles. Int. J. Mol. Sci. 2020, 21, 9350. https://doi.org/10.3390/ijms21249350
Královec K, Melounková L, Slováková M, Mannová N, Sedlák M, Bartáček J, Havelek R. Disruption of Cell Adhesion and Cytoskeletal Networks by Thiol-Functionalized Silica-Coated Iron Oxide Nanoparticles. International Journal of Molecular Sciences. 2020; 21(24):9350. https://doi.org/10.3390/ijms21249350
Chicago/Turabian StyleKrálovec, Karel, Lucie Melounková, Marcela Slováková, Nikola Mannová, Miloš Sedlák, Jan Bartáček, and Radim Havelek. 2020. "Disruption of Cell Adhesion and Cytoskeletal Networks by Thiol-Functionalized Silica-Coated Iron Oxide Nanoparticles" International Journal of Molecular Sciences 21, no. 24: 9350. https://doi.org/10.3390/ijms21249350