Genome-Wide DNA Alterations in X-Irradiated Human Gingiva Fibroblasts

 , , , ,
Abstract
:1. Introduction
2. Results
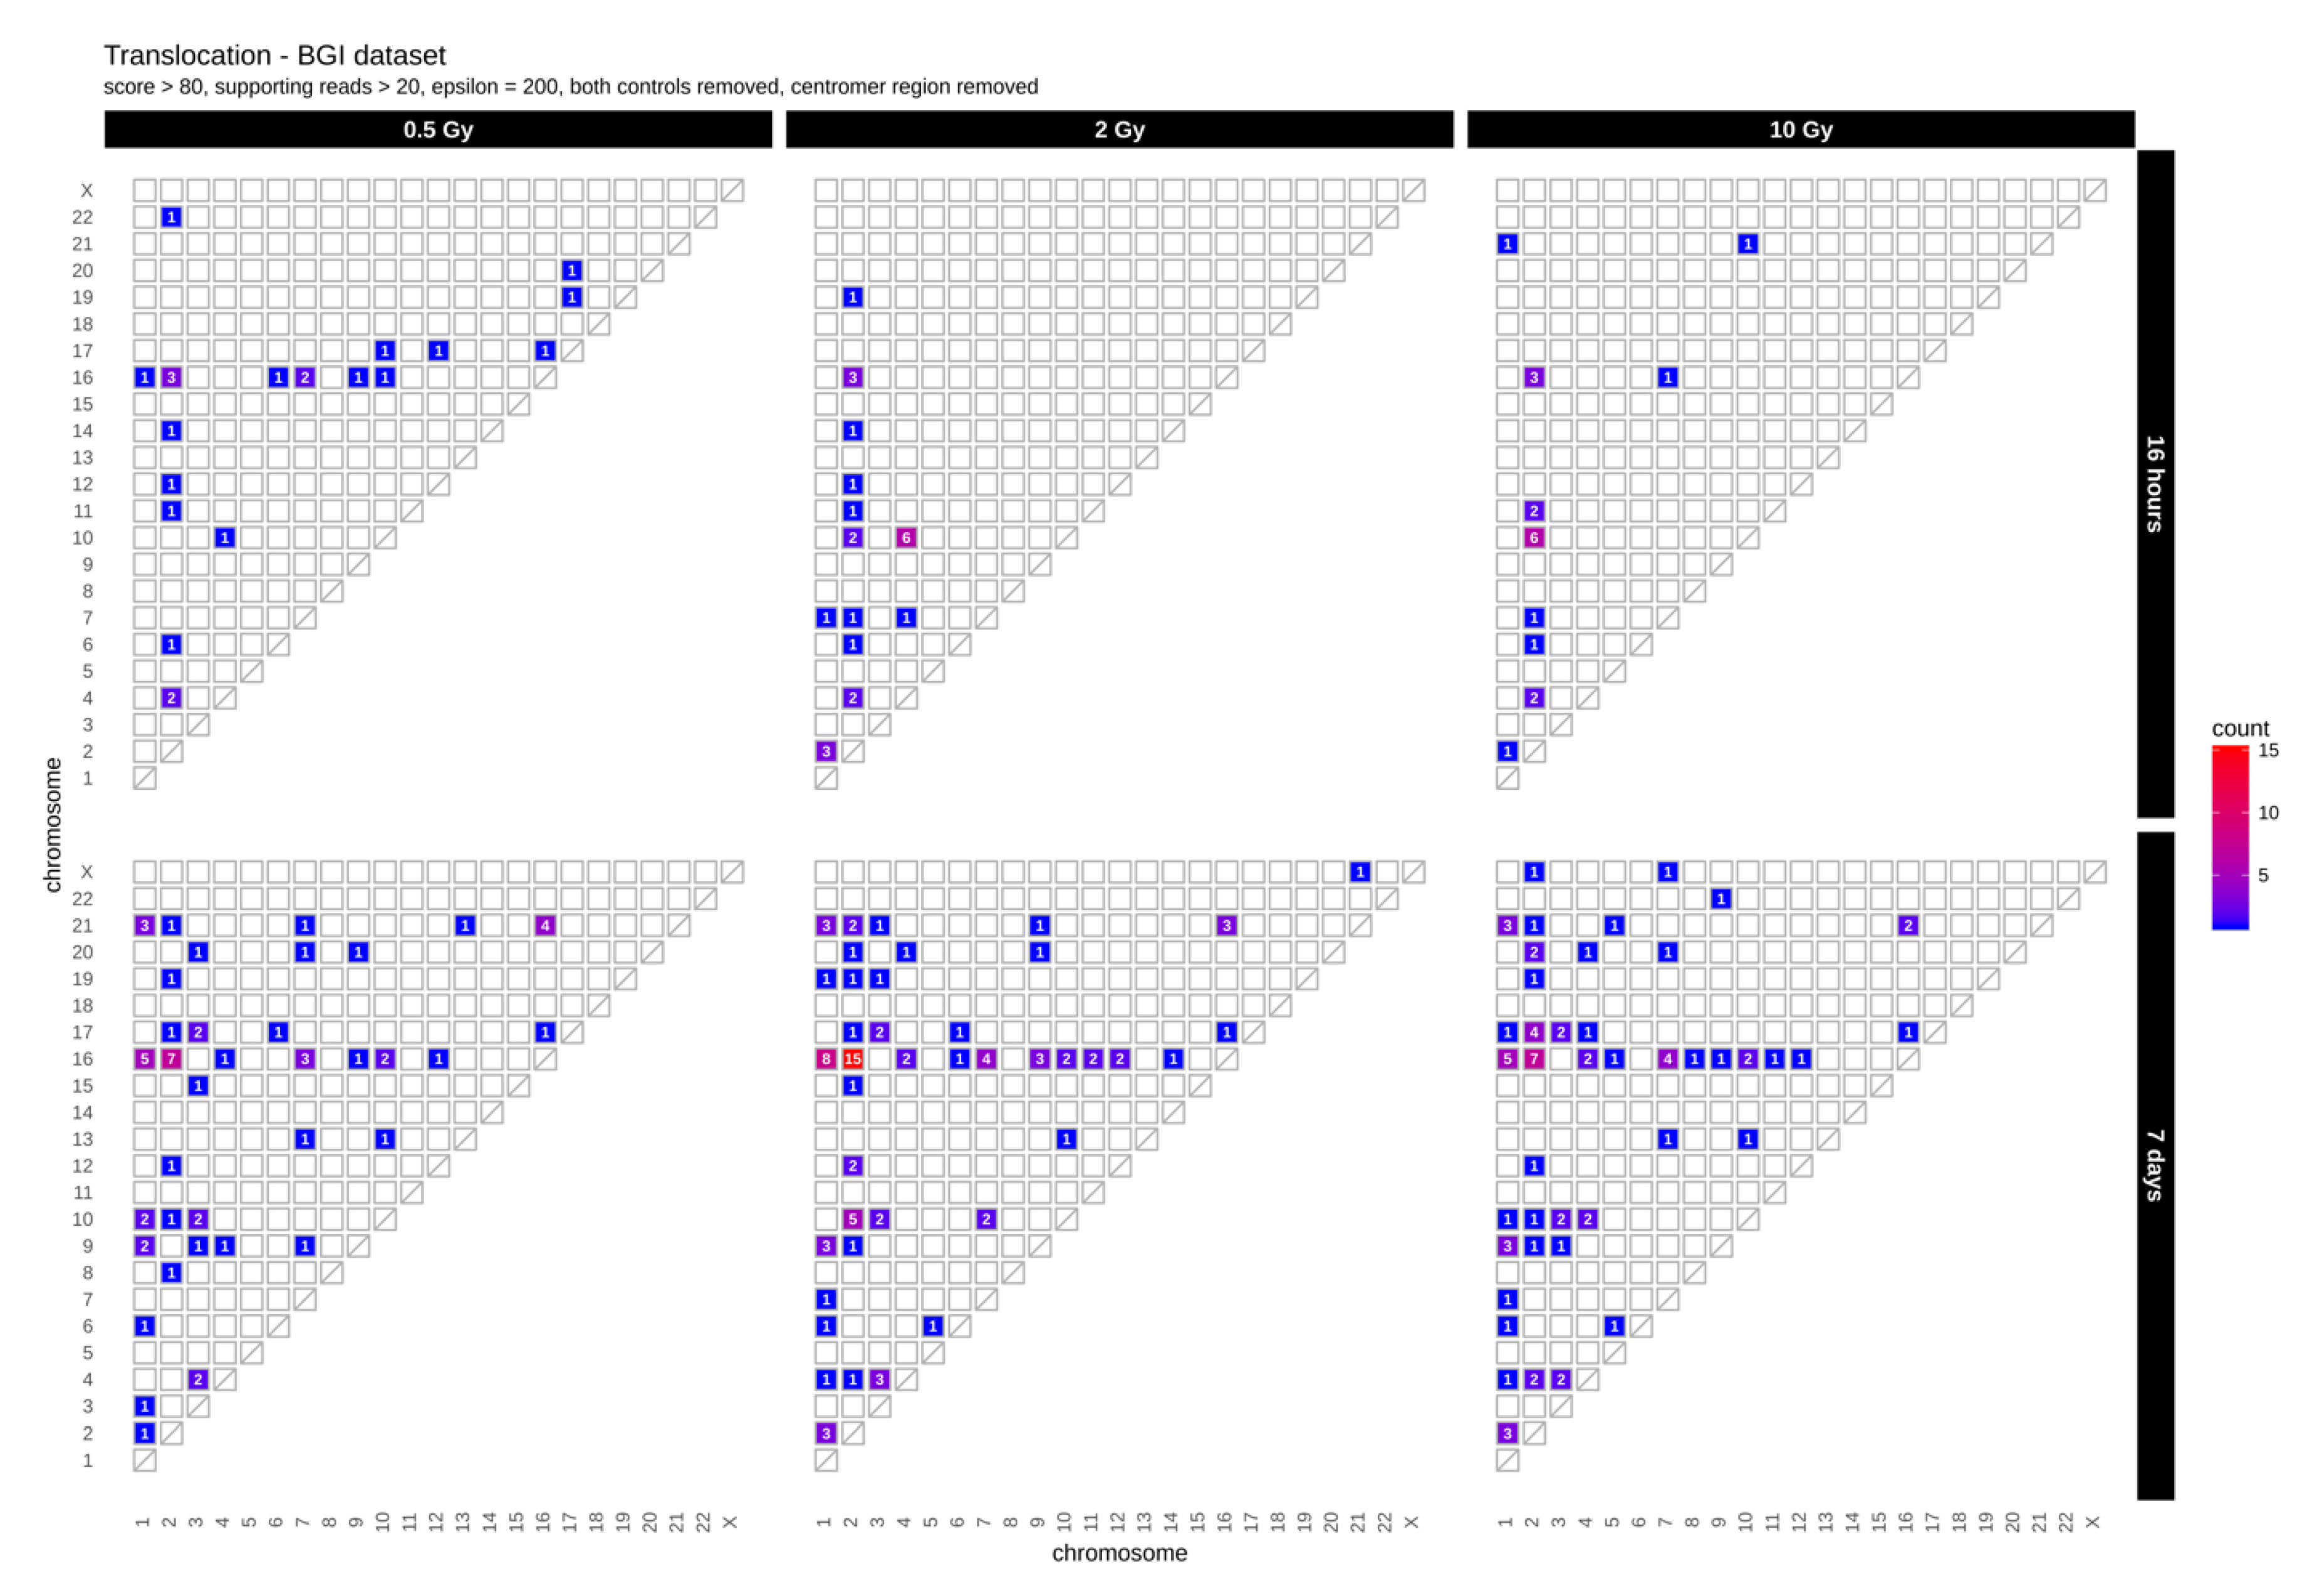
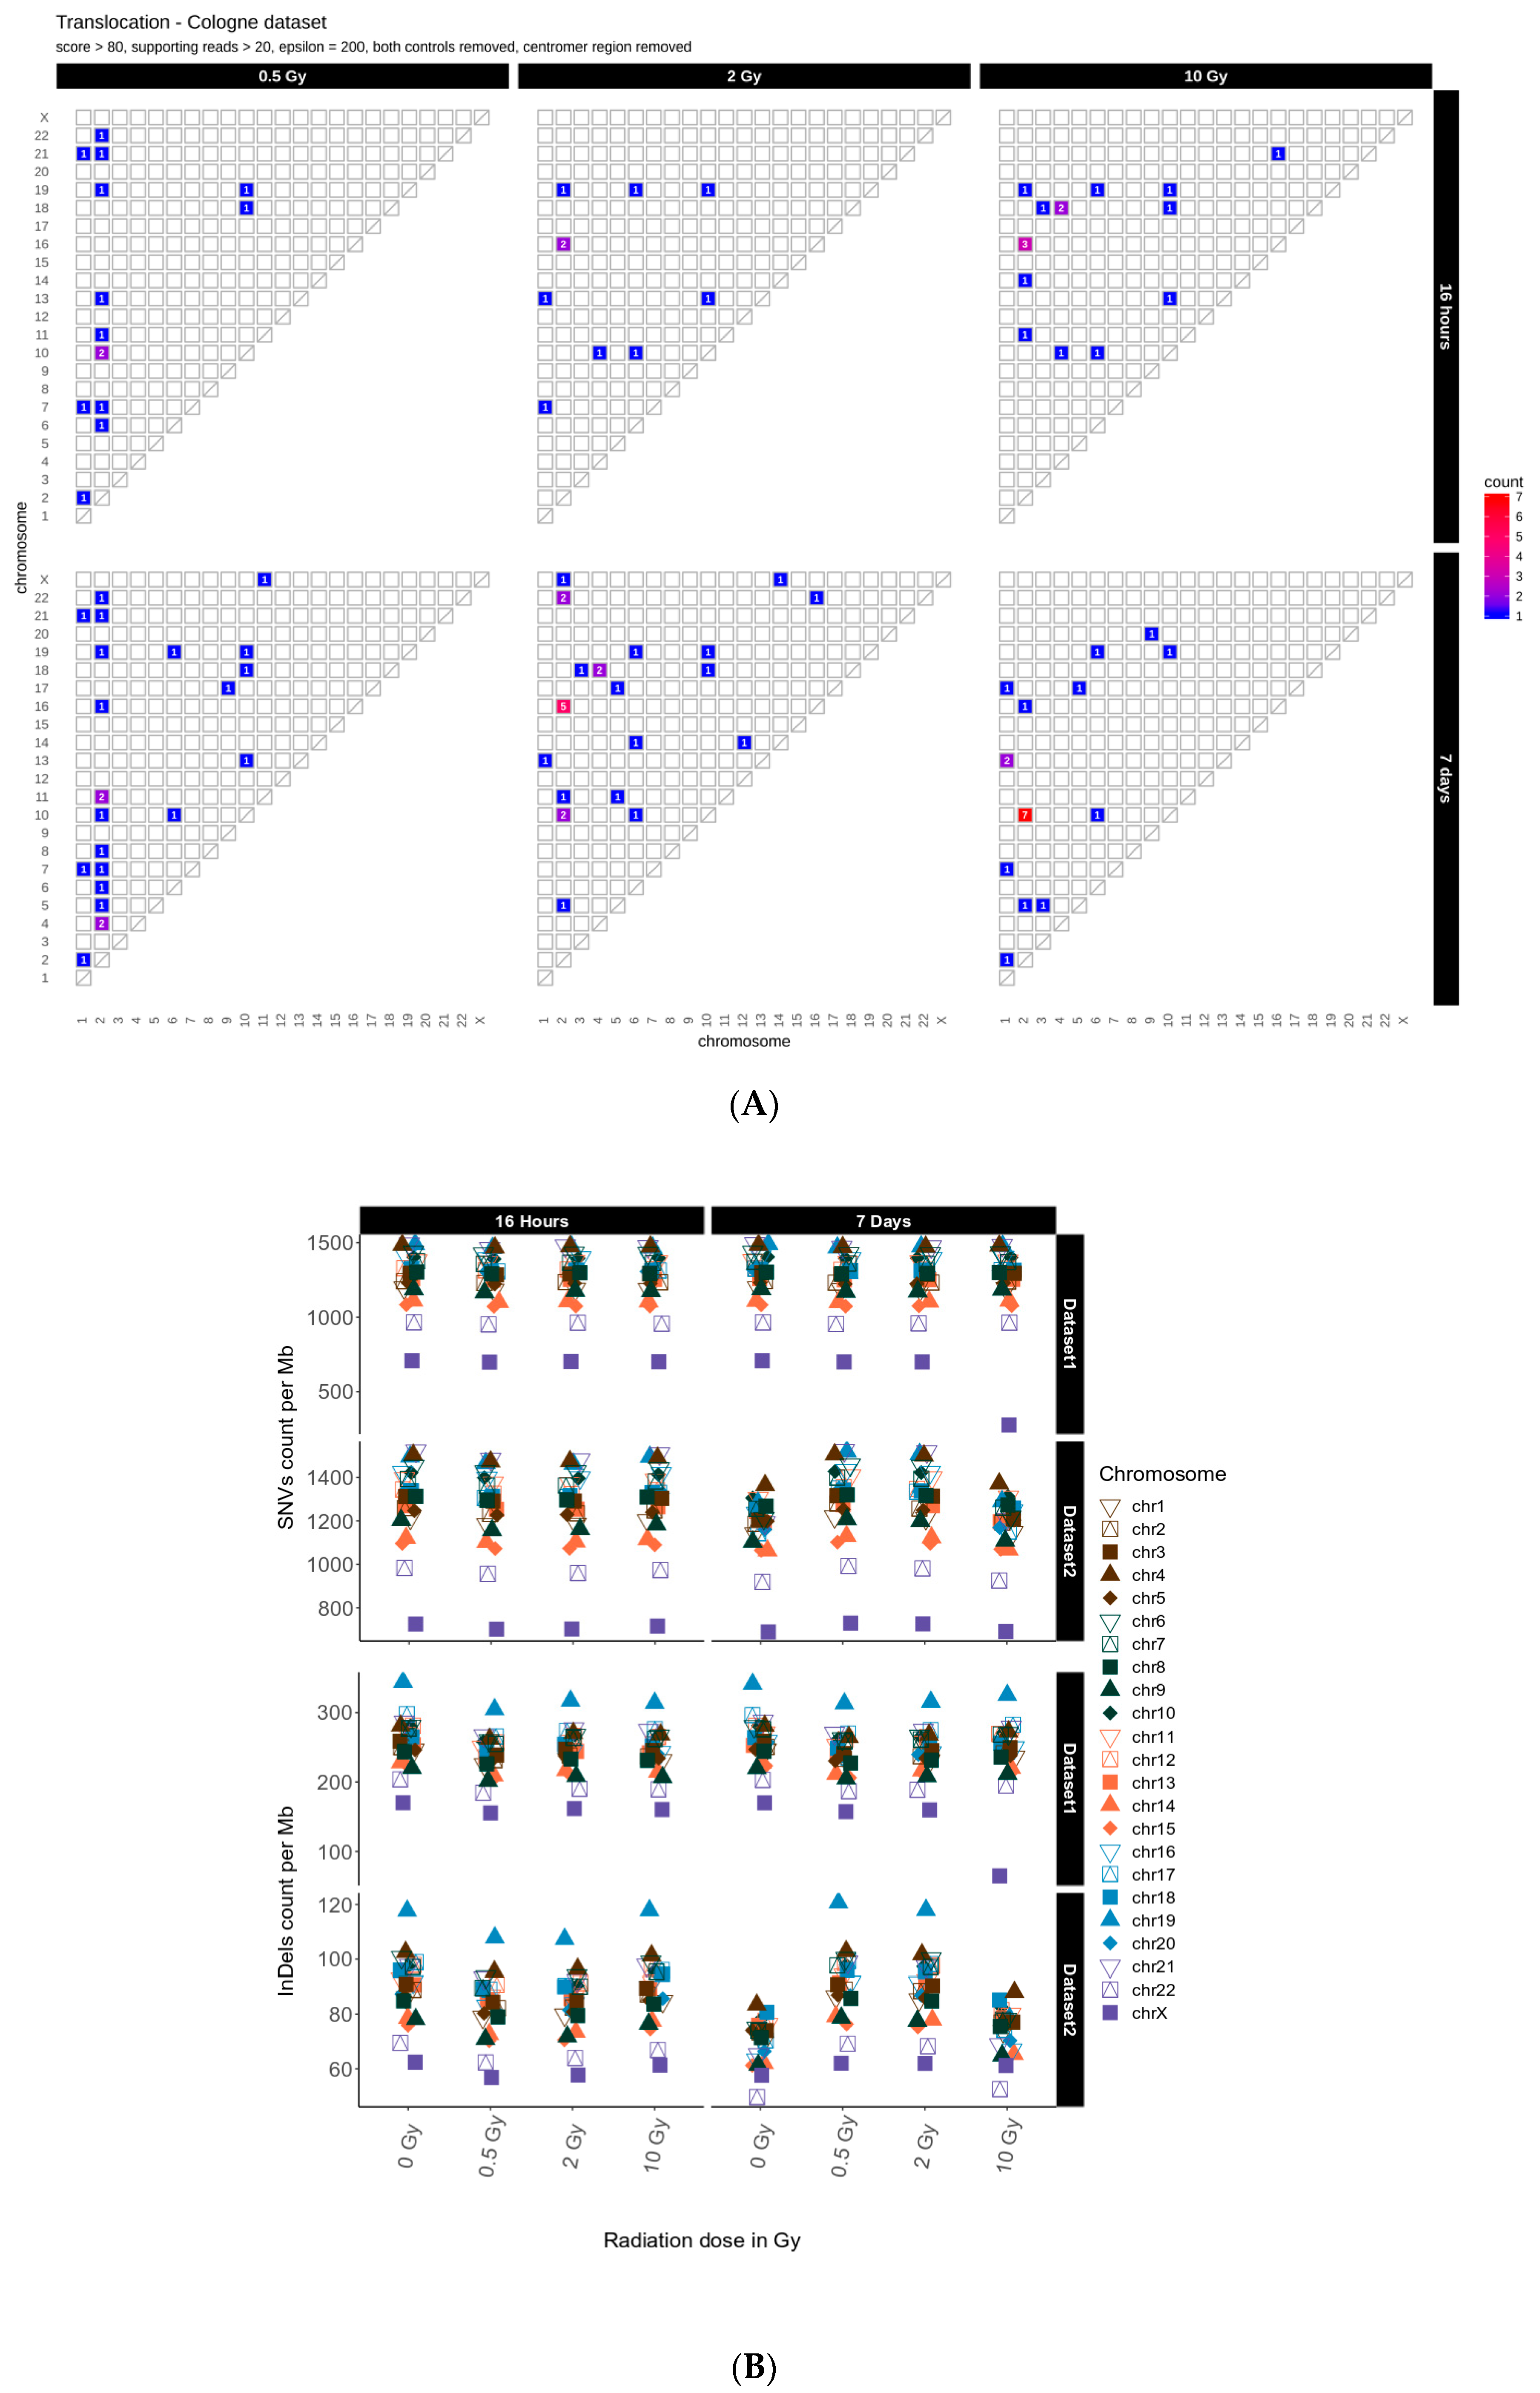
2.1. Translocations
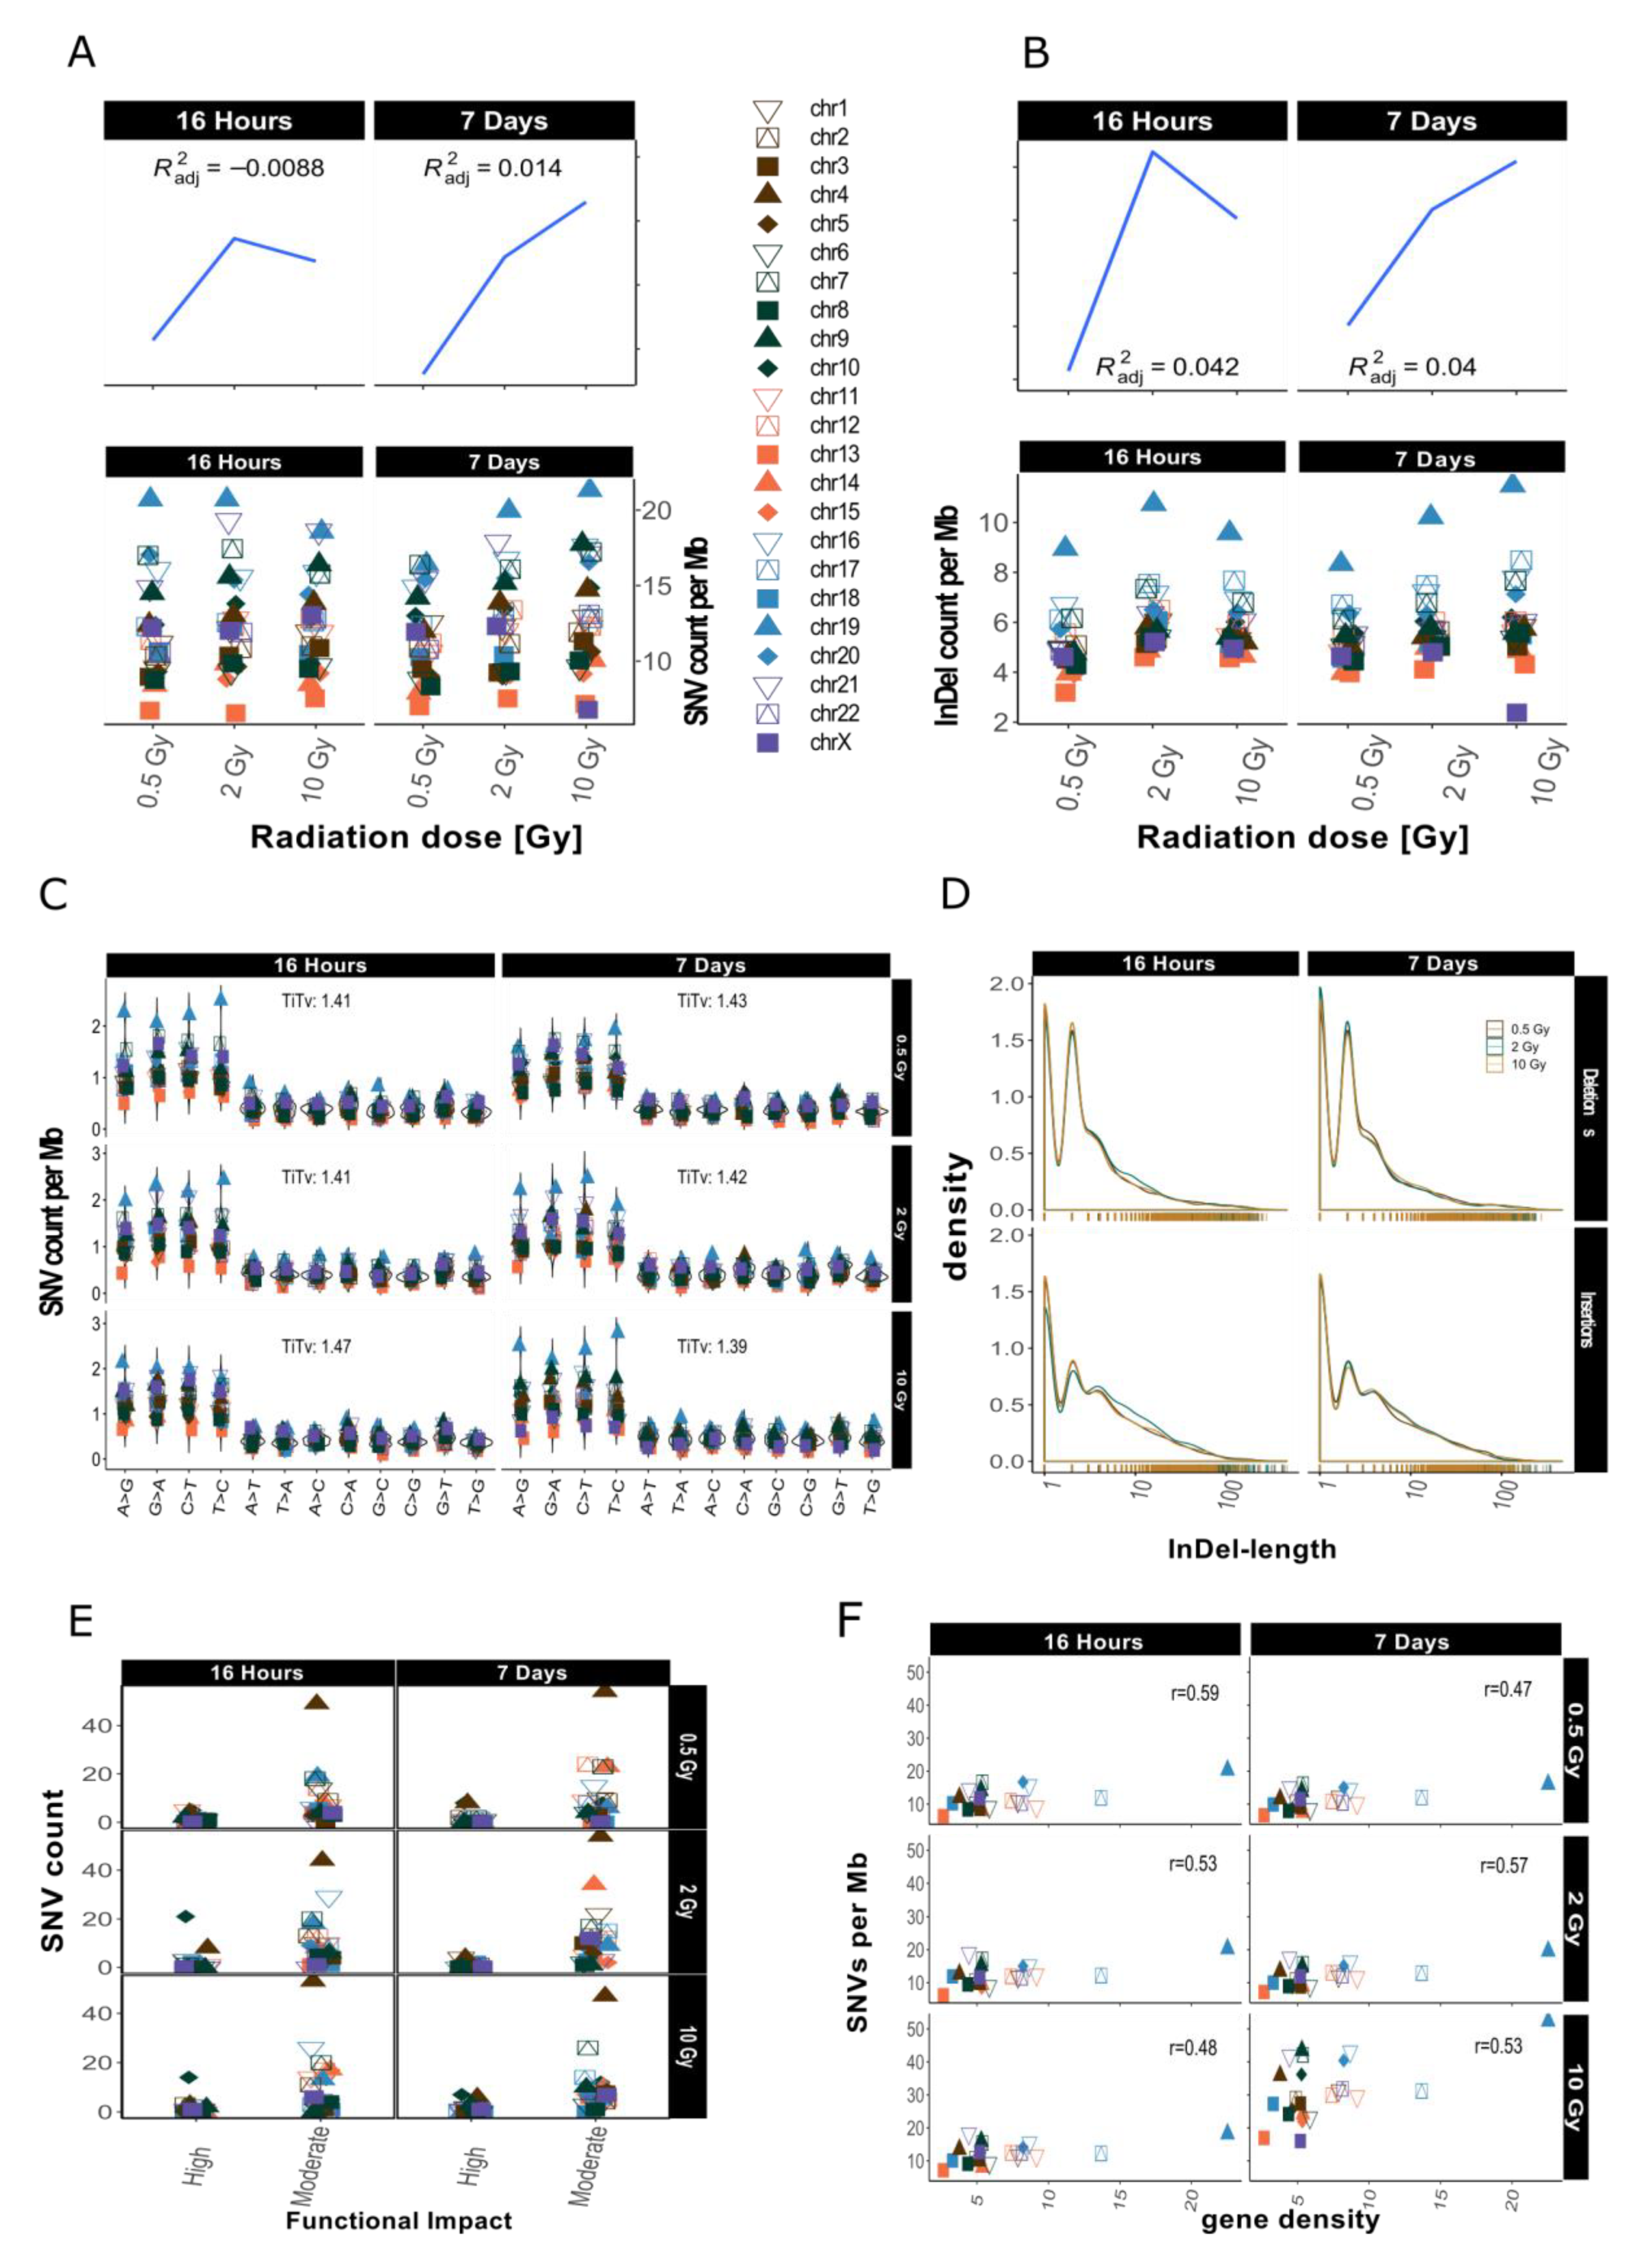
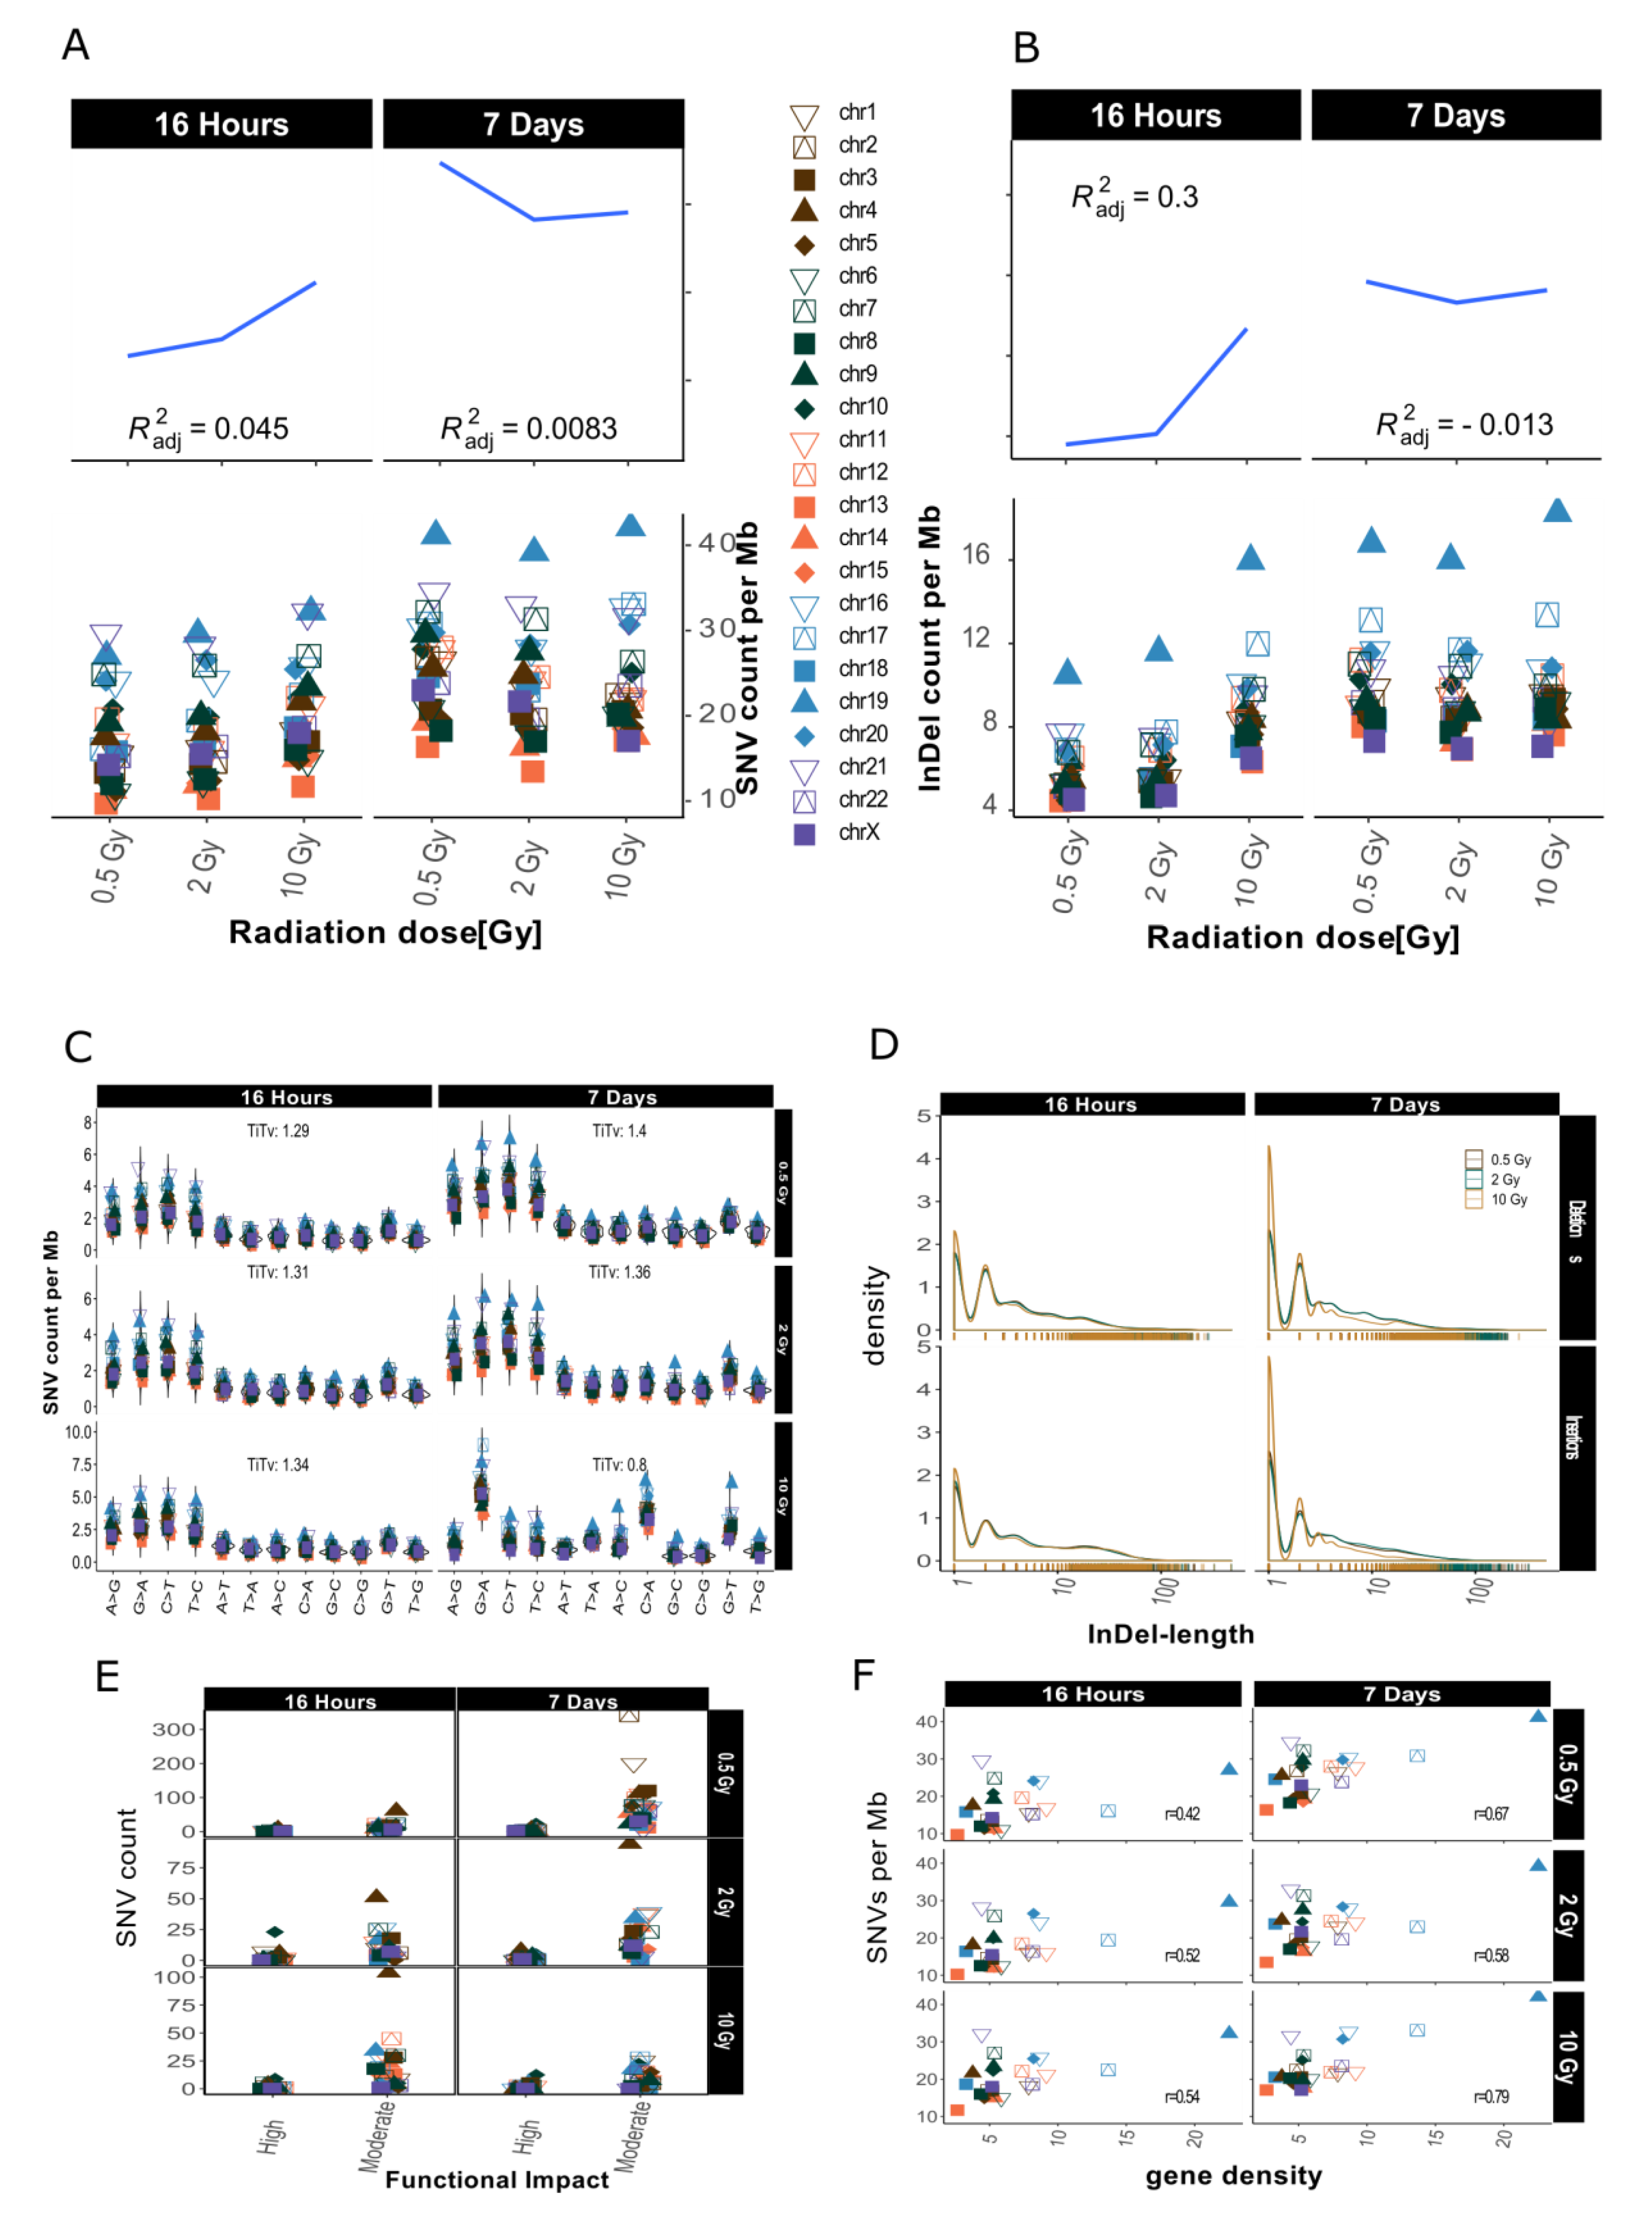
2.2. Distribution of SNVs and InDels in Genome Dataset
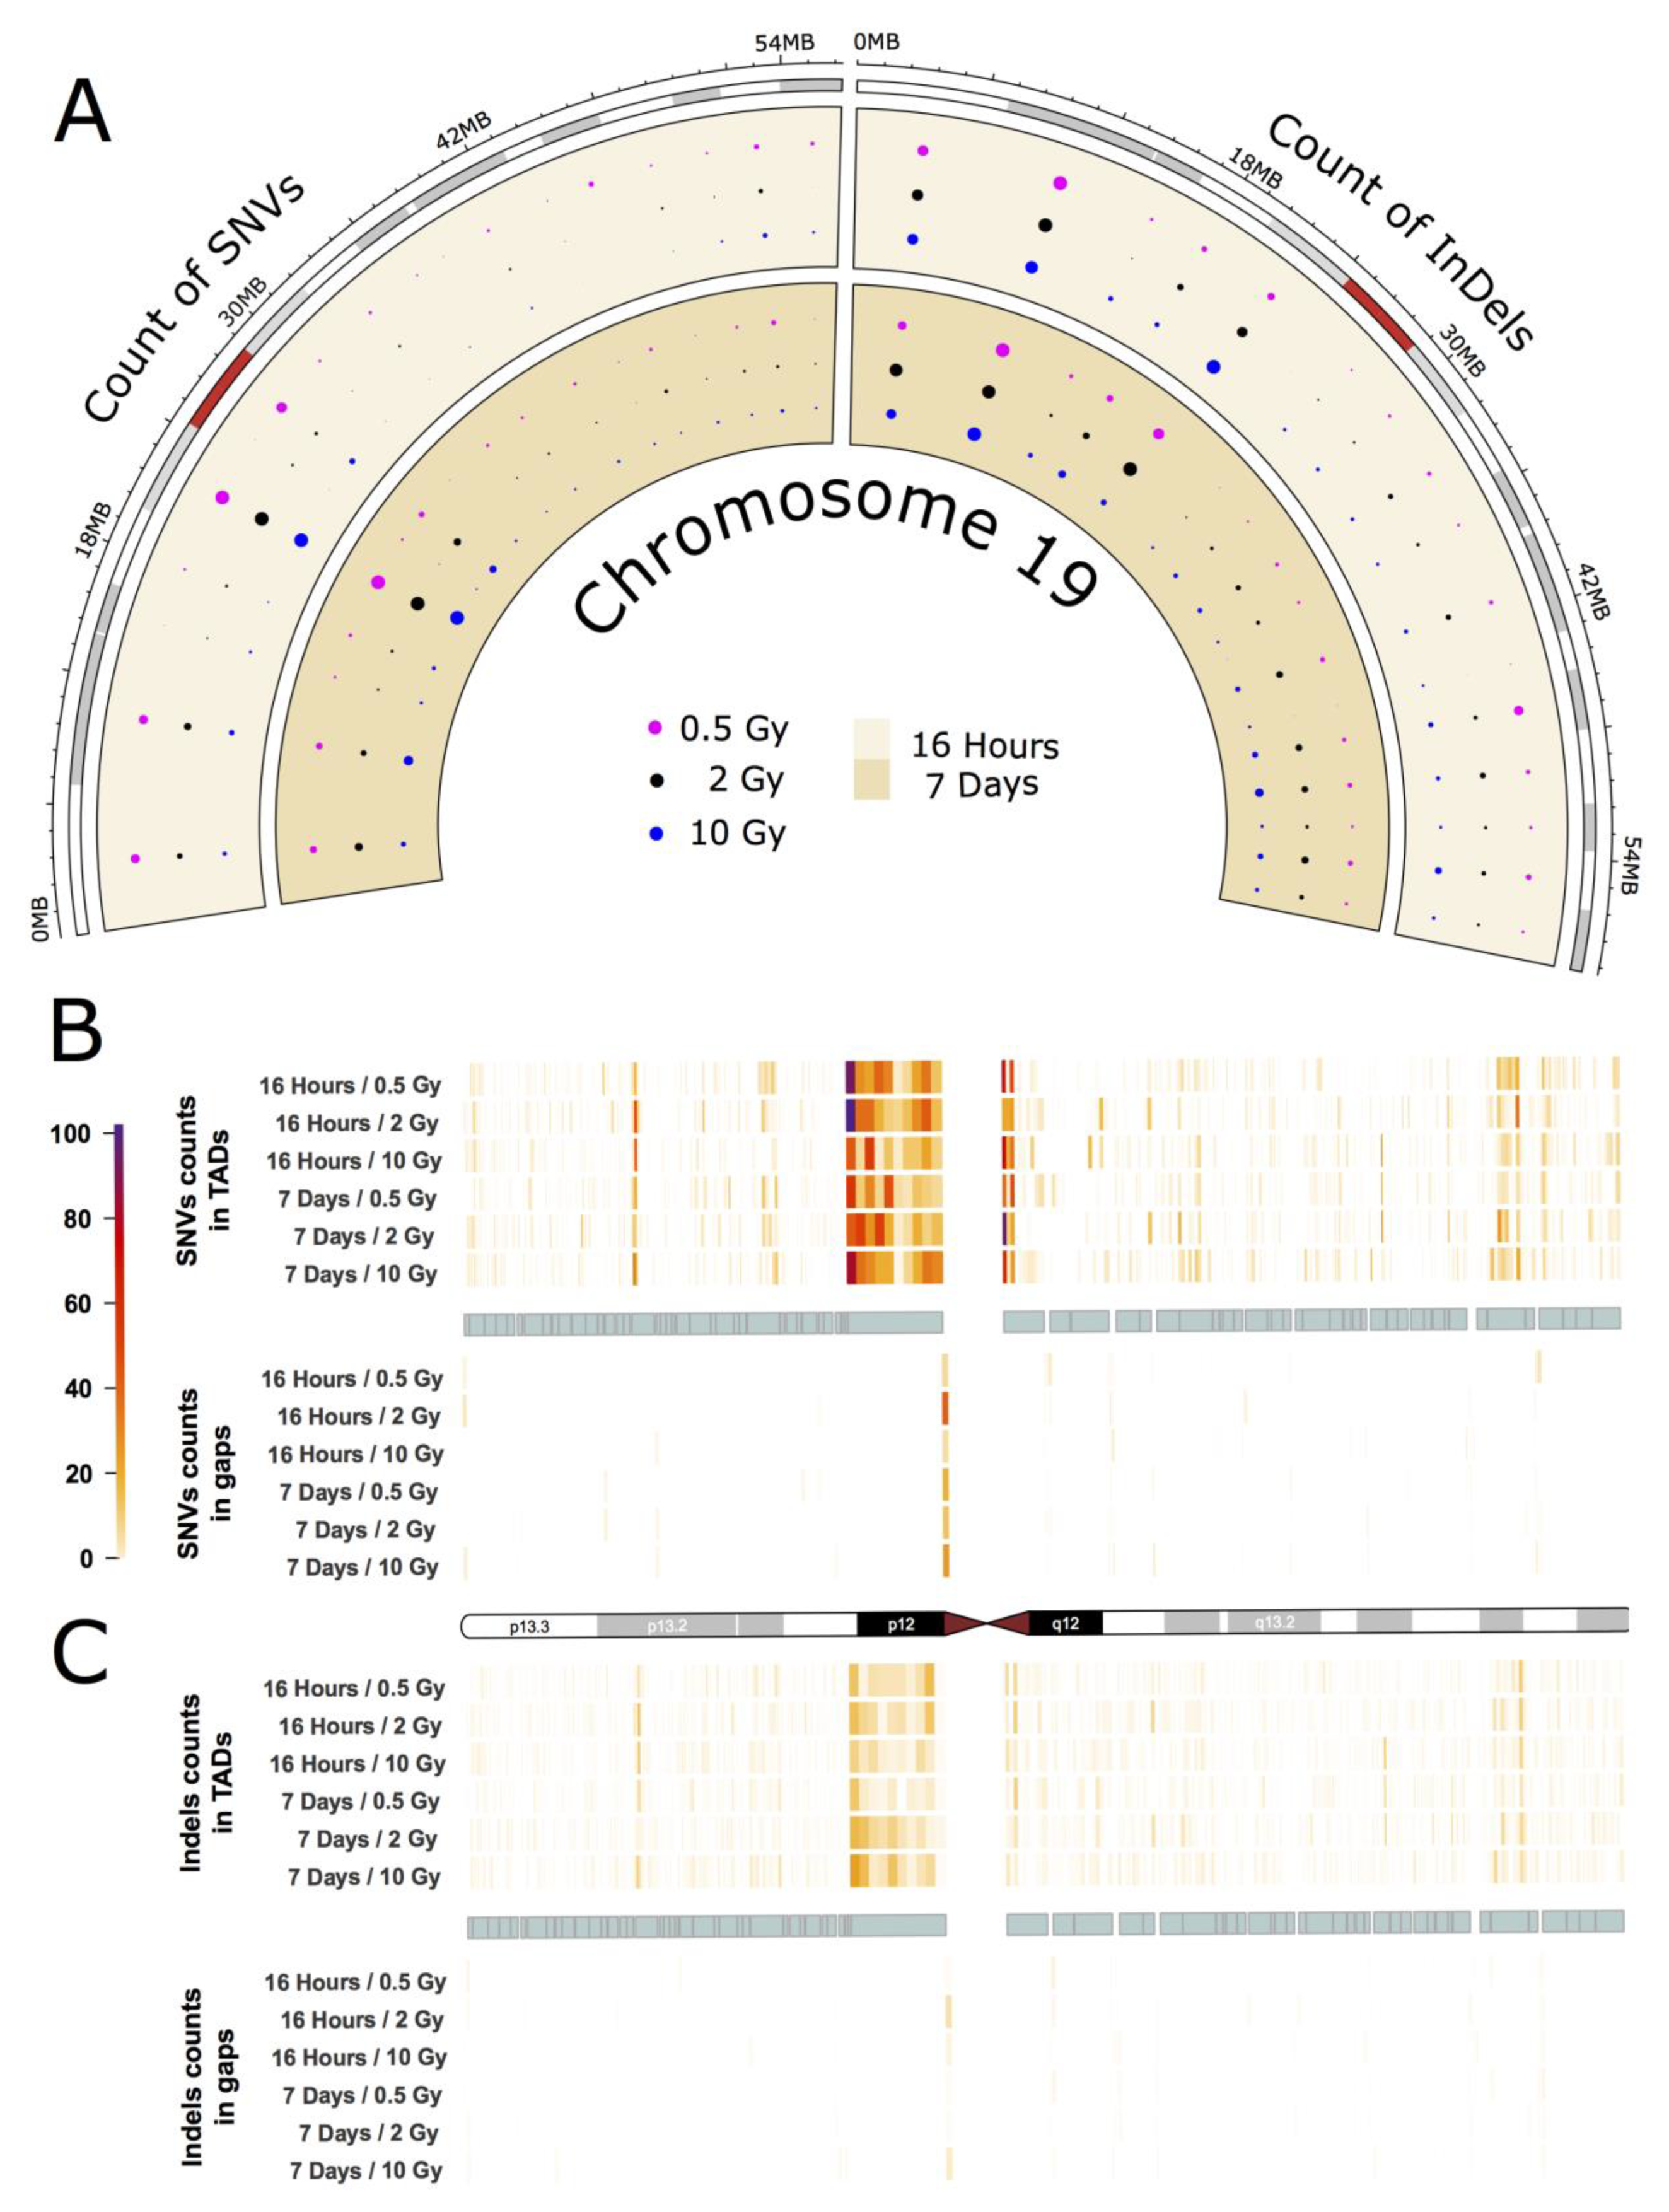
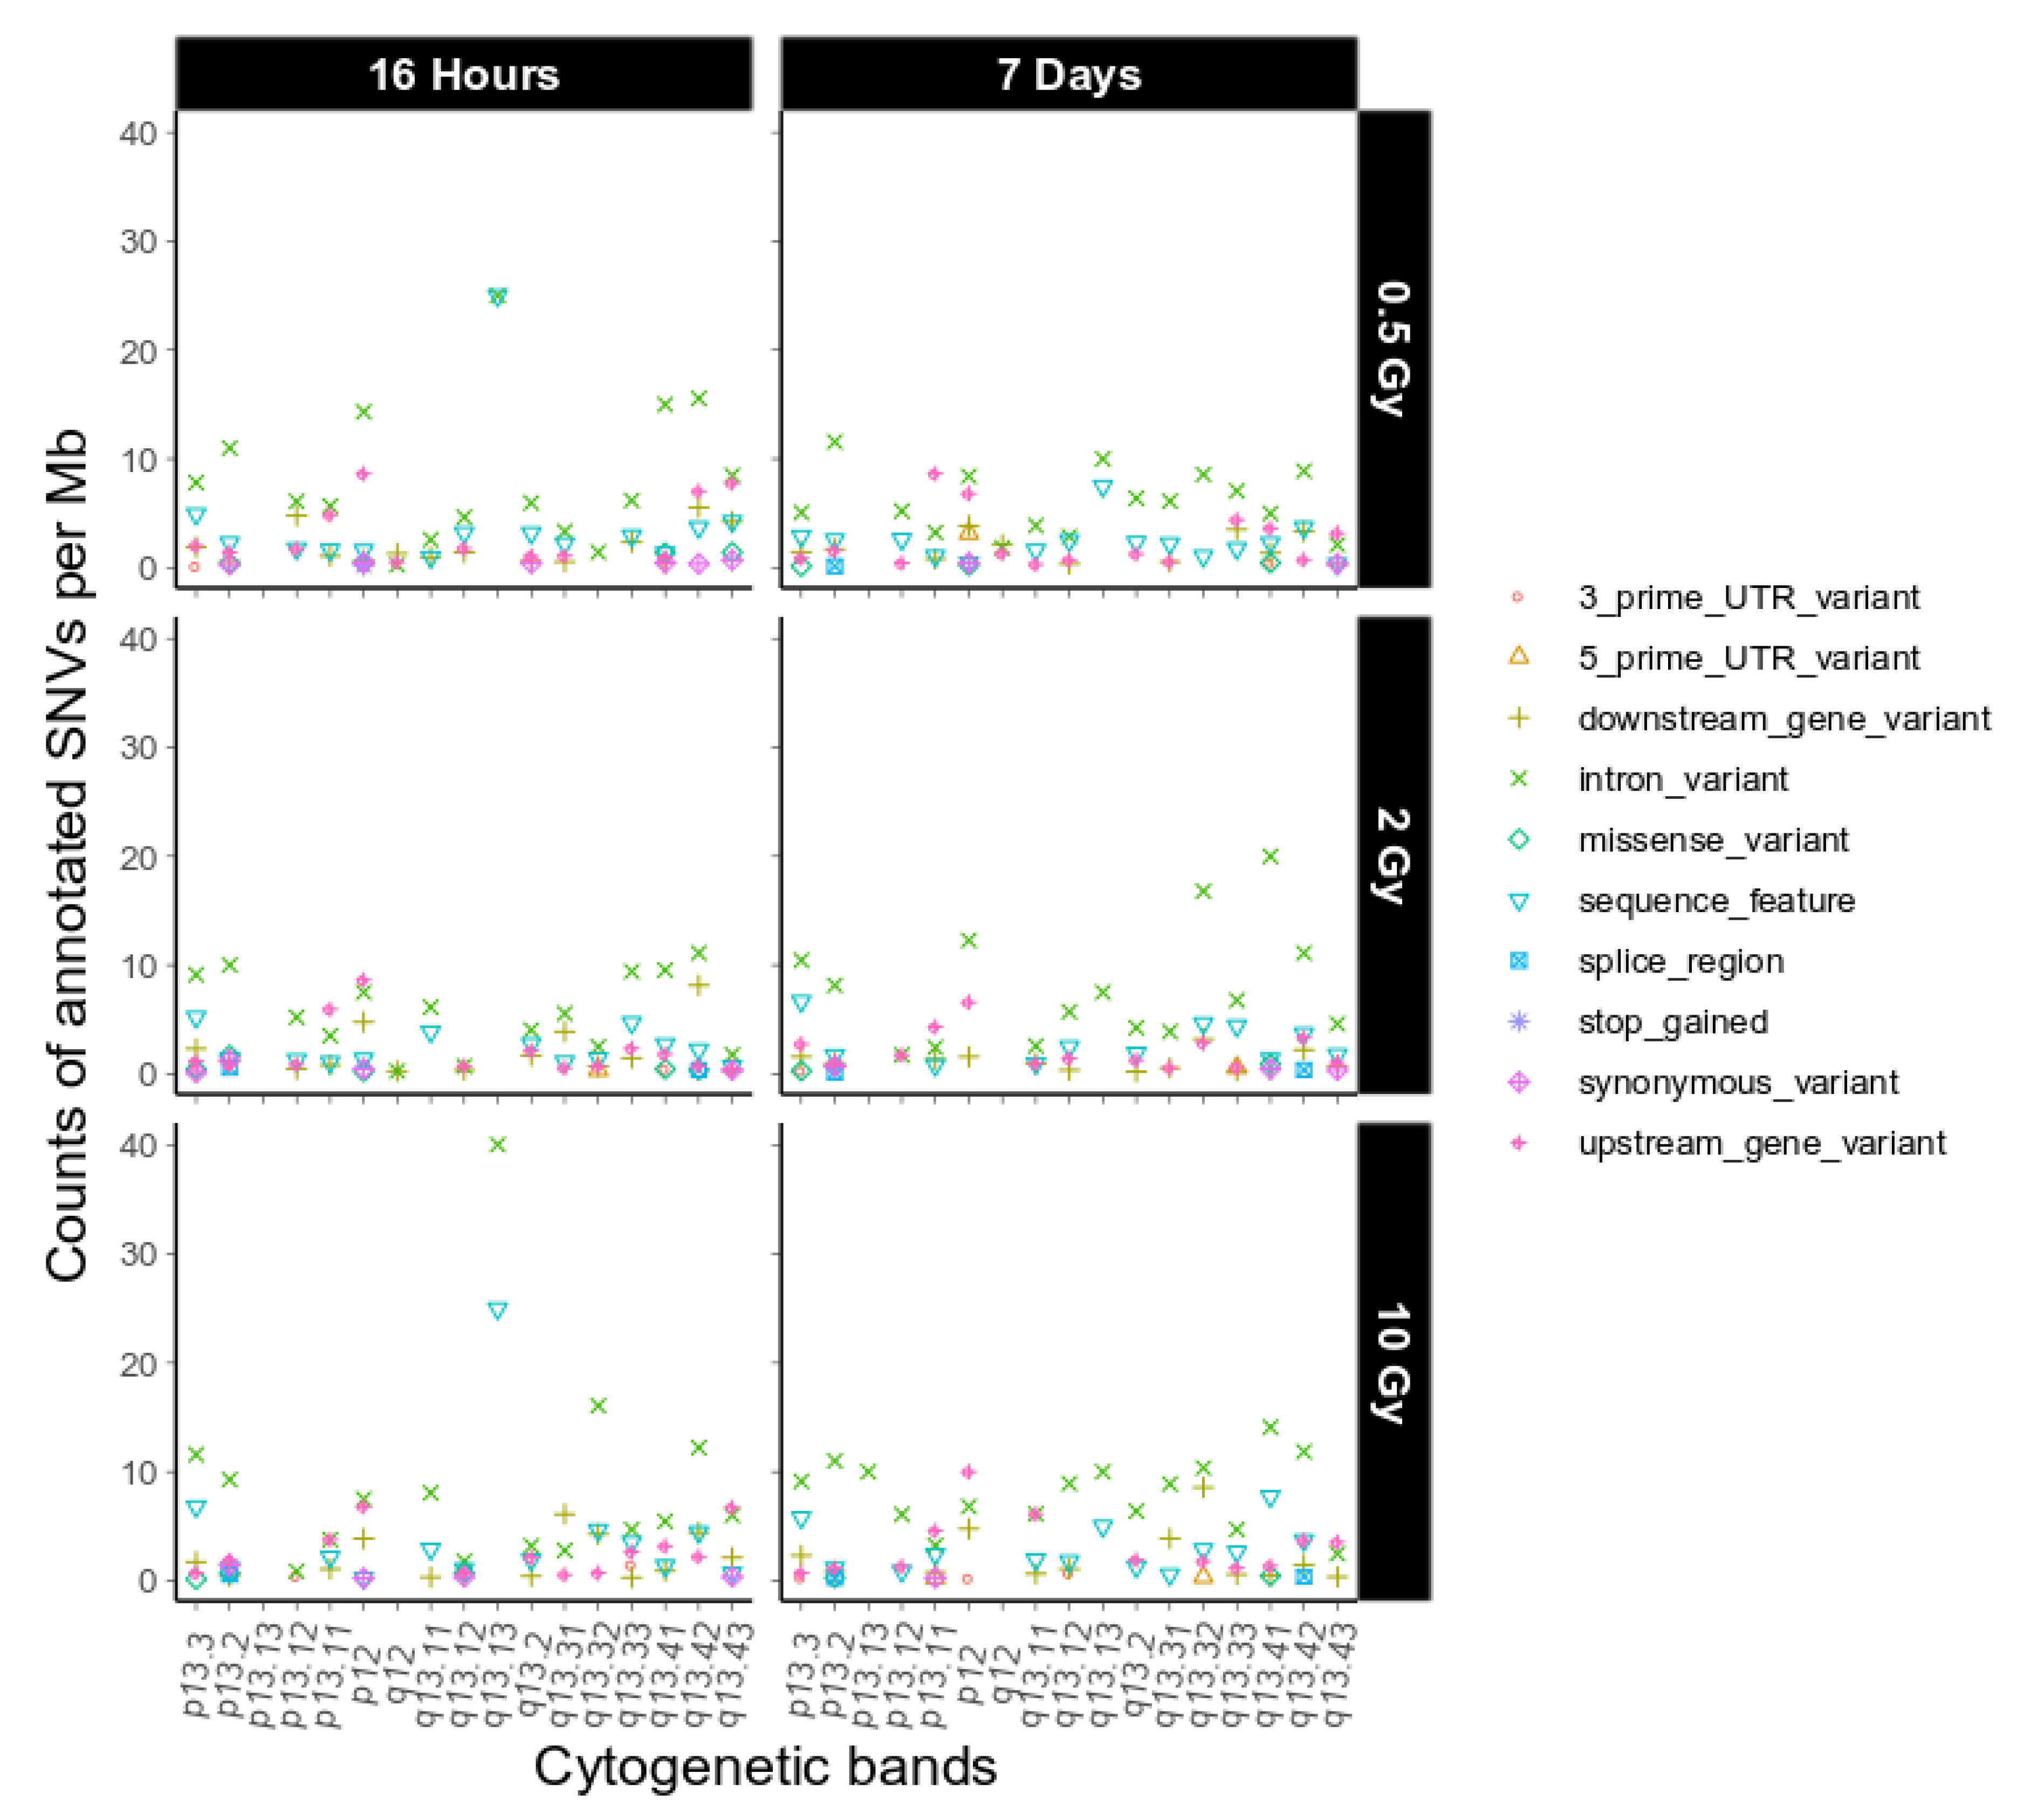
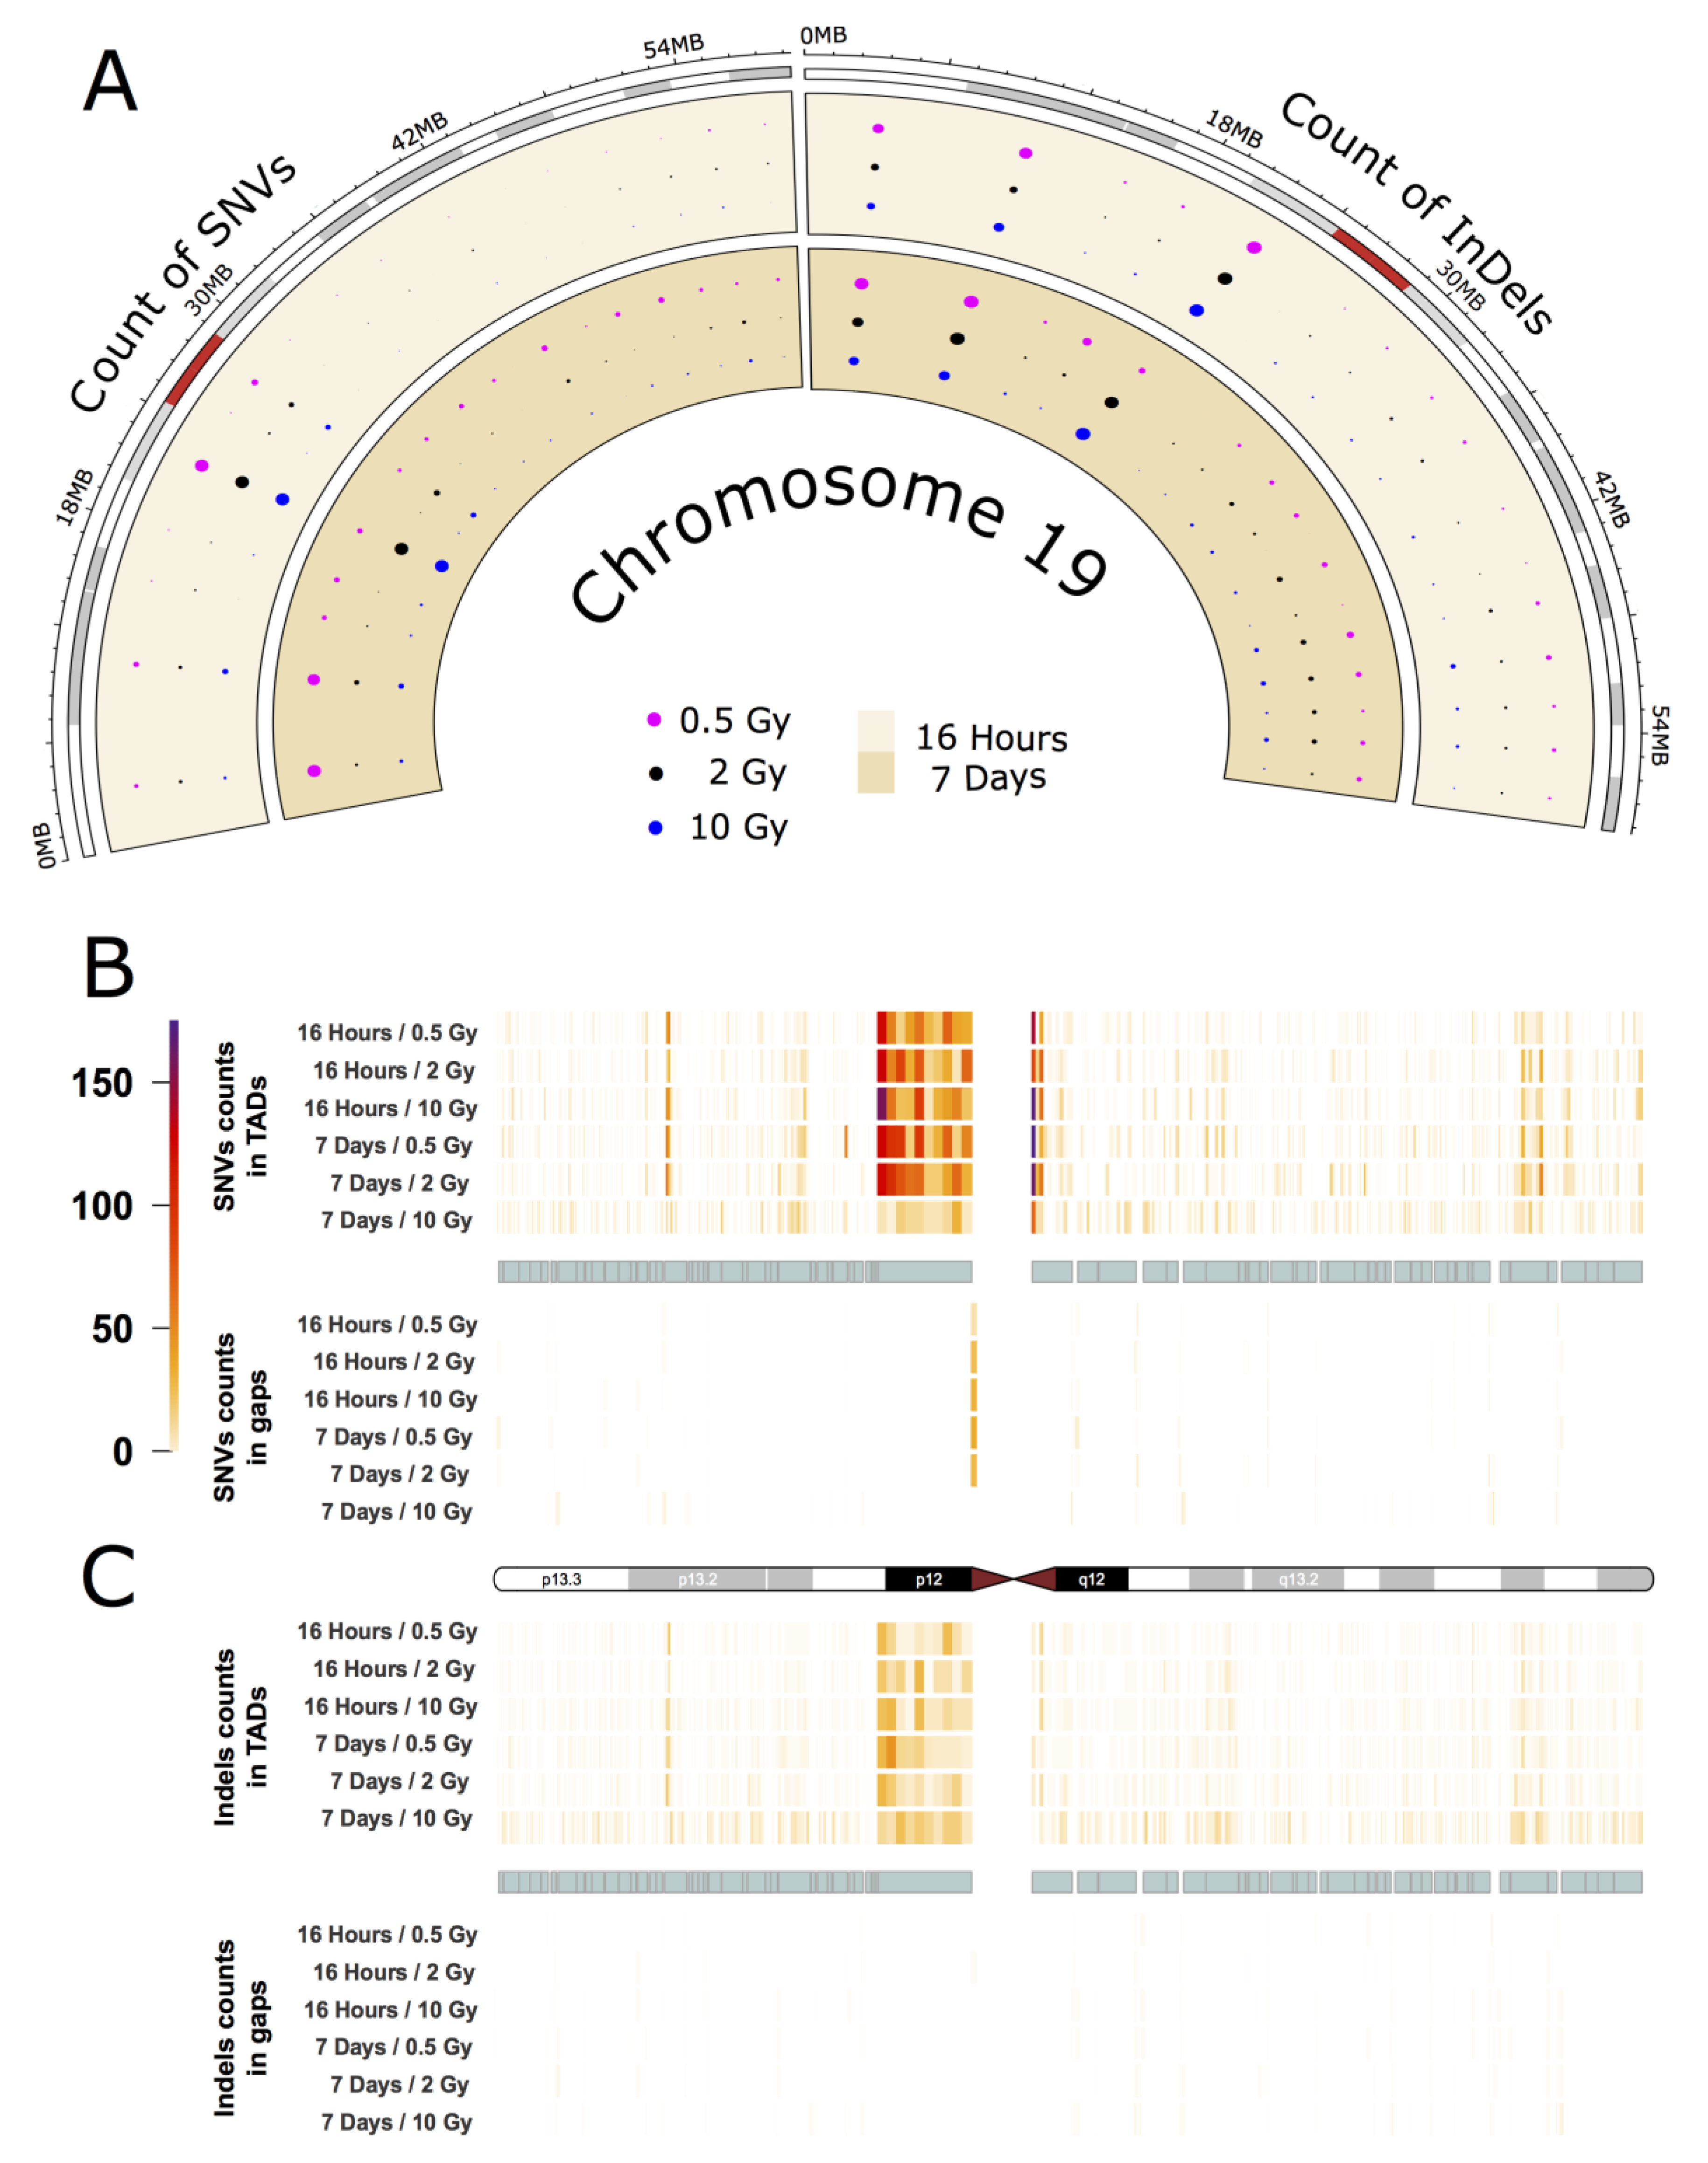
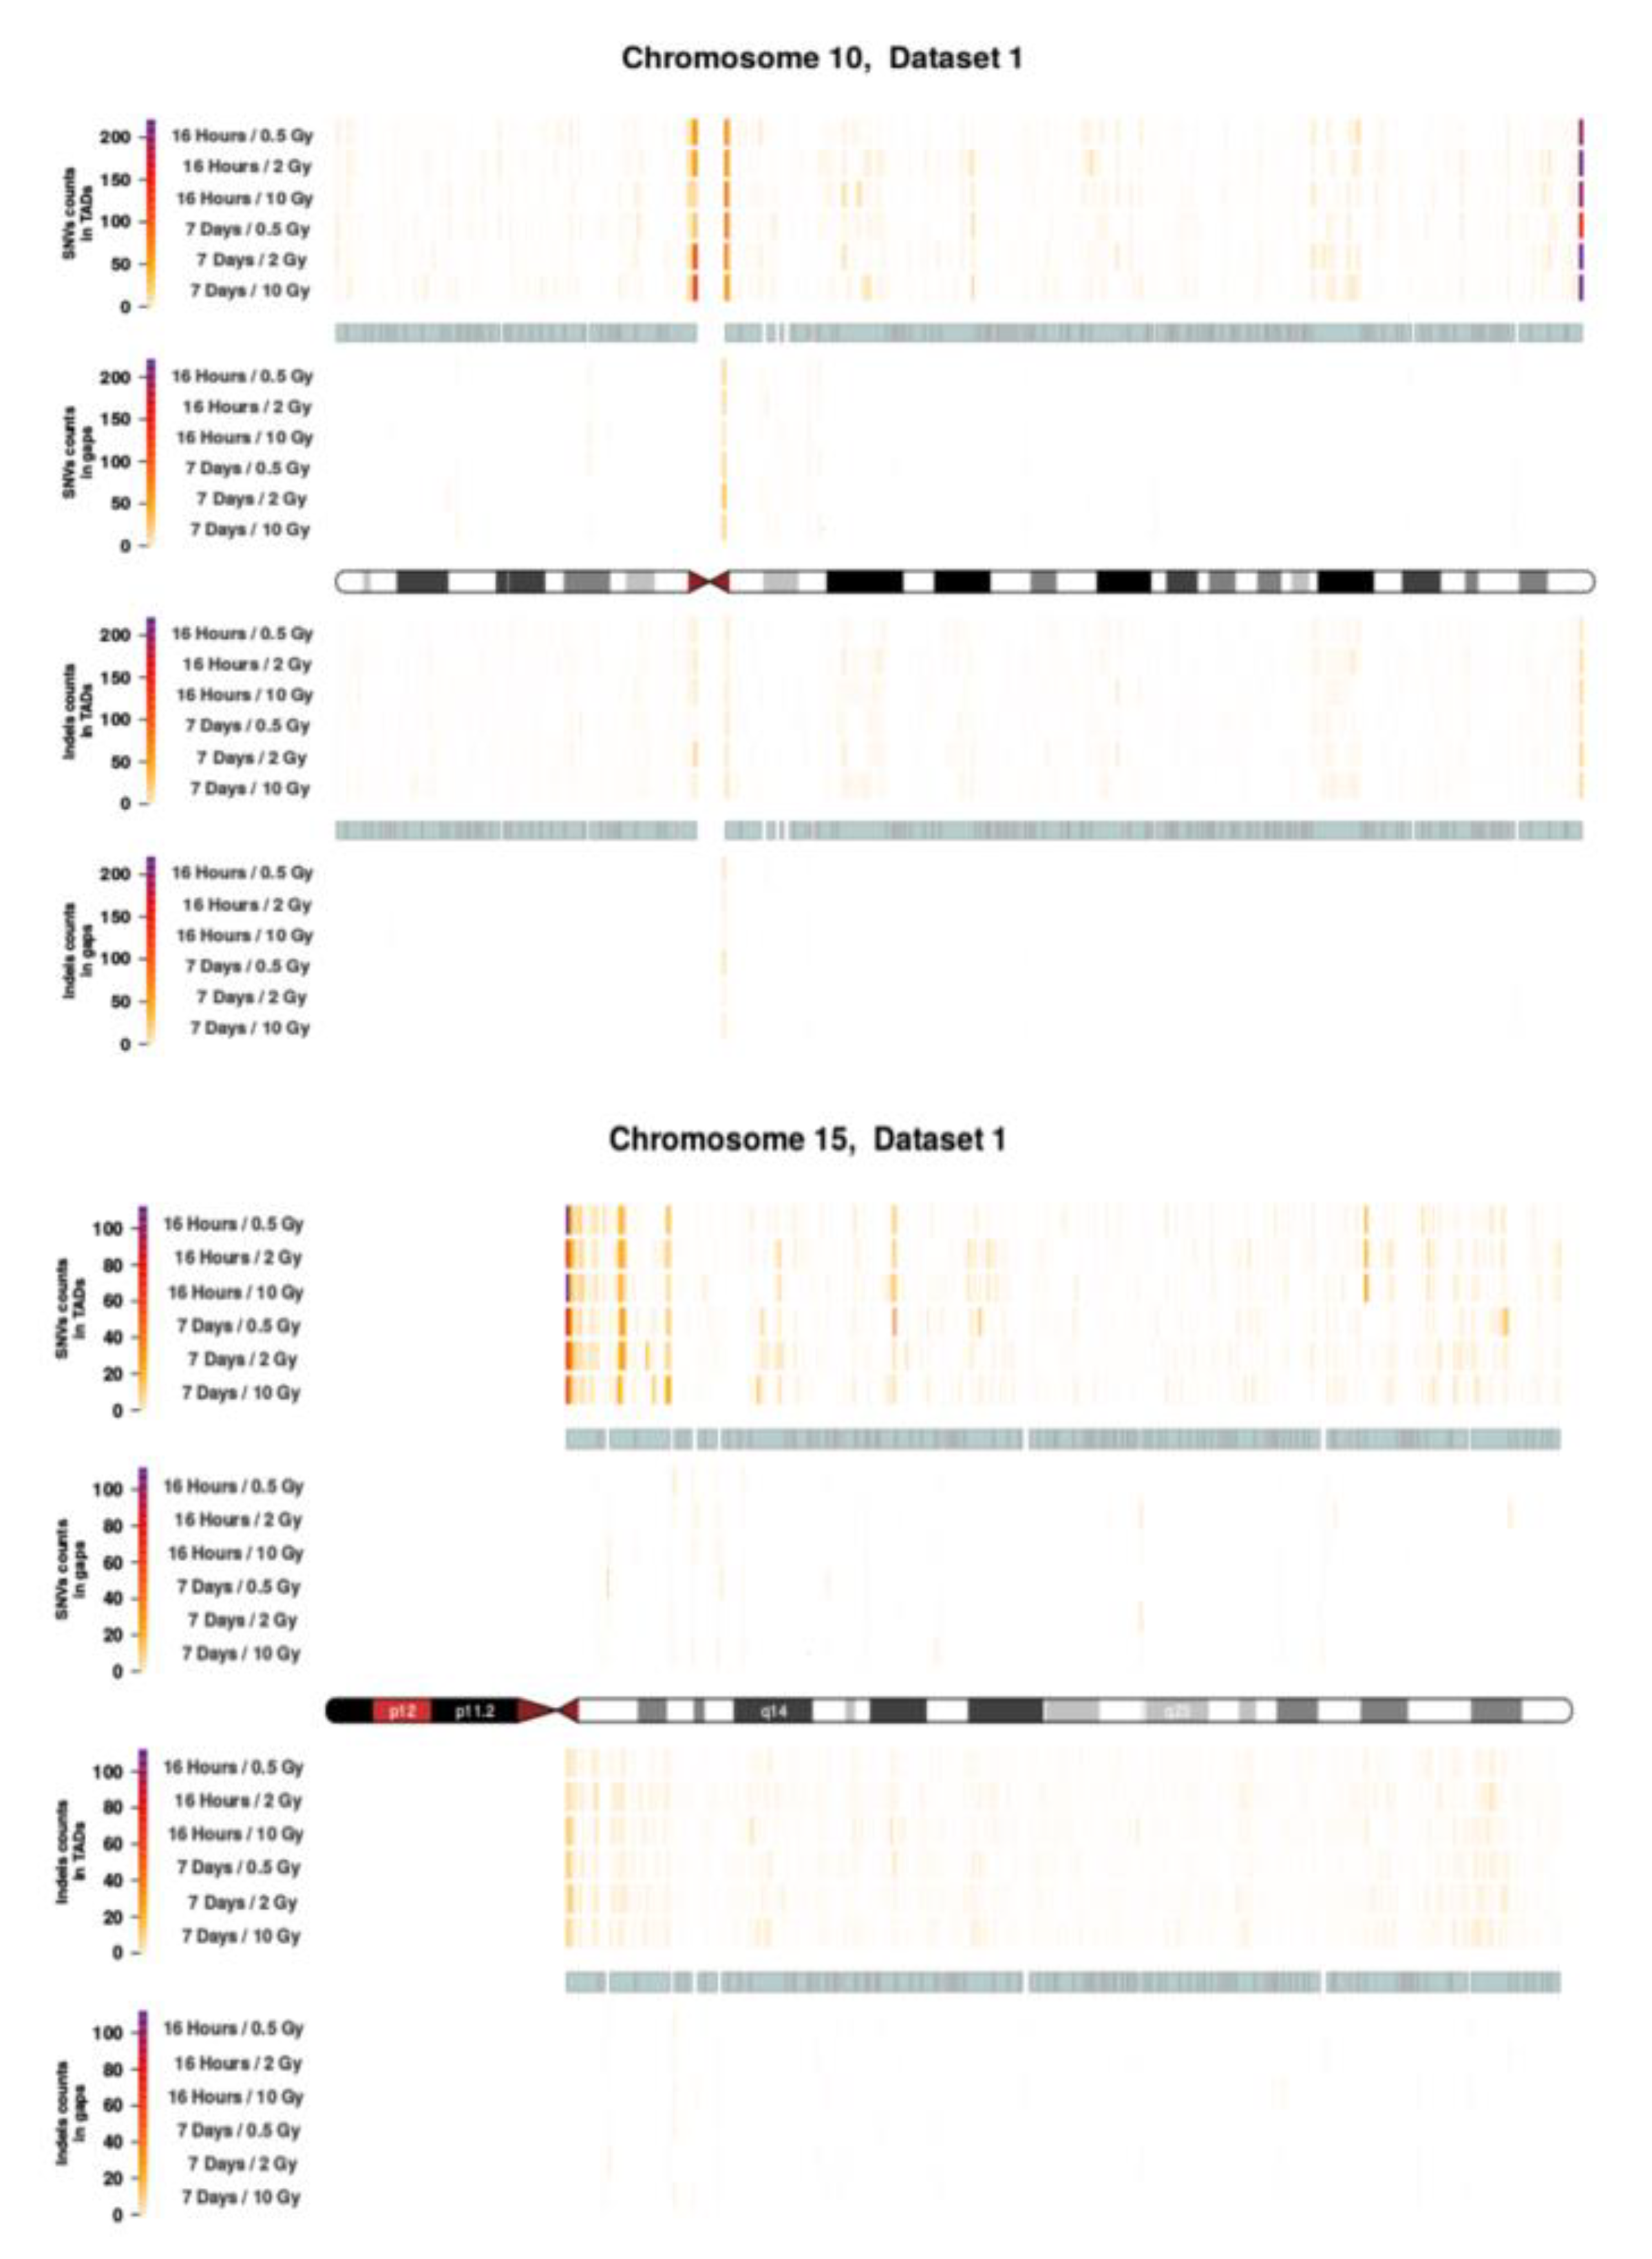
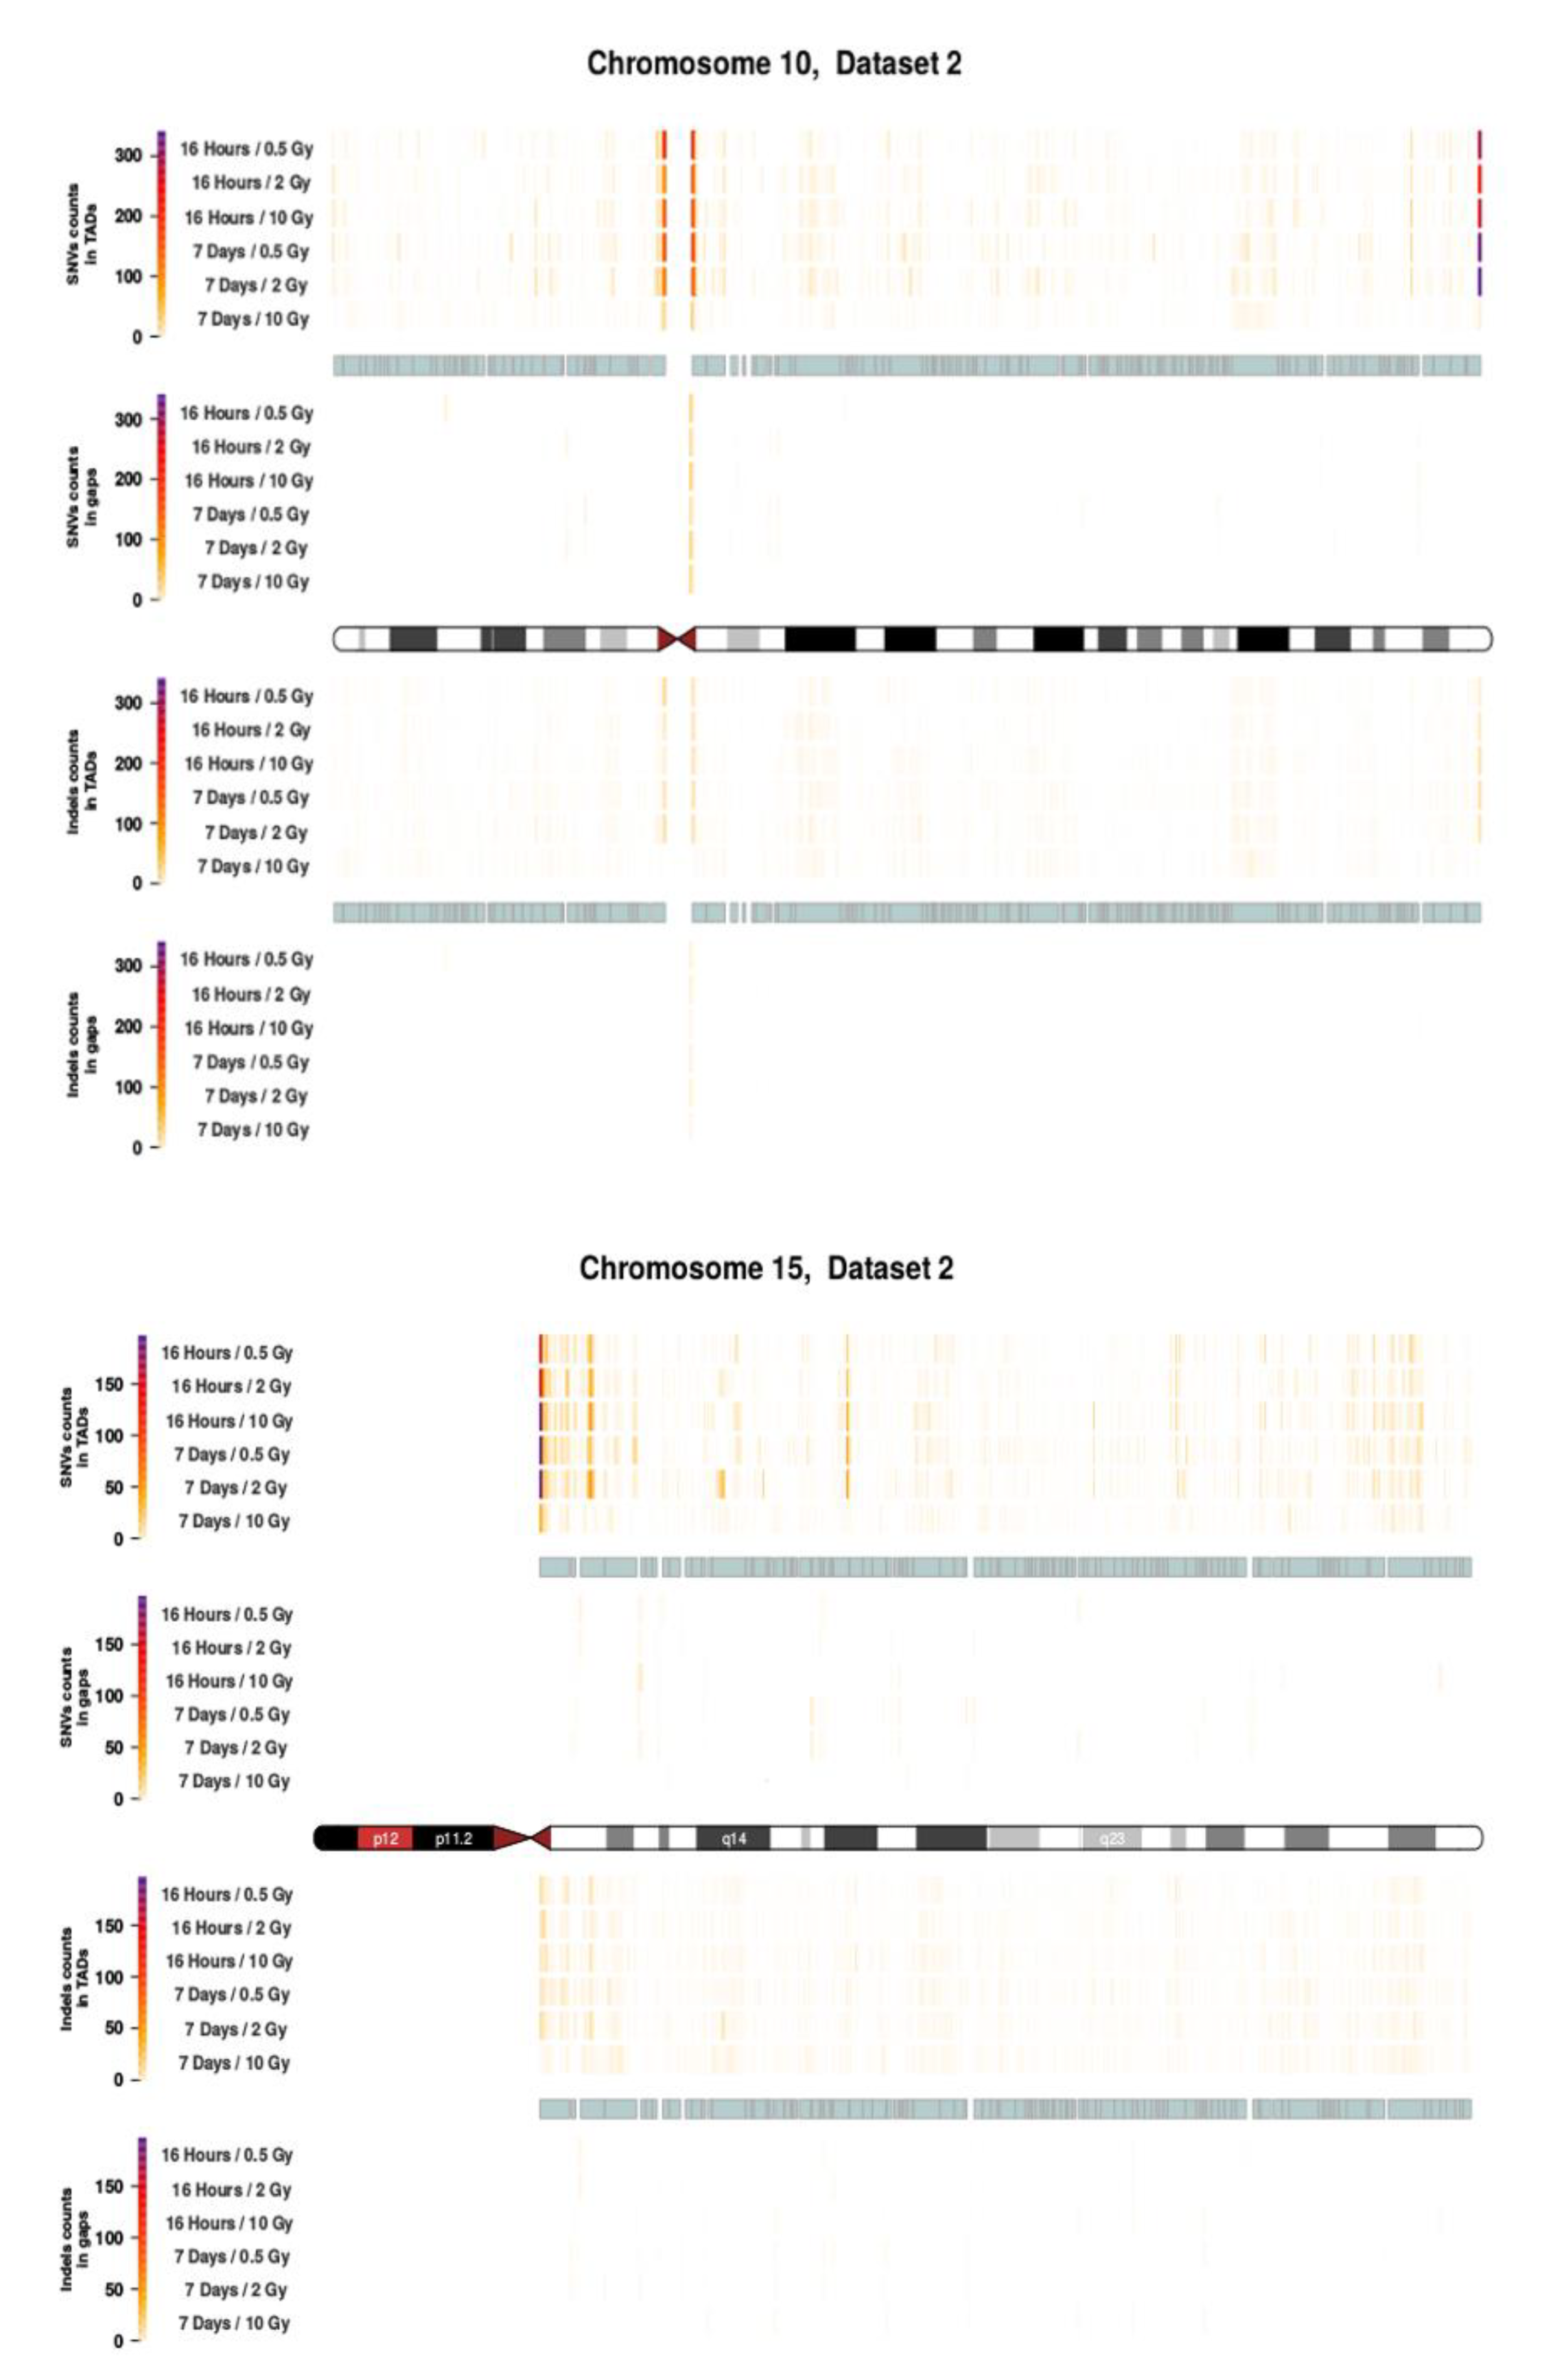
2.3. Intrachromosomal Distribution of SNVs and InDels
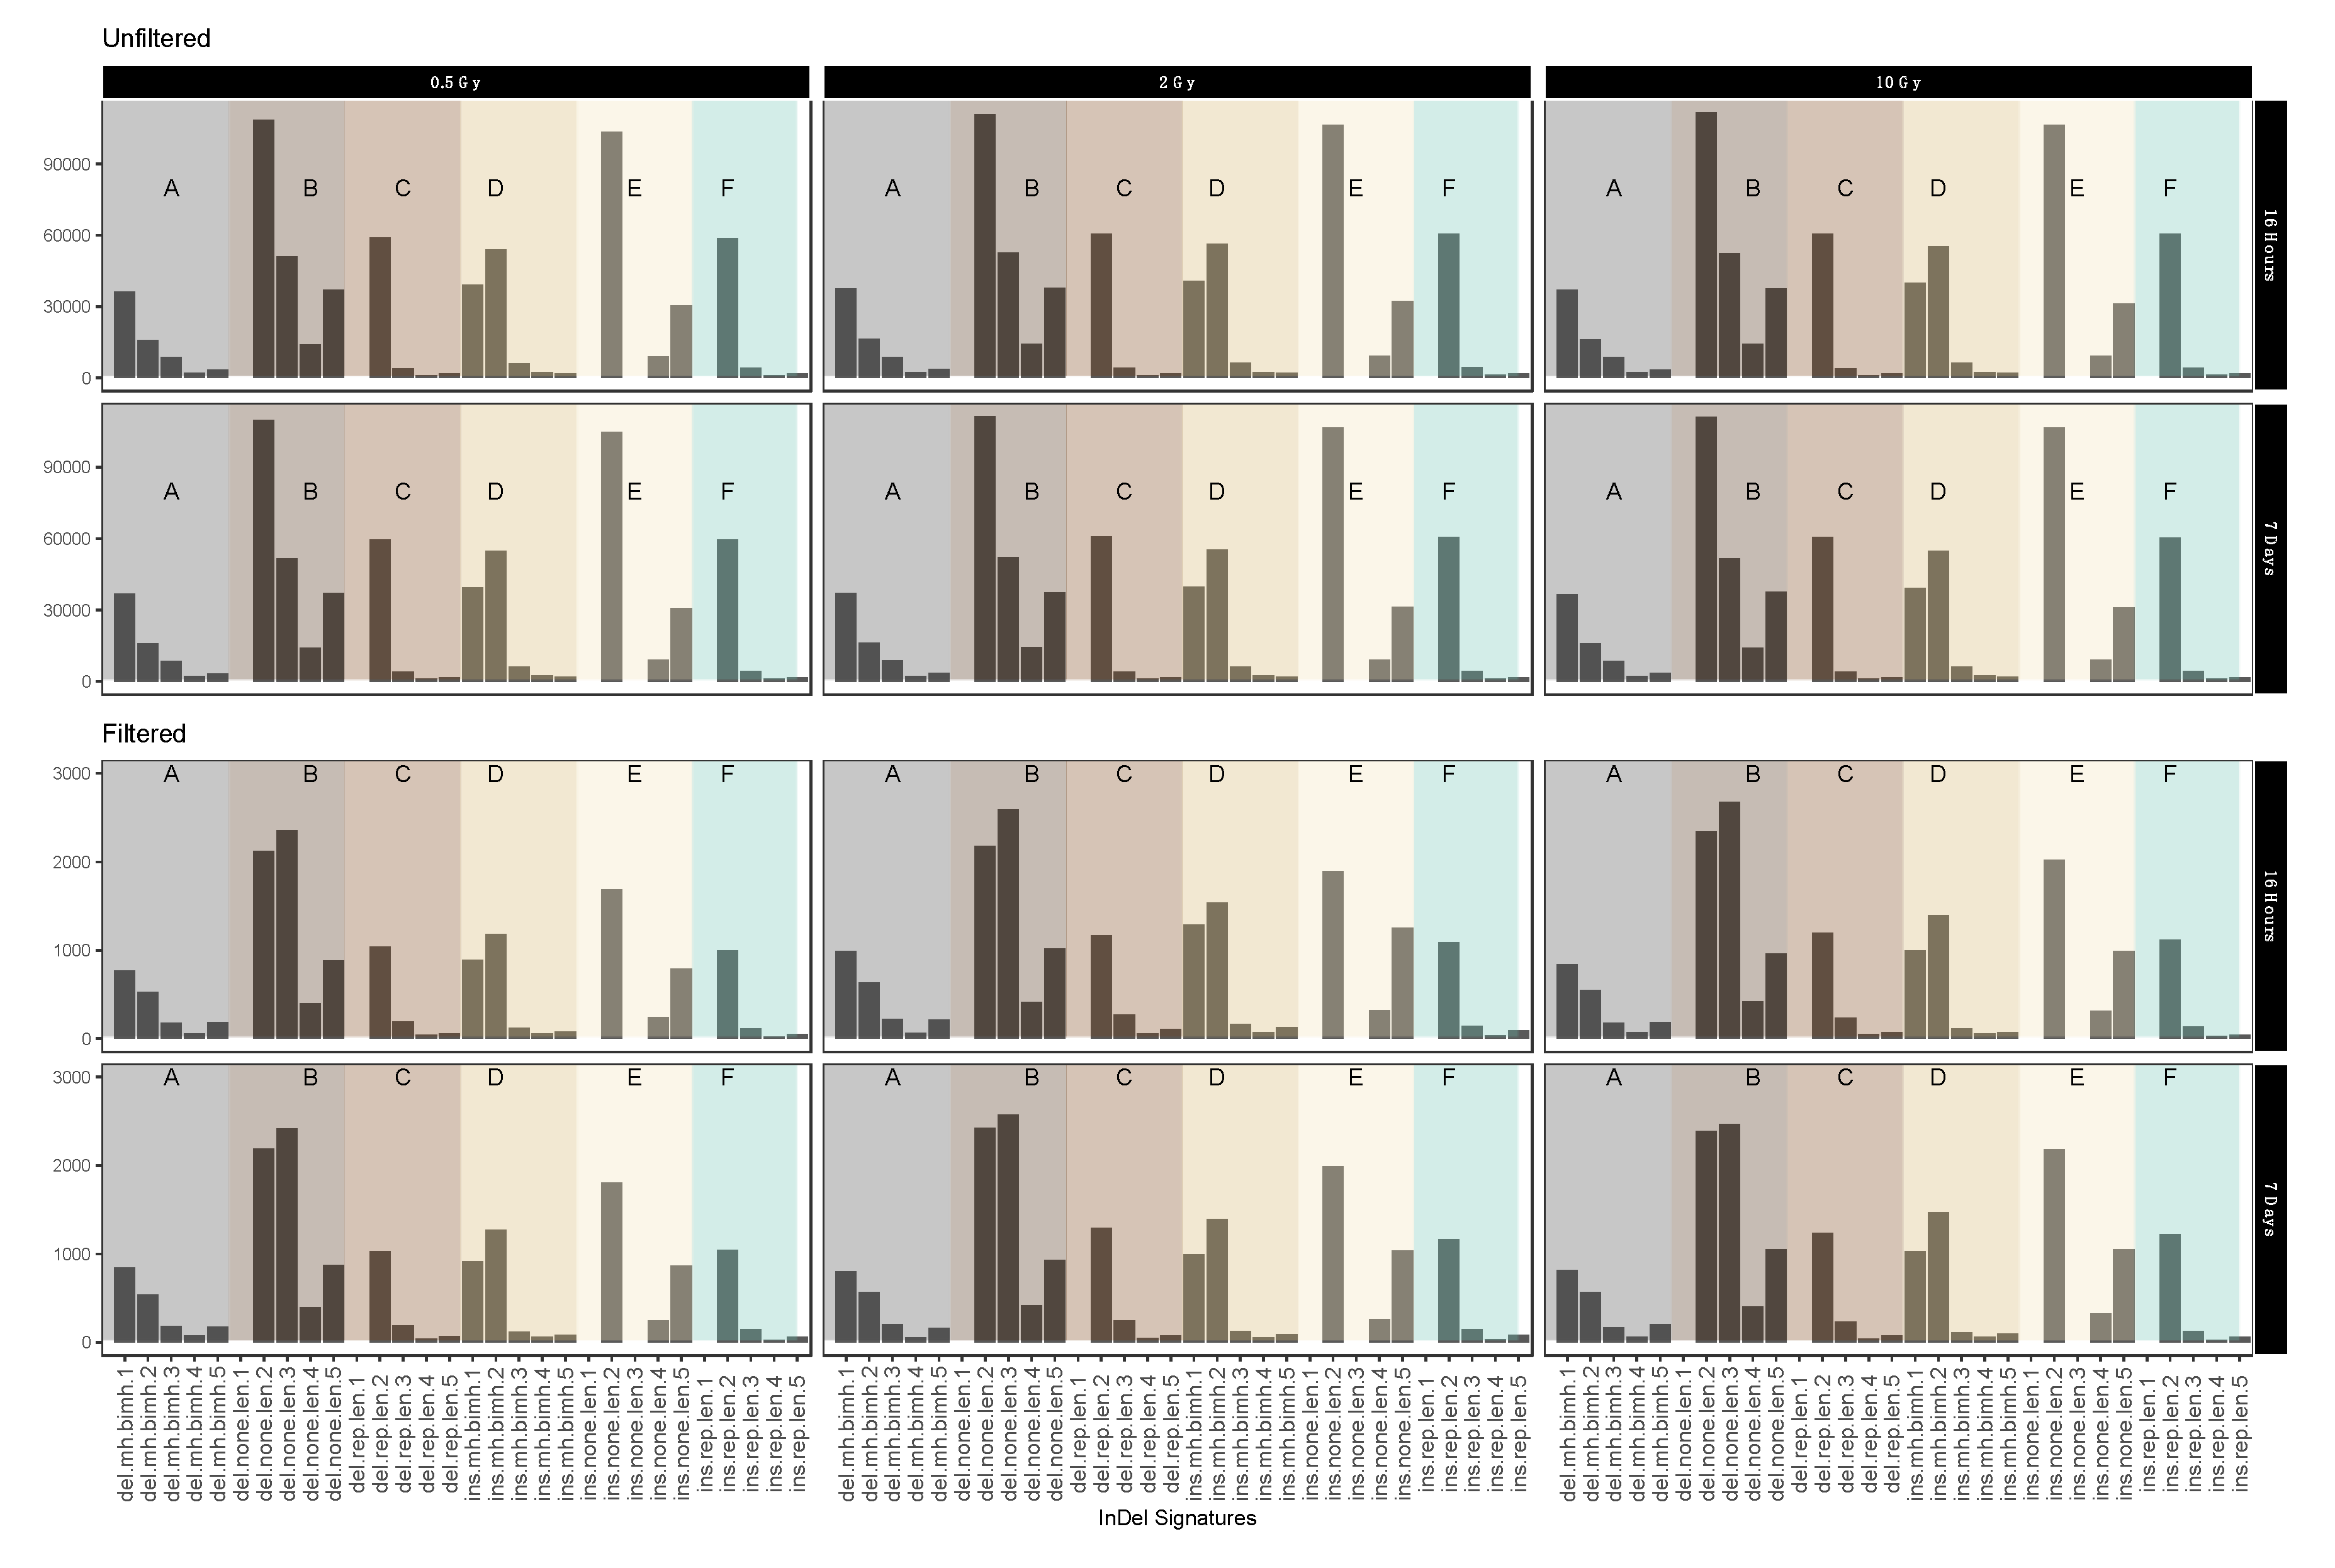
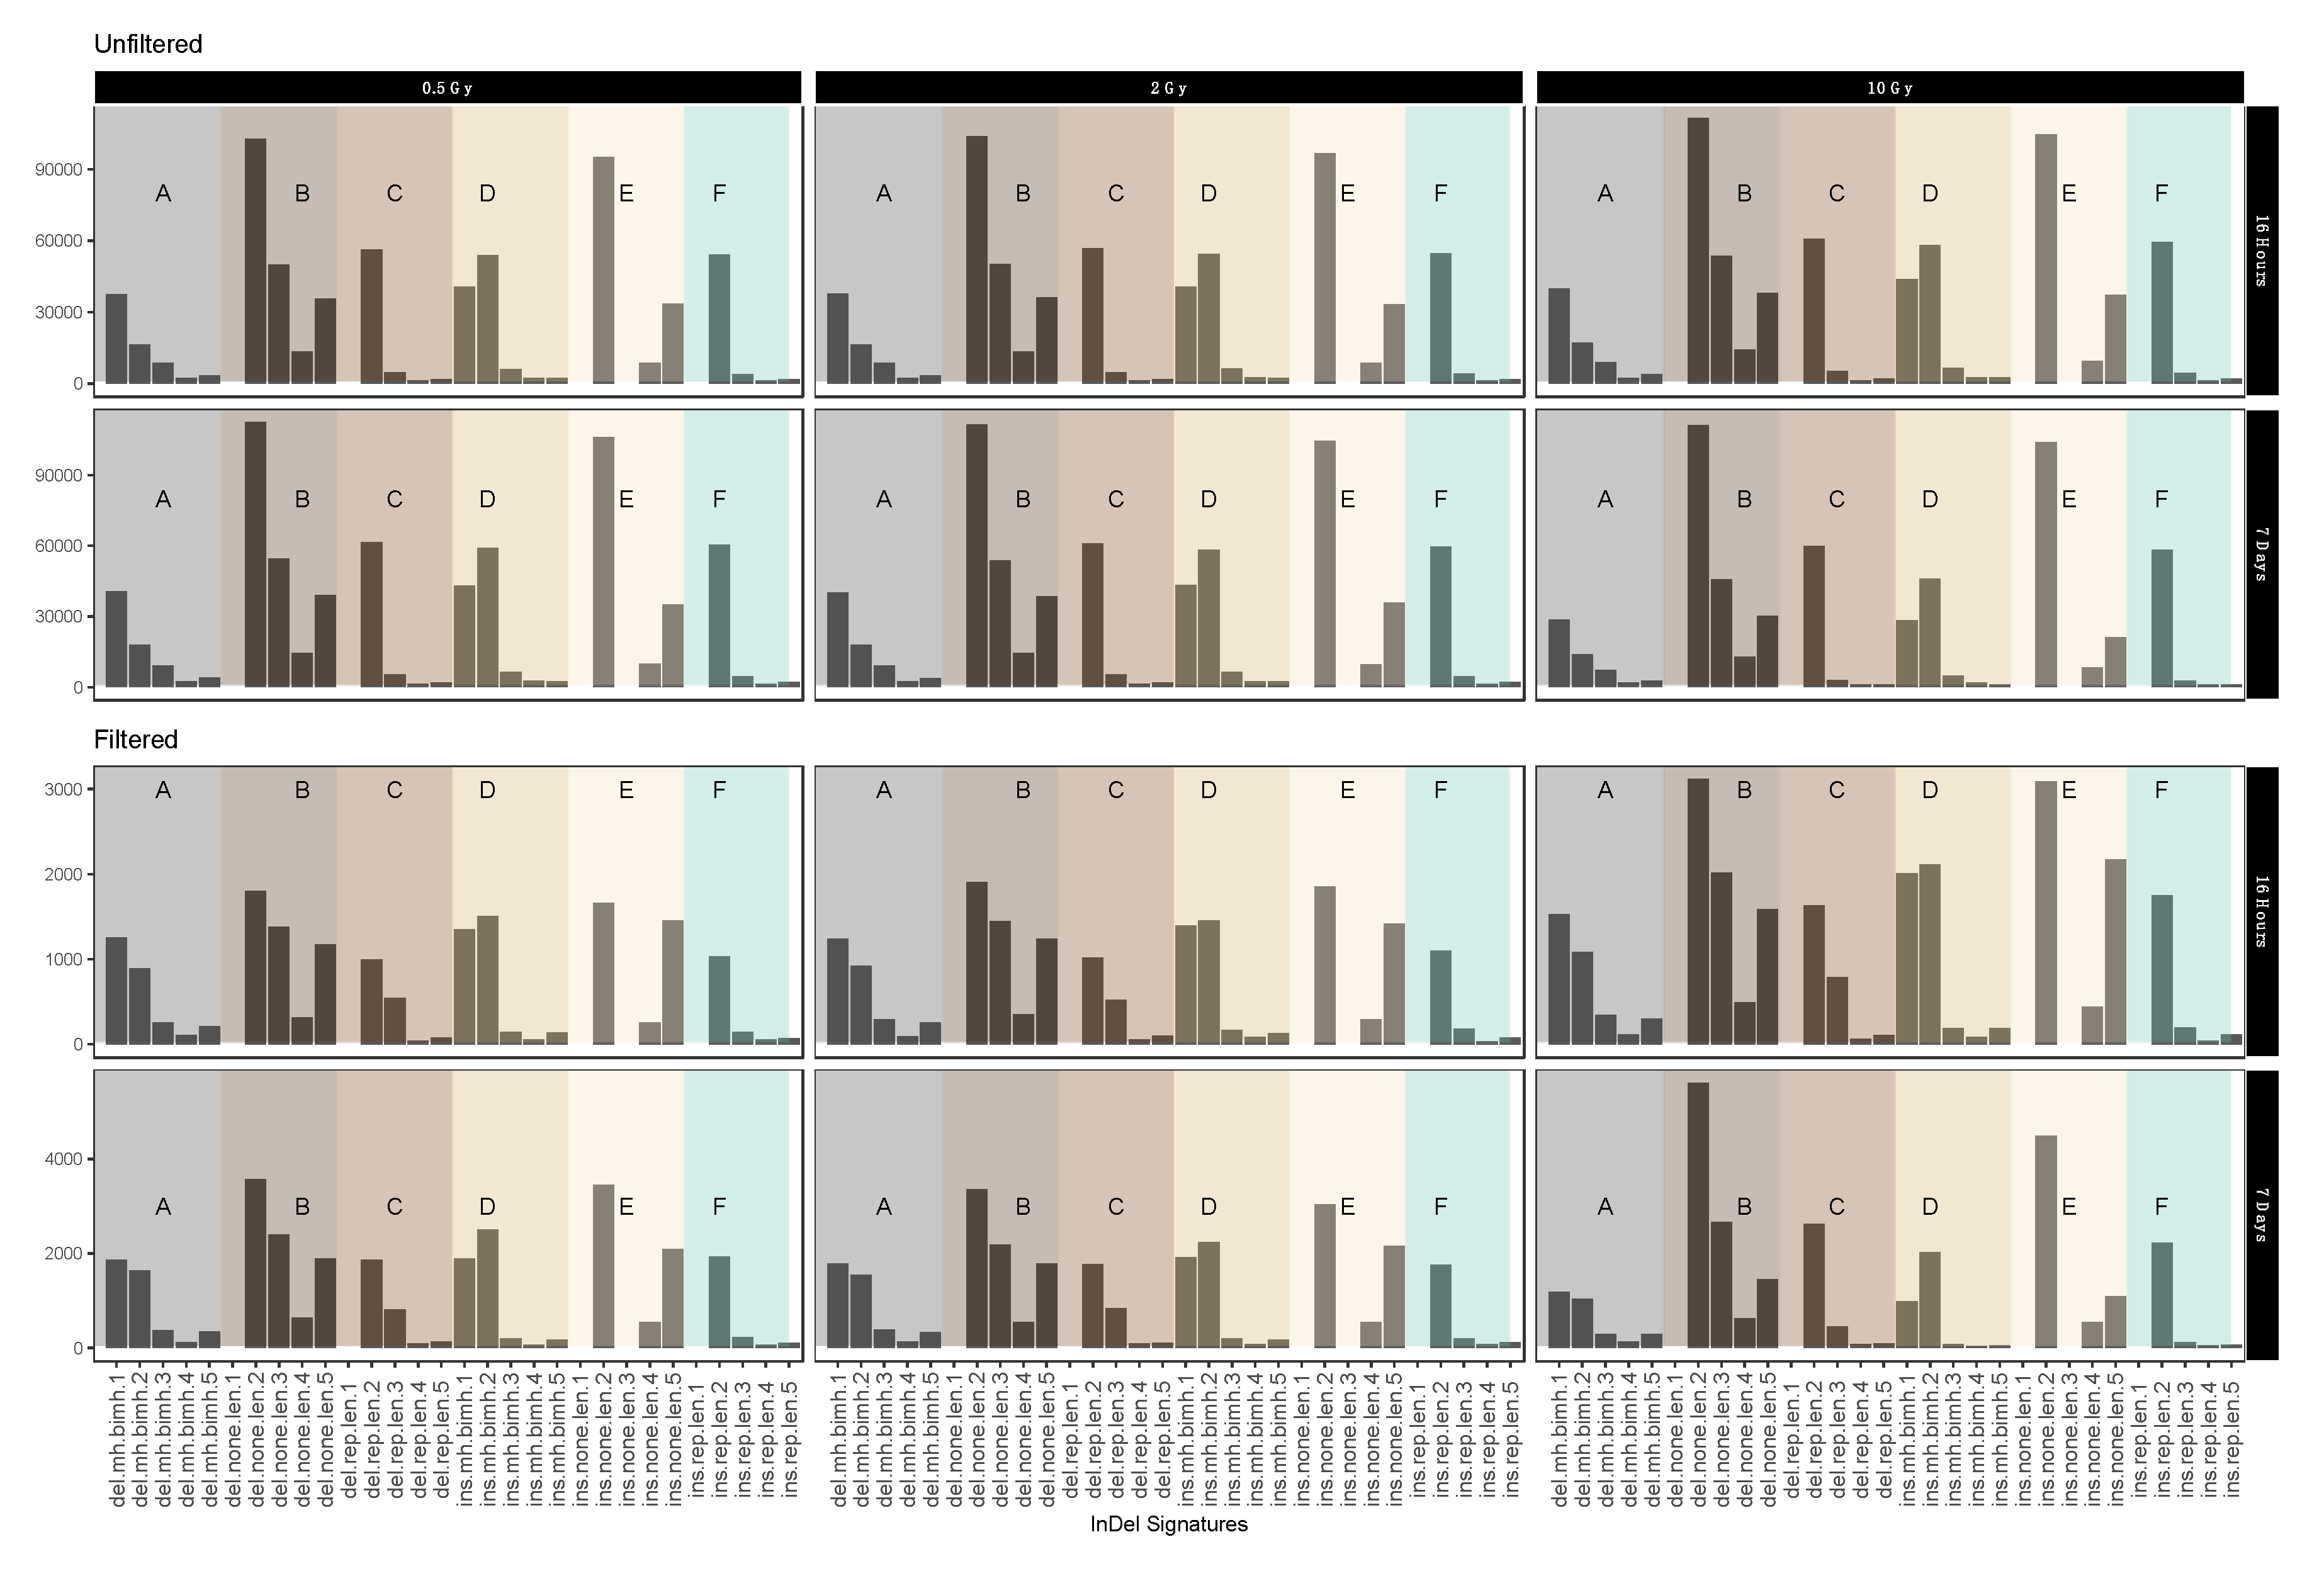
2.4. InDel-specific Signatures
3. Discussion
3.1. Dose-Response Correlation
3.2. Mutational Signatures on a Genomic Level
3.3. Intrachromosomal IR-Related Mutation Patterns
4. Materials and Methods
4.1. Cell Culture and IR Treatment
4.2. Next-Generation Sequencing Analysis
4.3. Bioinformatics Analysis
4.4. Data Filtering
4.5. Translocation Analysis
4.6. Variant Accumulation Analysis
4.7. SNV-based analyses
4.8. InDel-Based Analyses
4.9. Functional Annotation
Author Contributions
Funding
Acknowledgments
Conflicts of Interest
Abbreviations
| IR | Ionizing radiation |
| DSB | Double strand break |
| NHEJ | Non-homologous end joining |
| HR | Homologous recombination |
| MMEJ | Microhomology-mediated end joining |
| InDel | Insertion or deletion |
| SNV | Single Nucleotide Variants |
| HGF | Human Gingiva Fibroblasts |
| NGS | Next generation sequencing |
| Ti | Transition |
| Tv | Transversion |
| WGS | Whole genome sequencing |
| TAD | Topological Associating Domain |
| TCR | Transcription-coupled repair |
| iPSCs | Induced pluripotent stem cells |
| MMR | Mismatch repair |
| CTCF | CCCTC-binding factor |
| GATK | Genome Analysis Toolkit |
| DP | Sequencing Depth, number of reads during variant calling step |
| GQ | Genotype Quality based on Phred-Scaled confidence of assigned genotype |
| RefSeq | Reference Sequence |
Appendix A


| ID | Sample ID | Time | Dosage | Functional Effect | Putative Impact | GeneName | Transcript ID | Refseq mrna |
|---|---|---|---|---|---|---|---|---|
| chr19:20044988_C/G | 393 | 16 h | 0.5 Gy | stop_gained | HIGH | ZNF93 | ENST00000343769 | NM_031218 |
| chr19:50040366_G/A | 448 | 7 Days | 2 Gy | stop_gained | HIGH | RCN3 | ENST00000597801 | NA |
| chr19:52904936_A/T | 448 | 7 Days | 2 Gy | splice_acceptor_variant&intron_variant | HIGH | ZNF528 | ENST00000360465 | NM_032423 |
| chr19:52904936_A/T | 448 | 7 Days | 2 Gy | splice_acceptor_variant&intron_variant | HIGH | ZNF528 | ENST00000436397 | NA |
| chr19:52904936_A/T | 448 | 7 Days | 2 Gy | splice_acceptor_variant&intron_variant | HIGH | ZNF528 | ENST00000391787 | NA |
| chr19:52904936_A/T | 448 | 7 Days | 2 Gy | splice_acceptor_variant&intron_variant | HIGH | ZNF528 | ENST00000494167 | NA |
| chr19:52904936_A/T | 448 | 7 Days | 2 Gy | splice_acceptor_variant&intron_variant | HIGH | ZNF528 | ENST00000493272 | NA |
| chr19:52904936_A/T | 448 | 7 Days | 2 Gy | splice_acceptor_variant&intron_variant | HIGH | ZNF528 | ENST00000531472 | NA |
| chr19:52904937_G/T | 448 | 7 Days | 2 Gy | splice_acceptor_variant&intron_variant | HIGH | ZNF528 | ENST00000360465 | NM_032423 |
| chr19:52904937_G/T | 448 | 7 Days | 2 Gy | splice_acceptor_variant&intron_variant | HIGH | ZNF528 | ENST00000436397 | NA |
| chr19:52904937_G/T | 448 | 7 Days | 2 Gy | splice_acceptor_variant&intron_variant | HIGH | ZNF528 | ENST00000391787 | NA |
| chr19:52904937_G/T | 448 | 7 Days | 2 Gy | splice_acceptor_variant&intron_variant | HIGH | ZNF528 | ENST00000494167 | NA |
| chr19:52904937_G/T | 448 | 7 Days | 2 Gy | splice_acceptor_variant&intron_variant | HIGH | ZNF528 | ENST00000493272 | NA |
| chr19:52904937_G/T | 448 | 7 Days | 2 Gy | splice_acceptor_variant&intron_variant | HIGH | ZNF528 | ENST00000531472 | NA |
| chr19:39229056_A/C | 449 | 7 Days | 10 Gy | splice_donor_variant&intron_variant | HIGH | CAPN12 | ENST00000328867 | NM_144691 |
| chr19:39229056_A/C | 449 | 7 Days | 10 Gy | splice_donor_variant&intron_variant | HIGH | CAPN12 | ENST00000601953 | NA |
| chr19:52904936_A/T | 449 | 7 Days | 10 Gy | splice_acceptor_variant&intron_variant | HIGH | ZNF528 | ENST00000360465 | NM_032423 |
| chr19:52904936_A/T | 449 | 7 Days | 10 Gy | splice_acceptor_variant&intron_variant | HIGH | ZNF528 | ENST00000436397 | NA |
| chr19:52904936_A/T | 449 | 7 Days | 10 Gy | splice_acceptor_variant&intron_variant | HIGH | ZNF528 | ENST00000391787 | NA |
| chr19:52904936_A/T | 449 | 7 Days | 10 Gy | splice_acceptor_variant&intron_variant | HIGH | ZNF528 | ENST00000494167 | NA |
| chr19:52904936_A/T | 449 | 7 Days | 10 Gy | splice_acceptor_variant&intron_variant | HIGH | ZNF528 | ENST00000493272 | NA |
| chr19:52904936_A/T | 449 | 7 Days | 10 Gy | splice_acceptor_variant&intron_variant | HIGH | ZNF528 | ENST00000531472 | NA |
References
- Nénot, J.C. Radiation accidents: Lessons learnt for future radiological protection. Int. J. Radiat Biol. 1998, 73, 435–442. [Google Scholar] [CrossRef] [PubMed]
- Ward, J.F. DNA Damage Produced by Ionizing Radiation in Mammalian Cells: Identities, Mechanisms of Formation, and Reparability. In Progress in Nucleic Acid Research and Molecular Biology; Cohn, W.E., Moldave, K., Eds.; Academic Press: Cambridge, MA, USA, 1988; pp. 95–125. [Google Scholar]
- Van Gent, D.C.; Hoeijmakers, J.H.J.; Kanaar, R. Chromosomal stability and the DNA double-stranded break connection. Nat. Rev. Genet. 2001, 2, 196–206. [Google Scholar] [CrossRef] [PubMed]
- Bree, R.T.; Neary, C.; Samali, A.; Lowndes, N.F. The switch from survival responses to apoptosis after chromosomal breaks. Dna Repair 2004, 3, 989–995. [Google Scholar] [CrossRef] [PubMed]
- Rodgers, K.; McVey, M. Error-Prone Repair of DNA Double-Strand Breaks. J. Cell Physiol. 2016, 231, 15–24. [Google Scholar] [CrossRef] [PubMed] [Green Version]
- Chatterjee, N.; Walker, G.C. Mechanisms of DNA damage, repair, and mutagenesis. Environ. Mol. Mutagen. 2017, 58, 235–263. [Google Scholar] [CrossRef] [PubMed] [Green Version]
- Nik-Zainal, S.; Davies, H.; Staaf, J.; Ramakrishna, M.; Glodzik, D.; Zou, X.; Martincorena, I.; Alexandrov, L.B.; Martin, S.; Wedge, D.C.; et al. Landscape of somatic mutations in 560 breast cancer whole-genome sequences. Nature 2016, 534, 47–54. [Google Scholar] [CrossRef] [PubMed]
- Guirouilh-Barbat, J.; Huck, S.; Bertrand, P.; Pirzio, L.; Desmaze, C.; Sabatier, L.; Lopez, B.S. Impact of the KU80 Pathway on NHEJ-Induced Genome Rearrangements in Mammalian Cells. Mol. Cell 2004, 14, 611–623. [Google Scholar] [CrossRef] [PubMed]
- Lu, Y.; Goldstein, D.B.; Angrist, M.; Cavalleri, G. Personalized Medicine and Human Genetic Diversity. Cold Spring Harb. Perspect Med. 2014, 4, 1–11. [Google Scholar] [CrossRef] [Green Version]
- Bomba, L.; Walter, K.; Soranzo, N. The impact of rare and low-frequency genetic variants in common disease. Genome Biol. 2017, 18, 1–17. [Google Scholar] [CrossRef]
- Bibault, J.E.; Tinhofer, I. The role of Next-Generation Sequencing in tumoral radiosensitivity prediction. Clin. Transl. Radiat Oncol. 2017, 3, 16–20. [Google Scholar] [CrossRef] [Green Version]
- Nath, N.; Esche, J.; Muller, J.; Jensen, L.R.; Port, M.; Stanke, M.; Kaderali, L.; Scherthan, H.; Kuss, A.W. Exome Sequencing Discloses Ionizing-radiation-induced DNA Variants in the Genome of Human Gingiva Fibroblasts. Health Phys. 2018, 115, 151–160. [Google Scholar] [CrossRef] [PubMed]
- Adewoye, A.B.; Lindsay, S.J.; Dubrova, Y.E.; Hurles, M.E. The genome-wide effects of ionizing radiation on mutation induction in the mammalian germline. Nat. Commun. 2015, 6, 1–8. [Google Scholar] [CrossRef] [PubMed] [Green Version]
- Sanders, J.T.; Freeman, T.F.; Xu, Y.; Golloshi, R.; Stallard, M.A.; Martin, R.S.; Balajee, A.S.; McCord, R.P. Radiation-Induced DNA Damage and Repair Effects on 3D Genome Organization. BioRxiv 2019, 740704. [Google Scholar] [CrossRef]
- Surrallés, J.; Darroudi, F.; Natarajan, A.T. Low level of DNA repair in human chromosome I heterochromatin. Genes Chromosom Cancer 1997, 20, 173–184. [Google Scholar] [CrossRef]
- Falk, M.; Lukasova, E.; Kozubek, S. Chromatin structure influences the sensitivity of DNA to γ-radiation. Biochim Biophys Acta Mol Cell Res. 2008, 1783, 2398–2414. [Google Scholar] [CrossRef] [Green Version]
- Scherer, S. Guide to the Human Genome; Cold Spring Harbor Laboratory Press: Cold Spring Harbor, NY, USA, 2010. [Google Scholar] [CrossRef]
- Dixon, J.R.; Selvaraj, S.; Yue, F.; Kim, A.; Li, Y.; Shen, Y.; Hu, M.; Liu, J.S.; Ren, B. Topological domains in mammalian genomes identified by analysis of chromatin interactions. Nature 2012, 485, 376–380. [Google Scholar] [CrossRef] [Green Version]
- Cingolani, P.; Platts, A.; Wang, L.L.; Coon, M.; Nguyen, T.; Wang, L.; Land, S.J.; Lu, X. A program for annotating and predicting the effects of single nucleotide polymorphisms, SnpEff. Fly 2012, 6, 80–92. [Google Scholar] [CrossRef] [Green Version]
- Marteijn, J.A.; Lans, H.; Vermeulen, W.; Hoeijmakers, J.H.J. Understanding nucleotide excision repair and its roles in cancer and ageing. Nat. Rev. Mol Cell Biol. 2014, 15, 465–481. [Google Scholar] [CrossRef]
- Tsouroula, K.; Furst, A.; Rogier, M.; Heyer, V.; Maglott-Roth, A.; Ferrand, A.; Reina-San-Martin, B.; Soutoglou, E. Temporal and Spatial Uncoupling of DNA Double Strand Break Repair Pathways within Mammalian Heterochromatin. Mol. Cell 2016, 63, 293–305. [Google Scholar] [CrossRef] [Green Version]
- Brahme, A. Accurate Description of the Cell Survival and Biological Effect at Low and High Doses and LET’s. J. Radiat Res. 2011, 52, 389–407. [Google Scholar] [CrossRef] [Green Version]
- Beck, M.; Moreels, M.; Jacquet, P.; Van Oostveldt, P.; De Vos, W.H.; Baatout, S. X-irradiation induces cell death in fetal fibroblasts. Int. J. Mol. Med. 2012, 30, 114–118. [Google Scholar] [CrossRef] [PubMed] [Green Version]
- Tsuboi, K.; Moritake, T.; Tsuchida, Y.; Tokuuye, K.; Matsumura, A.; Ando, K. Cell cycle checkpoint and apoptosis induction in glioblastoma cells and fibroblasts irradiated with carbon beam. J. Radiat Res. 2007, 48, 317–325. [Google Scholar] [CrossRef] [PubMed] [Green Version]
- Lin, C.-C.; Wu, L.S.-H.; Lee, K.F. The Potential Effect of Different Doses of Ionizing Radiation on Genes and Disease. Dose-Response 2019, 17. [Google Scholar] [CrossRef] [PubMed] [Green Version]
- Cornforth, M.N. Perspectives on the formation of radiation-induced exchange aberrations. DNA Repair 2006, 5, 1182–1191. [Google Scholar] [CrossRef] [PubMed]
- Balajee, A.S.; Sanders, J.T.; Golloshi, R.; Shuryak, I.; McCord, R.P.; Dainiak, N. Investigation of Spatial Organization of Chromosome Territories in Chromosome Exchange Aberrations After Ionizing Radiation Exposure. Health Phys. 2018, 115, 77–89. [Google Scholar] [CrossRef] [PubMed]
- Camparoto, M.L.; Takahashi-Hyodo, S.A.; Dauwerse, J.G.; Natarajan, A.T.; Sakamoto-Hojo, E.T. High susceptibility of chromosome 16 to radiation-induced chromosome rearrangements in human lymphocytes under in vivo and in vitro exposure. Cytogenet Genome Res. 2005, 108, 287–292. [Google Scholar] [CrossRef]
- Behjati, S.; Gundem, G.; Wedge, D.C.; Roberts, N.D.; Tarpey, P.S.; Cooke, S.L.; Loo, P.V.; Alexandrov, L.B.; Ramakrishna, M.; Davies, H.; et al. Mutational signatures of ionizing radiation in second malignancies. Nat. Commun. 2016, 7, 12605. [Google Scholar] [CrossRef] [Green Version]
- Shibata, A.; Jeggo, P.A. Canonical DNA non-homologous end-joining; capacity versus fidelity. BJR 2020, 20190966. [Google Scholar] [CrossRef]
- Kucab, J.E.; Zou, X.; Morganella, S.; Joel, M.; Nanda, A.S.; Nagy, E.; Gomez, C.; Degasperi, A.; Harris, R.; Jackson, S.P.; et al. A Compendium of Mutational Signatures of Environmental Agents. Cell 2019, 177, 821–836.e16. [Google Scholar] [CrossRef] [Green Version]
- Yuan, J.; Yeasky, T.M.; Rhee, M.C.; Glazer, P.M. Frequent T:A→G:C transversions in X-irradiated mouse cells. Carcinogenesis 1995, 16, 83–88. [Google Scholar] [CrossRef]
- Hase, Y.; Satoh, K.; Seito, H.; Oono, Y. Genetic Consequences of Acute/Chronic Gamma and Carbon Ion Irradiation of Arabidopsis thaliana. Front. Plant Sci. 2020, 11, 336. [Google Scholar] [CrossRef] [PubMed] [Green Version]
- Nath, N.; Hagenau, L.; Weiss, S.; Tzvetkova, A.; Jensen, L.R.; Kaderali, L.; Port, M.; Scherthan, H.; Kuss, A.W. Ionizing Radiation alters the transition / transversion ratio in the exome of human gingiva fibroblasts. Health Phys. 2019, 119, 109–117. [Google Scholar] [CrossRef] [PubMed]
- Waris, G.; Ahsan, H. Reactive oxygen species: Role in the development of cancer and various chronic conditions. J. Carcinog. Wolters Kluwer Medknow Publ. 2006, 14. [Google Scholar] [CrossRef]
- Lujan, S.A.; Williams, J.S.; Pursell, Z.F.; Abdulovic-Cui, A.A.; Clark, A.B.; Nick McElhinny, S.A.; Kunkel, T.A. Mismatch Repair Balances Leading and Lagging Strand DNA Replication Fidelity. PLoS Genet. 2012, 8. [Google Scholar] [CrossRef] [PubMed]
- Tanaka, M.; Takahara, M.; Nukina, K.; Hayashi, A.; Sakai, W.; Sugasawa, K.; Shiomi, Y. Mismatch repair proteins recruited to ultraviolet light-damaged sites lead to degradation of licensing factor Cdt1 in the G1 phase. Cell Cycle. 2017, 16, 673–684. [Google Scholar] [CrossRef] [PubMed] [Green Version]
- Peña-Diaz, J.; Bregenhorn, S.; Ghodgaonkar, M.; Follonier, C.; Artola-Borán, M.; Castor, D.; Lopes, M.; Sartori, A.A.; Jiricny, J. Noncanonical Mismatch Repair as a Source of Genomic Instability in Human Cells. Mol. Cell. 2012, 47, 669–680. [Google Scholar] [CrossRef] [Green Version]
- Mosesso, P.; Palitti, F.; Pepe, G.; Piñero, J.; Bellacima, R.; Ahnstrom, G.; Natarajan, A.T. Relationship between chromatin structure, DNA damage and repair following X-irradiation of human lymphocytes. Mutat. Res. Genet. Toxicol. Environ. Mutagenesis 2010, 701, 86–91. [Google Scholar] [CrossRef] [Green Version]
- Grimwood, J.; Gordon, L.A.; Olsen, A.; Terry, A.; Schmutz, J.; Lamerdin, J.; Hellsten, U.; Goodstein, D.; Couronne, O.; Tran-Gyamfi, M.; et al. The DNA sequence and analysis of human chromosome 19. Nature 2004, 428, 522–528. [Google Scholar] [CrossRef] [Green Version]
- Bellefroid, E.J.; Marine, J.C.; Matera, A.G.; Bourguignon, C.; Desai, T.; Healy, K.C.; Bray-Ward, P.; Martial, J.A.; Ihle, J.N.; Ward, D.A. Emergence of the ZNF91 Krüppel-associated box-containing zinc finger gene family in the last common ancestor of anthropoidea. Proc. Natl. Acad. Sci. USA 1995, 92, 10757. [Google Scholar] [CrossRef] [Green Version]
- Eichler, E.E.; Hoffman, S.M.; Adamson, A.A.; Gordon, L.A.; McCready, P.; Lamerdin, J.E.; Mohrenweiser, H.W. Complex β-Satellite Repeat Structures and the Expansion of the Zinc Finger Gene Cluster in 19p12. Genome Res. 1998, 8, 791–808. [Google Scholar] [CrossRef] [Green Version]
- Jinks-Robertson, S.; Bhagwat, A.S. Transcription-Associated Mutagenesis. Annu Rev. Genet. 2014, 48, 341–359. [Google Scholar] [CrossRef] [PubMed]
- Lavelle, C.; Foray, N. Chromatin structure and radiation-induced DNA damage: From structural biology to radiobiology. Int. J. Biochem. Cell Biol. 2014, 49, 84–97. [Google Scholar] [CrossRef] [PubMed]
- Szabo, Q.; Bantignies, F.; Cavalli, G. Principles of genome folding into topologically associating domains. Sci. Adv. 2019, 5. [Google Scholar] [CrossRef] [Green Version]
- Natale, F.; Rapp, A.; Yu, W.; Maiser, A.; Harz, H.; Scholl, A.; Grulich, S.; Anton, T.; Hörl, D.; Chen, W.; et al. Identification of the elementary structural units of the DNA damage response. Nat. Commun. 2017, 8. [Google Scholar] [CrossRef]
- Lang, F.; Li, X.; Zheng, W.; Li, Z.; Lu, D.; Chen, G.; Gong, D.; Yang, L.; Fu, J.; Shi, P.; et al. CTCF prevents genomic instability by promoting homologous recombination-directed DNA double-strand break repair. Proc. Natl. Acad. Sci. USA 2017, 114, 10912–10917. [Google Scholar] [CrossRef] [PubMed] [Green Version]
- Hilmi, K.; Jangal, M.; Marques, M.; Zhao, T.; Saad, A.; Zhang, C.; Luo, V.M.; Syme, A.; Rejon, C.; Yu, Z.; et al. CTCF facilitates DNA double-strand break repair by enhancing homologous recombination repair. Sci. Adv. 2017, 3, 1–14. [Google Scholar] [CrossRef] [Green Version]
- Weissmann, R.; Kacprowski, T.; Peper, M.; Esche, J.; Jensen, L.R.; Van Diepen, L.; Port, M.; Kuss, A.W.; Scherthan, H. Transcriptome alterations in X-irradiated human gingiva fibroblasts. Health Phys. 2016, 111, 75–84. [Google Scholar] [CrossRef] [Green Version]
- McPherson, A.; Chen, K.; Wu, C.; Wallis, J.W.; Wyatt, A.W.; McLellan, M.D.; McGrath, S.D.; Wendl, M.C.; Zhang, Q.; Locke, D.P.; et al. BreakDancer: An algorithm for high-resolution mapping of genomic structural variation: Article: Nature Methods. Nat. Methods. 2009, 6, 677–681. [Google Scholar] [CrossRef]


| Time | Radiation Dose | Functional Impacts | Inter-Chromosomal Translocations | |||
|---|---|---|---|---|---|---|
| Dataset 1 | High | Moderate | Low | Modifier | ||
| 0.5 Gy | 14 | 189 | 3785 | 33,384 | 22 | |
| 16 h | 2 Gy | 21 | 226 | 3800 | 35,714 | 24 |
| 10 Gy | 15 | 222 | 3984 | 35,514 | 19 | |
| 0.5 Gy | 18 | 216 | 3408 | 33,189 | 59 | |
| 7 Days | 2 Gy | 12 | 263 | 3717 | 35,336 | 90 |
| 10 Gy | 22 | 208 | 3980 | 36,754 | 74 | |
| Dataset 2 | ||||||
| 0.5 Gy | 19 | 277 | 4849 | 50,437 | 14 | |
| 16 h | 2 Gy | 49 | 262 | 5119 | 52,567 | 10 |
| 10 Gy | 30 | 432 | 6107 | 60,561 | 16 | |
| 0.5 Gy | 62 | 1857 | 14,227 | 76,636 | 23 | |
| 7 Days | 2 Gy | 36 | 475 | 7416 | 69,550 | 26 |
| 10 Gy | 40 | 210 | 11,140 | 68,032 | 20 | |
| Time | Radiation Dose | SNVs Depth (DP) After (Before) Filter | InDels Depth (DP) After (Before) Filter | SNVs Counts After (Before) Filter | InDels Counts After (Before) Filter |
|---|---|---|---|---|---|
| Dataset 1 | |||||
| 16 h | 0.5 Gy | 1,029,599 (206,573,706) | 334,619 (25,449,747) | 34,261 (3,839,076) | 15,083 (715,406) |
| 2 Gy | 1,098,772 (221,379,800) | 372,440 (27,846,456) | 36,674 (3,859,535) | 17,982 (739,759) | |
| 10 Gy | 1,101,857 (222,284,695) | 379,065 (28,064,422) | 36,435 (3,854,999) | 17,098 (734,831) | |
| 7 Days | 0.5 Gy | 1,030,578 (217,184,675) | 352,673 (26,948,643) | 34,078 (3,846,812) | 15,698 (724,272) |
| 2 Gy | 1,092,867 (217,841,944) | 369,254 (27,518,060) | 36,256 (3,850,694) | 17,188 (734,633) | |
| 10 Gy | 1,142,613 (236,100,648) | 397,153 (29,973,246) | 36,836 (3,778,441) | 17,518 (730,883) | |
| Dataset 2 | |||||
| 16 h | 0.5 Gy | 1,166,694 (130,621,022) | 242,653 (6,073,404) | 50,516 (3,848,840) | 16,987 (252,782) |
| 2 Gy | 1,137,296 (123,863,517) | 234,141 (5,764,483) | 52,666 (3,852,339) | 17,675 (254,521) | |
| 10 Gy | 1,474,964 (153,573,569) | 351,819 (7,637,043) | 60,688 (3,901,398) | 25,620 (269,267) | |
| 7 Days | 0.5 Gy | 2,268,357 (187,652,991) | 478,893 (9,473,714) | 77,818 (3,953,911) | 29,045 (274,854) |
| 2 Gy | 1,825,231 (17,5864,812) | 432,240 (8,902,319) | 69,691 (3,930,167) | 27,463 (272,142) | |
| 10 Gy | 387,902 (84,432,203) | 266,508 (1,973,176) | 27,251 (3,510,867) | 28,387 (91,240) |
| Terms | Definition | Average Log Fold Change Form Filtered to Unfiltered |
|---|---|---|
| Del.mh.bimh.x (A) | Deletion in area of microhomology | −1.66 |
| Del.none.len.x (B) | Deletion in undistinguished area | −1.69 |
| Del.rep.len.x (C) | Deletion in repeat area | −1.72 |
| Ins.mh.bimh.x (D) | Insertion in area of microhomology | −1.70 |
| Ins.none.len.x (E) | Insertion in undistinguished area | −1.74 |
| Ins.rep.len.x (F) | Insertion in repeat area | −1.74 |
| SnpEff Sequence Ontology | Combined Terms |
|---|---|
| splice_region_variant&intron_variant; splice_region_variant; splice_region_variant&synonymous_variant; splice_region_variant&non_coding_exon_variant | splice_region |
| splice_acceptor_variant&intron_variant; splice_donor_variant&intron_variant; splice_acceptor_variant&splice_donor_variant&intron_variant | splice_site |
| missense_variant&splice_region_variant | missense_variant |
| stop_retained_variant | synonymous_variant |
| stop_gained&splice_region_variant | stop_gained |
| 5_prime_UTR_premature_start_codon_gain_variant | 5_prime_UTR_variant |
© 2020 by the authors. Licensee MDPI, Basel, Switzerland. This article is an open access article distributed under the terms and conditions of the Creative Commons Attribution (CC BY) license (http://creativecommons.org/licenses/by/4.0/).
Share and Cite
Nath, N.; Hagenau, L.; Weiss, S.; Tzvetkova, A.; Jensen, L.R.; Kaderali, L.; Port, M.; Scherthan, H.; Kuss, A.W. Genome-Wide DNA Alterations in X-Irradiated Human Gingiva Fibroblasts. Int. J. Mol. Sci. 2020, 21, 5778. https://doi.org/10.3390/ijms21165778
Nath N, Hagenau L, Weiss S, Tzvetkova A, Jensen LR, Kaderali L, Port M, Scherthan H, Kuss AW. Genome-Wide DNA Alterations in X-Irradiated Human Gingiva Fibroblasts. International Journal of Molecular Sciences. 2020; 21(16):5778. https://doi.org/10.3390/ijms21165778
Chicago/Turabian StyleNath, Neetika, Lisa Hagenau, Stefan Weiss, Ana Tzvetkova, Lars R. Jensen, Lars Kaderali, Matthias Port, Harry Scherthan, and Andreas W. Kuss. 2020. "Genome-Wide DNA Alterations in X-Irradiated Human Gingiva Fibroblasts" International Journal of Molecular Sciences 21, no. 16: 5778. https://doi.org/10.3390/ijms21165778