Article

The Temperature-Dependent Retention of Introns in GPI8 Transcripts Contributes to a Drooping and Fragile Shoot Phenotype in Rice

1
Key Laboratory of Plant Resources Conservation and Sustainable Utilization, South China Botanical Garden, Innovation Academy for Seed Design, Chinese Academy of Sciences, Guangzhou 510650, China
2
University of Chinese Academy of Sciences, Beijing 100049, China
3
State Key Laboratory of Plant Genomics, Institute of Genetics and Developmental Biology, Chinese Academy of Sciences, Beijing 100101, China
*
Author to whom correspondence should be addressed.
Int. J. Mol. Sci. 2020, 21(1), 299; https://doi.org/10.3390/ijms21010299
Submission received: 14 November 2019 / Revised: 25 December 2019 / Accepted: 30 December 2019 / Published: 31 December 2019
(This article belongs to the Section Molecular Biology)

Abstract

:
Attachment of glycosylphosphatidylinositols (GPIs) to the C-termini of proteins is one of the most common posttranslational modifications in eukaryotic cells. GPI8/PIG-K is the catalytic subunit of the GPI transamidase complex catalyzing the transfer en bloc GPI to proteins. In this study, a T-DNA insertional mutant of rice with temperature-dependent drooping and fragile (df) shoots phenotype was isolated. The insertion site of the T-DNA fragment was 879 bp downstream of the stop codon of the OsGPI8 gene, which caused introns retention in the gene transcripts, especially at higher temperatures. A complementation test confirmed that this change in the OsGPI8 transcripts was responsible for the mutant phenotype. Compared to control plants, internodes of the df mutant showed a thinner shell with a reduced cell number in the transverse direction, and an inhomogeneous secondary wall layer in bundle sheath cells, while many sclerenchyma cells at the tops of the main veins of df leaves were shrunken and their walls were thinner. The df plants also displayed a major reduction in cellulose and lignin content in both culms and leaves. Our data indicate that GPI anchor proteins play important roles in biosynthesis and accumulation of cell wall material, cell shape, and cell division in rice.

1. Introduction

Attachment of glycosylphosphatidylinositol (GPI) moieties to protein C-termini is one of the most common posttranslational modifications in eukaryotic cells [1]. Proteins modified by GPI attachment are called GPI anchor proteins (GPI-APs). The GPIs have a common backbone whose structure is EtNP-6-mannose (Man)-1,2-Man-1,6-Man-1,4-glucosamine(GlcA)-1,6-inositol-P-lipid [2]. The mature GPIs are transferred en bloc to proteins by GPI transamidase (GPI-T) complexes in the ER. The GPI-T complex consists of five subunits: PIG-K/GPI8 (human/yeast orthologs), PIG-S/GPI17, PIG-U/GAB1, PIG-T/GPI16, and GPAA1/GAA1 [3]. GPI8 and GPAA1 are the catalytic subunits of GPI-T [3]. GPAA1 catalyzes the formation of a bond between the substrate protein’s omega-site and the GPI lipid anchor’s phosphoethanolamine [4]. GPI8 has a dual role: it carries out the proteolytic cleavage of the C-terminal signal sequence of the precursor protein, then forms an amide bond between the protein and the ethanolamine phosphate of the GPI [5].
Loss of GPI anchoring in plants results in lethality, while a reduction in GPI seriously affects plant growth and development. Glucosamine-6-P acetyltransferase (GNA) is involved in de novo biosynthesis of UDP-N-acetylglucosamine (UDP-GlcNAc). The transfer of GlcNAc from UDP-GlcNAc to phosphatidylinositol is the initial reaction carried out by the GPI assembly [6]. Mutation of GNA in rice (gna1, [7]) affects cell shape and the growth of roots under low temperature conditions, and in Arabidopsis (lig; [8]) it causes temperature-dependent growth defects and ectopic lignin deposition. SETH1 and SETH2 encode Arabidopsis homologs of two conserved proteins involved in the first step of the GPI biosynthetic pathway. The seth1 and seth2 mutations block pollen germination and tube growth [9]. In the aptg1 mutant, pollen tubes are able to elongate but suffer a reduction in their micropylar guidance capacity and there is embryo lethality in homozygotes [10]. The PNT1 gene encodes the Arabidopsis homolog of mammalian PIG-M. The pnt1 mutants are seedling lethal [11]. Loss of function of AtGPI8 (atgpi8-2) in Arabidopsis is lethal. A mutation in atgpi8-1 that results in low enzyme activity disrupts growth, fertility, and formation of stomata [12].
A number of GPI-APs have been identified and/or predicted in plants [13]. The functions of several GPI-APs have been revealed based on the study of mutants. Most of the reported functions of GPI-APs are associated with cell wall biosynthesis and maintenance. COBRA (COB), the first GPI-AP to be found in Arabidopsis, is involved in cell wall synthesis. Mutations in the COB gene of Arabidopsis reduce the content of crystalline cellulose in cell walls in the root growth zone [14]. Loss of function of the fasciclin-like arabinogalactan-protein (FLA) SOS5 causes decreased root growth and thinner cell walls [15]. Another GPI-AP, AtSHV3, contains two glycerol phosphate choline diester phosphodiesterase domains. Plants doubly mutate for this gene and its homolog SVL1 shows shorter root hairs, swollen guard cells, abnormal hypocotyls, reduced cellulose content, ectopic lignin deposits, and fragile cell walls, indicating that SHV3 and its homolog participate in primary cell wall synthesis [16]. Fourteen FLAs in Arabidopsis have been identified as GPI-APs. Analysis of the fla11/fla12 double mutant suggested that Arabidopsis FLA11 and FLA12 may enhance plant stem strength and stem modulus of elasticity [17]. Mutations in AtSKU5 (which contains a cupredoxin-like domain) change the growth properties of roots and influence the direction of root growth and cell expansion [18]. In several mutants, loss of function of GPI-AP severely affects pollen development, pollen germination efficiency, and pollen tube growth. Examples include classical AGPs [19], aspartic protease [20], ENODL11-15 proteins that contain an early-nodulin like/plastocyanin domain [21], and LORELEI [22]. Other functions of the GPI-APs include immune recognition, transmembrane signaling, embryogenesis, formation of stomata, and export of cuticular wax [23].
In rice, COB-like proteins and CLD1/SRL1 are the only GPI-APs whose functions have been studied in detail. BC1 belongs to the COB-like family which is expressed mainly in developing sclerenchyma cells and vascular bundles. BC1 mutations cause not only a reduction in cell wall thickness and cellulose content but also an increase in lignin [24]. T-DNA insertion in OsBC1L4 results in abnormal cell expansion, dwarfing, and fewer tillers in rice [25]. The CLD1/SRL1 gene encodes a GPI-anchored membrane protein that modulates leaf rolling and other aspects of rice growth and development [26,27].
In the present study, we further elucidated the biology function of GPI-APs in rice plants using a T-DNA insertional mutant that shows a drooping and fragile (df) phenotype. Tail-PCR and DNA sequencing indicated that the T-DNA was inserted downstream of the stop codon of OsGPI8, the ortholog of the Arabidopsis GPI8 gene. Insertion of the T-DNA causes defective intron splicing of the OsGPI8 pre-mRNA, especially under higher temperature conditions. Intron retention in transcripts of the OsGPI8 gene results in the premature stop codon. Results from the anatomical analysis showed that the insertion of mutation led to a decreased cell number in the culm and a large change in cell wall structure. Reduced cellulose and lignin contents were deposited in the mutant culms and leaves correspondingly. Our results provide new insight into the function of GPI-anchored proteins in plant cell division in rice plants.

2. Results

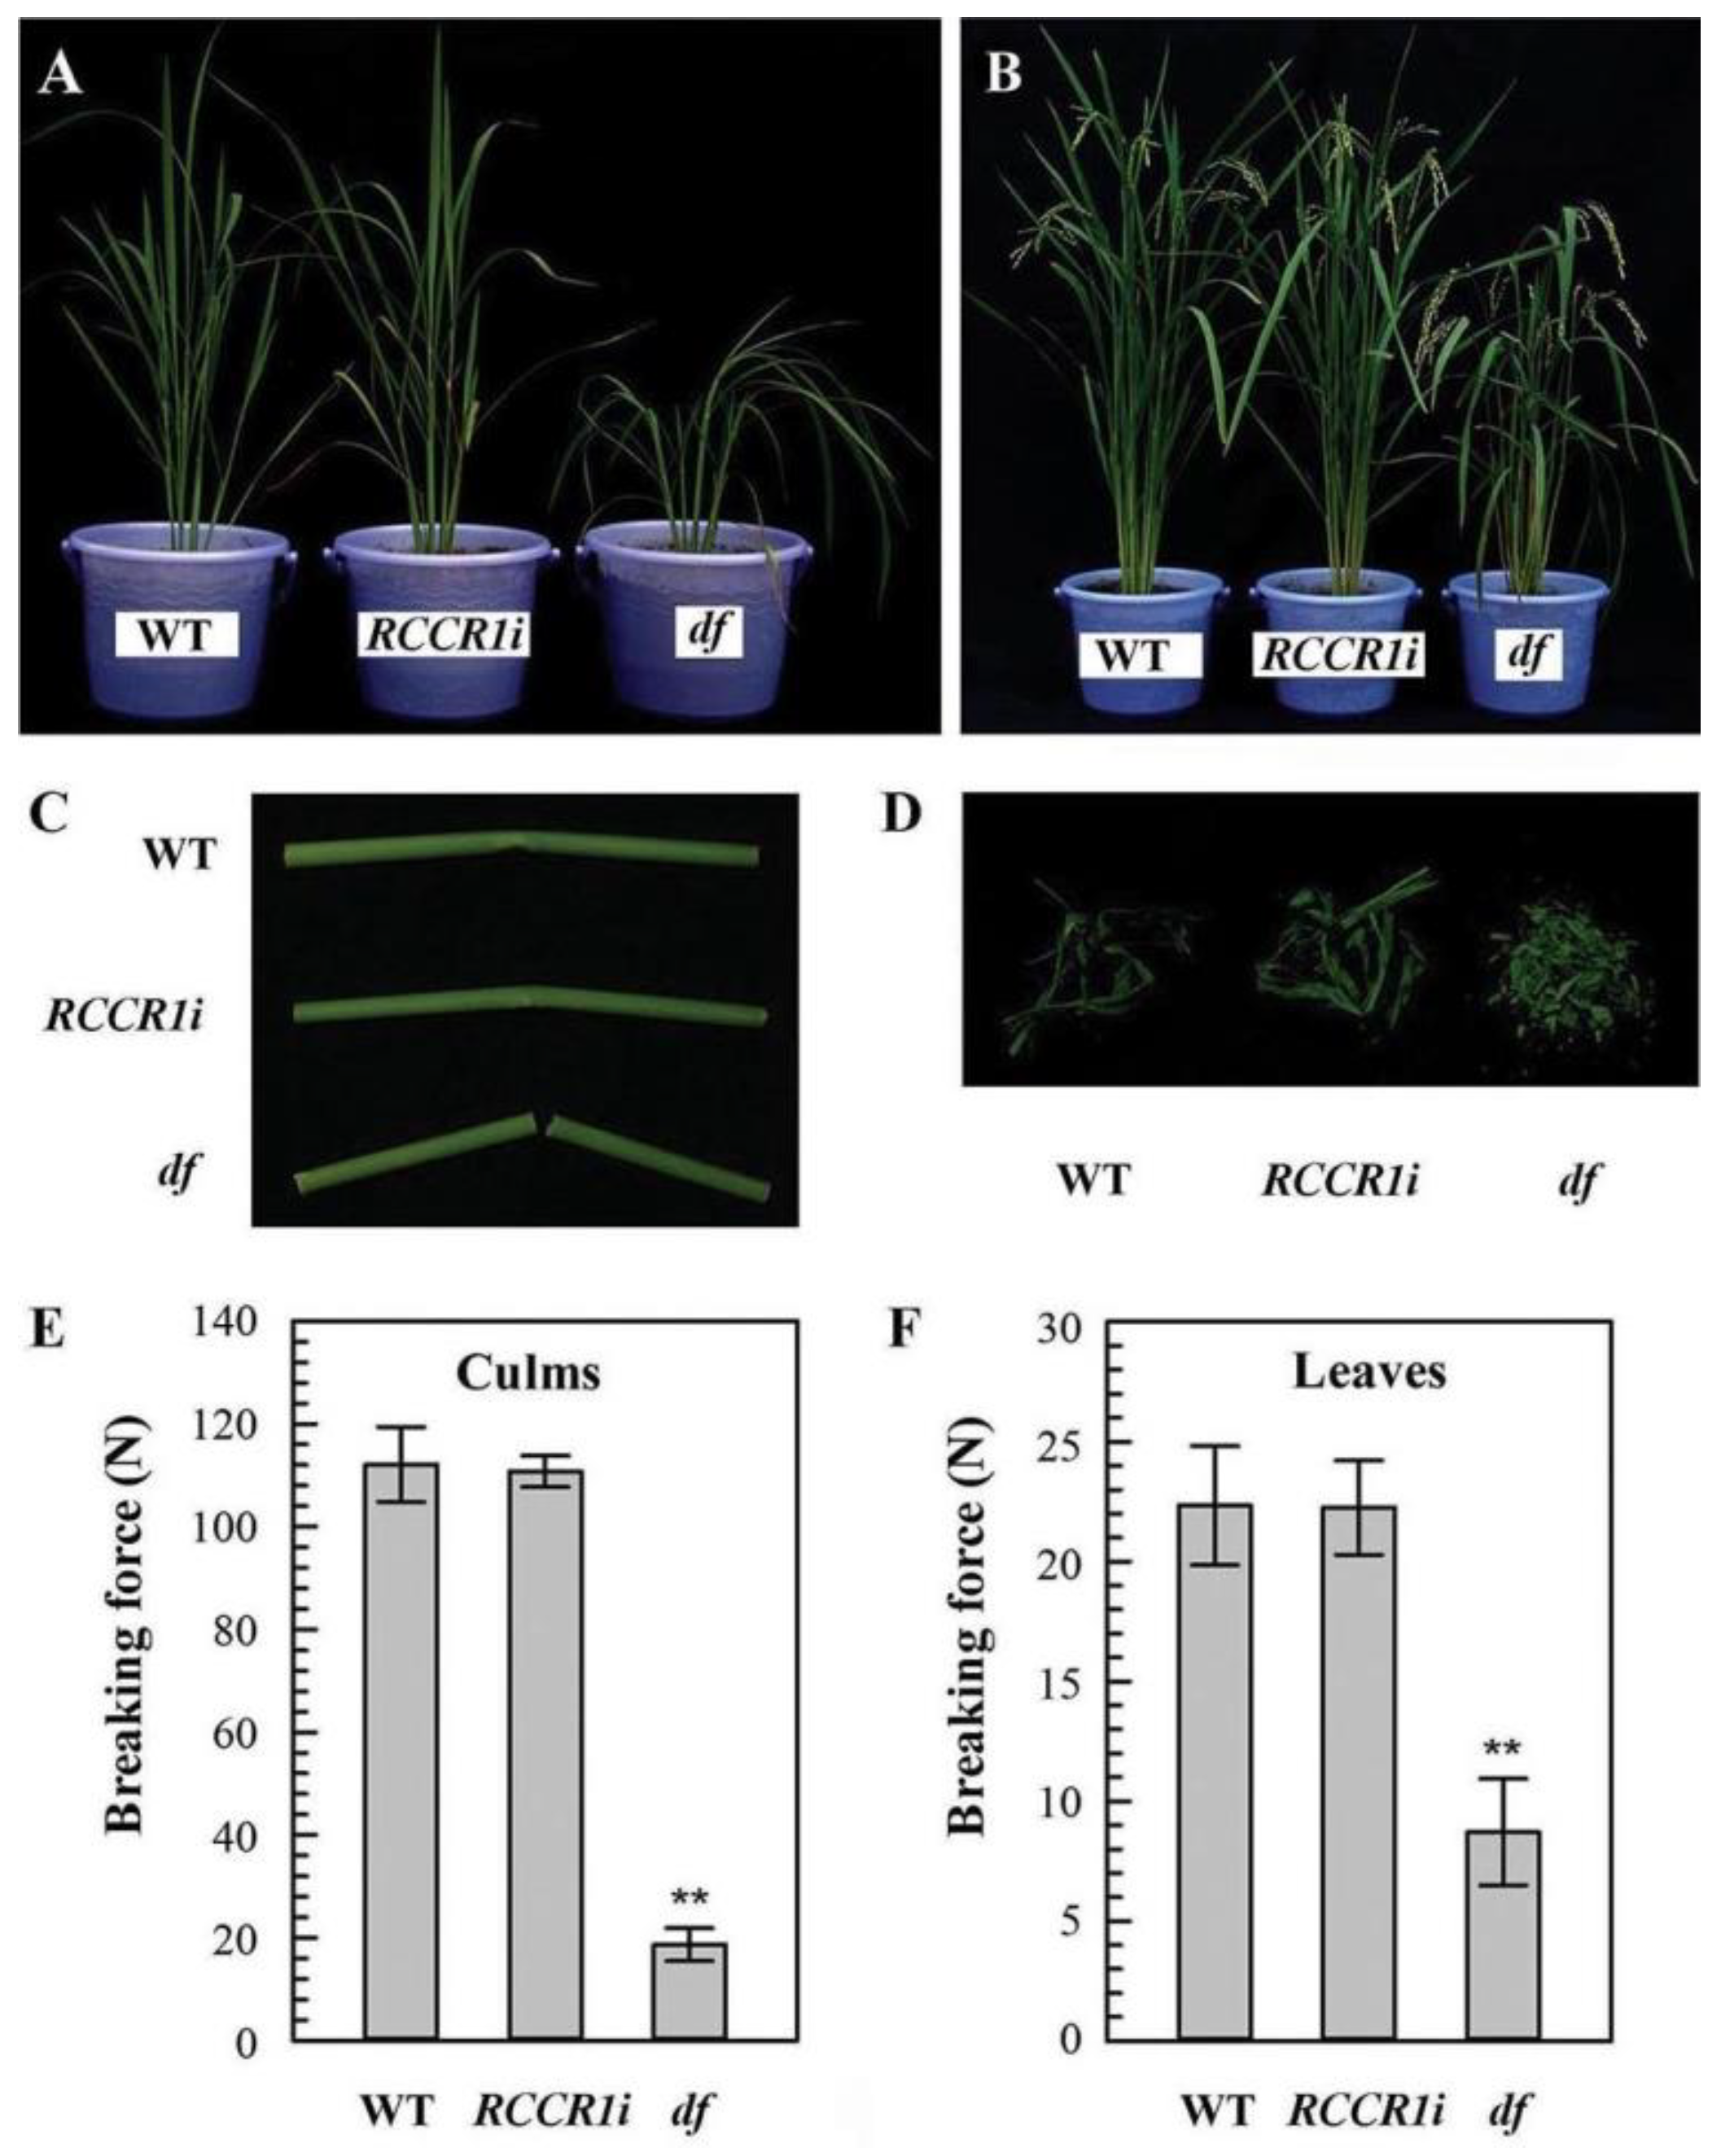
2.1. Isolation of the Drooping and Fragile Shoot Rice Mutant

In a previous study, we constructed transgenic rice plants with RNA interference of the rice red chlorophyll catabolite reductase 1 gene (RCCR1i) and analyzed their phenotype. The RCCR1i transgenic plants displayed lesion mimic spots in older leaves and these leaves died off early [28]. Among the homozygous RCCR1i lines grown in the greenhouse (day/night, 30–36 °C/25–30 °C), one line exhibiting drooping shoots (Figure 1A,B), fragile culms, and leaves (Figure 1C,D) was identified, and we named this rice mutant df (drooping and fragile). About 1/4 (8/30) of the plants of the T2 generation were drooping and fragile, indicating that a single recessive nuclear locus was likely to be responsible for this mutant phenotype. The mechanical strengths of df culms and leaves were found to be reduced to, respectively, ca. 17% and 39% for those of WT and RCCR1i lines when their breaking forces were measured (Figure 1E,F). The shoots of df seedlings showed the same morphology as those of RCCR1i seedlings under lower temperatures (LT; 19–23 °C), while manifesting the drooping phenotype at higher temperatures (HT; 29–33 °C) (Supplementary Figure S1). The mutant phenotype of df was therefore inferred to be temperature-dependent.

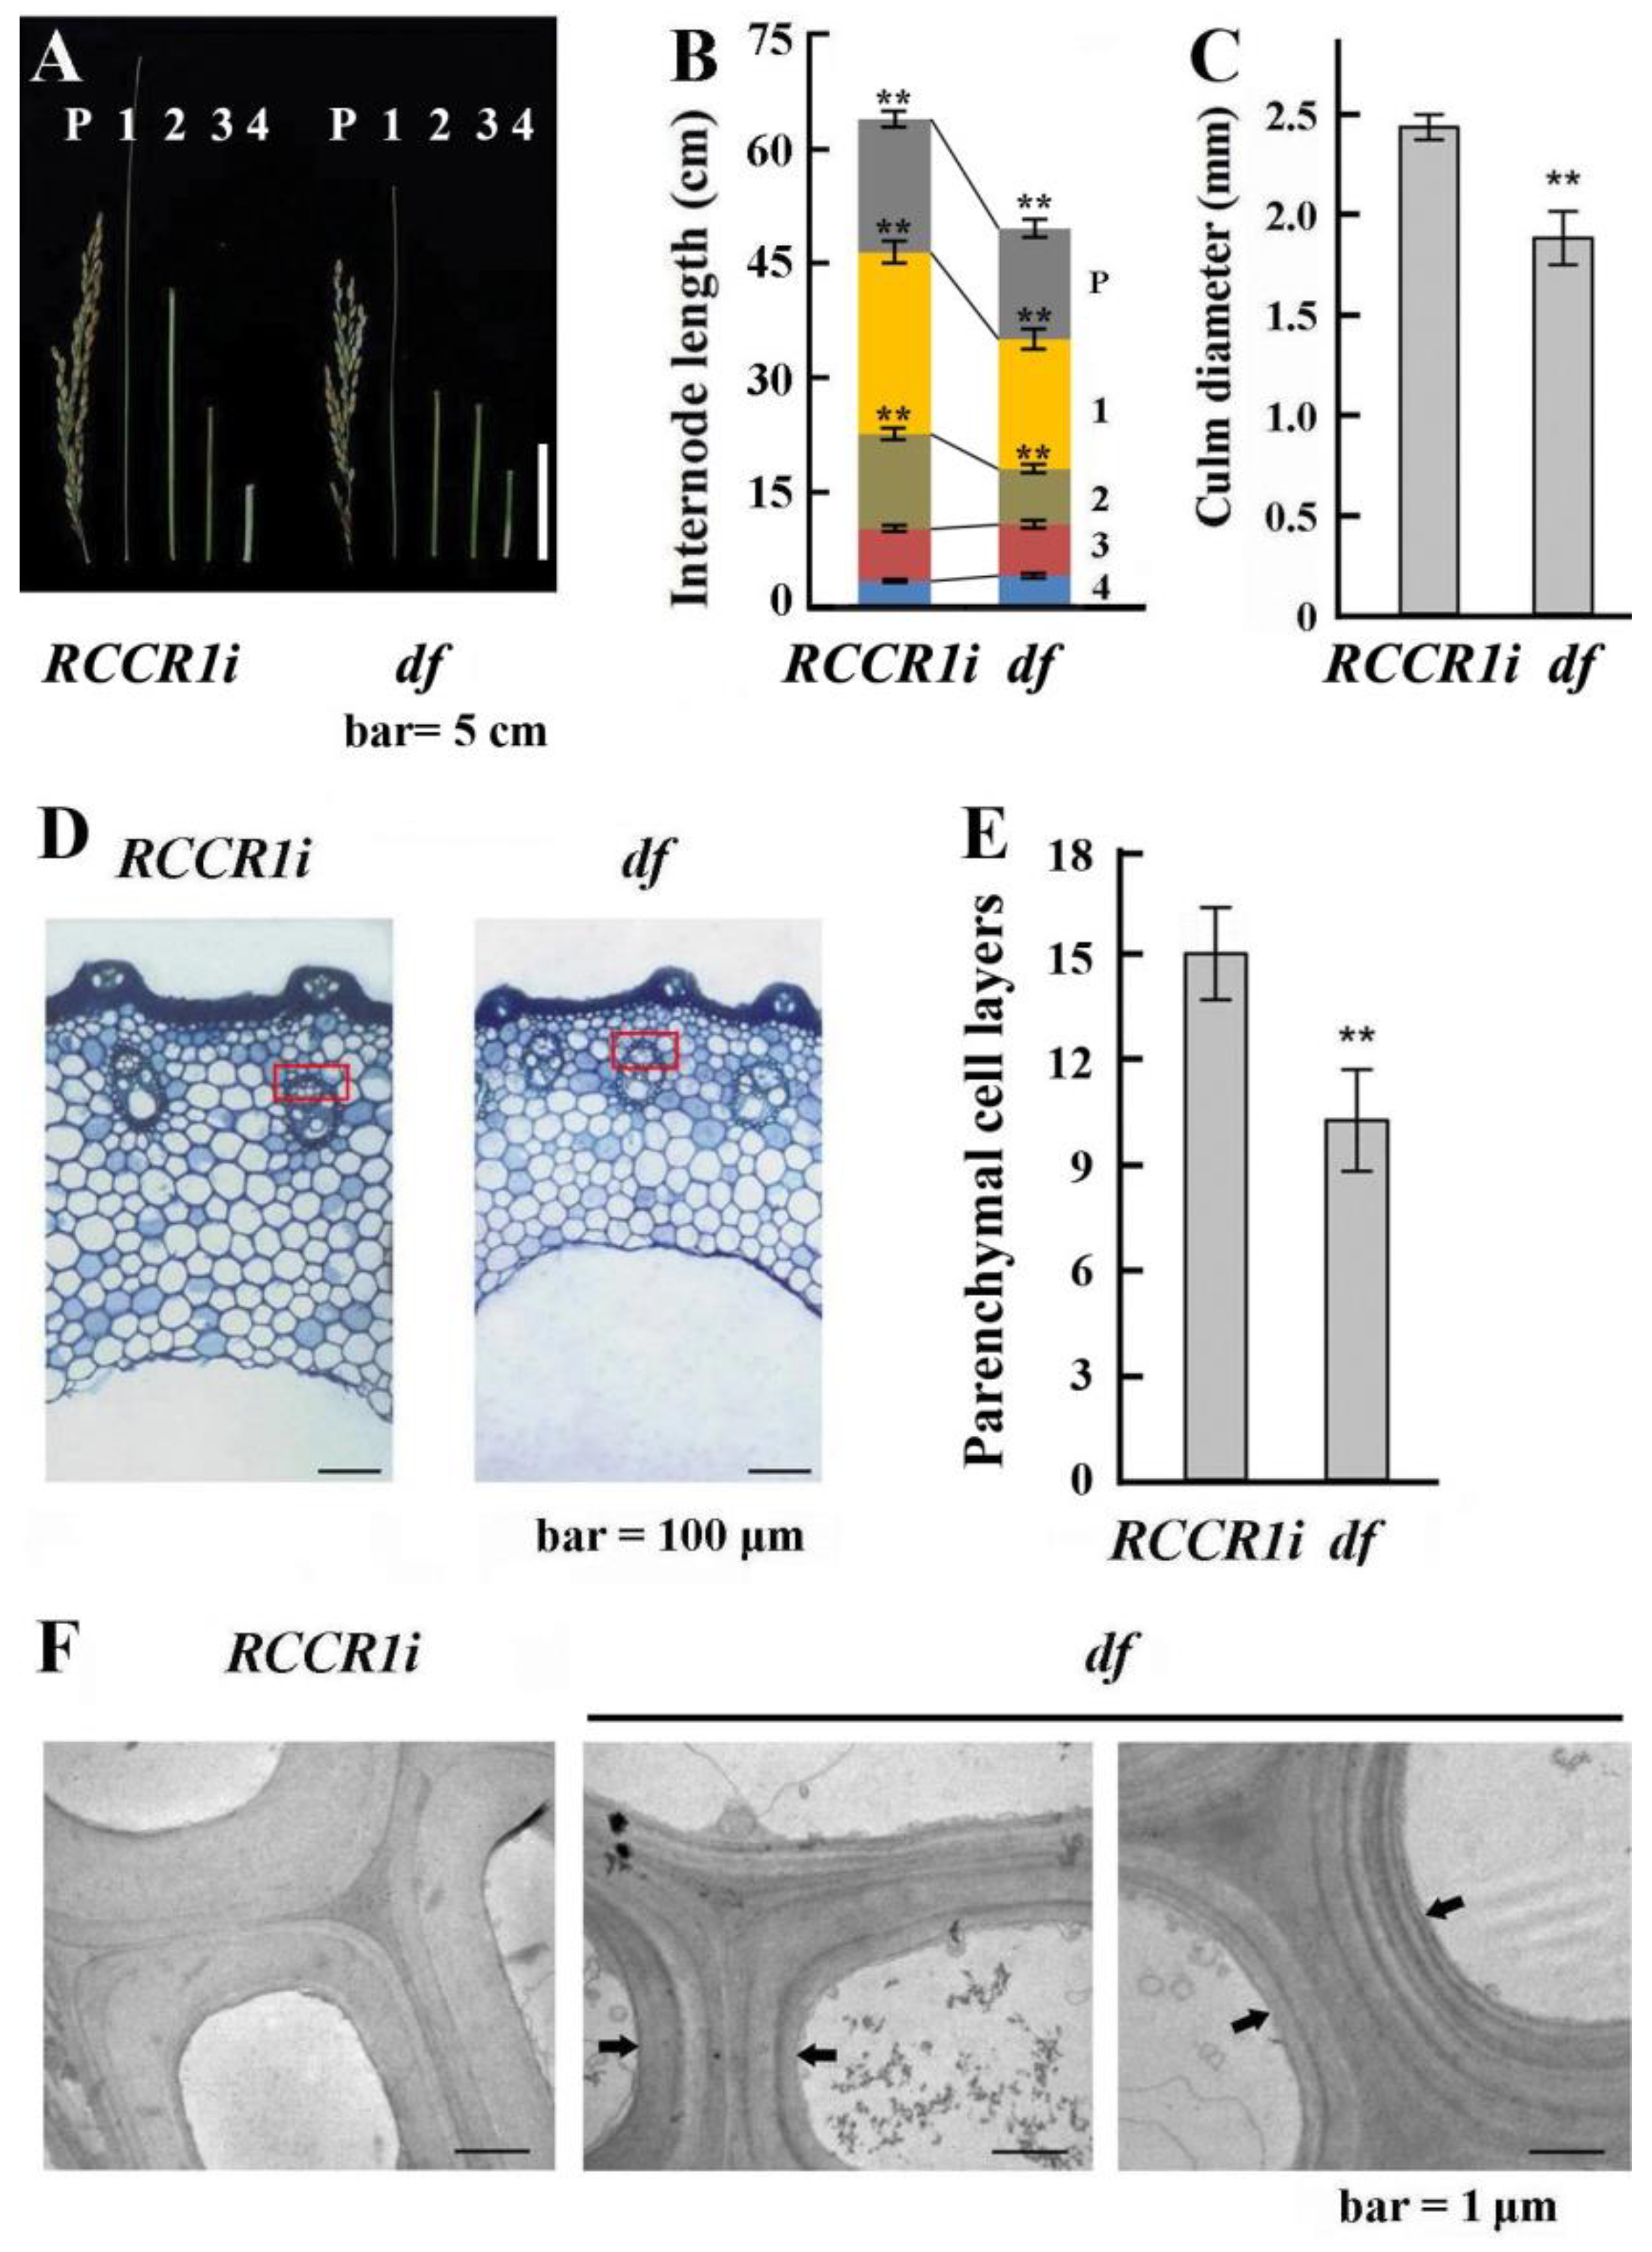
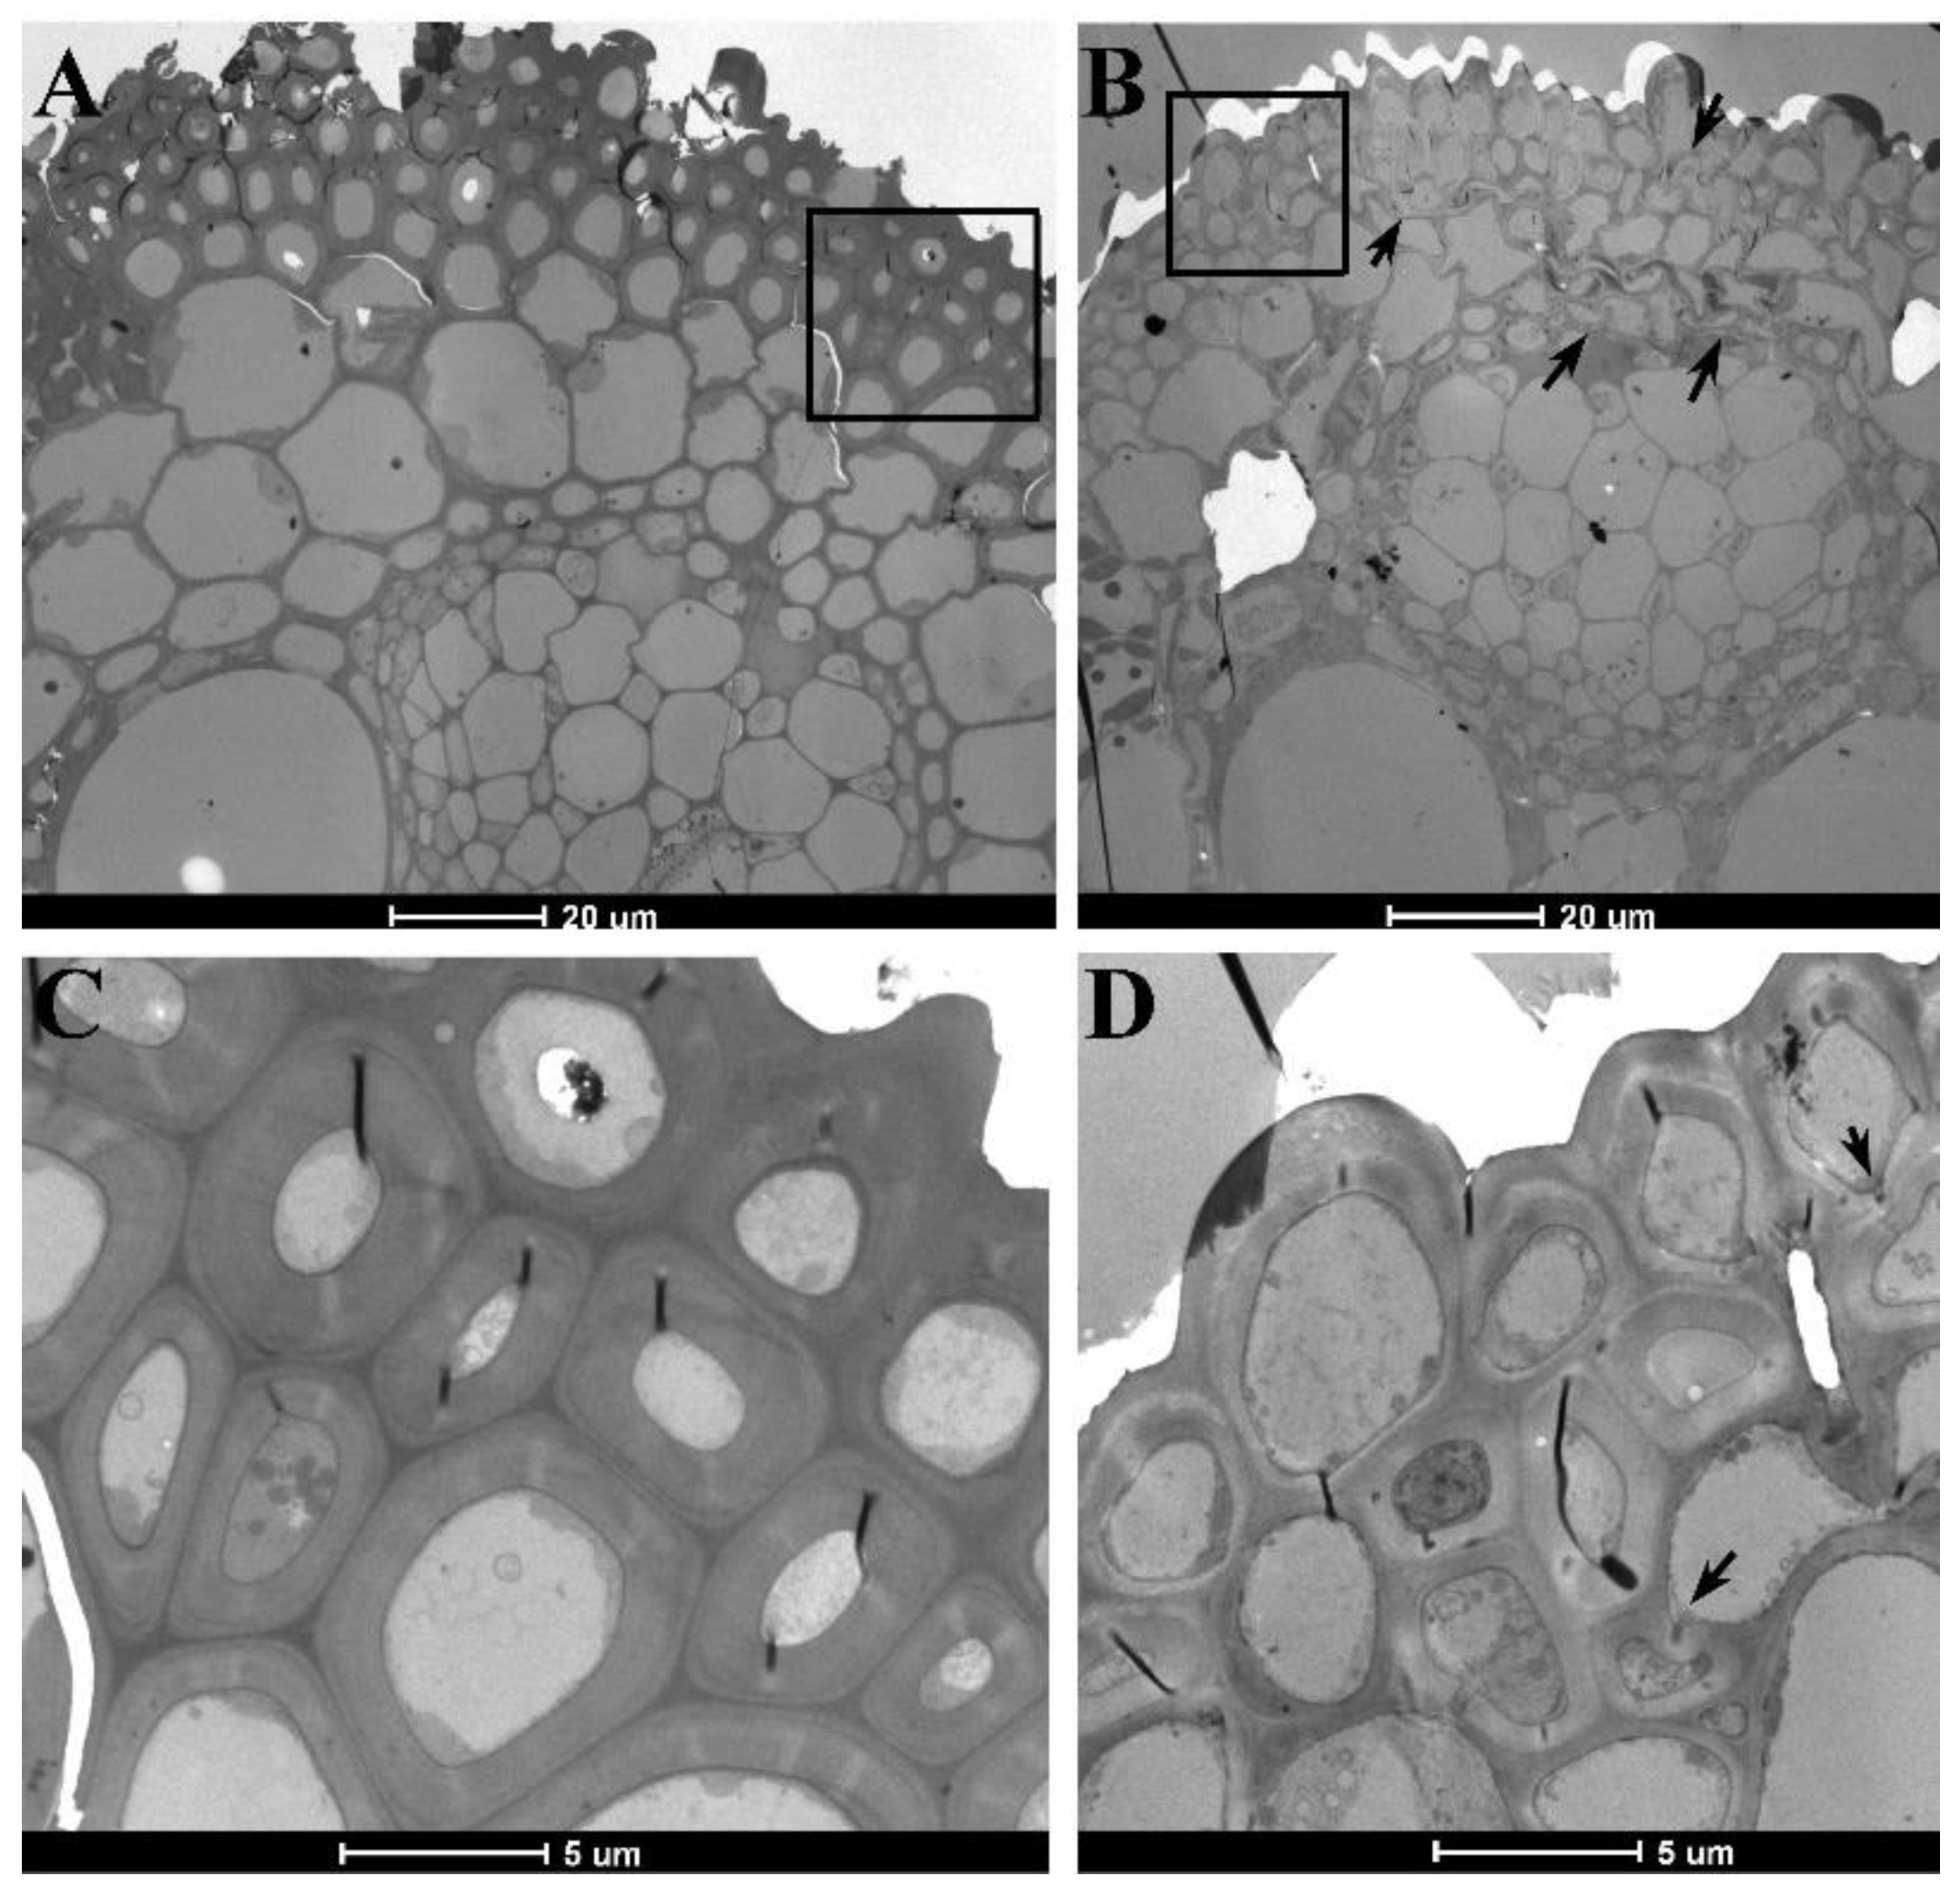
2.2. Changes in Morphological and Anatomical Structures of Culms

The leaves and culms of RCCR1i plants had the same mechanical strength as those of wild-type plants: one normal RCCR1i line was therefore chosen as the control for the next test. The df plants were shorter than RCCR1i plants (Figure 1B). Having measured the internode length in four internode-containing stems, we found that the lengths of the first top internode and the second top internode of df plants were decreased by about 22.6% compared to RCCR1i plants (Figure 2A,B). The culm diameter of df plants was also significantly less than that of RCCR1i plants (Figure 2C). Upon examining transverse sections of the internodes of mature stage plants, we observed that the shell of the culm is thinner (Figure 2D), and the length of the vascular bundle is shorter (Supplementary Figure S2) in df plants than in RCCR1i plants. No significant difference was observed in the average size of parenchyma cells in culms between df plants and RCCR1i plants, but the parenchyma cell layer number and peripheral sclerenchyma thickness in df plants were significantly reduced compared to those in RCCR1i plants (Figure 2E; Supplementary Figure S2). These results suggested a reduction in cross-sectional cell number in df internodes. To determine the pattern of deposition of cell wall polymers, ultra-thin sections of RCCR1i and df bundle sheath cells were examined by transmission electron microscopy. The secondary wall layer of RCCR1i had a uniform thickness and appearance, while showing a clearly layered structure with different electron-dense materials in df cell walls (Figure 2F).

2.3. Changes in the Morphological and Anatomical Structures of Leaves

Compared to those of RCCR1i plants, 11–28% of mature leaves in df plants were shorter (Supplementary Figure S3A). No differences in the morphology and arrangement of epidermal cells and stomata were observed in the fully expanded leaves of df (Supplementary Figure S3B). To explore the causes of the reduced mechanical strength of df leaves, we observed the cell shape and sclerenchyma structure in the main vein by means of transverse sectioning of leaves at the tillering stage. Light microscopy revealed that cells lying between the phloem and epidermis at the distal end of the main vein were shrunken in df leaves. The sclerenchyma cells of the main vein displayed greater intracellular transparency in df than in RCCR1i (Supplementary Figure S4). Electron microscopy indicated that some of the parenchyma and sclerenchyma cells within the distal end of the main vein in df leaves were shrunken, and that the cell walls of these sclerenchyma cells were significantly thinner in df than in RCCR1i leaves (Figure 3). The mean thickness of the radial walls of two adjacent sclerenchyma cells within the outermost layer and the secondary outer layer in the distal end of the main vein in df was 1.24 ± 0.34 μm and 1.37 ± 0.47 μm, respectively, while the corresponding values were 2.19 ± 0.54 μm and 3.13 ± 0.58 μm in RCCR1i plants, according to statistical analysis of thirty cells.

2.4. Differences in Cell Wall Composition

The reduction in mechanical strength and defects in wall structure observed in df suggested that the cell wall composition may be altered in the mutant plants. Because cellulose and lignin are the major components of the second cell walls influencing mechanical strength in plants, we therefore analyzed these components in culms and leaves. Cellulose content was reduced by ca. 27% in culms and by ca. 32% in leaves in df plants compared to RCCR1i plants (Table 1). The df plants also showed a decrease in lignin content in both leaves and culms. By contrast, most of the neutral sugars from culms and leaves in df plants were increased.

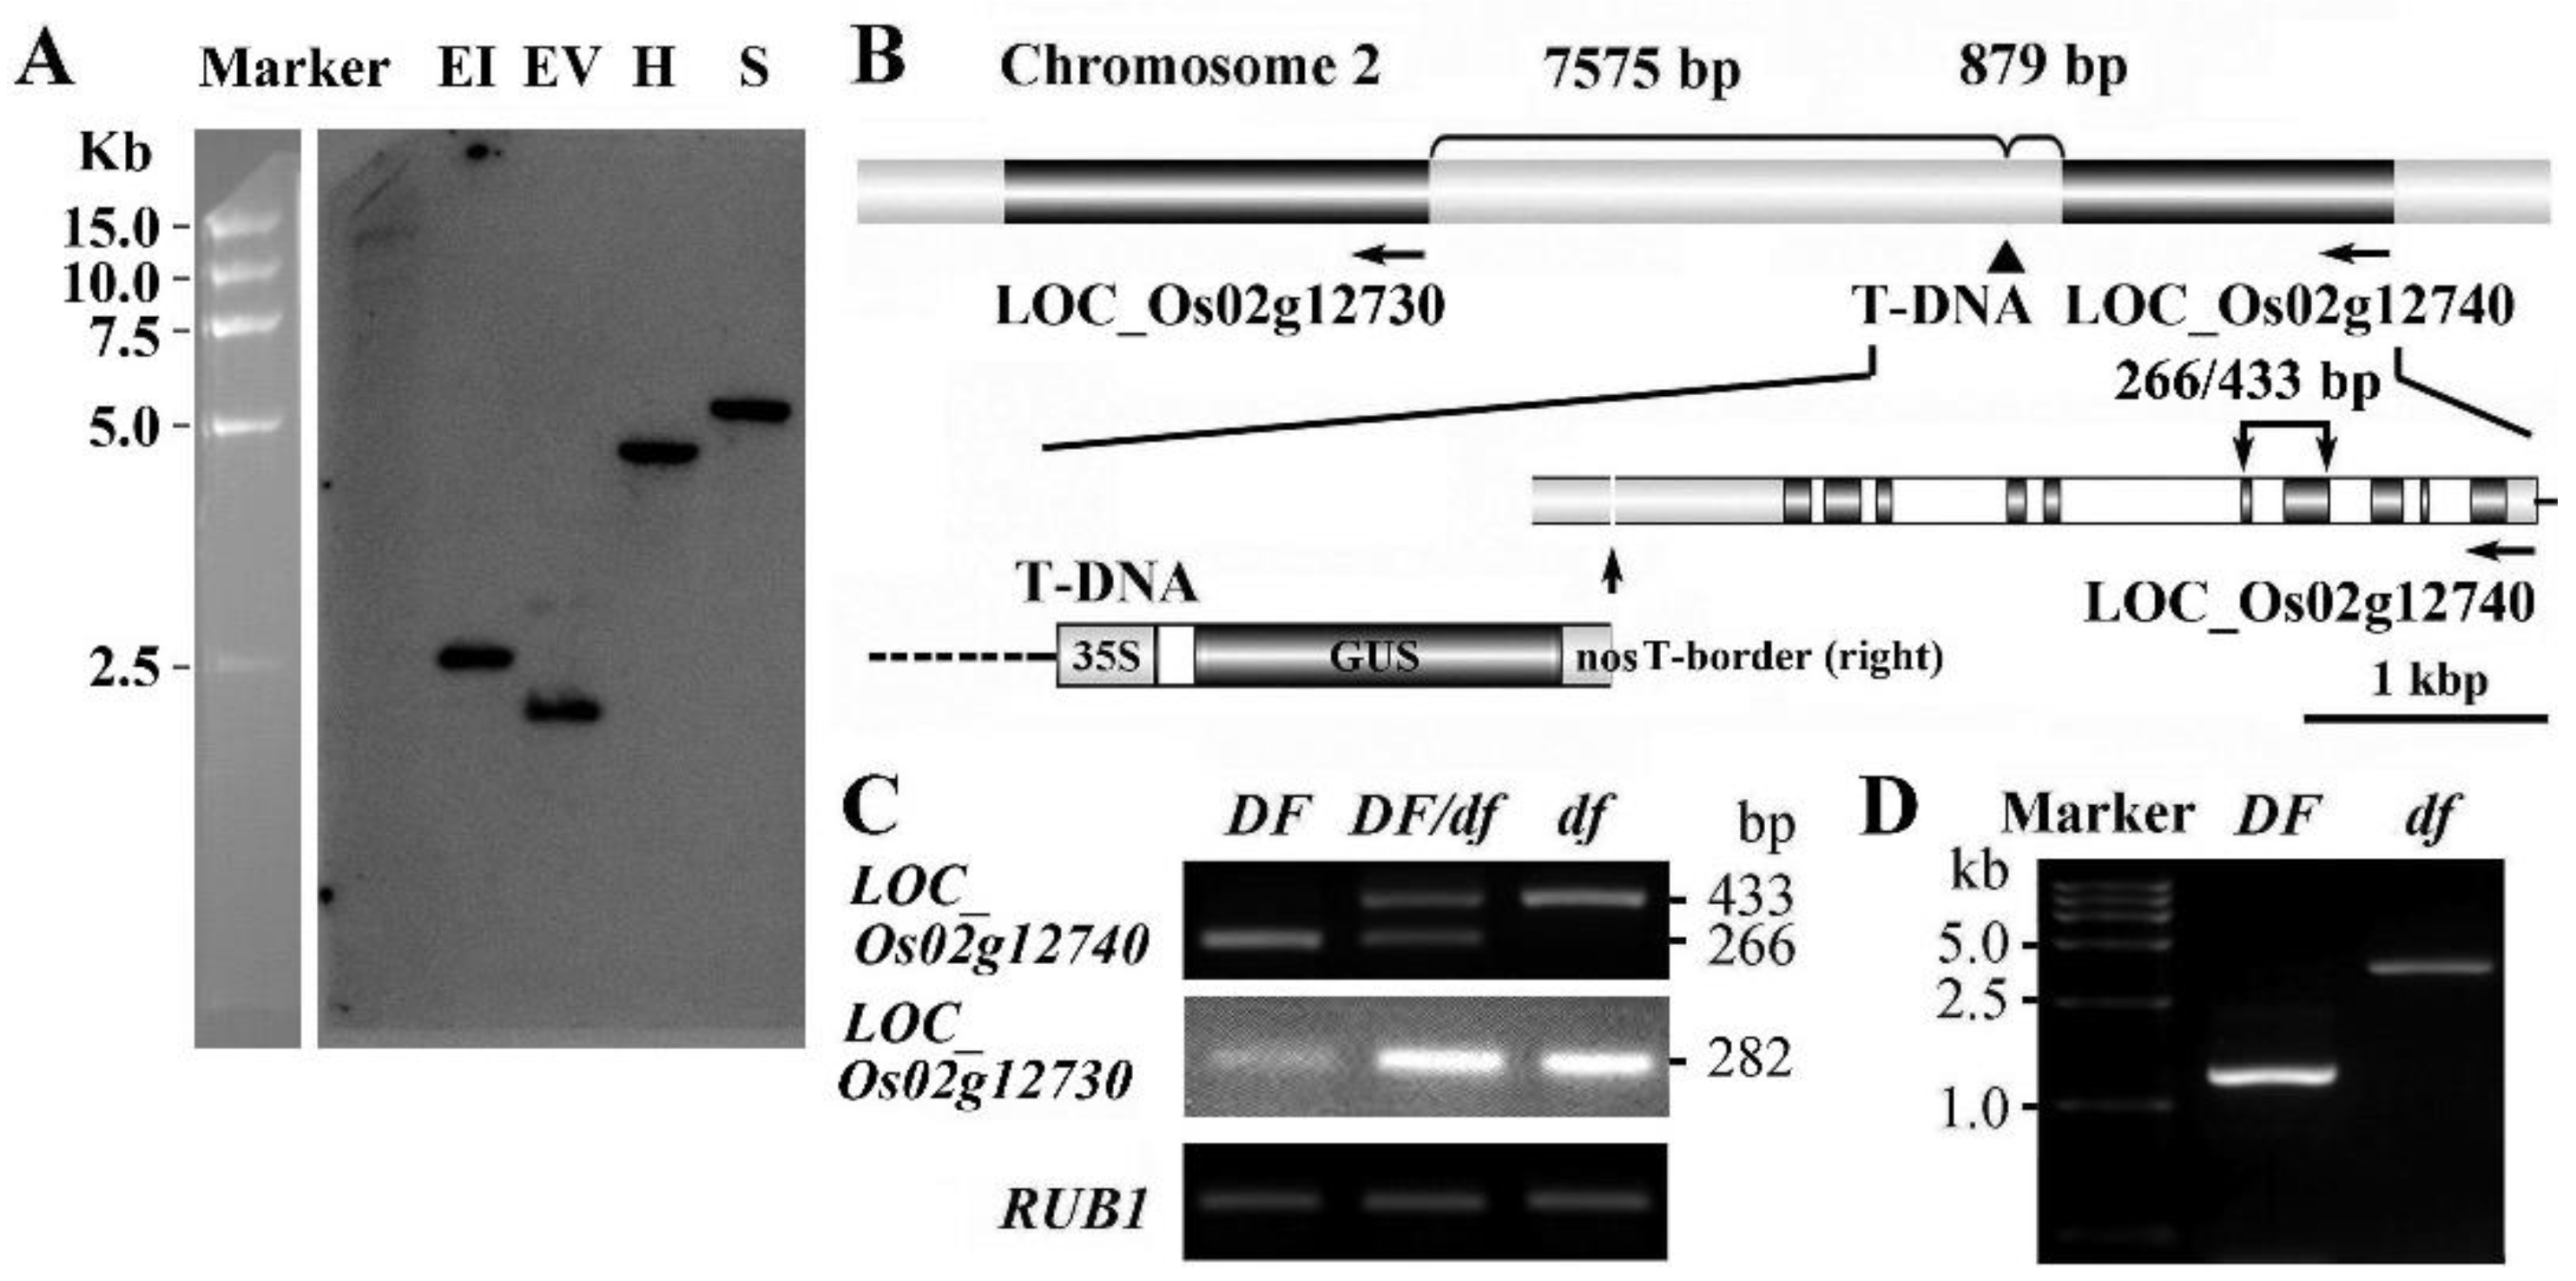
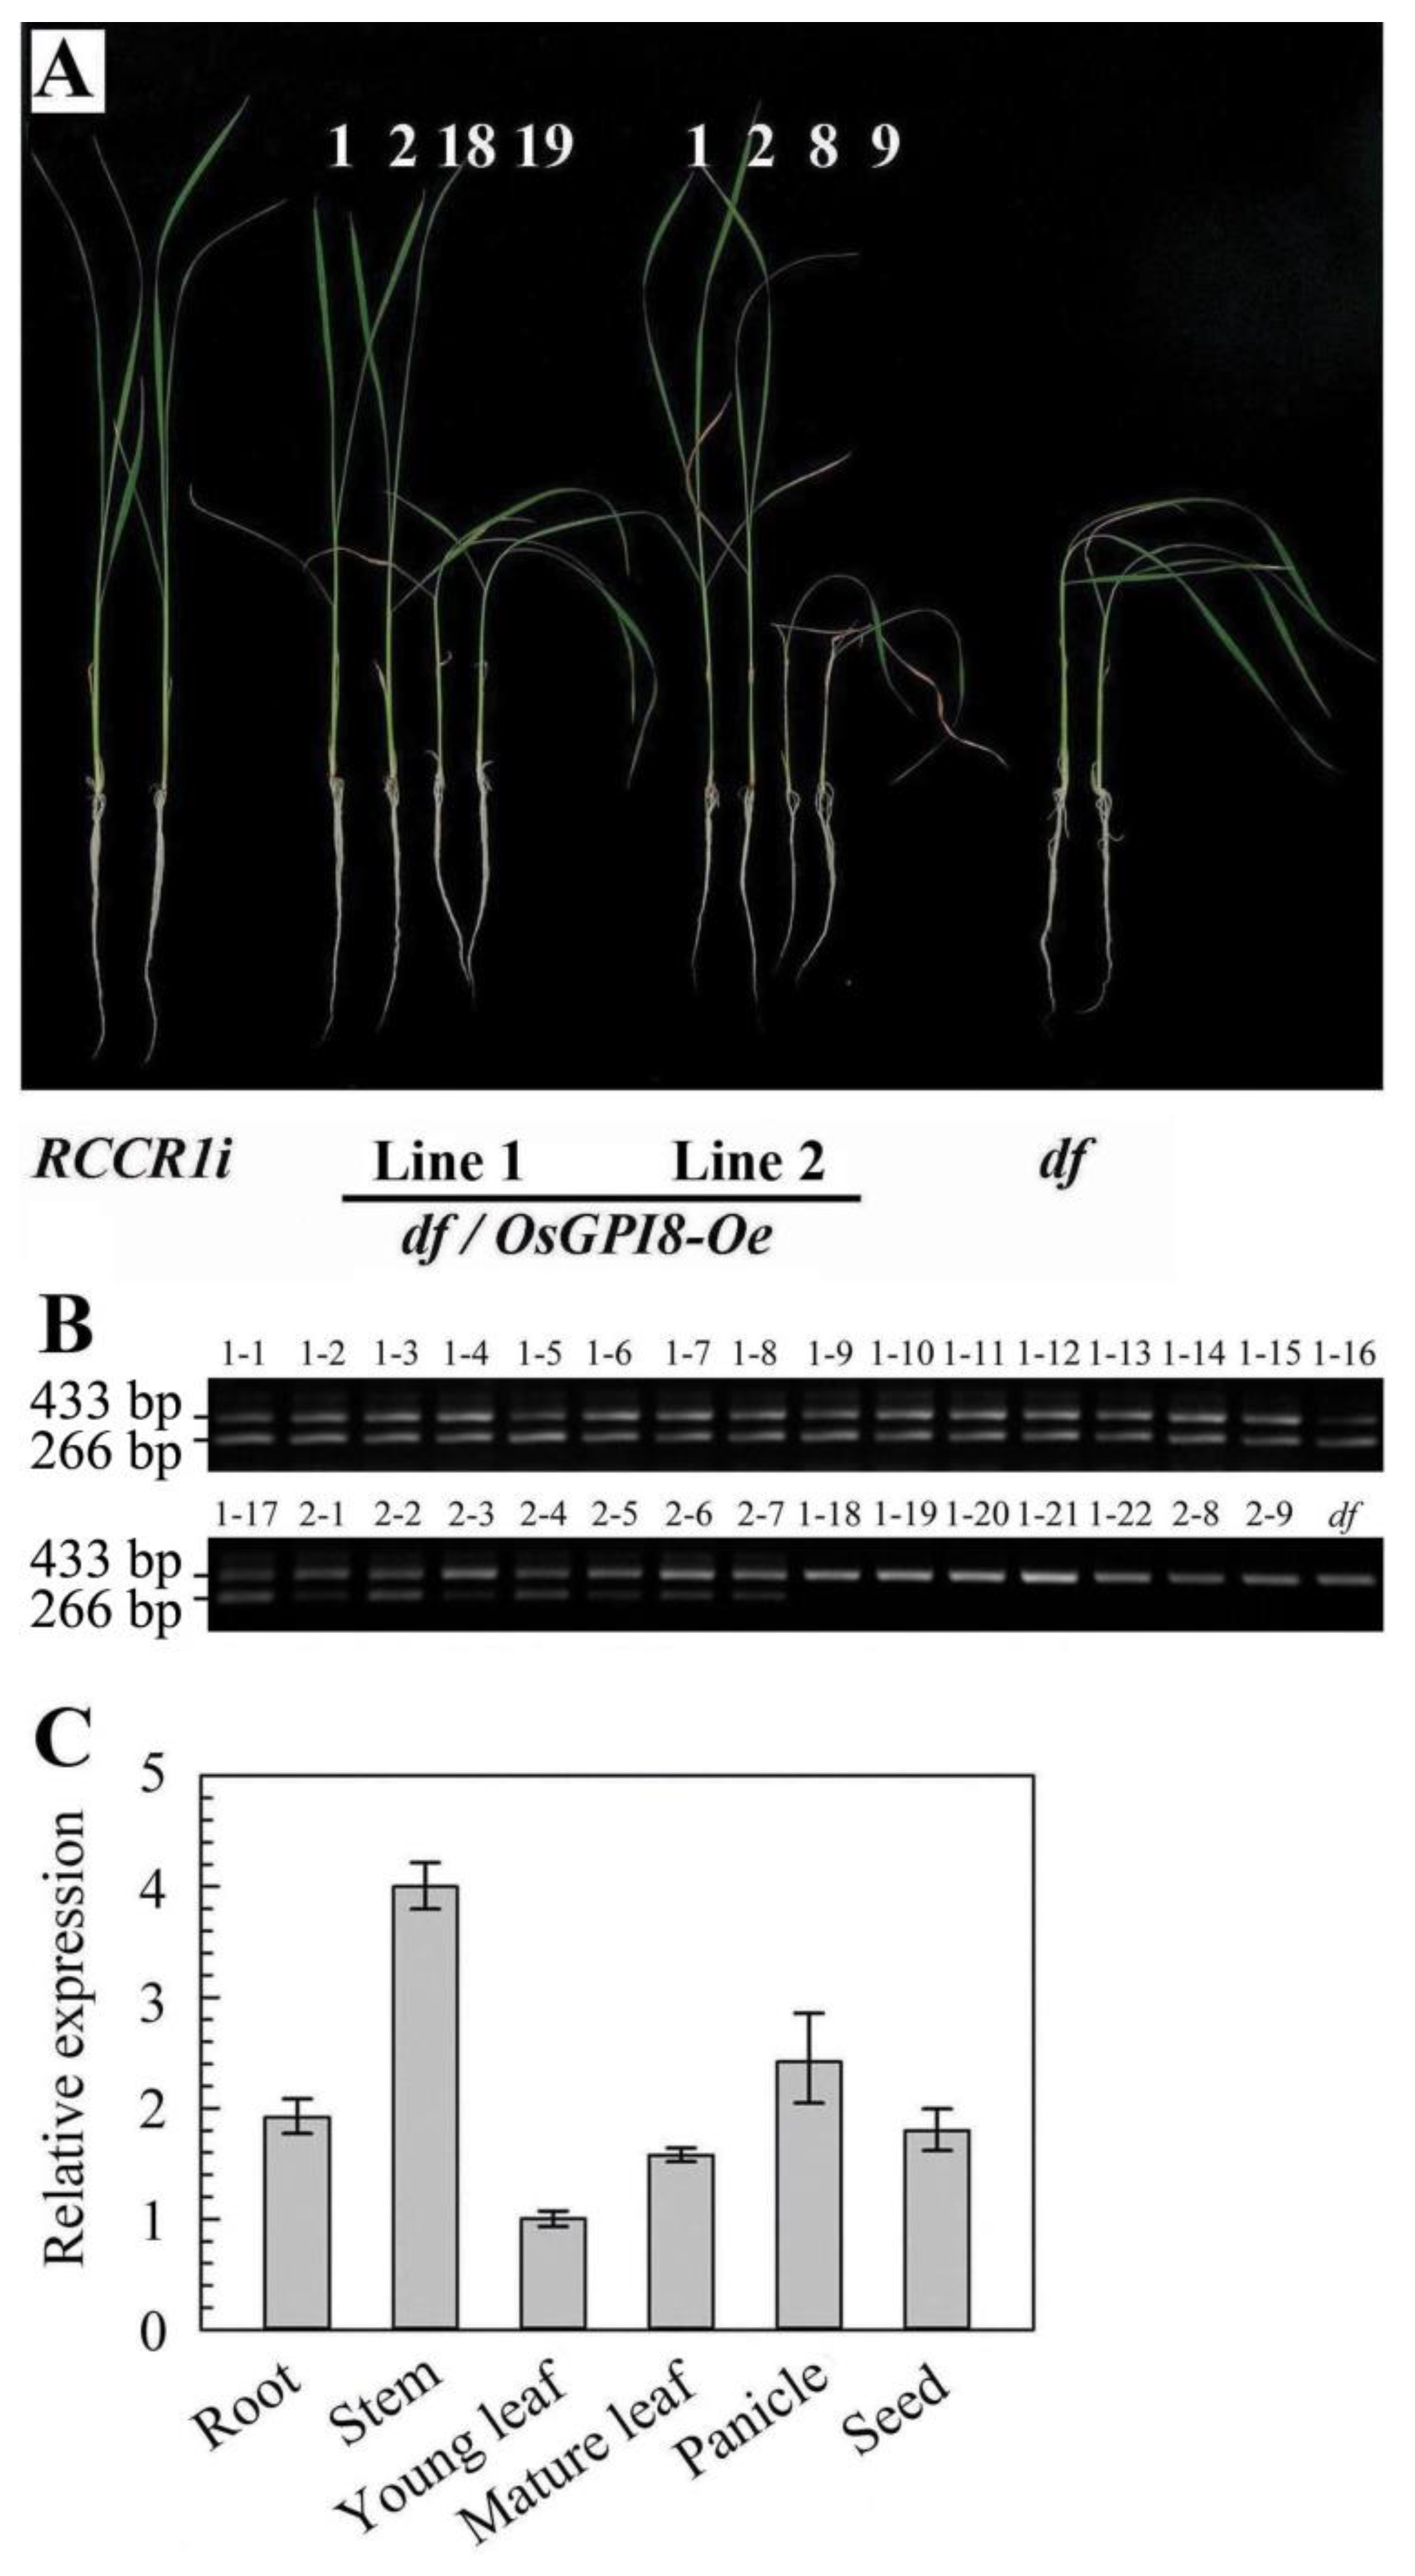
2.5. Cloning of the Gene

Southern blot analysis using a hygromycin phosphotransferase gene fragment as a probe revealed that the df mutant contained only one copy of the T-DNA insertion (Figure 4A). The flanking sequences bordering the T-DNA tag were obtained using the thermal asymmetric interlaced (TAIL)-PCR method [29]. The insertion site was identified as being 879 bp downstream of the stop codon of the LOC_Os02g12740 (Os02g0219400) gene, and 7575 bp before the start codon of the LOC_Os02g12730 (Os02g0219200) gene (Figure 4B). The LOC_Os02g12730 gene encodes a β-galactosidase family protein (OsBGAL1), which is homologous to Arabidopsis BGAL1 (At3g13750). The LOC_Os02g12740 gene (OsGPI8) encodes a putative catalytic subunit of GPI-T, which is the homolog of Arabidopsis GPI8 (At1g08750).
To identify the candidate gene, we examined the levels of expression of OsBGAL1 and OsGPI8 genes in shoots of control (RCCR1i, DF), heterozygote (DF/df), and homozygote (df) plants by semi-quantitative PCR. A primer pair hybridizing to regions located in exons 9 and 11 was used to test the expression of the OsBGAL1 gene. The results showed that the OsBGAL1 gene was weakly expressed in shoots of control plants (DF), but was more highly expressed in both heterozygote and df plants (Figure 4C). Being a recessive mutant, the OsBGAL1 gene may not be responsible for the df phenotype. A primer pair hybridizing to regions located in exons 4 and 5 was used to test the expression of the OsGPI8 gene (Figure 4B). The expected product, 266 bp in length, of the OsGPI8 gene amplified using this primer pair was observed in DF plants, whereas a larger fragment was obtained in df plants. The heterozygote (DF/df) plants had both bands in the PCR products (Figure 4C). Results from the sequencing of these products indicated that the larger fragment from df plants contains the intron in the cDNA fragment. Subsequently, cDNA containing the complete coding sequence was amplified from DF and df seedlings. After cloning and sequencing, the PCR product from DF plants was found to be the predicted 1315 bp in length, while it was 3780 bp in length from df plants, retaining all the introns of the gene (Figure 4D). No DNA sequence variation was detected in the 3780 bp fragment from df plants. We therefore deduced that defective pre-mRNA processing of the OsGPI8 gene transcript may be responsible for the mutant phenotype of df plants.
The GPI8 gene is found ubiquitously across eukaryotic organisms and its sequence is highly conserved. Homology analysis of OsGPI8 revealed that the protein has a high amino acid sequence similarity to Saccharomyces cerevisiae GPI8 (46%) and Arabidopsis thaliana GPI8 (72%). The catalytic active site of GPI8 (His-166 and Cys-208) is conserved (Supplementary Figure S5A). The coding region of the OsGPI8 gene is 3603 bp in length, including 9 introns and 10 exons, which encodes 404 amino acids (Figure 4B, Supplementary Figure S5A). While the intron retention in transcripts of the OsGPI8 gene results in the premature stop codon and the encoded truncated protein lacking the main active domain (Supplementary Figure S5A). Therefore, the retained introns in the DF transcript make OsGPI8 lose functions.
To confirm whether the OsGPI8 gene was responsible for the df mutant phenotype, the cDNA containing the complete coding sequence of the wild-type OsGPI8 gene was cloned into the binary vector pCAMBIA2301. OsGPI8 driven by the cauliflower mosaic virus 35S promoter (OsGPI8-Oe) was then introduced into df mutant plants via Agrobacterium tumefaciens-mediated transformation. A total of 11 transgenic lines (df GPI8-Oe) were obtained. Of these, two independent T2 lines that displayed a ca. 3:1 segregation ratio (17:5 and 7:2) of normal to df mutant plants were studied in detail (Figure 5A). The presence of the artificial OsGPI8 in genomes of transgenic plants was determined by PCR analysis. An introduced cDNA fragment of the expected length (266 bp) was found in all morphologically normal plants, but it was absent from plants with the mutant phenotype in both of the two independent T2 lines (Figure 5B). In addition, complemented plants (df GPI8-Oe) showed similar cellulose content (292.5 ± 1.61 to 300.7 ± 1.12 mg per gram of alcohol-insoluble residues) in leaves with RCCR1i plants. These results confirmed that overexpression of the wild-type OsGPI8 cDNA complemented the mutant phenotype. The OsGPI8 gene was expressed in all tissues tested by real-time quantitative PCR (qRT-PCR), including roots, stems, leaves, panicles, and seeds (Figure 5C), suggesting that it plays roles in most tissues of rice plants.
A previous report has shown that GPI protein affects stomatal clustering and callose content in Arabidopsis seedlings [12]. We therefore determined the callose contents in RCCR1i and df leaves at the four-leaf stage, and observed that df leaves had a significantly higher callose content (43.58 ± 0.24 μg g−1 fresh weight (FW)) than RCCR1i leaves did (21.26 ± 0.37 μg g−1 FW), but no stomatal clustering was observed in df leaf blades like atgpi8-1 mutant (Supplementary Figure S3B) [12].

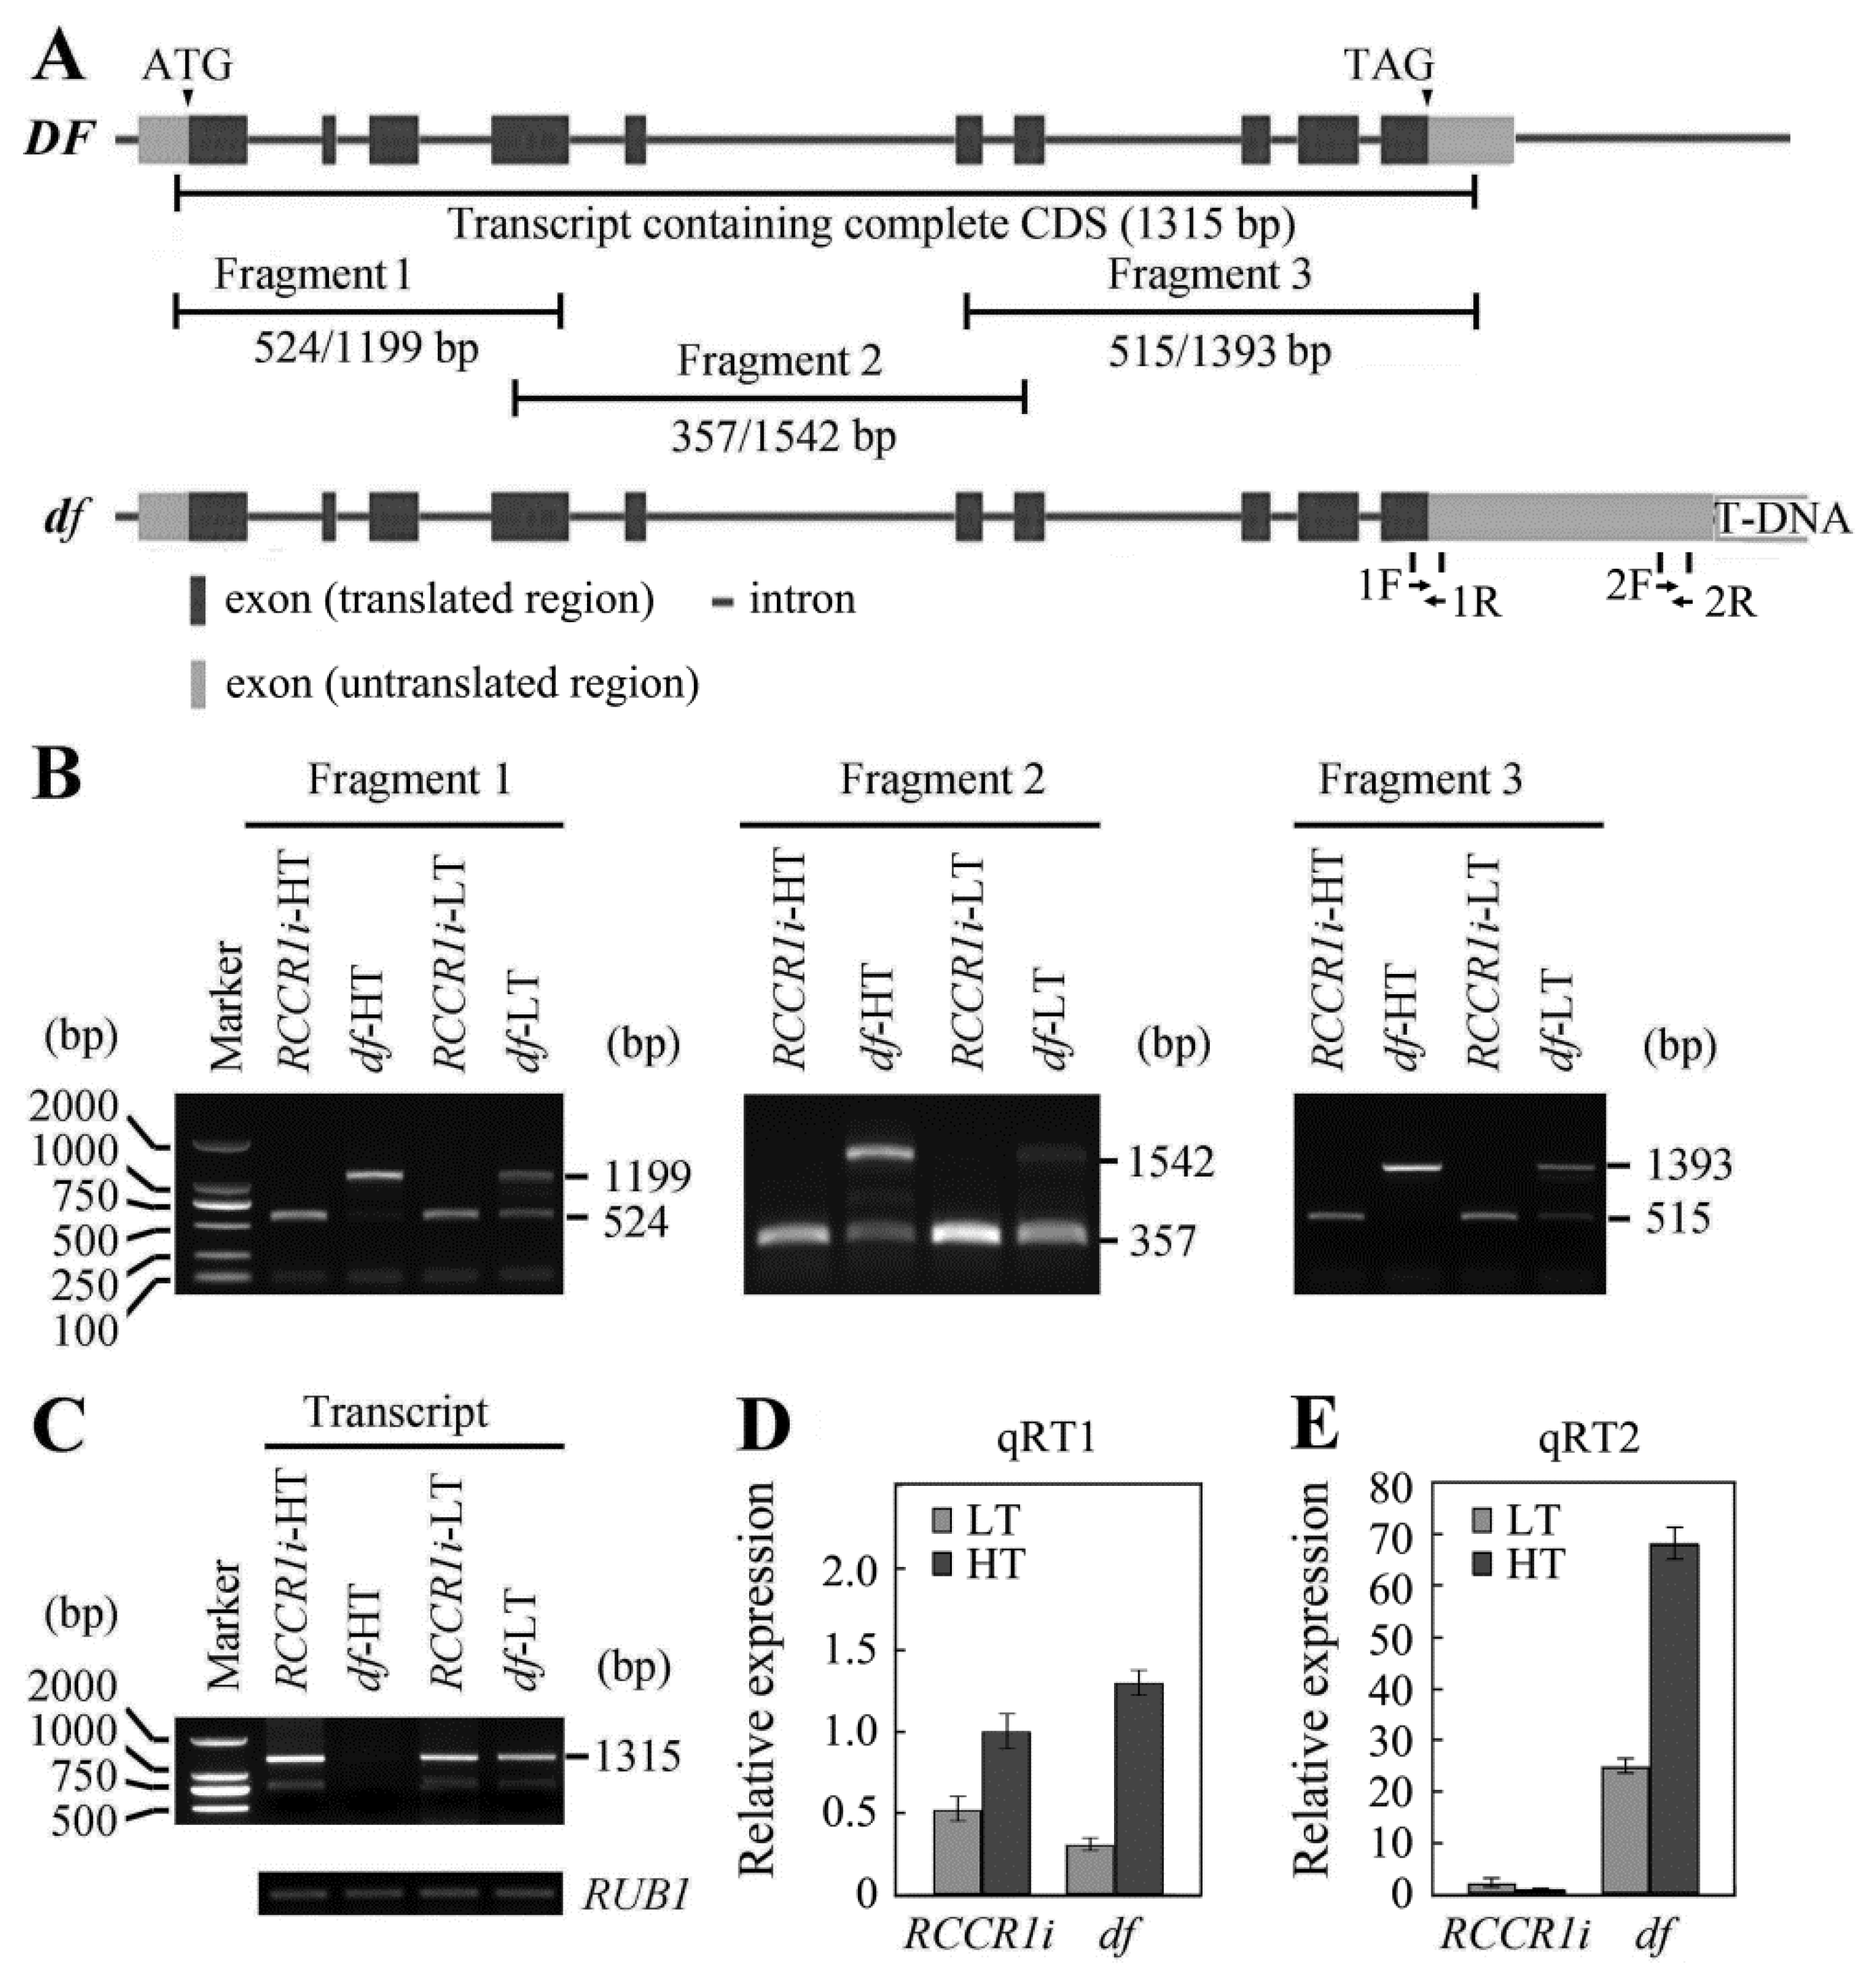
2.6. Temperature Influences the Pre-mRNA Processing of OsGPI8 Transcripts in df Plants

The mutant phenotype of the df was found to be temperature-dependent. To investigate whether temperature influenced the pre-mRNA processing of OsGPI8 transcripts, transcripts of the OsGPI8 gene were analyzed by RT-PCR using total RNA extracted from shoots of 14-day seedlings grown at higher temperatures (HT; 29–33 °C) and at lower temperatures (LT; 19–23 °C). For this analysis, three primer pairs were designed for the PCR amplification, with the intended products corresponding to different exon-encoded regions of the 5′, middle, and 3′ regions of the OsGPI8 transcripts (Figure 6A). We found that the band corresponding to normally spliced transcripts for OsGPI8 was weak when df shoots were grown at HT, whereas it was strong in RNA from df seedlings grown under LT conditions (Figure 6B). Most introns were retained in the transcripts (Figure 6B), and only a low level of normally spliced transcripts containing the complete coding domain sequences (Figure 6C) was observed in df seedlings grown at HT. These results indicate that temperature did affect the relative proportions of normal mRNA and intron-retaining forms of mRNA in OsGPI8 transcripts from df mutant plants, and the temperature-dependent df phenotype may result from reduced pre-mRNA splicing of OsGPI8 under HT conditions. On the other hand, no transcriptional silencing of full length or partial regions of the OsGPI8 pre-mRNA was performed when plants were grown at HT.

2.7. Change in Length of 3′-UTR of OsGPI8 Transcripts

Intron retention and alternative splicing are associated with polyadenylation sites in plants [31]. The OsGPI8 gene contains at least two putative polyadenylation sites (Supplementary Figure S5B). Normally, the 3′-UTR of OsGPI8 is about 257 bp in length according to the results of our 3′-RACE analysis and also the EST data in GenBank (https://www.ncbi.nlm.nih.gov/), but a 3′-UTR fragment over 1000 bp in the OsGPI8 transcript was detected in the df plants. To test the abundance of 3′-UTR with different lengths in RCCR1i and df plants, two primer pairs whose locations were indicated in Figure 6A were designed. qRT1 amplified by the primer pair 1F and 1R represents both the short and long 3′UTR, while qRT2 amplified by the primer pair 2F and 2R only represents the long 3′UTR. The expression levels of total OsGPI8 transcripts had no difference between RCCR1i and df plants under either HT or LT conditions (Figure 6D), but the abundance of OsGPI8 transcripts with the longer 3′-UTR in the RCCR1i plants was around 1.7% of that in df plants under HT conditions (Figure 6E). Compared to HT conditions, the amount of OsGPI8 transcripts with the longer 3′-UTR was reduced by ca. 63% in df plants under LT conditions (Figure 6E). These results indicated that the length of OsGPI8 transcripts increased at the 3′-end, especially under HT conditions, in df plants.

3. Discussion

The GPI anchor biosynthesis pathway has been studied intensively in yeast and in humans, and it is believed that this pathway may also be conserved in plants. In Arabidopsis, homologous genes exist for almost all the known components of the GPI anchoring pathway, although currently the only genes that have been studied are SETH1, SETH2, PEANUT1 (PNT1), APTG1, and AtGPI8 [9,10,11,12]. These genes encode enzymes that catalyze specific steps in the biosynthesis of the anchor. The yeast and mammalian GPI transamidase complexes consist of five subunits [3]. Like Arabidopsis [12], rice has homologs of all five subunits, with all but one subunit encoded by only one gene: they are LOC_Os02g12740, which is a homolog of At1g08750 and Gpi8/PIG-K, LOC_Os01g48980 (At5g19130, Gaa1p/GAA1), LOC_Os01g67960 (At3g07180, Gpi17p/PIG-S), LOC_Os11g28980 (At3g07140, Gpi16p/PIG-T), LOC_Os02g46350, and LOC_Os01g64990 (At1g12730 and At3g27325, Gab1p/PIG-U).
Alternative splicing, which can lead to intron retention in transcripts, is widely observed in plants [32,33]. Changes in splicing are induced by environmental stimuli including ambient temperature [34,35]. There is an interplay between the messenger RNA processing reactions, splicing, and polyadenylation, which take place co-transcriptionally [36]. Intron retention and alternative splicing are associated with polyadenylation sites in plants [31]. Defects in pre-mRNA splicing of OsGPI8 transcripts at higher temperatures in df plants is an interesting but as yet inexplicable phenomenon. The OsGPI8 gene contains at least two polyadenylation sites (Supplementary Figure S5B). RT-PCR analysis indicated that when df plants were grown under HT conditions they had the same amount of OsGPI8 transcripts as at LT, but most of them had a longer 3′-UTR and retained the majority of the nine introns (Figure 6). These results imply that the usage of alternative polyadenylation sites was one factor leading to intron retention in OsGPI8 gene transcripts in the df plants. The mechanism underlying intron retention in OsGPI8 transcripts after the insertion of the T-DNA in df plants may be that, on the one hand, the basic terminators of rice GPI8 have variability, and the insertion of foreign DNA disrupts the termination message, which results in a large increase in the length of 3′-UTR at a higher temperature. On the other hand, the DNA changes in structure or chromatin accessibility [37], or transcriptional interference [38] by the foreign GUS gene when it is inserted near the OsGPI8 gene, and this merits further study. Expression of OsGPI8 cDNA containing the complete coding sequences was found to rescue the rice df mutant (Figure 5A,B), confirming that it is the T-DNA insertion and defective pre-mRNA splicing of the OsGPI8 transcript that cause the drooping and fragile phenotype of this df mutant.
Our study of the df mutant allowed us to explore the role of GPI-APs in morphology, growth, and development in rice. By analysis of the rice protein database of 66,338 proteins (Phytozome, http://www.phytozome.net/index.ph-p), a total of 481 proteins were predicted to be GPI-APs and were identified by two or more methods (shown in Supplementary Table S2). Eight members of BC1-like family proteins were predicted as GPI-APs. The CWA1/BC1 gene encodes a COBRA-like protein and functions in the regulation of secondary cell wall deposition and assembly in rice [24,39,40]. Mutation of BC1 causes a reduction in cellulose content but an increase in lignin content [24]. A decrease in cellulose content but an increase in pectin and starch contents were identified in Osbc1l4 mutants that showed abnormal cell expansion, dwarfing, and fewer tillers phenotype [25]. OsBC1L5 is required for pollen tube elongation in rice [41]. Except for the BC1 family, CLD1/SRL1 also encodes a GPI-anchored membrane protein that modulates leaf rolling and other aspects of rice growth [26,27]. The cld1 mutant exhibits significant decreases in cellulose and lignin contents in cell walls of leaves.
According to annotation of rice GPI-APs, they are mainly involved in Glycosyl hydrolases family 17 (60), plastocyanin-like family proteins (41), lipid transfer like proteins (LTPs, 36), and Fasciclin-like (23). Glycosyl hydrolases were suggested to degrade the cell wall polymer, and are required for cell wall organization during tissue morphogenesis [42]. The plastocyanin-like family proteins are plant-specific blue copper proteins that were reported to regulate lignin biosynthesis induced by oxidative stress [43]. The LTPs may function in cuticular wax export [23] as well as cell wall extension [44]. Fasciclin-like GPI-APs were reported to play roles in regulating cell-type specification, cellulose deposition, and formation of secondary cell wall composition in Arabidopsis. In summary, many GPI-APs function on the formation of cell walls in plants. They can regulate the biosynthesis of cell wall composition such as cellulose and lignin, cellulose assembly, and the formation of the microfibril crystallinity in cell walls. Here, the df plants have a reduction of cellulose and lignin contents (Table 1), suggesting GPI-APs may positive regulate the biosynthesis and accumulation of cellulose and lignin in rice. Moreover, we speculate that plastocyanin-like family proteins might be involved in the pathway of OsGPI8 regulating affecting cell wall components since plastocyanin-like proteins directly affect lignin biosynthesis. The dense structure of the cell wall was changed in the df mutant (Figure 2F and Figure 3), indicating the roles of GPI-APs in regulating the deposition and assembly of cell wall polymers during cell wall formation in rice.
GPI-APs were found to modulate cell division in Arabidopsis. AtAGP19 is a lysine-rich, classical AGP that is predicted to be attached to the plasma membrane by a GPI anchor. The atagp19 mutant has a reduced number of abaxial epidermal cells in rosette leaves, indicating a decrease in cell division [45]. The reduction in cell division among parenchyma cells in internodes of df plants (Figure 2D,E) indicated that, in rice, GPI-APs have a function related to cell division. The homology protein of AtAGP19 was not found in the rice protein database. The cell division related to GPI-APs in rice remains to be explored. The fragile culm and leaves phenotype of df plants is likely to be due to the reduction in parenchymal cell layers and in the deposition and assembly of secondary cell wall materials (Figure 2E and Figure 3D). The drooping leaves may result from the significant reduction in wall thickness and cellulose content in sclerenchyma cells, which are thus insufficiently strong to support the blade.
The loss of GPI anchoring is lethal in Arabidopsis [10,11]. A T-DNA insertion line of AtGPI8, atgpi8-2 is distributed as a heterozygous line, and it does not segregate out homozygous plants. In addition, atgpi8-1/atgpi8-2 plants were found to be severely dwarfed; they never flowered, and did not survive into maturity [12]. The atgpi8-1 mutant has a mutation consisting of a G to A substitution at base pair 125 which results in the replacement of Arg-42 with Gln-42 [12]. While the atgpi8-1 mutation strongly disrupts plant growth, it is not lethal. Since it is not a null mutant of GPI8, it is understandable that the df mutation is not lethal even when plants are grown at HT. No stomatal clustering [12] in leaf blades or male defects [9,10,11] were observed in df plants, but there was a reduction in plant height and in cell number in the culm shell (Figure 1 and Figure 2). These results suggest distinct physiological and developmental differences between Arabidopsis and rice in response to a lower level of GPI anchoring.
GPI-APs are widespread in eukaryotic cells. However, direct evidence for the role of GPI-APs in rice physiology and development has hitherto been largely lacking. In conclusion, in this work, we confirm that the T-DNA insert the downstream of the stop codon in the OsGPI8 gene in rice, which results in intron retention and the knockdown of the GPI8 gene under higher temperature conditions. Analysis of knockdown of the GPI8 gene demonstrates the importance of GPI-APs in the accumulation of cell wall material, cell expansion, and cell division, as well as the morphology and mechanical strength of rice plants.

4. Materials and Methods

4.1. Plant Materials and Growth Conditions

The df mutant was generated from transgenic RCCR1i T-DNA insertion lines of the japonica rice cv. Huazhiwu. Wild-type rice (Oryza sativa L.), OsRCCR1i, and df plants were grown in a greenhouse under natural daylight at South China Botanical Garden, CAS, in Guangzhou during the natural growing seasons. For temperature treatments, the seedlings were cultivated in rice nutrient solution [46] in square basins and placed in growth chambers (16 h light/8 h dark, higher temperature (29–33 °C), lower temperature (19–23 °C)).

4.2. Cloning of the df Gene and Complementation Test

DNA fragments flanking the T-DNA insertions were amplified from the mutant plant genomic DNA using TAIL-PCR [29]. The PCR products were cloned into a pMD18-T vector (Takara; http://www.takara.co.jp/english) and sequenced by a company (Augct, Beijing, China). BLAST analysis indicates that the gene obtained from the df mutant was on chromosome 2. The OsGPI8 cDNA was cloned into a pMD18-T vector by reverse transcription-PCR using primers of fGPI8F and fGPI8R (shown in Supplementary Table S1). For the complementation test, the OsGPI8 cDNA clone with the complete CDS was digested with Xba I and subcloned into the corresponding site of pCAMBIA2301 under the control of the cauliflower mosaic virus (CaMV) 35S promoter. The PCR primers used are listed in Supplementary Table S1. Agrobacterium strain EHA105 harboring the above vector was used to transform mutant calli via Agrobacterium tumefaciens-mediated transformation [7].

4.3. RNA Isolation and Expression Analysis

Total RNA was isolated from different tissues using Trizol reagent (Invitrogen, Carlsbad, CA, USA) following the manufacturer’s instructions. First-strand cDNA was synthesized from 3 μg of the total RNA using M-MLV reverse transcriptase (Promega, Madison, WI, USA) and was used as a template for semi-quantitative PCR analysis after normalization relative to a rice polyubiquitin1 gene (OsRUB1, LOC_Os06g46770) [8]. Primers used for this part of the study are listed in Supplementary Table S1. Quantitative real-time PCR was performed using an ABI 7500 fast system with a SYBR Premix Ex TaqTM II (perfect real-time) kit (Takara) and the following program: predenaturation at 95 °C for 30 s, followed by 40 cycles of 95 °C for 5 s, 60 °C for 34 s, and a final dissociation cycle of 95 °C for 15 s, 60 °C for 1 min, and 95 °C for 15 s. Each PCR assay was run in duplicate for three independent biological repeats. The comparative Ct method [30] was used to determine the relative expression of the target genes, with OsRUB1 as the reference gene.

4.4. Southern Blot Analysis

Approximately 5 µg of DNA from each sample was digested with EcoR I, EcoR V, Hind III, and Sac I (Takara) and separated on a 0.8% (w/v) agarose gel. The restriction enzyme recognition sites occur only once each within the T-DNA, allowing the transgene copy number to be estimated. The fractionated genomic DNA was transferred to a positively charged nylon membrane using 20× saline sodium citrate (SSC; 1.5 M NaCl, 0.15 M sodium citrate) (Amersham Pharmacia Biotech, Piscataway, NJ, USA). Probes were prepared using a PCR DIG probe synthesis kit (Roche, Basel, Switzerland). Hybridization was performed according to the DIG Application Manual (Roche). Hybridization was at 42 °C and washing was performed under high-stringency conditions at 65 °C.

4.5. Mechanical Strength Test

The breaking forces for rice culms or leaves were measured with a universal force/length testing device (model Zwick Z2010, Ulm, Germany). For the measurements, second internodes (with leaf sheath) and flag leaf blades of WT, RCCR1i and df plants cut to the same length were used.

4.6. Microscopic Analysis

For light microscopic analysis, second internodes excised from rice plants were fixed in an FAA solution (formaldehyde 5 mL, glacial acetic acid 5 mL, and 70% ethanol 90 mL). The samples were dehydrated through an ethanol gradient and embedded in paraffin. For cell wall staining, sections were cut at a thickness of 10 μm with a microtome (Leica RM2255, Leica Biosystems, Buffalo Grove, IL, USA) and stained in 0.1% methylene blue for 3 to 5 min. The stained sections were examined and details recorded by taking pictures under a light microscope (ZEISS, Axio Imager A2, Jena, Germany) with a color CCD camera (AxioCam MRc). For electron microscopy, internodes excised from rice plants were fixed in 2.5% glutaraldehyde and 2% paraformaldehyde, then dehydrated through an ethanol series and embedded in Spurr resin. Ultra-thin sections were made using glass knives on an Ultracut E ultramicrotome (Leica). Ultra-thin sections (0.1 μm) were stained with 2% uranyl acetate for 1 h and 6% lead citrate for 20 min and observed with an electron microscope (JEM-1010, Jeol; http://www.jeol.com).
For microscopic analysis of leaf blade samples, the third leaves from four-leaf stage seedlings were fixed in 2.5% glutaraldehyde, vacuum treated, and post-fixed in 2% (w/v) osmium tetroxide, and washed with 0.1 M phosphate-buffered saline several times until osmium tetroxide was eliminated. Subsequently, samples were dehydrated successively with 30% (4 °C, 20 min), 50% (4 °C, 20 min), 70% (4 °C, overnight), 80% (RT, 15 min), 90% (RT, 15 min), 100% alcohol (RT, 30 min for twice), and finally propylene oxide (RT, 30 min for twice). After dehydration, samples were treated by different ratios of propylene oxide and epoxy resin and then embedded in pure epoxy resin. Semithin sections (2 μm) were stained with toluidine blue for 30 s, then observed and recorded by taking pictures under a light microscope with a color CCD camera (Zeiss). Ultra-thin sections were stained with 2% uranyl acetate for 1 h and 6% lead citrate for 20 min and observed with an electron microscope (JEM-1010, Jeol; http://www.jeol.com).

4.7. 3′-RACE PCR

The 3′-Race PCR was performed using a BD SMART™ RACE cDNA Amplification kit, referring to the manufacturer’s instructions. The primers are listed in Supplementary Table S1.

4.8. Cell Wall Component Measurement

Carbohydrate was isolated and assayed according to the methods described previously [47,48,49]. The samples (the second internode and flag leaf blades) were dried and ground into a fine powder using a food processor (JYL-B020). The powder was washed three times in phosphate buffer (50 mM, pH 7.2), extracted twice with 70% ethanol at 70 °C for 1 h, and dried under vacuum to produce alcohol-insoluble residue (AIR). De-starching was performed by treating AIR with pullulanase M3 (0.5 U mg−1, Megazyme, http://www.megazyme.com) and α-amylase (0.75 U mg−1, Sigma) in 0.1 m NaOAc buffer (pH 5.0) overnight. The destarched AIRs further hydrolyzed into monosaccharides by Trifluoroacetic acid (TFA) and were reduced with sodiumborohydride. The alditol acetate derivatives produced by acetic anhydride treatment were subjected to GC-MS according to Zhang and Zhou (2017) [49]. The remains of TFA treatment were hydrolyzed with sulfuric acid. After the development of color with anthrone in concentrated sulfuric acid, the absorption of each reaction at 625 nm was measured on a spectrophotometer [49,50].
The lignin content was measured using the acetyl bromide assay [51]. About 10 mg of AIR for each sample was dissolved in 0.6 mL of 25% acetyl bromide in glacial acetic acid and heated at 50 °C for 2 h with occasional mixing. After cooling, the samples were centrifuged (3000× g, 15 min) and the supernatants were used for lignin quantification with hydroxylamine hydrochloride solution. Lignin (471003, SIGMA-ALDRICH) was used as the standard. The absorbance at 280 nm for each sample was measured using a spectrophotometer (UV-1800, MAPADA).
The callose content was measured as described previously [52] with some modifications. About 100 mg of fresh leaves were ground into a fine powder in liquid nitrogen after washing 3 times with ethanol to eliminate autofluorescence and then suspended in 1 mL 1 M NaOH. Samples were incubated at 80 °C for 15 min to solubilize the callose. The mixture was centrifuged (10,000× g, 15 min) and the supernatants were used for the callose assay. For callose determination, 0.1% (w/v) aniline blue was used for the reaction and 1,3-β-glucan (Pachyman, Megazyme) was used as the standard. Fluorescence of the assay mixture was read in a spectrofluorometer (PE LS55, excitation 400 nm; emission, 510 nm; slit width, 10 nm).

4.9. Statistical Analysis

Three to six biological repeats were used for all experiments, and all data in this work were analyzed with a Duncan test [53] using the SAS software package (http://www.sas.com/en_us/software/sas9.html).

Supplementary Materials

Supplementary materials can be found at https://www.mdpi.com/1422-0067/21/1/299/s1.

Author Contributions

The research was designed by G.W., Y.C., and Y.Z. The experiments were performed by B.Z. (Bo Zhao), B.Z. (Baocai Zhang), P.W., H.J., and Y.T. Data were analyzed by Y.C. and P.W. The manuscript was written by B.Z. All authors have read and agreed to the published version of the manuscript.

Funding

This work was supported by the High-Tech Research and Development Program of China (863 Program, grant no.2006AA10Z163), the Nation Natural Science Foundation of China (grant no.30770174), and the CAS/SAFEA International Partnership Program for Creative Research Teams.

Conflicts of Interest

The authors declare no conflict of interest.

Abbreviations

AIRLcohol insoluble residue
AtArabidopsis thaliana
CaMVCauliflower mosaic virus
dfDrooping and fragile
EtNPEthanolamine phosphate
GC-MSGas Chromatography-Mass Spectrometer
GlcAGlucosamine
GNAGlucosamine-6-P acetyltransferase
GPIGlycosylphosphatidylinositol
GPI-ApsGPI anchor proteins
GPI-TGPI transamidase
GPIsGlycosylphosphatidylinositols
HTHigh temperature
LTLow temperature
OsOryza sativa
PCRPolymerase Chain Reaction
RACERapid amplification of cDNA ends
RCCRRed chlorophyll catabolite reductase
SDStandard deviation
TAIL-PCRThermal asymmetric interlaced PCR
UDP-GlcNAcUDP-N-acetylglucosamine
3′-UTR3′-Untranslated region

References

  1. Eisenhaber, B.; Bork, P.; Eisenhaber, F. Post-translational GPI lipid anchor modification of proteins in kingdoms of life: Analysis of protein sequence data from complete genomes. Protein Eng. 2001, 14, 17–25. [Google Scholar] [CrossRef] [Green Version]
  2. Ferguson, M.A.J. The structure, biosynthesis and functions of glycosylphosphatidylinositol anchors, and the contributions of trypanosome research. J. Cell Sci. 1999, 112, 2799–2809. [Google Scholar] [PubMed]
  3. Kinoshita, T. Enzymatic mechanism of GPI anchor attachment clarified. Cell Cycle 2014, 13, 1838–1839. [Google Scholar] [CrossRef] [PubMed] [Green Version]
  4. Eisenhaber, B.; Eisenhaber, S.; Kwang, T.Y.; Grüber, G.; Eisenhaber, F. Transamidase subunit GAA1/GPAA1 is a M28 family metallo-peptidesynthetase that catalyzes the peptide bond formation between the substrate protein’s omega-site and the GPI lipid anchor’s phosphoethanolamine. Cell Cycle 2014, 13, 1912–1917. [Google Scholar] [CrossRef] [PubMed] [Green Version]
  5. Zacks, M.; Garg, A.N. Recent developments in the molecular, biochemical and functional characterization of GPI8 and the GPI-anchoring mechanism. Mol. Membr. Biol. 2006, 23, 209–225. [Google Scholar] [CrossRef] [PubMed]
  6. Watanabe, R.; Inoue, N.; Westfall, B.; Taron, C.H.; Orlean, P.; Takeda, J.; Kinoshita, T. The first step of glycosylphosphatidylinositol biosynthesis is mediated by a complex of PIG-A, PIG-H, PIG-C and GPI1. EMBO J. 1998, 17, 877–885. [Google Scholar] [CrossRef] [PubMed] [Green Version]
  7. Jiang, H.; Wang, S.; Dang, L.; Wang, S.; Chen, H.; Wu, Y.; Jiang, X.; Wu, P. A novel short-root gene encodes a glucosamine-6-phosphate acetyltransferase required for maintaining normal root cell shape in rice. Plant Physiol. 2005, 138, 232–242. [Google Scholar] [CrossRef] [Green Version]
  8. Nozaki, M.; Sugiyama, M.; Duan, J.; Uematsu, H.; Genda, T.; Sato, Y. A missense mutation in the glucosamine-6-phosphate N-acetyltransferase-encoding gene causes temperature-dependent growth defects and ectopic lignin deposition in Arabidopsis. Plant Cell 2012, 24, 3366–3379. [Google Scholar] [CrossRef] [Green Version]
  9. Lalanne, E.; Honys, D.; Johnson, A.; Borner, G.H.; Lilley, K.S.; Dupree, P.; Grossniklaus, U.; Twell, D. SETH1 and SETH2, two components of the glycosylphosphatidylinositol anchor biosynthetic pathway, are required for pollen germination and tube growth in Arabidopsis. Plant Cell 2004, 16, 229–240. [Google Scholar] [CrossRef] [Green Version]
  10. Dai, X.R.; Gao, X.Q.; Chen, G.H.; Tang, L.L.; Wang, H.; Zhang, X.S. ABNORMAL POLLEN TUBE GUIDANCE1, an endoplasmic reticulum-localized mannosyltransferase homolog of GLYCOSYLPHOSPHATIDYLINOSITOL10 in yeast and PHOSPHATIDYLINOSITOL GLYCAN ANCHOR BIOSYNTHESIS B in human, is required for arabidopsis pollen tube micropylar guidance and embryo development. Plant Physiol. 2014, 165, 1544–1556. [Google Scholar] [CrossRef]
  11. Gillmor, C.S.; Lukowitz, W.; Brininstool, G.; Sedbrook, J.C.; Hamann, T.; Poindexter, P.; Somerville, C. Glycosylphosphatidylinositol-anchored proteins are required for cell wall synthesis and morphogenesis in Arabidopsis. Plant Cell 2005, 17, 1128–1140. [Google Scholar] [CrossRef] [PubMed]
  12. Bundy, M.G.R.; Kosentka, P.Z.; Willet, A.H.; Zhang, L.; Miller, E.; Shpak, E.D. A mutation in the catalytic subunit of the glycosylphosphatidylinositol transamidase disrupts growth, fertility, and stomata formation. Plant Physiol. 2016, 171, 974–985. [Google Scholar] [CrossRef] [PubMed] [Green Version]
  13. Borner, G.H.; Lilley, K.S.; Stevens, T.J.; Dupree, P. Identification of glycosylphosphatidylinositol-anchored proteins in Arabidopsis. A proteomic and genomic analysis. Plant Physiol. 2003, 132, 568–577. [Google Scholar] [CrossRef] [PubMed] [Green Version]
  14. Schindelman, G.; Morikami, A.; Jung, J.; Baskin, T.I.; Carpita, N.C.; Derbyshire, P.; McCann, M.C.; Benfey, P.N. COBRA encodes a putative GPI-anchored protein, which is polarly localized and necessary for oriented cell expansion in Arabidopsis. Genes Dev. 2001, 15, 1115–1127. [Google Scholar] [CrossRef] [Green Version]
  15. Shi, H.; Kim, Y.; Guo, Y.; Stevenson, B.; Zhu, J. The Arabidopsis SOS5 locus encodes a putative cell surface adhesion protein and is required for normal cell expansion. Plant Cell 2003, 15, 19–32. [Google Scholar] [CrossRef] [Green Version]
  16. Hayashi, S.; Ishii, T.; Matsunaga, T.; Tominaga, R.; Kuromori, T.; Wada, T.; Shinozaki, K.; Hirayama, T. The glycerophosphoryl diester phosphodiesterase-like proteins SHV3 and its homologs play important roles in cell wall organization. Plant Cell Physiol. 2008, 49, 1522–1535. [Google Scholar] [CrossRef] [Green Version]
  17. MacMillan, C.P.; Mansfield, S.D.; Stachurski, Z.H.; Evans, R.; Southerton, S.G. Fasciclin-like arabinogalactan proteins: Specialization for stem biomechanics and cell wall architecture in Arabidopsis and Eucalyptus. Plant J. 2010, 62, 689–703. [Google Scholar] [CrossRef]
  18. Sedbrook, J.C.; Carroll, K.L.; Hung, K.F.; Masson, P.H.; Somerville, C.R. The Arabidopsis SKU5 gene encodes an extracellular glycosyl phosphatidylinositol-anchored glycoprotein involved in directional root growth. Plant Cell 2002, 14, 1635–1648. [Google Scholar] [CrossRef] [Green Version]
  19. Coimbra, S.; Costa, M.; Jones, B.; Mendes, M.A.; Pereira, L.G. Pollen grain development is compromised in Arabidopsis agp6 agp11 null mutants. J. Exp. Bot. 2009, 60, 3133–3142. [Google Scholar] [CrossRef] [Green Version]
  20. Gao, H.; Zhang, Y.; Wang, W.; Zhao, K.; Liu, C.; Bai, L.; Li, R.; Guo, Y. Two membrane-anchored aspartic proteases contribute to pollen and ovule development. Plant Physiol. 2017, 173, 219–239. [Google Scholar] [CrossRef] [Green Version]
  21. Hou, Y.; Guo, X.; Cyprys, P.; Zhang, Y.; Bleckmann, A.; Cai, L.; Huang, Q.; Luo, Y.; Gu, H.; Dresselhaus, T.; et al. Maternal ENODLs are required for pollen tube reception in Arabidopsis. Curr. Biol. 2016, 26, 2343–2350. [Google Scholar] [CrossRef] [PubMed] [Green Version]
  22. Capron, A.; Gourgues, M.; Neiva, L.S.; Faure, J.E.; Berger, F.; Pagnussat, G.; Krishnan, A.; Alvarez-Mejia, C.; Vielle-Calzada, J.P.; Lee, Y.R.; et al. Maternal control of male-gamete delivery in Arabidopsis involves a putative GPI-anchored protein encoded by the LORELEI gene. Plant Cell 2008, 20, 3038–3049. [Google Scholar] [CrossRef] [PubMed] [Green Version]
  23. Yeats, T.H.; Bacic, A.; Johnson, K.L. Plant glycosylphosphatidylinositol anchored proteins at the plasma membrane-cell wall nexus. J. Integr. Plant Biol. 2018, 60, 649–669. [Google Scholar] [CrossRef] [PubMed]
  24. Li, Y.; Qian, Q.; Zhou, Y.; Yan, M.; Sun, L.; Zhang, M.; Fu, Z.; Wang, Y.; Han, B.; Pang, X.; et al. BRITTLE CULM1, which encodes a COBRA-like protein, affects the mechanical properties of rice plants. Plant Cell 2003, 15, 2020–2031. [Google Scholar] [CrossRef] [Green Version]
  25. Dai, X.; You, C.; Chen, G.; Li, X.; Zhang, Q.; Wu, C. OsBC1L4 encodes a COBRA-like protein that affects cellulose synthesis in rice. Plant Mol. Biol. 2011, 75, 333–345. [Google Scholar] [CrossRef]
  26. Xiang, J.; Zhang, G.; Qian, Q.; Xue, H. SEMI-ROLLED LEAF1 encodes a putative glycosylphosphatidylinositol-anchored protein and modulates rice leaf rolling by regulating the formation of bulliform cells. Plant Physiol. 2012, 159, 1488–1500. [Google Scholar] [CrossRef] [Green Version]
  27. Li, W.; Zhang, M.; Gan, P.; Qiao, L.; Yang, S.; Miao, H.; Wang, G.; Zhang, M.; Liu, W.; Li, H.; et al. CLD1/SRL1 modulates leaf rolling by affecting cell wall formation, epidermis integrity and water homeostasis in rice. Plant J. 2017, 92, 904–923. [Google Scholar] [CrossRef] [Green Version]
  28. Tang, Y.; Li, M.; Chen, Y.; Wu, P.; Wu, G.; Jiang, H. Knockdown of OsPAO and OsRCCR1 cause different plant death phenotypes in rice. J. Plant Physiol. 2011, 168, 1952–1959. [Google Scholar] [CrossRef]
  29. Liu, Y.; Chen, Y. High-efficiency thermal asymmetric interlaced PCR for amplification of unknown flanking sequences. Biotechniques 2007, 43, 649–656. [Google Scholar] [CrossRef]
  30. Livak, K.J.; Schmittgen, T.D. Analysis of relative gene expression data using real-time quantitative PCR and the 2−ΔΔCt method. Methods 2001, 25, 402–408. [Google Scholar] [CrossRef]
  31. Li, Q.; Liu, Z.; Lu, W.; Liu, M. Interplay between alternative splicing and alternative polyadenylation defines the expression outcome of the plant unique OXIDATIVE TOLERANT-6 gene. Sci. Rep. 2017, 7, 2052. [Google Scholar] [CrossRef] [PubMed]
  32. Wang, B.; Brendel, V. Genomewide comparative analysis of alternative splicing in plants. Proc. Natl. Acad. Sci. USA 2006, 103, 7175–7180. [Google Scholar] [CrossRef] [PubMed] [Green Version]
  33. Reddy, A.S.; Marquez, Y.; Kalyna, M.; Barta, A. Complexity of the alternative splicing landscape in plants. Plant Cell 2013, 25, 3657–3683. [Google Scholar] [CrossRef] [PubMed] [Green Version]
  34. James, A.B.; Syed, N.H.; Bordage, S.; Marshall, J.; Nimmo, G.A.; Jenkins, G.I.; Herzyk, P.; Brown, J.W.; Nimmo, H.G. Alternative splicing mediates responses of the Arabidopsis circadian clock to temperature changes. Plant Cell 2012, 24, 961–981. [Google Scholar] [CrossRef] [Green Version]
  35. Capovilla, G.; Pajoro, A.; Immink, R.G.; Schmid, M. Role of alternative pre-mRNA splicing in temperature signaling. Curr. Opin. Plant Biol. 2015, 27, 97–103. [Google Scholar] [CrossRef]
  36. Proudfoot, N.J.; Furger, A.; Dye, M.J. Integrating mRNA processing with transcription. Cell 2002, 108, 501–512. [Google Scholar] [CrossRef] [Green Version]
  37. Ullah, F.; Hamilton, M.; Reddy, A.S.; Ben-Hur, A. Exploring the relationship between intron retention and chromatin accessibility in plants. BMC Genomics 2018, 19, 21. [Google Scholar] [CrossRef] [Green Version]
  38. Mazo, A.; Hodgson, J.W.; Petruk, S.; Sedkov, Y.; Brock, H.W. Transcriptional interference: An unexpected layer of complexity in gene regulation. J. Cell Sci. 2007, 120, 2755–2761. [Google Scholar] [CrossRef] [Green Version]
  39. Sato, K.; Suzuki, R.; Nishikubo, N.; Takenouchi, S.; Ito, S.; Nakano, Y.; Nakaba, S.; Sano, Y.; Funada, R.; Kajita, S.; et al. Isolation of a novel cell wall architecture mutant of rice with defective Arabidopsis COBL4 ortholog BC1 required for regulated deposition of secondary cell wall components. Planta 2010, 232, 257–270. [Google Scholar] [CrossRef]
  40. Liu, L.; Shang-Guan, K.; Zhang, B.; Liu, X.; Yan, M.; Zhang, L.; Shi, Y.; Zhang, M.; Qian, Q.; Li, J.; et al. Brittle Culm1, a COBRA-like protein, functions in cellulose assembly through binding cellulose microfibrils. PLoS Genet. 2013, 9, e1003704. [Google Scholar] [CrossRef]
  41. Dai, X.; You, C.; Wang, L.; Chen, G.; Zhang, Q.; Wu, C. Molecular characterization, expression pattern, and function analysis of the OsBC1L family in rice. Plant Mol. Biol. 2009, 71, 469–481. [Google Scholar] [CrossRef] [PubMed]
  42. Vaddepalli, P.; Fulton, L.; Wieland, J.; Wassmer, K.; Schaeffer, M.; Ranf, S.; Schneitz, K. The cell wall-localized atypical β-1,3 glucanase ZERZAUST controls tissue morphogenesis in Arabidopsis thaliana. Development 2017, 144, 2259–2269. [Google Scholar] [CrossRef] [PubMed] [Green Version]
  43. Ji, H.; Wang, Y.; Cloix, C.; Li, K.; Jenkins, G.I.; Wang, S.; Shang, Z.; Shi, Y.; Yang, S.; Li, X. The Arabidopsis RCC1 family protein TCF1 regulates freezing tolerance and cold acclimation through modulating lignin biosynthesis. PLoS Genet. 2015, 11, e1005471. [Google Scholar] [CrossRef] [PubMed]
  44. Nieuwland, J.; Feron, R.; Huisman, B.A.; Fasolino, A.; Hilbers, C.W.; Derksen, J.; Mariani, C. Lipid transfer proteins enhance cell wall extension in tobacco. Plant Cell 2005, 17, 2009–2019. [Google Scholar] [CrossRef] [PubMed] [Green Version]
  45. Yang, J.; Sardar, H.S.; McGovern, K.R.; Zhang, Y.; Showalter, A.M. A lysine-rich arabinogalactan protein in Arabidopsis is essential for plant growth and development, including cell division and expansion. Plant J. 2007, 49, 629–640. [Google Scholar] [CrossRef]
  46. Yoshida, S.; Forno, D.A.; Cock, J.H.; Gomez, K.A. Laboratory Manual for Physiological Studies of Rice, 3rd ed.; International Rice Research Institute: Manila, Philippines, 1976; pp. 61–64. [Google Scholar]
  47. Harholt, J.; Jensen, J.K.; Sorensen, S.O.; Orfila, C.; Pauly, M.; Scheller, H.V. ARABINAN DEFICIENT 1 is a putative arabinosyltransferase involved in biosynthesis of pectic arabinan in Arabidopsis. Plant Physiol. 2006, 140, 49–58. [Google Scholar] [CrossRef] [Green Version]
  48. Li, M.; Xiong, G.; Li, R.; Cui, J.; Tang, D.; Zhang, B.; Pauly, M.; Cheng, Z.; Zhou, Y. Rice cellulose synthase-like D4 is essential for normal cell-wall biosynthesis and plant growth. Plant J. 2009, 60, 1055–1069. [Google Scholar] [CrossRef] [Green Version]
  49. Zhang, B.; Zhou, Y. Carbohydrate composition analysis in xylem. Methods Mol. Biol. 2017, 1544, 213–222. [Google Scholar] [CrossRef]
  50. Updegraff, D.M. Semimicro determination of cellulose in biological materials. Anal. Biochem. 1969, 32, 420–424. [Google Scholar] [CrossRef]
  51. Fukushima, R.S.; Hatfield, R.D. Extraction and isolation of lignin for utilization as a standard to determine lignin concentration using the acetyl bromide spectrophotometric method. J. Agric. Food Chem. 2001, 49, 3133–3139. [Google Scholar] [CrossRef]
  52. Köhle, H.; Jeblick, W.; Blaschek, F.; Kauss, H. Chitosan-elicited callose synthesis in soybean cells as a Ca2+-dependent process. Plant Physiol. 1985, 77, 544–551. [Google Scholar] [CrossRef] [PubMed] [Green Version]
  53. Duncan, D.B. Multiple range and multiple F tests. Int. Biom. Soc. 1955, 11, 1–42. [Google Scholar] [CrossRef]
Figure 1. The phenotypes of df plants. (A) Tillering stage plants. (B) Filling stage plants. Brittleness of culms (C) and leaves (D). Breaking force for culms (E) and leaves (F). The second internode and flag leaves of filling stage plants were used for the test. When testing the culm, the leaf sheath was included. Error bar indicates ± SD from at least four biological repeats. ** Indicates significant difference (p < 0.01) between the df (drooping and fragile) mutant and RCCR1i plants.
Ijms 21 00299 g001
Figure 2. Differences in height and anatomical structures of internodes in RCCRi and df plants. (A) Morphology of the internodes. Each internodes are numbered below the panicle (P) to the base. (B) Statistical analysis of length changes among different internodes between RCCRi and df culms. (C) Statistical analysis of culm diameter changes of the second internodes between RCCRi and df plants. Error bar in (B) and (C) indicates ± SD from 15 plants. (D) Cellular analysis of RCCRi and df culms. Transverse sections of culms in the second internodes showing the reduced cell layers in df culms. (E) Statistical analysis of numbers of parenchyma cell layers in the second internodes of RCCRi and df culms. Error bar indicates ± SD from six measurements. ** Significant difference (p < 0.01). (F) Ultrastructure of cell walls in vascular bundle sheath cells of the region indicated by the rectangles in (D). Arrows indicate regions contain layers of different electron-dense materials in df culms.
Ijms 21 00299 g002
Figure 3. Electron microscopic observation of the sclerenchyma in the main leaf vein. Top of the main vein in leaves of RCCR1i (A) and df (B) plants. (C,D) Magnified sections of (A,B) showing the irregular shape and thin walls of sclerenchyma cells in the main leaf vein of df leaves. Arrows indicate the irregular shape cells.
Ijms 21 00299 g003
Figure 4. Cloning of the df gene. (A) Southern blot for the df mutant using a Hygromycin probe. DNA was digested with EcoR I (EI), EcoR V (EV), Hind III (H), and Sac I (S). DNA size markers are indicated on the left. (B) Location of the T-DNA insertion. The T-DNA is located between the LOC_Os02g12730 and LOC_Os02g12740 genes. For the LOC_Os02g12740 gene, dark bars represent its ten exons. (C) Differences in expression of LOC_Os02g12730 and LOC_Os02g12740 among df mutant, heterozygote (DF/df), and RCCR1i (DF), determined by RT-PCR analysis. Localization of the binding sites in exons 4 and 5 for the primer pair used for the testing of LOC_Os02g12740 transcripts is indicated in (B). Lengths (bp) corresponding to the predicted cDNA and genomic DNA are indicated. (D) RT-PCR of the transcripts containing the complete coding sequence of the OsGPI8 gene.
Ijms 21 00299 g004
Figure 5. Complementation of the df mutant by the OsGPI8 gene. (A) Two-week-old seedlings of two representative T2 lines of df plants overexpressing OsGPI8 (df/OsGPI8-Oe) grown under 29–33 °C conditions. Phenotype segregation (the ratio of normal phenotype to df phenotype is 17:5 and 7:2, in two independent lines, respectively) was observed among two independent df/OsGPI8-Oe T2 families. (B) Genomic PCR analysis of df/OsGPI8-Oe T2 families. The 433 bp bands are products amplified from the rice genomic DNA of the OsGPI8 gene, while the 266 bp bands are products from the artificial OsGPI8 gene (which contains no intron). The 266 bp bands are absent in these plants. The binding sites for the primer pair are indicated in Figure 2B. (C) Analysis of expression of the OsGPI8 gene. Each PCR assay was run in duplicate for three independent biological repeats. The comparative Ct method [30] (Livak and Schmittgen, 2001) was used to determine the relative expression of the target genes, with OsRUB1 as the reference gene.
Ijms 21 00299 g005
Figure 6. Temperature-dependent pre-mRNA splicing in df plants. (A) Distribution of primer pairs used for (q) RT-PCR along the OsGPI8 gene. The lengths (bp) of predicted cDNAs/genomic DNAs are indicated. (B) RT-PCR products of different regions of OsGPI8 transcripts. Bands corresponding to predicted cDNAs and genomic DNA are indicated. (C) RT-PCR products for transcripts which contain the complete coding domain sequence. Bands corresponding to predicted cDNAs are indicated. (D) qRT-PCR analysis of total OsGPI8 transcripts using the primer pair of 1F and 1R indicated in (A) in shoots grown at different temperatures. (E) qRT-PCR analysis of OsGPI8 transcripts with the longer 3′-UTR using the primer pair of 2F and 2R indicated in (A) in shoots grown at different temperatures. Relative expression was normalized to that of the reference gene OsRUB1 (internal control). Bars show standard deviations of the repeats. Each assay was run in duplicate for three independent biological repeats. HT = higher temperature (29–33 °C). LT = lower temperature (19–23 °C).
Ijms 21 00299 g006
Table 1. Measurement of the cell wall composition in df and RCCR1i plants.
Compound
(μg mg−1 AIR)
Culms
RCCR1i
RCCR1i
df
Leaf Blades
RCCR1i
Leaf Blades
df
Cellulose453.74 ± 8.13331.9 3 ± 4.79 **326.91 ± 5.62221.21 ± 7.06 **
Lignin142.41 ± 3.84104.45 ± 1.01 **98.72 ± 0.9985.54 ± 1.42 **
Neutral Sugars
Rhamnose2.15 ± 0.082.44 ± 0.05 *2.76 ± 0.092.97 ± 0.08
Fucose1.20 ± 0.021.18 ± 0.021.41 ± 0.041.51 ± 0.01
Arabinose32.58 ± 0.7034.97 ± 0.65 *41.79 ± 0.8845.40 ± 0.79 *
Xylose212.59 ± 3.74317.89 ± 5.00 **219.57 ± 4.83229.71 ± 3.58 *
Mannose2.19 ± 0.062.16 ± 0.042.56 ± 0.072.79 ± 0.03
Galactose24.24 ± 0.29619.89 ± 0.27 **17.10 ± 0.3018.56 ± 0.09 **
Glucose135.75 ± 0.8387.60 ± 1.58 **27.86 ± 0.5226.11 ± 0.31
*/** Significant difference compared with RCCR1i (p < 0.05/0.01).

