Temporal Effects of Quercetin on Tight Junction Barrier Properties and Claudin Expression and Localization in MDCK II Cells

 , and
, and 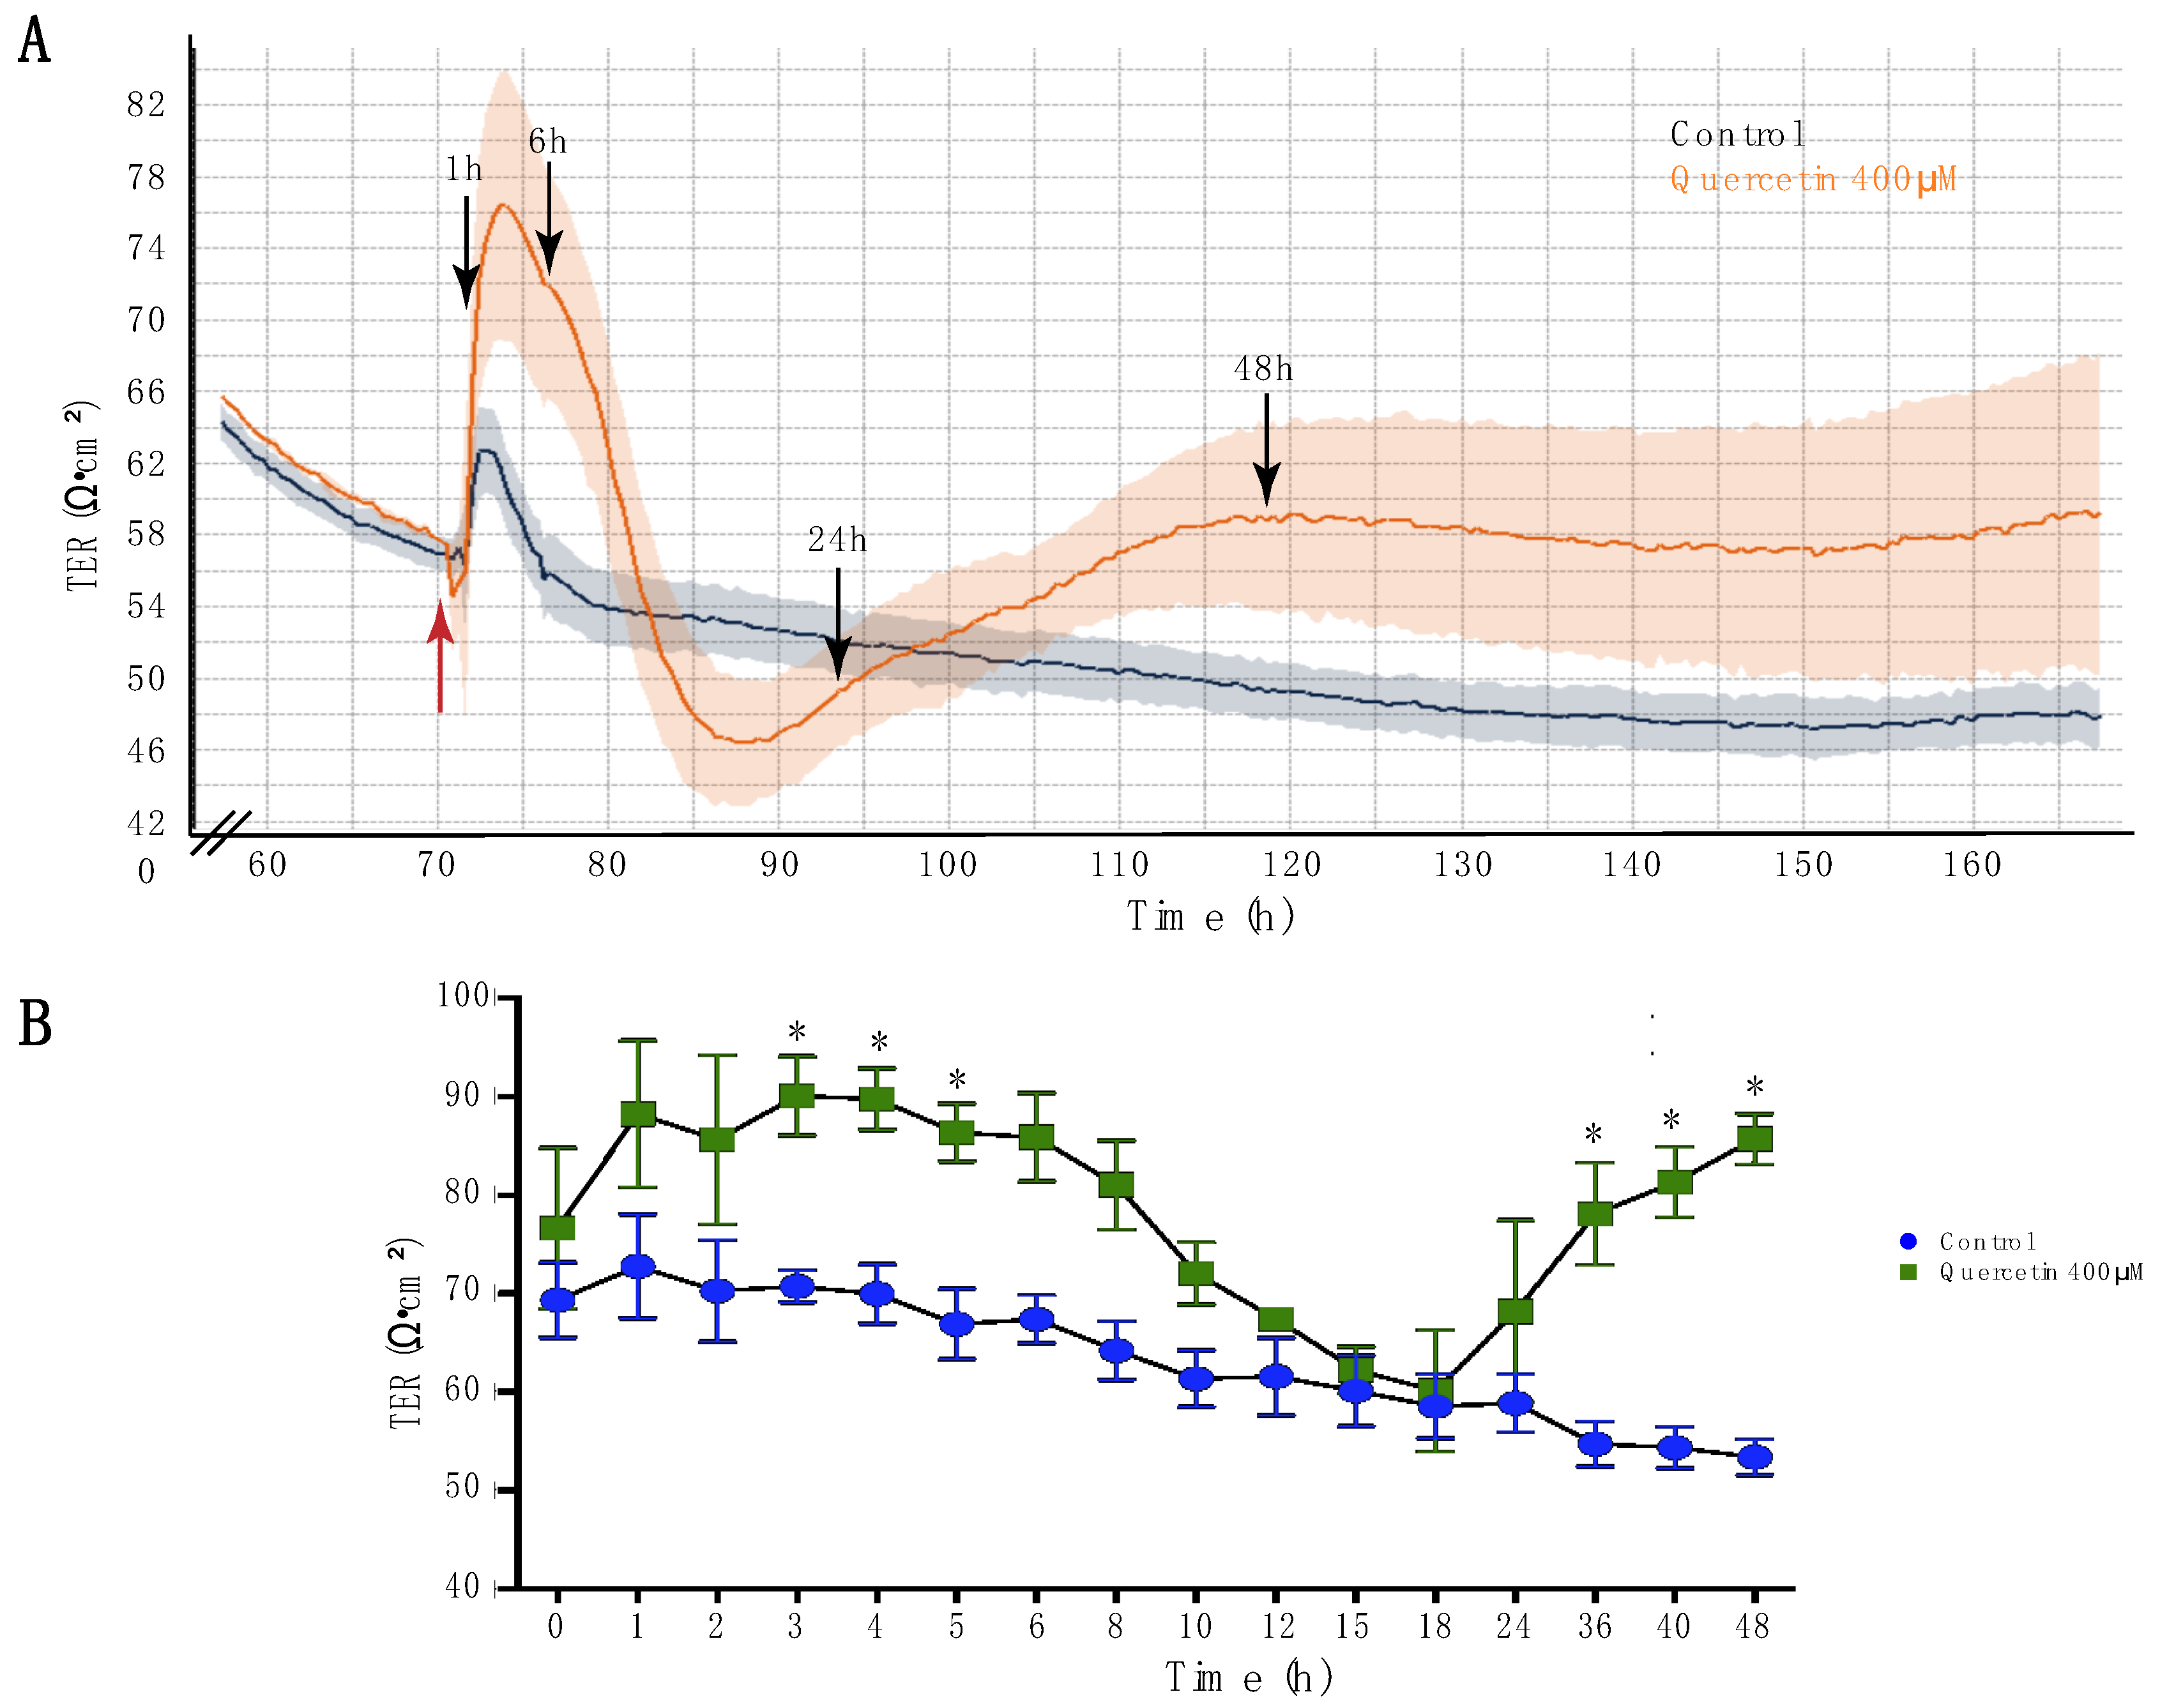
Abstract
:1. Introduction
2. Results
2.1. Quercetin Increased Transepithelial Resistance of MDCK II Cells
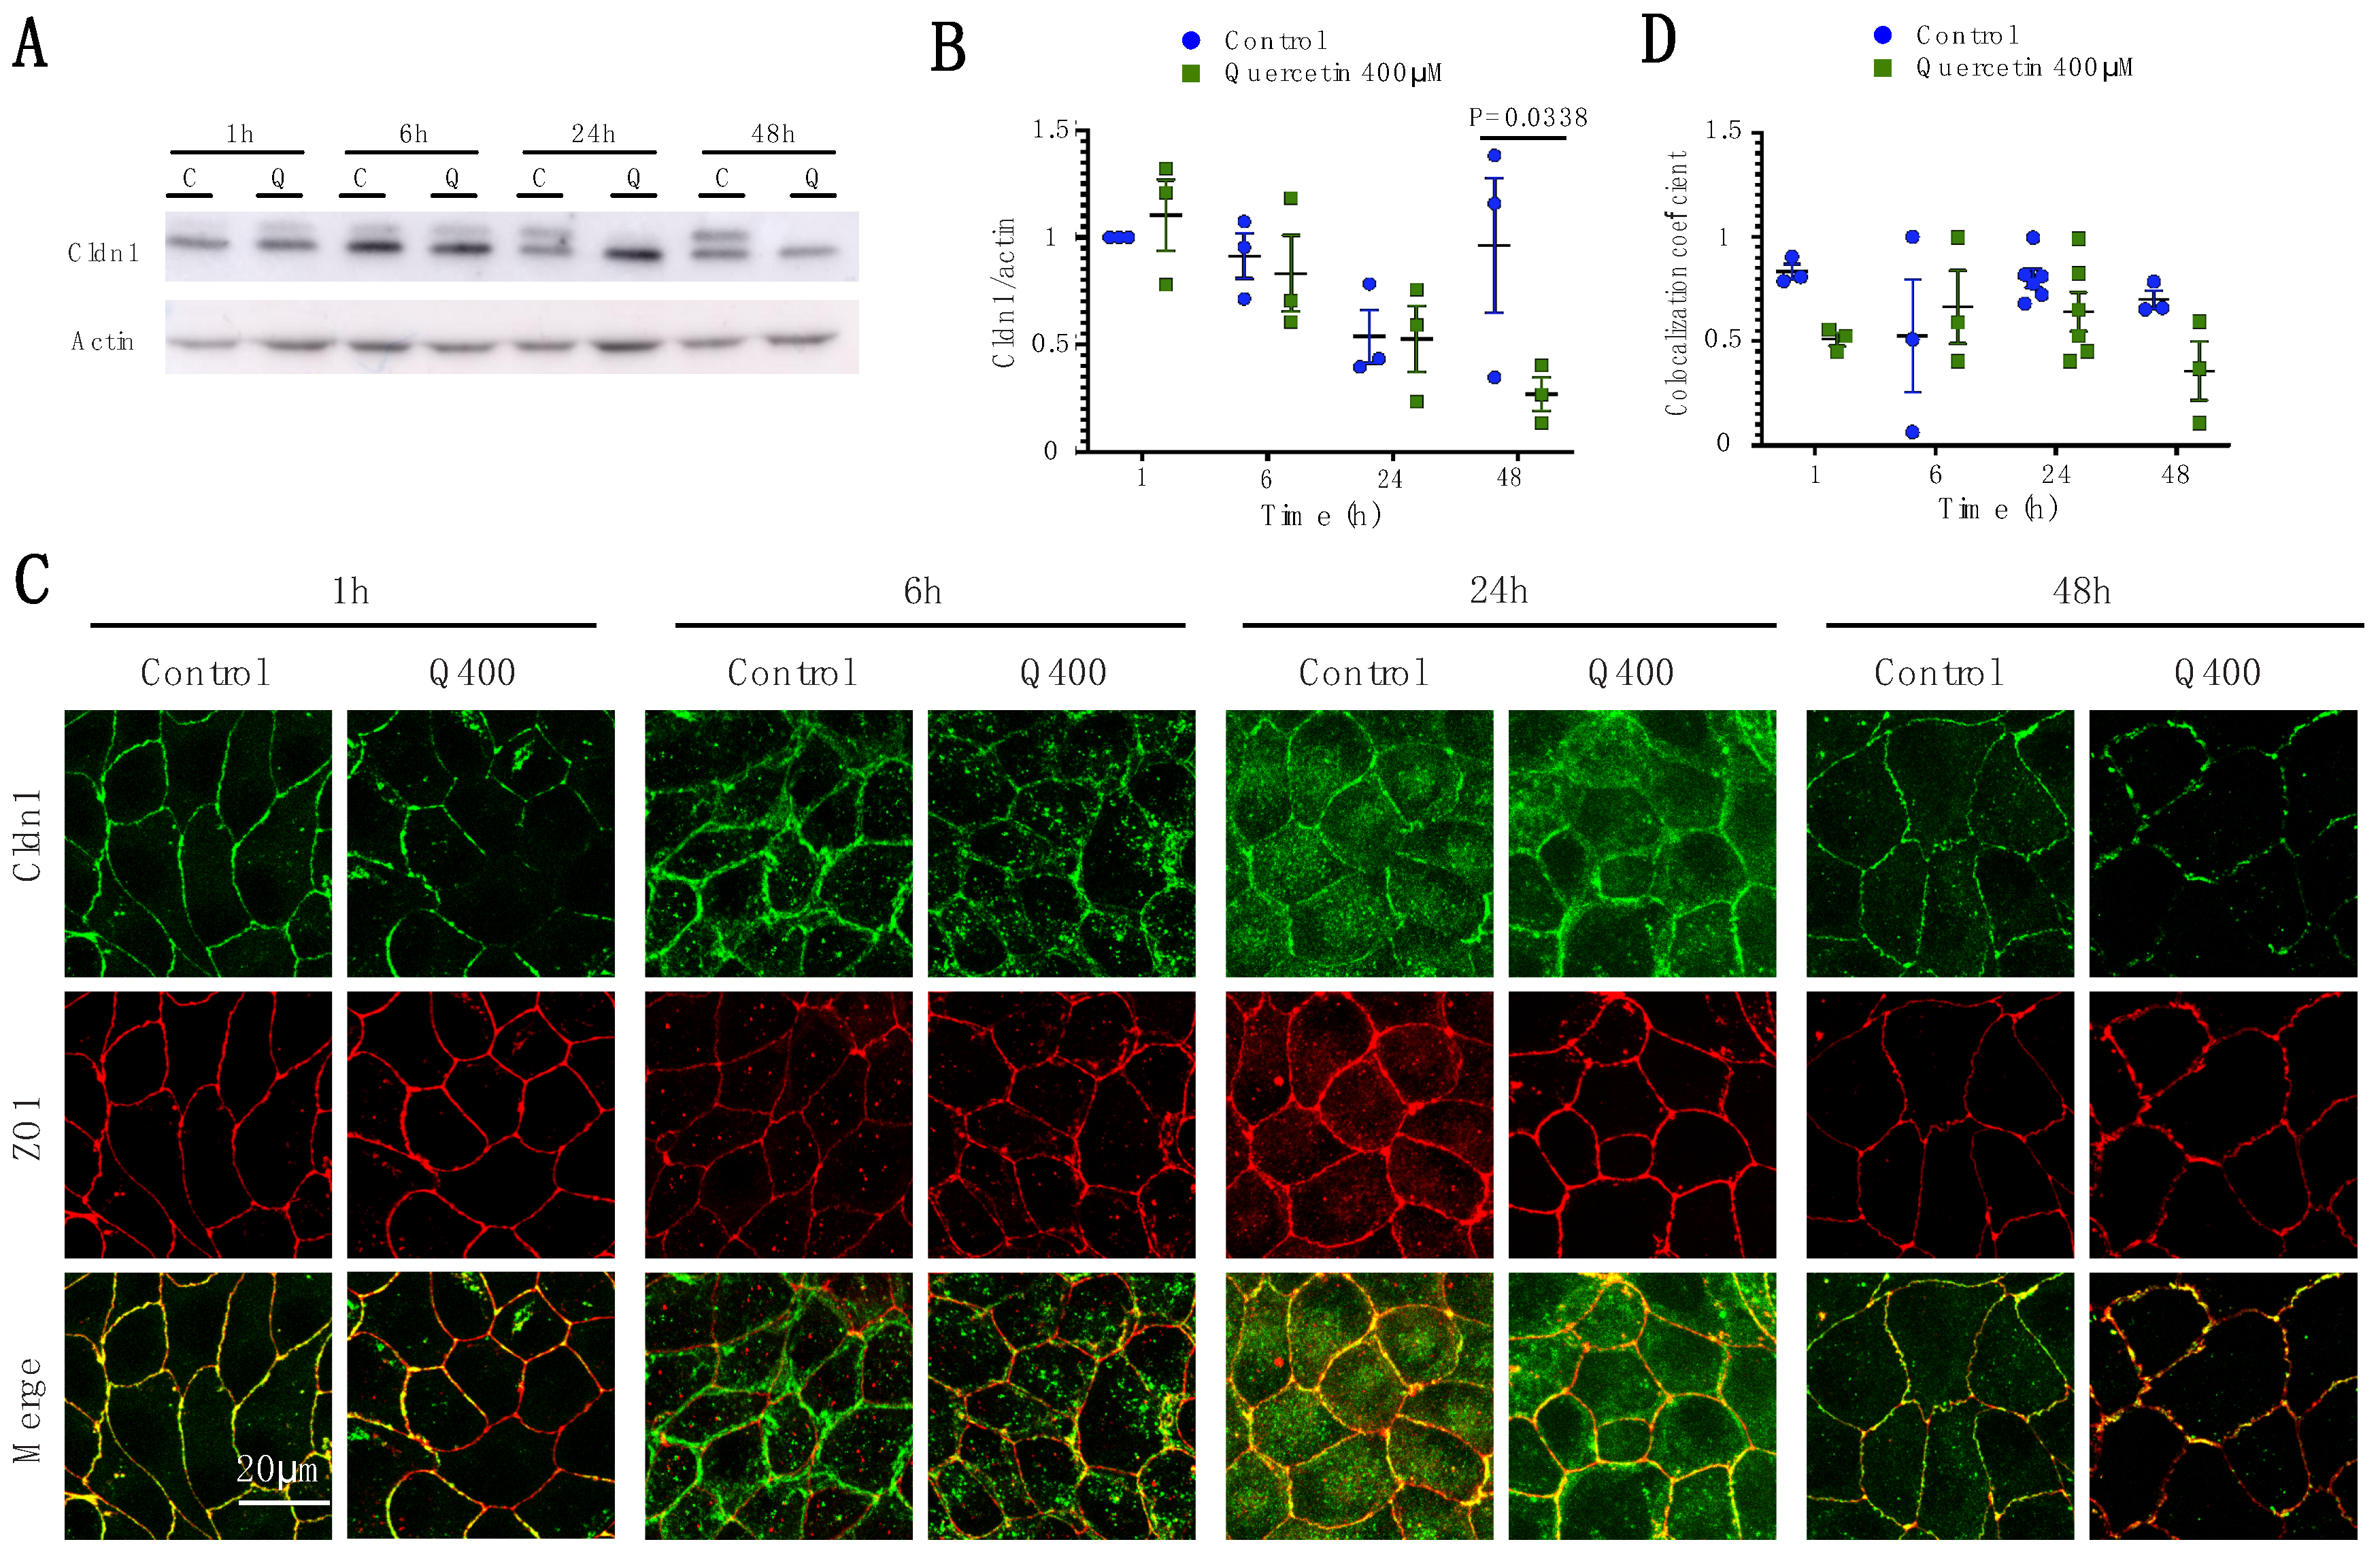
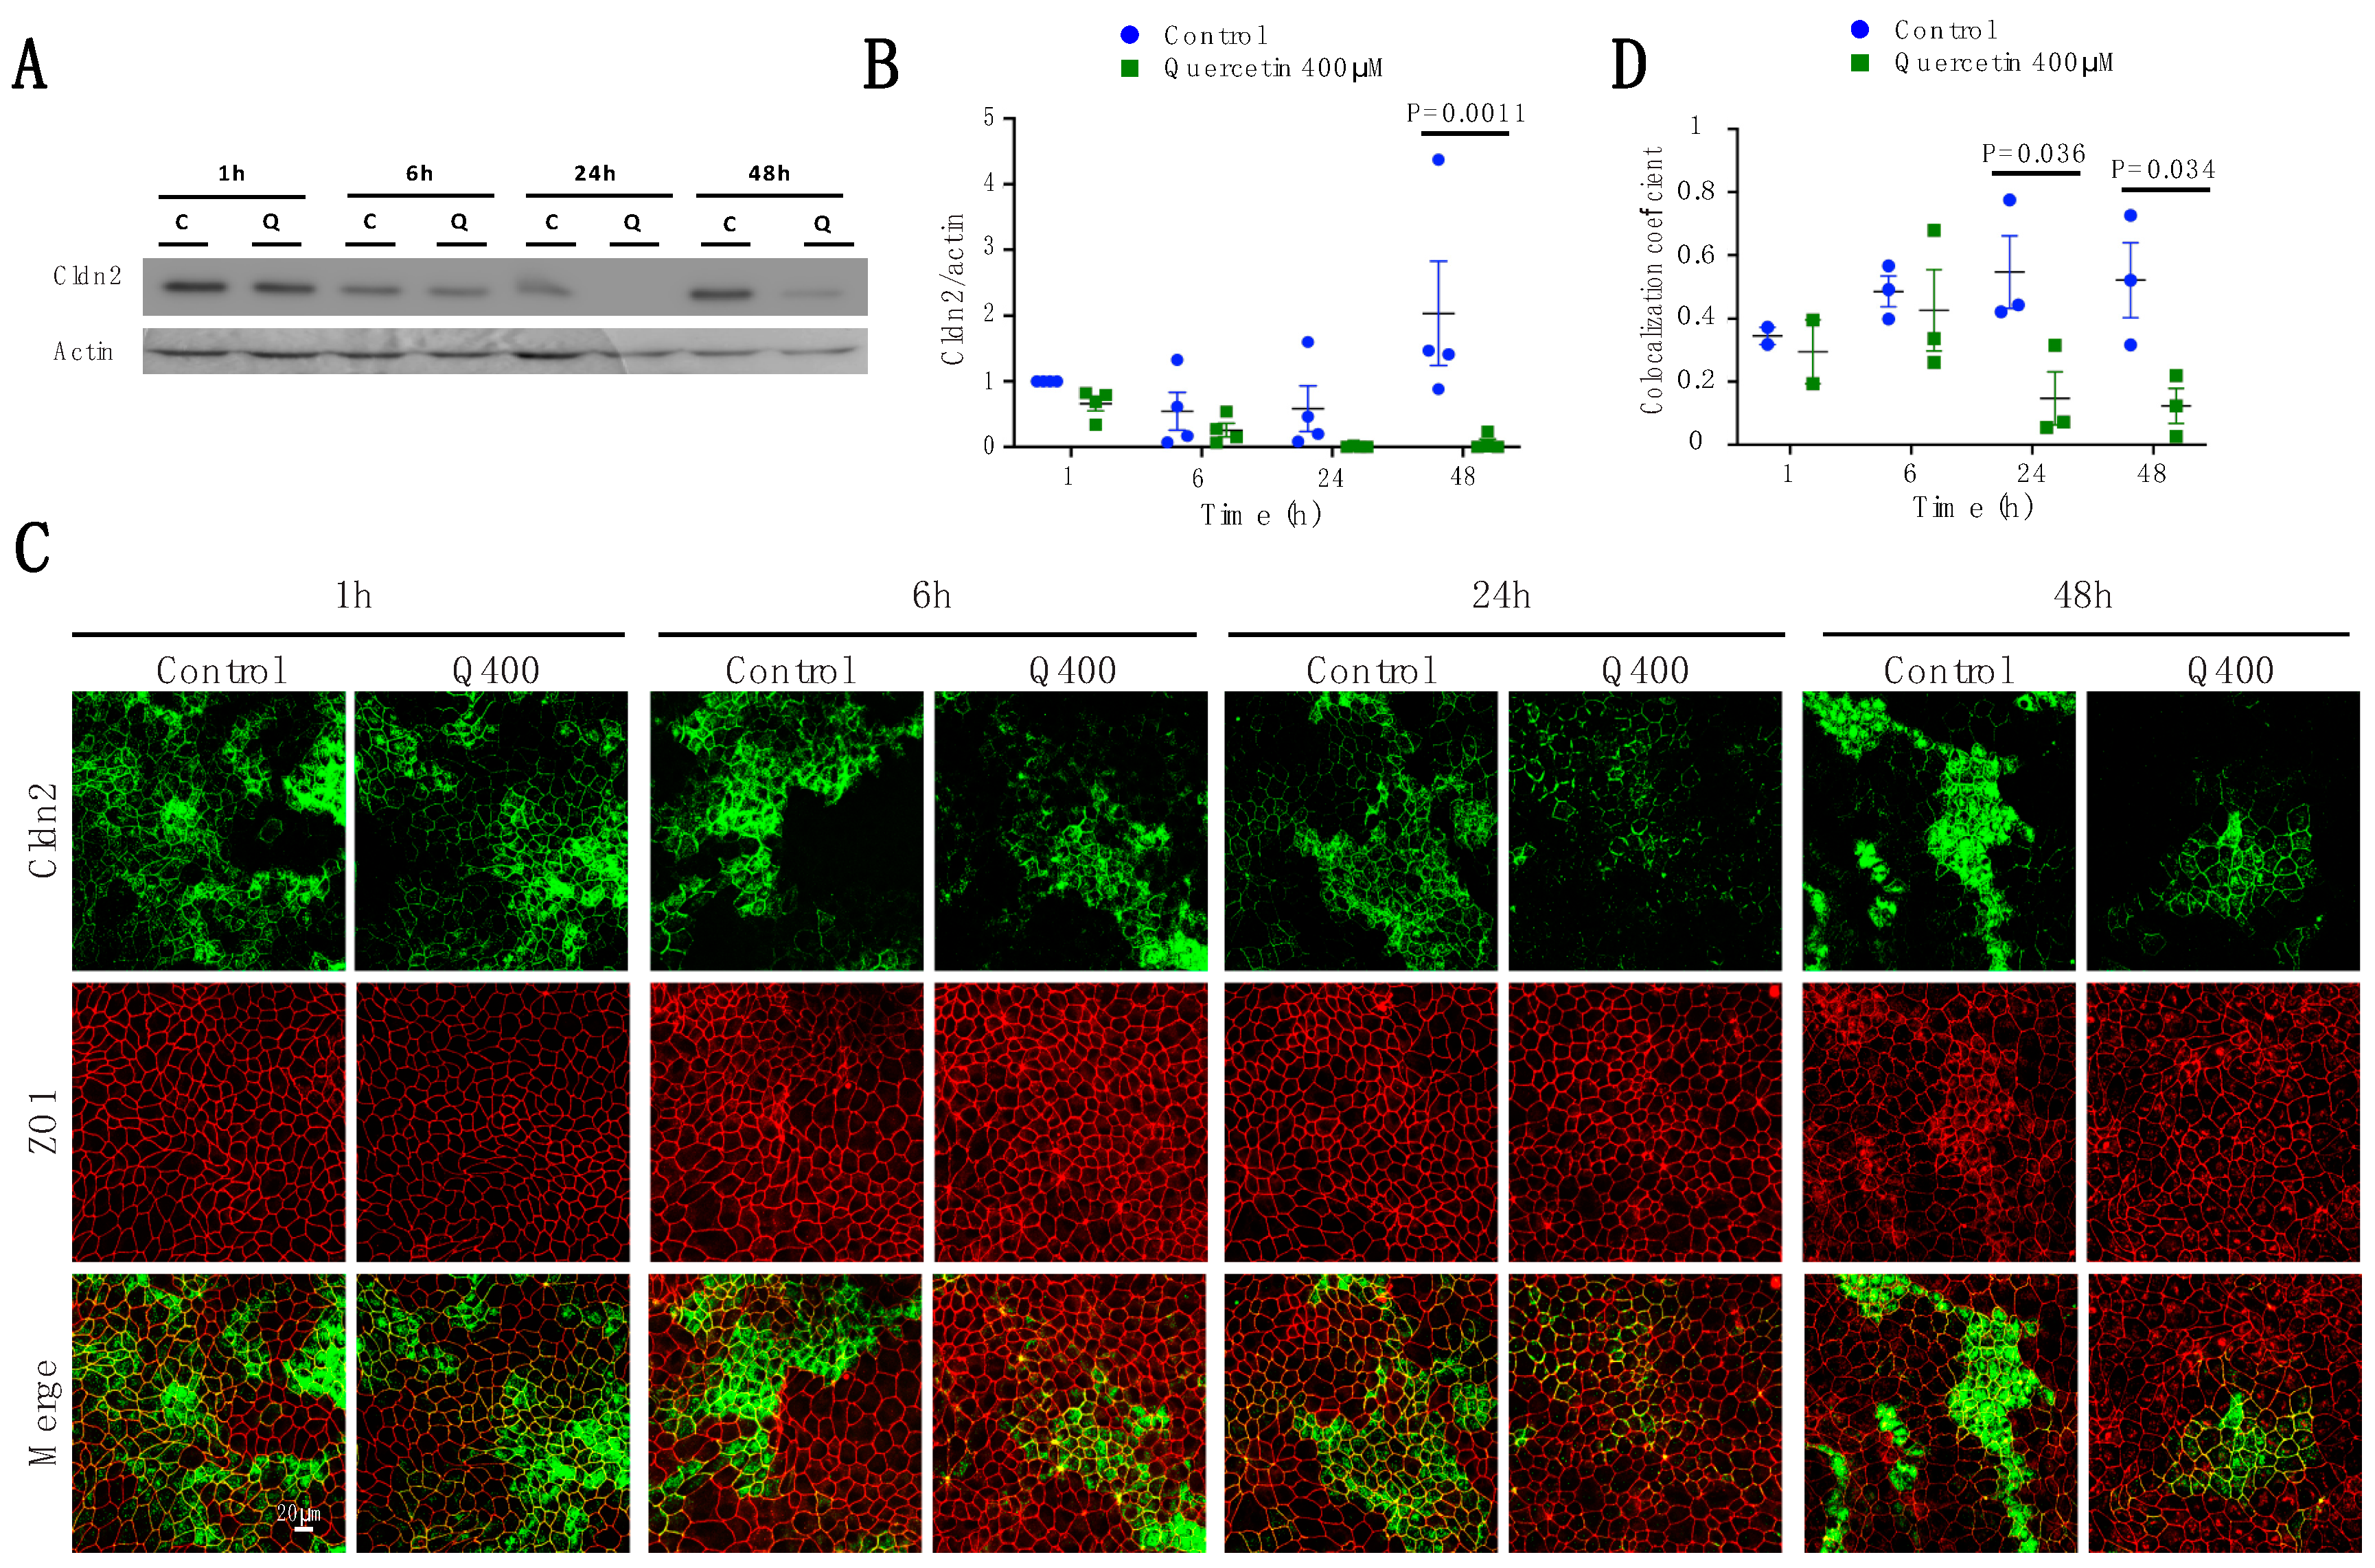
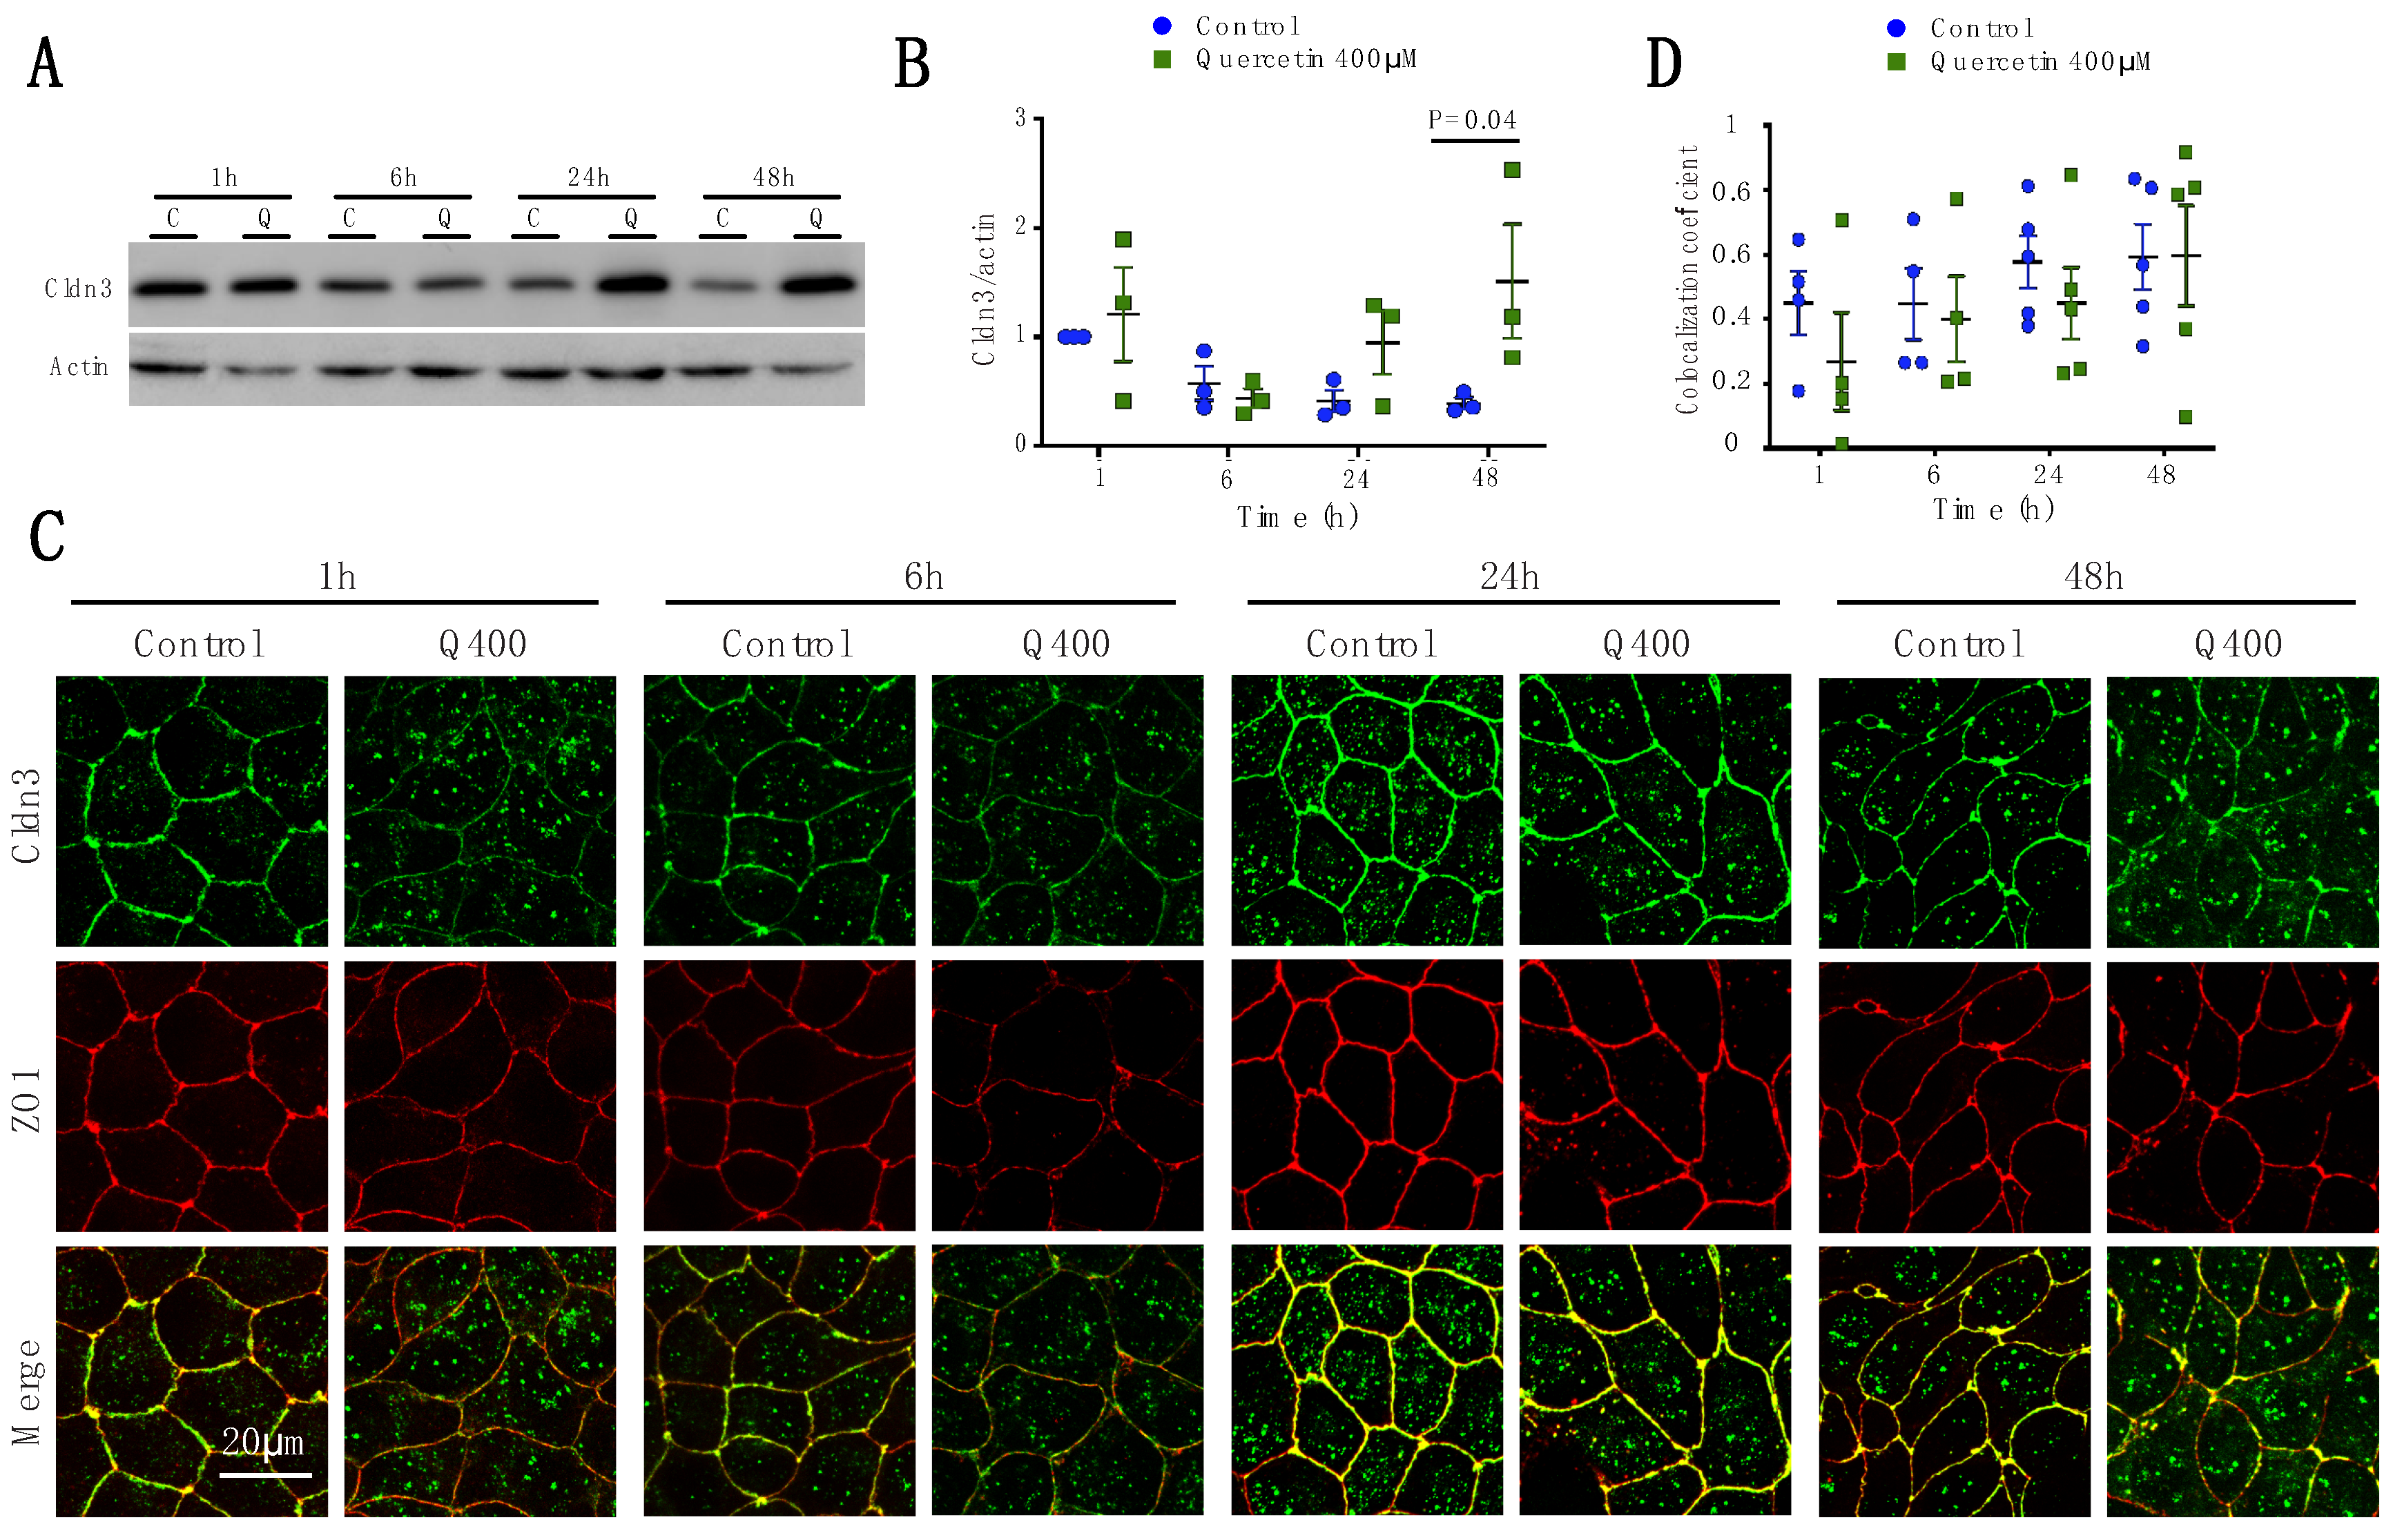
2.2. Quercetin Treatment Caused Claudin-Specific Changes in Expression and Membrane Localization
2.2.1. Cldn1
2.2.2. Cldn2
2.2.3. Cldn3
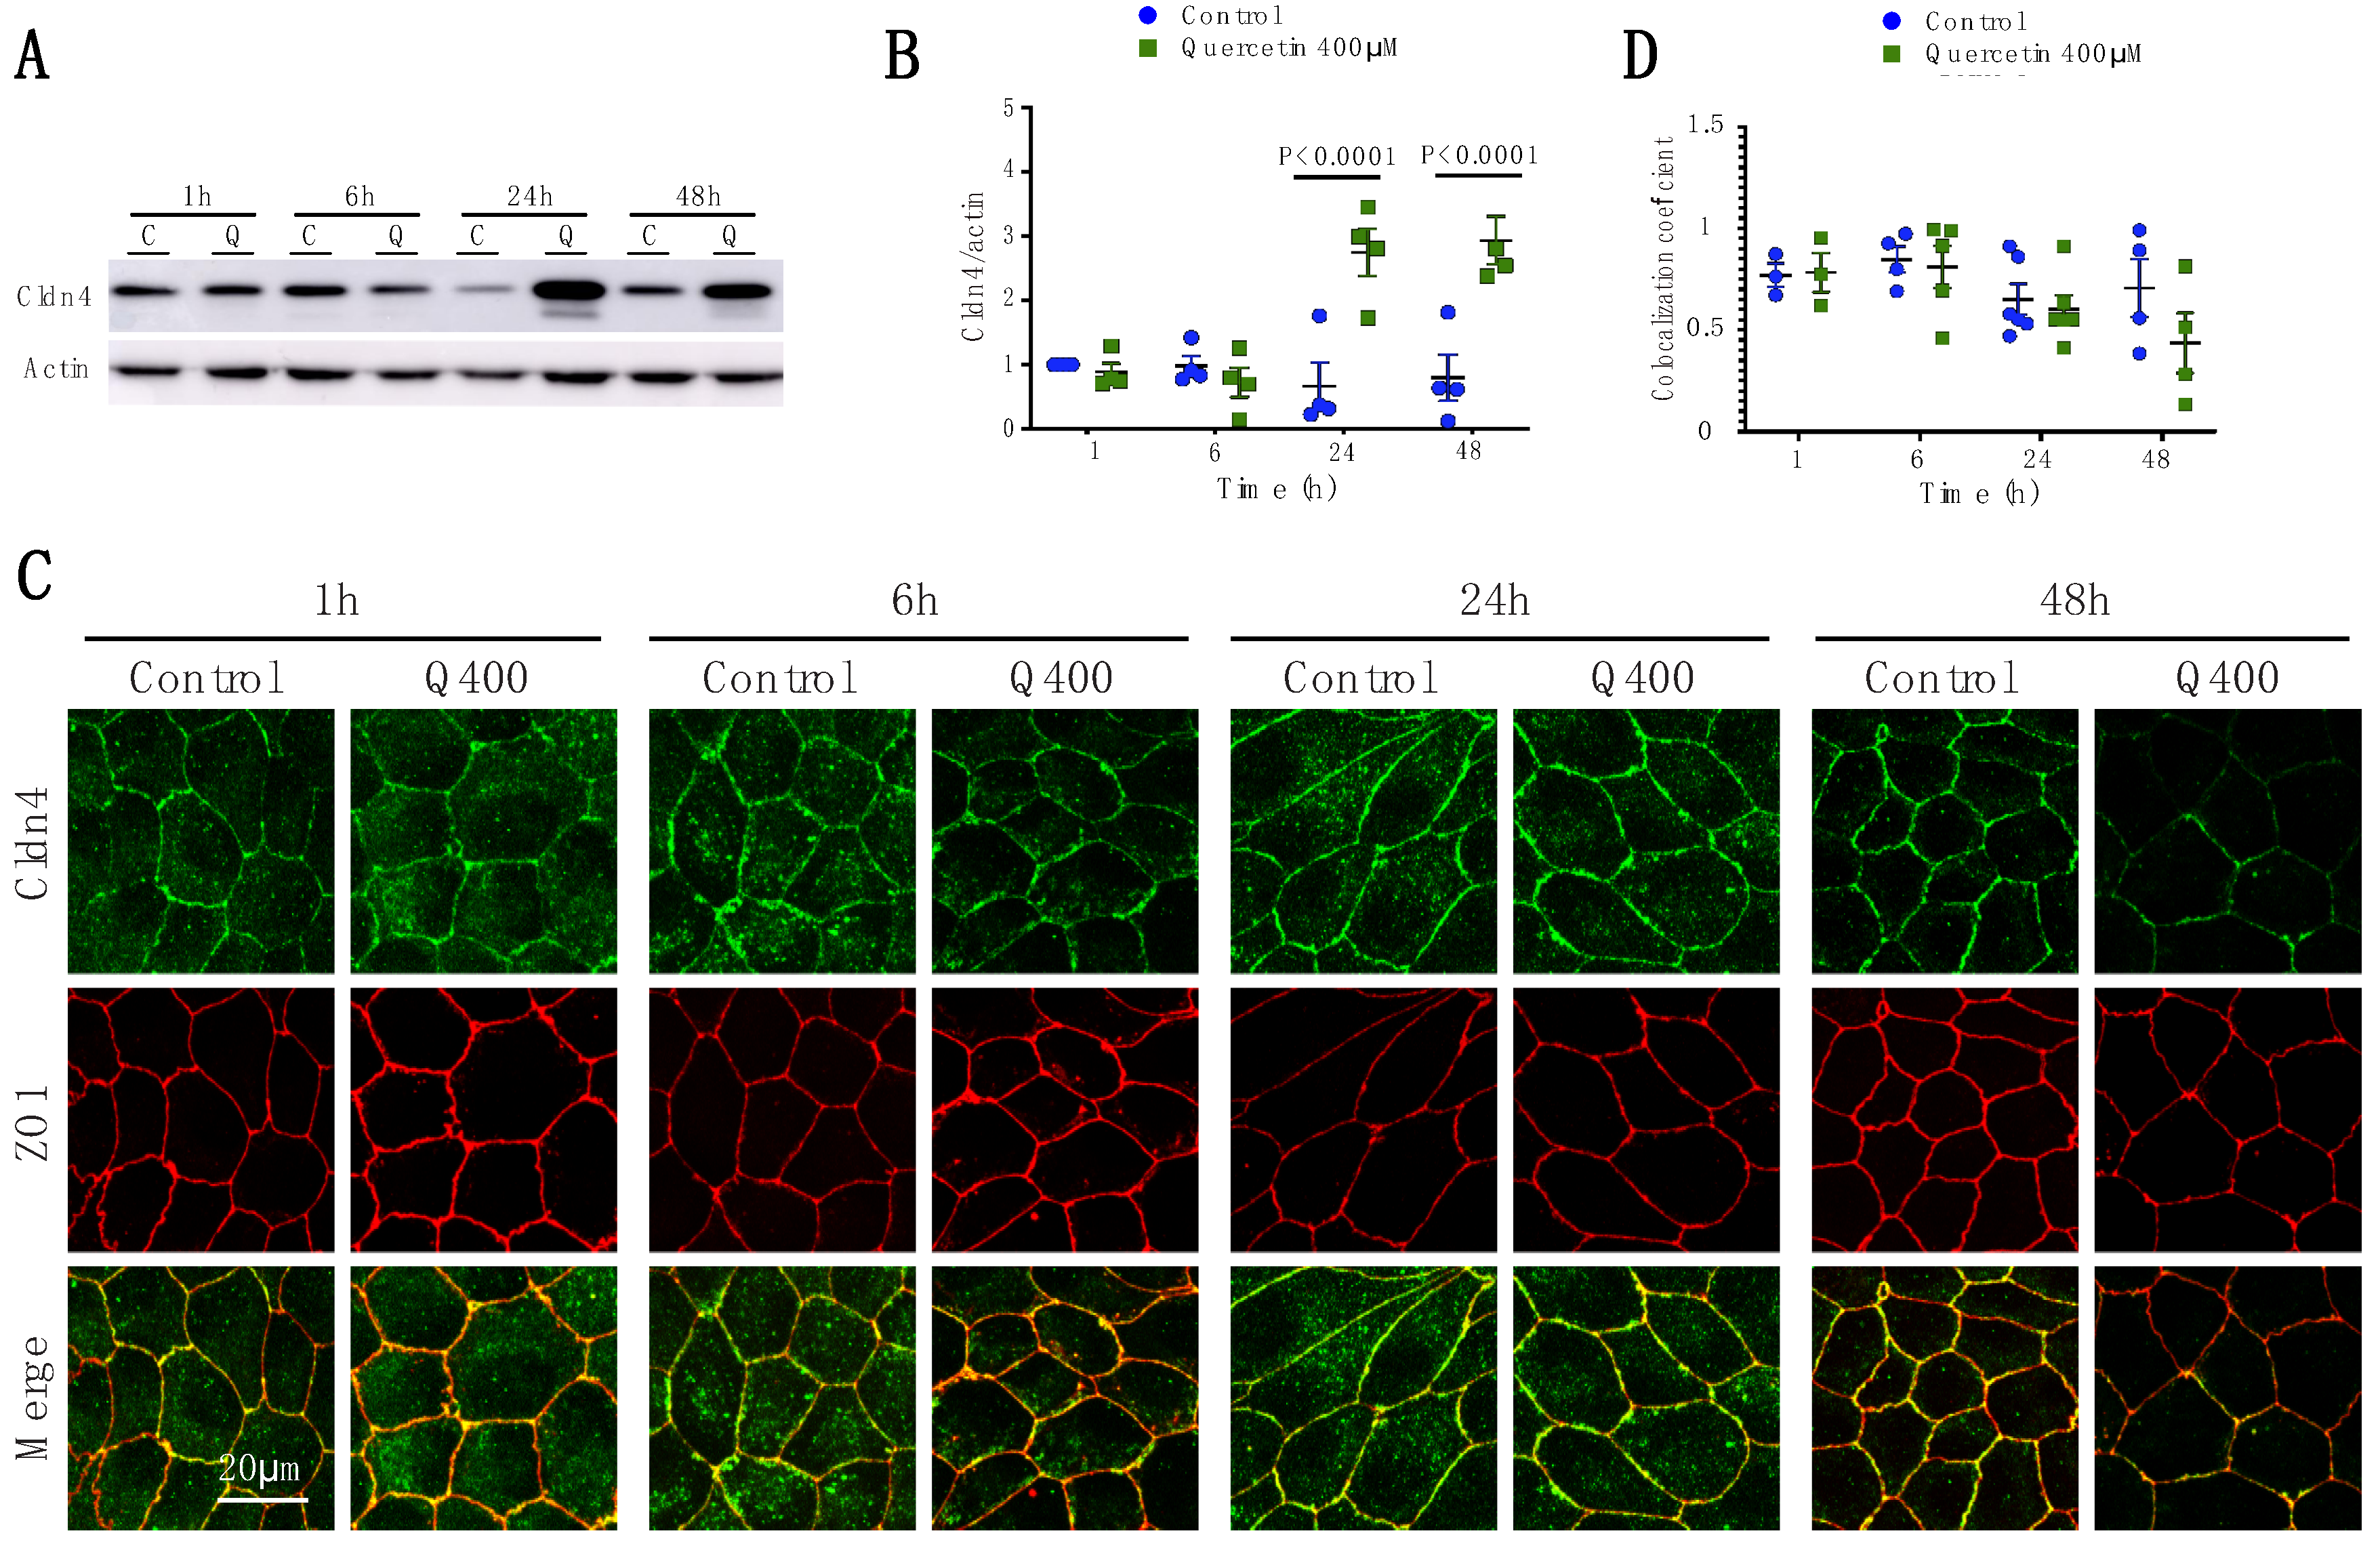
2.2.4. Cldn4
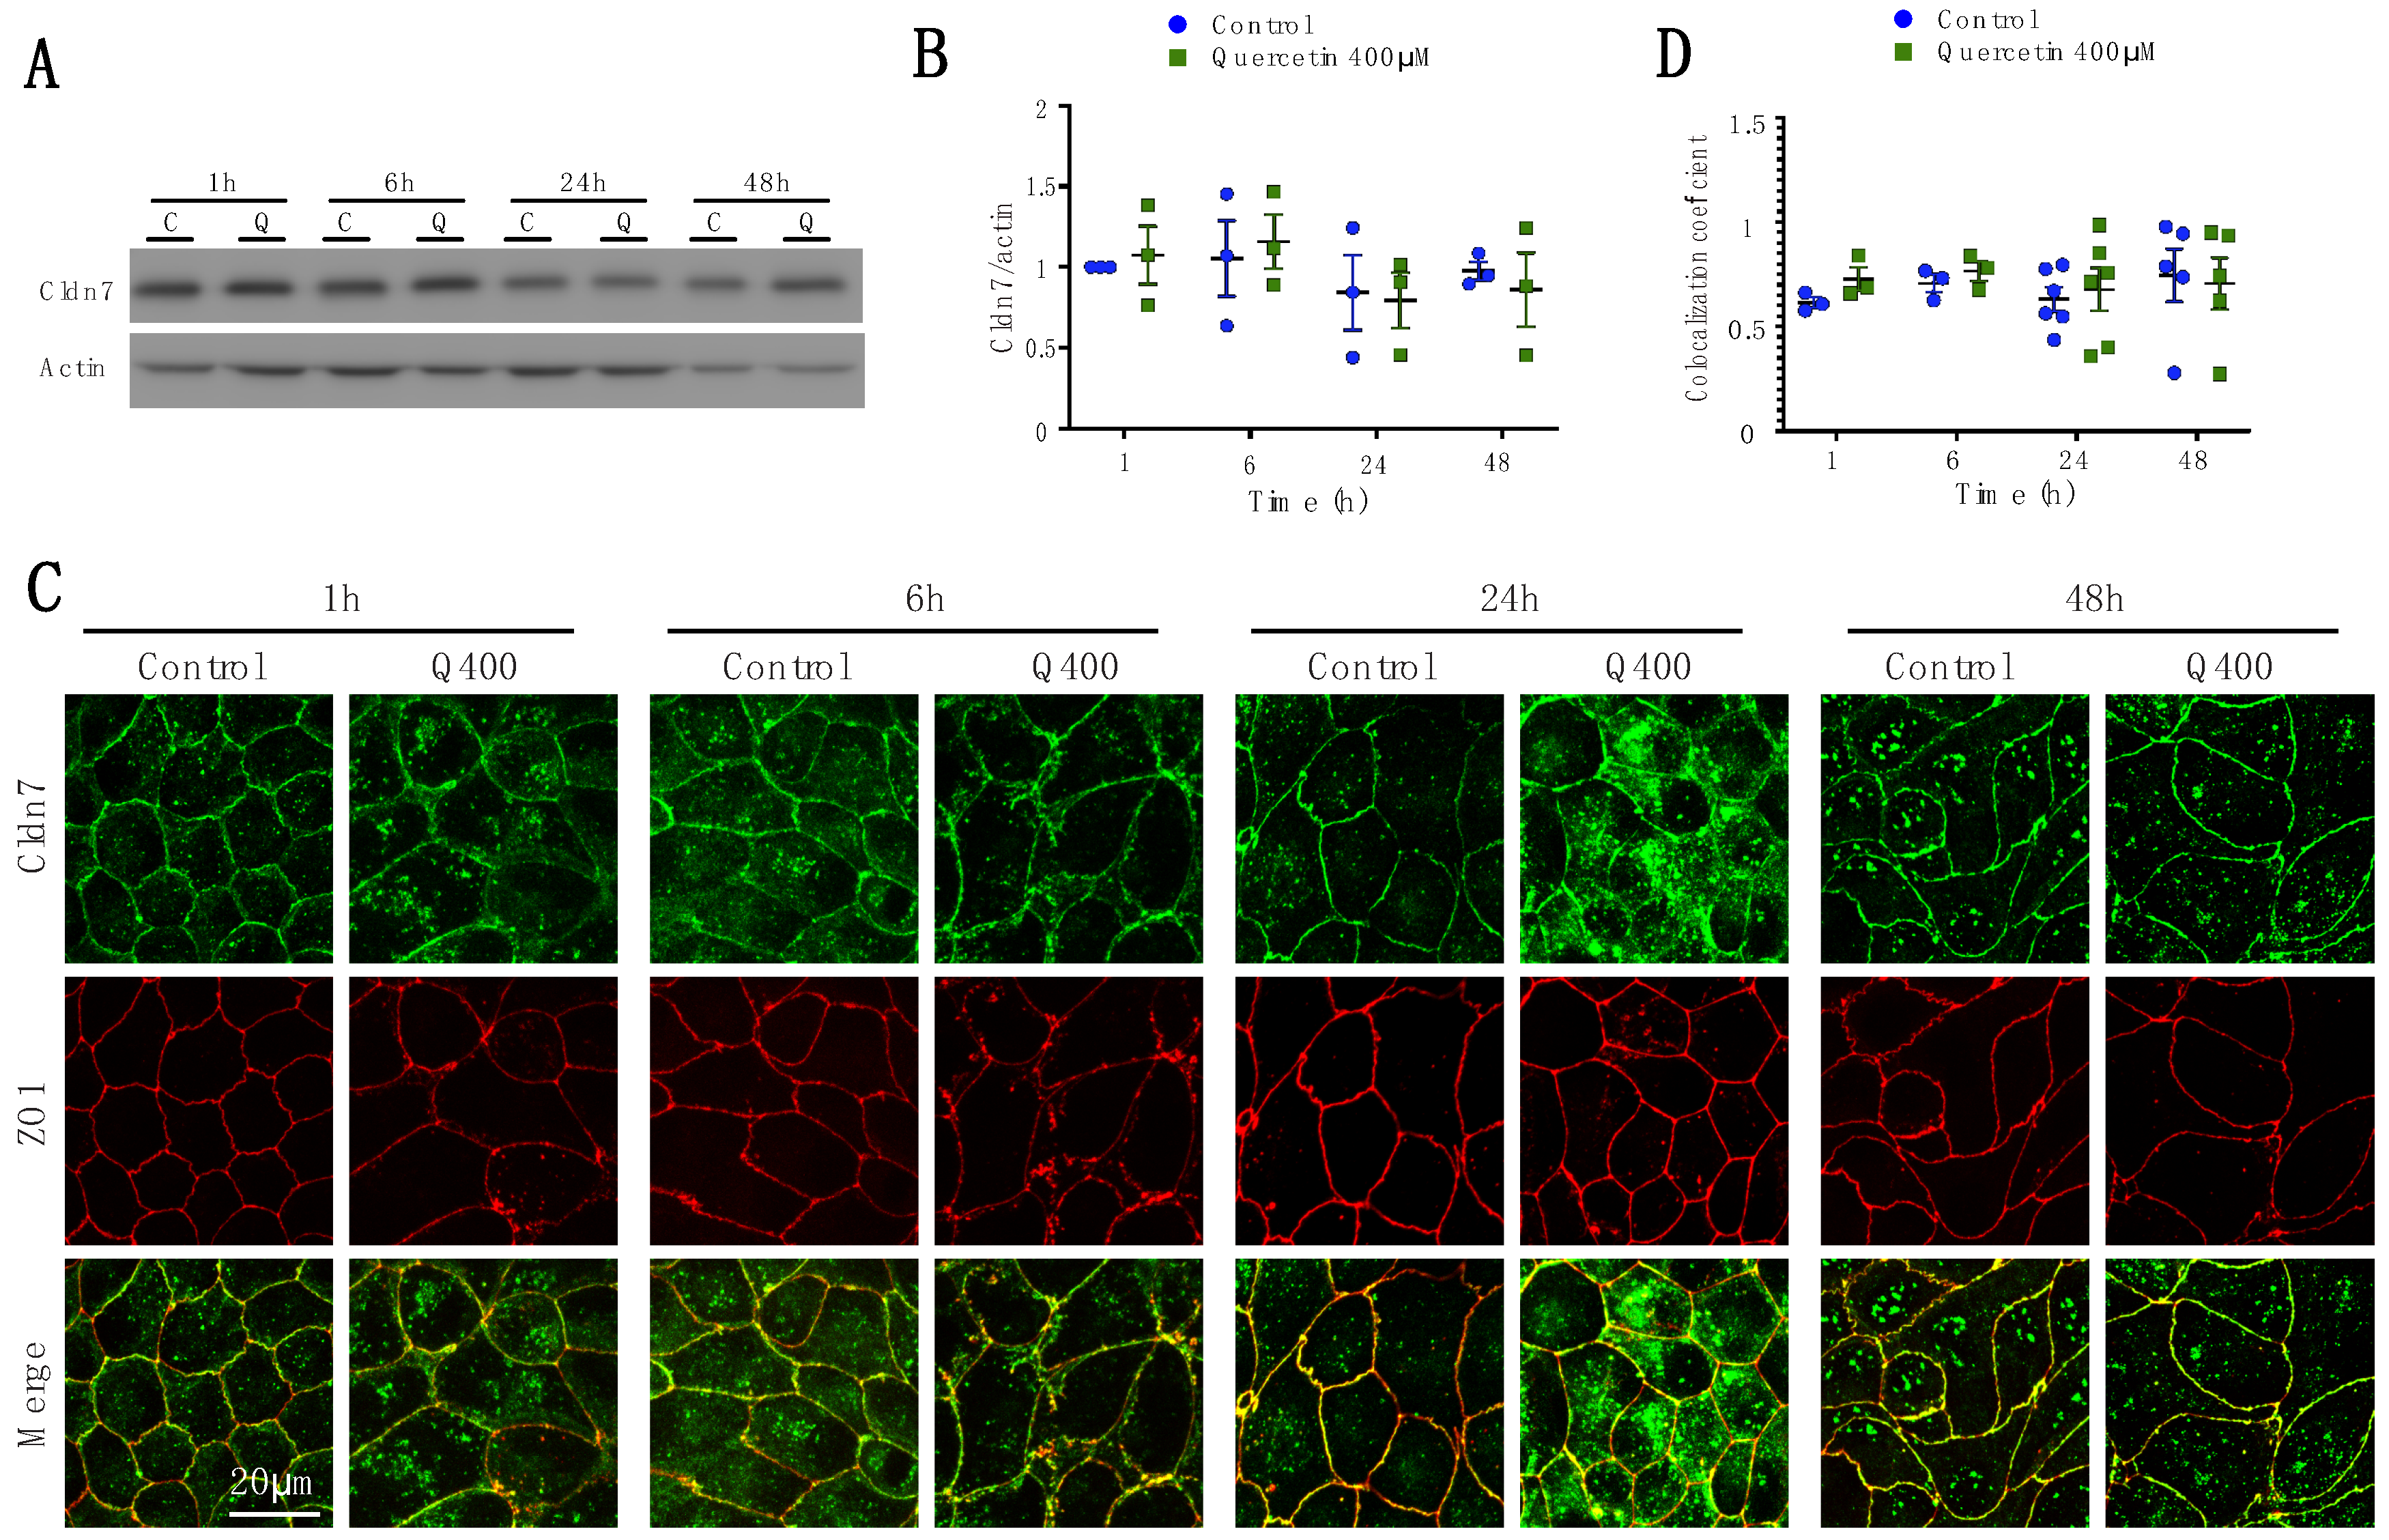
2.2.5. Cldn7
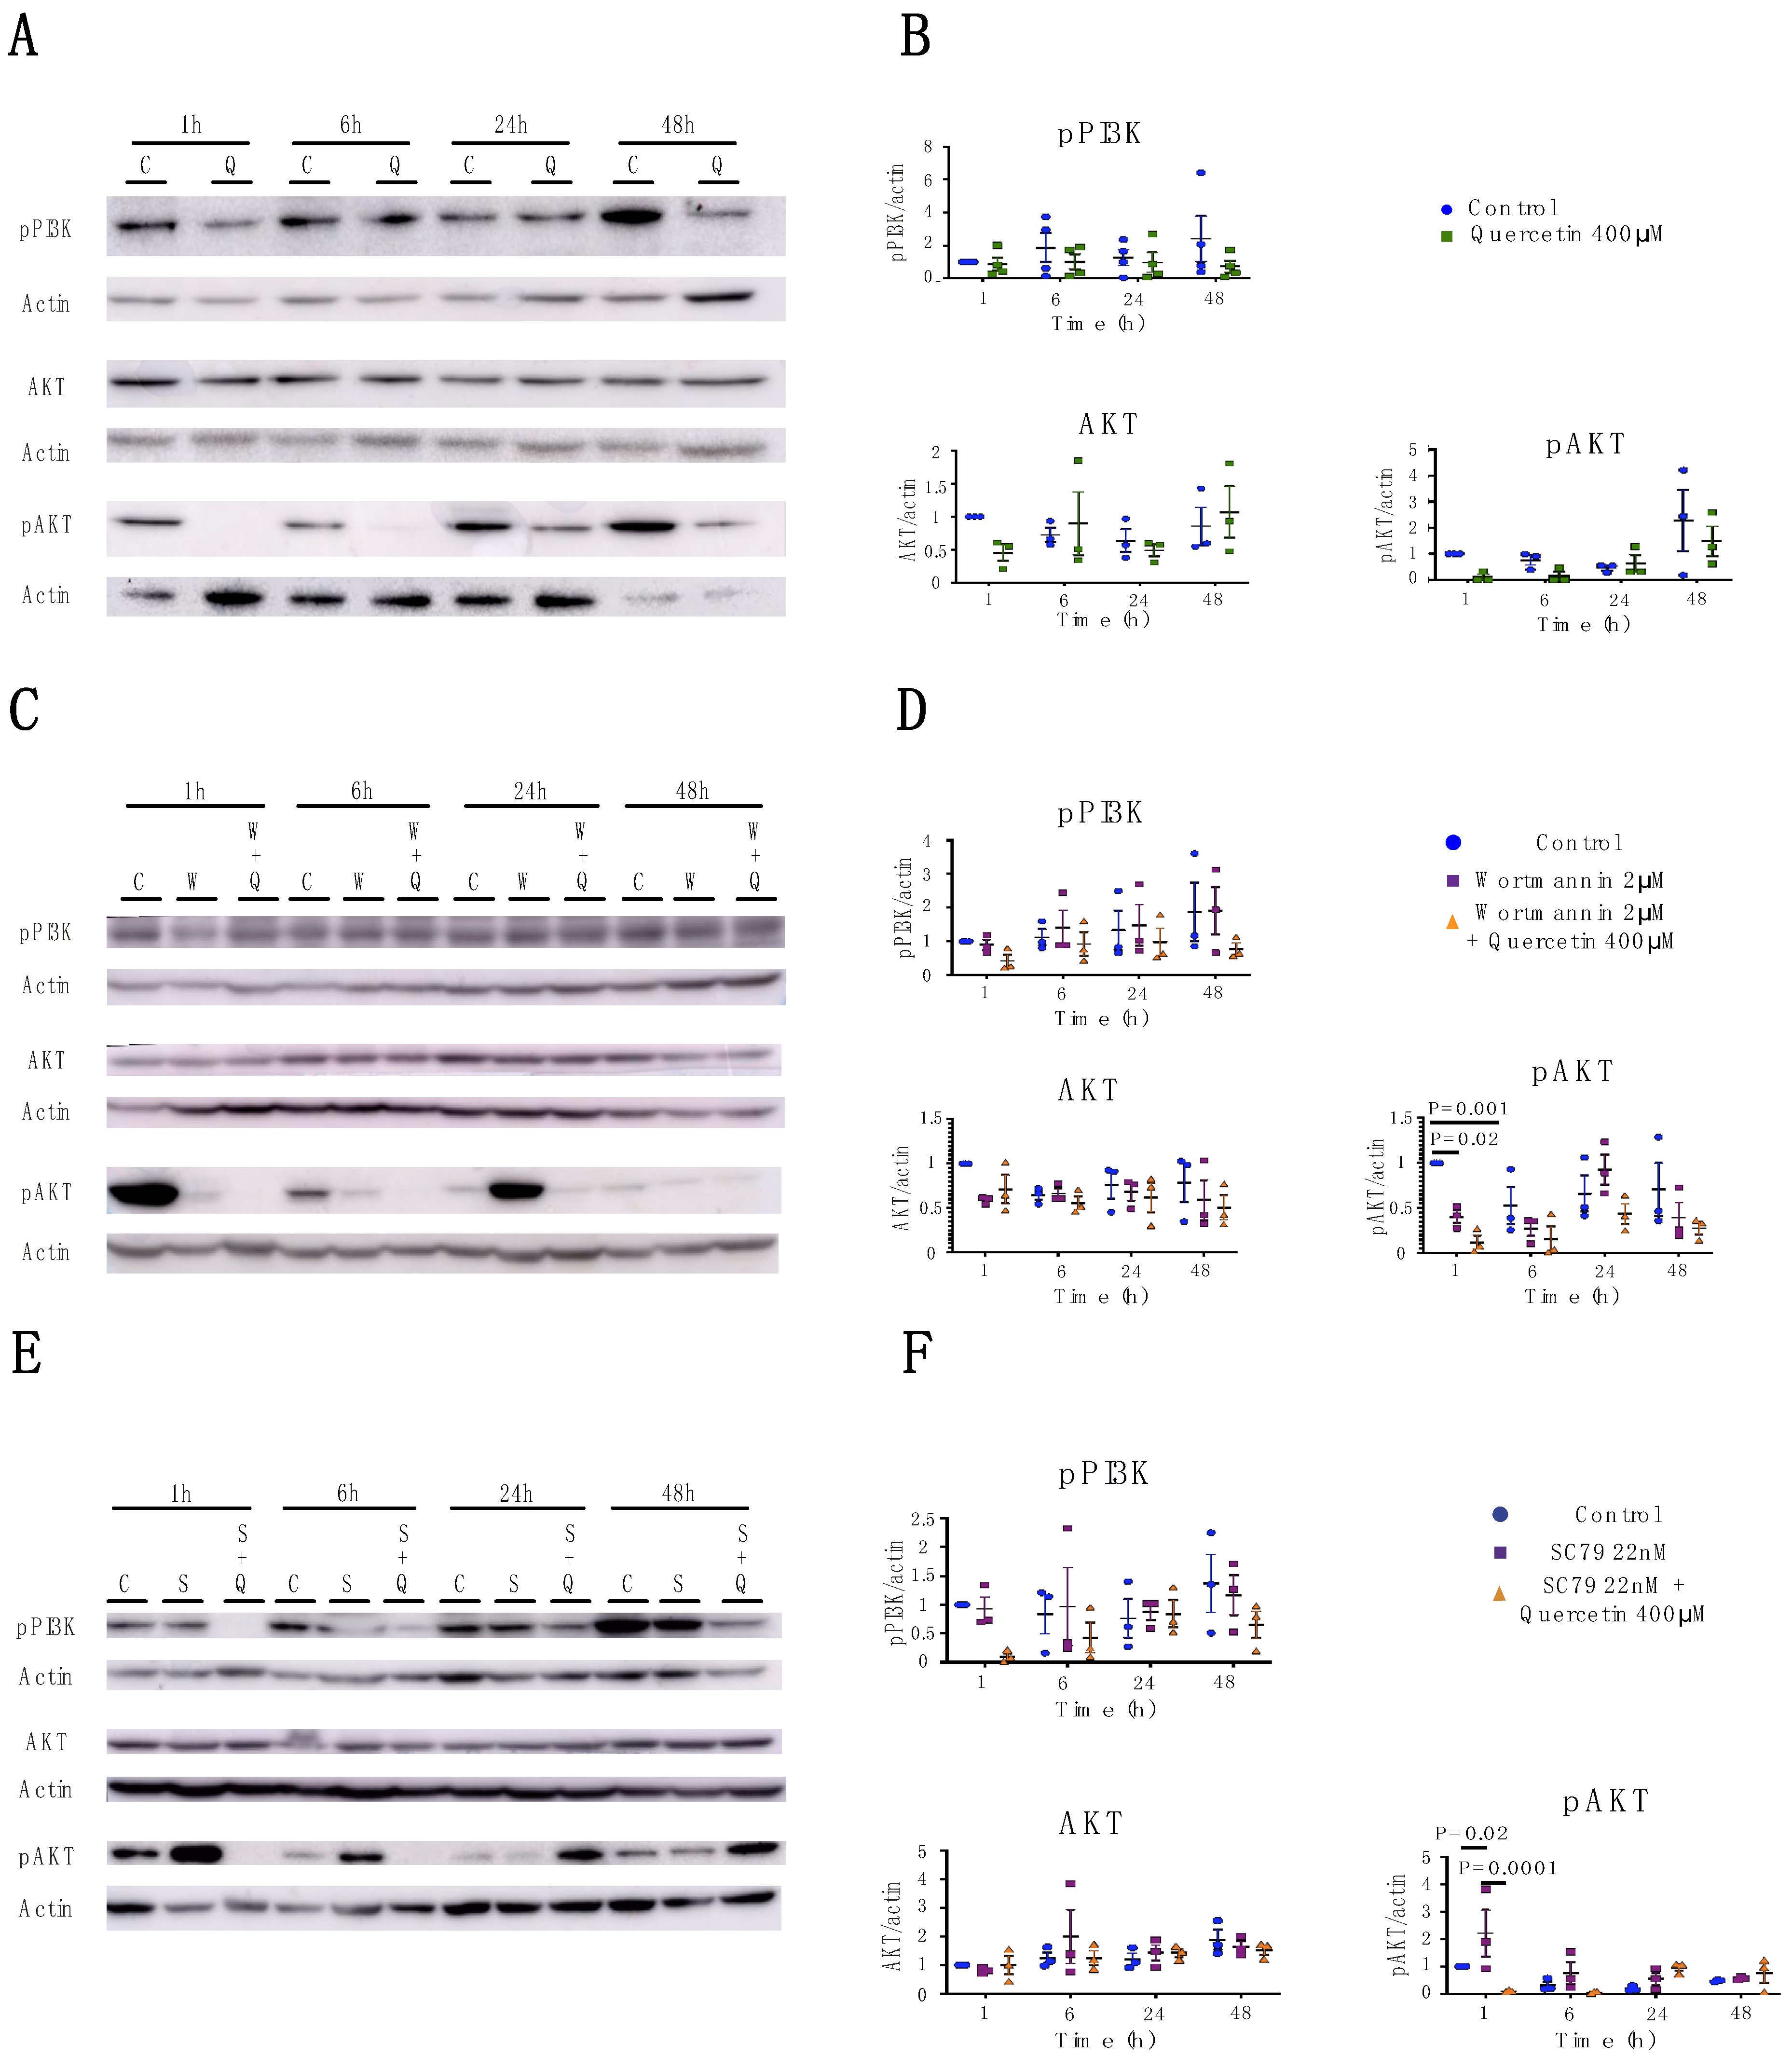
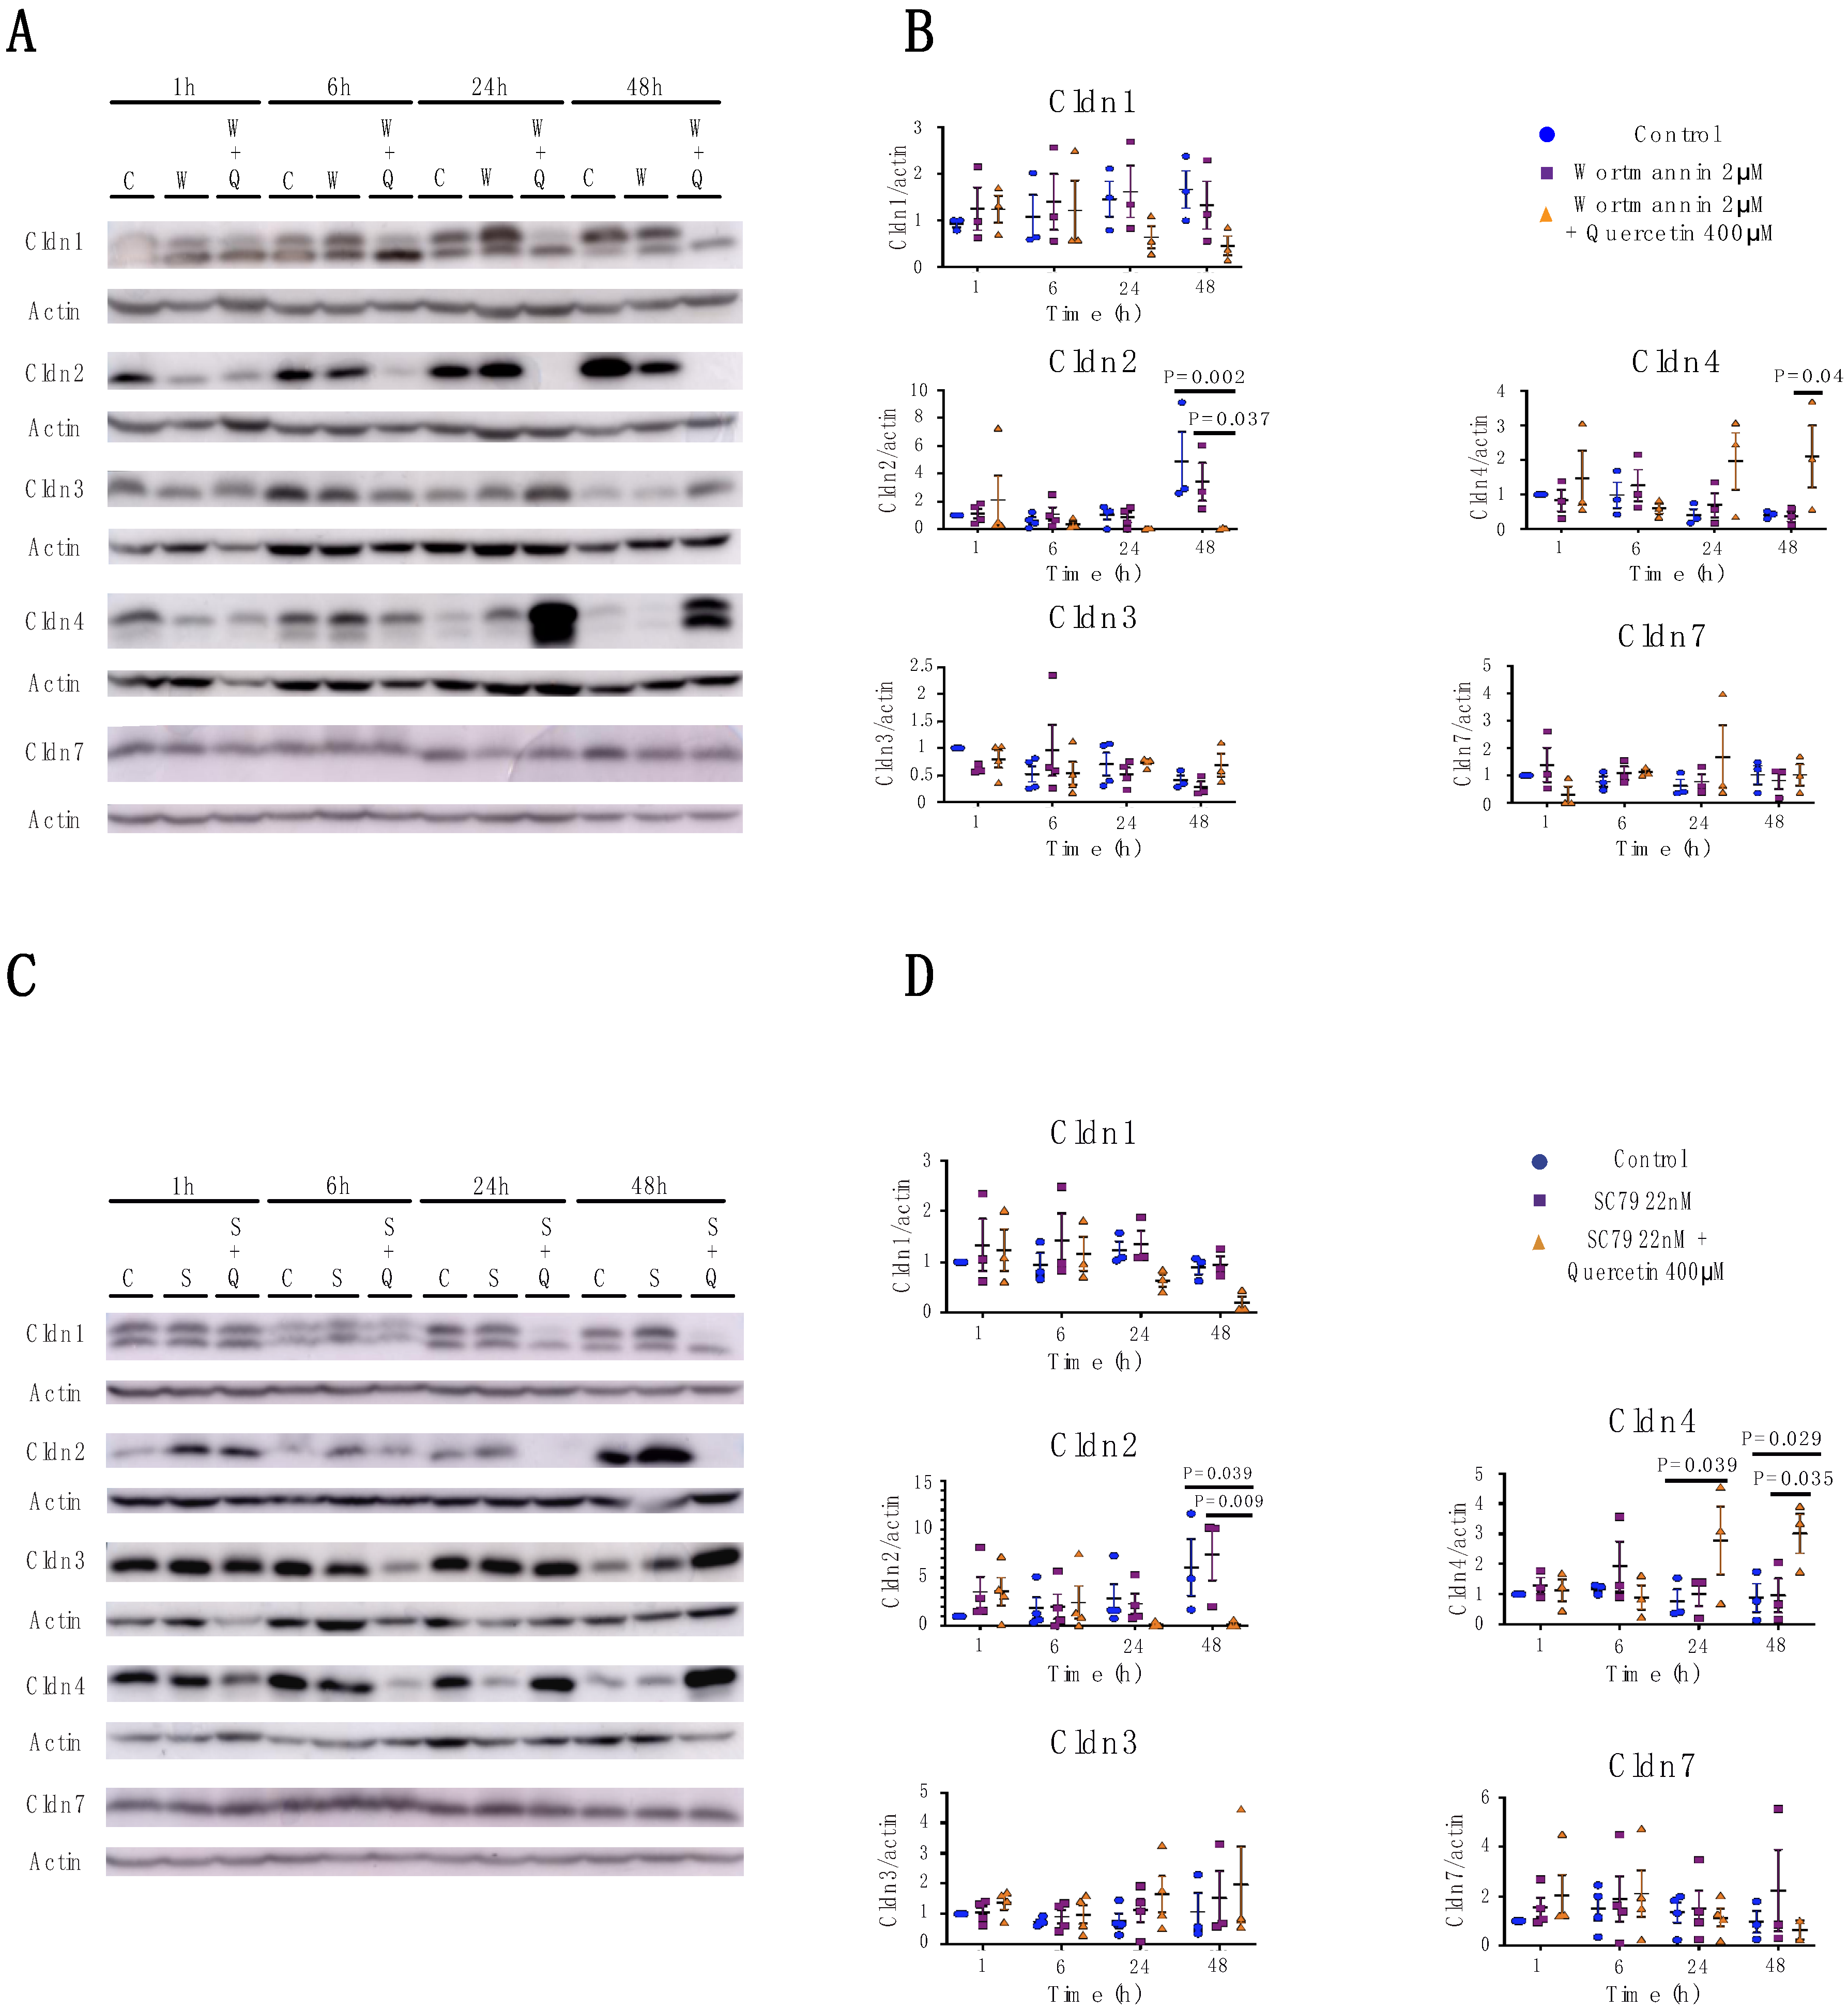
2.3. Quercetin’s Effects on Claudin Expression and Localization is Independent of the PI3K/AKT Pathway
3. Discussion
4. Material and Methods
4.1. Cell Culture
4.2. Chemicals and Antibodies
4.3. Transepithelial Resistance (TER)
4.4. Immunofluorescence Staining
4.5. Western Blot Analysis
4.6. Statistics
Supplementary Materials
Author Contributions
Funding
Acknowledgments
Conflicts of Interest
References
- Walker, V. Phosphaturia in kidney stone formers: Still an enigma. Adv. Clin. Chem. 2019, 90, 133–196. [Google Scholar] [CrossRef] [PubMed]
- Khan, S.R.; Pearle, M.S.; Robertson, W.G.; Gambaro, G.; Canales, B.K.; Doizi, S.; Traxer, O.; Tiselius, H.G. Kidney stones. Nat. Rev. Dis. Primers 2016, 2, 16008. [Google Scholar] [CrossRef] [PubMed]
- Evan, A.P. Physiopathology and etiology of stone formation in the kidney and the urinary tract. Pediatr. Nephrol. 2010, 25, 831–841. [Google Scholar] [CrossRef] [PubMed]
- Anderson, J.M.; Van Itallie, C.M. Physiology and function of the tight junction. Cold Spring Harb. Perspect. Biol. 2009, 1, a002584. [Google Scholar] [CrossRef] [PubMed]
- Van Itallie, C.M.; Anderson, J.M. Claudins and epithelial paracellular transport. Annu. Rev. Physiol. 2006, 68, 403–429. [Google Scholar] [CrossRef] [PubMed]
- Gupta, I.R.; Ryan, A.K. Claudins: Unlocking the code to tight junction function during embryogenesis and in disease. Clin. Genet. 2010, 77, 314–325. [Google Scholar] [CrossRef] [PubMed]
- Tsukita, S.; Tanaka, H.; Tamura, A. The Claudins: From Tight Junctions to Biological Systems. Trends Biochem. Sci. 2019, 44, 141–152. [Google Scholar] [CrossRef]
- Yu, A.S. Claudins and the kidney. J. Am. Soc. Nephrol. 2015, 26, 11–19. [Google Scholar] [CrossRef] [PubMed]
- Simon, D.B.; Lu, Y.; Choate, K.A.; Velazquez, H.; Al-Sabban, E.; Praga, M.; Casari, G.; Bettinelli, A.; Colussi, G.; Rodriguez-Soriano, J.; et al. Paracellin-1, a renal tight junction protein required for paracellular Mg2+ resorption. Science 1999, 285, 103–106. [Google Scholar] [CrossRef]
- Konrad, M.; Schaller, A.; Seelow, D.; Pandey, A.V.; Waldegger, S.; Lesslauer, A.; Vitzthum, H.; Suzuki, Y.; Luk, J.M.; Becker, C.; et al. Mutations in the tight-junction gene claudin 19 (CLDN19) are associated with renal magnesium wasting, renal failure, and severe ocular involvement. Am. J. Hum. Genet. 2006, 79, 949–957. [Google Scholar] [CrossRef]
- Thorleifsson, G.; Holm, H.; Edvardsson, V.; Walters, G.B.; Styrkarsdottir, U.; Gudbjartsson, D.F.; Sulem, P.; Halldorsson, B.V.; de Vegt, F.; d’Ancona, F.C.; et al. Sequence variants in the CLDN14 gene associate with kidney stones and bone mineral density. Nat. Genet. 2009, 41, 926–930. [Google Scholar] [CrossRef] [PubMed]
- Breiderhoff, T.; Himmerkus, N.; Stuiver, M.; Mutig, K.; Will, C.; Meij, I.C.; Bachmann, S.; Bleich, M.; Willnow, T.E.; Muller, D. Deletion of claudin-10 (Cldn10) in the thick ascending limb impairs paracellular sodium permeability and leads to hypermagnesemia and nephrocalcinosis. Proc. Natl. Acad. Sci. USA 2012, 109, 14241–14246. [Google Scholar] [CrossRef] [PubMed]
- Muto, S.; Hata, M.; Taniguchi, J.; Tsuruoka, S.; Moriwaki, K.; Saitou, M.; Furuse, K.; Sasaki, H.; Fujimura, A.; Imai, M.; et al. Claudin-2-deficient mice are defective in the leaky and cation-selective paracellular permeability properties of renal proximal tubules. Proc. Natl. Acad. Sci. USA 2010, 107, 8011–8016. [Google Scholar] [CrossRef] [PubMed]
- Himmerkus, N.; Shan, Q.; Goerke, B.; Hou, J.; Goodenough, D.A.; Bleich, M. Salt and acid-base metabolism in claudin-16 knockdown mice: Impact for the pathophysiology of FHHNC patients. Am. J. Physiol. Renal Physiol. 2008, 295, F1641–F1647. [Google Scholar] [CrossRef] [PubMed]
- Hou, J.; Renigunta, A.; Gomes, A.S.; Hou, M.; Paul, D.L.; Waldegger, S.; Goodenough, D.A. Claudin-16 and claudin-19 interaction is required for their assembly into tight junctions and for renal reabsorption of magnesium. Proc. Natl. Acad. Sci. USA 2009, 106, 15350–15355. [Google Scholar] [CrossRef] [PubMed] [Green Version]
- Tatum, R.; Zhang, Y.; Salleng, K.; Lu, Z.; Lin, J.J.; Lu, Q.; Jeansonne, B.G.; Ding, L.; Chen, Y.H. Renal salt wasting and chronic dehydration in claudin-7-deficient mice. Am. J. Physiol. Renal Physiol. 2010, 298, F24–F34. [Google Scholar] [CrossRef] [Green Version]
- Plain, A.; Alexander, R.T. Claudins and nephrolithiasis. Curr. Opin. Nephrol. Hypertens. 2018, 27, 268–276. [Google Scholar] [CrossRef]
- Gong, Y.; Hou, J. Claudins in barrier and transport function-the kidney. Pflugers Arch. 2017, 469, 105–113. [Google Scholar] [CrossRef]
- Wakino, S.; Hasegawa, K.; Itoh, H. Sirtuin and metabolic kidney disease. Kidney Int. 2015, 88, 691–698. [Google Scholar] [CrossRef] [Green Version]
- Zhu, W.; Xu, Y.F.; Feng, Y.; Peng, B.; Che, J.P.; Liu, M.; Zheng, J.H. Prophylactic effects of quercetin and hyperoside in a calcium oxalate stone forming rat model. Urolithiasis 2014, 42, 519–526. [Google Scholar] [CrossRef]
- Mercado, J.; Valenzano, M.C.; Jeffers, C.; Sedlak, J.; Cugliari, M.K.; Papanikolaou, E.; Clouse, J.; Miao, J.; Wertan, N.E.; Mullin, J.M. Enhancement of tight junctional barrier function by micronutrients: Compound-specific effects on permeability and claudin composition. PLoS ONE 2013, 8, e78775. [Google Scholar] [CrossRef] [PubMed]
- Valenzano, M.C.; DiGuilio, K.; Mercado, J.; Teter, M.; To, J.; Ferraro, B.; Mixson, B.; Manley, I.; Baker, V.; Moore, B.A.; et al. Remodeling of Tight Junctions and Enhancement of Barrier Integrity of the CACO-2 Intestinal Epithelial Cell Layer by Micronutrients. PLoS ONE 2015, 10, e0133926. [Google Scholar] [CrossRef] [PubMed]
- Suzuki, T.; Hara, H. Quercetin enhances intestinal barrier function through the assembly of zonula [corrected] occludens-2, occludin, and claudin-1 and the expression of claudin-4 in Caco-2 cells. J. Nutr. 2009, 139, 965–974. [Google Scholar] [CrossRef] [PubMed]
- Suzuki, T.; Tanabe, S.; Hara, H. Kaempferol enhances intestinal barrier function through the cytoskeletal association and expression of tight junction proteins in Caco-2 cells. J. Nutr. 2011, 141, 87–94. [Google Scholar] [CrossRef]
- Dukes, J.D.; Whitley, P.; Chalmers, A.D. The MDCK variety pack: Choosing the right strain. BMC Cell Biol. 2011, 12, 43. [Google Scholar] [CrossRef] [PubMed]
- Hou, J.; Gomes, A.S.; Paul, D.L.; Goodenough, D.A. Study of claudin function by RNA interference. J. Biol. Chem. 2006, 281, 36117–36123. [Google Scholar] [CrossRef]
- Gunzel, D.; Fromm, M. Claudins and other tight junction proteins. Compr. Physiol. 2012, 2, 1819–1852. [Google Scholar] [CrossRef] [PubMed]
- Borovac, J.; Barker, R.S.; Rievaj, J.; Rasmussen, A.; Pan, W.; Wevrick, R.; Alexander, R.T. Claudin-4 forms a paracellular barrier, revealing the interdependence of claudin expression in the loose epithelial cell culture model opossum kidney cells. Am. J. Physiol. Cell Physiol. 2012, 303, C1278–C1291. [Google Scholar] [CrossRef] [Green Version]
- Rosenthal, R.; Gunzel, D.; Krug, S.M.; Schulzke, J.D.; Fromm, M.; Yu, A.S. Claudin-2-mediated cation and water transport share a common pore. Acta Physiol. 2017, 219, 521–536. [Google Scholar] [CrossRef]
- Van Itallie, C.M.; Fanning, A.S.; Anderson, J.M. Reversal of charge selectivity in cation or anion-selective epithelial lines by expression of different claudins. Am. J. Physiol. Renal Physiol. 2003, 285, F1078–F1084. [Google Scholar] [CrossRef]
- Tokuda, S.; Furuse, M. Claudin-2 knockout by TALEN-mediated gene targeting in MDCK cells: Claudin-2 independently determines the leaky property of tight junctions in MDCK cells. PLoS ONE 2015, 10, e0119869. [Google Scholar] [CrossRef] [PubMed]
- Srinivasan, B.; Kolli, A.R.; Esch, M.B.; Abaci, H.E.; Shuler, M.L.; Hickman, J.J. TEER measurement techniques for in vitro barrier model systems. J. Lab. Autom. 2015, 20, 107–126. [Google Scholar] [CrossRef] [PubMed]
- Dembla, S.; Hasan, N.; Becker, A.; Beck, A.; Philipp, S.E. Transient receptor potential A1 channels regulate epithelial cell barriers formed by MDCK cells. FEBS Lett. 2016, 590, 1509–1520. [Google Scholar] [CrossRef] [PubMed] [Green Version]
- Amoozadeh, Y.; Anwer, S.; Dan, Q.; Venugopal, S.; Shi, Y.; Branchard, E.; Liedtke, E.; Ailenberg, M.; Rotstein, O.D.; Kapus, A.; et al. Cell confluence regulates claudin-2 expression: Possible role for ZO-1 and Rac. Am. J. Physiol. Cell Physiol. 2018, 314, C366–C378. [Google Scholar] [CrossRef] [PubMed]
- Welker, M.E.; Kulik, G. Recent syntheses of PI3K/Akt/mTOR signaling pathway inhibitors. Bioorg. Med. Chem. 2013, 21, 4063–4091. [Google Scholar] [CrossRef] [Green Version]
- Jiang, W.; Luo, T.; Li, S.; Zhou, Y.; Shen, X.Y.; He, F.; Xu, J.; Wang, H.Q. Quercetin Protects against Okadaic Acid-Induced Injury via MAPK and PI3K/Akt/GSK3beta Signaling Pathways in HT22 Hippocampal Neurons. PLoS ONE 2016, 11, e0152371. [Google Scholar] [CrossRef]
- Khan, N.; Binder, L.; Pantakani, D.V.K.; Asif, A.R. MPA Modulates Tight Junctions’ Permeability via Midkine/PI3K Pathway in Caco-2 Cells: A Possible Mechanism of Leak-Flux Diarrhea in Organ Transplanted Patients. Front. Physiol. 2017, 8, 438. [Google Scholar] [CrossRef]
- Lin, X.; Shang, X.; Manorek, G.; Howell, S.B. Regulation of the Epithelial-Mesenchymal Transition by Claudin-3 and Claudin-4. PLoS ONE 2013, 8, e67496. [Google Scholar] [CrossRef]
- Piegholdt, S.; Pallauf, K.; Esatbeyoglu, T.; Speck, N.; Reiss, K.; Ruddigkeit, L.; Stocker, A.; Huebbe, P.; Rimbach, G. Biochanin A and prunetin improve epithelial barrier function in intestinal CaCo-2 cells via downregulation of ERK, NF-kappaB, and tyrosine phosphorylation. Free Radic. Biol. Med. 2014, 70, 255–264. [Google Scholar] [CrossRef]
- Horng, S.; Therattil, A.; Moyon, S.; Gordon, A.; Kim, K.; Argaw, A.T.; Hara, Y.; Mariani, J.N.; Sawai, S.; Flodby, P.; et al. Astrocytic tight junctions control inflammatory CNS lesion pathogenesis. J. Clin. Investig. 2017, 127, 3136–3151. [Google Scholar] [CrossRef]
- Aono, S.; Hirai, Y. Phosphorylation of claudin-4 is required for tight junction formation in a human keratinocyte cell line. Exp. Cell Res. 2008, 314, 3326–3339. [Google Scholar] [CrossRef] [PubMed]
- Fujibe, M.; Chiba, H.; Kojima, T.; Soma, T.; Wada, T.; Yamashita, T.; Sawada, N. Thr203 of claudin-1, a putative phosphorylation site for MAP kinase, is required to promote the barrier function of tight junctions. Exp. Cell Res. 2004, 295, 36–47. [Google Scholar] [CrossRef] [PubMed]
- Shigetomi, K.; Ikenouchi, J. Regulation of the epithelial barrier by post-translational modifications of tight junction membrane proteins. J. Biochem. 2018, 163, 265–272. [Google Scholar] [CrossRef] [PubMed]
- Fujii, N.; Matsuo, Y.; Matsunaga, T.; Endo, S.; Sakai, H.; Yamaguchi, M.; Yamazaki, Y.; Sugatani, J.; Ikari, A. Hypotonic Stress-induced Down-regulation of Claudin-1 and -2 Mediated by Dephosphorylation and Clathrin-dependent Endocytosis in Renal Tubular Epithelial Cells. J. Biol. Chem. 2016, 291, 24787–24799. [Google Scholar] [CrossRef] [PubMed] [Green Version]
- Van Itallie, C.M.; Tietgens, A.J.; LoGrande, K.; Aponte, A.; Gucek, M.; Anderson, J.M. Phosphorylation of claudin-2 on serine 208 promotes membrane retention and reduces trafficking to lysosomes. J. Cell Sci. 2012, 125, 4902–4912. [Google Scholar] [CrossRef] [PubMed] [Green Version]
- Tanaka, M.; Kamata, R.; Sakai, R. EphA2 phosphorylates the cytoplasmic tail of Claudin-4 and mediates paracellular permeability. J. Biol. Chem. 2005, 280, 42375–42382. [Google Scholar] [CrossRef] [PubMed]
- D’Souza, T.; Indig, F.E.; Morin, P.J. Phosphorylation of claudin-4 by PKCepsilon regulates tight junction barrier function in ovarian cancer cells. Exp. Cell Res. 2007, 313, 3364–3375. [Google Scholar] [CrossRef] [PubMed]
- Zhu, Y.; Teng, T.; Wang, H.; Guo, H.; Du, L.; Yang, B.; Yin, X.; Sun, Y. Quercetin inhibits renal cyst growth in vitro and via parenteral injection in a polycystic kidney disease mouse model. Food Funct. 2018, 9, 389–396. [Google Scholar] [CrossRef]
- Jiang, H.; Yamashita, Y.; Nakamura, A.; Croft, K.; Ashida, H. Quercetin and its metabolite isorhamnetin promote glucose uptake through different signalling pathways in myotubes. Sci. Rep. 2019, 9, 2690. [Google Scholar] [CrossRef]
- Gamero-Estevez, E.; Baumholtz, A.I.; Ryan, A.K. Developing a link between toxicants, claudins and neural tube defects. Reprod. Toxicol. 2018, 81, 155–167. [Google Scholar] [CrossRef]
- Chuenkitiyanon, S.; Pengsuparp, T.; Jianmongkol, S. Protective effect of quercetin on hydrogen peroxide-induced tight junction disruption. Int. J. Toxicol. 2010, 29, 418–424. [Google Scholar] [CrossRef] [PubMed]
- Tan, C.; Meng, F.; Reece, E.A.; Zhao, Z. Modulation of nuclear factor-kappaB signaling and reduction of neural tube defects by quercetin-3-glucoside in embryos of diabetic mice. Am. J. Obstet. Gynecol. 2018, 219, 197.e1–197.e8. [Google Scholar] [CrossRef] [PubMed]
- Maurya, A.K.; Vinayak, M. PI-103 and Quercetin Attenuate PI3K-AKT Signaling Pathway in T- Cell Lymphoma Exposed to Hydrogen Peroxide. PLoS ONE 2016, 11, e0160686. [Google Scholar] [CrossRef] [PubMed]
- Wang, X.Q.; Yao, R.Q.; Liu, X.; Huang, J.J.; Qi, D.S.; Yang, L.H. Quercetin protects oligodendrocyte precursor cells from oxygen/glucose deprivation injury in vitro via the activation of the PI3K/Akt signaling pathway. Brain Res. Bull. 2011, 86, 277–284. [Google Scholar] [CrossRef] [PubMed]
- Du, G.; Zhao, Z.; Chen, Y.; Li, Z.; Tian, Y.; Liu, Z.; Liu, B.; Song, J. Quercetin attenuates neuronal autophagy and apoptosis in rat traumatic brain injury model via activation of PI3K/Akt signaling pathway. Neurol. Res. 2016, 38, 1012–1019. [Google Scholar] [CrossRef] [PubMed]
- Wu, L.; Zhang, Q.; Dai, W.; Li, S.; Feng, J.; Li, J.; Liu, T.; Xu, S.; Wang, W.; Lu, X.; et al. Quercetin Pretreatment Attenuates Hepatic Ischemia Reperfusion-Induced Apoptosis and Autophagy by Inhibiting ERK/NF-kappaB Pathway. Gastroenterol. Res. Pract. 2017, 2017, 9724217. [Google Scholar] [CrossRef] [PubMed]
- Qiu, L.; Luo, Y.; Chen, X. Quercetin attenuates mitochondrial dysfunction and biogenesis via upregulated AMPK/SIRT1 signaling pathway in OA rats. Biomed. Pharmacother. 2018, 103, 1585–1591. [Google Scholar] [CrossRef]
- Bird, V.Y.; Khan, S.R. How do stones form? Is unification of theories on stone formation possible? Arch. Esp. Urol. 2017, 70, 12–27. [Google Scholar] [PubMed]
- Coe, F.L.; Evan, A.P.; Worcester, E.M.; Lingeman, J.E. Three pathways for human kidney stone formation. Urol. Res. 2010, 38, 147–160. [Google Scholar] [CrossRef] [PubMed] [Green Version]
- Tokuda, S.; Hirai, T.; Furuse, M. Effects of Osmolality on Paracellular Transport in MDCK II Cells. PLoS ONE 2016, 11, e0166904. [Google Scholar] [CrossRef]


© 2019 by the authors. Licensee MDPI, Basel, Switzerland. This article is an open access article distributed under the terms and conditions of the Creative Commons Attribution (CC BY) license (http://creativecommons.org/licenses/by/4.0/).
Share and Cite
Gamero-Estevez, E.; Andonian, S.; Jean-Claude, B.; Gupta, I.; Ryan, A.K. Temporal Effects of Quercetin on Tight Junction Barrier Properties and Claudin Expression and Localization in MDCK II Cells. Int. J. Mol. Sci. 2019, 20, 4889. https://doi.org/10.3390/ijms20194889
Gamero-Estevez E, Andonian S, Jean-Claude B, Gupta I, Ryan AK. Temporal Effects of Quercetin on Tight Junction Barrier Properties and Claudin Expression and Localization in MDCK II Cells. International Journal of Molecular Sciences. 2019; 20(19):4889. https://doi.org/10.3390/ijms20194889
Chicago/Turabian StyleGamero-Estevez, Enrique, Sero Andonian, Bertrand Jean-Claude, Indra Gupta, and Aimee K. Ryan. 2019. "Temporal Effects of Quercetin on Tight Junction Barrier Properties and Claudin Expression and Localization in MDCK II Cells" International Journal of Molecular Sciences 20, no. 19: 4889. https://doi.org/10.3390/ijms20194889