Article

Genome-Wide Identification, Molecular Evolution, and Expression Profiling Analysis of Pectin Methylesterase Inhibitor Genes in Brassica campestris ssp. chinensis

1
Laboratory of Cell and Molecular Biology, Institute of Vegetable Science, Zhejiang University, Hangzhou 310058, China
2
Key Laboratory of Horticultural Plant Growth, Development and Quality Improvement, Ministry of Agriculture, Hangzhou 310058, China
3
Zhejiang Provincial Key Laboratory of Horticultural Plant Integrative Biology, Hangzhou 310058, China
4
Department of Horticulture, College of Agriculture and Food Science, Zhejiang A & F University, Lin’an 311300, China
*
Author to whom correspondence should be addressed.
Int. J. Mol. Sci. 2018, 19(5), 1338; https://doi.org/10.3390/ijms19051338
Submission received: 26 March 2018 / Revised: 20 April 2018 / Accepted: 23 April 2018 / Published: 2 May 2018
(This article belongs to the Section Molecular Plant Sciences)

Abstract

:
Pectin methylesterase inhibitor genes (PMEIs) are a large multigene family and play crucial roles in cell wall modifications in plant growth and development. Here, a comprehensive analysis of the PMEI gene family in Brassica campestris, an important leaf vegetable, was performed. We identified 100 Brassica campestris PMEI genes (BcPMEIs), among which 96 BcPMEIs were unevenly distributed on 10 chromosomes and nine tandem arrays containing 20 BcPMEIs were found. We also detected 80 pairs of syntenic PMEI orthologs. These findings indicated that whole-genome triplication (WGT) and tandem duplication (TD) were the main mechanisms accounting for the current number of BcPMEIs. In evolution, BcPMEIs were retained preferentially and biasedly, consistent with the gene balance hypothesis and two-step theory, respectively. The molecular evolution analysis of BcPMEIs manifested that they evolved through purifying selection and the divergence time is in accordance with the WGT data of B. campestris. To obtain the functional information of BcPMEIs, the expression patterns in five tissues and the cis-elements distributed in promoter regions were investigated. This work can provide a better understanding of the molecular evolution and biological function of PMEIs in B. campestris.

1. Introduction

The plant cell wall is a highly complex structure mainly containing polysaccharides and proteins and is indispensable to the proper plant growth and development [1]. The polysaccharides are mostly made up of cellulose, hemicellulose, and pectin, with pectin the major component [2]. Pectin arose after the separation between chlorophyta and charophyce and is essential for cellular structural integrity, cell adhesion, and the mediation of defense responses [3,4,5,6]. It can be divided into homogalacturonan (HG), xylogalacturonan (XGA), rhamnogalacturonan I (RGI), and rhamnogalacturonan II (RGII) based on the different structures [7]. The four different pectin domains are linked to each other, constituting a huge network [3]. HG, the most abundant pectic polysaccharide, is methyl-esterified in medial-Golgi; then the methyl-esterified HG is conveyed to the cell wall and proceeds with demethylation by pectin methylesterases (PMEs) [3]. PMEs belong to a big hydrolase family and are regulated by pectin methylesterase inhibitors (PMEIs) [2]. The proteins of PME and PMEI can form a reversible 1:1 complex, but the PMEIs only inhibit plant PMEs and do not affect the PME activity of microbe origin [8].
PMEIs play important roles in many stages of plant growth, development, and defense, such as pollen maturation and pollen tube growth, seed germination, hypocotyl elongation, fruit ripening, and plant immunity [9,10,11,12,13]. Bra014099, Bra019903, and Bra032239 might be involved in male sterile [14]. AtPMEI3 has been proposed to regulate the primordia formation in Arabidopsis inflorescence meristems [15]. AtPMEI6, specially expressed in the seed coat, can affect the speed of seed mucilage [16]. SolyPMEI, a tomato PMEI gene, can influence fruit softening and ripening by regulating the methylesterification of pectin [11]. OsPMEI28 is demonstrated to be a critical structural modulator and overexpression of OsPMEI28 in rice leads to dwarf phenotypes and reduced culm diameter [17]. CaPMEI1, a PMEI gene in pepper, is involved in fungal resistance, as well as drought and oxidative stress tolerance [18]. During Botrytis attack, AtPMEI10, AtPMEI11, and AtPMEI12 can be induced to fight against the infection [13].
Gene duplication is recognized as a common phenomenon in the evolution of plants and can provide raw materials for adaptive evolution [19]. Several modes of gene duplication, such as WGD and tandem duplication (TD), have been summarized by a previous study, among which WGD, a prevalent and recurring event, plays a significant role in the evolution of higher eukaryotes [20,21]. The Brassicaceae are a good model for studying the polyploidy and evolution [22]. Approximately 338 genera and 3709 species worldwide with major scientific and economic importance belong to Brassicaceae, including some model species, such as Arabidopsis and Brassica [23,24]. Arabidopsis, the well-known model plant, has experienced three whole-genome duplication (WGD) events [25]. Brassica campestris (synonym of Brassica rapa), an economically important vegetable crop, is a diploid Brassica species [26]. Besides the three WGD events shared with Arabidopsis, B. campestris experienced another whole-genome triplication (WGT) event that led to its separation from Arabidopsis 13–17 million years ago (MYA) [27]. The divergence time, which is short enough for most B. campestris genes to be identified in Arabidopsis but long enough for the genome to be fractionated, makes B. campestris ideal for the study of gene families [26,28].
The genome-wide analyses of PMEIs were performed in many plants, such as Arabidopsis, rice, and flax, with 78, 49, and 95 members identified, respectively [29,30,31], indicating that PMEIs belong to a large multigene family, like PMEs. In this study, 100 B. campestris PMEI genes (BcPMEIs) were identified and characterized. Comprehensive studies of the PMEI gene family in B. campestris were conducted, including phylogenetic tree, gene structures, physicochemical properties, chromosomal locations, conserved motifs, and molecular evolution. Additionally, we carried out the analysis of synteny and retention rate between BcPMEIs and Arabidopsis thaliana PMEI genes (AtPMEIs) to reveal the impacts of WGT on the evolution of BcPMEIs. To obtain the functional information of BcPMEIs, their expression patterns in five tissues were analyzed by quantitative real-time (qRT) PCR. The cis-elements detected in promoter regions suggested that BcPMEIs might be involved in hormone regulation and stress tolerance. Our findings can provide valuable insights for studying the molecular evolution and biological functions of PMEIs in B. campestris.

2. Results

2.1. Identification and Phylogenetic Analysis of PMEI Gene Family in B. campestris

A total of 165 PMEI gene members were found by the HMMER 3.0 software with default values. In addition, 196 PMEIs were acquired from the BLASTP searches in BRAD by using 78 AtPMEIs and 49 Oryza sativa PMEIs (OsPMEIs) as queries. After removing the redundant sequences obtained from the above two methods, SMART and Pfam were adopted to further verify the candidates whether or not cover the conserved PMEI domain (PF04043). Finally, 100 PMEI members were identified in the whole genome of B. campestris (Table S1).
In the phylogenetic tree, the 100 BcPMEIs were classified into five clades, containing 19, 6, 16, 25, and 34 members, respectively (Figure S1). However, in accordance with the research results of PMEI gene family in flax [30] and rice [29], we failed to find any common sequence features that can distinguish the subclassifications of BcPMEIs from each other.

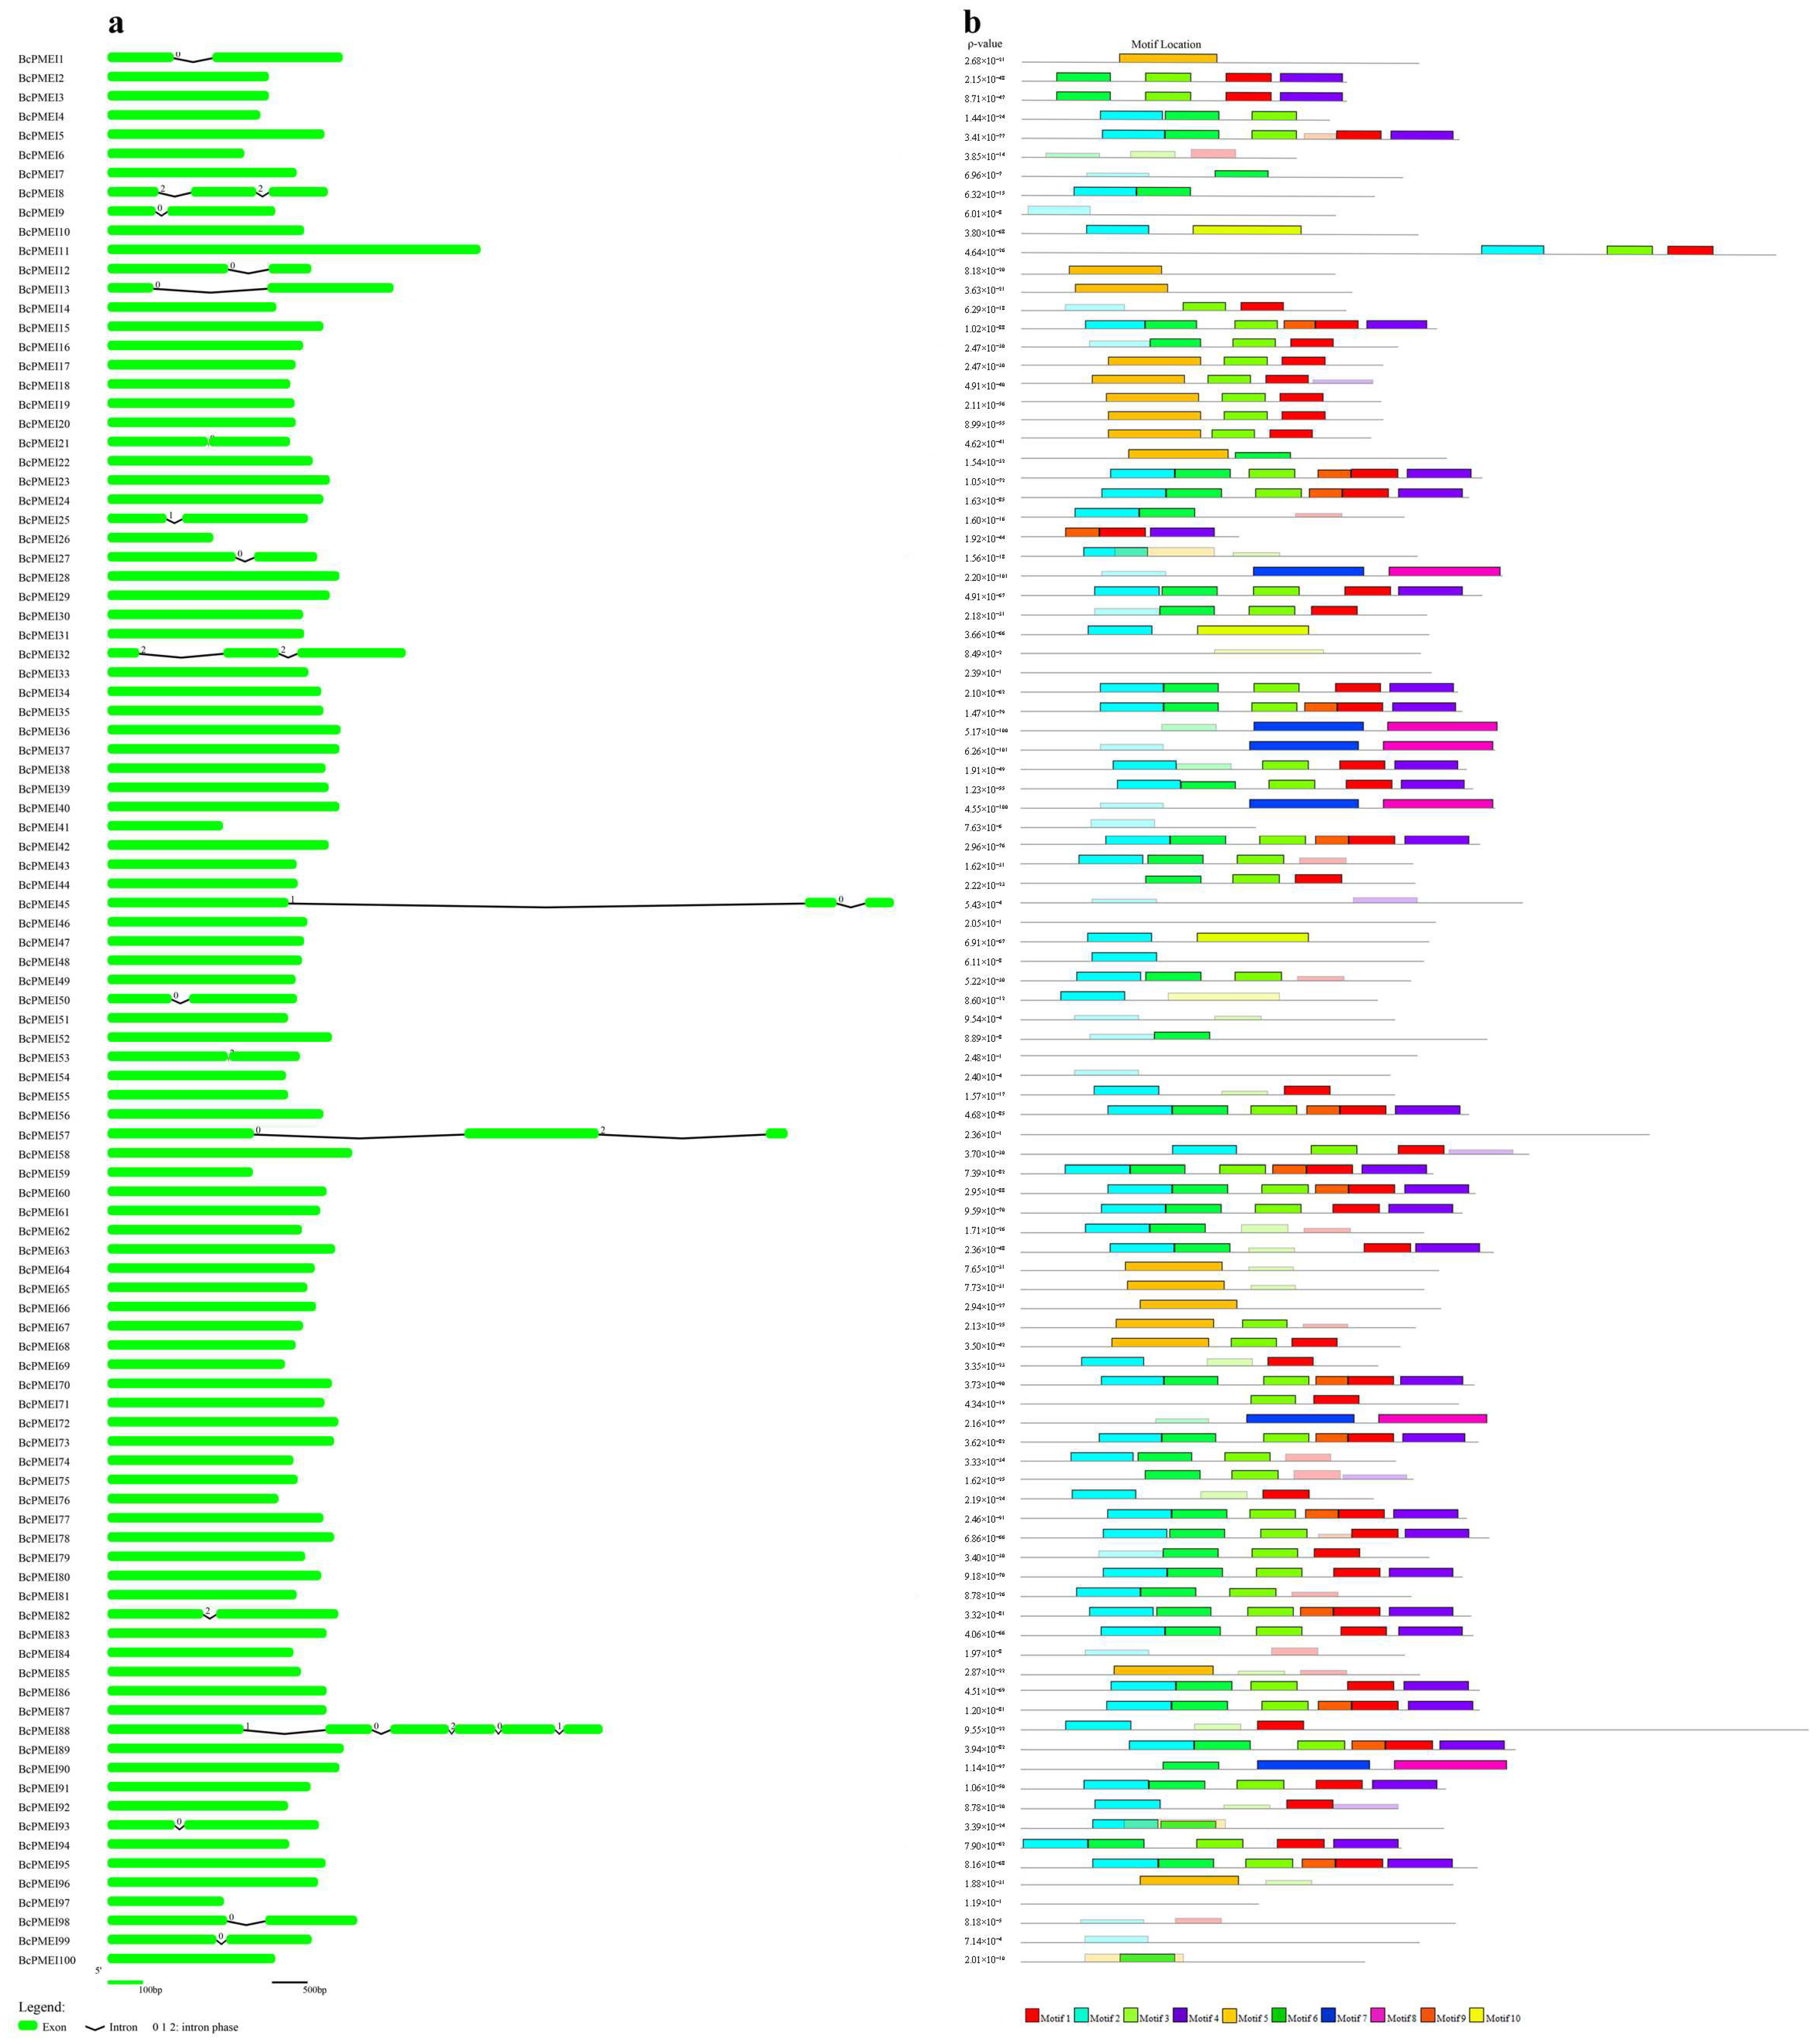
2.2. Characterization of Gene Structure, Conserved Motif, and Physicochemical Properties

The exon–intron structural analysis of BcPMEIs was performed by comparing the coding sequences with their corresponding genomic DNA sequences. The results showed that most of the BcPMEIs (88/100) only contain exon in their DNA sequences (Figure 1a), which was in line with previous studies [29,32]. Among the remaining 12 BcPMEIs, their coding sequences were disrupted by one to five introns, and a total of 26 introns were detected with 54%, 15%, and 31% in phases 0, 1 and 2, respectively. In order to detect the motifs shared among the PMEIs in B. campestris, we identified 10 conserved motifs using the MEME program (Figure 1b). The amino acid number of the motifs ranged from 15 (motif 9) to 50 (motifs 7, 8, and 10). Each BcPMEI protein covered 0 to 6 conserved motifs and the number of site distribution of motifs ranged from three (motif 10) to 50 (motifs 1, 2, and 3) (Figure S2). The length of the coding sequences of BcPMEIs ranged from 297 bp (BcPMEI26) to 1053 bp (BcPMEI88), and the number of the amino acids they encoded was from 98 to 350 with the predicted molecular weight from 10.9 to 38.2 kDa (Table S1). The theoretical isoelectric point varied from 4.06 (BcPMEI11) to 10.61 (BcPMEI41). A total of 82 BcPMEIs covered a signal peptide sequence with 16 to 31 amino acids in length, and 28 BcPMEIs had a transmembrane helix. Plant-mPLoc predicted that 97 BcPMEIs were secreted to the cell membrane. Based on the predictions of signal peptide, transmembrane domain, and subcellular localization, 98 BcPMEIs are predicted to be extracellular and two BcPMEIs were predicted to be localized to the nucleus, consistent with the subcellular localization results of PMEIs in flax [30].

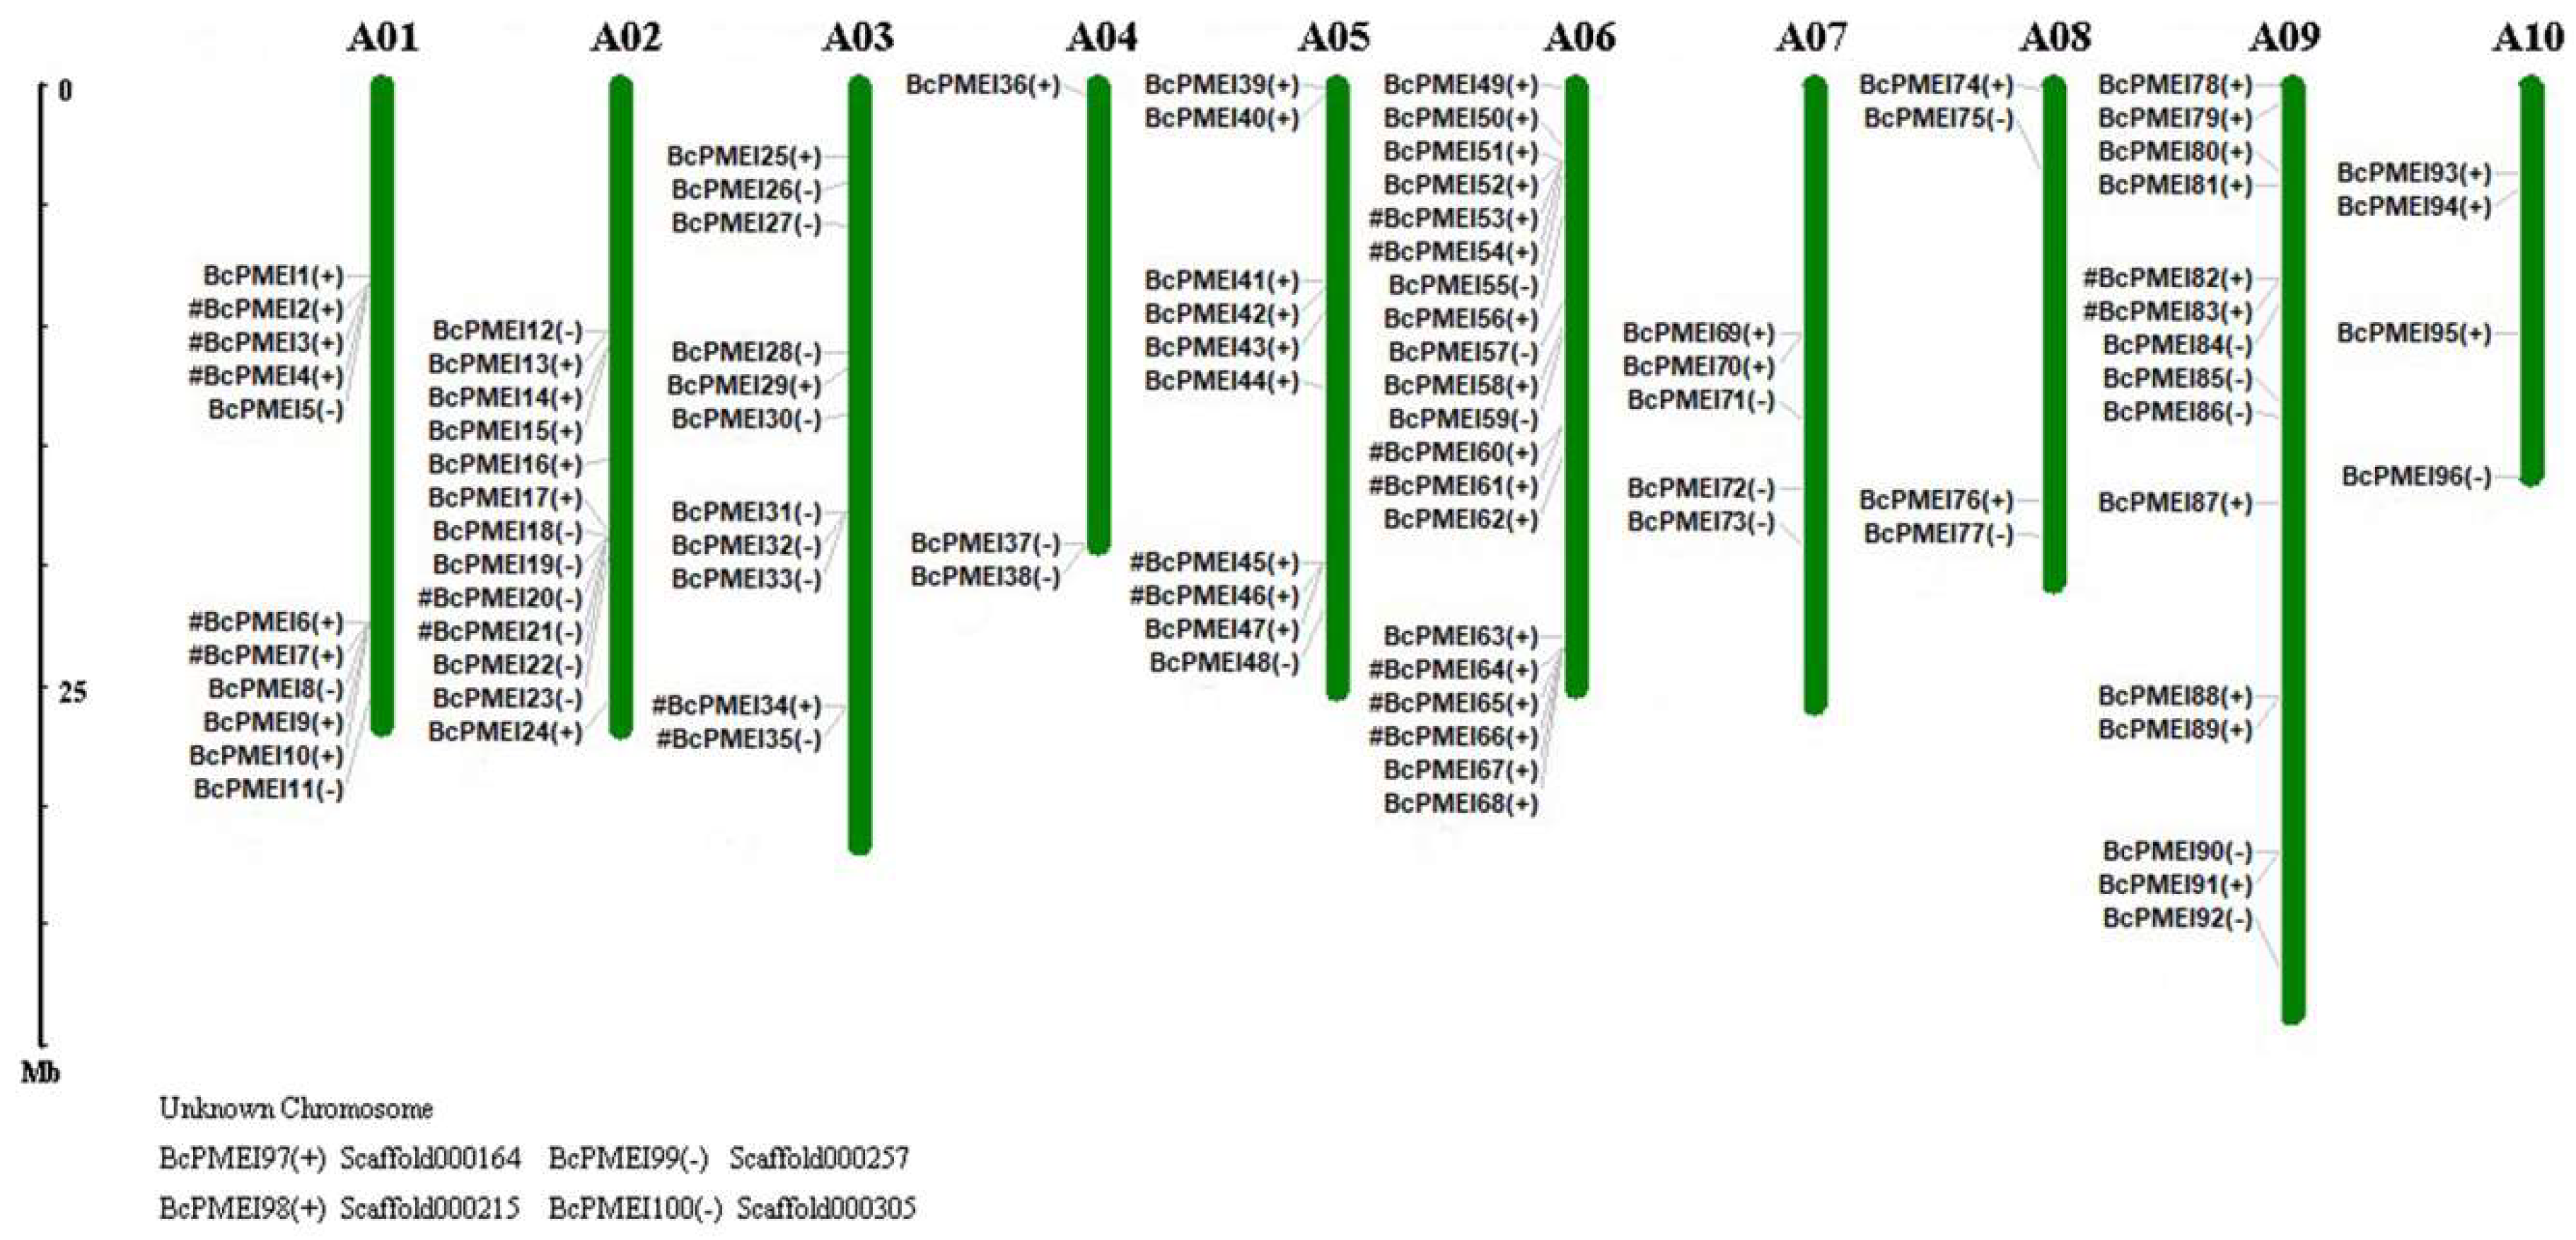
2.3. Chromosomal Distribution of PMEIs in B. campestris

A total of 96 BcPMEIs, namely BcPMEI1-BcPMEI96, were located on 10 chromosomes with an obviously uneven distribution and the other four unmapped genes, namely BcPMEI97BcPMEI100, were distributed on scaffold000164, scaffold000215, scaffold000257, and scaffold000305, respectively (Figure 2). The maximum number of BcPMEIs was discovered on chromosome 6 with up to 20 while the minimum number was on chromosome 4 with only three. Chromosomes 1, 2, 3, and 9 included more than 10 BcPMEIs with 11, 13, 11, and 15 genes located, respectively, while chromosomes 5, 7, 8, and 10 only contained 10, five, four, and four genes, respectively. Sixty-one BcPMEIs were present in the 5’ to 3’ direction, and the remaining members were at the opposite direction. In addition, among the BcPMEIs located on the 10 B. campestris chromosomes, nine tandemly duplicated clusters were identified, which were mapped on chromosome 1 (BcPMEI2/BcPMEI3/BcPMEI4; BcPMEI6/BcPMEI7), chromosome 2 (BcPMEI20/BcPMEI21), chromosome 3 (BcPMEI34/BcPMEI35), chromosome 5 (BcPMEI45/BcPMEI46), chromosome 6 (BcPMEI53/BcPMEI54; BcPMEI60/BcPMEI61; BcPMEI64/BcPMEI65/BcPME66), and chromosome 9 (BcPMEI82/BcPMEI83), respectively.

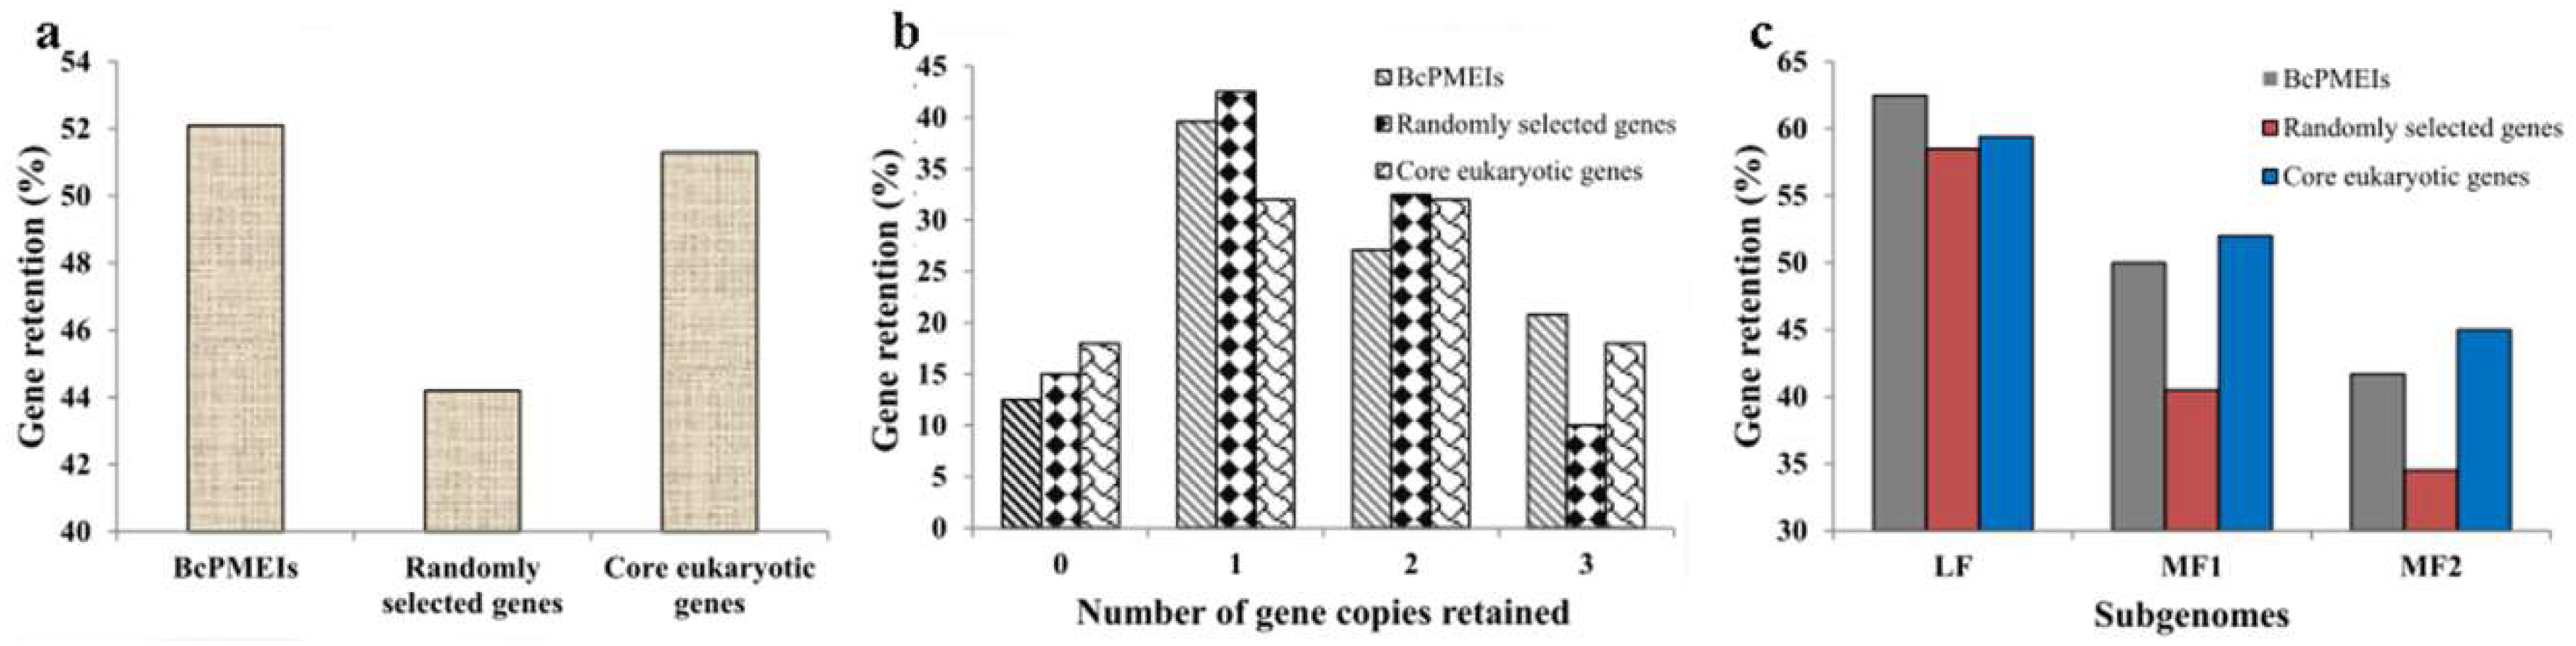
2.4. Synteny and Retained Proportion Analysis

On the basis of the well-conserved syntenic relationships between B. campestris and A. thaliana, we investigated the syntenic orthologous gene pairs between BcPMEIs and AtPMEIs by searching the “syntenic gene” in BRAD [33]. As shown in Figure 3, up to 80 pairs of orthologous PMEIs were detected in the same genomic blocks, implying that the expansion of BcPMEIs was mainly attributed to the WGT event. Additionally, by searching “nonsyntenic orthologous” in BRAD, we identified four pairs of nonsyntenic orthologous PMEIs (Table S2).
Seventeen loci of AtPMEIs did not have the orthologous gene in B. campestris. To know whether these loci were lost in B. campestris or were newly acquired in Arabidopsis, the analysis of their orthologous genes in other Brassicaceae species was performed on the basis of a previous study [34]. The results showed that 6 loci of AtPMEIs might be lost in B. campestris and 11 loci might arise after the divergence between Arabidopsis and B. campestris (Table S3). Similarly, the 13 loci of BcPMEIs that have no orthologous gene in Arabidopsis were identified to appear after WGT. On the basis of these results, we computed the retention rate of PMEIs in B. campestris (Figure 4). Meanwhile, the retention of BcPMEIs was compared to that of a set of 458 core eukaryotic genes and 458 randomly selected genes [35]. The analysis results showed that 52% of BcPMEIs were reserved, similar to the retention of core eukaryotic genes (51%), but much higher than that of random genes (44%) (Figure 4a). Moreover, compared with the other two sets, fewer BcPMEIs (12.5%) were completely lost and more BcPMEIs (21%) retained three copies (Figure 4b).
To know the retained proportions of BcPMEIs in the whole genome level, we conducted the calculation in the three subgenomes, namely least fractionated (LF), medium fractionated (MF1), and most fractionated (MF2) subgenomes (Figure 4c) [26,36]. The PMEI gene family retained more members in the LF subgenome (60%) than those in MF1 and MF2 subgenomes (50% and 42%, respectively). In the LF subgenome, BcPMEIs, randomly selected genes, and core eukaryotic genes have similar retained rates. In the MF1 and MF2 subgenomes, BcPMEIs showed similar retained rates in comparison with the core eukaryotic genes, and both gene sets were retained in remarkably higher rates than the random gene set. So, the BcPMEIs was biasedly retained in the three subgenomes of B. campestris, and the highly reserved rate of PMEIs might mainly result from the gene retention in the LF subgenome.

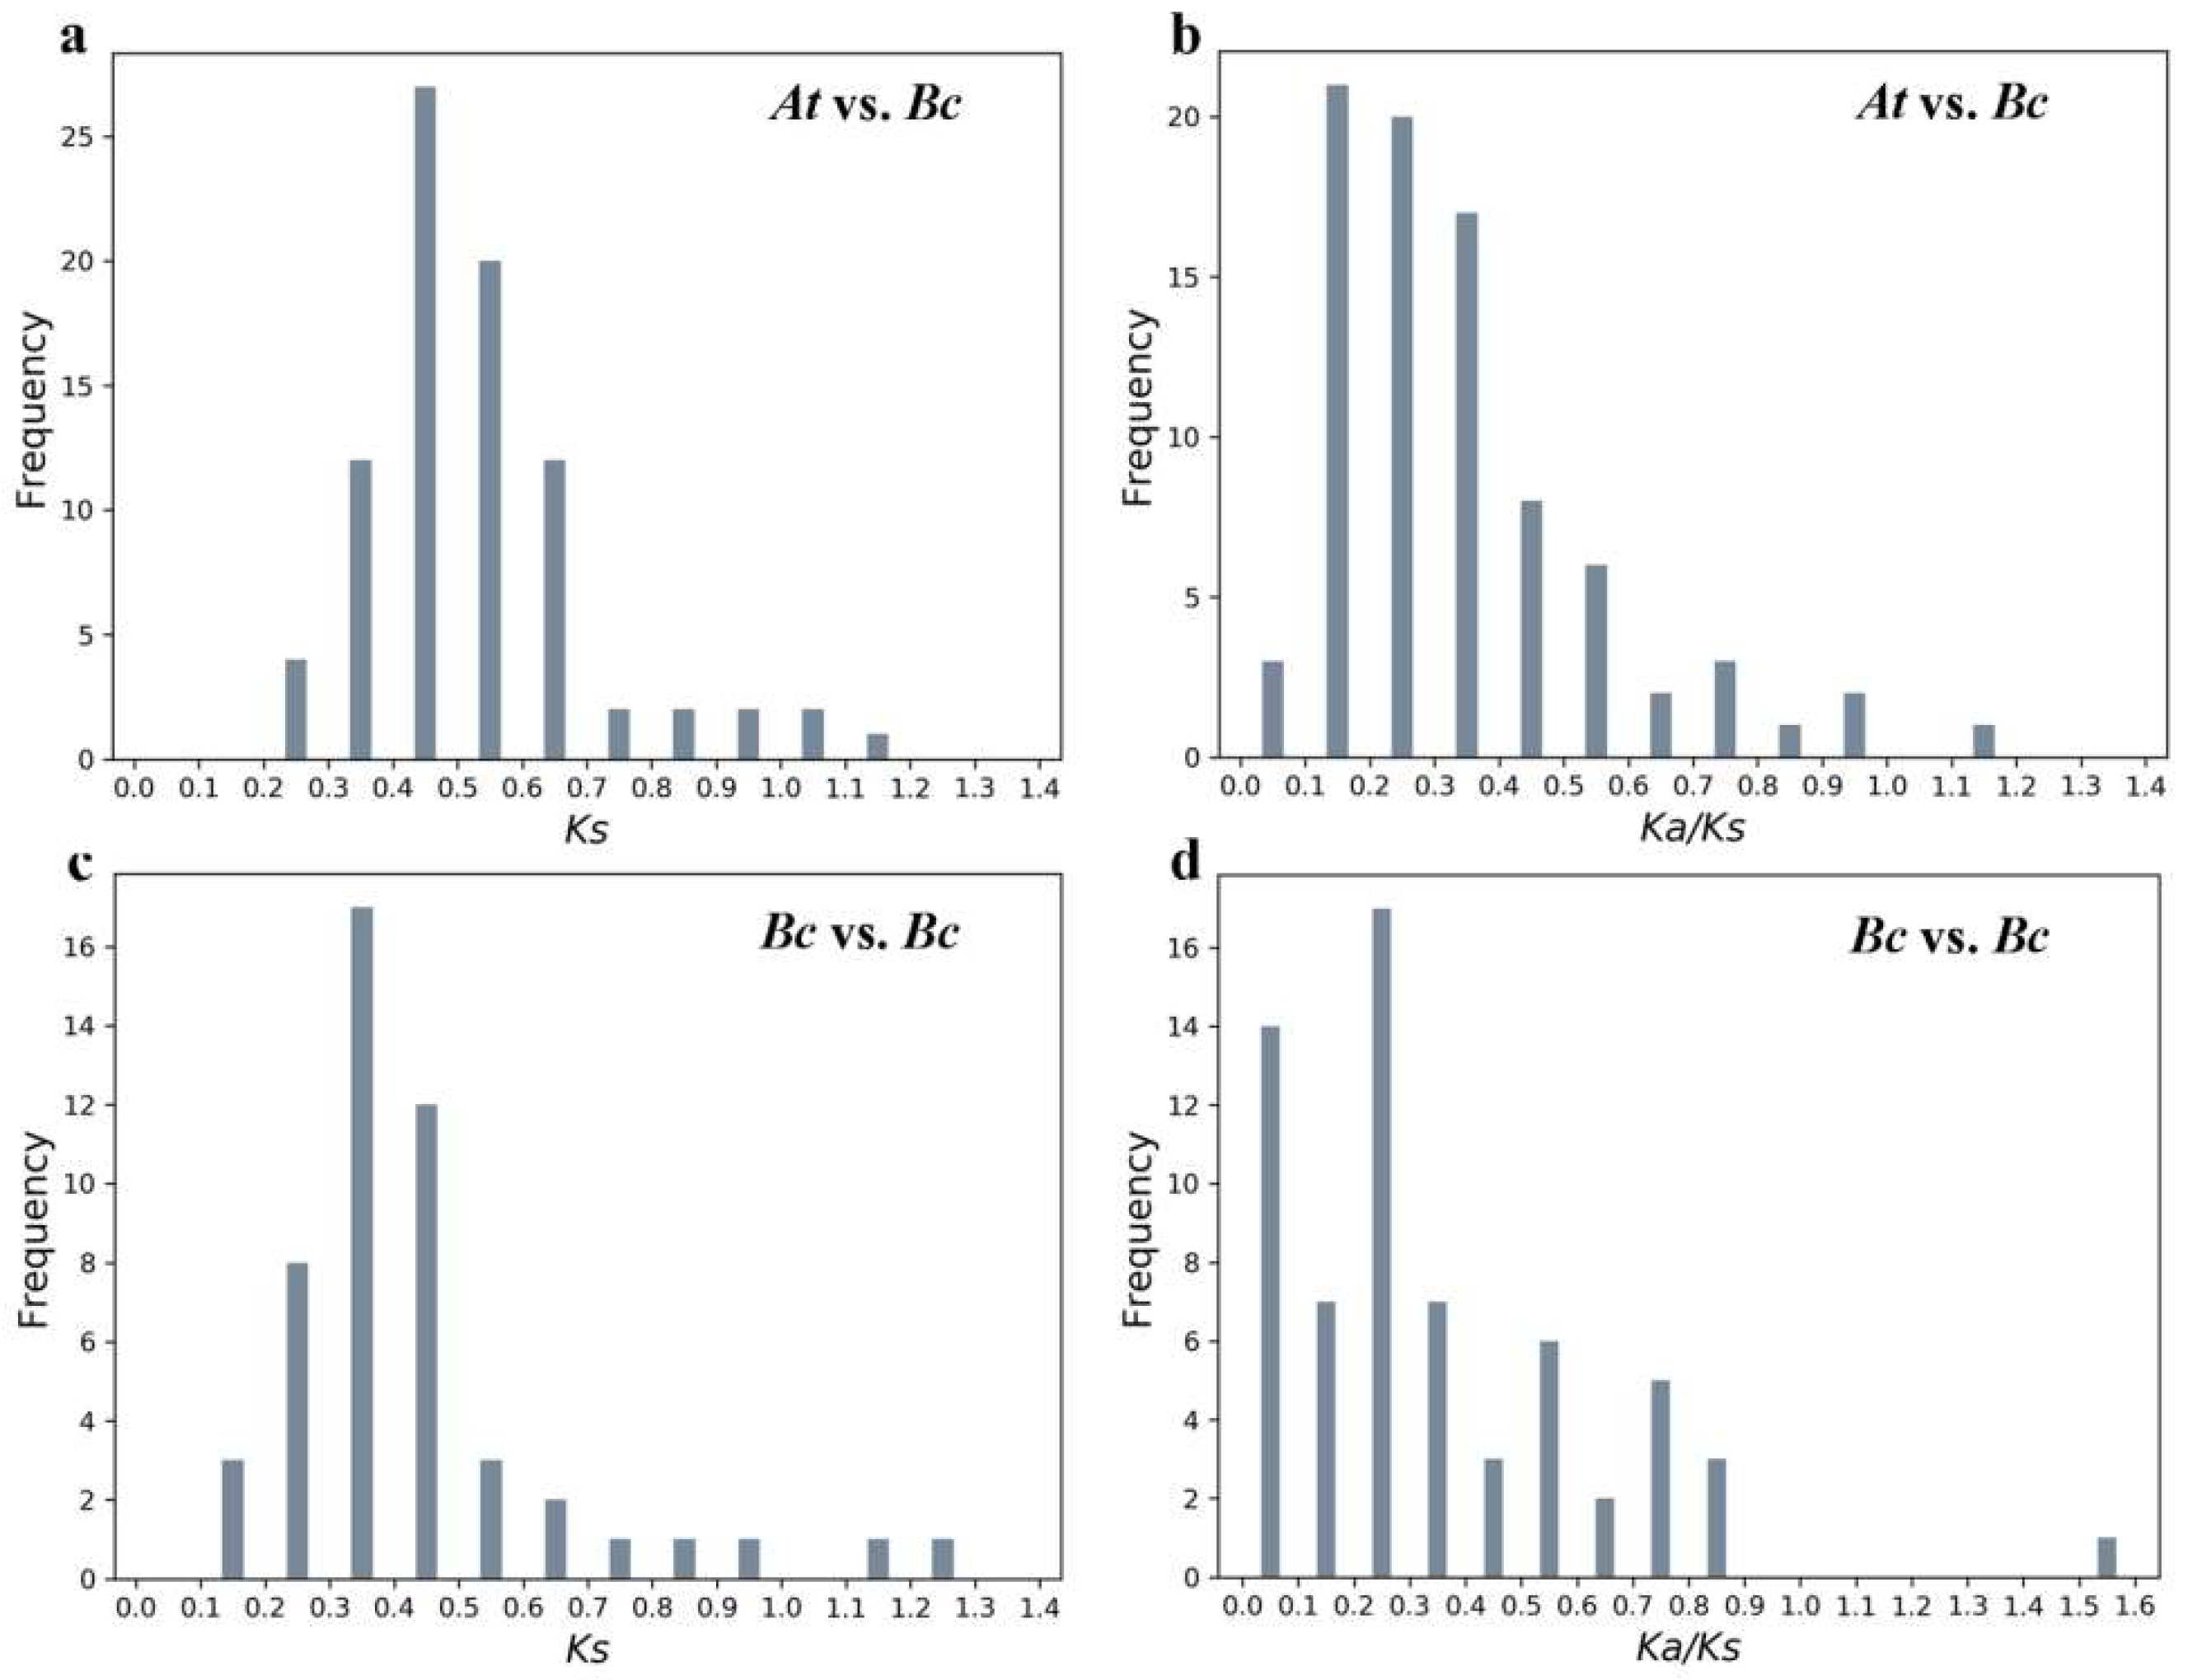
2.5. Evolutionary Analysis of BcPMEIs

The nonsynonymous substitution rate (Ka), synonymous substitution rate (Ks), and ω ratio (Ka/Ks) of homogenous were computed to explore their selection types. The Ks, as the proxy for time, was usually used to measure the divergence time. A total of 84 PMEI orthologous gene pairs were analyzed (Table S4). Their Ks values were from 0.30 to 0.70 and were concentrated on 0.50 (Figure 5a), with a duplication time of about 16.67 MYA, close to the WGT time of B. campestris (13–17 MYA) [26]. The ω ratios of 83 ortholog pairs were lower than 1 (Figure 5b), implying that they experienced purify selection except for BcPMEI98. Furthermore, only three pairs might be under strong purifying selection stress with a ω ratio lower than 0.1, leading to the relatively similar functions of these orthologous gene pairs [22]. Among the three subgenomes, the Ks values and ω ratios of orthologous gene pairs did not have a significant difference (Figure S3). In addition, the Ks values of 52 BcPMEI paralog pairs ranged from 0.13 to 1.99, with an average Ks value of 0.49 (Figure 5c, Table S5). So, the average duplication time of paralog pairs was 16.17 MYA, in accordance with the B. campestris WGT date. The ω ratios of most (51/52) paralog pairs were lower than 1, suggesting that they evolved through purifying selection (Figure 5d).

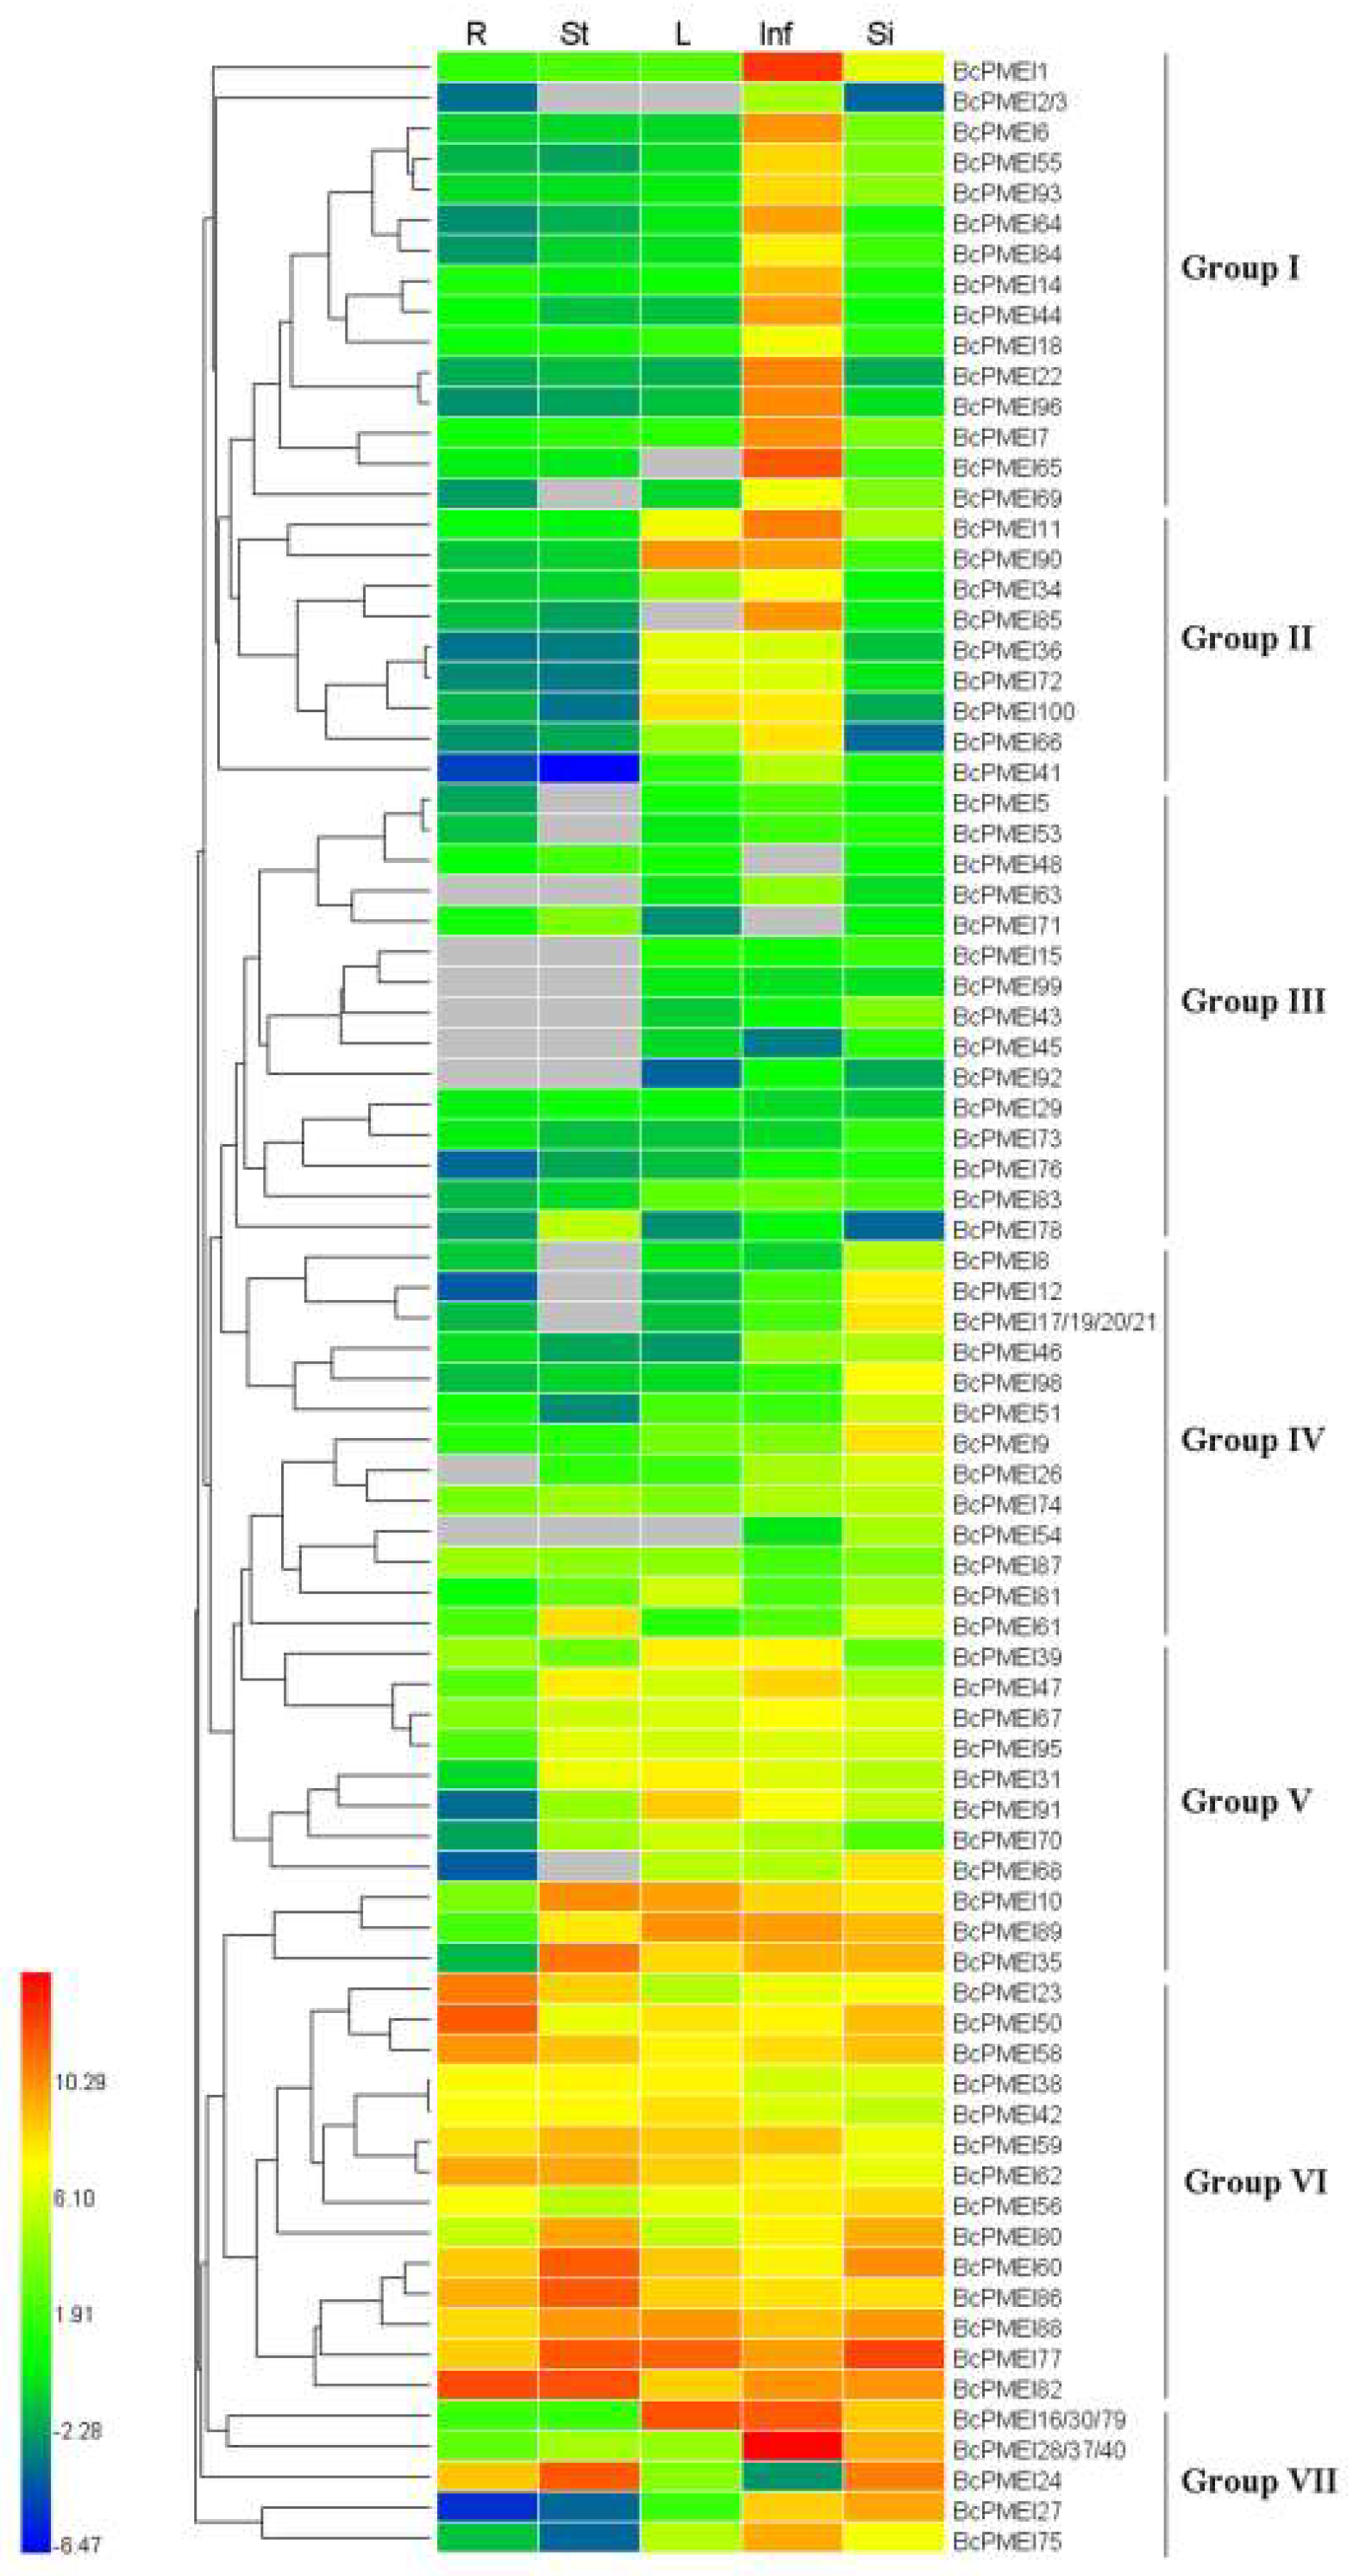
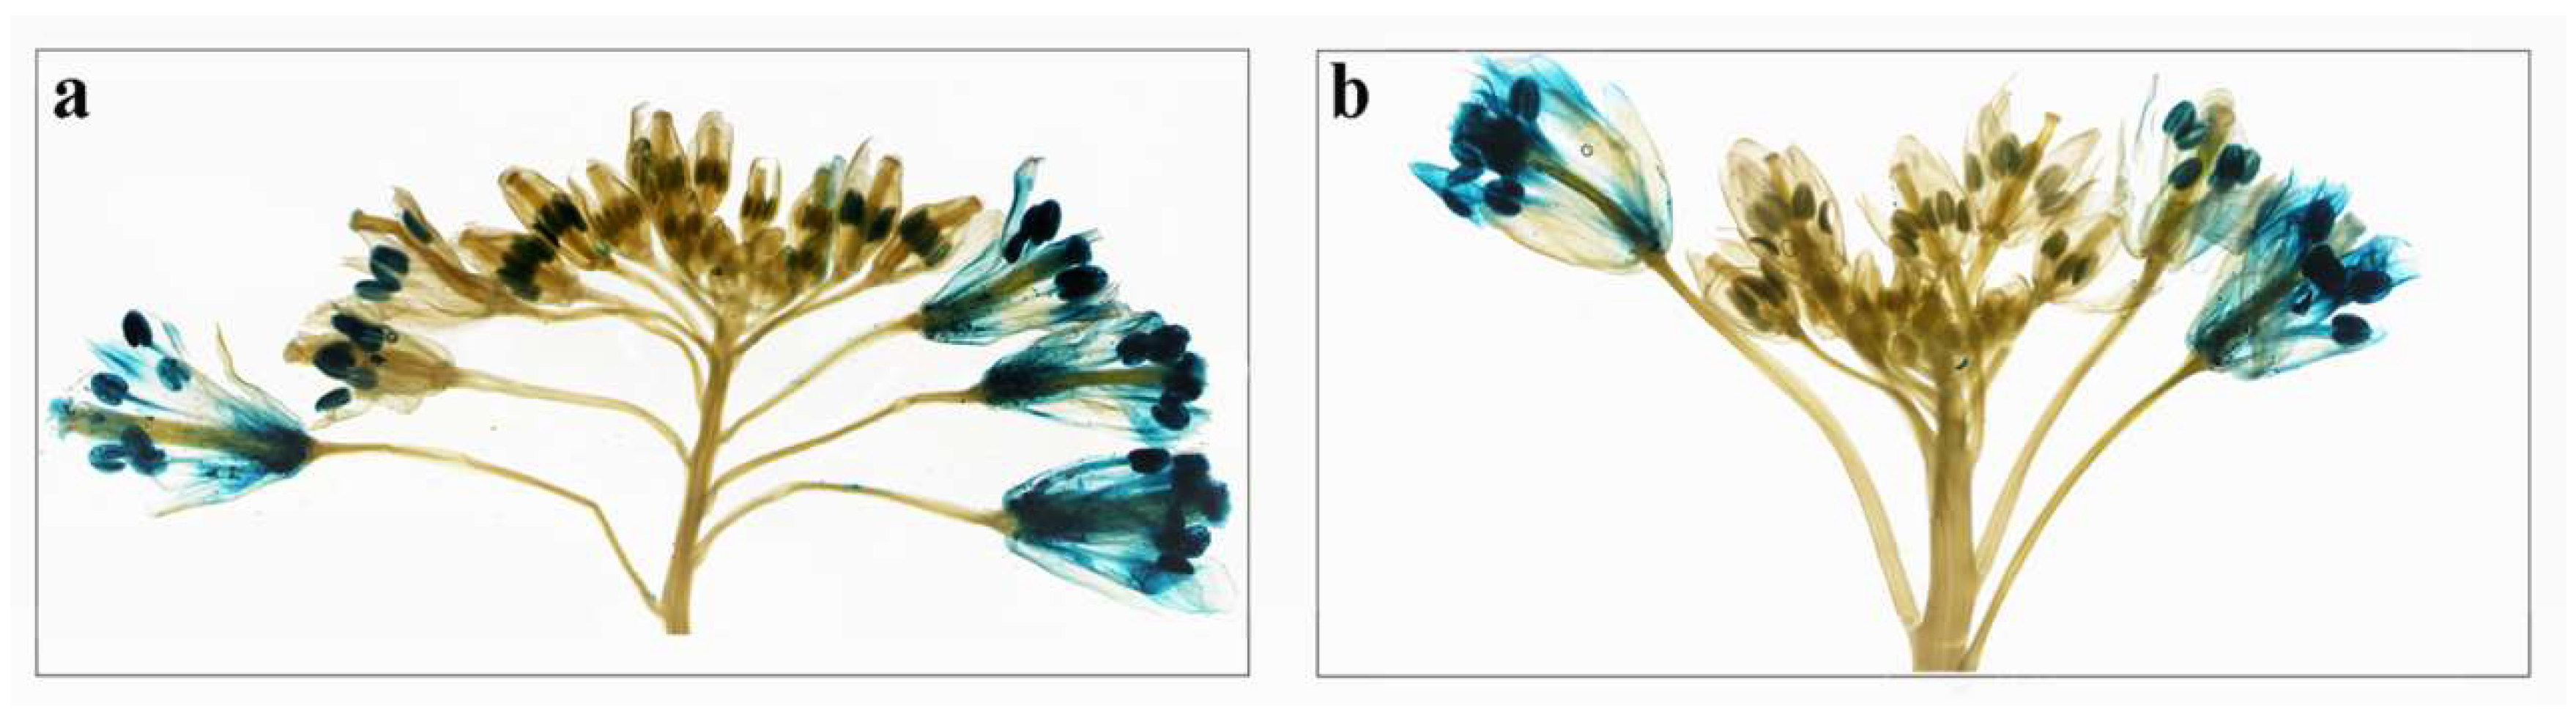
2.6. Expression Analysis of BcPMEIs in Different Tissues and Promoter::GUS Fusions

To study the tissue-specific expression profiles of the 100 BcPMEIs, we conducted qRT-PCR in five major tissues, including roots, stems, leaves, inflorescences, and siliques. Because no expression of 10 BcPMEIs was detected in any of the five tissues, the expression patterns of 90 BcPMEIs were analyzed. The 90 BcPMEIs were classified into seven groups on the basis of their differential expression patterns (Figure 6). Groups I contained 16 BcPMEIs that were mainly expressed in inflorescences and group II contained nine BcPMEIs that were largely expressed in inflorescences and leaves. Group III included 15 BcPMEIs that showed quite low expression levels in all five tissues. The 16 BcPMEIs in group IV were largely expressed in siliques and 11 BcPMEIs in groups V were largely expressed in all five tissues except roots. Group VI contained 17 genes that had relatively higher expression in all five tissues. The other nine BcPMEIs belonged to group VII and were largely expressed in both inflorescences and siliques, although BcPMEI16/30/79 was also highly expressed in leaves and BcPMEI24 was weakly expressed in inflorescences and largely expressed in roots and stems.
The expression patterns of BcPMEIs in five tissues revealed that more than half of genes had a large or specific expression in reproductive tissues. To further study the roles that BcPMEIs might play in reproductive development, we selected two BcPMEIs that were largely and specifically expressed in inflorescences for the analysis of promoter::GUS fusion strategy in transgenic Arabidopsis. The results of histochemical staining in transgenic Arabidopsis plants displayed that the GUS activities were mainly detected in the late flower stages in the two PPMEI::GUS inflorescences (Figure 7). Particularly, very strong GUS activities were discovered in their mature anther and mature pollen grains, suggesting that they were likely to play roles in the later periods of pollen development. Moreover, the GUS staining could be seen in the sepals, petals, filaments, and pistils at the flower stages 12–14.

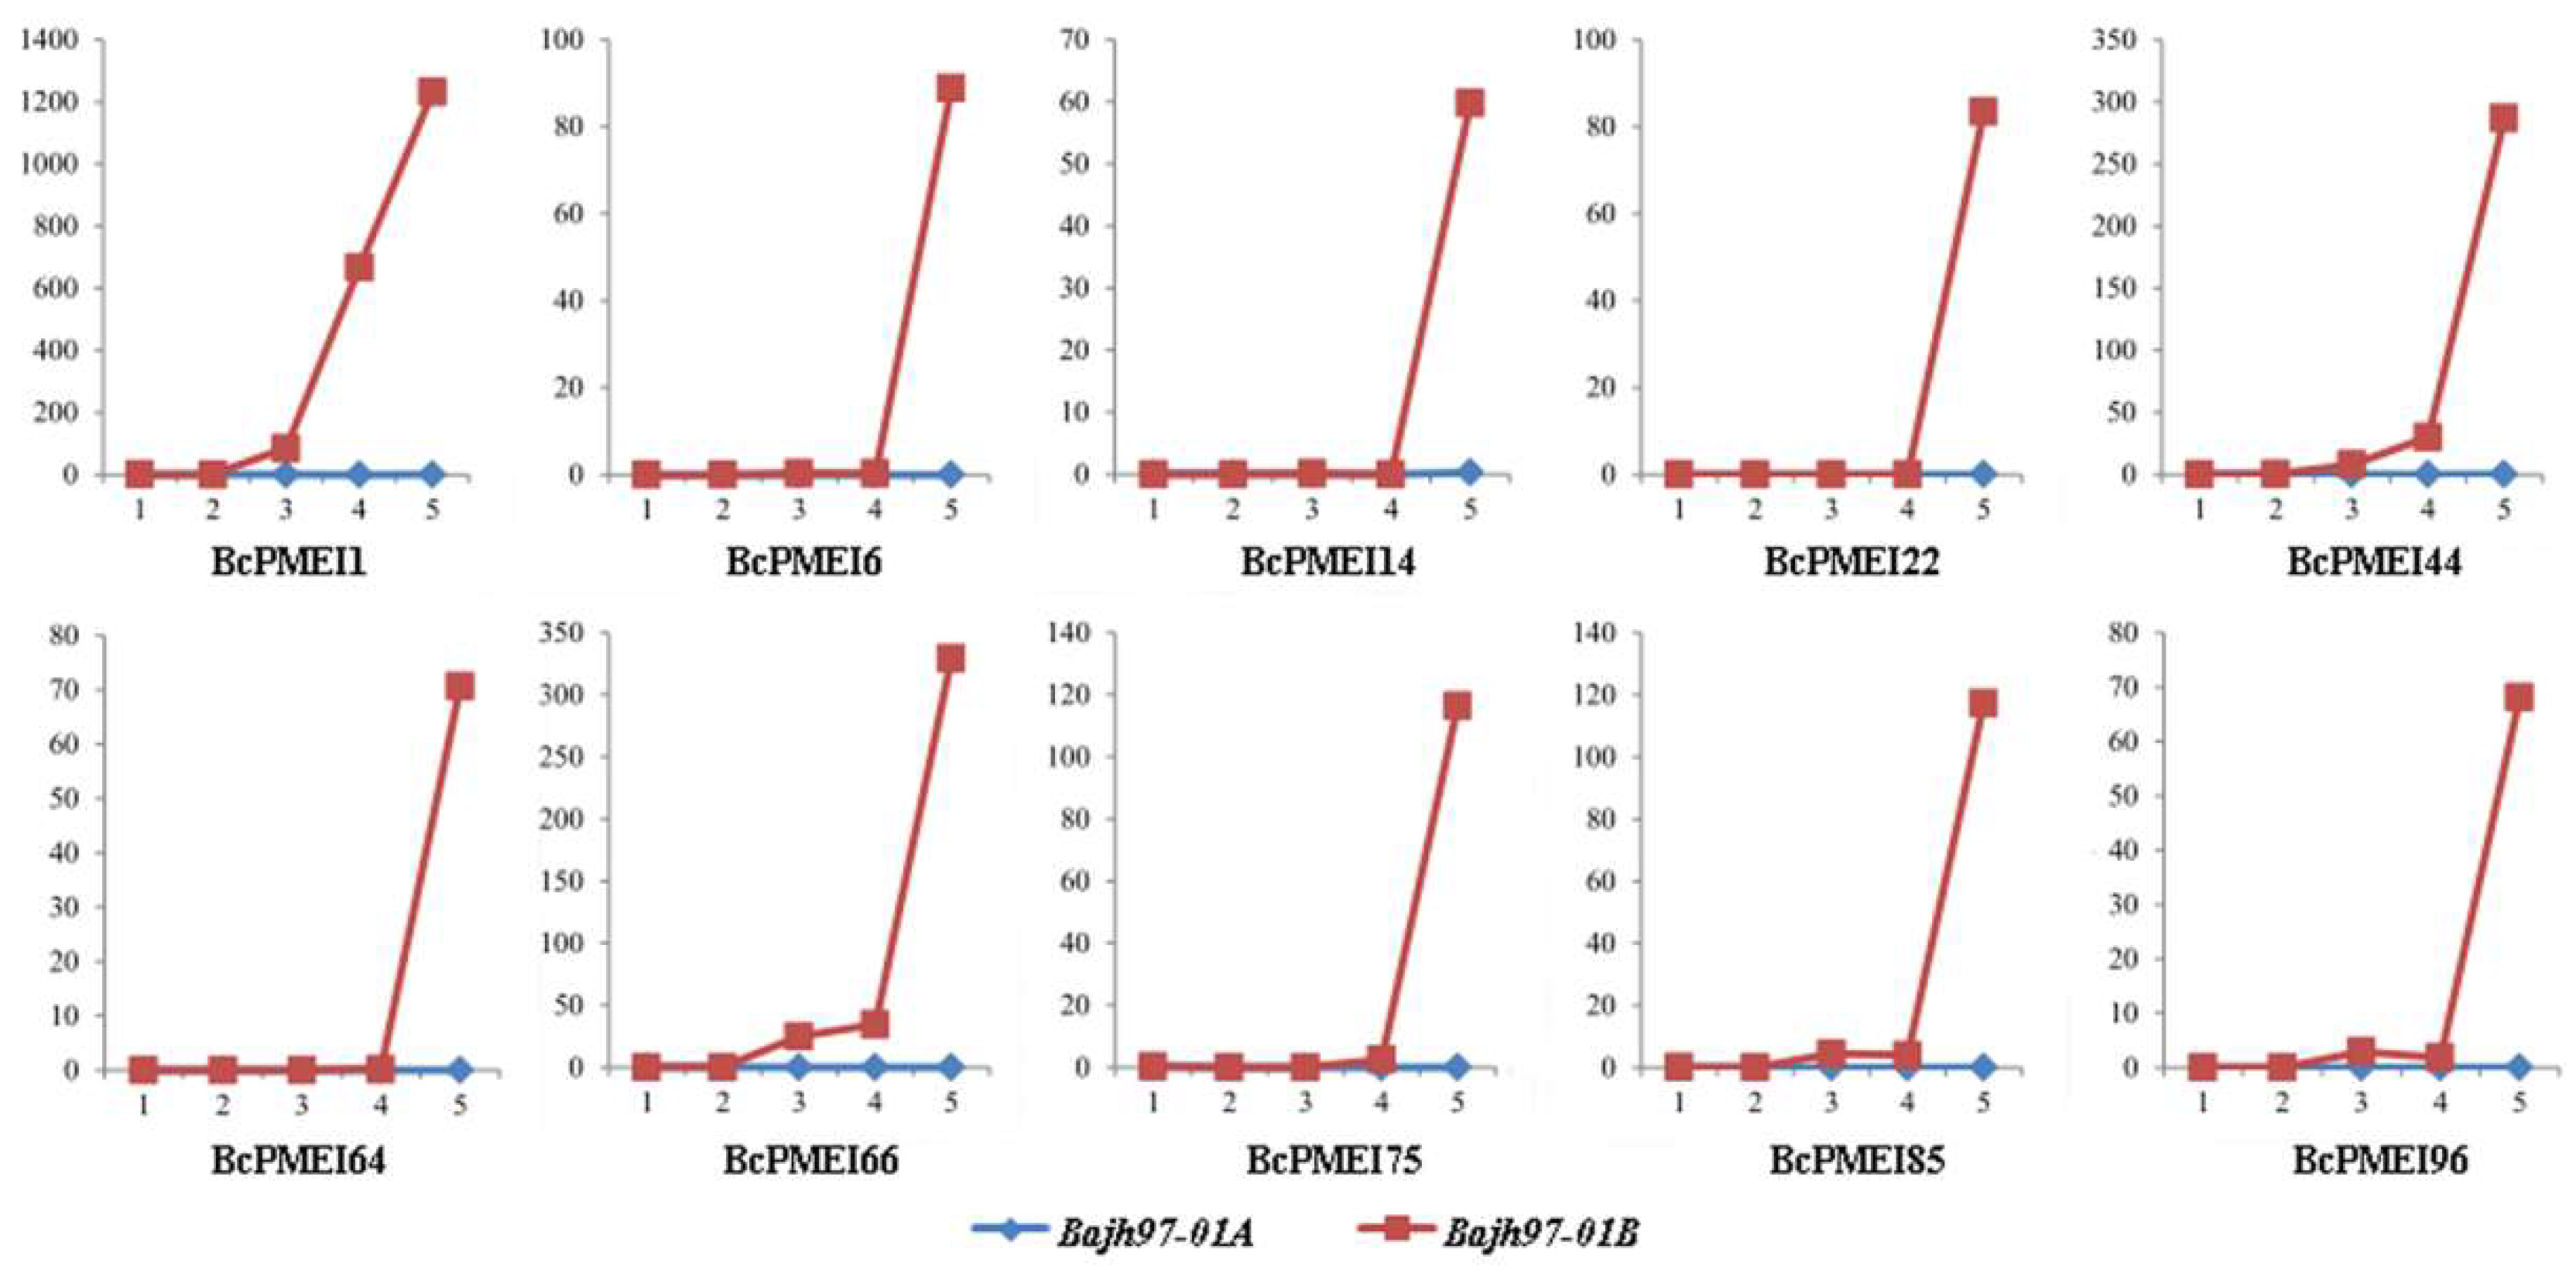
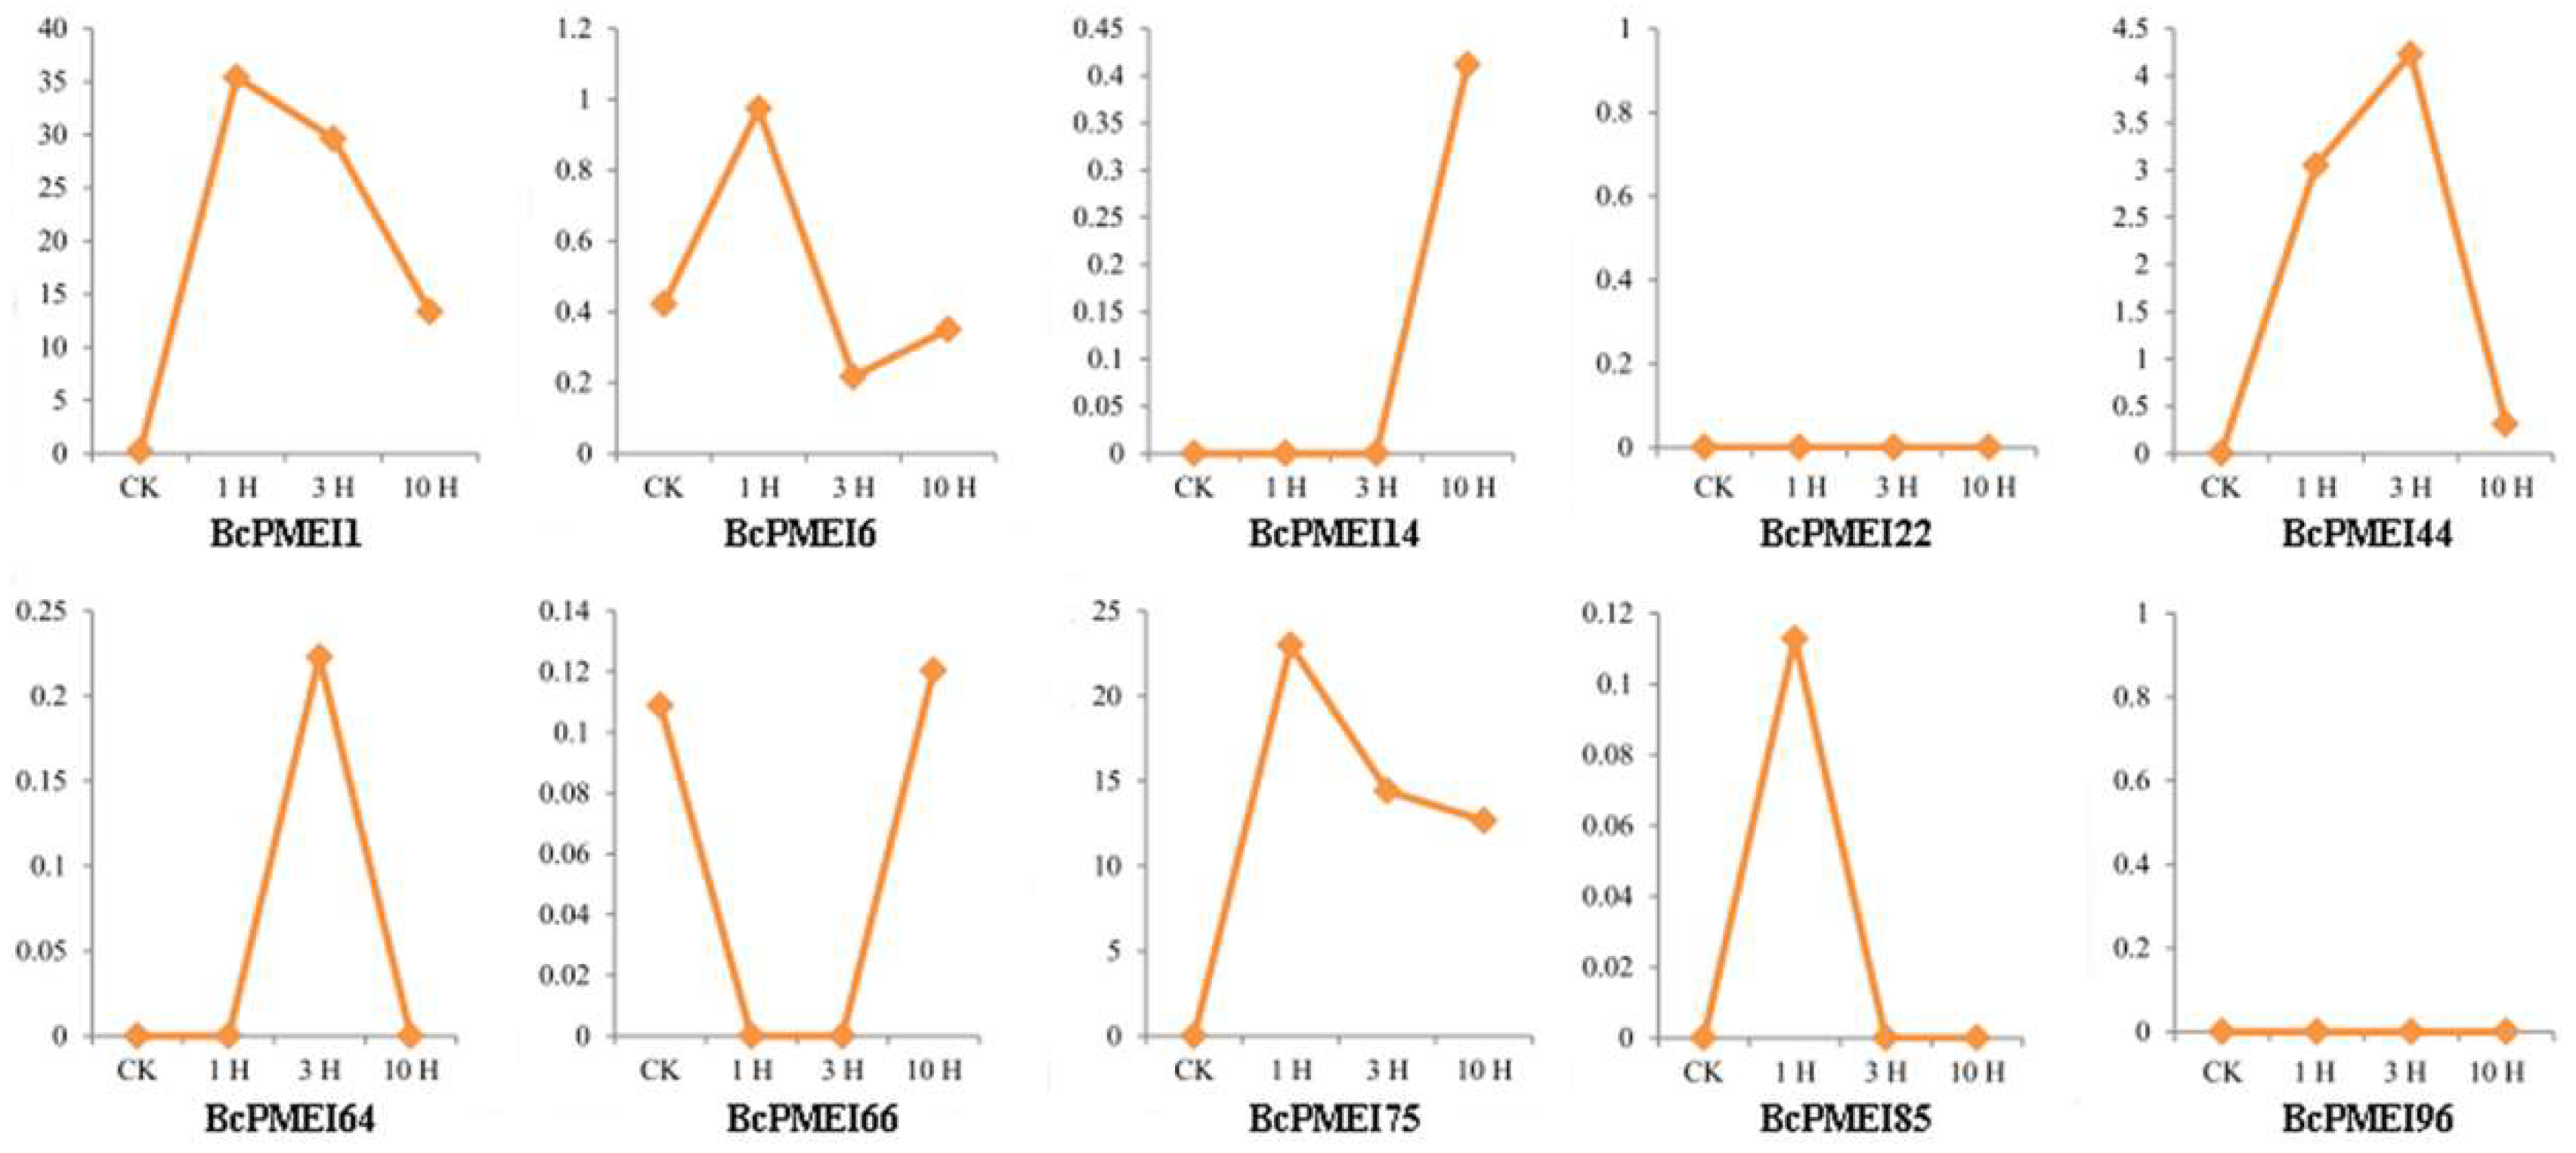
2.7. Roles of BcPMEIs in Pollen Development

The results of qRT-PCR showed that many BcPMEIs were specifically and highly expressed in inflorescences. Further, to explore the potential functions of BcPMEIs in pollen development, we used the Illumina RNA-Seq transcriptomic data of the “Bcajh97-01A/B” genic male sterile (GMS) line. In all, 10 BcPMEIs detected from the dataset showed high expressions in fertile flower buds but low or even no expression in sterile flower buds (Figure 7). All 10 BcPMEIs have the largest expression levels in stage V, and BcPMEI1, BcPMEI44, and BcPMEI66 also have relatively low expression levels in stage III and stage IV (Figure 8). In general, the genes that are expressed in mature pollen can go on expressing in pollen germination and pollen tube growth. So, we analyzed the expression levels of the 10 BcPMEIs in the pistils of the sterile line that were collected at 1, 3, and 10 h after pollination (HAP) in a fertile line. Only BcPMEI1 and BcPMEI75 were detected to be largely expressed in the pollinated pistils in the whole fertilization processes while the remaining eight BcPMEIs had very low or no expression in the pollinated pistils (Figure 9), indicating that BcPMEI1 and BcPMEI75 might be involved in pollen germination and pollen tube growth.

2.8. Cis-Elements in the Putative Promoter Regions of BcPMEIs

To further study the transcriptional regulation and potential functions of BcPMEIs, we identified and analyzed the cis-regulatory elements in their promoter regions by the PlantCARE website. A total of 22 cis-regulatory elements involved in hormone treatments (ABA, ethylene, GA, MeJA, and salicylic acid) and stress tolerance (fungus, drought, high or low temperature, hypoxia, light, salt, and wound) were analyzed (Table S6). Both ABA (ABRE and CE3) and IAA (AuxRE, AuxRR-core, and TGA-element) related cis-elements were found in the promoter regions of 38 BcPMEIs. GA (GARE-motif, P-box, and TATC-box) and MeJA (TGACG-motif and CGTCA-motif) related cis-elements were discovered in 58 and 44 promoters of BcPMEIs, respectively. In addition, we also identified the ethylene-responsive elements (ERE) and salicylic acid responsive elements (TCA-element) in 32 and 61 promoters of BcPMEIs, respectively. In response to various biotic and abiotic stresses, 63 promoters containing cis-acting elements involved in heat stress responsiveness (HSE) and 35 promoters containing the low-temperature responsive (LTR) elements were identified. We also found the MYB binding site (MBS) involved in drought responsiveness in 58 promoters and the MRE related to light responsiveness in 19 promoters. The cis-element essential for anaerobic induction was detected in up to 71 promoters of BcPMEIs, whereas only 15 promoters covered the wound-responsive element. These results implied that BcPMEIs might play significant roles in hormone regulation and stress responses.

2.9. The Microarray Data Analysis of PMEIs in Arabidopsis

The cis-elements analysis reveals that BcPMEIs are essential in mediating the responses to hormones and stresses. The expression profiles of AtPMEIs under several different hormones (ABA, GA, IAA, and MeJA) (Table S7) and stresses (cold, drought, heat, oxidation, salt, and wounding) (Table S8) were downloaded from the Bio-Analytic Resource database [37]. Given the close relationships between B. campestris and Arabidopsis, these data were used to further explore the impacts of hormones and stresses on the expression levels of PMEIs. In all, 48 AtPMEIs were detected by expression profile tags. Following the exogenous hormone treatments, the expression levels of AtPMEIs were changed and their variation trends were varied (Figure S4). Some PMEIs were markedly changed at the three treatment time points. Following ABA treatment, the expression of At1G14890, At4G12390, At4G25260, and At5G62360 were obviously downregulated while the expression of At1G47960 was markedly upregulated. After GA treatment, the expression levels of At5G62340 and At5G62350 were decreased at 0.5 hours after treatment (HAT) and were remarkably increased at 1 and 3 HAT. The obvious upregulation of the expression of At1G62770 and At5G62340, as well as the downregulation of the expression of At1G23205, At4G12390, and At5G62360, were observed in IAA treatment. Following MeJA treatment, the expression levels of At1G70720, At5G62350, and At5G62360 were markedly increased and that of At1G14890, At1G23205, and At4G12390 were decreased. Similarly, the microarray data analysis results of PMEIs under different stresses also revealed that many PMEIs are involved in the cold, drought, heat, oxidation, salt, and wounding regulation in A. thaliana.

3. Discussion

PMEIs play crucial roles in pectin remodeling and disassembly by regulating the activity of PMEs in plant growth and development [38]. In 1990, PMEIs were first found in kiwi (Actinidia deliciosa) [39]. To date, PMEIs have been investigated in many plant species, such as Arabidopsis, broccoli, grape, maize, pepper, and tomato, and were been identified to be a large multigene family [9,11,18,32,40,41,42]. In this study, 100 PMEIs were identified in B. campestris (Table S1). The number of PMEIs changed greatly in different plants that more PMEIs were detected in dicots than that in monocots with 95 members in flax, 78 in Arabidopsis, and 49 in rice [29,30,31]. This phenomenon is in accordance with the finding that pectin is more abundant in dicots than in monocots [43,44].
As has been reported, A. thaliana, the model plant, has experienced three WGD events: a γ event shared with most dicots and two subsequent genome duplications (α and β) shared with other members of the order Brassicales [25]. B. campestris, which shares a common ancestor with Arabidopsis, also experienced the three abovementioned WGD events. Approximately 13 to 17 MYA, B. campestris underwent another WGT event, resulting in the divergence of the genome between it and A. thaliana [27,28]. In this study, the number of PMEIs identified in B. campestris (100) was higher than that in A. thaliana (78). The PMEIs in B. campestris were distributed in the 10 chromosomes unevenly and up to 80 syntenic PMEI ortholog pairs were identified between the genome of B. campestris and A. thaliana (Figure 3). These findings provide the evidence that WGT results in the expansion of the PMEI gene family in B. campestris. TD is another crucial mode of gene expansion. Up to 2137, 1569, 1751, and 1135 tandemly duplicated clusters were discovered in B. campestris, A. thaliana, A. lyrata, and T. parvula, respectively [45]. Among the 100 BcPMEIs, we detected 9 tandem arrays containing 20 BcPMEIs (Figure 2), indicating that TD also contributes a lot to the expansion of PMEI gene family in B. campestris. WGD and TD are the main ways to account for the expansion of BcPMEIs, similar to the PMEI family in A. thaliana [32].
During the evolution of plants, diploidization always occurs after WGD and is usually accompanied by substantial gene fractionation [46]. In Arabidopsis, 27,411 genes were identified, so the B. campestris genome was supposed to have approximately 90,000 genes because of the WGT event. However, only 41,174 members were detected in the newly formed hexaploid in fact [26]. This case is representative of the considerable gene fractionation that happens following polyploid formation in eukaryotes [47,48,49]. In our work, only 100 PMEIs were identified in the genome of B. campestris, much less than the three times of 78 PMEIs in A. thaliana (Table S1), suggesting that many BcPMEIs were lost after WGT. The collapse of the BcPMEI gene complement might result from the genome-level gene loss. To investigate the fractionation extent of BcPMEIs after WGT, we calculated the reserved rate of BcPMEIs and compared it with the reserved rates of two other gene sets: a set of 458 randomly selected genes and 458 core eukaryotic genes (Figure 4). The result manifested that BcPMEIs were preferentially retained with a retention proportion of 52% (Figure 4a). This phenomenon is consistent with the gene dosage hypothesis, which proposes that genes whose products interact either with other proteins or in networks are more likely to be retained, to avoid the stoichiometric imbalances among the products [50,51]. In the metabolic network of pectin in cell walls, PMEIs play a crucial part and are highly connected with other enzymes, including PMEs, polygalacturonases (PGs), and pectate lyases (PLs) [52]. In B. campestris, the three subgenomes, namely LF, MF1, and MF2, were named according to the extent of gene fractionation relative to A. thaliana since 13–17 MYA. Approximately 70%, 46%, and 36% of the genes found in Arabidopsis were retained in LF, MF1, and MF2 subgenomes, respectively [26]. In this work, BcPMEIs were also identified to be biasedly retained (Figure 4c). More BcPMEIs were reserved in LF subgenome than that in MF subgenomes, and more BcPMEIs were reserved in MF1 subgenome than that in MF2 subgenome, in accordance with the previous study [26]. These results can be explained by a ‘two-step theory’, which supposes that MF1 and MF2 subgenomes underwent two rounds of gene fractionation and LF subgenome only under one round, therefore MF1 and MF2 subgenomes lost more genes than LF subgenome [53].
To explore the selection type of genes after duplication, the Ka and Ks modes of ortholog and paralog pairs were analyzed. Taking advantage of the commonly used estimate of the mutational rate of 1.5 synonymous substitutions per 108 years, we calculated the divergence time [54]. The average duplication time of the 84 pairs of orthologs was 16.67 MYA (Figure 5a, Table S4), which was in accordance with the divergence time of B. campestris and Arabidopsis [26]. Additionally, among the three subgenomes, the average duplication time of the 52 BcPMEI paralog pairs was 16.17 MYA (Figure 5c, Table S5), in accordance with the formation time of the three subgenomes in B. campestris. Most of the homologous gene pairs experienced purifying selection, indicating that these genes were strongly controlled in evolution. Only one ortholog pair and one paralog pair have a ω ratio larger than 1 (Figure 5b,d), suggesting that novel functions were likely to generate among these genes. This is the same as some other gene families in plants, such as TCS of tomato, GRAS of Medicago truncatula, and NF-YB of Gossypium hirsutum, of which most homolog pairs evolve through purifying selection and few or even no gene experience positive selection [55,56,57].
Many studies have demonstrated that PMEIs play important parts in plant growth and development. AtPMEI1 and AtPMEI2, mainly detected in anthers and pollen, have an important function during pollen development [41]. AtPMEI4 can regulate the growth acceleration of the dark-grown seedlings [10] and AtPMEI6 is involved in seed maturation and germination [16]. Generally, gene expression patterns can offer helpful information for studying gene functions. In our work, the expression profiles of the 100 BcPMEIs in five different tissues were analyzed and 90% of the BcPMEIs could be detected in at least one tissue (Figure 6). As many BcPMEIs displayed a high and/or specific expression level in inflorescences, we conducted a further analysis to search candidate BcPMEIs that may be related to pollen development using the RNA-seq data (A1–A5, B1–B5). As shown in Figure 8, 10 BcPMEIs were identified to have specific expressions in the fifth stage of the fertile flower buds except for three genes, which were also expressed in the third and fourth stages (Figure 8). This finding is in accordance with the results of GUS staining (Figure 7). Also, among the 10 BcPMEIs, BcPMEI44, BcPMEI55, and BcPMEI73 might be closely related to male sterility [14]. Considering that genes highly expressed in mature pollen generally keep being expressed in pollen germination and pollen tube growth, we also explored the expression levels of the 10 genes in pistils at 1, 3, and 10 HAP. Two members, BcPMEI1 and BcPMEI75, were identified to be expressed in pistils in the whole process of fertilization (Figure 9), suggesting that they might be involved in the pollen germination and pollen tube growth. BoPMEI1, specifically expressed in mature pollen and pollen tubes, can suppress the expression of its orthologous gene At1G10770 and causes the male sterility of the transgenic Arabidopsis by impairing pollen tube growth [9]. Coincidentally, At1G10770 is also the orthologous gene of BcPMEI1. We speculate that BcPMEI1 is more likely to play critical parts in the pollen tube growth of B. campestris. Pollen tube growth contains cell wall synthesis and expansion, which are influenced by the PME activity [58]. The activity of PMEs is regulated by PMEIs, hence PMEIs can function in pollen tube growth by affecting the cell wall stability [59].
Increasing evidence proved that PMEIs are involved in hormone regulation and stress tolerance by controlling the biophysical properties of plant cell walls. Transgenic Arabidopsis plants with ectopic CaPMEI1 expression show reduced sensitivity to oxidative and drought stresses [18]. An Arabidopsis mutant with T-DNA insertion in the promoter region of a PMEI gene (AtPMEI10) presents enhanced resistance to salinity stress [60]. When overexpressed an Arabidopsis PMEI gene, AtPMEI5, the PME activity of transgenic seed is decreased and the degree of cell wall pectin methylesterification is increased; the speed of seed germination is faster and the sensitivity of seed to the inhibitory effects of ABA on germination is lowered [10]. AtPMEI10, AtPMEI11, and AtPMEI12 were identified as functional PME inhibitors that can control the integrity of cell walls to fight against the Botrytis attack; the expressions of AtPMEI11 and AtPMEI12 are strictly mediated by Jasmonic Acid and Ethylene signaling [13]. In this work, many cis-regulatory elements related to the responses of different hormone treatments including ABA, IAA, MeJA, and GA, and different stresses, including anaerobism, cold, heat, drought, salt, and fungus were detected (Table S6). BcPMEI17 has up to 27 related cis-elements, with 10 cis-elements involved in MeJA responsiveness and 4 cis-elements involved in heat responsiveness. Among the 26 cis-elements detected in the promoter of BcPMEI90, 11 cis-elements were related to anaerobic responsiveness and 4 cis-elements were related to ABA responsiveness. In addition, the analysis results of the microarray data of 48 AtPMEIs revealed that many PMEIs can be strongly induced in response to some exogenous hormones and stresses (Tables S8 and S9). However, further researches are required to investigate the detailed regulatory mechanisms of PMEIs in B. campestris under different stimuli.

4. Materials and Methods

4.1. Plant Materials

The Chinese cabbage-pak-choi ‘Aijiaohuang’ (B. campestris L. ssp. chinensis Makino cv. Aijiaohuang) named ‘Bajh97-01A/B’ provides the materials used for the expression analysis in this study. It was a GMS system and was developed by continuous backcross for more than 10 years. The progenies of ‘Bajh97-01A/B’ were segregated into a homozygous male sterile line (Bcajh97-01A) and a heterozygous male fertile line (Bcajh97-01B) with a 1:1 ratio. The only difference presented between the sibling (sister) lines is that ‘Bcajh97-01A’ is in a complete absence of mature pollen compared with that of ‘Bcajh97-01B’ [61,62]. This feature makes ‘Bajh97-01A/B’ become an ideal material to explore the genes closely related to pollen development.
The ‘Bcajh97-01A/B’ was grown under natural conditions in an experimental farm at Zhejiang University, China. To study the expression profiles of BcPMEIs in roots, stems, leaves, inflorescences, and siliques of ‘Bcajh97-01B’, the five organs were sampled from 15 individual plants at the flowering stage. Before RNA extraction, all the materials were frozen in liquid nitrogen immediately after collected and stored at –80 °C.
According to the results of the cytological examination described in previous studies [63,64], the flower buds were classified into five stages: stage I, pollen mother cell stage; stage II, tetrad stage; stage III, uninucleate microspore stage; stage IV, binucleate microspore stage; and stage V, mature pollen stage. In ‘Bcajh97-01A’ and ‘Bcajh97-01B’ plants, the flower buds at five pollen development stages were named as A1–A5 and B1–B5, respectively. In addition, pistils in the sterile ‘Bcajh97-01A’ pollinated by the pollen of fertile plants were sampled at 1, 3, and 10 HAP [64]. To study the potential functions of BcPMEIs in the pollen development of B. campestris, we used the Illumina RNA-seq data of ‘Bcajh97-01A/B’. Of the dataset, A1–A5, B1–B5, the unpollinated pistils, and the pollinated pistils sampled at 1, 3, and 10 HAP were analyzed.

4.2. Identification of PMEIs in B. campestris

The genome-wide protein sequences of B. campestris were retrieved from the Brassica database (BRAD, http://brassicadb.org/brad/, V1.5) [65]. The hidden Markov model (HMM) file of PMEI domain (PF04043) was obtained from Pfam 31.0 (http://pfam.xfam.org/) [66] and was used as a query in the following HMM analysis. Then, the HMMER V3.0 software was used to search candidate PMEI protein sequences in the B. campestris protein genome with default values. Meanwhile, the protein sequences of 78 Arabidopsis thaliana PMEIs (AtPMEIs) [31] and 49 Oryza sativa PMEIs (OsPMEIs) were downloaded from The Arabidopsis Information Resource (TAIR, http://www.arabidopsis.org/) and Rice Genome Annotation Project (http://rice.plantbiology.msu.edu/) [67], respectively, and were used as queries to conduct the BLASTP search in BRAD with default parameters. Finally, we used the SMART (http://smart.embl-heidelberg.de/) [68] and Pfam databases to further confirm the presence of PMEI domain (PF04043). The identified BcPMEIs were named based on their orders in chromosomes or scaffolds, from top to bottom.

4.3. Phylogenetic, Gene Structural, and Physicochemical Properties Analysis

The protein, coding, and genomic sequences of BcPMEIs used in the following analysis were retrieved from BRAD [65]. The full-length protein sequence alignments of PMEIs were conducted by the ClustalW program of MEGA6.0 with the default parameters [69,70]. Then the MEGA6.0 software was used to construct the phylogenetic tree with the statistical method of neighbor-joining (NJ), the bootstrap replications of 1000, the model/method of passion, the rates among sites of uniform, and the gaps/missing data treatment of pairwise deletion. The exon–intron structures of BcPMEIs were analyzed by Gene Structure Display Server 2.0 (GSDS 2.0) (http://gsds.cbi.pku.edu.cn/index.php) [71]. The intron phases were also analyzed with phases 0, 1, and 2, which were assigned to the introns located between codons, the introns located between the first and second nucleotides of a codon, and the introns located between the second and third nucleotides of a codon, respectively. Plant-mPLoc (http://www.csbio.sjtu.edu.cn/bioinf/plant-multi/) was used to analyze the subcellular localization of PMEI proteins [72]. PROTEIN CALCULATOR v3.4 (http://protcalc.sourceforge.net/) was used to compute theoretical isoelectric point and molecular weight and SMART was used to analyze signal peptide sequence. TMHMM Server V2.0 (http://www.cbs.dtu.dk/services/TMHMM/) [73] was taken advantage to predict transmembrane helices (TMHs) in BcPMEI proteins.

4.4. Motif Recognition, Putative Promoter Region Analysis, and Promoter::GUS Fusion Construction

The online program of Multiple Em for Motif Elicitation (MEME Version 4.11.4) (http://meme-suite.org/tools/meme) [74] was used to explore the distributions of BcPMEI protein motifs and the parameters were set up as below: number of repetitions, any; width of the motif, 6–50; and maximum number of motifs, 10. To analyze the cis-elements in promoter sequences of BcPMEIs, the upstream sequences (1.5 kb) of the initiation codon (ATG) for BcPMEIs were extracted from BRAD. Then the PlantCARE website (http://bioinformatics.psb.ugent.be/webtools/plantcare/html/) [75] was used to identify the cis-elements in promoter regions. The predicted promoter sequences of two BcPMEIs were amplified from the genomic DNAs of B. campestris using the gene-specific primers (Table S9) and cloned into the binary vector pBI101. The resulting constructs were transferred into Agrobacterium tumefaciens and then transformed into Arabidopsis. The inflorescences of the transgenic Arabidopsis plants were used to detect GUS activity as previously described [76]. Stages of flower development in Arabidopsis were confirmed on the basis of a previous study [77].

4.5. Chromosome Location, Synteny, Retained Rate, and Evolutionary Analysis

The precise positions of PMEIs on the B. campestris chromosomes were derived from the Brassica Genome Browse (http://brassicadb.org/cgi-bin/gbrowse/Brassica_v1.5/) and the Mapinspect and Adobe Photoshop CC software were used to draw the map. The chromosomal positions of AtPMEIs were obtained from TAIR. The syntenic relationships between AtPMEIs and BcPMEIs were identified by searching “syntenic gene” (http://brassicadb.org/brad/searchSyntenytPCK.php) in BRAD [33]. Furthermore, the information of 24 conserved collinear blocks of ancestral karyotype (A-K) in B. campestris and Arabidopsis was acquired from a previous research [78]. Circos 5.05 software was used to display the colinearity of PMEIs in or between B. campestris and A. thaliana genomes [79]. To compute the retention rates, we used the term “locus” to replace “gene”, which can exclude the interferences of tandem duplication after WGT [80]. The full-length amino acid sequence alignments were performed by Clustal Omega (http://www.ebi.ac.uk/Tools/msa/clustalo/) and then Ka, Ks and ω ratio (Ka/Ks) were counted using the PAL2NAL by the codeml program in PAML (http://www.bork.embl.de/pal2nal/index.cgi?example=Yes#RunP2N) [81,82]. The divergence time was calculated by the following equation: T = Ks/2R (R = 1.5 × 10⁻⁸ for dicotyledonous plants) [54].

4.6. RNA Isolation and Expression Profile Analysis

The total RNA was extracted from roots, stems, leaves, inflorescences, and siliques using Trizol reagent (Invitrogen, Carlsbad, CA, USA) treated with DNAase on the basis of the manufacturer-recommended protocol. The PrimerScript RT reagent kit (TaKaRa, Shiga, Japan) was used to reverse-transcribe total RNA into the first strand of complementary DNA. The gene expression was measured by applying diluted cDNA in a SYBR Premix Ex Taq Kit (TOYOBO, Osaka, Japan) with CFX96 Real-Time System (Bio-Rad, Hercules, CA, USA). BcUBC10 was used as internal control [83]. The gene-specific primers listed in Table S10 were designed by the Primer Premier 5.0 software and the BLASTN page of BRAD was used to verify the specificity of each primer. QRT-PCR was carried out in triplicate. The qRT-PCR conditions were optimized to consist of an initial denaturation for 30 s at 95 °C, followed by 40 cycles of 5 s at 95 °C and 30 s at 55 °C, and at the end, 1 cycle of 10 s at 95 °C, 5 s at 65 °C and 5 s at 95 °C. The 2−ΔΔCt method was applied to compute the relative expression levels of different genes [84] and the Heatmap Illustrator (HemI 1.0) (http://hemi.biocuckoo.org/index.php) was used to make the results of qRT-PCR in a heat map [85]. In addition, to know the impacts of different hormones and stresses on the expression levels of PMEIs, the values of AtPMEIs treated with 10 µM ABA, 1 µM GA, 1 µM IAA, 10 µM MeJA, cold, salt, heat, drought, oxidation, and wounding were download from the Bio-Analytic Resource database (http://bar.utoronto.ca/affydb/cgi-bin/affy_db_exprss_browser_in.cgi) [37].

5. Conclusions

In this study, a genome-wide analysis of the PMEI gene family in B. campestris was carried out on the base of publicly available genome data. A total of 100 BcPMEIs were identified with 96 members unevenly distributed on 10 chromosomes and four members distributed on different scaffolds. In the evolutionary process, the PMEI gene family of B. campestris was expanded mainly because of WGT and TD. During diploidization after WGT, BcPMEIs were preferentially and biasedly retained. The evolution analysis suggested that most of the duplicated genes evolved through purifying selection, indicating the strong controls among these genes. In the analyses of qRT-PCR and RNA-seq data, 10 BcPMEIs were identified to be involved in pollen development, among which two genes might play important roles in pollen germination and pollen tube growth. Furthermore, the promoter analysis results suggested that BcPMEIs might be closely related with the responses to multiple stimuli. This work will be beneficial to understand the molecular evolution of BcPMEIs and select proper candidate genes for further functional characterization.

Supplementary Materials

Supplementary materials can be found at https://www.mdpi.com/1422-0067/19/5/1338/s1. Figure S1: Phylogenetic relationships of the 100 BcPMEIs. The phylogenetic tree was carried out using MEGA 6 by the neighbor-joining (NJ) analysis with 1000 replicates. Bootstrap values less than 50 are not shown. This tree was classified into five phylogenetic subgroups marked with different colors. Figure S2: The sequences of 10 motifs identified from the 100 BcPMEIs. Figure S3: Box plots of Ks values (a) and Ka/Ks values (b) of the PMEI ortholog pairs between each of the three Brassica campestris subgenomes and Arabidopsis. Figure S4: Relative expression levels of AtPMEIs under ABA (a), GA (b), IAA (c), and MeJA (d) treatments, respectively. Table S1: Basic information of the PMEI gene family in Brassica campestris. Table S2: The homologous relationships between BcPMEIs and AtPMEIs. BcPMEIs in black have syntenic relationships to their corresponding AtPMEIs. BcPMEIs in red are nonsyntenic orthologs to their corresponding AtPMEIs. BcPMEIs in bold are not sure which subgenomes they are on. tPCK Chr, Chromosome of translocation Proto-Calepineae Karyotype, ancestral genome of Brassica species. Table S3: Orthologous genes of AtPMEIs and BcPMEIs in sequenced Brassicaceae species. Aar, Aethionema arabicum; Aly, Arabidopsis lyrata; Ath, Arabidopsis thaliana; Bna, Brassica napus; Bol, Brassica oleracea; Bra, Brassica rapa; Cru, Capsella rubella; Csa, Camelina sativa; Lal, Leavenworthia alabamica; Sir, Sisymbrium irio; Spa, Schrenkiella parvula; Tha, Thellungiella halophila; Tsa, Thellungiella salsuginea. Table S4: Ka, Ks, Ka/Ks, and divergent time calculation of the PMEI ortholog pairs between the Brassica campestris and Arabidopsis thaliana genomes. Table S5: Ka, Ks, Ka/Ks, and divergent time calculation of PMEI paralog pairs in Brassica campestris genome. Table S6: Cis-element analysis in the promoter regions of BcPMEIs. Table S7: Relative expression levels of AtPMEIs under different hormone treatments. Table S8: Relative expression levels of AtPMEIs under different stresses. Table S9: Gene primers used in the promoter amplification of BcPMEIs. Table S10: Gene primers for the qRT-PCR analysis of PMEIs in Brassica campestris.

Author Contributions

Tingting Liu and Jiashu Cao conceived and designed the research. Tingting Liu and Hui Yu performed the experiments. Tingting Liu, Xingpeng Xiong, and Xiaoyan Yue analyzed the data. Tingting Liu wrote the paper. Li Huang revised the manuscript. All authors read and approved the final manuscript.

Funding

This work was supported by the National Natural Science Foundation of China (Grant number 31471877).

Conflicts of Interest

The authors declare no conflict of interest.

Abbreviations

AtPMEIsArabidopsis thaliana PMEI genes
BcPMEIsBrassica campestris PMEI genes
BRADbrassica database
GMSgenic male sterile
HAPhour after pollination
HAThour after treatment
HMMhidden Markov model
HGhomogalacturonan
Kanonsynonymous substitution rate
Kssynonymous substitution rate
LFleast fractionated subgenome
MEMEmultiple em for motif elicitation
MF1medium fractionated subgenome
MF2most fractionated subgenome
MYAmillion years ago
NJneighbor-joining
PGspolygalacturonases
PLspectate lyases
PMEspectin methylesterases
PMEIspectin methylesterase inhibitors
qRT-PCRquantitative real-time PCR
RGIrhamnogalacturonan I
RGIIrhamnogalacturonan II
TAIRthe arabidopsis information resource
TDtandem duplication
WGTwhole genome triplication
WGDwhole genome duplication
XGAxylogalacturonan

References

  1. Varner, J.E.; Lin, L.S. Plant cell wall architecture. Cell 1989, 56, 231–239. [Google Scholar] [CrossRef]
  2. Micheli, F. Pectin methylesterases: Cell wall enzymes with important roles in plant physiology. Trends Plant Sci. 2001, 6, 414–419. [Google Scholar] [CrossRef]
  3. Caffall, K.H.; Mohnen, D. The structure, function, and biosynthesis of plant cell wall pectic polysaccharides. Carbohydr. Res. 2009, 344, 1879–1900. [Google Scholar] [CrossRef] [PubMed]
  4. Popper, A.; Michel, G.; Domozych, D.S.; Tuohy, M.G.; Kloareg, B.; Stengel, D.B. Evolution and diversity of plant cell walls: From algae to flowering plants. Annu. Rev. Plant Biol. 2011, 62, 567–590. [Google Scholar] [CrossRef] [PubMed]
  5. Lionetti, V.; Cervone, F.; Bellincampi, D. Methyl esterification of pectin plays a role during plant–pathogen interactions and affects plant resistance to diseases. J. Plant Physiol. 2012, 169, 1623–1630. [Google Scholar] [CrossRef] [PubMed]
  6. Bellincampi, D.; Cervone, F.; Lionetti, V. Plant cell wall dynamics and wall-related susceptibility in plant–pathogen interactions. Front. Plant Sci. 2014, 5, 228. [Google Scholar] [CrossRef] [PubMed]
  7. Ridley, B.L.; Oneill, M.A.; Mohnen, D. Pectins: Structure, biosynthesis, and oligogalacturonide-related signaling. Phytochemistry 2001, 57, 929–967. [Google Scholar] [CrossRef]
  8. Giovane, A.; Servillo, L.; Balestrieri, C.; Raiola, A.; D’Avino, R.; Tamburrini, M.; Ciardiello, M.A.; Camardella, L. Pectin methylesterase inhibitor. Biochim. Biophys. Acta 2004, 1696, 245–252. [Google Scholar] [CrossRef] [PubMed]
  9. Zhang, G.Y.; Feng, J.; Wu, J.; Wang, X.W. BoPMEI1, a pollen-specific pectin methylesterase inhibitor, has an essential role in pollen tube growth. Planta 2010, 231, 1323–1334. [Google Scholar] [CrossRef] [PubMed]
  10. Pelletier, S.; Van Orden, J.; Wolf, S.; Vissenberg, K.; Delacourt, J.; Ndong, Y.A.; Pelloux, J.; Bischoff, V.; Urbain, A.; Mouille, G.; et al. A role for pectin de-methylesterification in a developmentally regulated growth acceleration in dark-grown Arabidopsis hypocotyls. New Phytol. 2010, 188, 726–739. [Google Scholar] [CrossRef] [PubMed]
  11. Reca, I.B.; Lionetti, V.; Camardella, L.; D’Avino, R.; Giardina, T.; Cervone, F.; Bellincampi, D. A functional pectin methylesterase inhibitor protein (SolyPMEI) is expressed during tomato fruit ripening and interacts with PME-1. Plant Mol. Biol. 2012, 79, 429–442. [Google Scholar] [CrossRef] [PubMed]
  12. Muller, K.; Levesque-Tremblay, G.; Bartels, S.; Weitbrecht, K.; Wormit, A.; Usadel, B.; Haughn, G.; Kermode, A.R. Demethylesterification of cell wall pectins in Arabidopsis plays a role in seed germination. Plant Physiol. 2013, 161, 305–316. [Google Scholar] [CrossRef] [PubMed]
  13. Lionetti, V.; Fabri, E.; De Caroli, M.; Hansen, A.R.; Willats, W.G.T.; Piro, G.; Bellincampi, D. Three pectin methylesterase inhibitors protect cell wall integrity for immunity to Botrytis. Plant Physiol. 2017, 173, 1844–1863. [Google Scholar] [CrossRef] [PubMed]
  14. Tan, C.; Liu, Z.; Huang, S.; Li, C.; Ren, J.; Tang, X.; Liu, W.; Peng, S.; Feng, H. Pectin methylesterase inhibitor (PMEI) family can be related to male sterility in Chinese cabbage (Brassica rapa ssp. pekinensis). Mol. Genet. Genom. 2017, 293, 243–357. [Google Scholar] [CrossRef] [PubMed]
  15. Peaucelle, A.; Louvet, R.; Johansen, J.N.; Hofte, H.; Laufs, P.; Pelloux, J.; Mouille, G. Arabidopsis phyllotaxis is controlled by the methyl-esterification status of cell-wall pectins. Curr. Biol. 2008, 18, 1943–1948. [Google Scholar] [CrossRef] [PubMed]
  16. Saez-Aguayo, S.; Ralet, M.C.; Berger, A.; Botran, L.; Ropartz, D.; Marion-Poll, A.; North, H.M. Pectin methylesterase inhibitor6 promotes Arabidopsis mucilage release by limiting methylesterification of homogalacturonan in seed coat epidermal cells. Plant Cell 2013, 25, 308–323. [Google Scholar] [CrossRef] [PubMed]
  17. Nguyen, H.P.; Jeong, H.Y.; Jeon, S.H.; Kim, D.; Lee, C. Rice pectin methylesterase inhibitor28 (OsPMEI28) encodes a functional PMEI and its overexpression results in a dwarf phenotype through increased pectin methylesterification levels. J. Plant Physiol. 2017, 208, 17–25. [Google Scholar] [CrossRef] [PubMed]
  18. An, S.H.; Sohn, K.H.; Choi, H.W.; Hwang, I.S.; Lee, S.C.; Hwang, B.K. Pepper pectin methylesterase inhibitor protein CaPMEI1 is required for antifungal activity, basal disease resistance and abiotic stress tolerance. Planta 2008, 228, 61–78. [Google Scholar] [CrossRef] [PubMed]
  19. Freeling, M. Bias in plant gene content following different sorts of duplication: Tandem, whole-genome, segmental, or by transposition. Annu. Rev. Plant Biol. 2009, 60, 433–453. [Google Scholar] [CrossRef] [PubMed]
  20. Wang, Y.; Wang, X.; Tang, H.; Tan, X.; Ficklin, S.P.; Feltus, F.A.; Paterson, A.H. Modes of gene duplication contribute differently to genetic novelty and redundancy, but show parallels across divergent angiosperms. PLoS ONE 2011, 6, e28150. [Google Scholar] [CrossRef] [PubMed]
  21. Edger, P.P.; Pires, J.C. Gene and genome duplications: The impact of dosage-sensitivity on the fate of nuclear genes. Chromosome Res. 2009, 17, 699–717. [Google Scholar] [CrossRef] [PubMed]
  22. Yan, C.; Duan, W.; Lyu, S.; Li, Y.; Hou, X. Genome-wide identification, evolution, and expression analysis of the ATP-binding cassette transporter gene family in Brassica rapa. Front. Plant Sci. 2017, 8, 349. [Google Scholar] [CrossRef] [PubMed]
  23. Warwick, S.I.; Francis, A.; Alshehbaz, I.A. Brassicaceae: Species checklist and database on CD-Rom. Plant Syst. Evol. 2006, 259, 249–258. [Google Scholar] [CrossRef]
  24. Bailey, C.D.; Koch, M.A.; Mayer, M.S.; Mummenhoff, K.; Okane, S.L.; Warwick, S.I.; Windham, M.D.; Alshehbaz, I.A. Toward a global phylogeny of the Brassicaceae. Mol. Biol. Evol. 2006, 23, 2142–2160. [Google Scholar] [CrossRef] [PubMed]
  25. Bowers, J.E.; Chapman, B.A.; Rong, J.; Paterson, A.H. Unravelling angiosperm genome evolution by phylogenetic analysis of chromosomal duplication events. Nature 2003, 422, 433. [Google Scholar] [CrossRef] [PubMed]
  26. Wang, X.; Wang, H.; Wang, J.; Sun, R.; Wu, J.; Liu, S.; Bai, Y.; Mun, J.H.; Bancroft, I.; Cheng, F.; et al. The genome of the mesopolyploid crop species Brassica rapa. Nat. Genet. 2011, 43, 1035–1039. [Google Scholar] [CrossRef] [PubMed]
  27. Town, C.D.; Cheung, F.; Maiti, R.; Crabtree, J.; Haas, B.J.; Wortman, J.R.; Hine, E.E.; Althoff, R.; Arbogast, T.S.; Tallon, L.J.; et al. Comparative genomics of Brassica oleracea and Arabidopsis thaliana reveal gene loss, fragmentation, and dispersal after polyploidy. Plant Cell 2006, 18, 1348–1359. [Google Scholar] [CrossRef] [PubMed]
  28. Yang, Y.W.; Lai, K.N.; Tai, P.Y.; Li, W.H. Rates of nucleotide substitution in angiosperm mitochondrial DNA sequences and dates of divergence between Brassica and other angiosperm lineages. J. Mol. Evol. 1999, 48, 597–604. [Google Scholar] [CrossRef] [PubMed]
  29. Nguyen, H.P.; Jeong, H.Y.; Kim, H.; Kim, Y.C.; Lee, C. Molecular and biochemical characterization of rice pectin methylesterase inhibitors (OsPMEIs). Plant Physiol. Biochem. 2016, 101, 105–112. [Google Scholar] [CrossRef] [PubMed]
  30. Pinzón-Latorre, D.; Deyholos, M.K. Characterization and transcript profiling of the pectin methylesterase (PME) and pectin methylesterase inhibitor (PMEI) gene families in flax (Linum usitatissimum). BMC Genom. 2013, 14, 742. [Google Scholar] [CrossRef] [PubMed]
  31. Scheler, C.; Weitbrecht, K.; Pearce, S.P.; Hampstead, A.; Büttner-Mainik, A.; Lee, K.J.D.; Voegele, A.; Oracz, K.; Dekkers, B.J.W.; Wang, X.; et al. Promotion of testa rupture during garden cress germination involves seed compartment-specific expression and activity of pectin methylesterases. Plant Physiol. 2015, 167, 200–215. [Google Scholar] [CrossRef] [PubMed]
  32. Wang, M.; Yuan, D.; Gao, W.; Li, Y.; Tan, J.; Zhang, X. A comparative genome analysis of PME and PMEI families reveals the evolution of pectin metabolism in plant cell walls. PLoS ONE 2013, 8, e72082. [Google Scholar] [CrossRef] [PubMed]
  33. Cheng, F.; Wu, J.; Fang, L.; Wang, X. Syntenic gene analysis between Brassica rapa and other Brassicaceae species. Front. Plant Sci. 2012, 3, 198. [Google Scholar] [CrossRef] [PubMed]
  34. Han, T.; Dong, H.; Cui, J.; Li, M.; Lin, S.; Cao, J.; Huang, L. Genomic, molecular evolution, and expression analysis of genes encoding putative classical AGPs, lysine-rich AGPs, and AG peptides in Brassica rapa. Front. Plant Sci. 2017, 8, 397. [Google Scholar] [CrossRef] [PubMed]
  35. Lou, P.; Wu, J.; Cheng, F.; Cressman, L.G.; Wang, X.; McClung, C.R. Preferential retention of circadian clock genes during diploidization following whole genome triplication in Brassica rapa. Plant Cell 2012, 24, 2415–2426. [Google Scholar] [CrossRef] [PubMed]
  36. Cheng, F.; Wu, J.; Wang, X. Genome triplication drove the diversification of Brassica plants. Hortic. Res. 2014, 1, 14024. [Google Scholar] [CrossRef] [PubMed]
  37. Toufighi, K.; Brady, S.M.; Austin, R.; Ly, E.; Provart, N.J. The botany array resource: E-northerns, expression angling, and promoter analyses. Plant J. 2005, 43, 153–163. [Google Scholar] [CrossRef] [PubMed]
  38. Juge, N. Plant protein inhibitors of cell wall degrading enzymes. Trends Plant Sci. 2006, 11, 359–367. [Google Scholar] [CrossRef] [PubMed]
  39. Balestrieri, C.; Castaldo, D.; Giovane, A.; Quagliuolo, L.; Servillo, L. A glycoprotein inhibitor of pectin methylesterase in kiwi fruit (Actinidia chinensis). FEBS J. 1990, 193, 183–187. [Google Scholar] [CrossRef]
  40. Woriedh, M.; Wolf, S.; Marton, M.L.; Hinze, A.; Gahrtz, M.; Becker, D.; Dresselhaus, T. External application of gametophyte-specific ZmPMEI1 induces pollen tube burst in maize. Plant Reprod. 2013, 26, 255–266. [Google Scholar] [CrossRef] [PubMed]
  41. Wolf, S.; Grsic-Rausch, S.; Rausch, T.; Greiner, S. Identification of pollen-expressed pectin methylesterase inhibitors in Arabidopsis. FEBS Lett. 2003, 555, 551–555. [Google Scholar] [CrossRef]
  42. Lionetti, V.; Raiola, A.; Mattei, B.; Bellincampi, D. The grapevine VvPMEI1 gene encodes a novel functional pectin methylesterase inhibitor associated to grape berry development. PLoS ONE 2015, 10, e0133810. [Google Scholar] [CrossRef] [PubMed]
  43. Smith, B.G.; Harris, P.J. The polysaccharide composition of Poales cell walls: Poaceae cell walls are not unique. Biochem. Syst. Ecol. 1999, 27, 33–53. [Google Scholar] [CrossRef]
  44. Pelloux, J.; Rusterucci, C.; Mellerowicz, E.J. New insights into pectin methylesterase structure and function. Trends Plant Sci. 2007, 12, 267–277. [Google Scholar] [CrossRef] [PubMed]
  45. Fang, L.; Cheng, F.; Wu, J.; Wang, X. The impact of genome triplication on tandem gene evolution in Brassica rapa. Front. Plant Sci. 2012, 3, 261. [Google Scholar] [CrossRef] [PubMed]
  46. Stebbins, G.L. Variation and Evolution in Plants; Columbia University Press: New York, NY, USA, 1950. [Google Scholar]
  47. Sankoff, D.; Zheng, C.; Zhu, Q. The collapse of gene complement following whole genome duplication. BMC Genom. 2010, 11, 313. [Google Scholar] [CrossRef] [PubMed]
  48. Messing, J.; Bharti, A.K.; Karlowski, W.M.; Gundlach, H.; Kim, H.R.; Yu, Y.; Wei, F.; Fuks, G.; Soderlund, C.A.; Mayer, K.F.; et al. Sequence composition and genome organization of maize. Proc. Natl. Acad. Sci. USA 2004, 101, 14349–14354. [Google Scholar] [CrossRef] [PubMed]
  49. Schnable, J.C.; Springer, N.M.; Freeling, M. Differentiation of the maize subgenomes by genome dominance and both ancient and ongoing gene loss. Proc. Natl. Acad. Sci. USA 2011, 108, 4069–4074. [Google Scholar] [CrossRef] [PubMed]
  50. Thomas, B.C.; Pedersen, B.; Freeling, M. Following tetraploidy in an Arabidopsis ancestor, genes were removed preferentially from one homeolog leaving clusters enriched in dose-sensitive genes. Genome Res. 2006, 16, 934–946. [Google Scholar] [CrossRef] [PubMed]
  51. Birchler, J.A.; Veitia, R.A. The gene balance hypothesis: From classical genetics to modern genomics. Plant Cell 2007, 19, 395–402. [Google Scholar] [CrossRef] [PubMed]
  52. Senechal, F.; Wattier, C.; Rusterucci, C.; Pelloux, J. Homogalacturonan-modifying enzymes: Structure, expression, and roles in plants. J. Exp. Bot. 2014, 65, 5125–5160. [Google Scholar] [CrossRef] [PubMed]
  53. Cheng, F.; Wu, J.; Fang, L.; Sun, S.; Liu, B.; Lin, K.; Bonnema, G.; Wang, X. Biased gene fractionation and dominant gene expression among the subgenomes of Brassica rapa. PLoS ONE 2012, 7, e36442. [Google Scholar] [CrossRef] [PubMed]
  54. Koch, M.A.; Haubold, B.; Mitchell-Olds, T. Comparative evolutionary analysis of chalcone synthase and alcohol dehydrogenase loci in Arabidopsis, Arabis, and related genera (Brassicaceae). Mol. Biol. Evol. 2000, 17, 1483–1498. [Google Scholar] [CrossRef] [PubMed]
  55. Zhang, H.; Cao, Y.; Shang, C.; Li, J.; Wang, J.; Wu, Z.; Ma, L.; Qi, T.; Fu, C.; Bai, Z. Genome-wide characterization of GRAS family genes in Medicago truncatula reveals their evolutionary dynamics and functional diversification. PLoS ONE 2017, 12, e0185439. [Google Scholar] [CrossRef] [PubMed]
  56. He, Y.; Liu, X.; Ye, L.; Pan, C.; Chen, L.; Zou, T.; Lu, G. Genome-wide identification and expression analysis of two-component system genes in tomato. Int. J. Mol. Sci. 2016, 17, 1204. [Google Scholar] [CrossRef] [PubMed]
  57. Chen, Y.; Yang, Z.; Xiao, Y.; Wang, P.; Wang, Y.; Ge, X.; Zhang, C.; Zhang, X.; Li, F. Genome-wide analysis of the NF-YB gene family in Gossypium hirsutum L. and characterization of the role of GhDNF-YB22 in embryogenesis. Int. J. Mol. Sci. 2018, 19, 483. [Google Scholar] [CrossRef] [PubMed]
  58. Krichevsky, A.; Kozlovsky, S.V.; Tian, G.W.; Chen, M.H.; Zaltsman, A.; Citovsky, V. How pollen tubes grow. Dev. Biol. 2007, 303, 405–420. [Google Scholar] [CrossRef] [PubMed]
  59. Rockel, N.; Wolf, S.; Kost, B.; Rausch, T.; Greiner, S. Elaborate spatial patterning of cell-wall PME and PMEI at the pollen tube tip involves PMEI endocytosis, and reflects the distribution of esterified and de-esterified pectins. Plant J. 2008, 53, 133–143. [Google Scholar] [CrossRef] [PubMed]
  60. Jithesh, M.N.; Wally, O.S.; Manfield, I.; Critchley, A.T.; Hiltz, D.; Prithiviraj, B. Analysis of seaweed extract-induced transcriptome leads to identification of a negative regulator of salt tolerance in Arabidopsis. HortScience 2012, 47, 704–709. [Google Scholar]
  61. Huang, L.; Cao, J.; Ye, W.; Liu, T.; Jiang, L.; Ye, Y. Transcriptional differences between the male-sterile mutant bcms and wild-type Brassica campestris ssp. chinensis reveal genes related to pollen development. Plant Biol. 2008, 10, 342–355. [Google Scholar] [CrossRef] [PubMed]
  62. Huang, L.; Ye, W.Z.; Liu, T.T.; Cao, J.S. Characterization of the male-sterile line Bcajh97-01A/B and identification of candidate genes for genic male sterility in Chinese cabbage-pak-choi. J. Am. Soc. Hortic. Sci. 2009, 134, 632–640. [Google Scholar]
  63. Huang, L.; Zhao, X.; Liu, T.; Dong, H.; Cao, J. Developmental characteristics of floral organs and pollen of Chinese cabbage (Brassica campestris L. ssp. chinensis). Plant Syst. Evol. 2010, 286, 103–115. [Google Scholar] [CrossRef]
  64. Jiang, J.; Jiang, J.; Qiu, L.; Miao, Y.; Yao, L.; Cao, J. Identification of gene expression profile during fertilization in Brassica campestris subsp. chinensis. Genome 2013, 56, 39–48. [Google Scholar] [CrossRef] [PubMed]
  65. Cheng, F.; Liu, S.; Wu, J.; Fang, L.; Sun, S.; Liu, B.; Li, P.; Hua, W.; Wang, X. BRAD, the genetics and genomics database for Brassica plants. BMC Plant Biol. 2011, 11, 136. [Google Scholar] [CrossRef] [PubMed]
  66. Finn, R.D.; Coggill, P.; Eberhardt, R.Y.; Eddy, S.R.; Mistry, J.; Mitchell, A.L.; Potter, S.C.; Punta, M.; Qureshi, M.; Sangrador-Vegas, A.; et al. The Pfam protein families database: Towards a more sustainable future. Nucleic Acids Res. 2016, 44, D279–D285. [Google Scholar] [CrossRef] [PubMed]
  67. Kawahara, Y.; La Bastide, M.D.; Hamilton, J.P.; Kanamori, H.; Mccombie, W.R.; Ouyang, S.; Schwartz, D.C.; Tanaka, T.; Wu, J.; Zhou, S. Improvement of the Oryza sativa nipponbare reference genome using next generation sequence and optical map data. Rice 2013, 6, 4. [Google Scholar] [CrossRef] [PubMed]
  68. Letunic, I.; Doerks, T.; Bork, P. SMART 7: Recent updates to the protein domain annotation resource. Nucleic Acids Res. 2012, 40, D302–D305. [Google Scholar] [CrossRef] [PubMed]
  69. Thompson, J.D.; Gibson, T.J.; Plewniak, F.; Jeanmougin, F.; Higgins, D.G. The CLUSTAL_X windows interface: Flexible strategies for multiple sequence alignment aided by quality analysis tools. Nucleic Acids Res. 1997, 25, 4876–4882. [Google Scholar] [CrossRef] [PubMed]
  70. Tamura, K.; Stecher, G.; Peterson, D.; Filipski, A.; Kumar, S. MEGA6: Molecular evolutionary genetics analysis version 6.0. Mol. Biol. Evol. 2013, 30, 2725–2729. [Google Scholar] [CrossRef] [PubMed]
  71. Hu, B.; Jin, J.; Guo, A.Y.; Zhang, H.; Luo, J.; Gao, G. GSDS 2.0: An upgraded gene feature visualization server. Bioinformatics 2015, 31, 1296–1297. [Google Scholar] [CrossRef] [PubMed]
  72. Chou, K.C.; Shen, H.B. Plant-mPLoc: A top-down strategy to augment the power for predicting plant protein subcellular localization. PLoS ONE 2010, 5, e11335. [Google Scholar] [CrossRef] [PubMed]
  73. Krogh, A.; Larsson, B.; von Heijne, G.; Sonnhammer, E.L.L. Predicting transmembrane protein topology with a hidden Markov model: Application to complete genomes. J. Mol. Biol. 2001, 305, 567–580. [Google Scholar] [CrossRef] [PubMed]
  74. Bailey, T.L.; Boden, M.; Buske, F.A.; Frith, M.; Grant, C.E.; Clementi, L.; Ren, J.; Li, W.W.; Noble, W.S. MEME SUITE: Tools for motif discovery and searching. Nucleic Acids Res. 2009, 37, W202–W208. [Google Scholar] [CrossRef] [PubMed]
  75. Lescot, M.; Déhais, P.; Thijs, G.; Marchal, K.; Moreau, Y.; Van de Peer, Y.; Rouzé, P.; Rombauts, S. PlantCARE, a database of plant cis-acting regulatory elements and a portal to tools for in silico analysis of promoter sequences. Nucleic Acids Res. 2002, 30, 325–327. [Google Scholar] [CrossRef] [PubMed]
  76. Jefferson, R.A.; Kavanagh, T.A.; Bevan, M.W. GUS fusions: β-glucuronidase as a sensitive and versatile gene fusion marker in higher plants. EMBO J. 1987, 6, 3901–3907. [Google Scholar] [PubMed]
  77. Sanders, P.M.; Bui, A.Q.; Weterings, K.; McIntire, K.; Hsu, Y.C.; Lee, P.Y.; Truong, M.T.; Beals, T.; Goldberg, R. Anther developmental defects in Arabidopsis thaliana male-sterile mutants. Sex. Plant Reprod. 1999, 11, 297–322. [Google Scholar] [CrossRef]
  78. Cheng, F.; Mandakova, T.; Wu, J.; Xie, Q.; Lysak, M.A.; Wang, X. Deciphering the diploid ancestral genome of the mesohexaploid Brassica rapa. Plant Cell 2013, 25, 1541–1554. [Google Scholar] [CrossRef] [PubMed]
  79. Krzywinski, M.; Schein, J.; Birol, I.; Connors, J.; Gascoyne, R.; Horsman, D.; Jones, S.J.; Marra, M.A. Circos: An information aesthetic for comparative genomics. Genome Res. 2009, 19, 1639–1645. [Google Scholar] [CrossRef] [PubMed]
  80. Wu, P.; Shao, Z.Q.; Wu, X.Z.; Wang, Q.; Wang, B.; Chen, J.Q.; Hang, Y.Y.; Xue, J.Y. Loss/retention and evolution of NBS-encoding genes upon whole genome triplication of Brassica rapa. Gene 2014, 540, 54–61. [Google Scholar] [CrossRef] [PubMed]
  81. Suyama, M.; Torrents, D.; Bork, P. PAL2NAL: Robust conversion of protein sequence alignments into the corresponding codon alignments. Nucleic Acids Res. 2006, 34, W609–W612. [Google Scholar] [CrossRef] [PubMed]
  82. Goldman, N.; Yang, Z. A codon-based model of nucleotide substitution for protein-coding DNA sequences. Mol. Biol. Evol. 1994, 11, 725–736. [Google Scholar] [CrossRef] [PubMed]
  83. Czechowski, T.; Stitt, M.; Altmann, T.; Udvardi, M.K.; Scheible, W.R. Genome-wide identification and testing of superior reference genes for transcript normalization in Arabidopsis. Plant Physiol. 2005, 139, 5–17. [Google Scholar] [CrossRef] [PubMed]
  84. Livak, K.J.; Schmittgen, T.D. Analysis of relative gene expression data using real-time quantitative PCR and the 2−ΔΔCT method. Methods 2001, 25, 402–408. [Google Scholar] [CrossRef] [PubMed]
  85. Deng, W.; Wang, Y.; Liu, Z.; Cheng, H.; Xue, Y. HemI: A toolkit for illustrating heatmaps. PLoS ONE 2014, 9, e111988. [Google Scholar] [CrossRef] [PubMed]
Figure 1. Gene structures and conserved motifs of PMEIs in Brassica campestris. (a) Exon–intron organization of BcPMEIs. The black lines and green boxes stand for introns and exons, respectively; (b) Distributions of conserved motifs in BcPMEIs. The differently colored boxes, numbered 1–10 at the bottom, denote differently conserved motifs.
Ijms 19 01338 g001
Figure 2. Chromosomal locations of PMEIs in Brassica campestris. The chromosome numbers are represented on the top of each chromosome. The positive (+) and negative (−) signs indicate forward and reverse orientation, respectively. The names of tandem genes lie next to pound signs (#). Four BcPMEIs could not be mapped onto a specific chromosome.
Ijms 19 01338 g002
Figure 3. Syntenic analysis of PMEIs in Brassica campestris and Arabidopsis thaliana. The 24 genomic blocks are colored on the basis of the inferred ancestral chromosomes following an established convention.
Ijms 19 01338 g003
Figure 4. The retained rate of PMEIs in Brassica campestris. (a) Retained rates of BcPMEIs, randomly selected genes, and core eukaryotic genes; (b) retention rates by the number of homologous copies in the syntenic region; (c) retained rates of BcPMEIs, randomly selected genes, and core eukaryotic genes among the three subgenomes of B. campestris.
Ijms 19 01338 g004
Figure 5. Frequency distributions of the Ks and Ka/Ks values of PMEI homolog pairs. (a,b) Ks and Ka/Ks value distributions of the PMEI ortholog pairs between the Brassica campestris and Arabidopsis genomes; (c,d) Ks and Ka/Ks value distributions of the PMEI paralog pairs in the B. campestris genome. The vertical axes represent the frequency of paired sequences and the horizontal axes represent the Ks and Ka/Ks values at a 0.1 interval.
Ijms 19 01338 g005
Figure 6. Hierarchical clustering and heat map representation displaying the expression profiles of BcPMEIs in root (R), stem (St), leaf (L), inflorescence (Inf), and silique (Si). The gene expression levels in the five tissues were explored by qRT-PCR. The scale bars on the left indicate relative expression level. The vertical dark bars on the right depict the seven groups of BcPMEIs. The grey boxes represent the undetectable expression.
Ijms 19 01338 g006
Figure 7. GUS staining of the PPMEI22::GUS inflorescence (a) and PPME44::GUS inflorescence (b).
Ijms 19 01338 g007
Figure 8. Expression profile analysis of representative BcPMEIs by the Illumina RNA-Seq data in A1–A5 and B1–B5. A1–A5 and B1–B5 present the five developmental stages of pollen in “Bcajh97-01A” and “Bcajh97-01B”, respectively.
Ijms 19 01338 g008
Figure 9. Expression profile analysis of representative BcPMEIs by the Illumina RNA-Seq data in unpollinated pistils (CK) and pollinated pistils at 1, 3, and 10 h after pollination (HAP).
Ijms 19 01338 g009

