Article

Evaluation of Housekeeping Genes for Quantitative Real-Time PCR Analysis of Bradysia odoriphaga (Diptera: Sciaridae)

1
College of Agriculture, Yangtze University, Jingzhou 434025, China
2
College of Life Science, Heilongjiang University, Harbin 150080, China
3
Department of Plant Protection, Institute of Vegetables and Flowers, Chinese Academy of Agricultural Sciences, Beijing 100081, China
4
Department of Medicine, University of Connecticut Health Center, Farmington, CT 06030, USA
*
Author to whom correspondence should be addressed.
These authors contribute equally to this work.
Int. J. Mol. Sci. 2016, 17(7), 1034; https://doi.org/10.3390/ijms17071034
Submission received: 8 April 2016 / Revised: 15 June 2016 / Accepted: 20 June 2016 / Published: 7 July 2016
(This article belongs to the Section Biochemistry)

Abstract

:
The soil insect Bradysia odoriphaga (Diptera: Sciaridae) causes substantial damage to Chinese chive. Suitable reference genes in B. odoriphaga (Bradysia odoriphaga) have yet to be identified for normalizing target gene expression among samples by quantitative real-time PCR (qRT-PCR). This study was focused on identifying the expression stability of 12 candidate housekeeping genes in B. odoriphaga under various experiment conditions. The final stability ranking of 12 housekeeping genes was obtained with RefFinder, and the most suitable number of reference genes was analyzed by GeNorm. The results revealed that the most appropriate sets of internal controls were RPS15, RPL18, and RPS18 across developmental phases; RPS15, RPL28, and GAPDH across temperatures; RPS15 and RPL18 across pesticide treatments; RSP5, RPS18, and SDHA across photoperiods; ACTb, RPS18, and RPS15 across diets; RPS13 and RPL28 across populations; and RPS15, ACTb, and RPS18 across all samples. The use of the most suitable reference genes versus an arbitrarily selected reference gene resulted in significant differences in the analysis of a target gene expression. HSP23 in B. odoriphaga was found to be up-regulated under low temperatures. These results will contribute to the standardization of qRT-PCR and will also be valuable for further research on gene function in B. odoriphaga.

Graphical Abstract

1. Introduction

Quantitative real-time PCR (qRT-PCR) is considered as a reliable technique for the gene quantification [1,2,3]. However, gene expression can be affected by many confounding factors, such as RNA extraction, reverse transcription, and qRT-PCR efficiency [4,5]. Therefore, housekeeping genes are commonly used as “reference genes” to decrease the effects due to confounding factors and to increase the accuracy of the quantification analysis related to the particular biological environment [6,7]. The reference genes overcome the whole steps of the analyses along with interest genes and suppress the variations within the treatment group to the lowest level. Determining the number and identity of the reference genes to be employed for count data of normalization factors (NF) among comparable samples is indispensable for the precise quantification of gene expression. Thus far, however, qRT-PCR remains unreliable because of unquestioning selection of reference genes and random decision of the number for data standardization. In most of the insect samples thus far studied, for example, the expression levels of frequently used reference genes show unacceptable variability among tissues or under different physiological conditions [8,9]. The use of such reference genes will lead to inaccurate calculations and may hide true differences among samples or may indicate false differences [10]. Gutierrez et al. found that estimates of gene expression level can differ by 100-fold depending on the selection of reference gene [11]. It follows that before a housekeeping gene is applied as a reference gene, its stability should be evaluated in the particular tissue and under the particular experimental conditions of the study [12,13]. In addition, at least two or three reference genes with stable expression pattern should be selected [14,15,16].
Although qPCR has been frequently utilized for detecting expression in insects, there is still no suitable housekeeping gene and stable gene quantification system for the chive gnat, Bradysia odoriphaga Yang and Zhang (Diptera: Sciaridae). It has been reported that the chive gnat is a major soil pest of Chinese chive, Allium tuberosum Rottler ex Sprengel [17,18,19]. With its high fecundity, overlapping generations, and wide host range, the chive gnat occurs throughout China [20,21]. The chive gnat commonly reduces the yield of Chinese chive by 40%–60% and in some cases destroys the entire crop [22,23,24,25]. Quantitative examination of gene expression in B. odoriphaga (Bradysia odoriphaga) may increase our understanding of the biology and control of this pest.
This study was focused on identifying suitable housekeeping genes for assessing gene expression in B. odoriphaga under various experimental conditions that included differences in developmental stage, temperature, population, pesticide exposure, diet, and photoperiod. We also assessed the significance of variations by comparing different normalization strategies with the merits of using the most appropriate versus a randomly selected reference genes under different temperature treatments.

2. Results

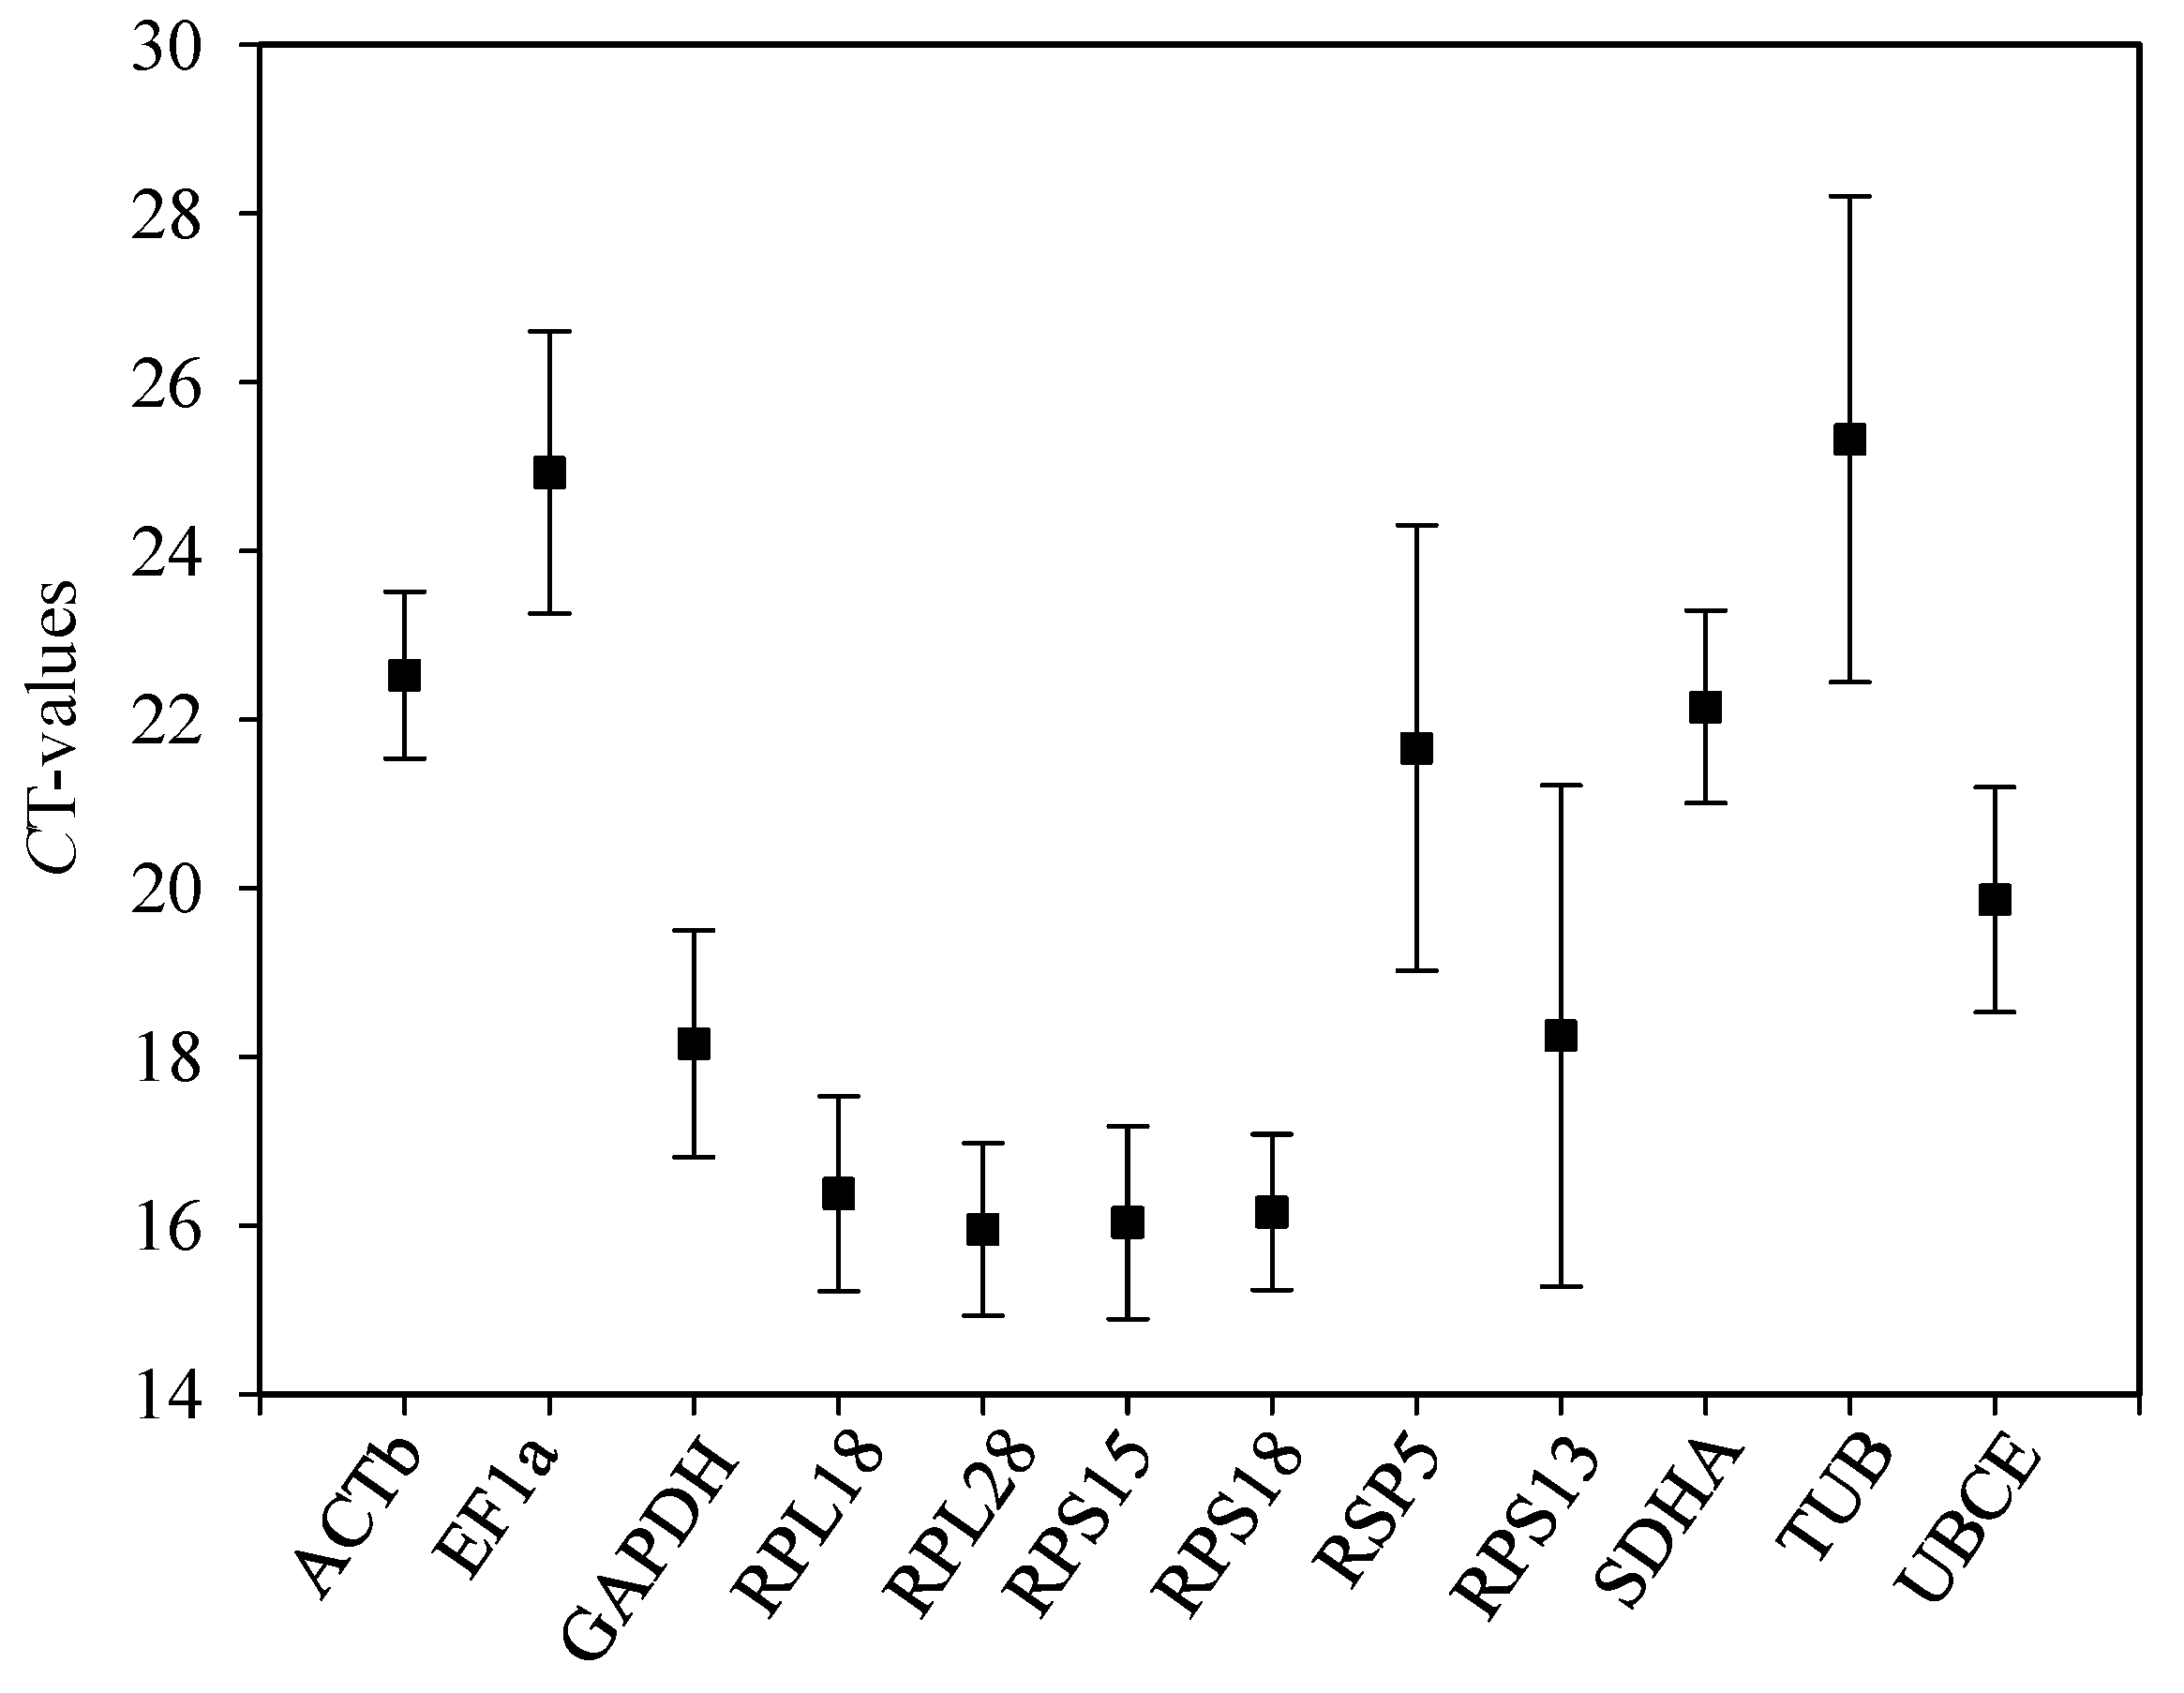
2.1. Amplification Efficiencies

Reverse transcription PCR (RT-PCR) showed that all 12 selected reference genes and one target gene were observed in the B. odoriphaga samples. For each gene, an amplicon of the correct size was evident. In order to estimate the amplification efficiency of the candidate genes, five-point standard curves were drawn based on the known RNA standards concentration, and the melting curve showed a single peak in each case (Figure 1). Amplification efficiencies ranged from 95.1% to 107.0%. Coefficients of determination (R2) based on linear regression were >0.990 (Table 1).

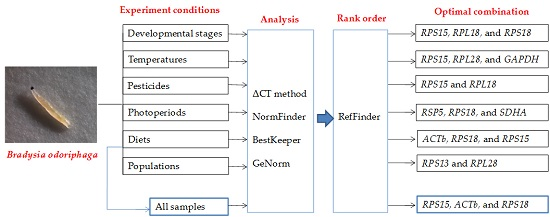
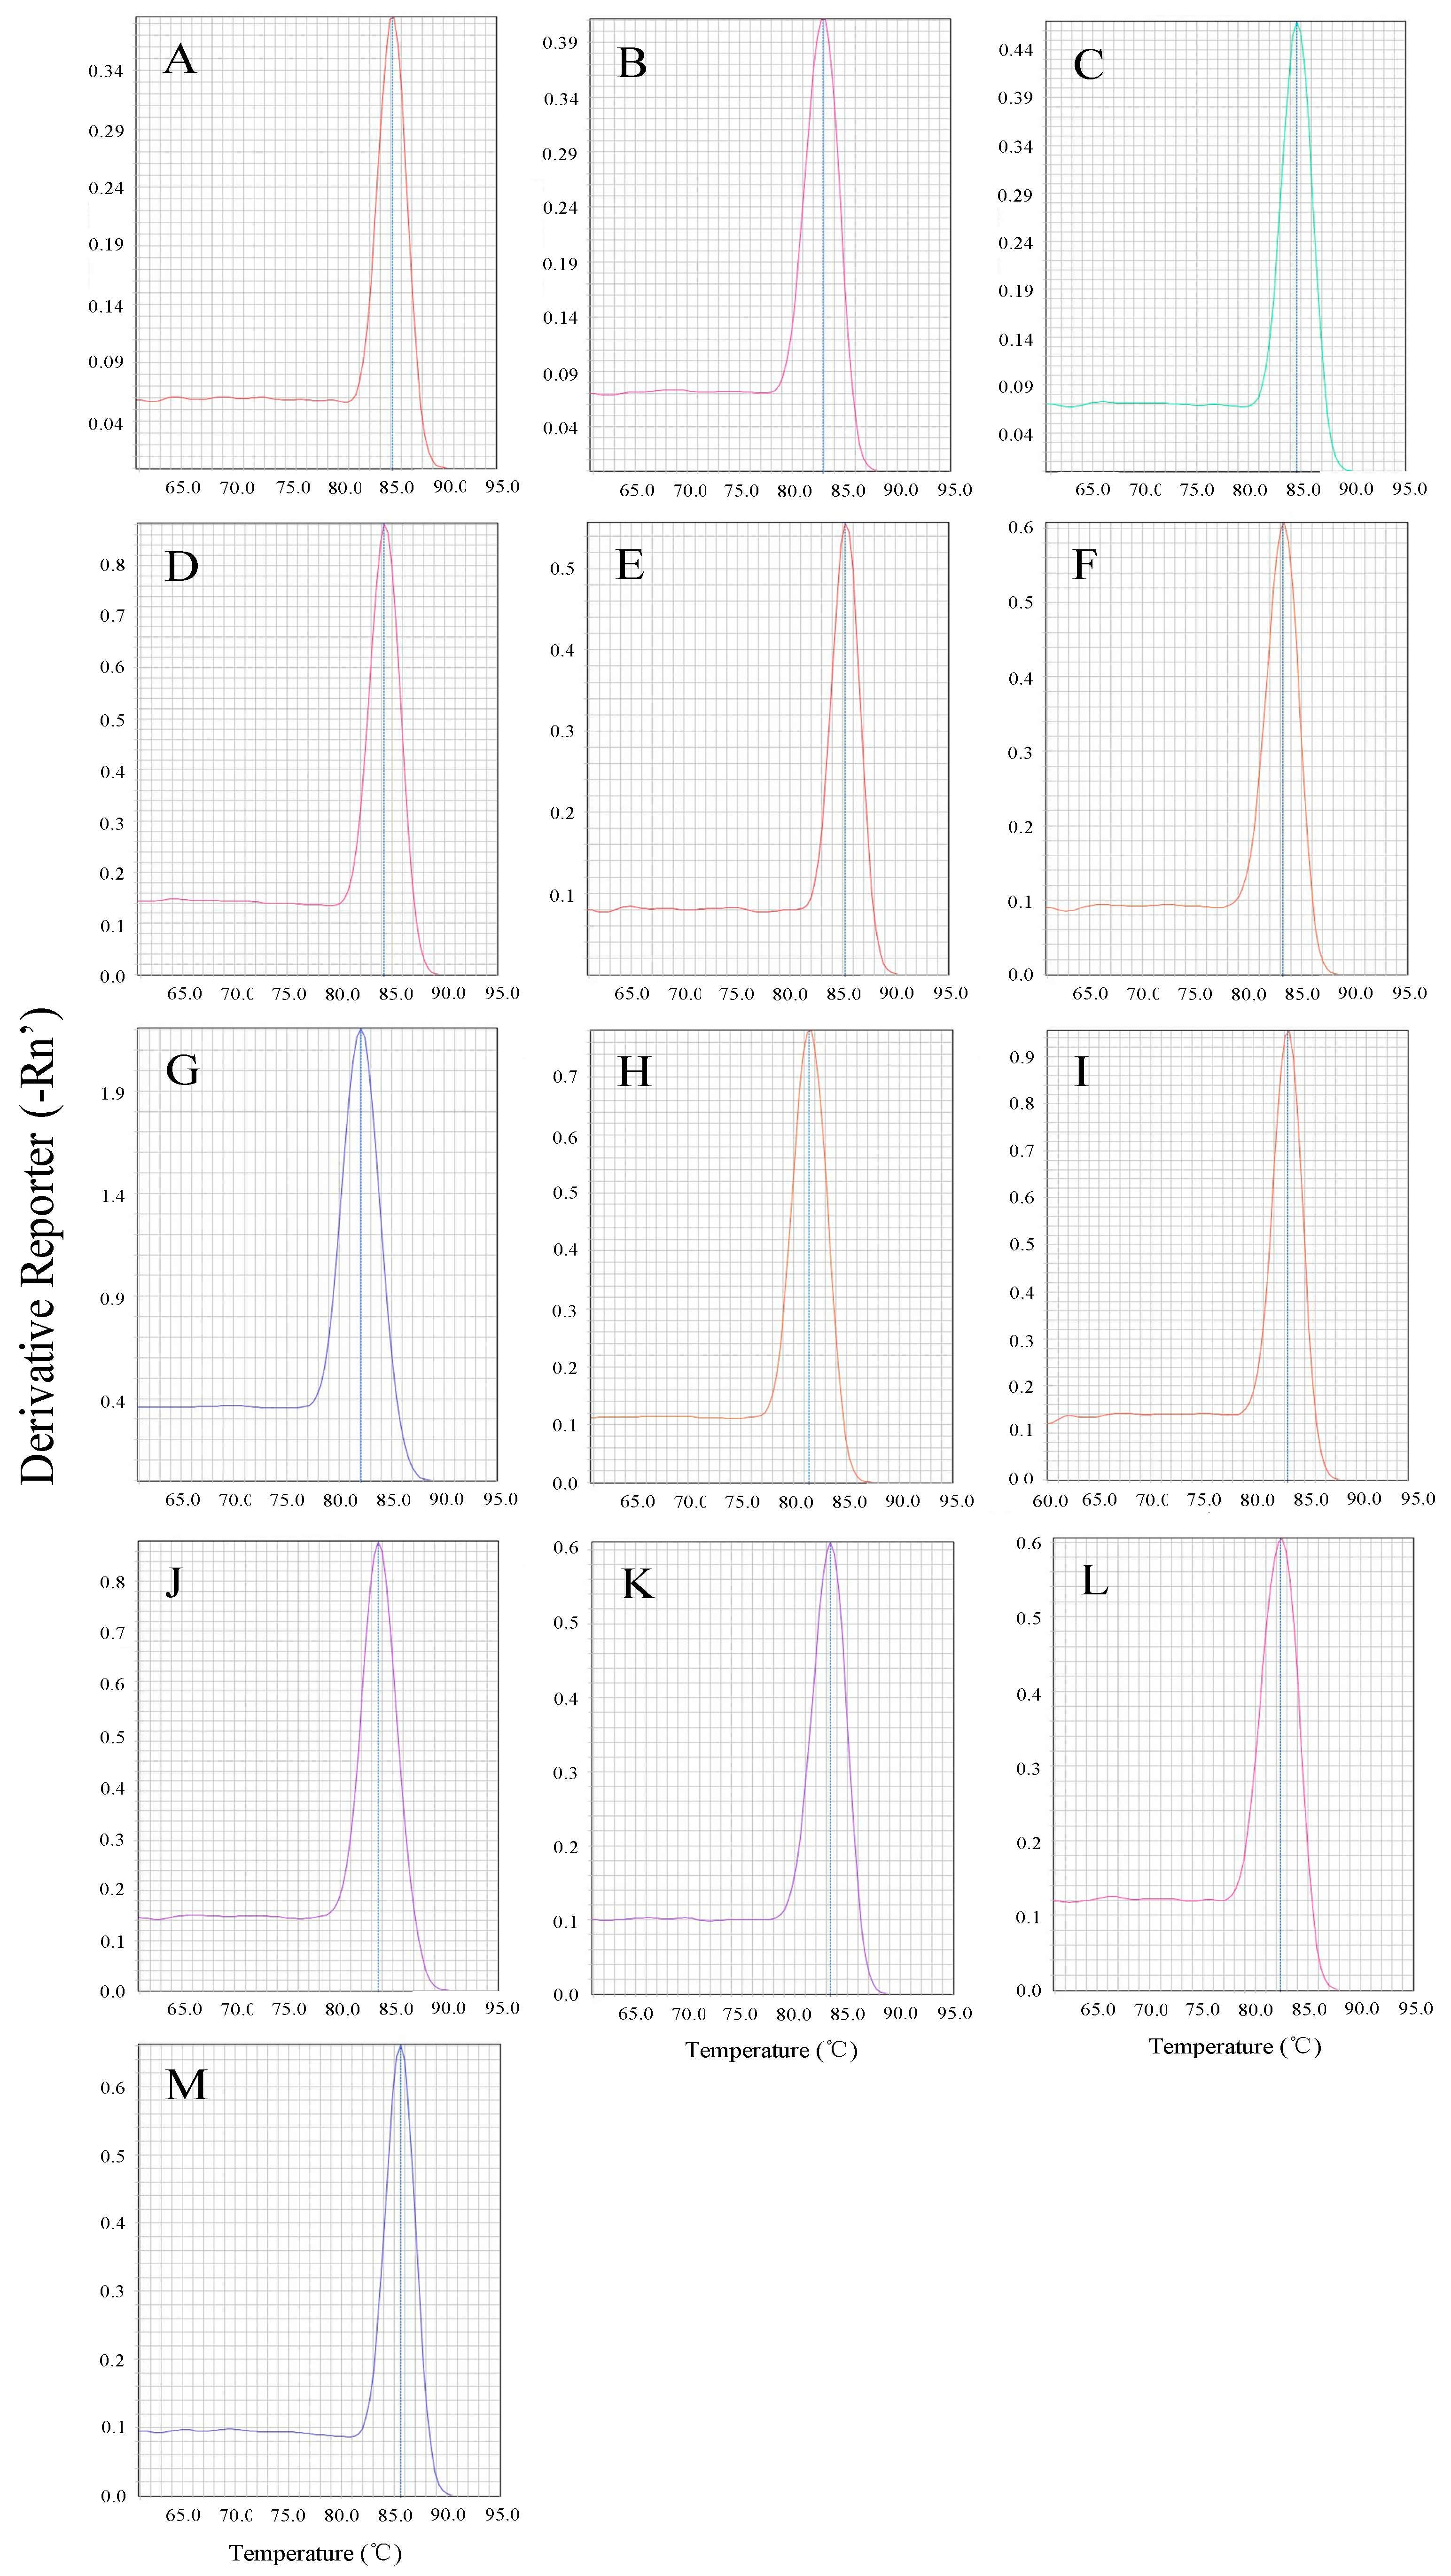
2.2. Expression Images of Candidate Reference Genes

To analyze mRNA expression level of the 12 candidate housekeeping genes, Ct values were calculated for all samples in this study. As shown in Figure 2, the mean Ct values of the 12 candidates were <30. The average Ct value was lowest for RPL28 (15.95) and highest for TUB (25.32).

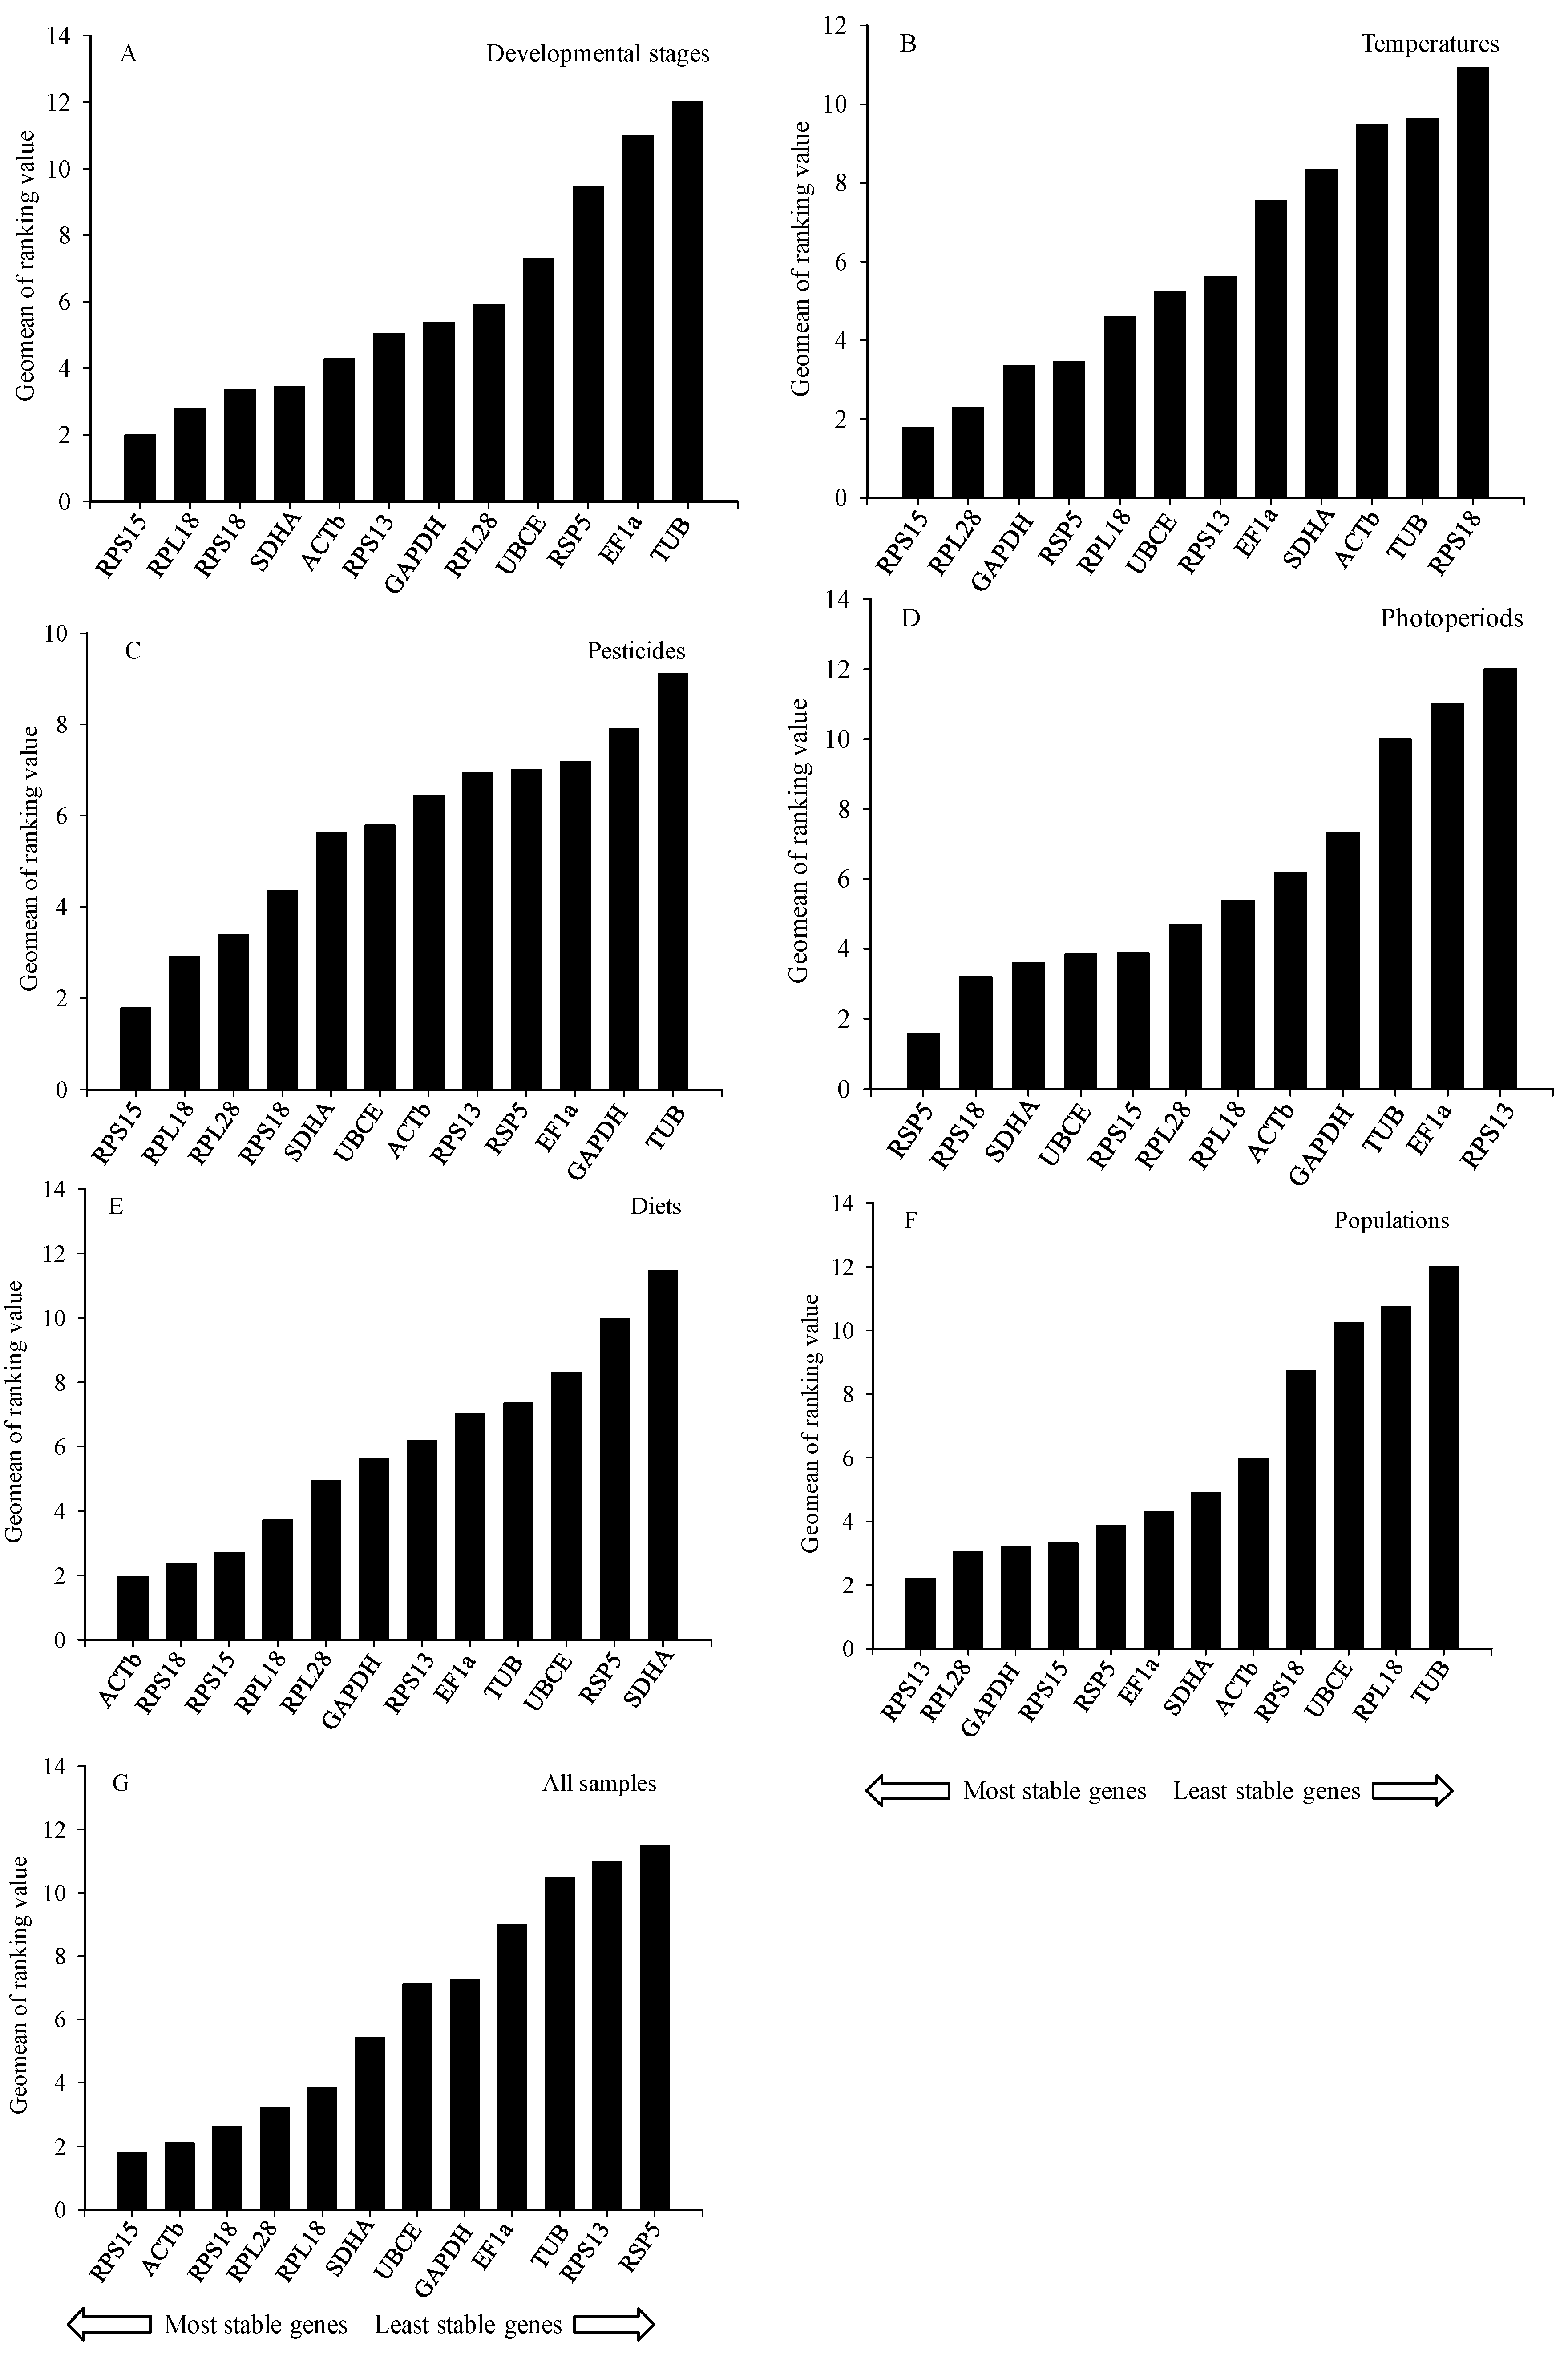
2.3. Stability of Reference Genes

The following results are based on analyses across the range of each factor. For developmental stage, for example, stability is based on an analysis across all stages.

2.3.1. Developmental Stages

According to the four algorithms, TUB and EF1a were the least steady across developmental stage (Table 2). The most stable genes (in order) were RPS15, RPL18, and ACTb according to the ΔCt method; RPS18, RPS13, and RPL28 according to BestKeeper; SDHA, ACTb, and GAPDH according to NormFinder; and RPL18, RPS15, and RPS18 according to GeNorm (Table 2).
According to RefFinder, the order of the reference gene stability across developmental stages was: RPS15 > RPL18 > RPS18 > SDHA > ACTb > RPS13 > GAPDH > RPL28 > UBCE > RSP5 > EF1a > TUB (Figure 3A). GeNorm analysis results showed that the pair-wise values of V2/3 to V6/7 were all above the cut-off value of 0.15 but that the pair-wise value of V7/8 was <0.15 (Figure 4); a value <0.15 indicates that the supplemental reference genes will not evidently change the normalization. Based on the RefFinder recommendations for selection of reference genes and on convenience of operation, RPS15, RPL18, and RPS18 were considered suitable reference genes across developmental stages of B. odoriphaga (Table 3).

2.3.2. Temperatures

According to the ΔCt method and NormFinder, the most steady candidate genes across temperature treatments were RPS15, RPL28, and GAPDH, and the least stable were RPS18, SDHA, and TUB (Table 2). According to BestKeeper, the most stable candidate genes were RPL28, RPS15, and UBCE, and the least steady were RPS18, EF1a, and ACTb (Table 2). According to GeNorm, the most stable candidates were RPL18, RSP5, and RPL28, and the least stable were TUB, SDHA, and ACTb (Table 2).
According to RefFinder, the order of reference gene stability across temperatures was: RPS15 > RPL28 > GAPDH > RSP5 > RPL18 > UBCE > RPS13 > EF1a > SDHA > ACTb > TUB > RPS18 (Figure 3B). The GeNorm data predicted that the pair-wise values from V2/3 to V3/4 were <0.15 (Figure 4). Therefore, RPS15, RPL28, and GAPDH were considered stable candidate genes across the tested temperatures (Table 3).

2.3.3. Pesticides

TUB, GAPDH, and EF1a were regarded as the least steady genes across pesticide treatments by the ΔCt method and by GeNorm and NormFinder but not by BestKeeper (Table 2). According to the comparative ΔCt method and GeNorm, the most stable candidates were RPS15, RPL18, and RPL28 (Table 2), while they were RPS15, RPL18, and RPS18 by using NormFinder and were SDHA, EF1a, and ACTb according to BestKeeper (Table 2).
Based on RefFinder, the order of reference gene stability across pesticide treatments was: RPS15 > RPL18 > RPL28 > RPS18 > SDHA > UBCE > ACTb > RPS13 > RSP5 > EF1a > GAPDH > TUB (Figure 3C). The GeNorm analysis showed that the pair-wise value of V2/3 was <0.15 (Figure 4). Therefore, RPS15 and RPL18 were considered suitable candidate genes across the tested pesticide treatments (Table 3).

2.3.4. Photoperiods

According to the four algorithms, the least stable genes across photoperiod treatments were RPS13, EF1a, and TUB (Table 2). The most stable genes were RSP5, RPS15, and SDHA according to the comparative ΔCt method; RSP5, ACTb, and RPS18 according to BestKeeper; RSP5, SDHA, and RPL28 according to NormFinder; and RPS18, UBCE, and RPL18 according to GeNorm (Table 2).
According to RefFinder, the order of reference gene stability across photoperiod treatments was: RSP5 > RPS18 > SDHA > UBCE > RPS15 > RPL28 > RPL18 > ACTb > GAPDH > TUB > EF1a > RPS13 (Figure 3D). The GeNorm analysis data showed that only the pair-wise value of V7/8 was below the cut-off value of 0.15 (Figure 4). RSP5, RPS18, and SDHA were considered to be the most stable candidate genes across photoperiod treatments (Table 3).

2.3.5. Diets

Both NormFinder and ΔCt method results shared the same stable genes (ACTb, RPS18, and RPS15) across diets and confirmed SDHA, EF1a, and RSP5 as the least steady genes across diets (Table 2). According to BestKeeper, the most steady genes were RPS15, EF1a, and GAPDH, and the least stable were RPL18, UBCE, and SDHA (Table 2). According to GeNorm, the most stable genes were RPL18, RPS18, and ACTb, and the least stable were SDHA, RSP5, and EF1a (Table 2).
According to RefFinder, the ranking order of reference gene stability across diets was: ACTb > RPS18 > RPS15 > RPL18 > RPL28 > GAPDH > RPS13 > EF1a > TUB > UBCE > RSP5 > SDHA (Figure 3E). The GeNorm analysis showed that the pair-wise value of V4/5 was <0.15 (Figure 4). Therefore, ACTb, RPS18, and RPS15 were considered fitted reference genes across diets (Table 3).

2.3.6. Populations

Across B. odoriphaga populations, TUB, RPL18, and UBCE were identified as the least stable genes by all the four algorithms (Table 2). The most stable genes were RPS13, RPS15, and GAPDH according to the comparative ΔCt method; RPL28, SDHA, and GAPDH according to BestKeeper; RPS13, RPS15 and RPL28 according to NormFinder; and EF1a, RSP5, and GAPDH according to GeNorm (Table 2).
According to RefFinder, the order of reference gene stability across populations was: RPS13 > RPL28 > GAPDH > RPS15 > RSP5 > EF1a > SDHA > ACTb > RPS18 > UBCE > RPL18 > TUB (Figure 3F). The GeNorm analysis showed that V2/3 value was <0.15 (Figure 4). Therefore, RPS13 and RPL28 were considered suitable reference genes for gene expression (Table 3).

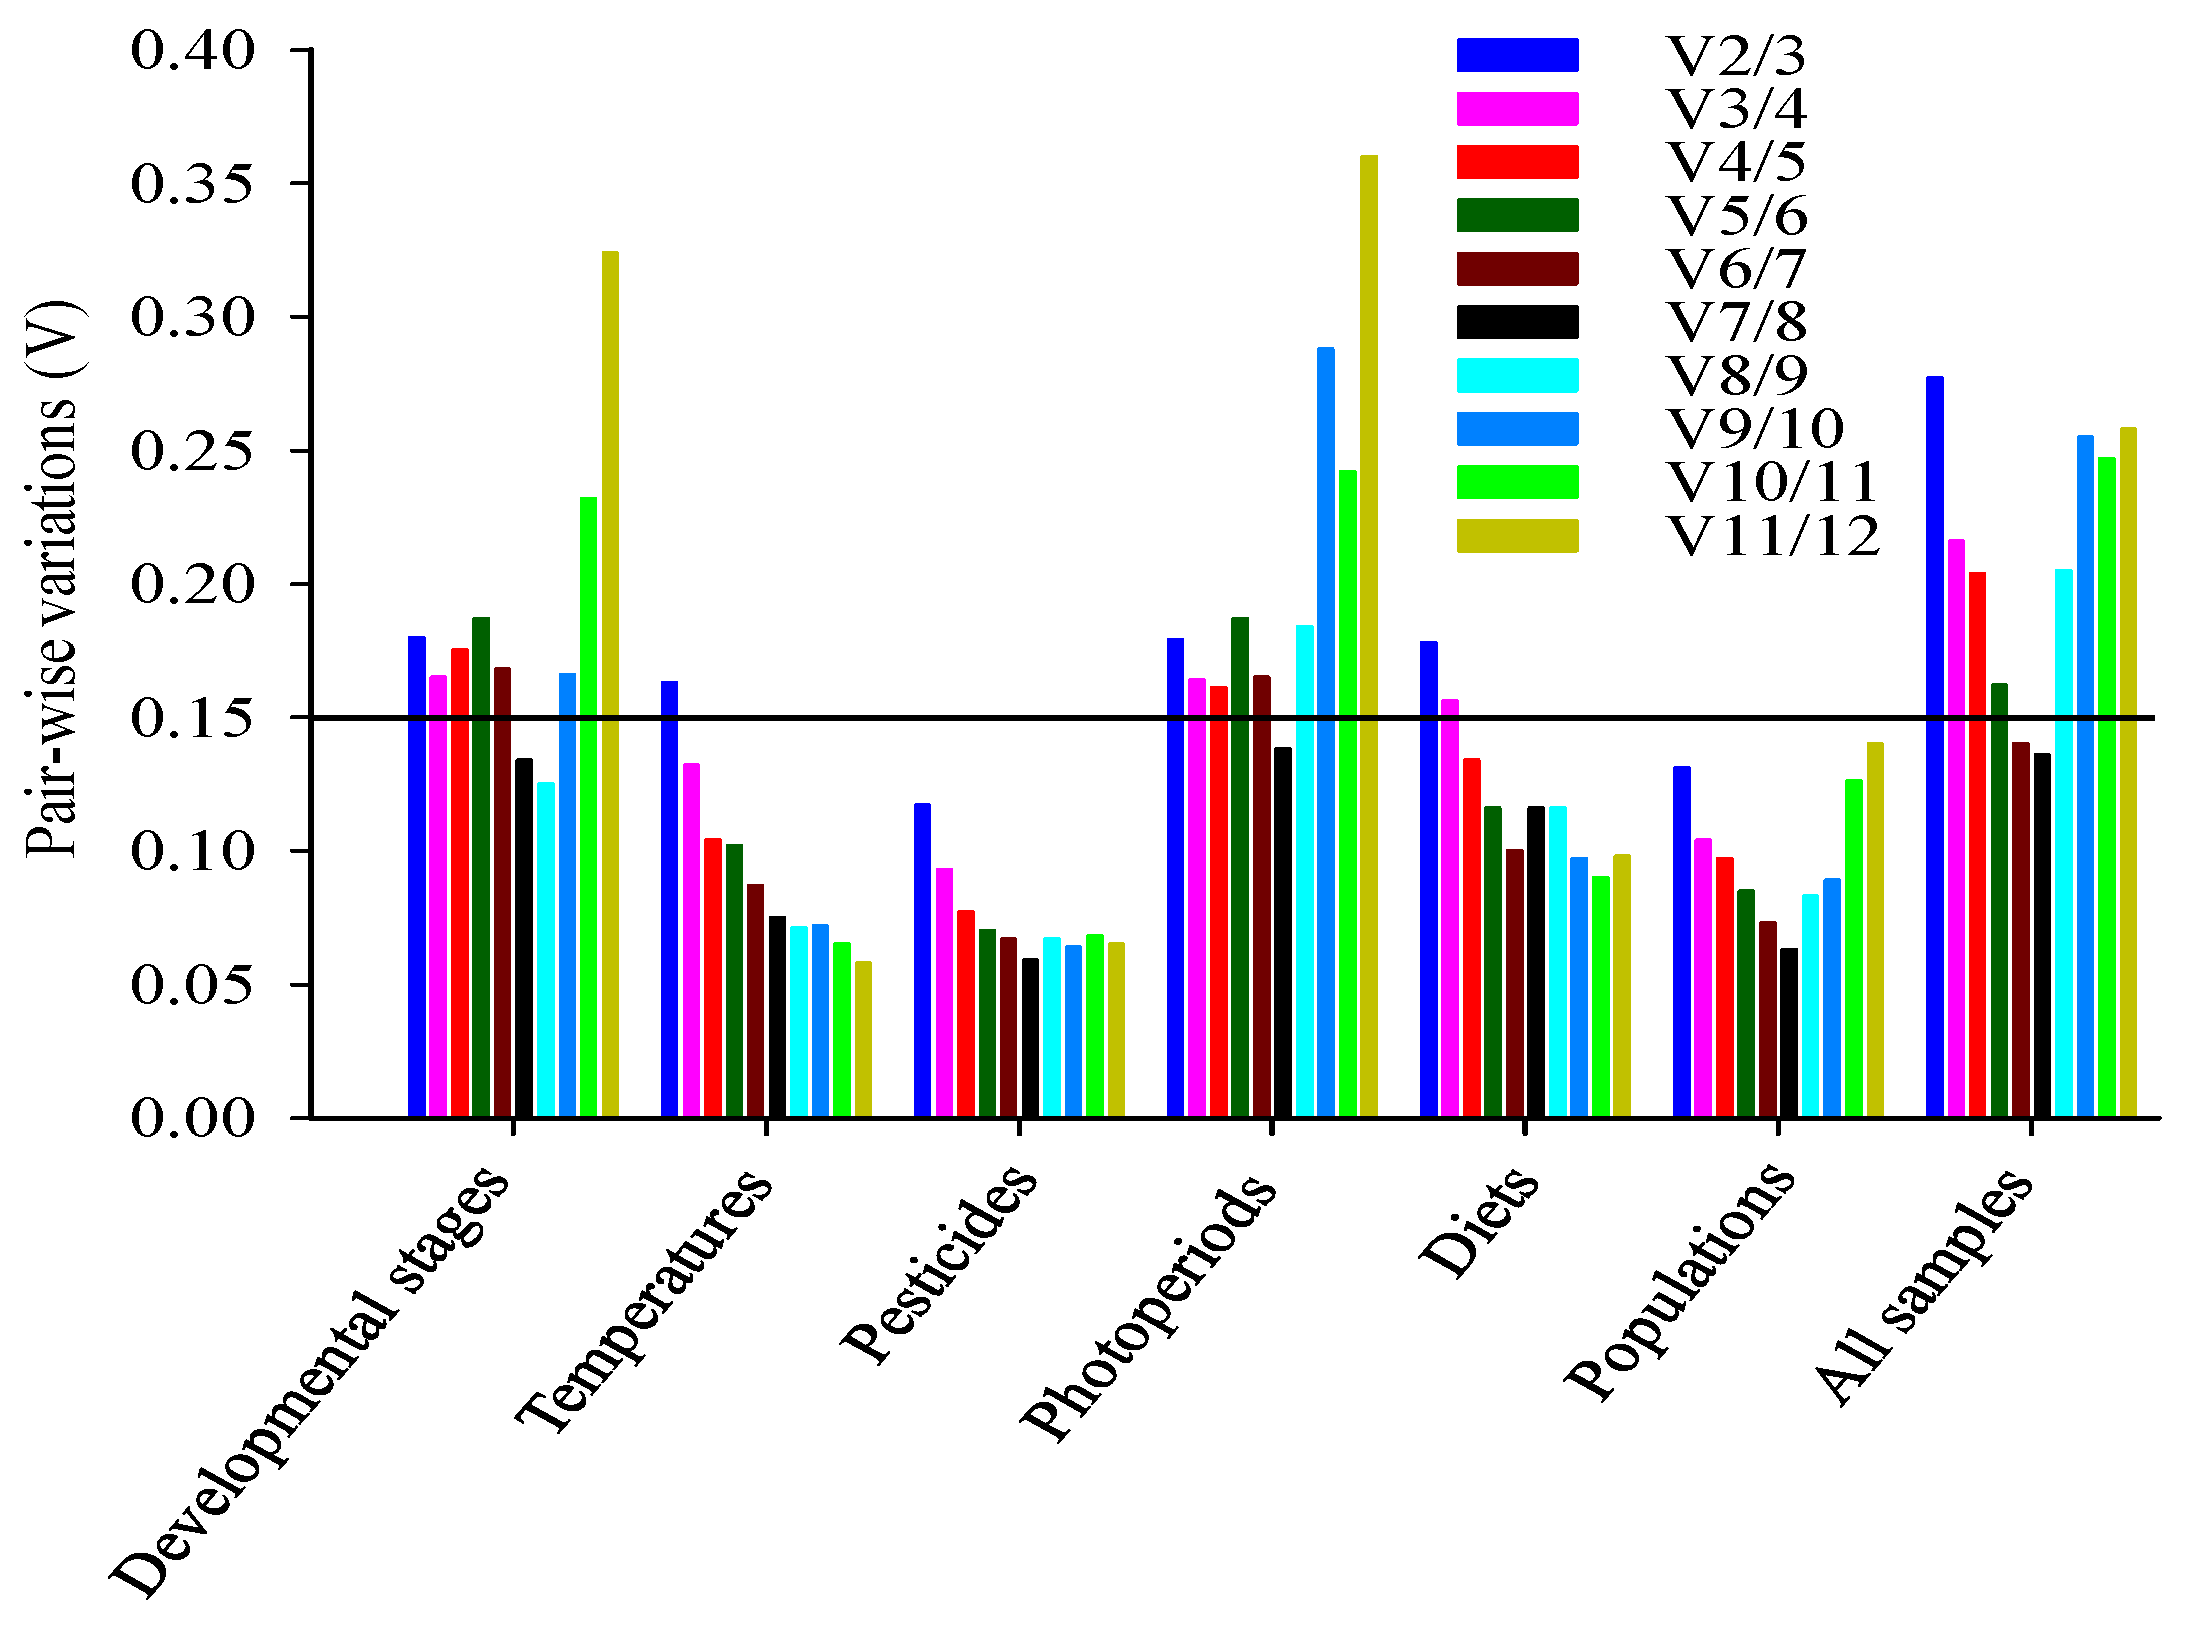
2.4. Ranking of Reference Genes for All Specimens

Across all samples, the three computational programs, and the comparative ΔCt method ranked RSP5, RPS13, and TUB as the least stable genes (Table 2). The most stable genes were RPS15, ACTb, and RPL18 according to the ΔCt method; RPS18, ACTb, and RPL28 according to BestKeeper; ACTb, RPS15, and RPS18 according to NormFinder; and RPL28, RPS15, and RPL18 according to GeNorm (Table 2). Based on RefFinder, the order of reference gene stability across all samples was: RPS15 > ACTb > RPS18 > RPL28 > RPL18 > SDHA > UBCE > GAPDH > EF1a > TUB > RPS13 > RSP5 (Figure 3G). The GeNorm analysis showed that only the pair-wise values of V6/7 to V7/8 were less than the cut-off value of 0.15 (Figure 4). Therefore, RPS15, ACTb, and RPS18 were regarded as the most suitable reference genes for qRT-PCR (Table 3).

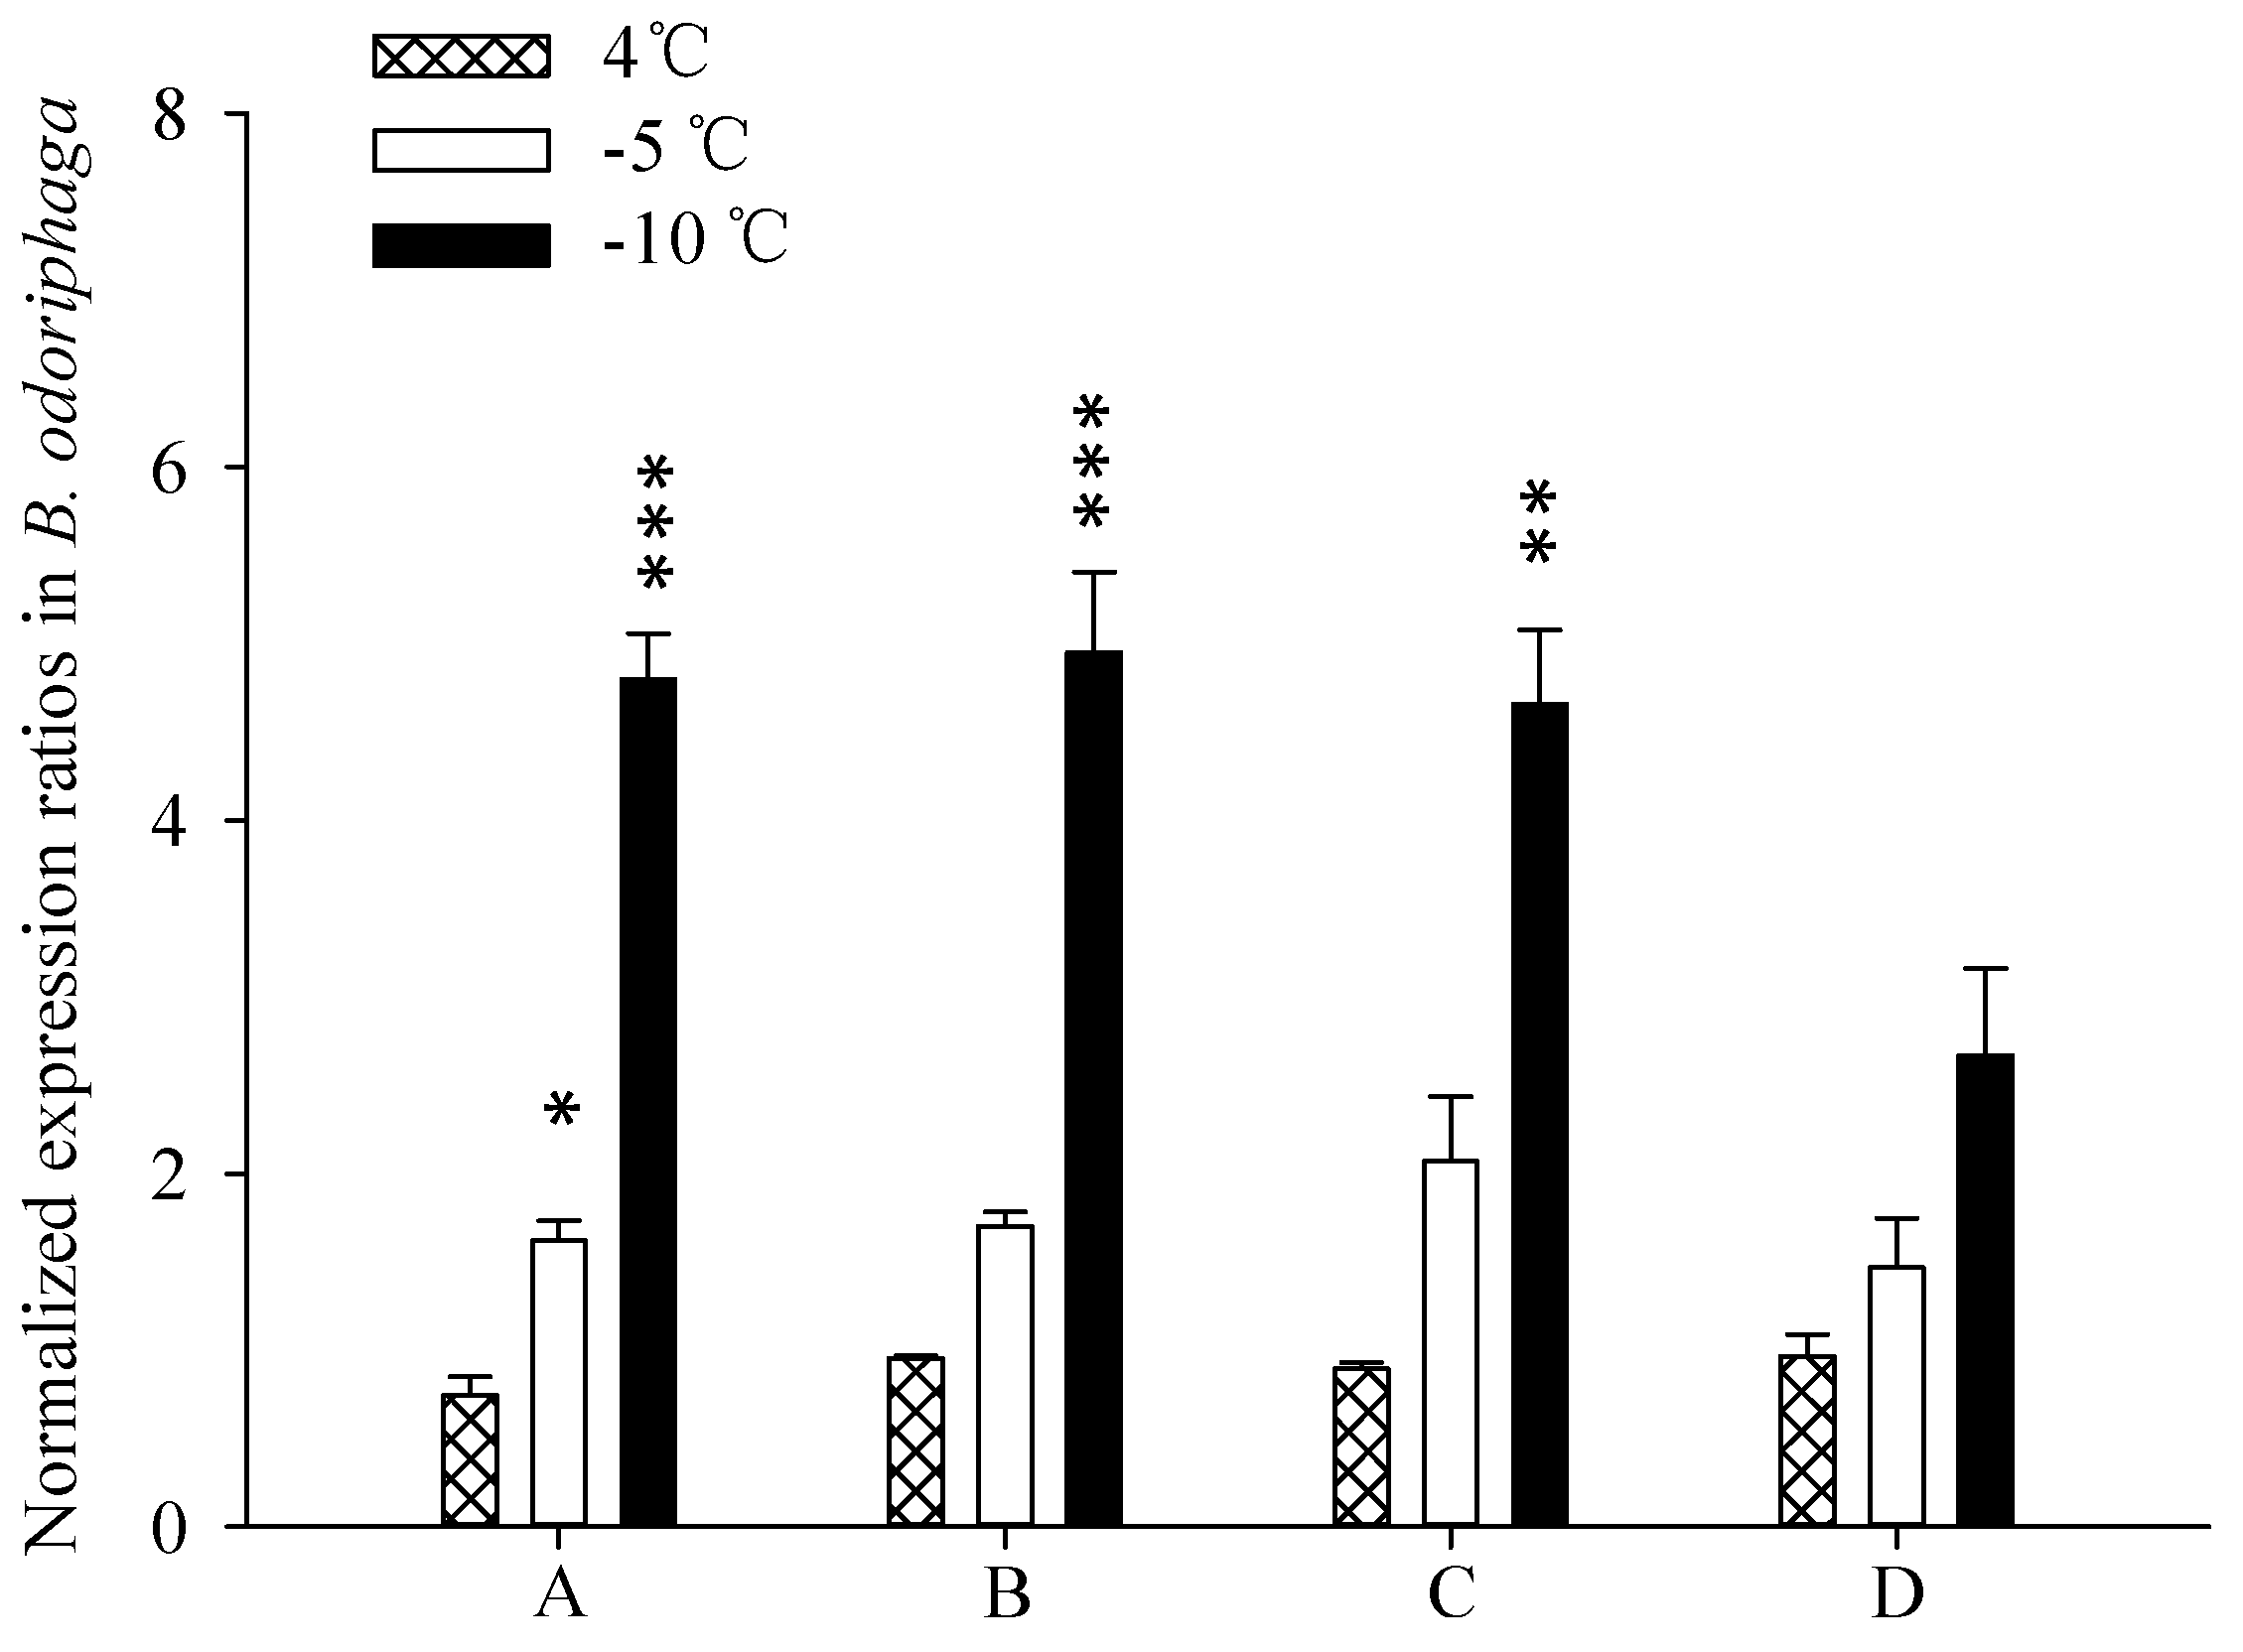
2.5. Target Gene Expression

The selection failure of internal controls led to remarkable differences in quantification target genes. The relative expression level of HSP23 significantly differed among temperature treatments (4, −5, or −10 °C) when normalized by the most stable reference genes (such as RPS15) (Figure 5). Similar changes observed in analyzing relative expression level of HSP23 with the normalization of two reference genes (such as RPS15 and RPL28) (Figure 5) or three reference genes (such as RPS15, RPL28, and GAPDH) (Figure 5). HSP23 in B. odoriphaga was found to be up-regulated under low temperatures, especially when the temperature was below −10 °C. However, HSP23 expression did not significantly differ among these treatments when expression was calculated with an arbitrary reference gene (such as ACTb) (Figure 5).

3. Discussion

Results obtained with qRT-PCR depend on several critical factors including RNA quantity, primer efficiency, and an internal control, i.e., a reference gene. When mRNA expression level is determined by qRT-PCR, the RNA must be intact, and primer efficiency must be determined [26]. Here, the OD ratio (A260/A280) of all RNA samples were between 1.8 and 2.0, and the amplification efficiency of the 12 candidates ranged from 90% to 110% (all R2 > 0.990) (Table 1). Thus, the quality of the RNA and amplification was sufficient for qRT-PCR.
Previous researches have reported that expression level of reference genes is not always stable under all experimental conditions [27,28,29] and that mRNA expression levels varied among several housekeeping genes [2,30]. These earlier findings were confirmed in the current study with B. odoriphaga (Table 2). In the current study, none of the candidate genes exhibited the same level of expression under all experiment conditions [31]. This indicates that reference genes need to be optimized and chosen depending on experimental parameters. Our data showed that, among the tested genes, mRNA expression of RPS15 was the most stable across development stages, temperatures, pesticide treatment, and all samples of B. odoriphaga, which is consistent with previous studies concerning development stage and temperature treatments for Nilaparvata lugens [9] and insecticide treatments for Helicoverpa armigera [32]. In B. odoriphaga, RSP5 was the most stable gene across photoperiod treatments, while RPS13 was the most stable across populations.
Previous studies have reported high expression stability for genes in the ribosomal protein (RP) genes family [27,33]. For example, among different organs, geographic populations, pesticide treatments, and starvation treatments, expression stability in Nilaparvata lugens was highest for RPS11 [9]; among different organs and developmental stages of Tetranychus cinnabarinus, expression stability was highest for RPS18 [34]; in Phenacoccus solenopsis, expression stability among temperature treatments was highest for RPL32 [35]; among different developmental stages of Schistocerca gregaria, expression stability was highest for RPL49 [36]; among different organs and developmental stages of Cimex lectularius, expression stability was highest for RPL18 [37]; in Spodoptera litura, expression stability among different larval tissues, populations, and food treatments was highest for RPL10 [33]; in Plutella xylostella, expression stability among different developmental stages and photoperiods was highest for RPS13 [38]; in response to virus infection in Tribolium castaneum, expression stability was highest for RPS3 [39]; and in Helicoverpa armigera, expression stability among temperature treatments was highest for RPL28 [40]. As a principal component of ribosomes, ribosomal protein (RP) is important in intracellular protein biosynthesis, DNA repair, cell differentiation, etc. [31]. These results indicate that ribosomal protein genes might be useful as reference genes in interest gene expression studies. In the current study with B. odoriphaga, however, an exception was that RPS13 showed the least steady expression across photoperiod treatments. Another exception was reported for Rhodnius prolixus: RPL26 was the most variable gene in the salivary glands of starved and non-starved specimens [41].
Because actin is the main structural protein of the cellular skeleton and is important for cell function [42], expression of the actin gene is substantial in most cell types [43]. The actin gene is the most stable gene in Chilo suppressalis [44], Schistocerca gregaria [36], and Apis mellifera [45]. Our study showed that ACTb is an ideal reference gene in B. odoriphaga subjected to diet treatments. In Helicoverpa armigera, however, ACTb exhibited the least stable expression in response to photoperiod and temperature treatments [40]. These results further confirmed that validating the stability of reference gene is very significant. The suitability of reference genes relative to both species and experimental conditions.
In addition to be affected by species and conditions [40], the ranking of reference gene stability is also affected by the tools used to perform the ranking. In the current study with B. odoriphaga, for example, the most stable genes across temperature treatments were RPS15, RPL28, and GAPDH by using NormFinder and ΔCt method but were RPL28, RPS15, and UBCE due to BestKeeper. This difference in ranking probably results from differences in the statistical algorithms: while BestKeeper individually analyzes the stability among candidate reference genes, NormFinder and the ΔCt method mainly think of the pair-wise variation between two candidate genes, and then confirm the stability of one of them [44,46]. Therefore, we used RefFinder software to comprehensively estimate the stability ranking of the 12 candidates. In addition, the optimal number of reference genes was confirmed by GeNorm, which calculates the pair-wise variation (Vn/Vn + 1) between the continuous standardization factors or NF (NFn and NFn + 1) [14] (Figure 3). If the first V value (V2/3) is <0.15, this indicates that two reference genes are enough for reliable normalization [14]. Nevertheless, the most appropriate number of reference genes also appears arbitrary without proper statistical verification under appropriate experimental condition. Some analyses, for example, failed to achieve Vn/n + 1 <0.15, but could get relatively stable expression genes across final ranking estimated by GeNorm [47]. The most suitable number of reference genes conforms to the steadiest NF feasible with a unique sample set and a unique panel of candidates [48].
Random selection of reference genes reduces the accuracy of detecting interest genes expression because such a standardization strategy will be either under-estimate or over-estimate the expression differences among specimens. Such as the expression level of HSP23 among different temperature samples did not significantly differ using ACTb as internal control, but did significantly differ using other reference gene (such as RPS15) (Figure 5). Normalization with two or more stable reference genes may be demanded, and researchers have recommended that multiple normalization genes were used to get more credible results [49,50,51]. Vandesompele et al. [14] recommended that reliable normalization needs at least three reference genes, and the pair-wise variation analysis in GeNorm hinted the need to include more than two genes in the current study. According to the ranking of expression stability among the 12 candidates evaluated by RefFinder in this work, we selected RPS15, RPL28, and GAPDH to assess the target gene HSP23 in B. odoriphaga under different temperatures; the results showed that HSP23 expression was up-regulated by low temperature, which was consistent with an earlier study that used RPS20 as reference gene [52]. In the current study, however, an arbitrarily selected reference gene (such as ACTb) failed to detect a significant effect of temperature on the expression profile of HSP23. Therefore, optimization of reference genes is critical for exact normalization of mRNA, especially for the subtle difference. To improve the accuracy of results, it is necessary to use the panel of selected housekeeping genes for any sample set.

4. Materials and Methods

4.1. Insects

B. odoriphaga was collected from a Chinese chive field on the Yang Town farm, ShunYi area (40°1′ N, 116°6′ E), Beijing, China. Individuals were reared for three generations with rhizomes of Chinese chive in an incubator (MLR-352H-PC) at 25 ± 1 °C, 70% ± 5% relative humidity, and 12:12 (L:D). The specimens were promptly put into liquid nitrogen for further RNA isolation, and then screened following 12 candidate genes and amplification efficiencies.

4.2. Factors that Could Affect the Expression of Housekeeping Genes

The effects of the following factors on candidate reference genes mRNA were measured: developmental stage, temperature, population, pesticide exposure, diet, and photoperiod. After “exposure” to each factor (as described in the following sections), the specimens were placed in liquid nitrogen and then saved in −80 °C fridge for further study. Each factor was assessed in three independent experiments.

4.2.1. Developmental Stages

Each of the six developmental stages of B. odoriphaga was placed in an Eppendorf tube (1.5-mL) as follows: adults (10 per tube), eggs (200 per tube), 1st-instar larvae (20 per tube), 2nd-instar larvae (20 per tube), 3rd-instar larvae (6 per tube), 4th-instar larvae (4 per tube), and pupae (4 per tube). The tubes were frozen and stored.

4.2.2. Temperatures

Groups of 20 4th-instar larvae were placed in a plastic Petri dish and exposed to 25, 4, −5, or −10 °C. After 4 h, they were exposed to 25 °C for another 24 h. Four living insects per group were then put in the tube (1.5-mL), frozen, and stored.

4.2.3. Pesticides

Groups of 40 4th-instar larvae were sprayed in culture dishes (Ф = 60 mm) with the LC90 value of allyl isothiocyanate, lime nitrogen, or thiamethoxam. An additional group of 40 larvae was sprayed with distilled water. After 24 h at 25 °C, four living larvae per group were saved in a 1.5-mL plastic tube, frozen, and stored.

4.2.4. Photoperiods

Groups of 20 4th-instar larvae in plastic Petri dishes were exposed to the following photoperiods (L:D): 24:0, 12:12, or 0:24. After 96 h, 12 individuals per group were stored with a 1.5-mL tube, frozen, and stored.

4.2.5. Diets

Groups of four 4th-instar larvae were maintained in an incubator at 25 ± 1 °C, 70% ± 5% relative humidity, and 12:12 (L:D) and were provided with one of the following: ginger slices, garlic bulbs, Chinese chive rhizomes, onion bulbs, or artificial diet [53]. After three generations, four larvae were placed into a 1.5-mL Eppendorf tube, frozen, and stored.

4.2.6. Populations

Larvae collected from three locations in China (Dezhou, Shandong; Baoding, Hebei; and Shunyi, Beijing) were reared on rhizomes of Chinese chive in an incubator at 25 ± 1 °C, 70 ± 5% relative humidity, and 12:12 (L:D). In the third generation, 12 4th-instar larvae from each population were placed in 1.5-mL micro centrifuge tubes (four larvae per tube), frozen, and stored.

4.3. Candidate Reference Genes

We assessed 12 “housekeeping” genes are known as reference genes selected from other insects. They were EF1a, UBCE, RSP5, GAPDH, RPS18, RPL18, ACTb, SDHA, RPL28, RPS13, RPS15, and TUB [33,34,36,40]. The sequences were obtained from our B. odoriphaga transcriptome data. The secondary structure of DNA template was predicted by the mfold web server [54], with the sets as follows: melting temperature for 60 °C; Na+ concentration for 50 mM; Mg2+ concentration for 3 mM; and linear DNA sequence. Other parameters were used as default. The primers used here were designed and checked by NCBI (National center for Biotechnology Information) Primer-BLAST, under the following conditions: primer GC content between 40% and 60%; primer melting temperature for 60 °C; and PCR products size of between 80 and 200 base pairs (Table 1).

4.4. Total RNA Abstraction and cDNA Synthesis

Total RNA was abstracted by the Trizol method. Each sample was homogenized with 1 mL of Trizol in a glass homogenizer following the manufacturer’s protocol (TIANGEN, Beijing, China). The quality and quantity of RNA were assessed with a Thermo Scientific NanoDrop 2000c UV-Vis spectrophotometer (Thermo Fisher Scientific Inc., Waltham, MA, USA). The quality of the nucleic acid sample was considered good if the OD ratio (A260/A280) was between 1.81 and 2.05. The cDNA was synthesized using the TransScript® (TAKARA, Japan) All-in-One First-Strand cDNA Synthesis SuperMix in a 20 µL volume, with 4 µL 5× TransScript® Buffer, 1 µg total RNA, and 1 µL gDNA Remover. Following the manufacturer’s instruction, the 20-µL mixture was reacted in a Bio-rad PCR machine for 15 min at 42 °C before both the TransScript® RT and gDNA remover were inactivated for 5 s at 85 °C. The cDNA was stored at −20 °C.

4.5. qRT-PCR

Each reaction was operated in a 20-µL solution including 0.4 µL cDNA, 10 µL 5× TransStart® SuperMix, 0.4 µL forward primer, 0.4 µL reverse primer, and 0.4 µL 50× Passive Reference Dye. The amplification conditions for the qRT-PCR were set as follows: 94 °C for 30 s, followed by 40 cycles of 94 °C for 5 s, 60 °C for 15 s, and 72 °C for 34 s. Then, the 10-fold dilution series of cDNA was used for a standard curve. The melting curve analysis from 80 to 90 °C was used for assuring specificity of the amplified product [55]. The corresponding qRT-PCR efficiencies (E) were counted by means of the equation: E = (10[−1/slope] − 1) × 100 [30,55].

4.6. Constancy of Gene Expression

The constancy of candidate genes was estimated by the ΔCt method [46] and with the following software: BestKeeper [56], GeNorm [14], and NormFinder [4]. The lower the value estimated by these algorithms, the greater the stability of expression. RefFinder [57], a useful web-based tool, was applied to estimate and screen the most suitable reference genes by combining the results of the four algorithms. Based on rankings from each algorithm, RefFinder assigned a suitable weight to each gene and counted the geometric mean of the overall ultimate ranking.

4.7. Evaluation of a Target Gene Expression

To select the suitable reference genes from 12 candidates, we estimated latent up- or down-regulation of the HSP23 gene in B. odoriphaga under different temperature treatments. Gene expression ratios were calculated by using the formula (2−ΔΔCt) [58].
ΔCt =Ct (target gene) − Ct (reference gene)
ΔΔCtCt (sample) − ΔCt (control)

4.8. Statistical Analysis

Results are showed as means ± SD. The means were calculated with Tukey’s test at p < 0.05 by the software SPSS 19.0 for Windows (SPSS Inc., Chicago, IL, USA).

5. Conclusions

In summary, we first systematically evaluated 12 candidate reference genes in B. odoriphaga under various conditions. Four algorithms (NormFinder, BestKeeper, GeNorm, and the comparative ΔCt method) were used for evaluating the suitable reference genes. RefFinder, which was applied to combine the results of the different algorithms, then indicated that the most suitable reference genes were RPS15, RPL18, and RPS18 across developmental phases; RPS15, RPL28, and GAPDH across temperatures; RPS15 and RPL18 across pesticide treatments; RSP5, RPS18, and SDHA across photoperiods; ACTb, RPS18, and RPS15 across diets; RPS13 and RPL28 across populations; and RPS15, ACTb, and RPS18 across all samples. The use of the best reference genes vs. an arbitrarily selected reference gene resulted in substantial differences in the estimation of expression of a target gene. The results of this study will be valuable for research concerning gene function in B. odoriphaga.

Acknowledgments

This work was supported by Special Fund for Agro-scientific Research in the Public Interest (201303027), the Key Laboratory of Vegetable Genetics and Physiology, Ministry of Agriculture, China Agriculture Research System (CARS-26-10), and Beijing Training Project for the Leading Talents in S &T (LJRC201412).

Author Contributions

Caihua Shi and Fengshan Yang conceived and designed the experiments; Caihua Shi performed the experiments; Caihua Shi, Xun Zhu and Yuting Yang analyzed the data; Qingjun Wu, Shaoli Wang and Youjun Zhang contributed reagents/materials/analysis tools; Caihua Shi and Erxia Du wrote the paper; and Youjun Zhang contributed to the final editing and supervised the project.

Conflicts of Interest

The authors declared no conflict of interest.

References

  1. Bustin, S.A. Absolute quantification of mRNA using real-time reverse transcription polymerase chain reaction assays. J. Mol. Endocrinol. 2000, 25, 169–193. [Google Scholar] [CrossRef] [PubMed]
  2. Bustin, S.A. Quantification of mRNA using real-time reverse transcription PCR (RT-PCR): Trends and problems. J. Mol. Endocrinol. 2002, 29, 23–39. [Google Scholar] [CrossRef] [PubMed]
  3. Kubista, M.; Andrade, J.M.; Bengtsson, M.; Forootan, A.; Jonak, J.; Lind, K.; Sindelka, R.; Sjobac, R.; Sjogreen, B.; Strombom, L.; et al. The real-time polymerase chain reaction. Mol. Asp. Med. 2006, 27, 95–125. [Google Scholar] [CrossRef] [PubMed]
  4. Hao, X.Y.; Horvath, D.P.; Chao, W.S.; Yang, Y.J.; Wang, X.C.; Xiao, B. Identification and evaluation of reliable reference genes for quantitative real-time PCR analysis in tea plant (Camellia sinensis (L.) O. Kuntze). Int. J. Mol. Sci. 2014, 15, 22155–22172. [Google Scholar] [CrossRef] [PubMed]
  5. Fleige, S.; Pfaffl, M.W. RNA integrity and the effect on the real-time qRT-PCR performance. Mol. Asp. Med. 2006, 27, 126–139. [Google Scholar] [CrossRef] [PubMed]
  6. Suzuki, T.; Higgins, P.J.; Crawford, D.R. Control selection for RNA quantitation. Biotechniques 2000, 29, 332–337. [Google Scholar] [PubMed]
  7. Coulson, D.T.R.; Brockbank, S.; Quinn, J.G.Q.; Murphy, S.; Ravid, R.; Irvine, G.B.; Johnston, J.A. Identification of valid reference genes for the normalization of RT qPCR gene expression data in human brain tissue. BMC Mol. Biol. 2008, 9, 1–11. [Google Scholar] [CrossRef] [PubMed]
  8. Su, Y.L.; He, W.B.; Wang, J.; Li, J.M.; Liu, S.S.; Wang, X.W. Selection of endogenous reference genes for gene expression analysis in the Mediterranean species of the Bemisia tabaci (Hemiptera: Aleyrodidae) complex. J. Econ. Entomol. 2013, 106, 1446–1455. [Google Scholar] [CrossRef] [PubMed]
  9. Yuan, M.; Lu, Y.H.; Zhu, X.; Wan, H.; Shakeel, M.; Zhan, S.; Jin, B.R.; Li, J.R. Selection and evaluation of potential reference genes for gene expression analysis in the brown planthopper, Nilaparvata lugens (Hemiptera: Delphacidae) using reverse-transcription quantitative PCR. PLoS ONE 2014, 9, e86503. [Google Scholar] [CrossRef] [PubMed]
  10. Zhang, L.; He, L.L.; Fu, Q.T.; Xu, Z.F. Selection of reliable reference genes for gene expression studies in the biofuel plant Jatropha curcas using real-time quantitative CPR. Int. J. Mol. Sci. 2013, 14, 24338–24354. [Google Scholar] [CrossRef] [PubMed]
  11. Gutierrez, L.; Mauriat, M.; Guenin, S.; Pelloux, J.; Lefebre, J.E.; Louvet, R.; Rusterucci, C.; Moritz, T.; Guerineau, F.; Bellini, C.; et al. The lack of a systematic validation of reference genes: A serious pitfall undervalued in reverse transcription-polymerase chain reaction (RT-PCR) analysis in plants. Plant Biotechnol. J. 2008, 6, 609–618. [Google Scholar] [CrossRef] [PubMed]
  12. Thellin, O.; Zorzi, W.; Lakaye, B.; de Borman, B.; Coumans, B.; Hennen, G.; Grisar, T.; Igout, A.; Heinen, E. Housekeeping genes as internal standards: Use and limits. J. Biotechnol. 1999, 75, 291–295. [Google Scholar] [CrossRef]
  13. Stürzenbaum, S.R.; Kille, P. Control genes in quantitative molecular biological techniques: The variability of invariance. Comp. Biochem. Physiol. 2001, 130, 281–289. [Google Scholar] [CrossRef]
  14. Vandesompele, J.; de Preter, K.; Pattyn, F.; Poppe, B.; van Roy, N.; de Paepe, A.; Speleman, F. Accurate normalization of real-time quantitative RT-PCR data by geometric averaging of multiple internal control genes. Genome Biol. 2002, 3, 0034.1–0034.11. [Google Scholar] [CrossRef] [Green Version]
  15. Wang, E.L.; Wang, K.Y.; Chen, D.F.; Wang, J.; He, Y.; Long, B.; Yang, L.; Yang, Q.; Geng, Y.; Huang, X.L.; et al. Evaluation and selection of appropriate reference genes for real-time quantitative PCR analysis of gene expression in Nile Tilapia (Oreochromis niloticus) during vaccination and infection. Int. J. Mol. Sci. 2015, 16, 9998–10015. [Google Scholar] [CrossRef] [PubMed]
  16. Peters, I.R.; Peeters, D.; Helps, C.R.; Day, M.J. Development and application of multiple internal reference (housekeeper) gene assays for accurate normalisation of canine gene expression studies. Vet. Immunol. Immunopathol. 2007, 117, 55–66. [Google Scholar] [CrossRef] [PubMed]
  17. Yabuki, Y.; Mukaida, Y.; Saito, Y.; Oshima, K.; Takahashi, T.; Muroi, E.; Hashimoto, E.; Uda, Y. Characterisation of volatile sulphur-containing compounds generated in crushed leaves of Chinese chive (Allium tuberosum Rottler). Food Chem. 2010, 120, 343–348. [Google Scholar] [CrossRef]
  18. Misawa, T.; Kuninaga, S. First report of while leaf rot on Chinese chives caused by Rhizoctonia solani AG-2-1. J. Gen. Plant Pathol. 2013, 79, 280–283. [Google Scholar] [CrossRef]
  19. Yang, J.K.; Zhang, X.M. Notes on the fragrant onion gnats with descriptions of two new species of Bradysia (Diptera: Sciaridae). Acta Agric. Univ. Pekin. 1985, 11, 153–156. [Google Scholar]
  20. Yang, Y.T.; Li, W.X.; Xie, W.; Wu, Q.J.; Xu, B.Y.; Wang, S.L.; Li, C.R.; Zhang, Y.J. Development of Bradysia odoriphaga (Diptera: Sciaridae) as affected by humidity: An age-stage, two-sex, life-table study. Appl. Entomol. Zool. 2015, 50, 3–10. [Google Scholar] [CrossRef]
  21. Mei, Z.X.; Wu, Q.J.; Zhang, Y.J.; Hua, L. The biology, ecology and management of Bradysia odoriphaga. Entomol. Knowl. 2003, 40, 396–398. [Google Scholar]
  22. Dang, Z.H.; Dong, J.H.; Gao, Z.L.; Jia, H.M.; Zhang, K.J.; Pan, W.L. Biology and injury of Bradysia odoriphaga on leek in different types of cultivation. J. Agric. Univ. Hebei 2002, 24, 65–68. [Google Scholar]
  23. Li, H.J.; He, X.K.; Zeng, A.J.; Liu, Y.J.; Jiang, S.R. Bradysia odoriphaga copulatory behavior and evidence of a female sex pheromone. J. Agric. Urban Entomol. 2007, 24, 27–34. [Google Scholar] [CrossRef]
  24. Li, W.X.; Yang, Y.T.; Xie, W.; Wu, Q.J.; Xu, B.Y.; Wang, S.L.; Zhu, X.; Wang, S.J.; Zhang, Y.J. Effects of Temperature on the Age-Stage, Two-Sex Life Table of Bradysia odoriphaga (Diptera: Sciaridae). J. Econ. Entomol. 2015, 108, 126–134. [Google Scholar] [CrossRef] [PubMed]
  25. Zhang, P.; Liu, F.; Mu, W.; Wang, Q.H.; Li, H.; Chen, C.Y. Life table study of the effects of sublethal concentrations of thiamethoxam on Bradysia odoriphage Yang and Zhang. Pestic. Biochem. Phys. 2014, 111, 31–37. [Google Scholar] [CrossRef] [PubMed]
  26. Bustin, S.A.; Benes, V.; Garson, J.A.; Hellemans, J.; Huggett, J.; Kubista, M.; Mueller, R.; Nolan, T.; Pfaffl, M.W.; Shipley, G.L.; et al. The MIQE guidelines: Minimum information for publication of quantitative real-time PCR experiments. Clin. Chem. 2009, 55, 611–622. [Google Scholar] [CrossRef] [PubMed]
  27. Li, R.M.; Xie, W.; Wang, S.L.; Wu, Q.J.; Yang, N.N.; Yang, X.; Pan, H.P.; Zhou, X.M.; Bai, L.Y.; Xu, B.Y.; et al. Reference gene selection for qRT-PCR analysis in the sweet potato whitefly, Bemisia tabaci. (Hemiptera: Aleyrodidae). PLoS ONE 2013, 8, e53006. [Google Scholar] [CrossRef] [PubMed]
  28. Zhu, X.; Yuan, M.; Shakeel, M.; Zhang, Y.J.; Wang, S.L.; Wang, X.; Zhan, S.; Kang, T.H.; Li, J.H. Selection and evaluation of reference genes for expression analysis using qRT-PCR in the beet armyworm Spodoptera exigua (Hübner) (Lepidoptera: Noctuidae). PLoS ONE 2014, 9, e84730. [Google Scholar] [CrossRef] [PubMed]
  29. Yang, C.X.; Pan, H.P.; Liu, Y.; Zhou, X.G. Selection of reference genes for expression analysis using quantitative real-time PCR in the pea aphid, Acyrthosiphon pisum (Harris) (Hemiptera: Aphidiae). PLoS ONE 2014, 9, e110454. [Google Scholar] [CrossRef] [PubMed]
  30. Radonic, A.; Thulke, S.; Mackay, I.M.; Landt, O.; Siegert, W.; Nitsche, A. Guideline to reference gene selection for quantitative real-time PCR. Biochem. Biophys. Res. Commun. 2004, 313, 856–862. [Google Scholar] [CrossRef] [PubMed]
  31. Ladror, D.T.; Frey, B.L.; Scalf, M.; Levenstein, M.E.; Artymiuk, J.M.; Smith, L.M. Methylation of yeast ribosomal protein S2 is elevated during stationary phase growth conditions. Biochem. Biophys. Res. Commun. 2014, 445, 535–541. [Google Scholar] [CrossRef] [PubMed]
  32. Zhang, S.D.; An, S.H.; Li, Z.; Wu, F.M.; Yang, Q.P.; Liu, Y.C.; Cao, J.J.; Zhang, H.J.; Zhang, Q.W.; Liu, X.X. Identification and validation of reference genes for normalization of gene expression analysis using qRT-PCR in Helicoverpa armigera (Lepidoptera: Noctuidae). Gene 2015, 555, 393–402. [Google Scholar] [CrossRef] [PubMed]
  33. Lu, Y.H.; Yuan, M.; Gao, X.W.; Kang, T.H.; Zhan, S.; Wan, H.; Li, J.H. Identification and validation of reference genes for gene expression analysis using quantitative PCR in Spodoptera litura (Lepidoptera: Noctuidae). PLoS ONE 2013, 8, e68059. [Google Scholar] [CrossRef] [PubMed]
  34. Sun, W.; Jin, Y.; He, L.; Lu, W.C.; Li, M. Suitable reference gene selection for different strains and developmental stages of the carmine spider mite, Tetranychus cinnabarinus, using quantitative real-time PCR. J. Insect Sci. 2010, 10, 1–12. [Google Scholar] [CrossRef] [PubMed]
  35. Chen, F.; Lu, Y.Y. Selection of reference genes in Phenacoccus solenopsis (Hemiptera: Pseudococcidae) under heat stress. Acta Entomol. Sin. 2014, 57, 1146–1154. [Google Scholar]
  36. Van Hiel, M.B.; Wielendaele, P.V.; Temmerman, L.; Soest, S.V.; Vuerinckx, K.; Huybrechts, R.; Broeck, J.V.; Simonet, G. Identification and validation of housekeeping genes in brains of the desert locust Schistocerca gregaria under different developmental conditions. BMC Mol. Biol. 2009, 10, 56. [Google Scholar] [CrossRef] [PubMed]
  37. Mamidala, P.; Rajarapu, S.P.; Jones, S.C.; Mittapalli, O. Identification and Validation of Reference Genes for Quantitative Real-Time Polymerase Chain Reaction in Cimex lectularius. J. Med. Entomol. 2011, 48, 947–951. [Google Scholar] [CrossRef] [PubMed]
  38. Fu, W.; Xie, W.; Zhang, Z.; Wang, S.; Wu, Q.; Liu, Y.; Zhou, X.M.; Zhou, X.G.; Zhang, Y. Exploring valid reference genes for quantitative real-time PCR analysis in Plutella xylostella (Lepidoptera: Plutellidae). Int. J. Biol. Sci. 2013, 9, 792–802. [Google Scholar] [CrossRef] [PubMed]
  39. Lord, J.C.; Hartzer, K.; Toutges, M.; Oppert, B. Evaluation of quantitative PCR reference genes for gene expression studies in Tribolium castaneum after fungal challenge. J. Microbiol. Methods 2010, 80, 219–221. [Google Scholar] [CrossRef] [PubMed]
  40. Shakeel, M.; Zhu, X.; Kang, T.H.; Wan, H.; Li, J.H. Selection and evaluation of reference genes for quantitative gene expression studies in cotton bollworm, Helicoverpa armigera (Lepidoptera: Noctuidae). J. Asia-Pac. Entomol. 2015, 18, 123–130. [Google Scholar] [CrossRef]
  41. Paim, R.M.; Pereira, M.H.; Ponzio, R.D.; Rodrigues, J.O.; Guarneri, A.A.; Gontijo, N.F.; Araújo, R.N. Validation of reference genes for expression analysis in the salivary gland and the intestine of Rhodnius prolixus (Hemiptera: Reduviidae) under different experimental conditions by quantitative real-time PCR. BMC Res. Notes 2012, 5, 128. [Google Scholar] [CrossRef] [PubMed]
  42. Hunter, T.; Garrels, J.I. Characterization of the mRNAs for α-, β- and γ-actin. Cell 1977, 12, 767–781. [Google Scholar] [CrossRef]
  43. Ponton, F.; Chapuis, M.P.; Pernice, M.; Sword, G.A.; Simpson, S.J. Evaluation of potential reference genes for reverse transcription-qPCR studies of physiological responses in Drosophila melanogaster. J. Insect Physiol. 2011, 57, 840–850. [Google Scholar] [CrossRef] [PubMed]
  44. Teng, X.; Zhang, Z.; He, G.; Yang, L.; Li, F. Validation of reference genes for quantitative expression analysis by real-time RT-PCR in four lepidopteran insects. J. Insect Sci. 2012, 12, 1–17. [Google Scholar] [CrossRef] [PubMed]
  45. Lourenco, A.P.; Mackert, A.; Cristino, A.S.; Simões, Z.L.P. Validation of reference genes for gene expression studies in the honey bee, Apis mellifera, by quantitative real-time RT-PCR. Apidologie 2008, 39, 372–385. [Google Scholar] [CrossRef]
  46. Silver, N.; Best, S.; Jiang, J.; Thein, S.L. Selection of housekeeping genes for gene expression studies in human reticulocytes using real-time PCR. BMC Mol. Biol. 2006, 7, 33. [Google Scholar] [CrossRef] [PubMed]
  47. Dheda, K.; Huggett, J.F.; Chang, J.S.; Kim, L.U.; Bustin, S.A. The implications of using an inappropriate reference gene for real-time reverse transcription PCR data normalization. Anal. Biochem. 2005, 344, 141–143. [Google Scholar] [CrossRef] [PubMed]
  48. Ling, D.J.; Salvaterra, P.M. Robust RT-qPCR data normalization: Validation and selection of internal reference genes during post-experimental data analysis. PLoS ONE 2011, 6, e17762. [Google Scholar] [CrossRef] [PubMed]
  49. Ferguson, B.S.; Nam, H.; Hopkins, R.G.; Morrison, R.F. Impact of reference gene selection for target gene normalization on experimental outcome using real-time qRT-PCR in adipocytes. PLoS ONE 2010, 5, e15208. [Google Scholar] [CrossRef] [PubMed]
  50. Veazey, K.J.; Golding, M.C. Selection of stable reference genes for quantitative RT-PCR comparisons of mouse embryonic and extra-embryonic stem cells. PLoS ONE 2011, 6, e27592. [Google Scholar] [CrossRef] [PubMed]
  51. Jiang, H.C.; Qian, Z.J.; Lu, W.; Ding, H.Y.; Yu, H.W.; Wang, H.; Li, J. Identification and characterization of reference genes for normalizing expression data from red swamp crawfish Procambarus clarkii. Int. J. Mol. Sci. 2015, 16, 21591–21605. [Google Scholar] [CrossRef] [PubMed]
  52. Colinet, H.; Hoffmann, A.A. Comparing phenotypic effects and molecular correlates of developmental, gradual and rapid cold acclimation responses in Drosophila melanogaster. Funct. Ecol. 2012, 26, 84–93. [Google Scholar] [CrossRef]
  53. Zhou, X.H.; Zhang, S.C.; Zhuang, Q.Y.; Zhang, A.S.; Li, L.L.; Men, X.Y.; Zhai, Y.F.; Yu, Y. Screening and evaluation of the artificial diets of Bradysia odoriphaga Yang et Zhang (Diptera: Sciaridae). Acta Entomol. Sin. 2015, 58, 1245–1252. [Google Scholar]
  54. Markham, N.R.; Zuker, M. DNAMelt web server for nucleic acid melting prediction. Nucleic Acids Res. 2005, 33, W577–W581. [Google Scholar] [CrossRef] [PubMed]
  55. Pfaffl, M.W. A new mathematical model for relative quantification in real-time RT-PCR. Nucleic Acids Res. 2001, 29, 2002–2007. [Google Scholar] [CrossRef]
  56. Pfaffl, M.W.; Tichopad, A.; Prgomet, C.; Neuvians, T.P. Determination of stable housekeeping genes, differentially regulated target genes and sample integrity: BestKeeper-Excel-Based tool using pair-wise correlations. Biotechnol. Lett. 2004, 26, 509–515. [Google Scholar] [CrossRef] [PubMed]
  57. Xie, F.; Sun, G.; Stiller, J.W.; Zhang, B. Genome-wide functional analysis of the cotton transcriptome by creating an integrated EST database. PLoS ONE 2011, 6, e26980. [Google Scholar] [CrossRef] [PubMed]
  58. Zhu, X.; Li, Y.L.; Chen, D.X.; Wu, P.; Yi, T.; Chen, T.; Zhang, J.S.; Chu, W.Y. Selection of reference genes for microRNA quantitative expression analysis in Chinese perch, Siniperca chuatsi. Int. J. Mol. Sci. 2015, 16, 8310–8323. [Google Scholar] [CrossRef] [PubMed]
Figure 1. Melting curve analysis of quantitative real-time PCR (qRT-PCR) amplification (using gene-specific primers) of 12 housekeeping gene and a target gene in B. odoriphaga: (A) ACTb; (B) EF1a; (C) GAPDH; (D) RPL18; (E) RPL28; (F) RPS15; (G) RPS18; (H) RSP5; (I) RPS13; (J) SDHA; (K) TUB; (L) UBCE; and (M) HSP23.
Ijms 17 01034 g001
Figure 2. Expression profiles of the 12 housekeeping genes in all specimens of B. odoriphaga as indicated by cycle threshold (Ct) values. Samples were from the assays with developmental stages, temperatures, populations, pesticides, diets, and photoperiods. Values are means ± SD.
Ijms 17 01034 g002
Figure 3. The stability of the 12 housekeeping genes in B. odoriphaga based on the Geomean method of RefFinder and measured across: (A) developmental stages (from adult to pupa); (B) temperatures; (C) pesticides; (D) photoperiods; (E) diets; (F) B. odoriphaga populations; and (G) all samples. For (BF), 4th-instar larvae were used.
Ijms 17 01034 g003
Figure 4. Pair-wise variation (Vn/Vn + 1) analysis of the number of candidate reference genes in B. odoriphaga. Pair-wise variation was analyzed by GeNorm software. A value <0.15 indicates that the normalization could not be dramatically changed by additional reference genes.
Ijms 17 01034 g004
Figure 5. Relative expression of a target gene, HSP23, was affected by three temperature treatments and standardized with different numbers, and kinds of reference genes. The expression level was separately normalized by: A (RPS15); B (RPS15 and RPL28); C (RPS15, RPL28 and GAPDH); or D (ACTb) reference genes. The reference genes were selected depending on the expression stability of the 12 housekeeping genes among the three temperature treatments. Values are means ± SD of three biology replications; the “*” means remarkable differences, * p < 0.05; ** p < 0.01; *** p < 0.001.
Ijms 17 01034 g005
Table 1. Features of the 12 housekeeping genes and one target gene in B. odoriphaga (Bradysia odoriphaga) samples.
Gene SymbolGene NameForward Primer (5′→3′)Reverse Primer (5′→3′)Product Length (bp)Efficiency (%)R2 *
ACTbβ-actinCGCCCCCGAAGAAATTGTTGGTCACGACCGGCAATGTCTA128107.011.000
EF1aElongation factor 1 alphaTGCAACTGCACTGCGAAAAGACACTTTGCCCTACCGTCTG153102.230.991
GAPDHGlyceraldehyde-3-phosphateGCTAGTGCCGGTGCTGAATAGACGCCACAGACGAACATTG144100.201.000
RPL18Ribosomal protein L18CCAACTGGCAAGGGAACTCTAGCTACGTCTGCGACCTCTA160101.260.998
RPL28Ribosomal protein L28CGTGCCCGACATTTTCATCAGACCAAGCCACTGTAACGGA180105.181.000
RPS15Ribosomal protein S15ATCGTGGCGTCGATTTGGATCTCATTTGGTGGGGCTTCCT164101.030.997
RPS18Ribosomal protein S18AACGAGCTGGTGAATGTACCGTGGACGACGTCAATTGTGTG144101.840.999
RSP5Similar to ubiquity family memberTCTACCAAAGGCGCACACATCAACCGCAAATCCACACGTT116103.851.000
RPS13Ribosomal protein S13AAGTACGTTTCGTCAGCGGTGTTTGCGAATAGCGACAGCC11797.350.999
SDHASuccinate dehydrogenaseTTGCCTGCTGAACAATTGGCGTCGGTACGCCACCCATATT13495.100.998
TUBAlpha tubulinACAGTGCAAGGGCTTACAGGGCTGTTGATACTCTGGGCGA159101.801.000
UBCEUbiquitin-conjugating enzymeACTACGGGCCGATTTAGCTGCATTTGGTCGCTTCTCGCTG101102.580.998
HSP23Small heat shock proteinGAGAGCTATGCATCGCGACAGCATTCTGCGGGTCGATTTC140106.860.997
The gene source was transcriptome data in all cases. * Regression coefficient obtained according to standard regression curve.
Table 2. Expression stability of the 12 candidate housekeeping genes in B. odoriphaga under various experimental conditions.
Experimental ConditionRankΔCtBestKeeperNormFinderGeNorm
Gene NameStandard ValueGene NameStandard ValueGene NameStandard ValueGene NameStandard Value
Developmental stages1RPS151.460RPS180.559SDHA0.455RPL18/RPS150.429
2RPL181.510RPS130.628ACTb0.481
3ACTb1.520RPL280.742GAPDH0.729RPS180.530
4SDHA1.530RPS150.745RPS150.757RPS130.626
5GAPDH1.620RPL180.757UBCE0.810RPL280.756
6RPS181.620SDHA0.824RPL180.927SDHA0.908
7UBCE1.640GAPDH0.856RPS181.140ACTb1.020
8RPS131.710ACTb0.970RSP51.221GAPDH1.080
9RPL281.770UBCE1.238RPL281.264UBCE1.130
10RSP51.950RSP51.652RPS131.273RSP51.259
11EF1a2.860EF1a1.754EF1a2.514EF1a1.520
12TUB3.990TUB3.942TUB3.870TUB1.931
Temperatures1RPS150.640RPL280.298RPS150.307RPL18/RSP50.476
2GAPDH0.680RPS150.432GAPDH0.397
3RPL280.690UBCE0.457RPL280.415RPL280.521
4RSP50.720SDHA0.457RSP50.478GAPDH0.564
5RPS130.750RPS130.468RPS130.515RPS150.581
6UBCE0.760TUB0.486UBCE0.522EF1a0.625
7EF1a0.770RPL180.498EF1a0.544UBCE0.654
8RPL180.800GAPDH0.564RPL180.612RPS130.674
9ACTb0.830RSP50.585ACTb0.645RPS180.696
10SDHA0.850ACTb0.608TUB0.682ACTb0.726
11RPS180.860EF1a0.712SDHA0.683SDHA0.748
12TUB0.860RPS180.721RPS180.695TUB0.767
Pesticides1RPS150.550SDHA0.277RPS150.297RPL28/RPS150.300
2RPL180.580EF1a0.305RPL180.323
3RPL280.580ACTb0.402RPS180.356RPL180.351
4RPS180.600TUB0.496RPL280.373GAPDH0.387
5UBCE0.610RPS180.506UBCE0.385UBCE0.413
6RPS130.620RPL180.511RPS130.387RPS180.438
7RSP50.630RSP50.518RSP50.424RSP50.470
8ACTb0.670RPS130.585ACTb0.471RPS130.492
9GAPDH0.670UBCE0.632GAPDH0.536ACTb0.535
10SDHA0.750RPS150.656SDHA0.591SDHA0.575
11EF1a0.830RPL280.684EF1a0.704EF1a0.622
12TUB0.880GAPDH0.774TUB0.765TUB0.664
Photoperiods1RSP51.620RSP50.526RSP50.324RPS18/UBCE0.542
2RPS151.680ACTb0.700SDHA0.363
3SDHA1.720RPS180.967RPL280.442RPL180.580
4RPL281.740SDHA0.998RPS150.523RPS150.655
5RPL181.760RPL281.035RPS180.849GAPDH0.746
6UBCE1.770UBCE1.047UBCE0.850RSP50.903
7RPS181.780RPS151.212RPL180.899SDHA1.009
8GAPDH1.900RPL181.335GAPDH1.071RPL281.074
9ACTb2.040GAPDH1.592ACTb1.337ACTb1.225
10TUB3.040TUB1.874TUB2.899TUB1.564
11EF1a3.090EF1a2.075EF1a2.956EF1a1.778
12RPS134.370RPS134.172RPS134.300RPS132.210
Diets1ACTb0.850RPS150.596ACTb0.333RPL18/RPS180.470
2RPS180.860EF1a0.604RPS180.435
3RPS150.920GAPDH0.638RPS150.550ACTb0.546
4RPL180.960TUB0.665RPL180.621RPL280.613
5RPL280.980ACTb0.777RPL280.683RPS130.673
6RPS131.020RPL280.803GAPDH0.728RPS150.719
7GAPDH1.050RPS130.805RPS130.735UBCE0.752
8UBCE1.060RPS180.864UBCE0.801GAPDH0.825
9TUB1.130RSP50.928TUB0.870TUB0.900
10RSP51.160SDHA0.956RSP50.920EF1a0.945
11EF1a1.190UBCE0.980EF1a0.977RSP50.984
12SDHA1.340RPL181.056SDHA1.154SDHA1.042
Populations1RPS130.760RPL280.200RPS130.189EF1a/RSP50.405
2RPS150.770SDHA0.214RPS150.247
3GAPDH0.770GAPDH0.366RPL280.324GAPDH0.430
4RPL280.790RPS130.404GAPDH0.364ACTb0.457
5RSP50.810ACTb0.406RSP50.445RPS150.498
6SDHA0.830RPS150.473SDHA0.448RPS130.527
7EF1a0.860EF1a0.474EF1a0.525RPL280.551
8ACTb0.860RPS180.503ACTb0.546SDHA0.567
9RPS180.960RSP50.517RPS180.604RPS180.625
10UBCE1.080RPL180.834UBCE0.830UBCE0.694
11RPL181.550UBCE0.937RPL181.472RPL180.829
12TUB1.740TUB1.576TUB1.674TUB0.981
All samples1RPS151.630RPS180.744ACTb0.565RPL28/RPS150.893
2ACTb1.650ACTb0.811RPS150.668
3RPL181.660RPL280.828RPS180.763RPL180.926
4RPS181.670SDHA0.917RPL180.768RPS180.968
5RPL281.710RPS150.925UBCE0.810ACTb1.054
6SDHA1.730RPL181.039SDHA0.826SDHA1.095
7GAPDH1.740GAPDH1.057RPL280.848GAPDH1.127
8UBCE1.760UBCE1.069GAPDH0.868UBCE1.171
9EF1a2.330EF1a1.192EF1a1.116EF1a1.354
10TUB2.990RSP52.125TUB2.623RPS131.620
11RPS133.030TUB2.210RPS132.774TUB1.857
12RSP53.320RPS132.274RSP53.062RSP52.101
Table 3. Recommended reference genes in B. odoriphaga under various experimental conditions.
Experimental ConditionReference Genes
Developmental stagesRPS15RPL18RPS18
TemperaturesRPS15RPL28GAPDH
PesticidesRPS15RPL18
PhotoperiodsRSP5RPS18SDHA
DietsACTbRPS18RPS15
PopulationsRPS13RPL28
All samplesRPS15ACTbRPS18

