The Protective Effect of Glycyrrhizic Acid on Renal Tubular Epithelial Cell Injury Induced by High Glucose

Abstract
: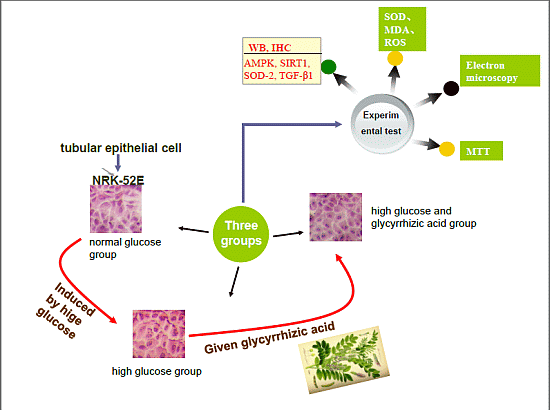
1. Introduction
2. Results and Discussion
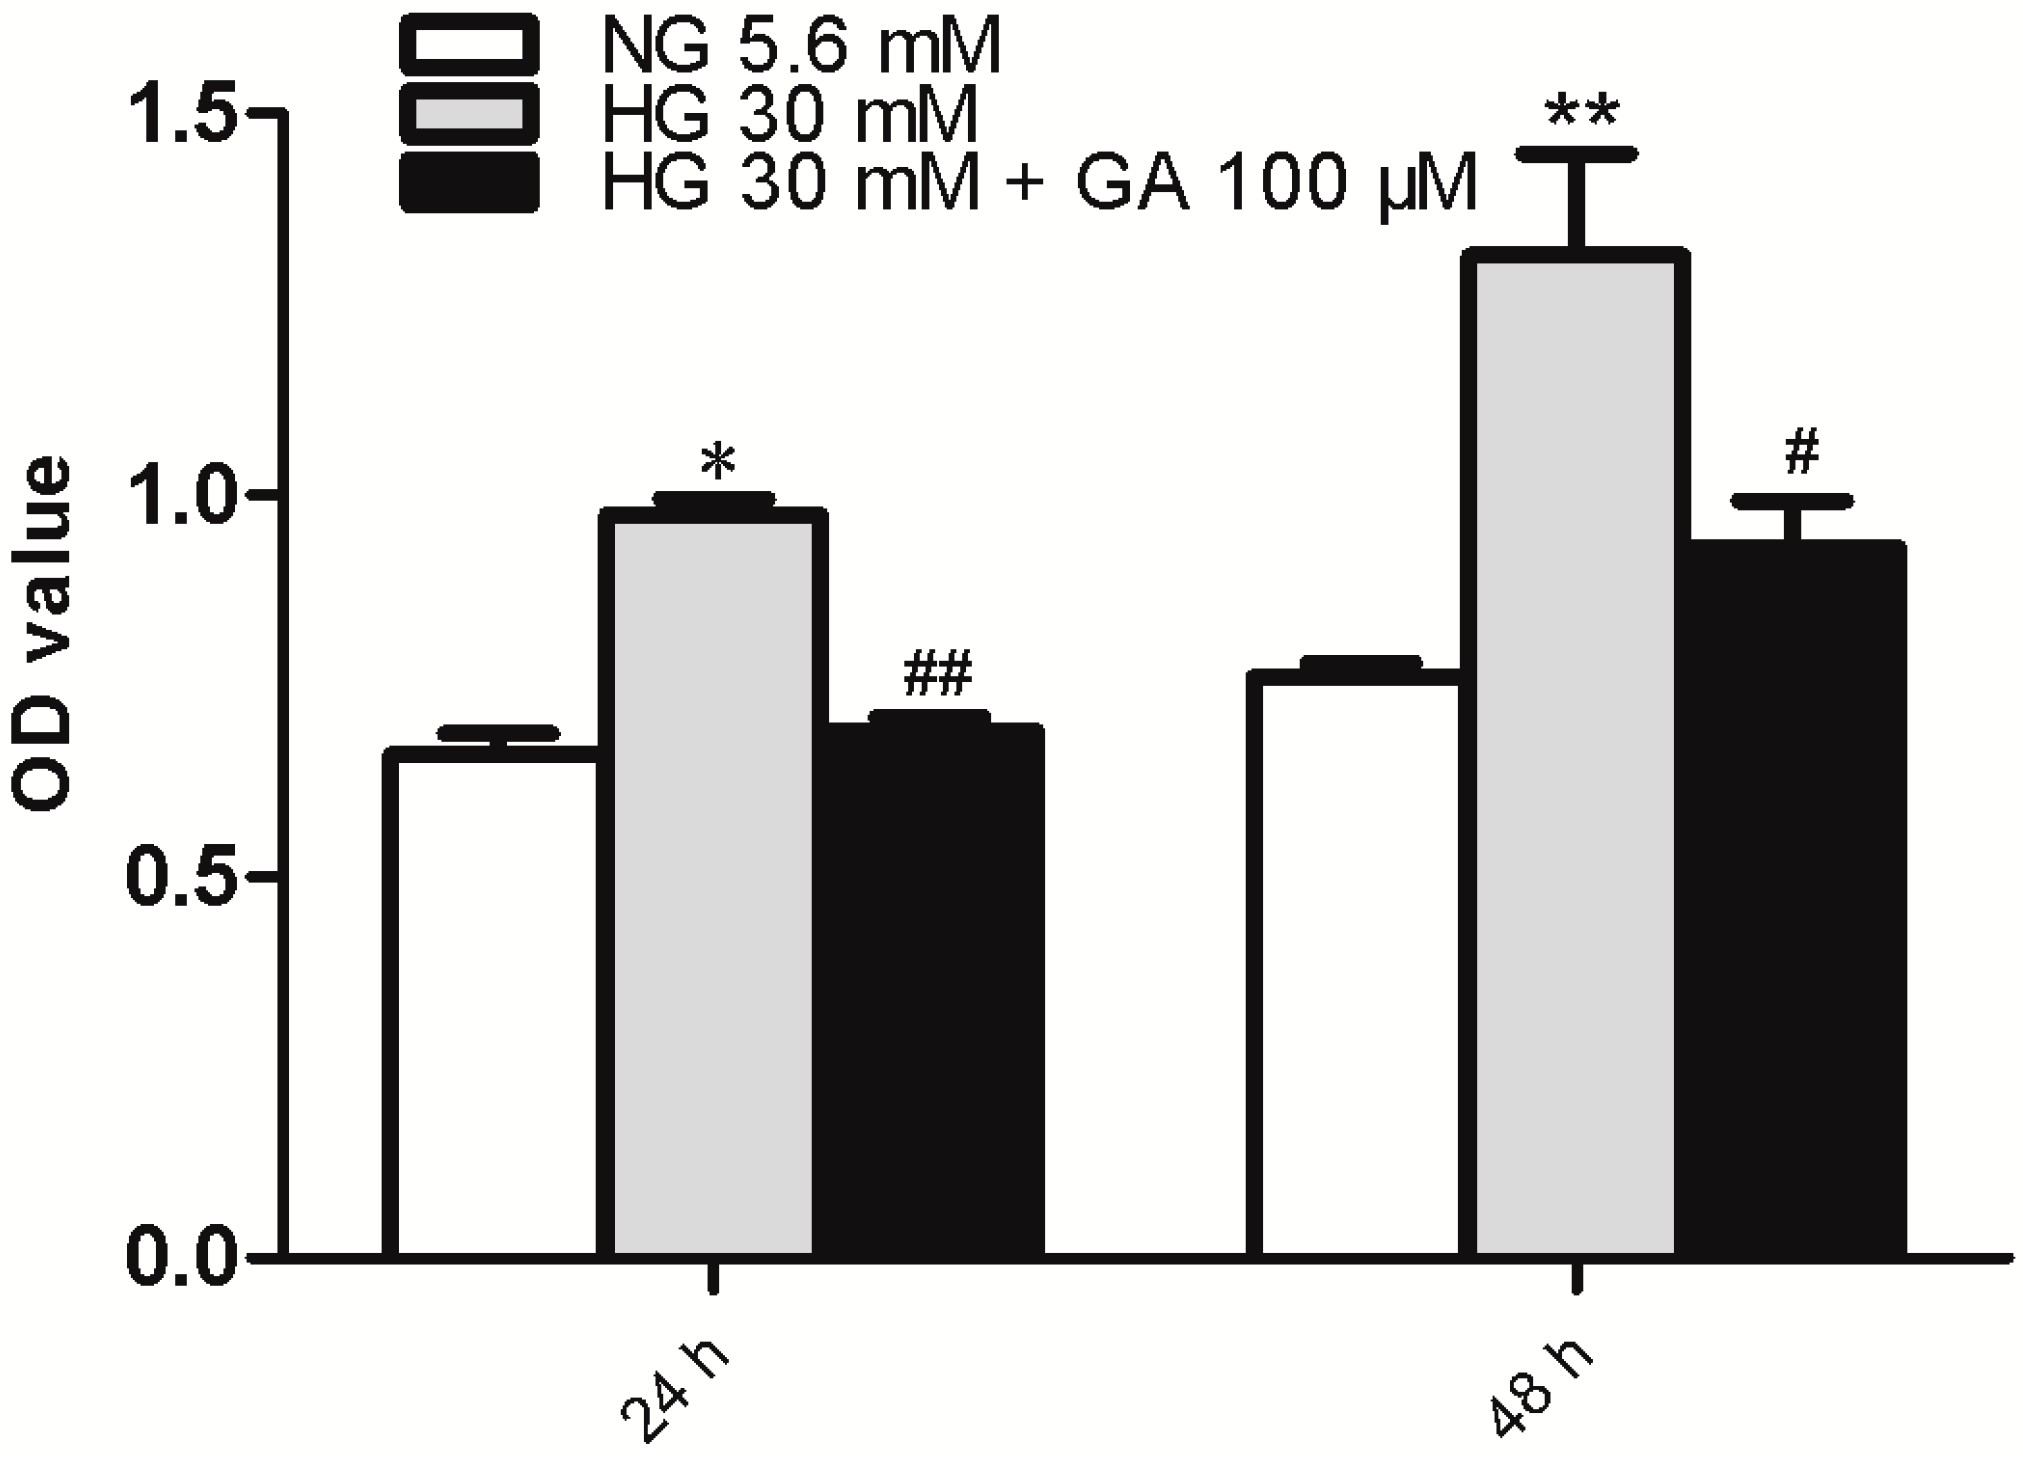
2.1. GA (Glycyrrhizic Acid) Reverses the High Glucose-Induced Effect on Cell Proliferation in NRK-52E Cells

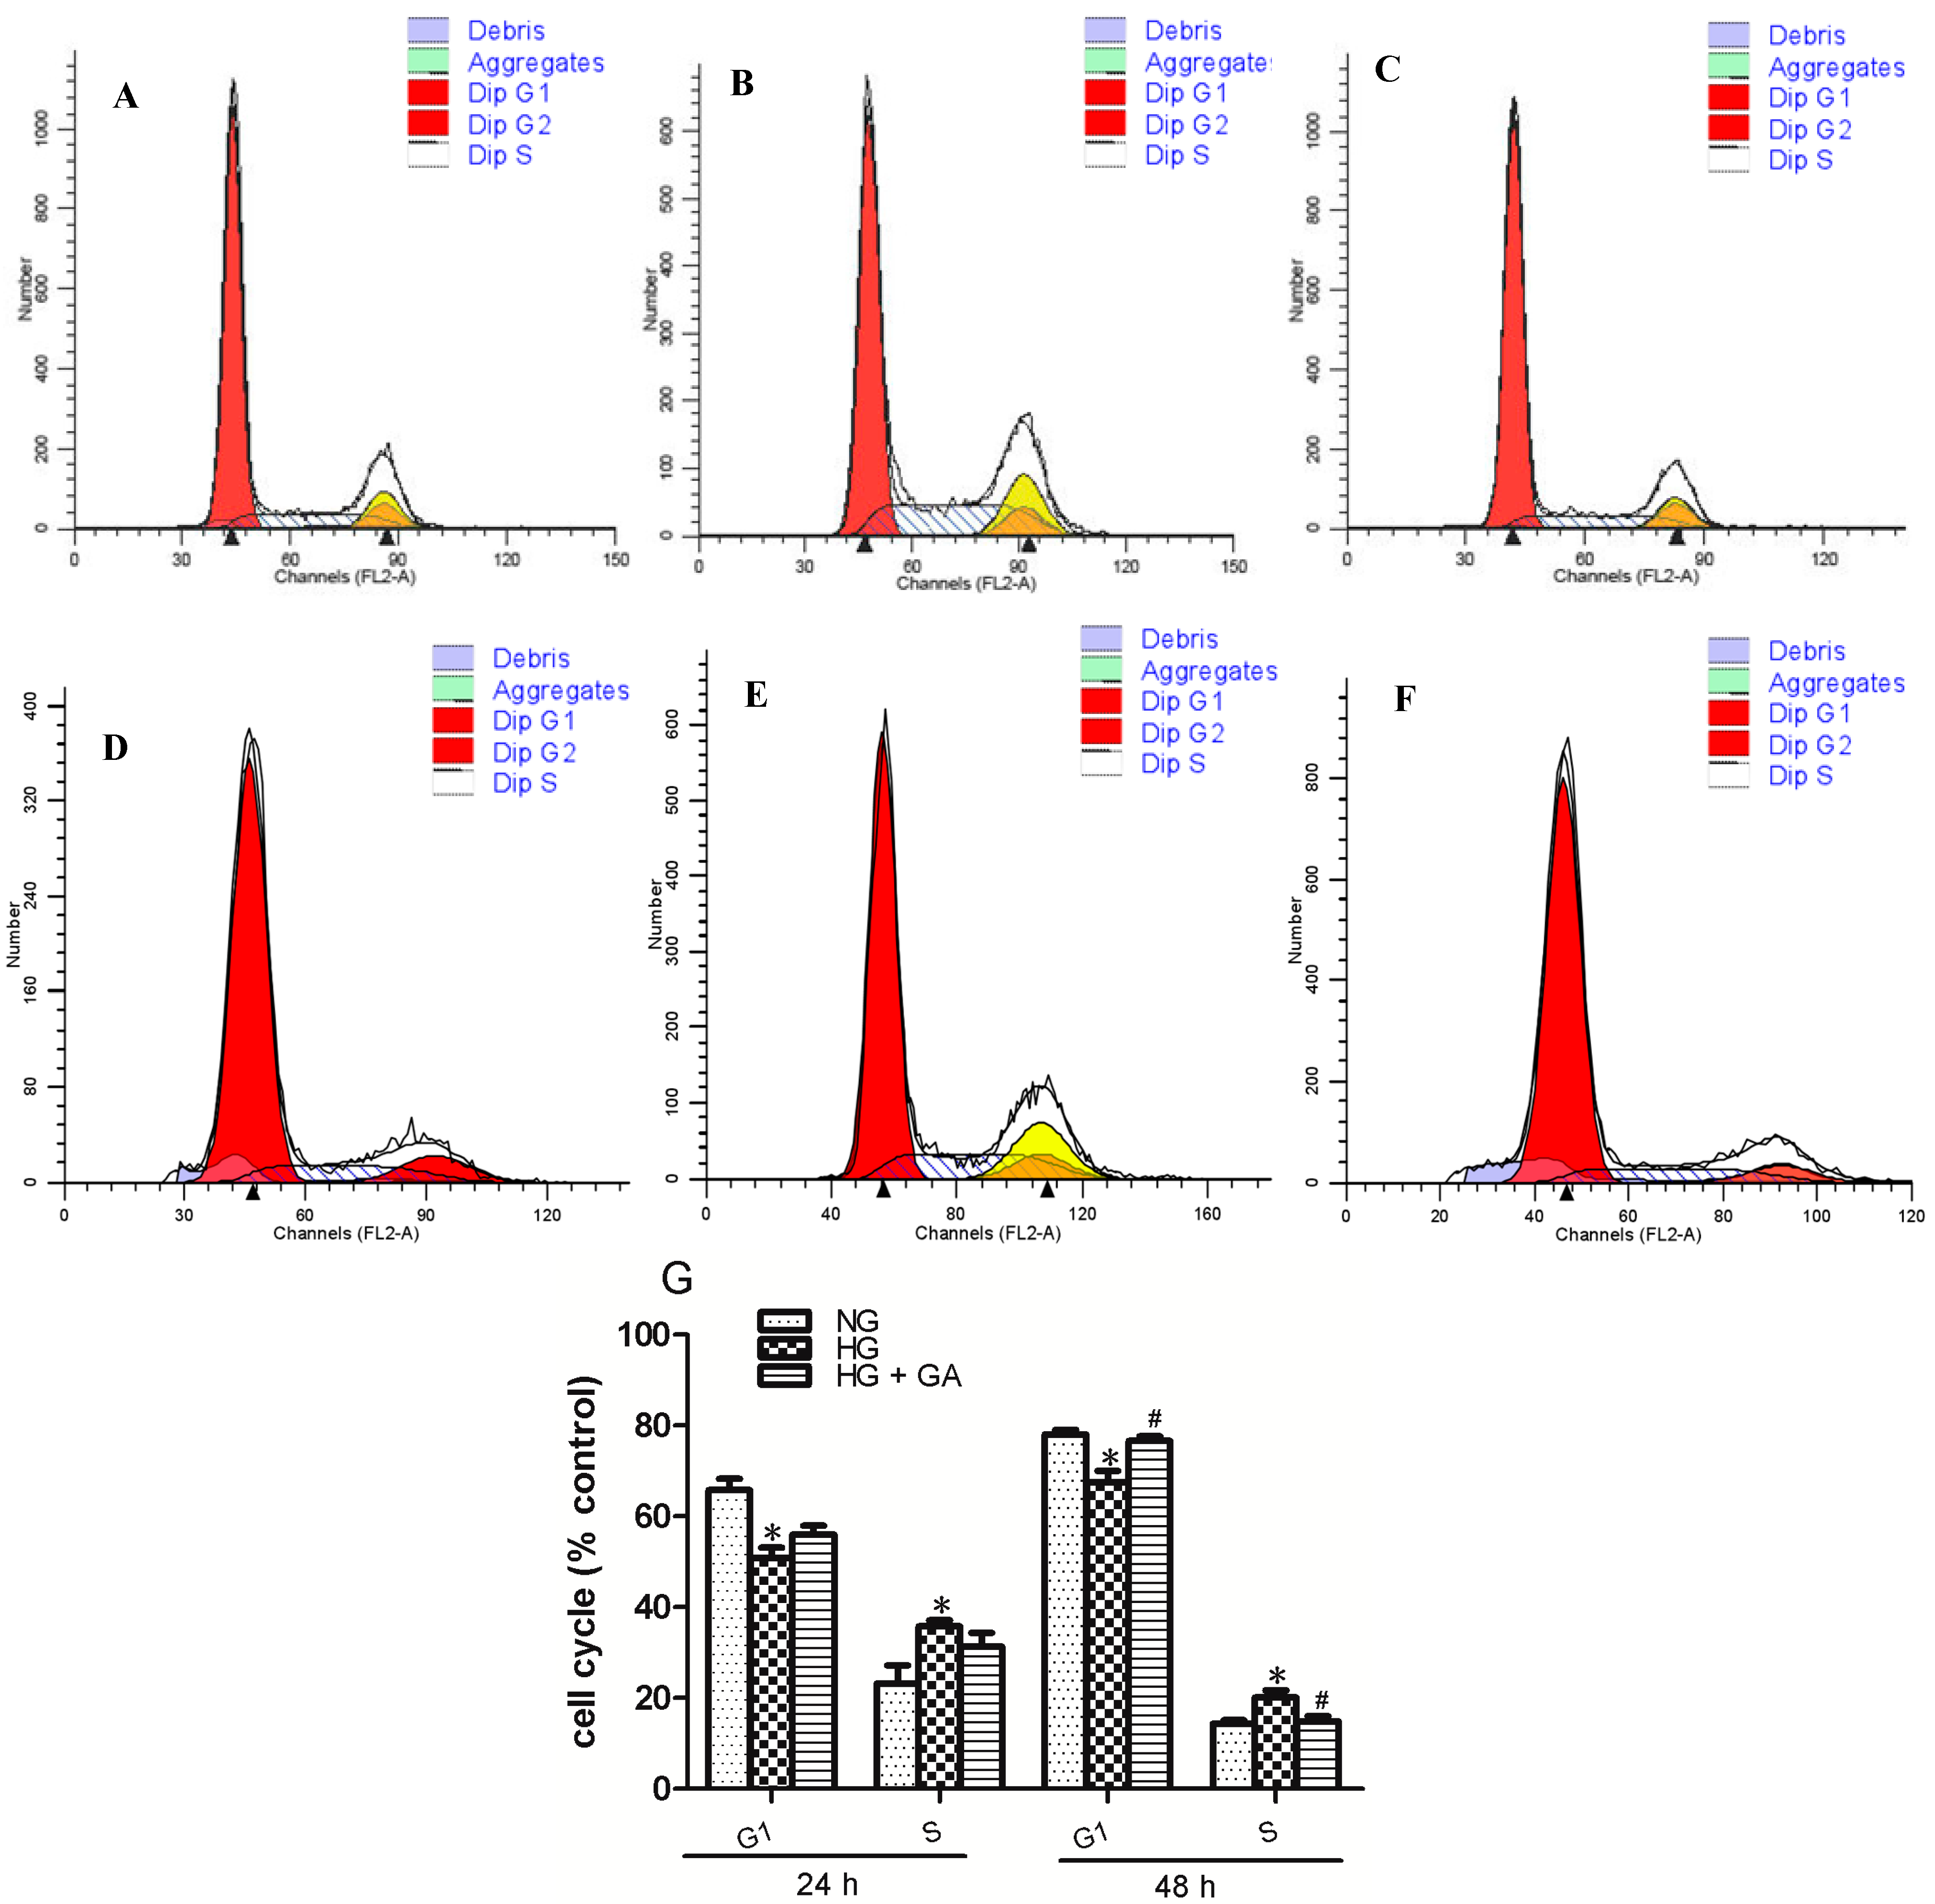
2.2. Effect of GA on Cell Cycle Induced by HG (High Glucose) in NRK-52E Cells

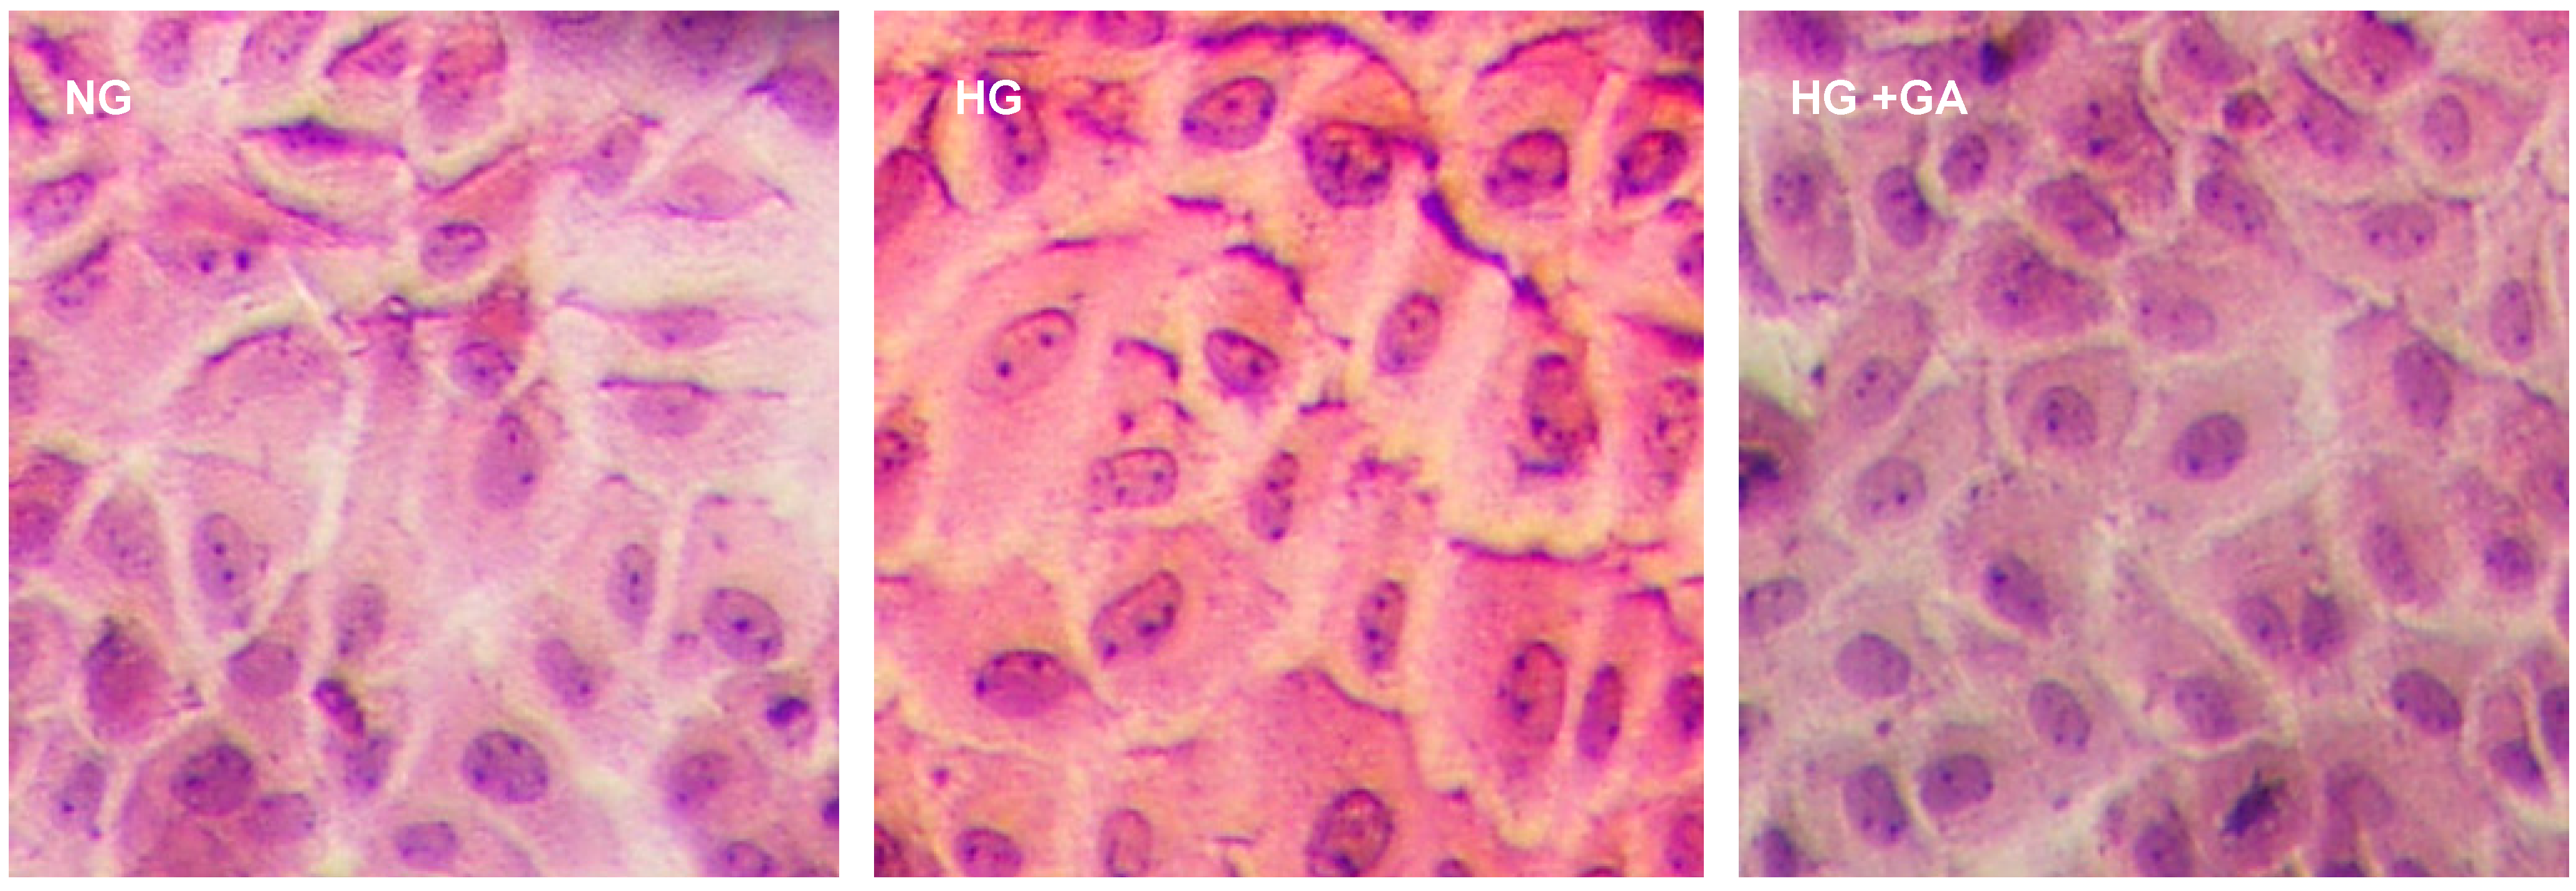
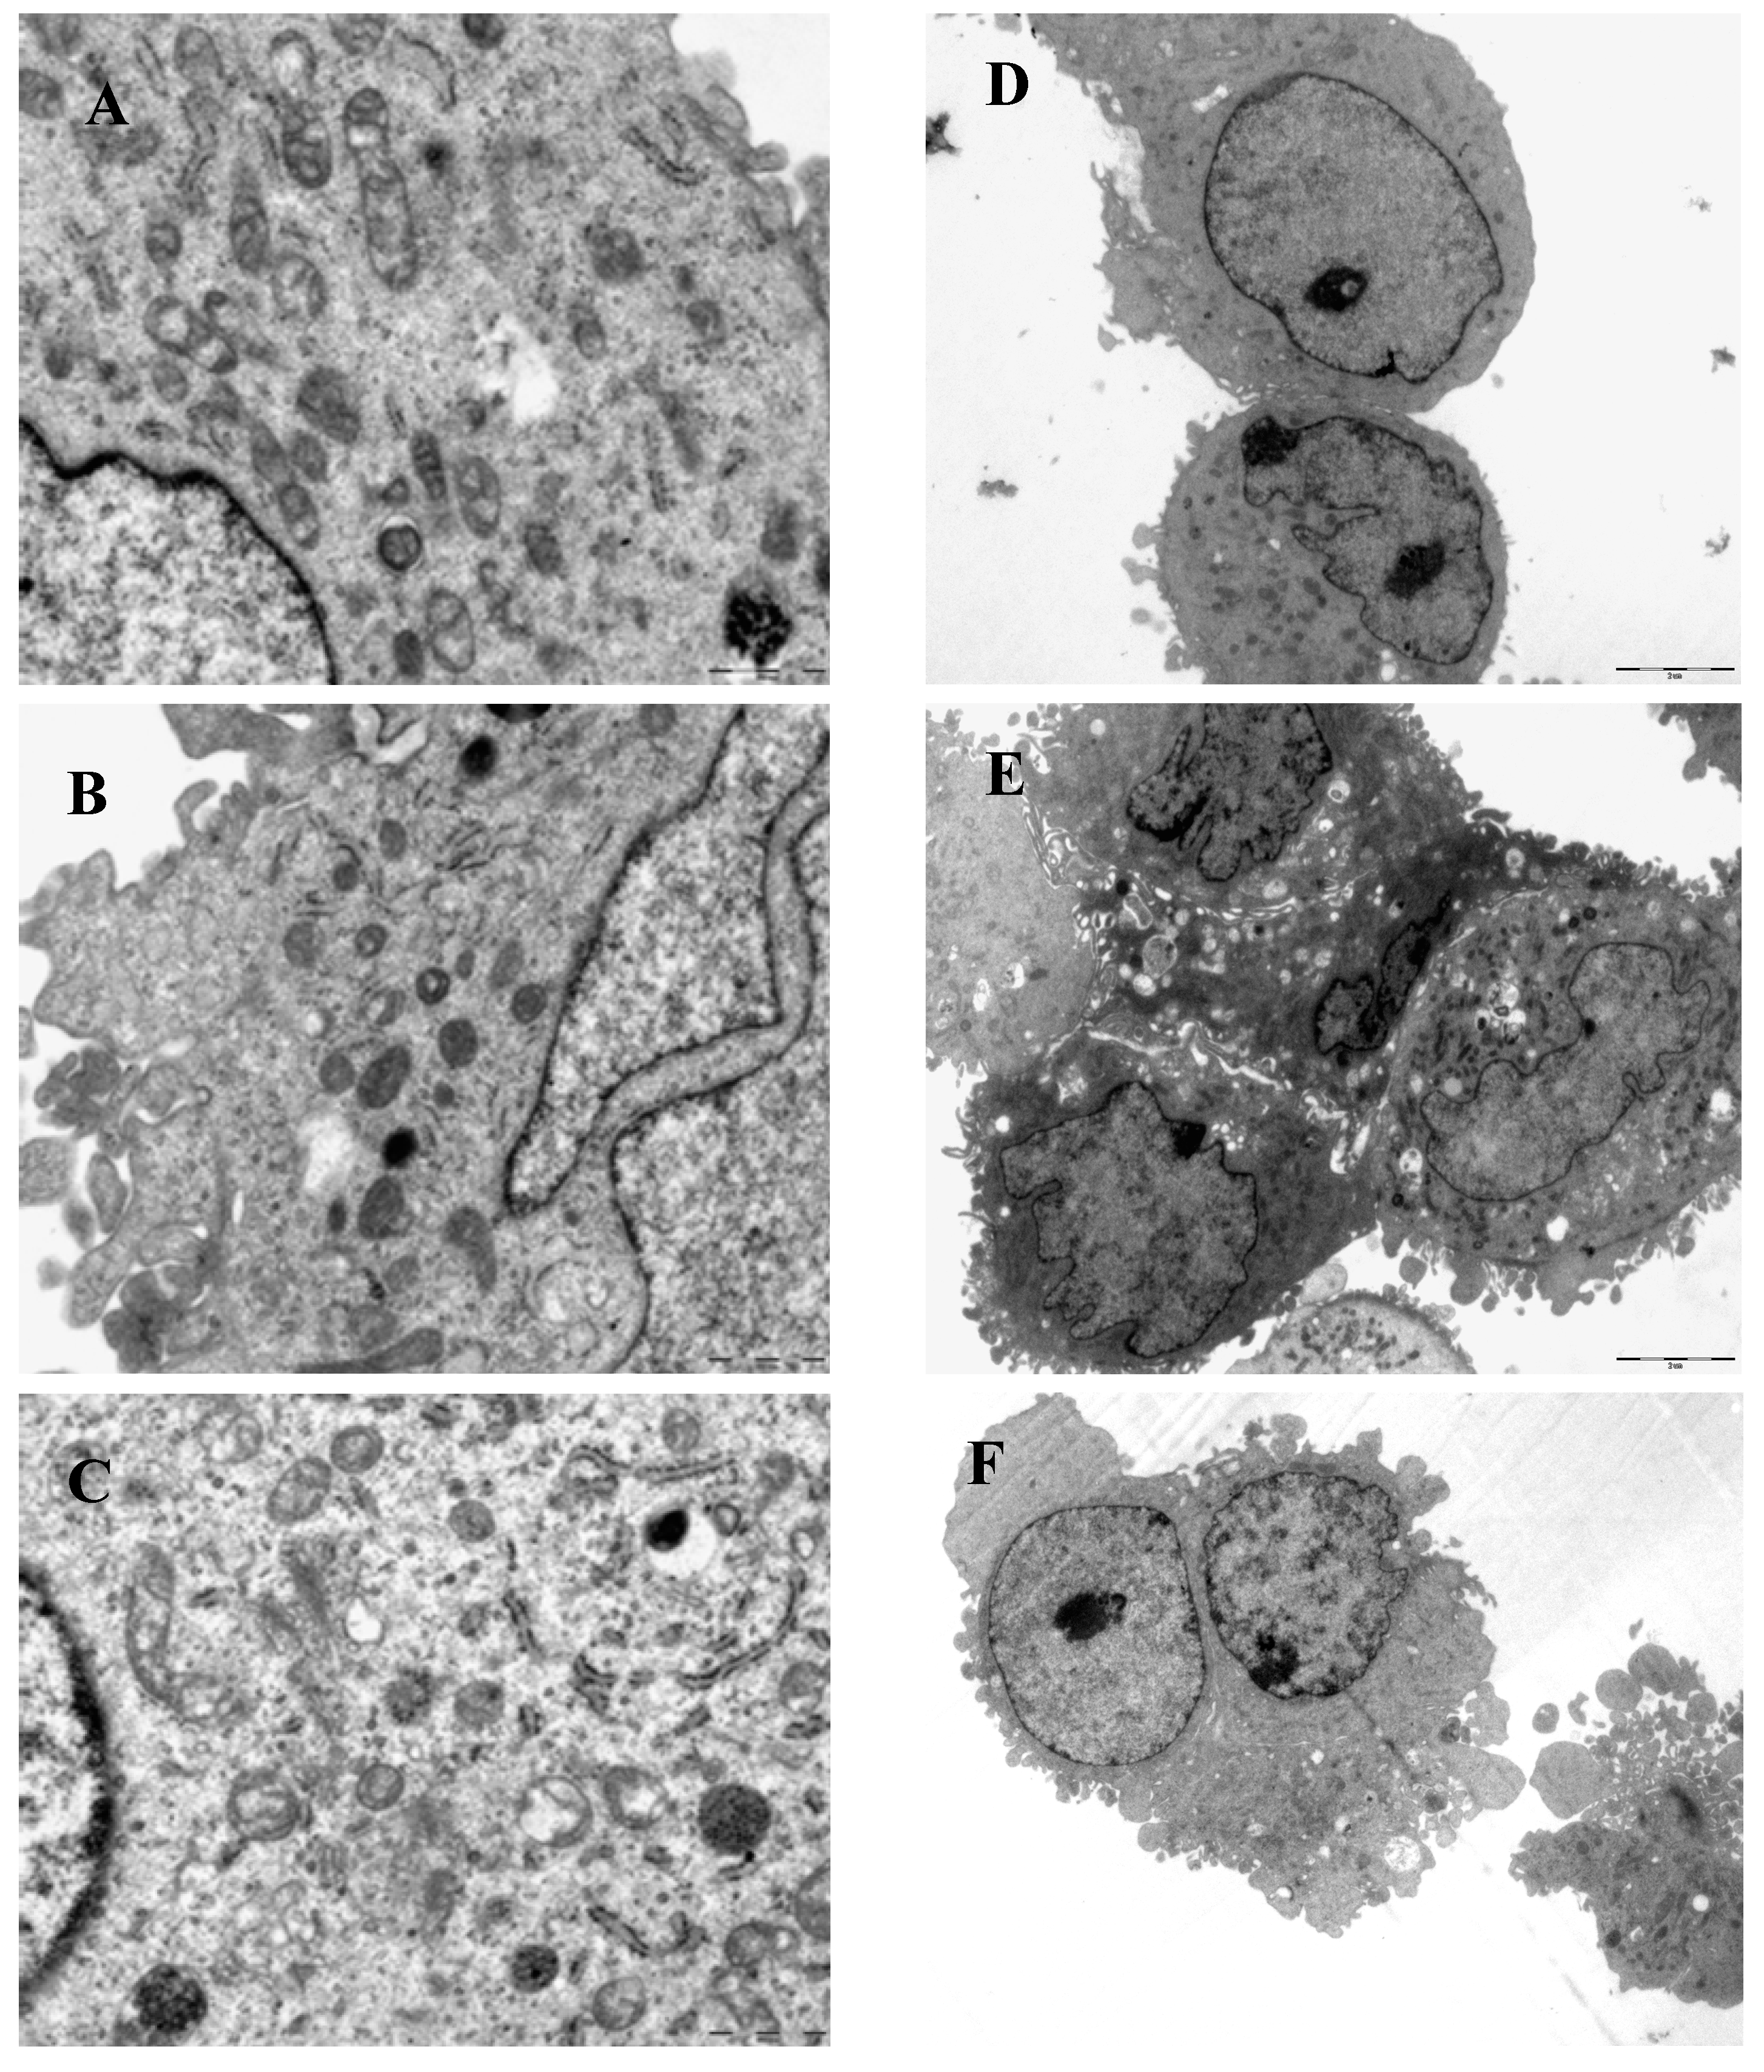
2.3. Histopathological Findings


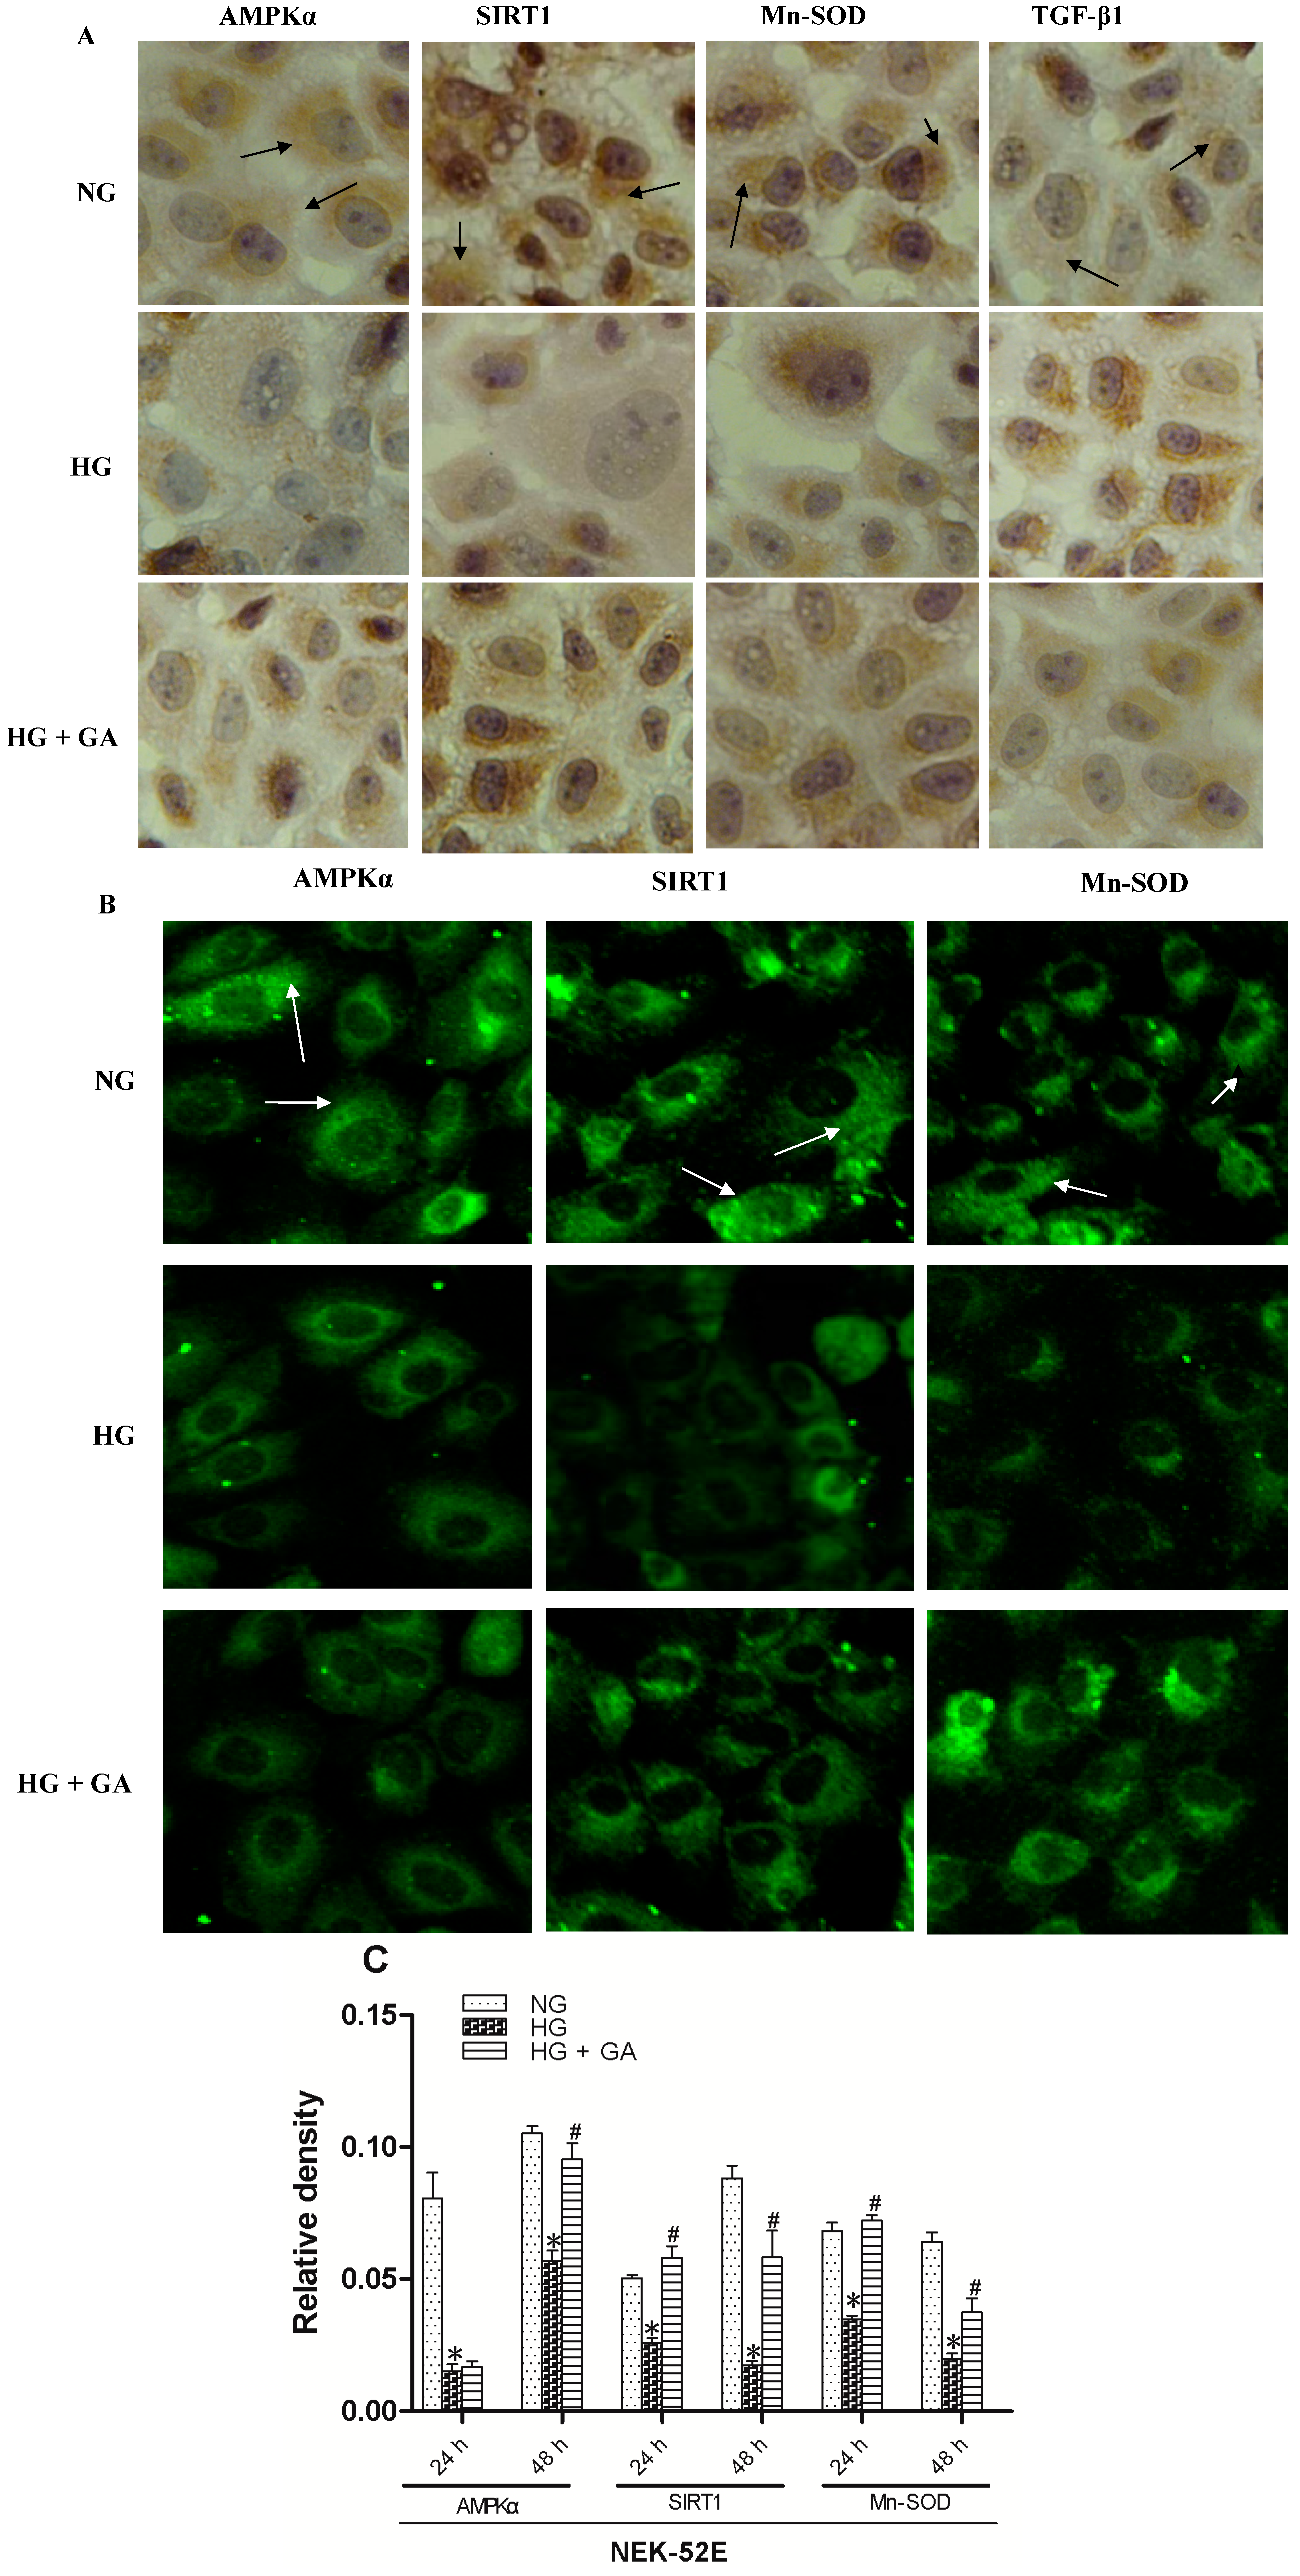
2.4. Effect of GA on SIRT1 (Silent Information Regulator T1), AMPKα (AMP-Activated Protein Kinase α), Mn-SOD (Manganese-Superoxide Dismutase) and TGF-β1 (Transforming Growth Factor-β1) Proteins Expression


| Group (n = 6) | AMPKα Expression | SIRT1 Expression | Mn-SOD Expression | TGF-β1 Expression |
|---|---|---|---|---|
| Normal group (24 h) | 0.24 ± 0.018 | 0.21 ± 0.014 | 0.27 ± 0.018 | 0.17 ± 0.006 |
| High glucose group (24 h) | 0.20 ± 0.027 * | 0.18 ± 0.015 * | 0.19 ± 0.031 * | 0.28 ± 0.019 ** |
| Experimental group (24 h) | 0.22 ± 0.025 | 0.21 ± 0.017 # | 0.24 ± 0.028 # | 0.18 ± 0.017 ## |
| Normal group (48 h) | 0.29 ± 0.010 | 0.19 ± 0.017 | 0.41 ± 0.048 | 0.23 ± 0.005 |
| High glucose group (48 h) | 0.23 ± 0.007 ** | 0.13 ± 0.006 * | 0.22 ± 0.029 * | 0.31 ± 0.058 ** |
| Experimental group (48 h) | 0.25 ± 0.006 # | 0.18 ± 0.005 # | 0.28 ± 0.024 # | 0.26 ± 0.037 # |
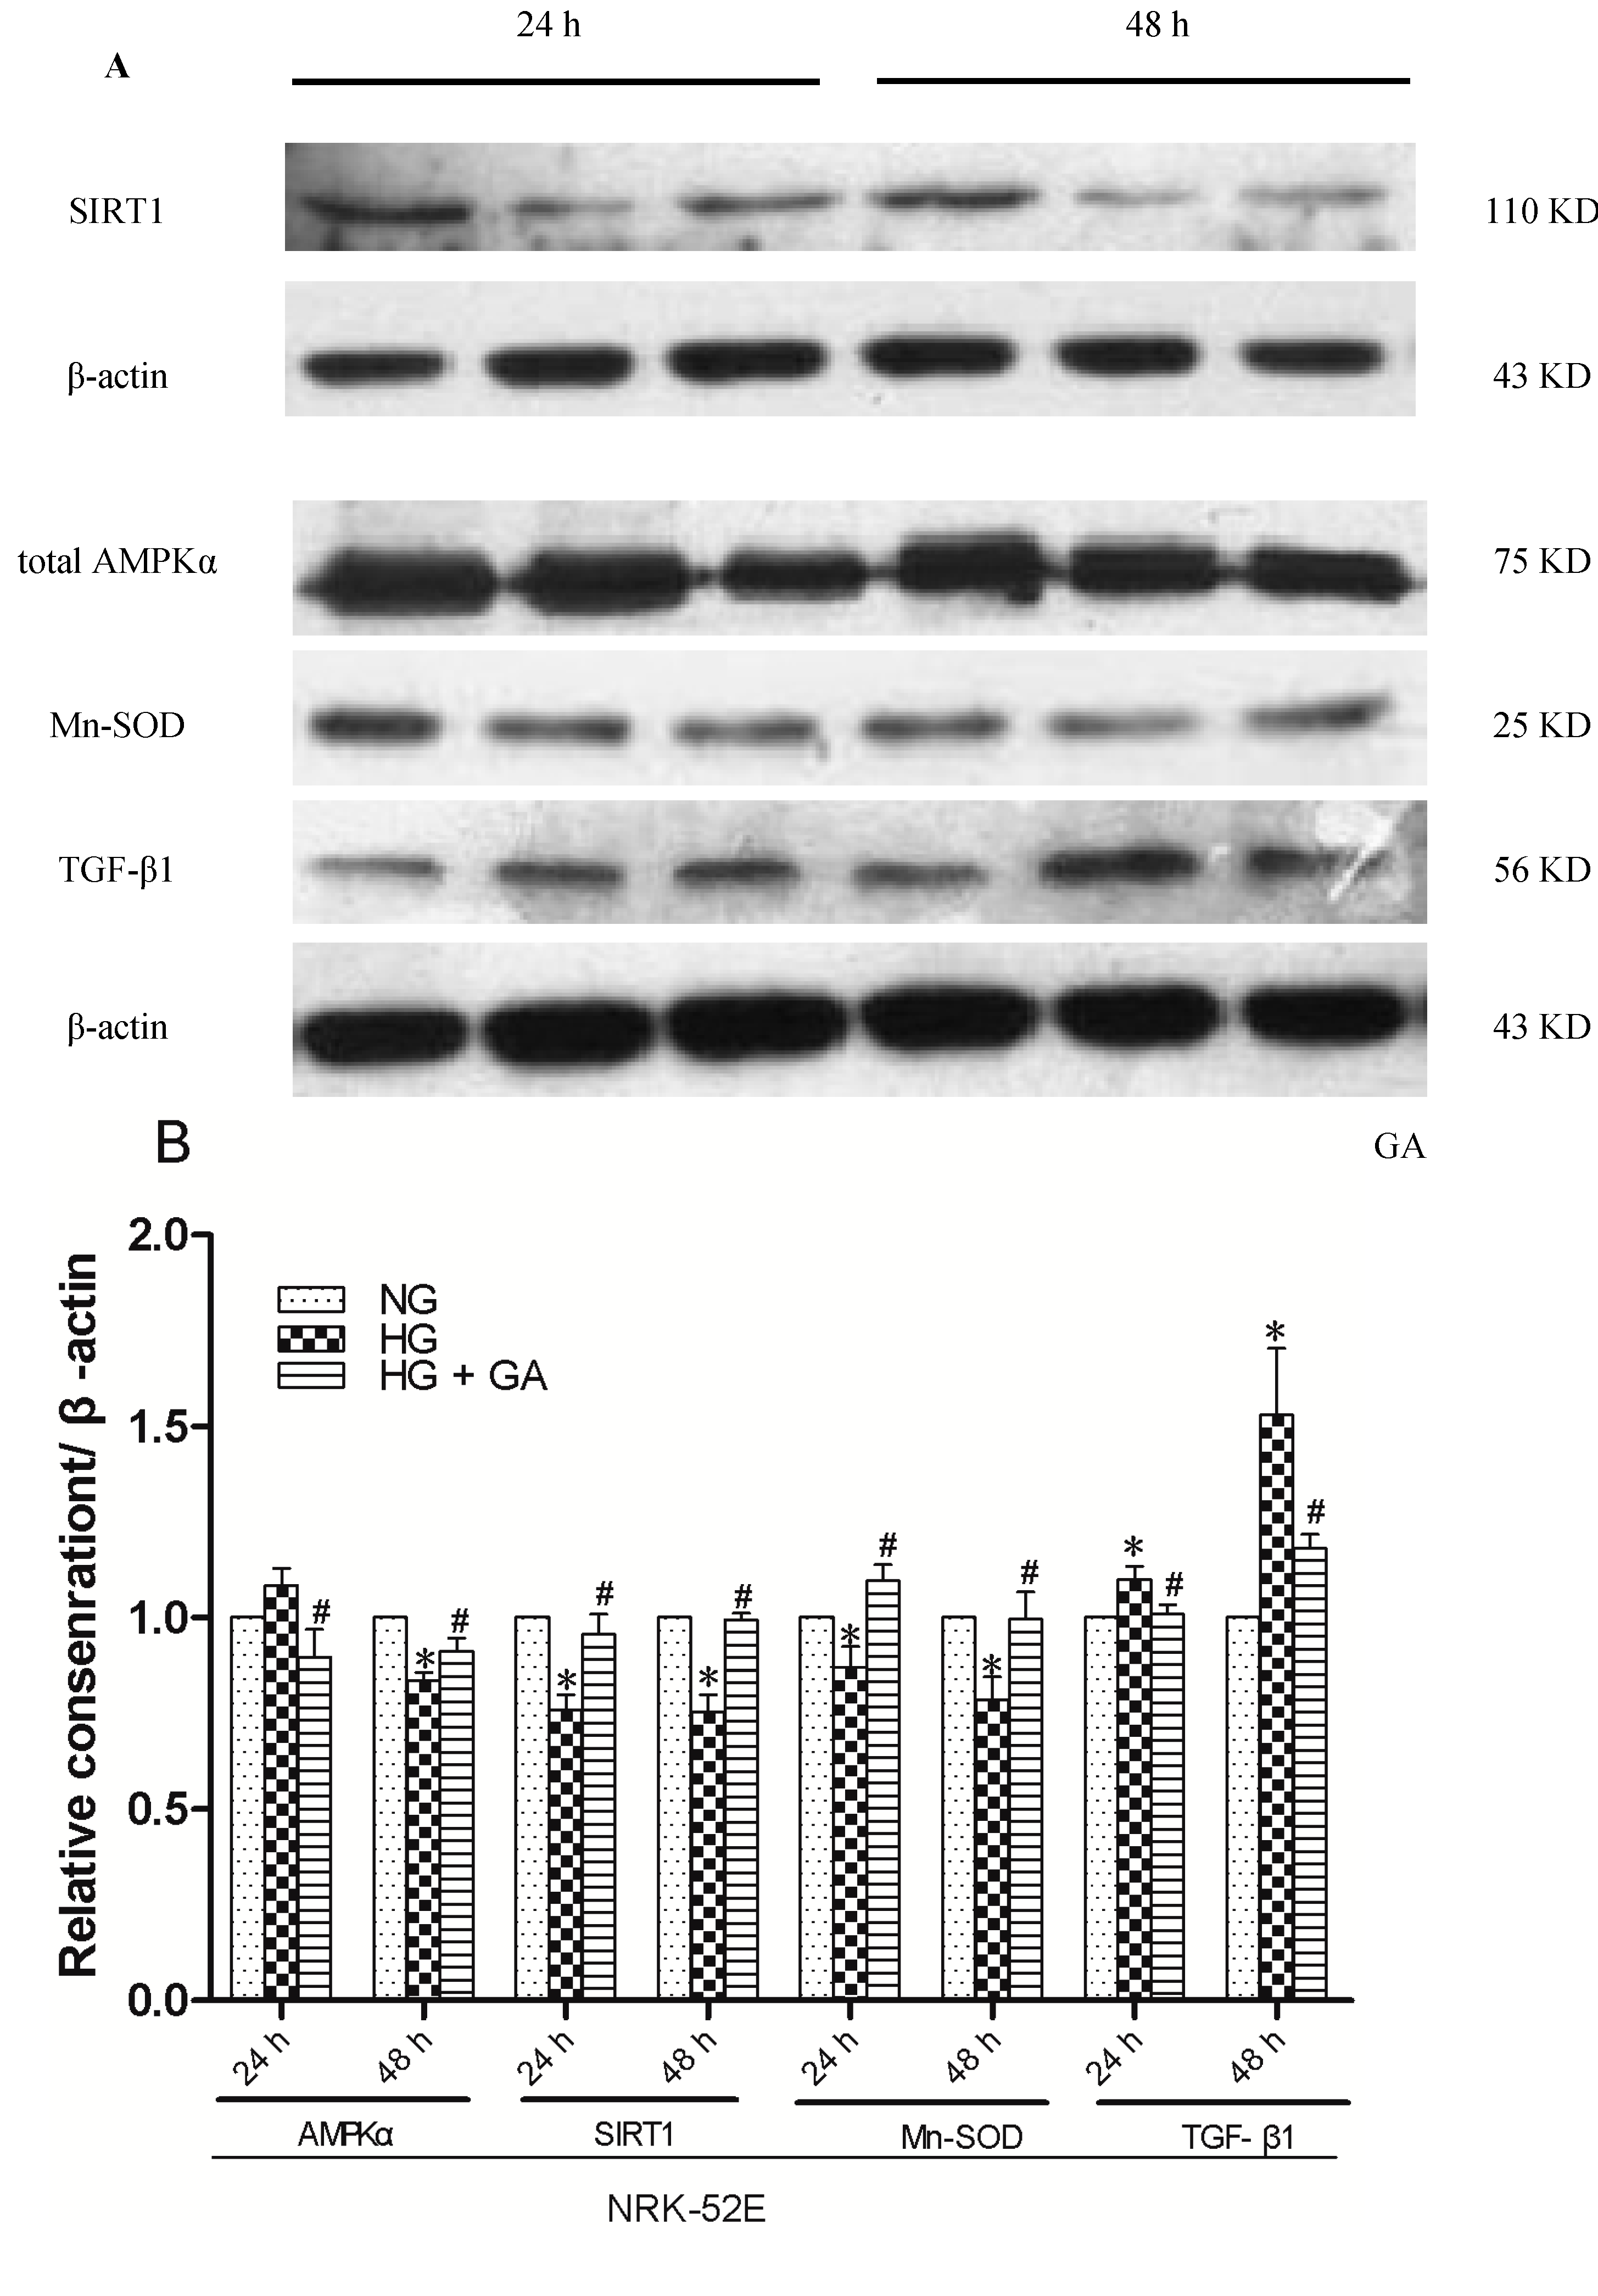
2.5. Effect of GA on SIRT1, AMPKα, Mn-SOD and TGF-β1 Proteins Expression, as Detected with Western Blotting

2.6. Effects of GA on Activities of Antioxidant Enzymes and Oxidative Stress Markers
| Group (n = 3) | MDA (μmol/L) | SOD (U/mL) |
|---|---|---|
| Normal group | 7.57 ± 0.680 | 23.60 ± 0.538 |
| High glucose group | 14.66 ± 0.480 ** | 16.22 ± 0.315 ** |
| Experimental group | 9.77 ± 0.468 ## | 19.68 ± 0.952 # |
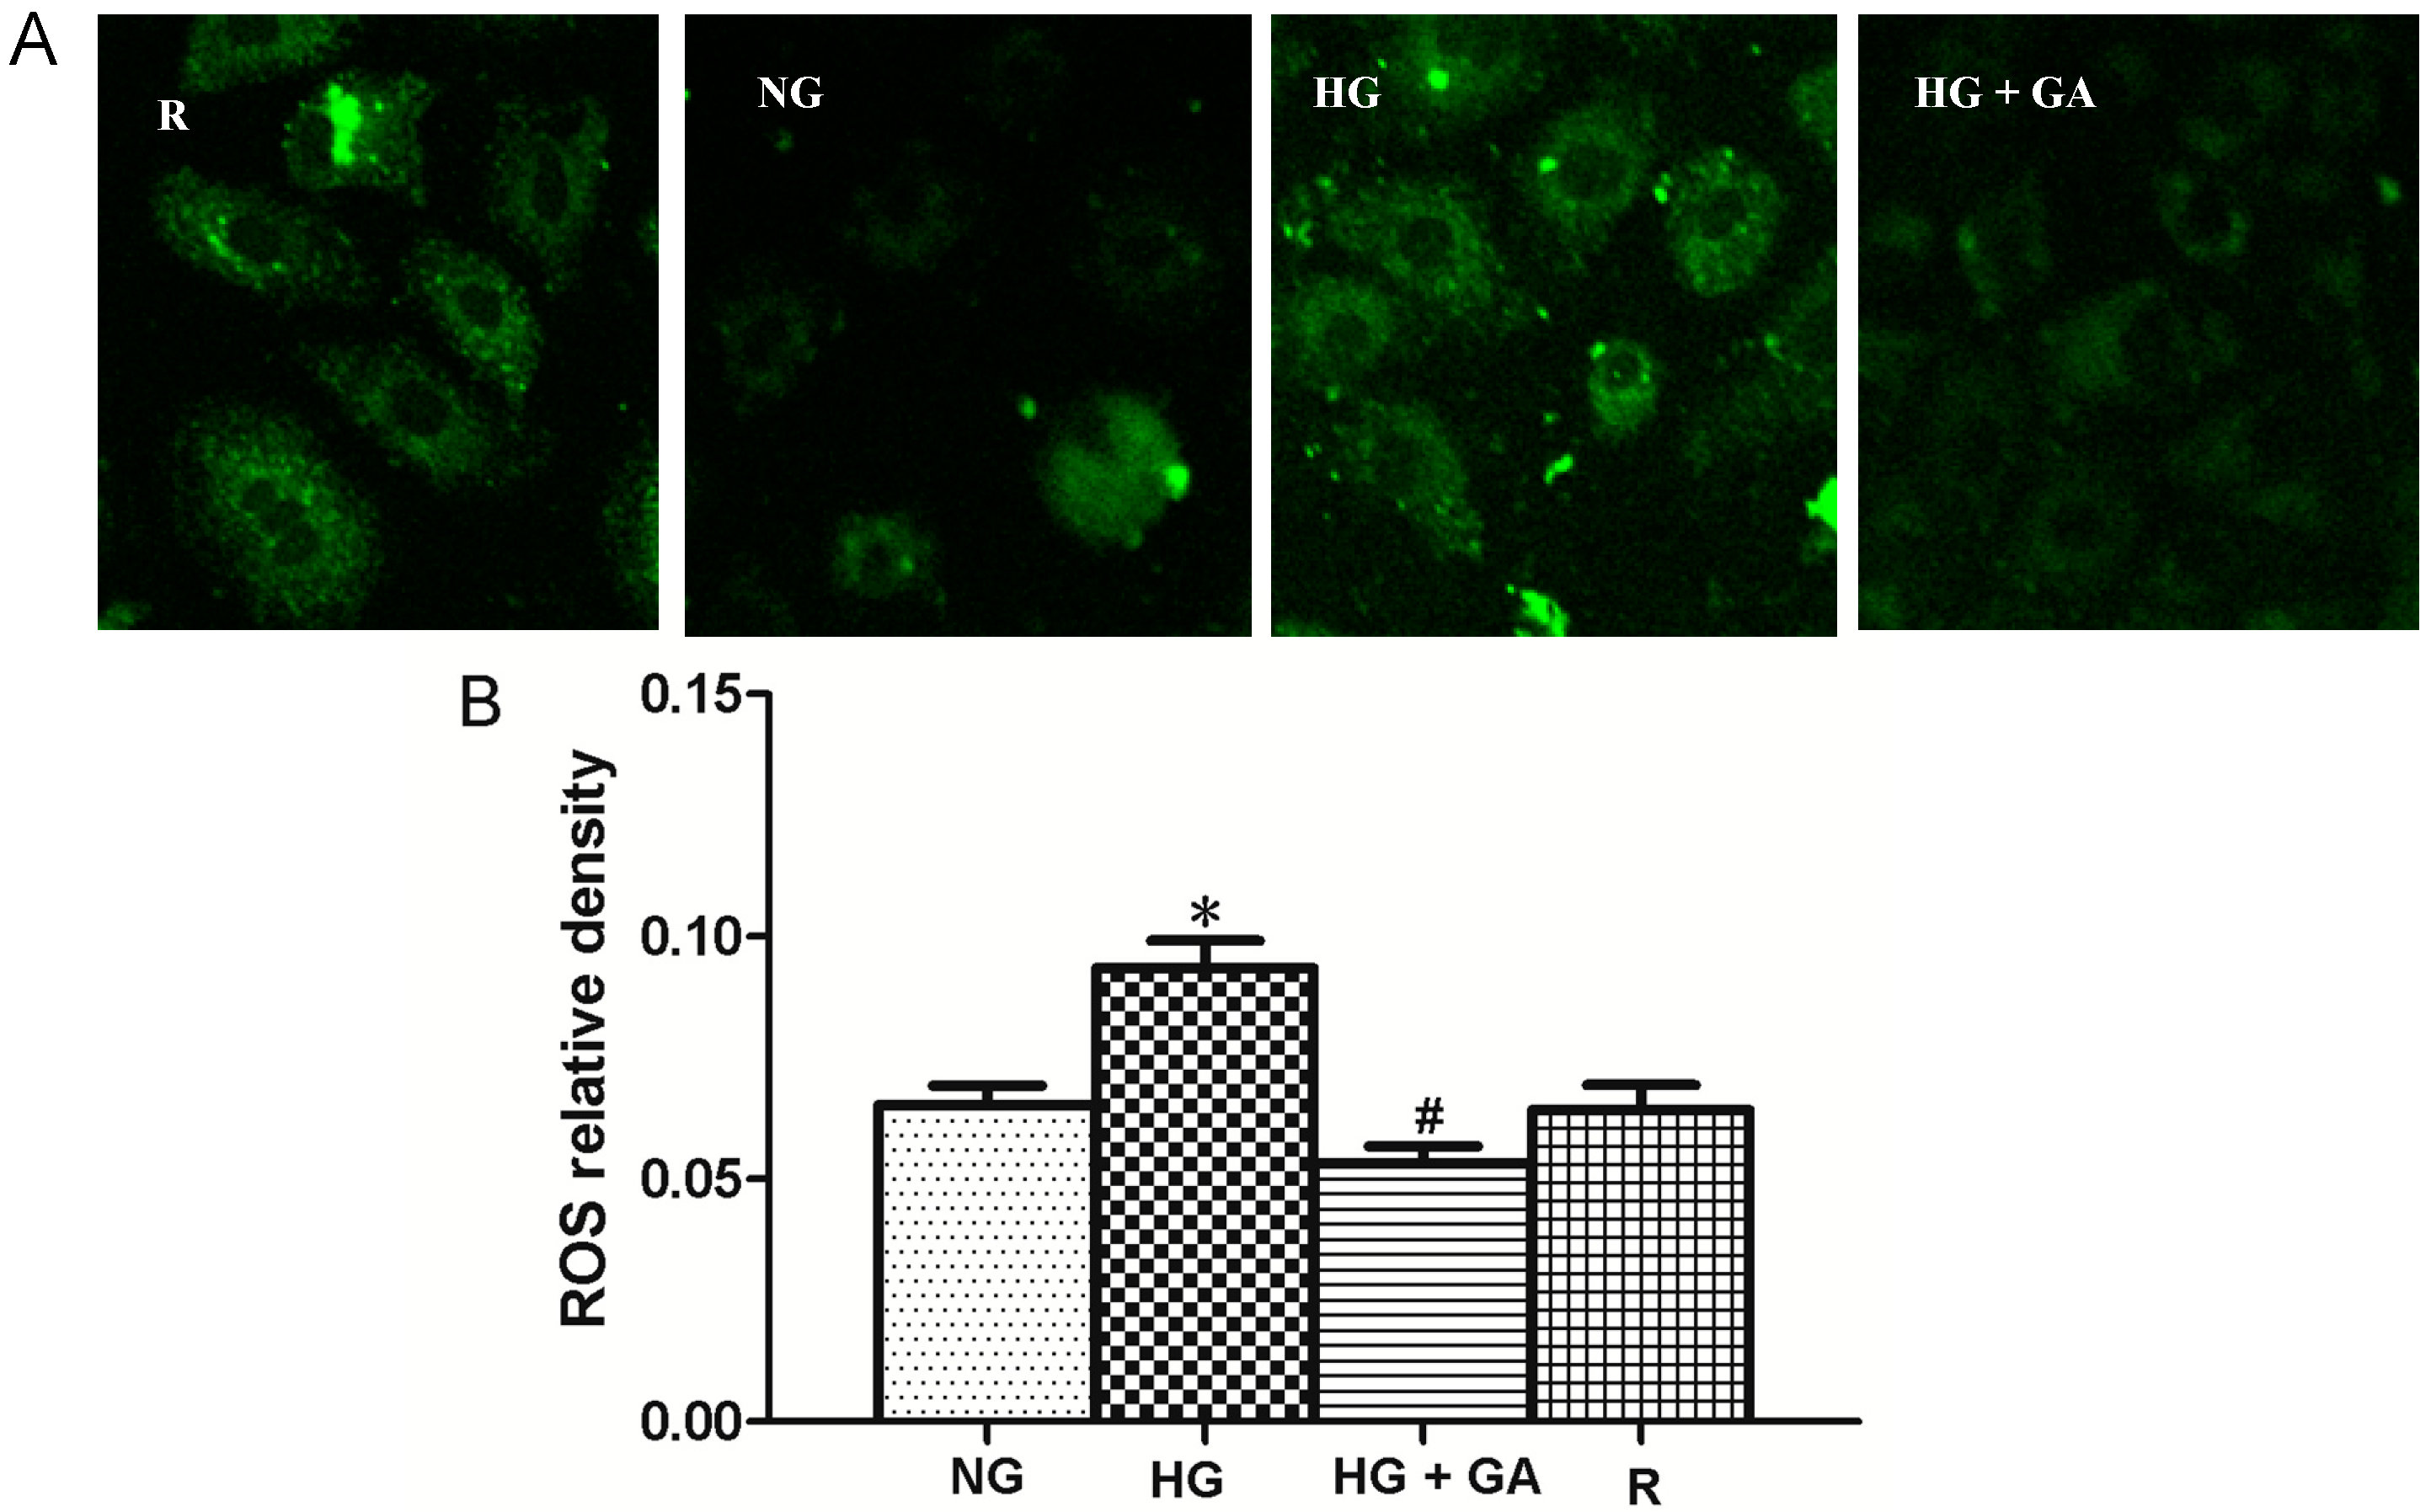
2.7. Effect of High Glucose and GA on ROS (Reactive Oxygen Species) Production

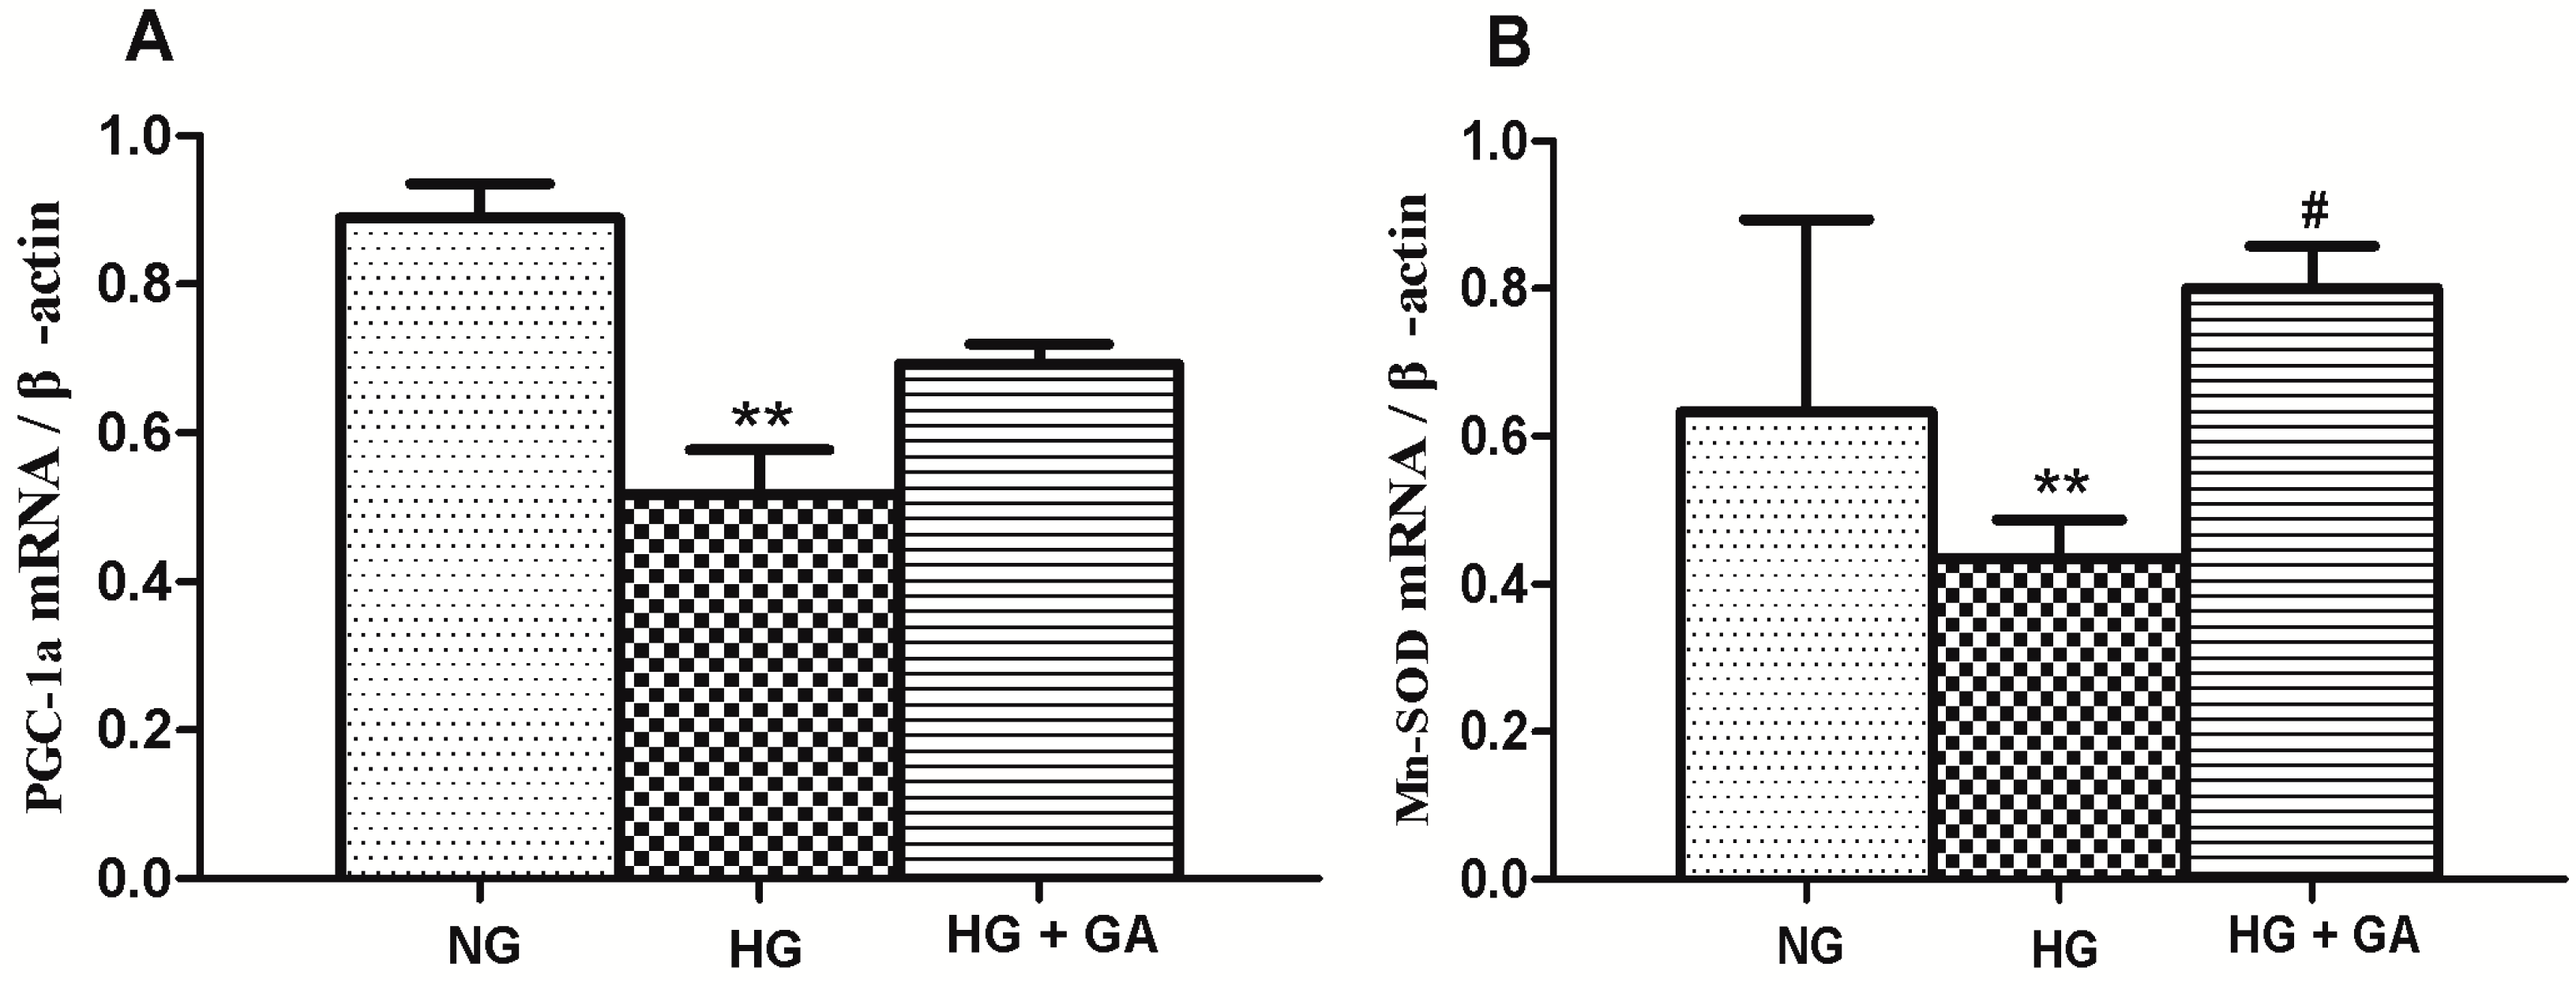
2.8. Effect of GA on the Expression of Mn-SOD and PGC-lα (PPARγ Co-Activator 1α) mRNA

2.9. Discussion
3. Experimental Section
3.1. Materials
3.2. Cell Culture
3.3. Cell Proliferation Assay
3.4. Flow Cytometry
3.5. Histological Studies
3.6. Electron Microscopy
3.7. Immunohistochemistry Assay
3.8. Immunofluorescence Assay
3.9. Western Blotting
3.10. UV Spectrophotometer
3.11. ROS Detection
3.12. Quantitative Real Time Polymerase Chain Reaction PCR Assay
3.13. Statistical Analysis
4. Conclusions
Acknowledgments
Author Contributions
Conflicts of Interests
References
- Giunti, S.; Barit, D.; Cooper, M.E. Diabetic nephropathy: From mechanisms to rational therapies. Minerva Med. 2006, 97, 241–262. [Google Scholar]
- Baoyu, T.; Xiaoli, C.; Yu, L. Oxidative stress in diabetic rat kidney and PGC-1α mRNA expression. Chin. J. Mod. Med. 2010, 7, 13–16. [Google Scholar]
- Hallows, K.R.; Mount, P.F.; Pastor-Soler, N.M.; Power, D.A. Role of the energy sensor AMP-activated protein kinase in renal physiology and disease. Am. J. Physiol. Ren. Physiol. 2010, 298, F1067–F1077. [Google Scholar] [CrossRef]
- Fornoni, A.; Ijaz, A.; Tejada, T. Role of inflammation in diabetic nephropathy. Curr. Diabetes Rev. 2008, 4, 10–17. [Google Scholar] [CrossRef]
- Ming, M.J.; Yin, A.C. Therapeutic effects of glycyrrhizic acid. Nat. Prod. Commun. 2013, 8, 415–418. [Google Scholar]
- Lee, C.H.; Park, S.W.; Kim, Y.S.; Kang, S.S.; Kim, J.A.; Lee, S.H.; Lee, S.M. Protective Mechanism of Glycyrrhizic acid on acute liver injury induced by carbon tetrachloride in mice. Biol. Pharm. Bull. 2007, 30, 1898–1904. [Google Scholar] [CrossRef]
- Subramanian, S.; Bowyer, M.W.; Egan, J.C.; Knolmayer, T.J. Atenuation of renal is chemia-reperfusion injury with selectin inhibition in rabbit model. Am. J. Surg. 2009, 178, 573–576. [Google Scholar]
- Zhang, J.; Jing, L.; Hou, S.; Ge, X.; Zhao, L.; Qin, H.; Guo, F. Effect of glycyrrhizin on kidney of diabetic rats TGF-β1 expression (in Chinese). Chin. J. Clin. Pharmacol. 2010, 26, 673–676. [Google Scholar]
- Sodhi, C.P.; Phadke, S.A.; Batlle, D.; Sahai, A. Hypoxia and high glucose cause exaggerated mesangial cell growth and collagen synthesis: Role of osteopontin. Am. J. Physiol. Ren. Physiol. 2011, 280, 667–774. [Google Scholar]
- Suzaki, Y.; Yoshizumi, M.; Kagami, S.; Nishiyama, A.; Ozawa, Y.; Kyaw, M.; Izawa, Y.; Kanematsu, Y.; Tsuchiya, K.; Tamaki, T. BMK1 is activated in glomeruli of diabetic rats and in mesangial cells by high glucose conditions. Kidney Int. 2004, 65, 1749–1760. [Google Scholar] [CrossRef]
- Jilin, W.; Wei, L.; Xuexia, L. Effect of ganoderma on rat mesangial cells proliferation and cell cycle cultured in high glucose (in Chinese). Integr. Med. China 2008, 9, 61–63. [Google Scholar]
- Forbes, J.M.; Coughlan, M.T.; Cooper, M.E. Oxidative stress as a major culprit in kidney disease in diabetes. Diabetes 2008, 57, 1446–1454. [Google Scholar] [CrossRef]
- Singh, D.K.; Winocour, P.; Farrington, K. Oxidative stress in early diabetic nephropathy: Fueling the fire. Nat. Rev. Endocrinol. 2011, 7, 176–184. [Google Scholar] [CrossRef]
- Dentelli, P.; Rosso, A.; Zeoli, A.; Gambino, R.; Pegoraro, L.; Pagano, G.; Falcioni, R.; Brizzi, M.F. Oxidative stress-mediated mesangial cell proliferation requires RAC-1/reactive oxygen species production and beta4 integrin expression. J. Biol. Chem. 2007, 282, 26101–26110. [Google Scholar] [CrossRef]
- Toyokuni, S.; Tanaka, T.; Hattori, Y.; Nishiyama, Y.; Yoshida, A.; Uchida, K.; Hiai, H.; Ochi, H.; Osawa, T. Quantitative immunohistochemical determination of 8-hydroxy-20-deoxyguanosine by a monoclonal antibody N45.1: Its application to ferric nitrilotriacetateinduced renal carcinogenesis model. Lab. Investig. 1997, 76, 365–374. [Google Scholar]
- Karadeniz, A.; Simsek, N.; Karakus, E.; Yildirim, S.; Kara, A.; Can, I.; Kisa, F.; Emre, H.; Turkeli, M. Royal jelly modulates oxidative stress and apoptosis in liver and kidneys of rats treated with cisplatin. Oxid. Med. Cell. Longev. 2011. [Google Scholar] [CrossRef]
- Jeong, H.G.; You, H.J.; Park, S.J. Hepatoprotective effects of 18beta-glycyrrhetinic acid on carbon tetrachloride-induced liver injury: Inhibition of cytochrome P450 2E1 expression. Pharmacol. Res. 2002, 46, 221–227. [Google Scholar] [CrossRef]
- Liu, C.; Lin, J.D. PGC-1 coactivators in the control of energy metabolism. Acta Biochim. Biophys. Sin. 2011, 43, 248–257. [Google Scholar] [CrossRef]
- Leone, T.C.; Lehman, J.J.; Finck, B.N.; Schaeffer, P.J.; Wende, A.R.; Boudina, S.; Courtois, M.; Wozniak, D.F.; Sambandam, N.; Bernal-Mizrachi, C.; et al. PGC-1α deficiency causes multi-system energy metabolic derangements: Muscle dysfunction, abnormal weight control and hepatic steatosis. PLoS Biol. 2005, 3, e101. [Google Scholar] [CrossRef] [Green Version]
- Tan, B.; Li, X.; Yin, Y.; Wu, Z.; Liu, C.; Tekwe, C.D.; Wu, G. Regulatory roles for l-arginine in reducing white adipose tissue. Front. Biosci. 2012, 17, 2237–2246. [Google Scholar] [CrossRef]
- Liang, H.; Ward, W. F. PGC-1α: A key regulator of energy metabolism. Adv. Physiol. Educ. 2006, 30, 145–151. [Google Scholar] [CrossRef]
- Cansby, E.; Nerstedt, A.; Amrutkar, M.; Duran, E.N.; Smith, U.; Mahlapuu, M. Partial hepatic resistance to IL-6-induced inflammation develops in type 2 diabetic mice, while the anti-inflammatory effect of AMPK is maintained. Mol. Cell Endocrinol. 2014, 393, 143–151. [Google Scholar] [CrossRef]
- Namkoong, C.; Kim, M.S.; Jang, P.G.; Han, S.M.; Park, H.S.; Koh, E.H.; Lee, W.J.; Kim, J.Y.; Park, I.S.; Park, J.Y.; et al. Enhanced hypothalamic AMP-activated protein kinase activity contributes to hyperphagia in diabetic rats. Diabetes 2005, 54, 63–68. [Google Scholar] [CrossRef]
- Kume, S.; Uzu, T.; Araki, S.; Sugimoto, T.; Isshiki, K.; Chin-Kanasaki, M.; Sakaguchi, M.; Kubota, N.; Terauchi, Y.; Kadowaki, T.; et al. Role of altered renal lipid metabolism in the development of renal injury induced by a high-fat diet. J. Am. Soc. Nephrol. 2007, 18, 2715–2723. [Google Scholar] [CrossRef]
- Kitada, M.; Kume, S.; Imaizumi, N.; Koya, D. Resveratrol improves oxidative stress and protects against diabetic nephropathy through normalization of Mn-SOD dysfunction in AMPK/SIRT1-independent pathway. Diabetes 2011, 60, 634–643. [Google Scholar] [CrossRef]
- Ruderman, N.B.; Xu, X.J.; Nelson, L.; Cacicedo, J.M.; Saha, A.K.; Lan, F.; Ido, Y. AMPK and SIRT1: A long-standing partnership? Am. J. Physiol. Endocrinol. Metab. 2010, 298, 751–760. [Google Scholar] [CrossRef]
- Gerhart-Hines, Z.; Rodgers, J.T.; Bare, O.; Lerin, C.; Kim, S.H.; Mostoslavsky, R.; Alt, F.W.; Wu, Z.; Puigserver, P. Metabolic control of muscle mitochondrial function and fatty acid oxidation through SIRT1/PGC-1α. EMBO J. 2007, 26, 1913–1923. [Google Scholar] [CrossRef]
- Lagouge, M.; Argmann, C.; Gerhart-Hines, Z.; Meziane, H.; Lerin, C.; Daussin, F.; Messadeq, N.; Milne, J.; Lambert, P.; Elliott, P.; et al. Resveratrol improves mitochondrial function and protects against metabolic disease by activating SIRT1 and PGC-1α. Cell 2006, 127, 1109–1122. [Google Scholar] [CrossRef]
© 2014 by the authors; licensee MDPI, Basel, Switzerland. This article is an open access article distributed under the terms and conditions of the Creative Commons Attribution license (http://creativecommons.org/licenses/by/3.0/).
Share and Cite
Hou, S.; Zheng, F.; Li, Y.; Gao, L.; Zhang, J. The Protective Effect of Glycyrrhizic Acid on Renal Tubular Epithelial Cell Injury Induced by High Glucose. Int. J. Mol. Sci. 2014, 15, 15026-15043. https://doi.org/10.3390/ijms150915026
Hou S, Zheng F, Li Y, Gao L, Zhang J. The Protective Effect of Glycyrrhizic Acid on Renal Tubular Epithelial Cell Injury Induced by High Glucose. International Journal of Molecular Sciences. 2014; 15(9):15026-15043. https://doi.org/10.3390/ijms150915026
Chicago/Turabian StyleHou, Shaozhang, Fangfang Zheng, Yuan Li, Ling Gao, and Jianzhong Zhang. 2014. "The Protective Effect of Glycyrrhizic Acid on Renal Tubular Epithelial Cell Injury Induced by High Glucose" International Journal of Molecular Sciences 15, no. 9: 15026-15043. https://doi.org/10.3390/ijms150915026