Article

How Information and Communications Technology Affects the Micro-Location Choices of Stores on On-Demand Food Delivery Platforms: Evidence from Xinjiekou’s Central Business District in Nanjing

1
College of Landscape Architecture, Nanjing Forestry University, Nanjing 210037, China
2
Jinpu Research Institute, Nanjing Forestry University, Nanjing 210037, China
3
School of Architecture, Southeast University, Nanjing 210096, China
4
College of Economics and Management, Nanjing Forestry University, Nanjing 210037, China
*
Author to whom correspondence should be addressed.
ISPRS Int. J. Geo-Inf. 2024, 13(2), 44; https://doi.org/10.3390/ijgi13020044
Submission received: 21 November 2023 / Revised: 22 January 2024 / Accepted: 23 January 2024 / Published: 2 February 2024

Abstract

:
The digitization of consumption, led by information and communications technology (ICT), has reshaped the urban commercial spatial structure (UCSS) of restaurants and retailers. However, the impacts of ICT on UCSS and location selection remain unclear. In this study, based on on-demand food delivery data and real-time traffic data, we used two types of machine learning algorithms, random forest regression (RFR) and the density-based spatial clustering of applications with noise (DBSCAN), to study the spatial distribution patterns, driving factors, and new geographical location phenomena of ‘brick-and-click’ (B&C) stores in Xinjiekou’s central business district (CBD) in Nanjing, China. The results show that the UCSS in the CBD is being decentralized, but the degree of influence is related to the business type. Additionally, the scale of demand and the distance from core commercial nodes greatly affect the scales of B&C stores. Moreover, the agglomeration of high-sales B&C stores seems to indicate a micro-location advantage, characterized by the concentration of delivery riders, which is usually located in the commercial hinterland with dense traffic. This makes stores situated in traditionally advantageous locations more attractive for online sales. Thus, ICT enhances the Matthew effect in business competition. These findings deepen our understanding of urban digital planning management and business systems.

1. Introduction

The digital transformation of consumption services has caused a profound change in people’s consumption behavior [1,2,3]. In 2021, the proportion of the online consumption of various consumer goods in China continued to rise, making it the largest e-commerce market worldwide, accounting for 11.87% of the total value of the global market [4]. Digital consumption scenarios, such as takeaway delivery, online shopping, and ride-hailing, have created a new paradigm of urban life. E-commerce systems, such as on-demand food delivery (ODFD) platforms, enable a high degree of integration and effective matching of supply and demand information in addition to solving the problem of “last-mile” delivery. Therefore, on the one hand, the separation of consumer payment and commercial space enables the logic behind commercial space layout to break through traditional geographical constraints [5]. On the other hand, the resulting temporal and spatial compression effects induce new commercial competition on a wider spatial scale.
As the central nodes in the urban commercial spatial structure (UCSS), central business districts (CBDs) have witnessed a change toward a flexible layout of businesses, which simultaneously imposes new spatial constraints. This reflects the adaptation of the urban space to the new needs of people to “consume anywhere, anytime” [6,7,8]. To meet “just-in-time delivery” needs, technological capital has triggered a shift toward additional logistics node functions in commercial spaces, leading to an expansion in the service scope of commercial spaces [9,10]. Therefore, the principle of establishing retail and restaurant spaces is no longer limited to a search for the ‘agglomeration’ and ‘location’ effects. Instead, the importance of the location with the best scale and efficiency that can be achieved within the geographical proximity is highlighted under the “just-in-time delivery” metaphor [11]. In other words, the readjustment of the socio-spatial organization, guided by the new infrastructure, has led to a more complex logic behind the spatial layout for urban commerce [12].
Deciding upon the locations of retail and catering commercial facilities is always a complex and important task, especially nowadays, when ODFD is popular [13,14]. Due to the widespread use of ODFD, the retail and catering industries are facing competition not only from offline competitors but also from online ones. As the pressure of competition increases, ODFD has given rise to new forms of business: shops that combine offline and online business or even “ghost shops” that provide services only through ODFD [11]. Shops with this new business format have larger spatial service ranges, a larger number of potential customers, and more varied channels of profitability, due to the flexibility of ordering, than physical stores that do not operate an online presence [1,15]. Moreover, such shops are highly dependent on online traffic and, therefore, tend to be able to have low dependence on location in order to save on spatial, rental, and labor costs [16,17]. In view of the high cost of opening and relocating retail and catering commercial facilities, the reasonable selection of store locations is crucial to improving profitability and reducing cost pressure especially for stores that provide ODFD services.
At present, research on store distribution, based on data such as socioeconomic and built environment characteristics, is not new, but there are generally few studies on ODFD stores [16,17]. Existing relevant research shows that ODFD catering stores are less dependent on traditional locations, prompting the urban commercial spatial structure to become decentralized [7,18,19]. Since the penetration of ODFD into urban commerce is spatially heterogeneous, previous research has mainly focused on how ODFD affects the distribution of the catering industry in macro-cities as well as residents’ eating habits, changes in the logistical environment, and changes in shopping methods [20,21,22,23]. Little is known about how urban spaces are affected by ODFD, especially CBDs, where commercial density is extremely high and takeaway services are extremely frequent. To be more precise, relevant research has identified a trend in the decentralization of ODFD stores at the urban scale, but it is not clear to what micro-location the stores will move. Compared with other urban areas, urban central areas with extremely frequent takeout services have an absolute advantage in the distribution of stores, labor, technology, and other resources. As a result, these areas often have the highest penetration rate and are most effected by ODFD platforms, which is valuable to other urban areas. On the other hand, combined with the actual store location process, although previous research is of great value for store selection in urban areas, it has limited significance for site evaluation at the level of a single space [24], and it is impossible to predict the operating conditions after micro-location selection. In these cases, combined with online sales data, there is a lack of research comparing the distribution differences between purely physical stores and ODFD stores in micro-spatial locations. In addition, most studies have also ignored the current situation that ODFD has become widely present in retail industries, such as supermarkets and pharmacies, in recent years. Therefore, it is also necessary to investigate the status of the retail industry.
In this study, we define retail stores as supermarkets, pharmacies, vegetable shops, flower shops, and other stores facing the street. Restaurants are defined as commercial spaces that mainly provide food and beverages. In addition, we will use the abbreviations B&C for stores providing both dine-in and timely delivery services and B&M for stores that do not offer immediate delivery services [25]. In this context, the current study aims to analyze the spatial distribution and sales data of restaurants and retailers on the ODFD platform in Xinjiekou’s CBD in Nanjing, China, to decipher the new UCSS and geographical phenomena of commerce. Specifically, we aim to answer the following questions: (1) What are the characteristics of the distribution of urban commercial space, including retail stores and restaurants, under the influence of ICT? (2) What are the key factors that contribute to these spatial distribution characteristics? (3) Is there a discernible correlation between location differences and the store’s online sales? If so, which micro-location might be more favorable to B&C establishments?
The remainder of this paper is structured as follows: In the next section, relevant studies in the extant literature are reviewed and discussed. Section 3 provides an overview of the study location and research design. In Section 4, we delve into the distribution characteristics of commercial spaces and the attributes affecting online sale efficiency due to locational differences. Section 5 presents our discussion. Finally, Section 6 summarizes the conclusions drawn from this study.

2. Literature Review

2.1. Urban Spatial Structure

The urban spatial structure is defined as the spatial distribution pattern of activities in a city, reflecting the distribution and composition of the elements in the city [26,27,28]. Scholars have explored the urban spatial structure extensively in terms of land use, behavioral activities, and transportation, focusing on summaries of static urban structures [29,30,31,32,33]. However, ICT has reshaped the relationship between capital, space, and people, guiding the dynamic evolution of the urban spatial structure. On the one hand, new technologies and capital preferences have contributed to the birth and popularity of digital platforms, allowing for the recombination of commercial spaces in new geographical locations, ultimately leading to changes in the structure of physical spaces. On the other hand, human behavioral mechanisms change [18,34,35,36], as manifested in the replacement of consumer visits by logistics distribution visits, leading to changes in the structure of human flow activities. Furthermore, the COVID-19 pandemic accelerated this trend [37,38]. With the improvement of digital infrastructure and the maturity of new business models, the composition of commercial space dominated by restaurants and retail is becoming more important in affecting the urban economic system. Nevertheless, there is limited quantitative analysis of the UCSS. Therefore, filling this gap in the extant literature is necessary to improve urban digital management and achieve sustainable development.
In recent years, some studies have pointed out that the impact of ICT on commercial space in different regions is heterogeneous [39]. More specifically, the impact of ICT varies across regions with distinct business functions and developmental levels. However, the research objects in the existing literature focus on the urban scale, ignoring the possible differential changes in CBDs with highly mature businesses at the medium and micro-scales. It is worth noting that these studies were unable to capture the dynamic impact on UCSS due to the limitations of traditional datasets. Therefore, employing new datasets that are composed of a large number of stores integrated on the ODFD platform can help overcome this limitation.

2.2. Multiple Dimensions of Locations Evaluations and Decision-Making Processes

A suitable location ensures the profitability and long-term viability for a commercial facility. This provides an important basis for predicting its commercial potential, especially catering and retail facilities. The general process of location selection for commercial facilities includes two aspects: macro-location selection and micro-location determination [40,41]. In order to determine the best location for commercial facilities, scholars measure the degree of relative advantage of a location—that is, the potential spatial benefit or economic value—based on theoretical frameworks from different perspectives. Central place theory and spatial interaction theory are based on the assumption of rational consumers and summarize the hierarchical advantages in the macro-urban spatial structure [42,43]. They tend to believe that commercial nodes that are close to more consumers have greater competitive advantages. In contrast, the principle of minimal differentiation proposes a neighborhood location model from a micro-perspective, pointing out that appropriate agglomeration is an important strategy to promote business success. To be more precise, agglomeration enables stores that offer different products to sell complementary products, increase consumer’ shopping frequency per unit time, and attract more consumers at the same time, thereby minimizing store operation risks [38,44]. In addition, urban studies scholars have proposed the concept of space syntax based on the topological structure of urban space, emphasizing the correlation between location accessibility and business success [40,41,45]. Therefore, some scholars have summarized three location factors for business success: agglomeration, centrality and connectivity [44].
While existing theories have contributed to our understanding of dominant locations, they may not provide guidance for selecting micro-locations. The proliferation of computer technology has led to the emergence of extensive data types [46]. Business scholars and corporate entities have responded by developing more comprehensive site selection models that integrate more data types to assess and predict the business potential of specific locations [47,48,49]. Currently, there are three primary categories of research methods related to this topic. The first type of approach is a comprehensive analysis that takes into account demand and competition. This type of research often measures demand by analyzing the population structure in small-scale areas, and it considers competitive factors, such as competition density, competition scale, etc. [41,50]. Finally, the location is selected based on rent and other information [51,52]. The second category of methods focuses on store operational performance. The most direct method is to consider the long-term dynamic study of store opening, closing, and relocation in a specific area, which effectively reveals the difference in benefits of different locations for store survival [53]. Similarly, it is common for business analytics to combine sales dynamics data and review data with store location information, aiding in the identification of location factors that influence performance [54,55]. The third category of methods focuses on analyzing foot traffic at micro-locations. It is unanimously agreed that customer flow is considered to be the most direct factor affecting the success of a store [24,56]. Foot traffic represents the attractiveness of a location and is also positively correlated with more shopping behaviors and payments [57]. However, due to technical limitations, most studies are unable to accurately measure passenger flow directly. Instead, they use proxy variables like accessibility, walking environment quality, and land use attributes to predict passenger flow [40].
Some studies have indicated that ODFD reduces the reliance of B&C’s establishments on foot traffic and traditional advantageous locations. However, existing research focuses on the analysis of the advantageous locations of B&Ms and rarely involves B&Cs. Therefore, it is necessary to examine the differences between the preferred locations of B&Cs and traditional advantaged locations to improve the mechanistic understanding of B&Cs location selection at the micro-scale.

2.3. Multifaceted Determinants of the B&Cs Businesses

As an emerging business form that adopts instant delivery services, B&C has received widespread attention from scholars in various fields. Research has demonstrated that the Internet has transformed not only how consumers interact with physical stores but also the operational methods and customer acquisition channels of these stores [43,58]. Notably, there is an ongoing debate regarding whether the Internet will alter the fundamental principles of store locations. As a result, many scholars generally use the rules affecting traditional physical stores to assess the extent of change in B&Cs [16,59]. At present, relevant discussions mainly focus on the urban built environment, socio-economic characteristics and marketing mix [49,60,61,62]. In terms of business research, most studies start with an exploration of supply and demand, demonstrating the significance of factors such as demographic structure, educational background, cultural background, and income level on online consumption [55,63]. Simultaneously, several studies have shown that business models, product types, and marketing methods significantly impose significant constraints on B&C establishments’ location selection and sales capabilities [64,65]. Therefore, more and more scholars believe that there is a close correlation between business form and store location and sales.
In addition to the business field, urban research scholars have conducted in-depth research with urbanization and accessibility as the two main research starting points. At the heart of the debate between the efficiency hypothesis and the technology diffusion hypothesis, urbanization plays a pivotal role in determining residents’ ease and frequency of online shopping, as well as influencing potential operational strategies for commercial facilities [66]. Recent research suggests that the actual scenario is actually more complicated, and the two are not inherently contradictory [35,38,67]. On the other hand, accessibility calculation based on multiple transportation modes focuses on examining the results of changes in location dependence of B&Cs [14,25]. In addition, factors such as rent, business district location, distance from commercial centers and public infrastructure, road network density and building type have varying degrees of interpretability for B&C store locations, confirming its trend of moving to non-core locations [17,58,68]. Recent research has highlighted that the heterogeneous distribution of distribution labor may directly affect the efficiency of online business completion, consequently affecting the online sales and viability of B&Cs [69]. However, due to a lack of relevant data and a lack of attention to the potential correlation between store sales dynamics and delivery labor, some studies have not explored this further.
Although existing studies have extensively studied the factors that may affect B&Cs, they only focus on the impact on the distribution of B&C restaurants within macro-regions, which limits their ability to identify the evolution of different types of business trends at the meso-micro scale, such as real-time retail. Therefore, comprehending the nuances of how these factors influence store location and sales dynamics, and utilizing this knowledge, could be a key factor in achieving success in online competition.

3. Materials and Methods
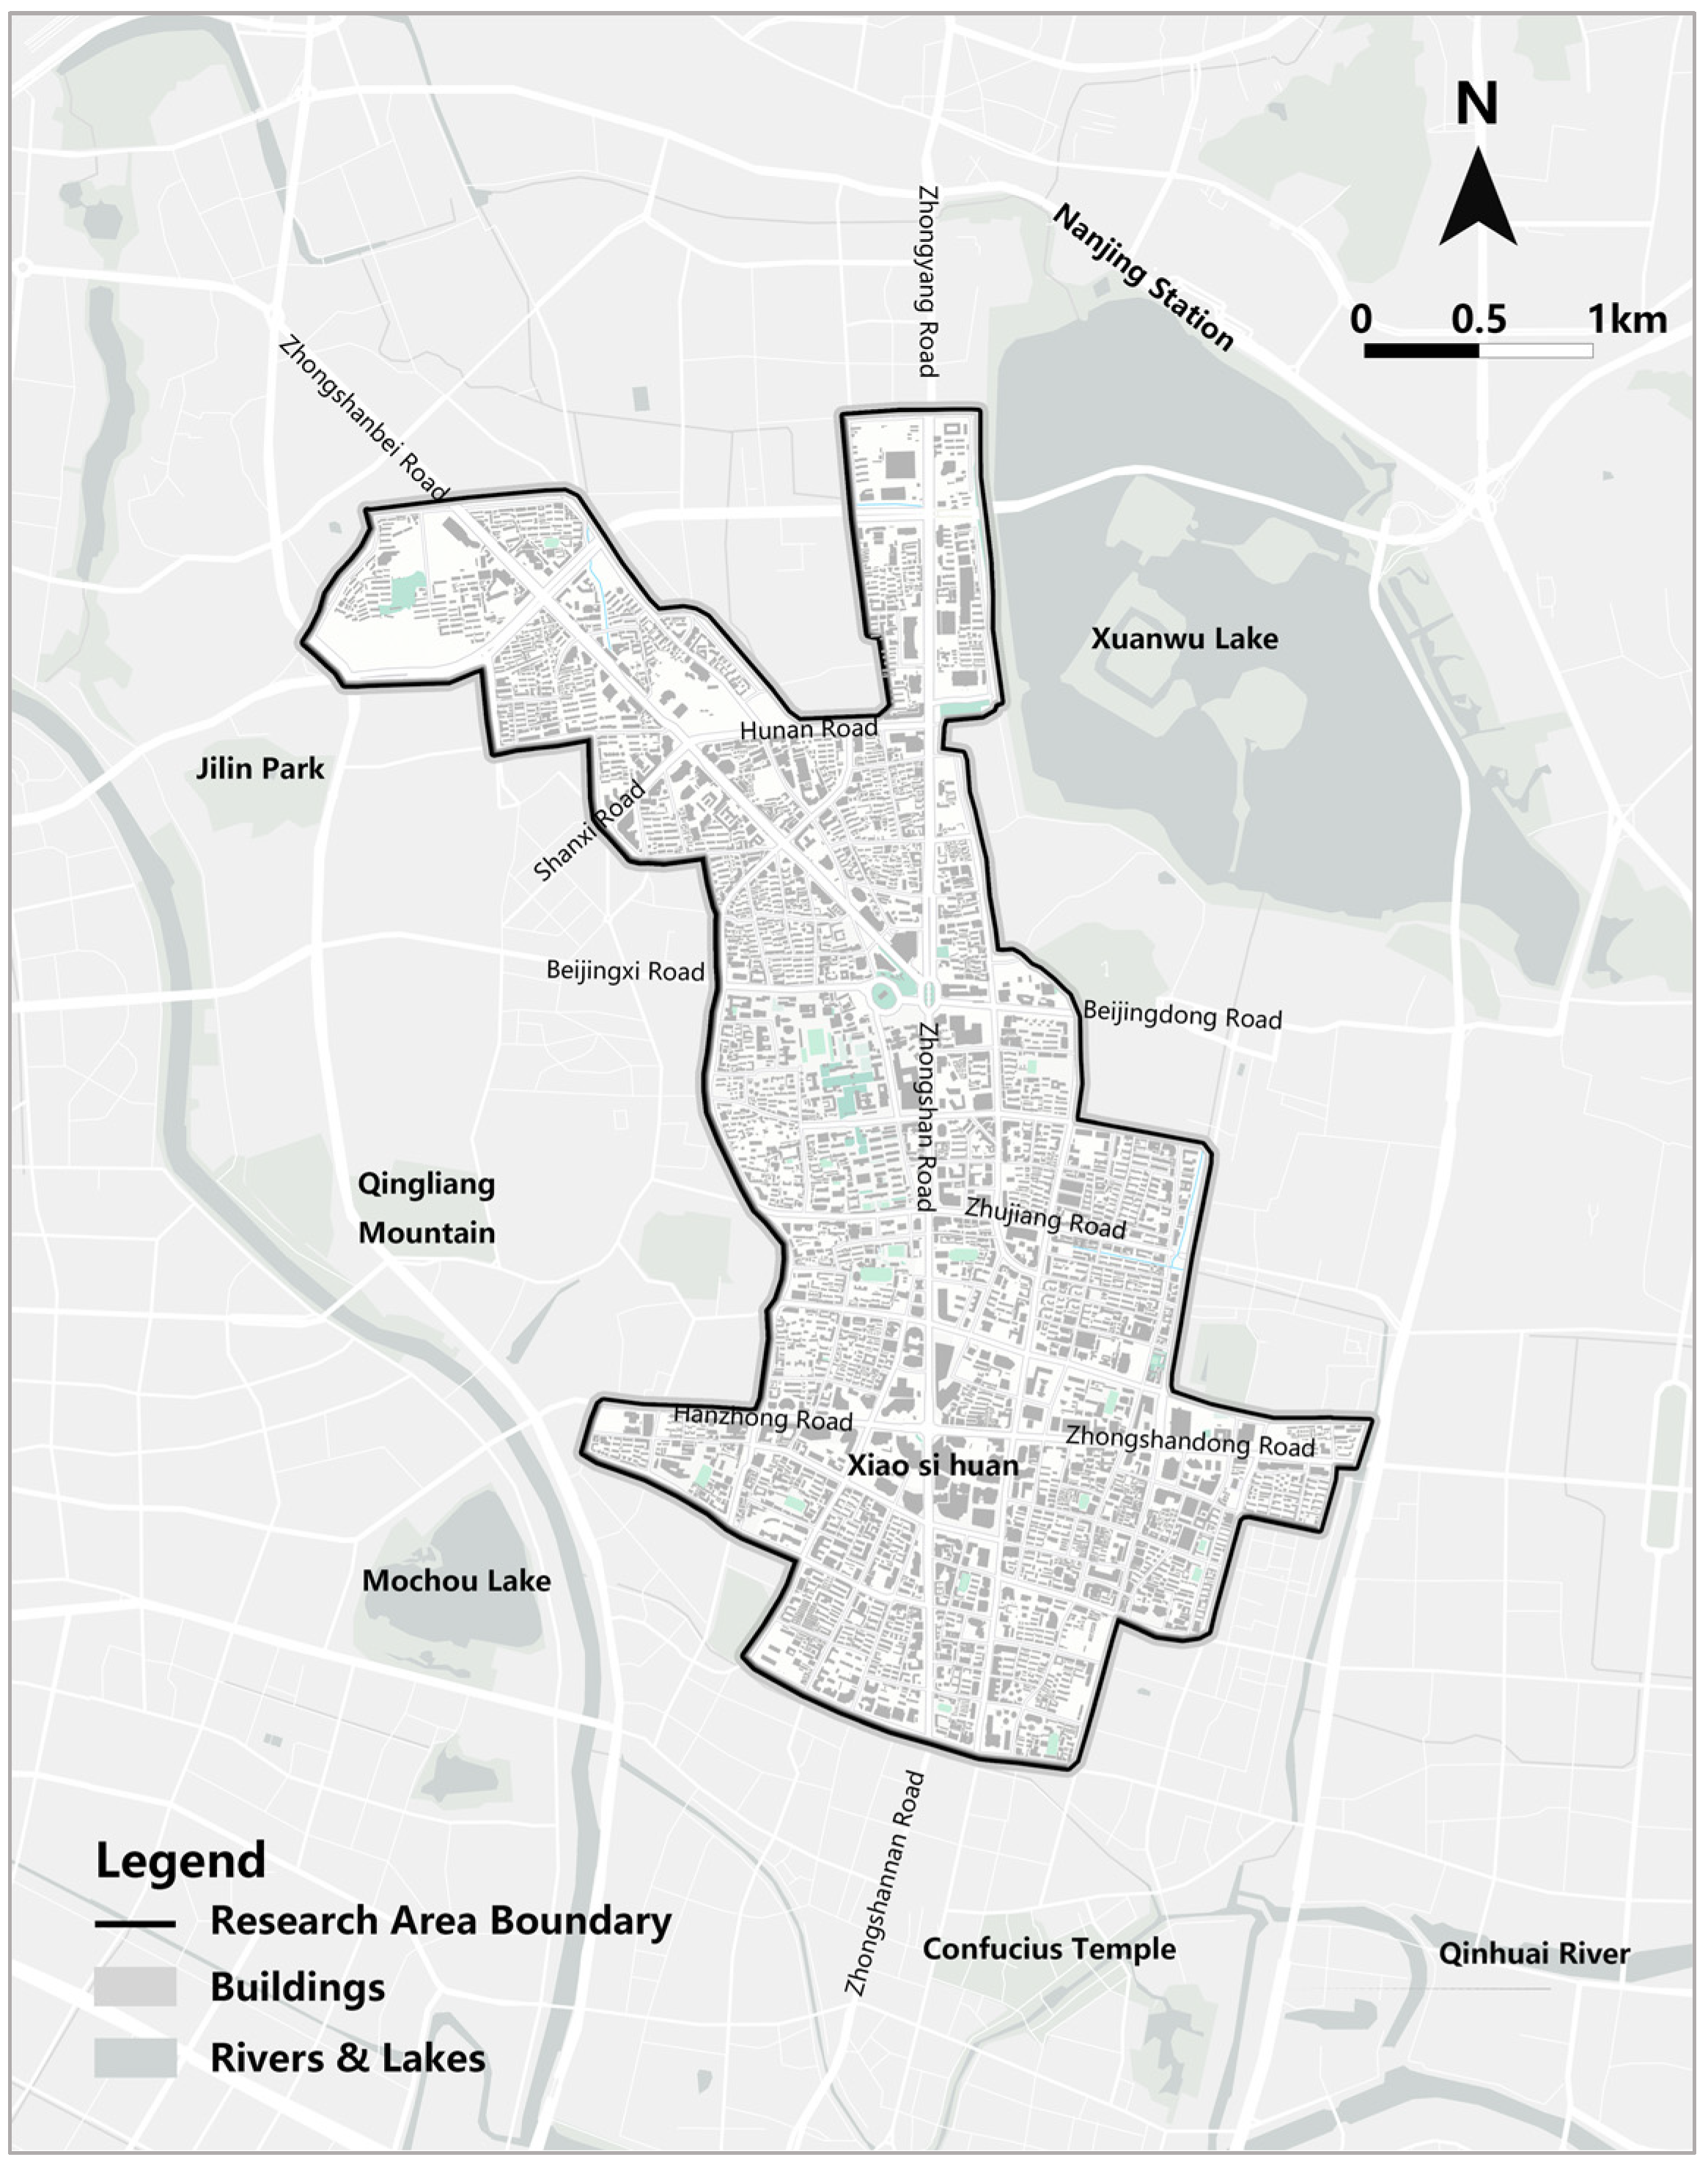
3.1. Study Area

Nanjing is an influential provincial capital city in China’s southeastern coastal region and one of the core cities in the three economic spheres. In 2021, Nanjing’s total retail sales of consumer goods reached RMB 789.94 billion, and the per capita retail sales of consumer goods reached RMB 84,800, ranking first in China [70]. In the same period, Nanjing’s online retail sales reached 650.1 billion yuan [71]. Furthermore, Nanjing’s takeaway business, one of the main online consumption scenarios, ranked 10th in mainland China with over 100 million takeaway orders in 2019 [72].
Xinjiekou’s CBD in Nanjing (Figure 1) was chosen as the location for the this study, as detailed in Section 3.3.1. This selection is based on Xinjiekou’s status as the most densely populated and commercially active area in Nanjing, which has functioned as a comprehensive urban center for business and commerce for over a century. Moreover, according to the 2035 Nanjing Master Plan, Xinjiekou’s CBD is slated to remain the city’s central hub and play an crucial role in core functions [73].

3.2. Data

The data used in this study consist of primarily five categories:
(1)
The building vector data of Xinjiekou’s CBD were sourced from the open source database of the Chinese Academy of Sciences (https://www.resdc.cn/, accessed on 10 March 2022). The dataset includes building ground outlines and building heights.
(2)
The acquisition of point of interest (POI) data for physical stores was a two-step process. Initially, Python programming was used to extract data in batches from the open platform of Gaode Map (https://lbs.amap.com/, accessed on 29 March 2022). Subsequently, data calibration was performed through field research. The attributes of the acquired data included store name, latitude, and longitude.
(3)
The ODFD platform store data were crawled through Python on 29 March 2022. The data were obtained from two ODFD platforms: Meituan Waimai and Ele.me. The reasons for choosing Meituan Waimai and Ele.me were as follows: ① In 2021, these two platforms were the largest takeaway platforms in China, jointly holding a market share exceeding 90% [72,74,75]. They encompassed a vast majority of the stores offering takeaway services; ② Chinese takeaway services are highly dependent on third-party platforms to create orders and deliver goods [17]. The collected data attributes included name, latitude and longitude, monthly sales, and store type. In addition, we established links between the ODFD store data and POI data using name and coordinates, which was followed by manual calibration to ensure the accuracy of the data.
(4)
Traffic data were obtained through Baidu’s open map platform, (https://lbsyun.baidu.com/, accessed on 27 March 2022), which could be divided into static and dynamic data [76]. Static data encompassed the latitude, longitude, and names of subway stations and bus stations. Dynamic data included pedestrian traffic data. It was time consuming to obtain point-to-point traffic data in batches through the pedestrian path-planning API service. Compared with traditional methods of obtaining traffic data, the traffic data provided by map service providers are more real-time representative and more accurate. The specific reasons for utilizing pedestrian traffic data in this study were as follows: ① The research area was within walking distance; ② The central area experienced high foot traffic, with most people walking; ③ After testing, the walking speed was 1.25 m/s, and there was minimal variation in pedestrian traffic accessibility between working and non-working days, making it relatively stable.
(5)
The data on residential communities, offices, and stores were collected on 20 March 2022. We collected the data mainly using Python via Anjuke (https://nanjing.anjuke.com/, accessed on 15 March 2022) and Lianjia (https://nj.lianjia.com/, accessed on 20 March 2022), including data on name, latitude and longitude, house price, and rent.

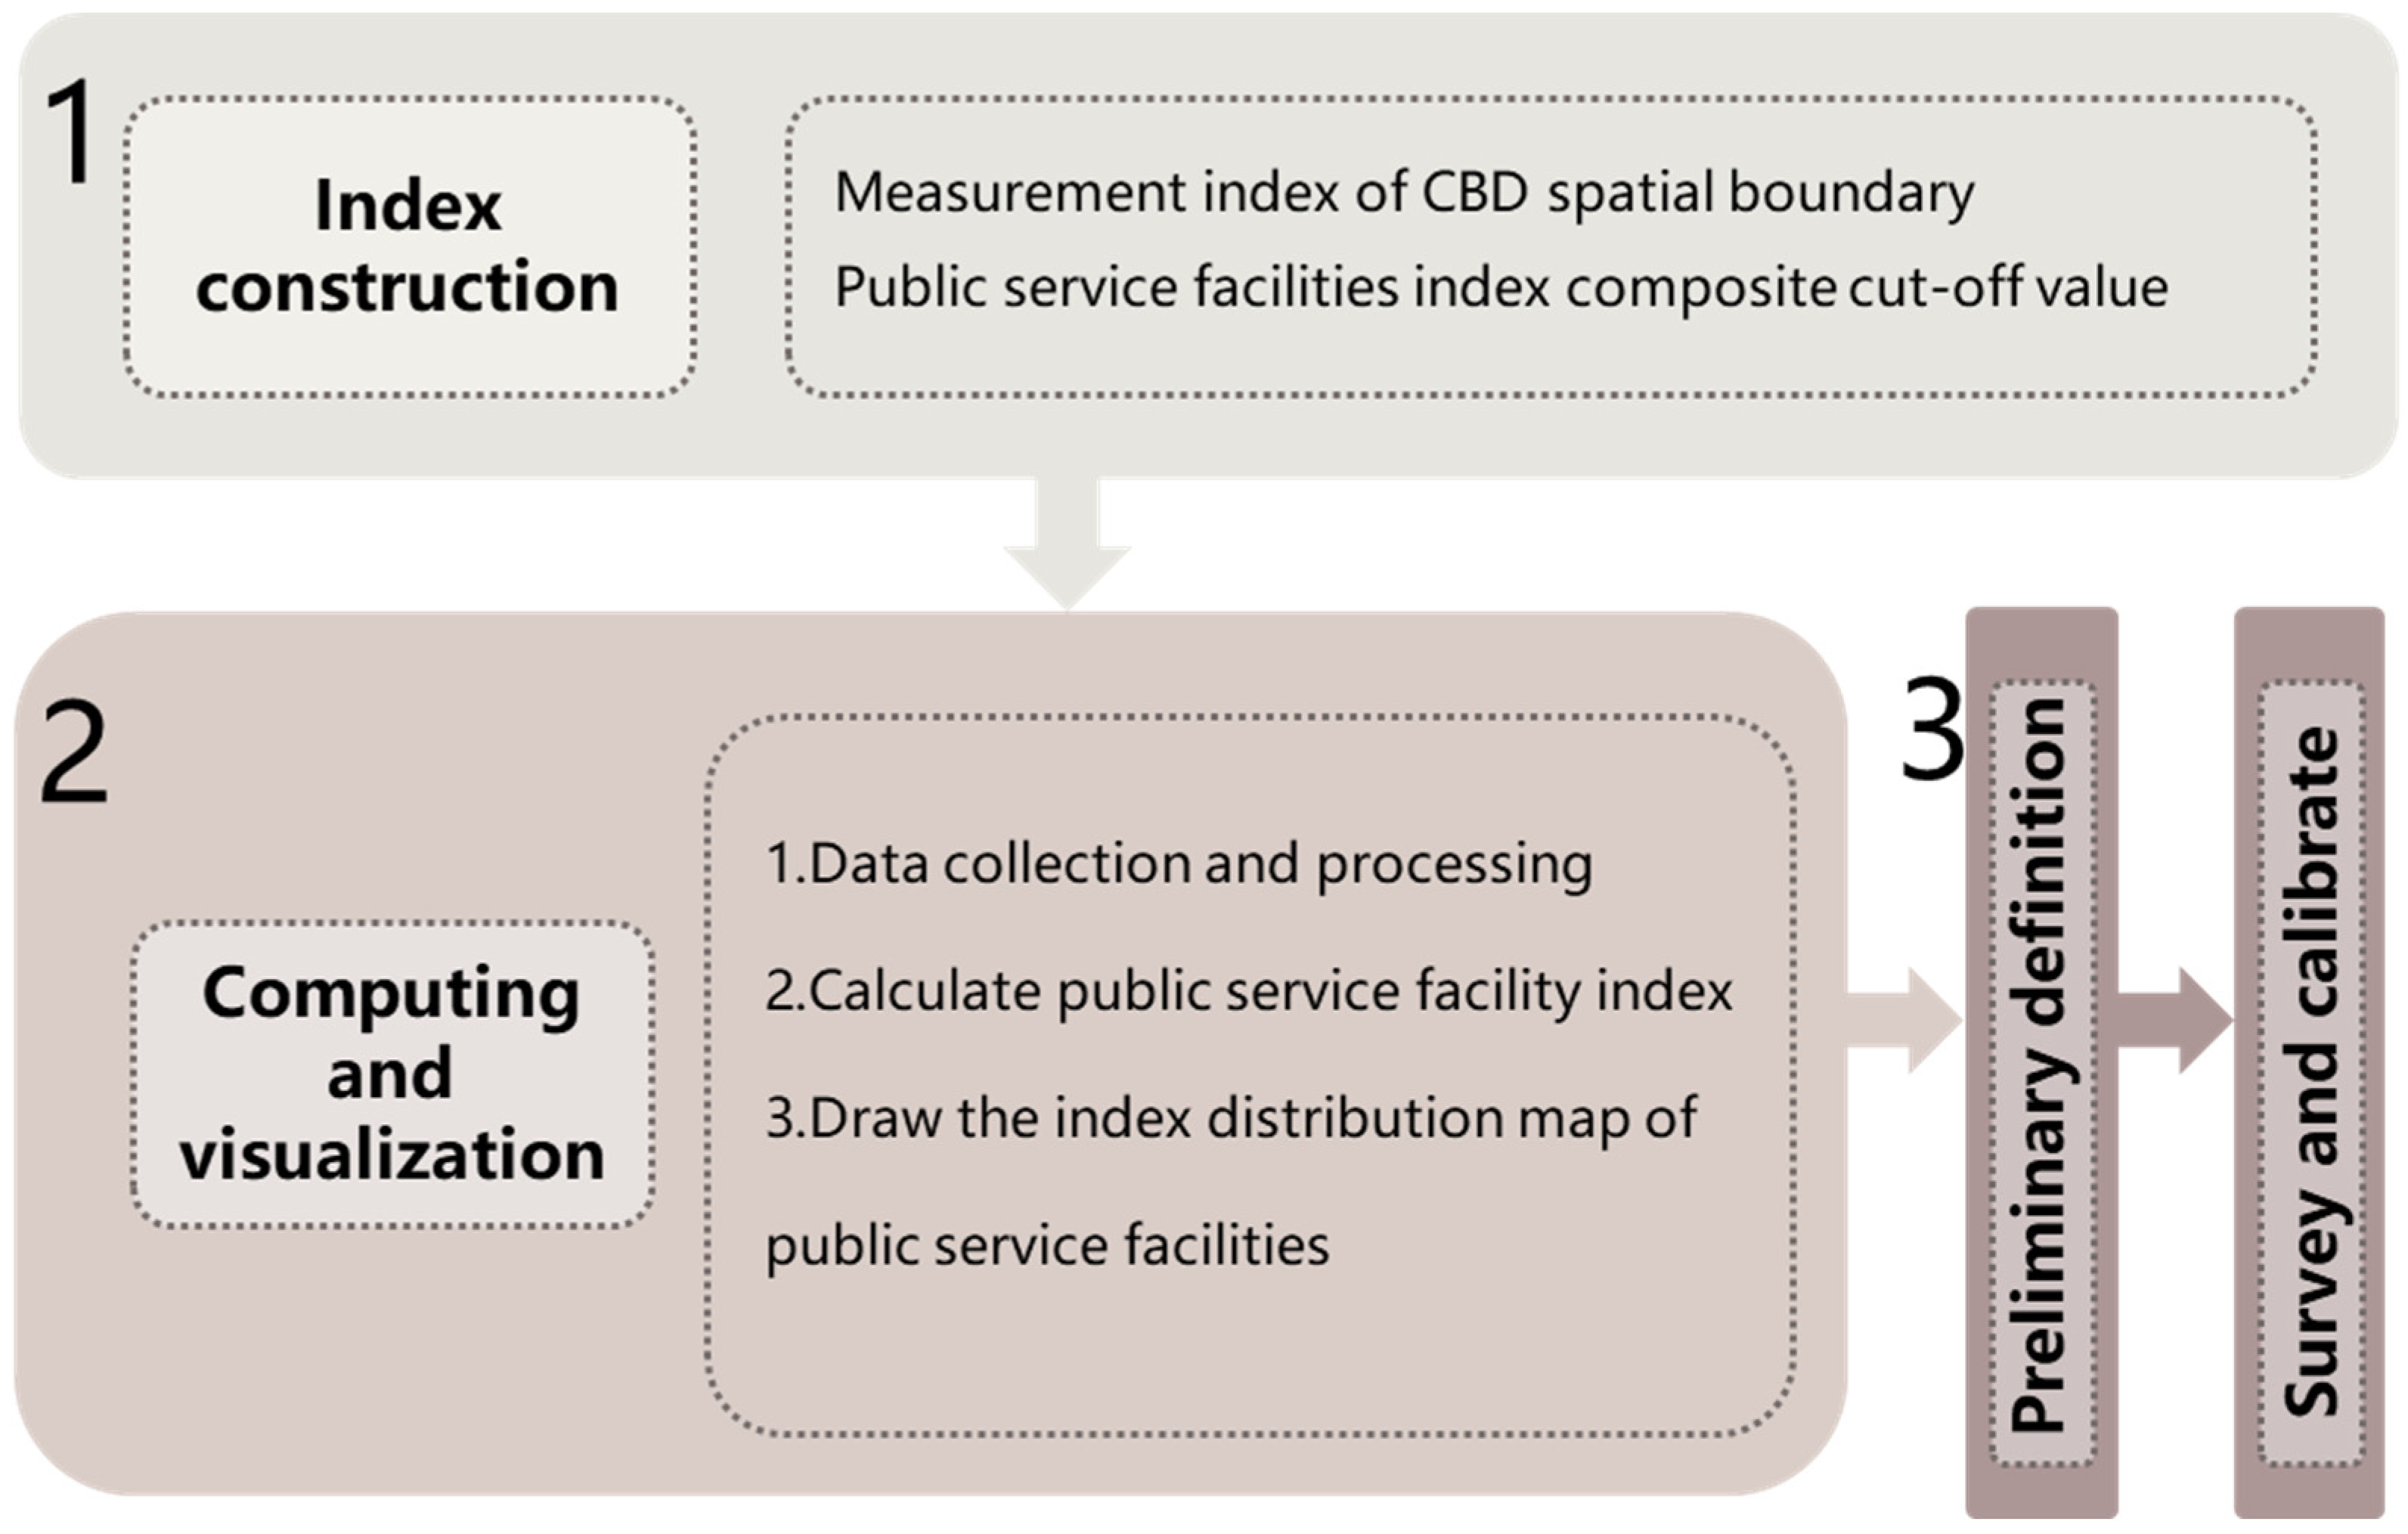
3.3. Research Design

This study evaluates the impact of ODFD on the location of restaurants and retail industries within the CBD. This study focuses on the central area of the city because this is the area with the highest commercial density and the most active takeout services in the city. In addition, at the medium and micro-scale, the CBD is a comprehensive urban functional area, showing a different B&C store spatial pattern from the macro-scale.
Our main research ideas are as follows. Firstly, by testing the distribution status of B&C and B&M shops in urban centers, we distinguish the extent to which the retail and catering industries are affected by ODFD. Secondly, we explore the general spatial distribution mechanism of B&C shops using regression modelling to test whether there is a correlation between online sales and B&C shop distribution. Finally, in conjunction with previous location assessment methods, three 20-min isochronous circles are established to cover the entire CBD, centered on each of the three core commercial nodes (CCNs), to verify the potential connectivity between traditional micro-advantageous locations and B&C shop locations and online sales as well as identify micro-locations that may be conducive to online business.

3.3.1. Definition of the Central Business District

The scope of Xinjiekou’s CBD was defined using the public service facility index method [77]. This method takes into account the development characteristics of China’s urban central districts and is grounded on two key principles: (i) public service institutions are the functional essence of CBDs; (ii) the degree of spatial aggregation of public service facilities serves as a comprehensive measure for identifying the scope of the CBD. Hu and Yang proposed a methodology to define the spatial extent of CBDs based on the values of the Public Service Facility Height Index (PSFHI) and the Public Service Facility Intensity Index (PSFII), which were calculated using Formulas (1a) and (1b), respectively. The specific for defining the scope are illustrated in Figure 2.
P S F H I = S a S b × 100 %
P S F I I = S a S c × 100 %
where S a is the building surface of the public services on the surveyed site, S b is the site area of the surveyed site, and S c is the total floor area of the surveyed site.

3.3.2. Spatial Statistical Analysis

This study mainly uses spatial analysis tools based on the ArcGIS Pro software to describe the spatial distribution patterns of two types of B&C stores (i.e., restaurant and retail) in the central area of Xinjiekou. In addition, to measure the level of penetration of the ODFD platform into B&M stores, we use a Platform Penetration Index (PPI) to describe it. The details are as follows:
To avoid deviations in evaluating the size of B&C stores due to differences in the number of stores in the spatial unit, we use the proportion of the number of B&C stores in all stores as a representation. The index only reflects the quantitative relationship between the two.
P = N a N b × 100 % ,
where P represents the PPI; N a and N b are the numbers of B&C and B&M stores, respectively.
(1)
Kernel density estimation (KDE)
KDE is employed to calculate and generate a spatial analysis map that visualizes the distribution pattern and relative concentration of the dataset based on the spatial location of a given elemental dataset. After several attempts, we set a search radius of 500 m to identify the density distribution characteristics of businesses and the location of CCN. The specific definition is as follows. Firstly, we use kernel density analysis method to identify several regions with relatively high commercial density by inputting POI data. Secondly, the geographic coordinates of the locations of the highest commercial density in these regions are calculated, and finally, the geographic coordinates and the surrounding areas are identified as the core commercial nodes.
(2)
Average nearest neighbor (AVN)
AVN is a geographical indicator used to quantify the degree of spatial dispersion of a point dataset. It is calculated as the ratio of the average nearest neighbor distance of an element dataset to the average distance in a hypothetical random distribution. The elements are considered clustered when the ratio is >1 and dispersed when it is <1.
(3)
Optimized hot spot analysis (OHSA)
OHSA is a method for identifying local spatial autocorrelation phenomena for analyzing the distribution trend of spatial elements. Depending on whether each observation has a significant spatial association with its neighbors, the algorithm generates a spatial analysis with hot and cold spots representing clusters of high and low values, respectively. Specifically, we use the 200 m × 200 m grid as the basic geographic unit to identify hot spots for the number of B&Cs and PPI.

3.3.3. Random Forest Regression Model

RFR model is a machine learning algorithm based on decision trees. It employs multiple tree classifiers for classification and prediction. In regression problems, random forests can effectively measure the relative importance of drivers and generate reliable analytical results [78]. For example, the RFR model was used to study the importance of each driver affecting urban land expansion [79]. In the present study, we built this algorithm using MATLAB and ranked the importance of the drivers affecting the spatial distribution of B&Cs.
In selecting explanatory variables, we used the number of B&Cs as the dependent variable. Drawing from the literature review, we identified several categories of explanatory variables (demand scale, diversity of demand, economic costs, traffic costs, and online sales volume) from online business perspective, as shown in Table 1 [13,14,17]. The primary reasons for choosing specific explanatory variables were as follows. (1) Population size is the main factor that directly affects the operation of B&Cs. In CBDs, community residents and white-collar workers are the main customers for takeaway consumption. However, data on the population size and the number of white-collar workers were difficult to obtain. Therefore, we used data on the number of residential communities and office buildings to represent the size of demand. (2) High-income population groups and different types of population groups tend to have diverse demands, triggering more stores to gather. However, owing to the unavailability of per capita income data and difficulty of quantifying group types, we chose two indicators, house price and office building rent, to reflect the diversity of demand indirectly. For different types of population groups, we quantified them through the calculation of information entropy based on POI types. (3) In terms of economic costs, store rent is one of the main economic costs of store expenditures, which directly affects the location of stores. (4) The convenience of transportation reflects the accessibility of stores and indirectly verifies the location strategy of different types of stores. We chose to reflect it through three indicators: the walking time to the nearest commercial node, the distance to the nearest commercial node, and the number of traffic stations. (5) The number of online sales represents the performance of the takeaway service, the activity level, and the concentration of delivery labor per unit of time.
Before employing the RFR model, we divided the original dataset into a training set and a validation set. To enhance the fitting accuracy and stability, the relative shares were set to 70% and 30%, respectively. The number of relevant parameters (i.e., leaf and tree) were set to 3 and 500, respectively.

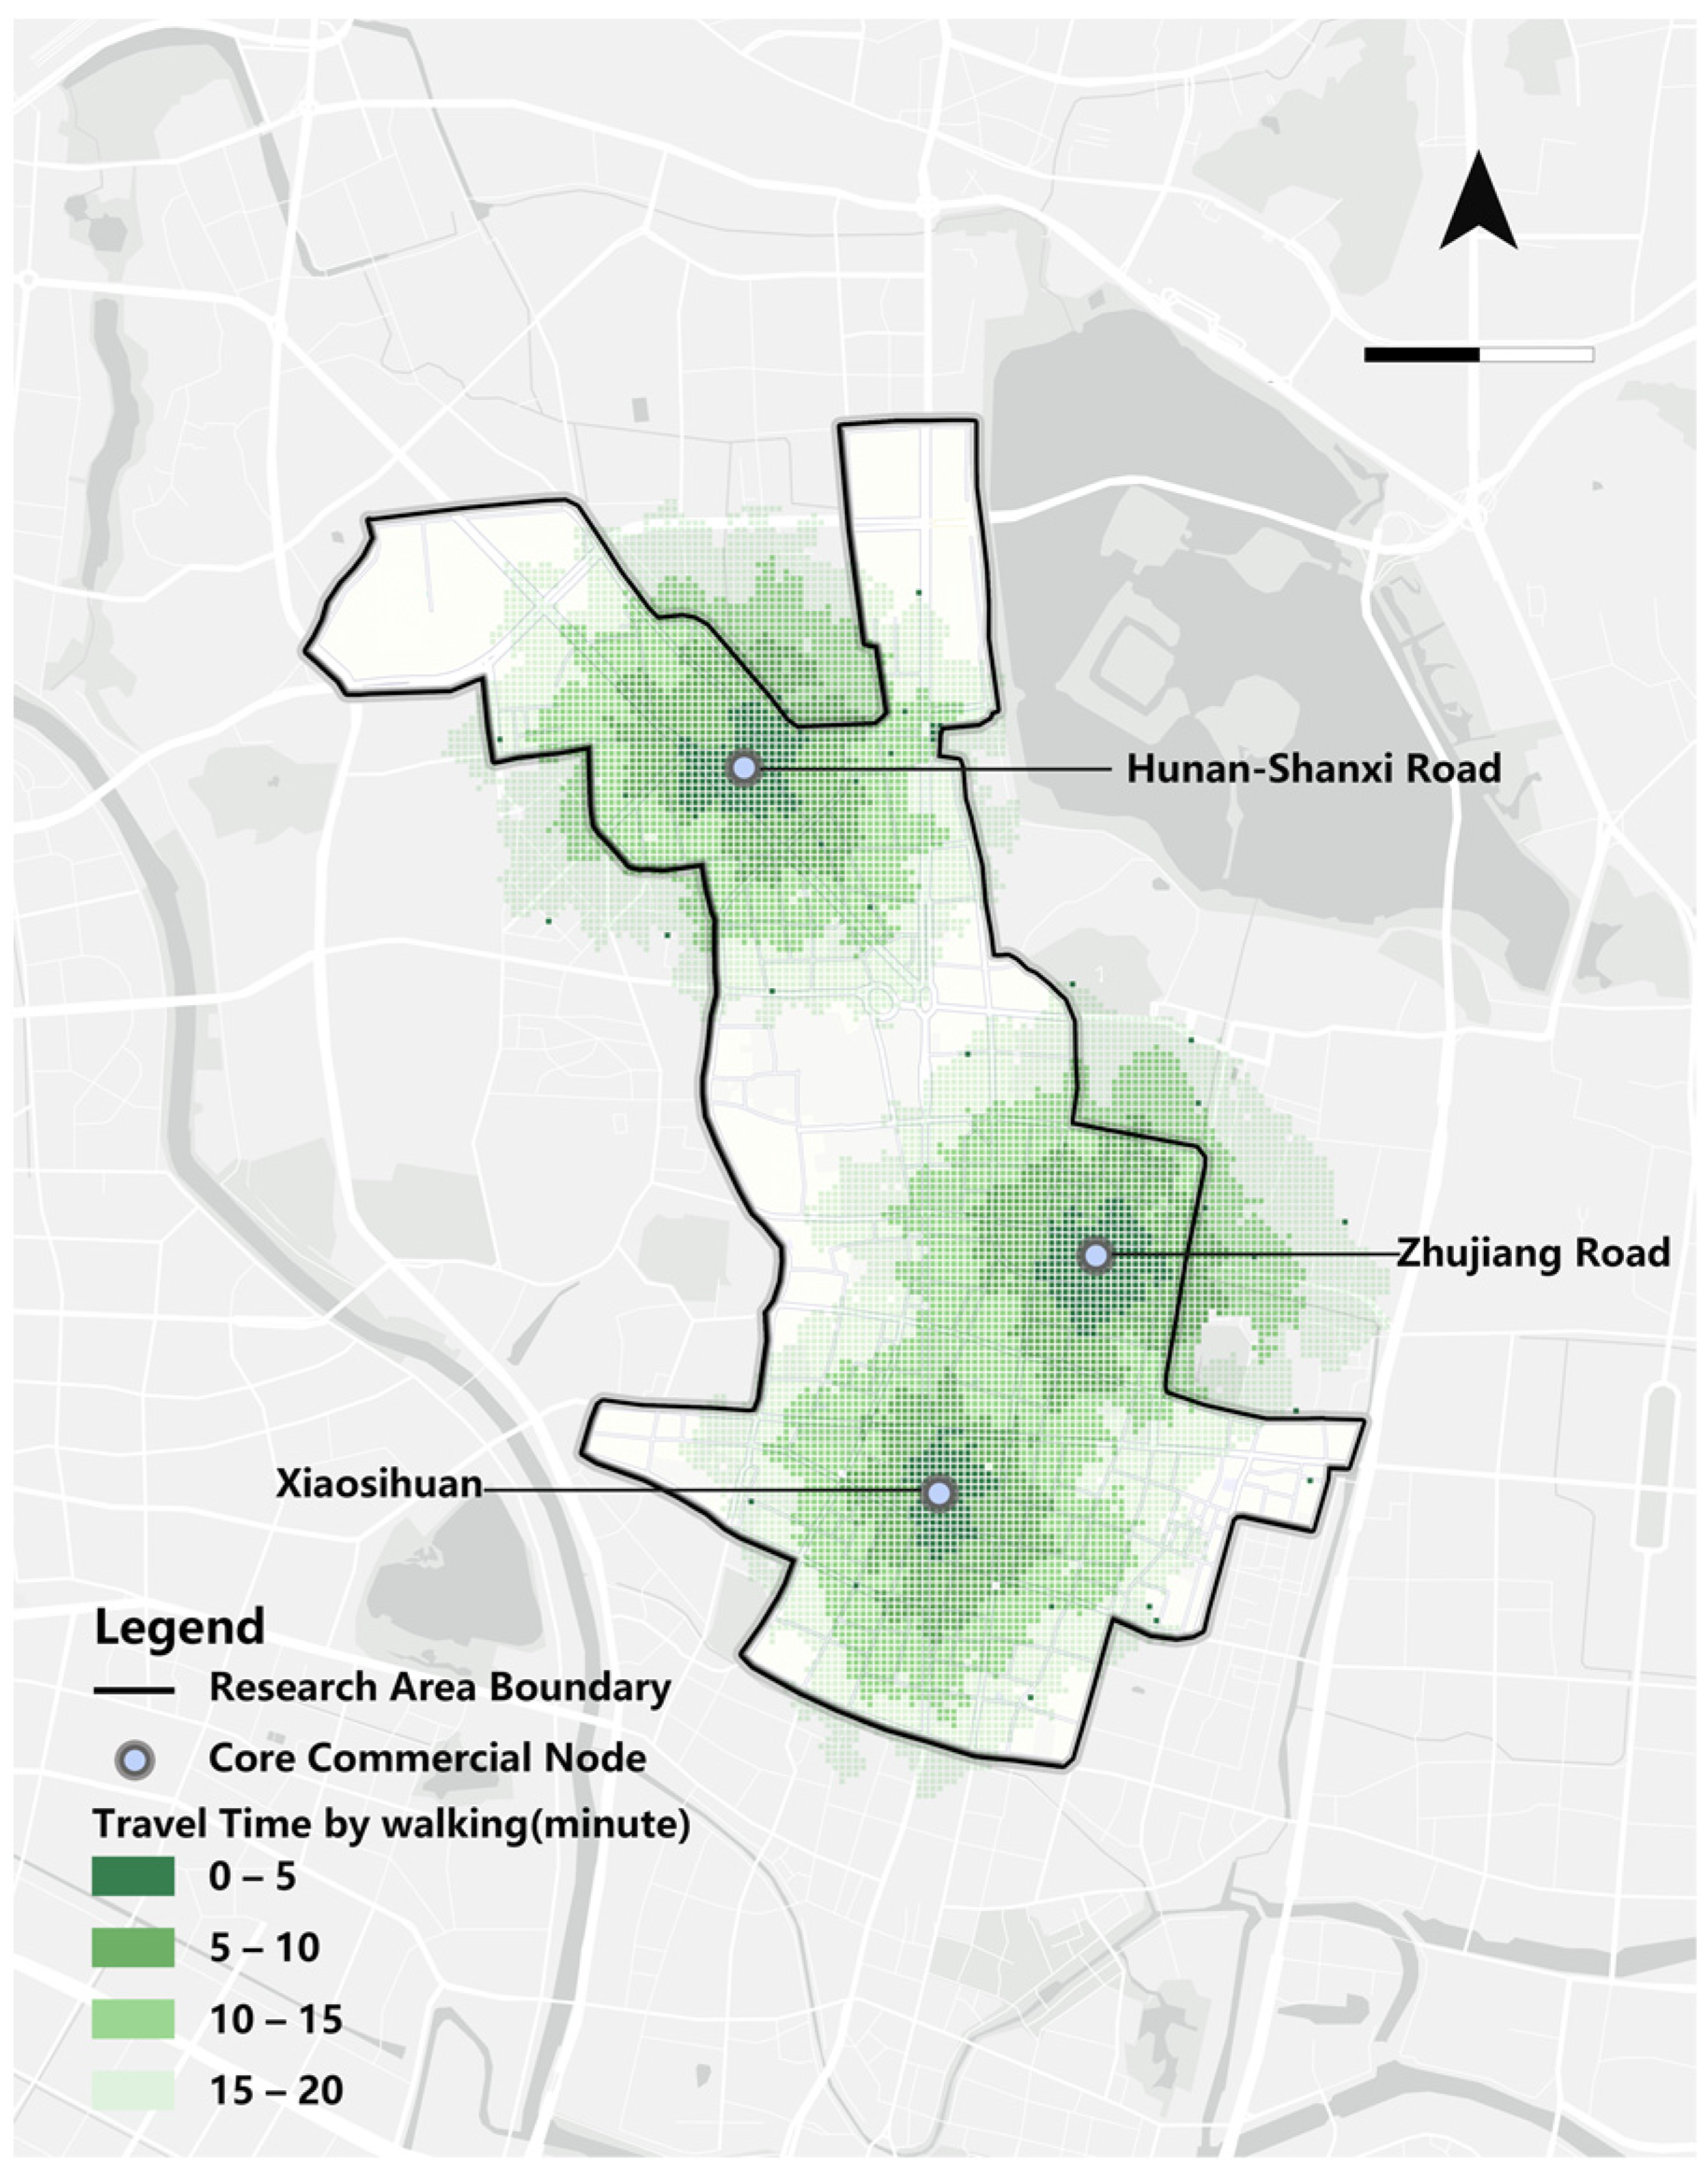
3.3.4. Traffic Isochronous Analysis

Isochronous analysis is a common method used to quantify traffic accessibility. Previous studies have highlighted that customer traffic is a consequence of commercial agglomeration. Merchandising is influenced by the density of foot traffic, and the areas with the highest density of foot traffic are usually the best locations from a traditional perspective [80]. Therefore, we opted to use the accessibility results obtained from the isochrone analysis to evaluate the location. In the following steps, we used QGIS to process the pedestrian dynamic traffic data to generate 20-min isochrones starting at the CCN with 5-min intervals (Figure 3); the lighter the color, the less accessible the area and the worse the micro-location.
To evaluate the correlation between B&Cs location and online monthly sales, we counted the monthly sales in each time cost circle for comparison. Notably, to avoid data errors caused by platform differences, we only used Meituan data in this part.

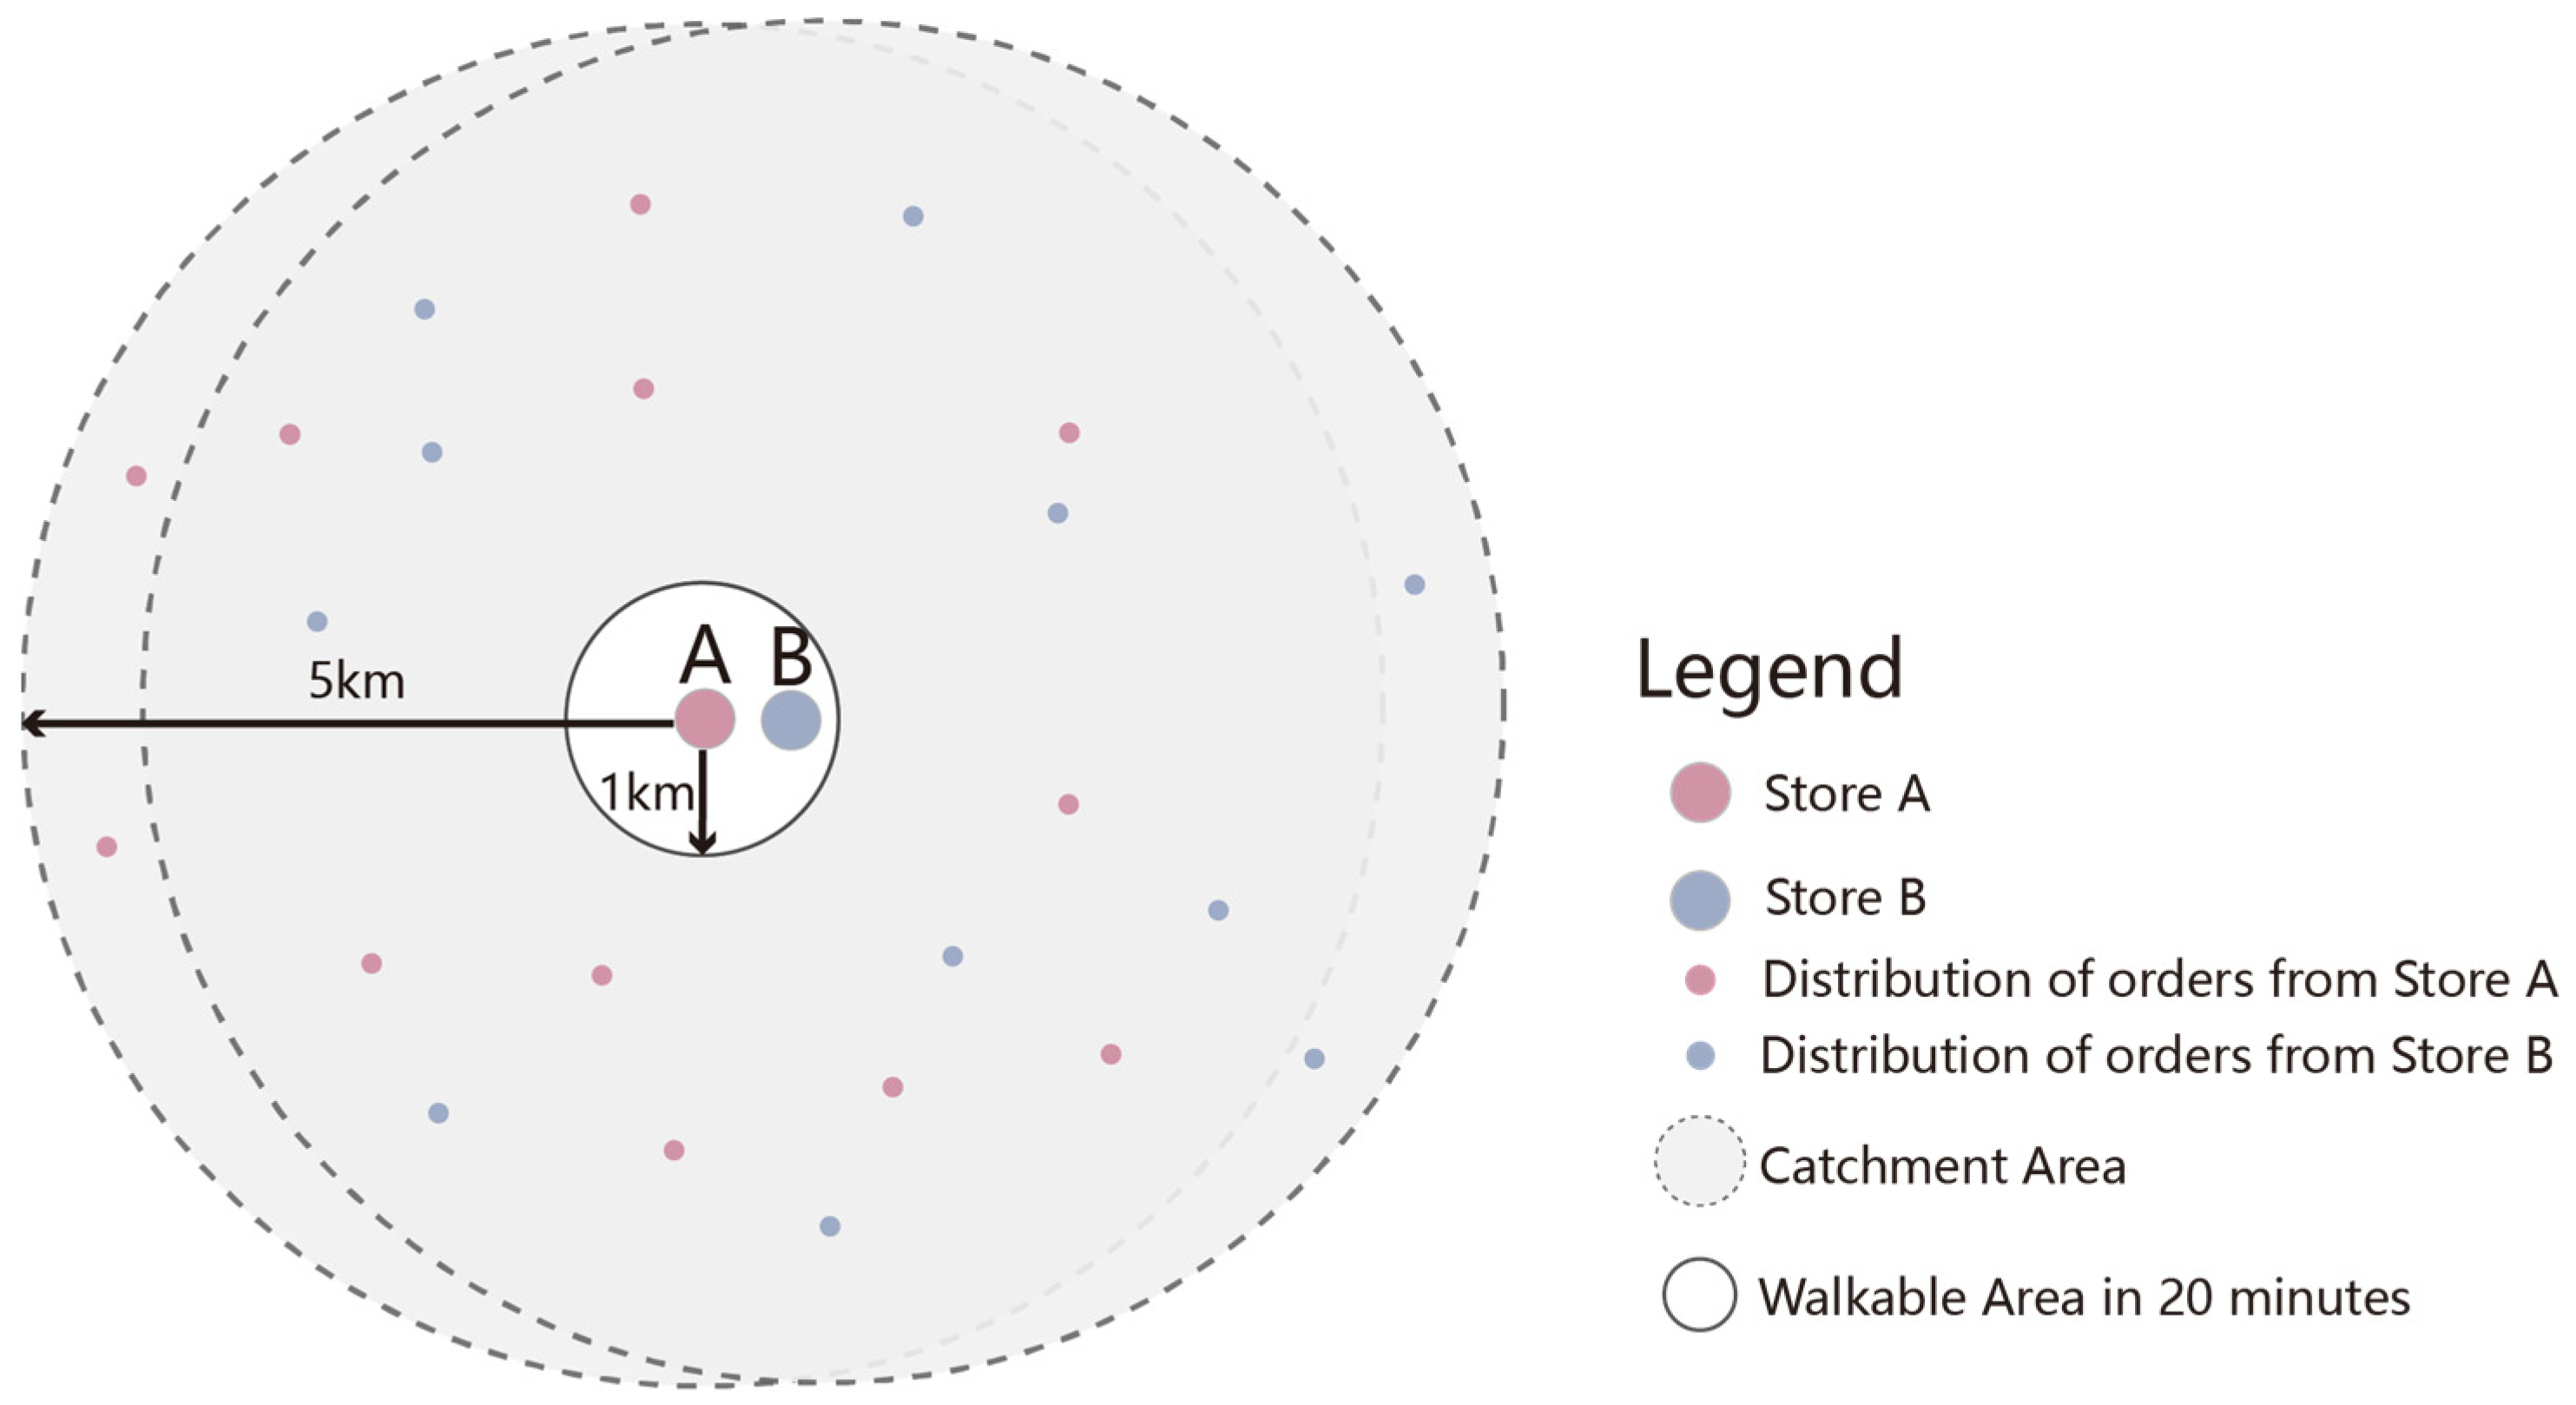
3.3.5. Online Sales Efficiency Evaluation

From a competitive business perspective, the difference in online sales between stores with overlapping spatial service areas provides an accurate indicator of competitive efficiency. To compare the competitive efficiency of stores under micro-location conditions, we constructed a model as shown in Figure 4 based on the above-mentioned 20-min isochronous circle. In general, the just-in-time delivery service radius is 5 km [81]. In this model, Store A is within a 5-min isochronous circle, and Store B is within a 20-min isochronous circle. Considering the limit distance (approximately 1 km) between A and B, the overlapping competition area between stores is the smallest at 87% of the service area. Therefore, it is reasonable to compare the competitive efficiency by volume difference.
Additionally, we employed the DBSCAN algorithm to identify the heterogeneous distributions of store clusters with similar sales efficiency. DBSCAN is a machine learning clustering algorithm known for its ability to consider both spatial and attribute data simultaneously, allowing it to detect spatial clusters of arbitrary shapes while identifying noise points. The algorithm relies on two key parameters: the neighborhood distance (Eps) and the minimum number of samples contained in the Eps neighborhood (MinPts). In this study, the algorithm was implemented using Python. The specific parameters were set as follows. The data dimensions included geospatial coordinates and sales, MinPts = 5, Eps = 100.

4. Results

4.1. Spatial Distribution Pattern

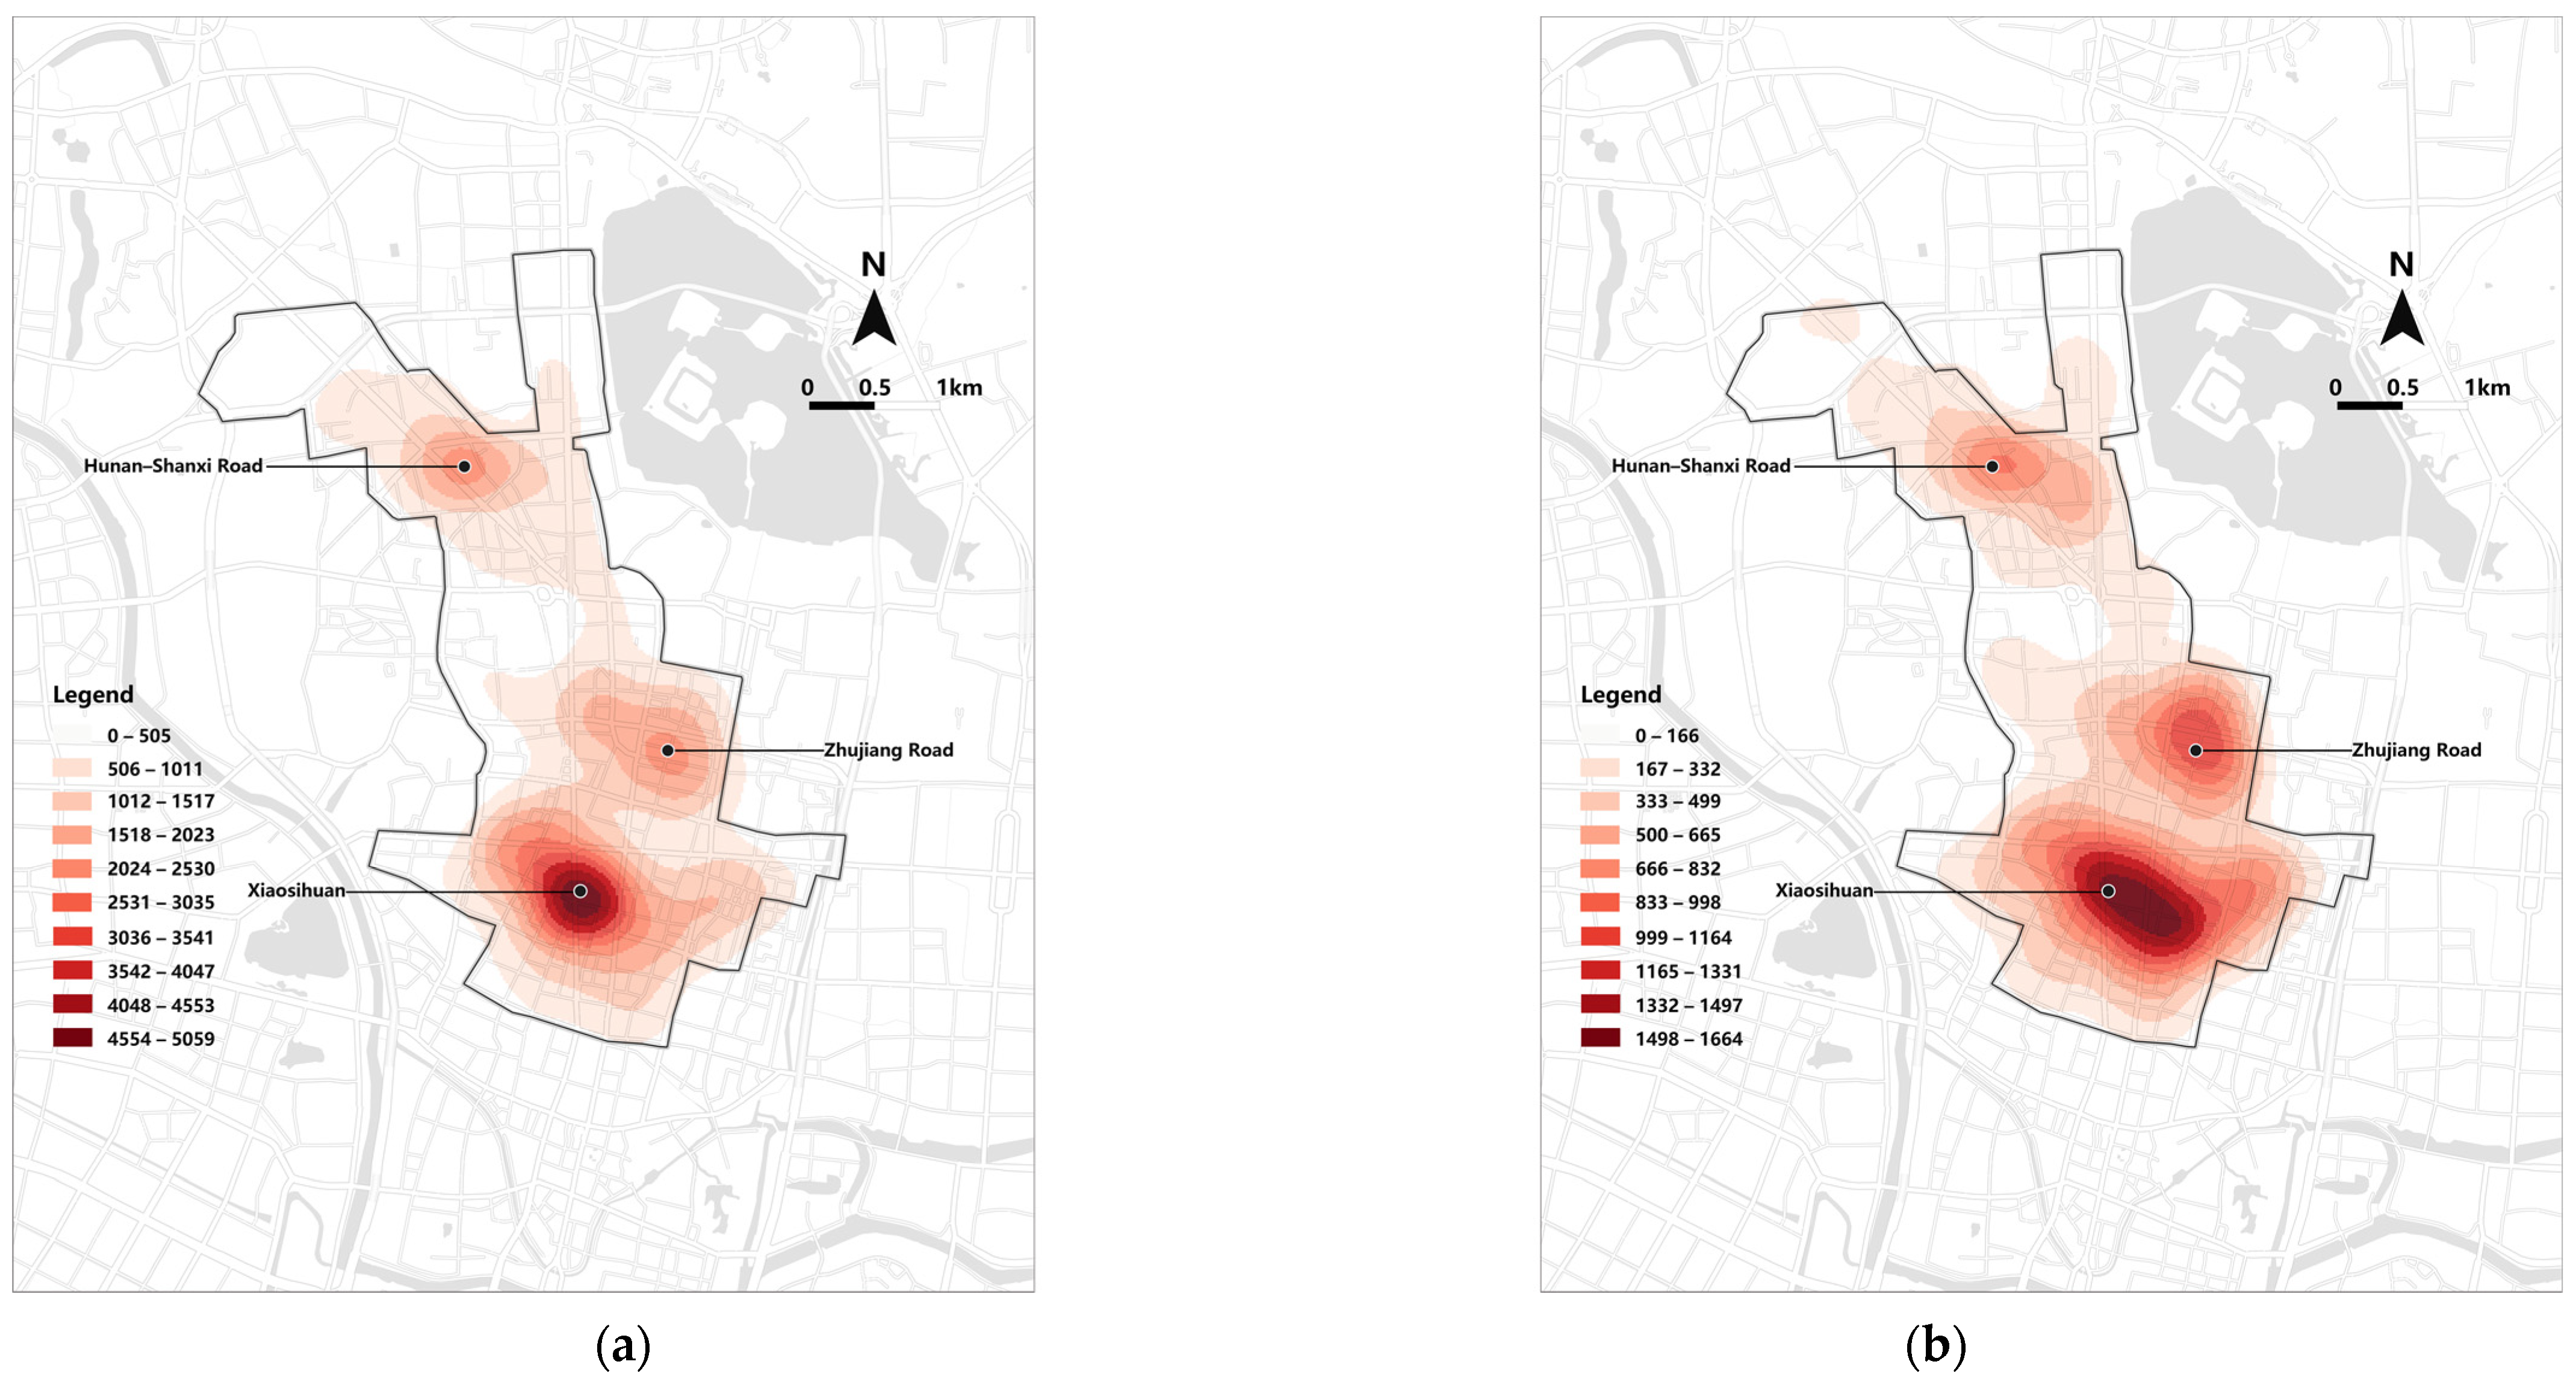
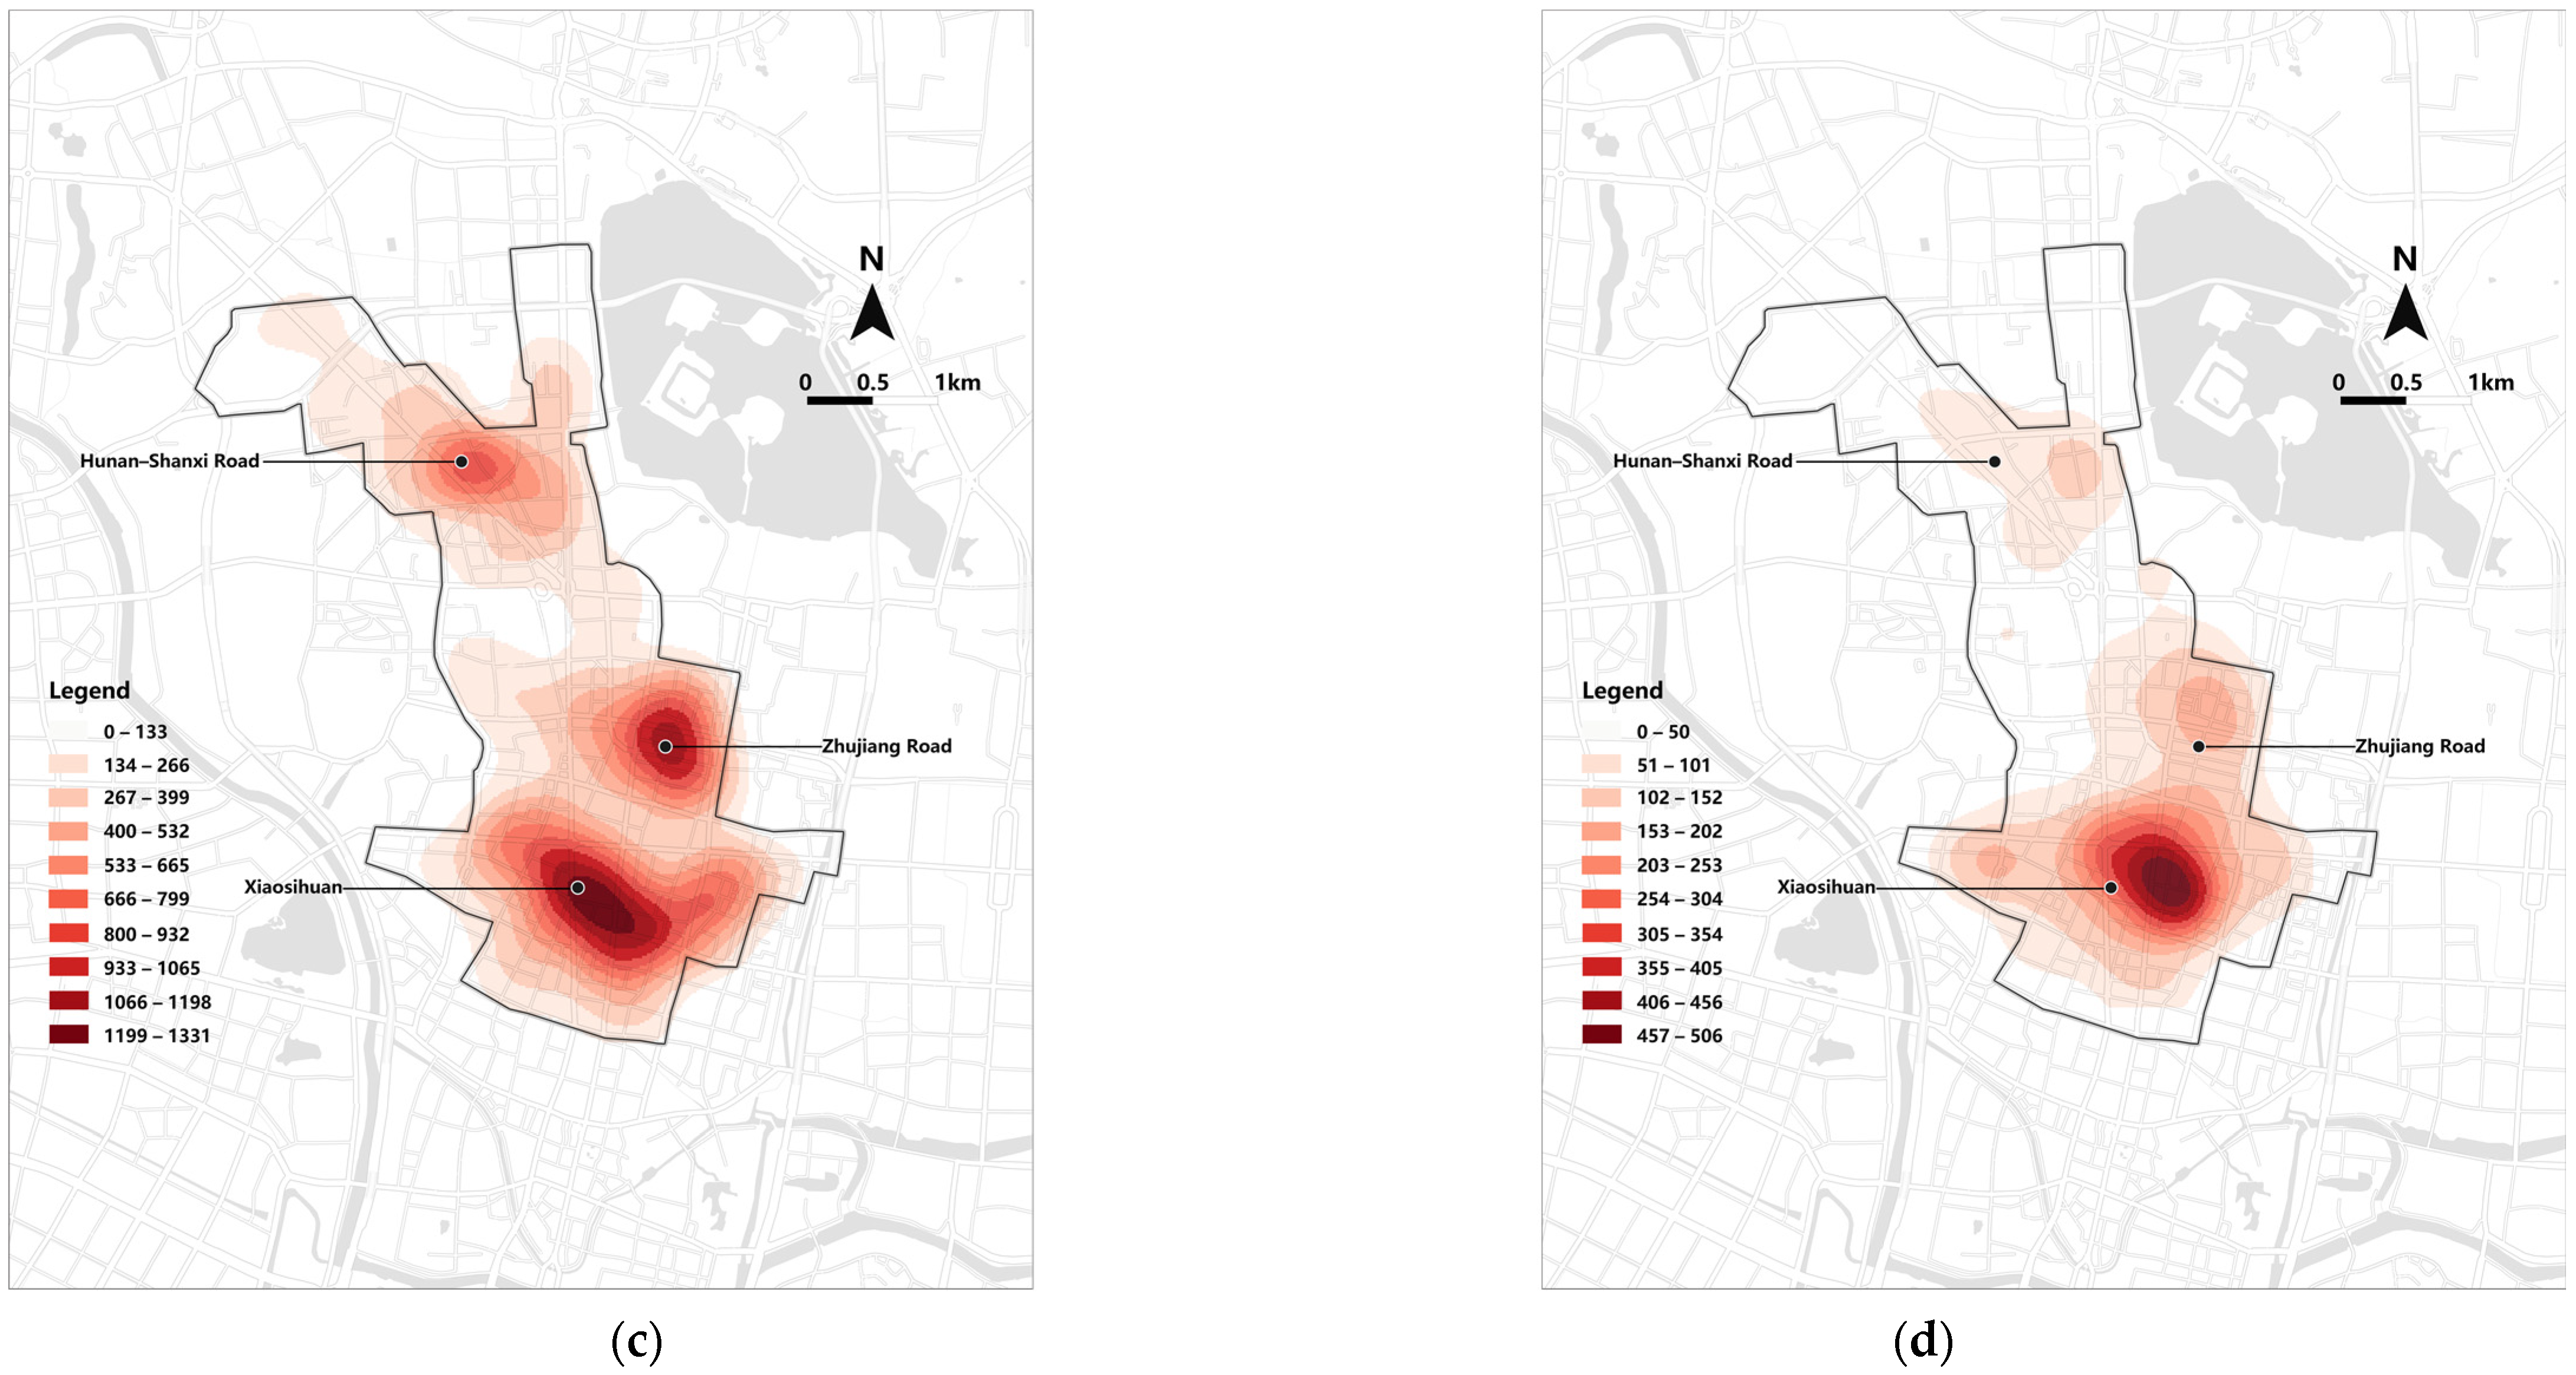
4.1.1. Density Distribution Characteristics

The UCSS, predominantly comprising restaurants and retailers, exhibited a clear spatial distribution pattern aligned with the CCN hierarchy (Figure 5). Specifically, the stores were clustered around three CCNs, namely Xiaosihuan, Zhujiang Road, and Hunan-Shanxi Road, in a circular pattern. Xiaosihuan was the area with the highest degree of commercial agglomeration, which was followed by Zhujiang Road and Hunan Road-Shanxi Road. In contrast, B&Cs basically followed this density distribution pattern.

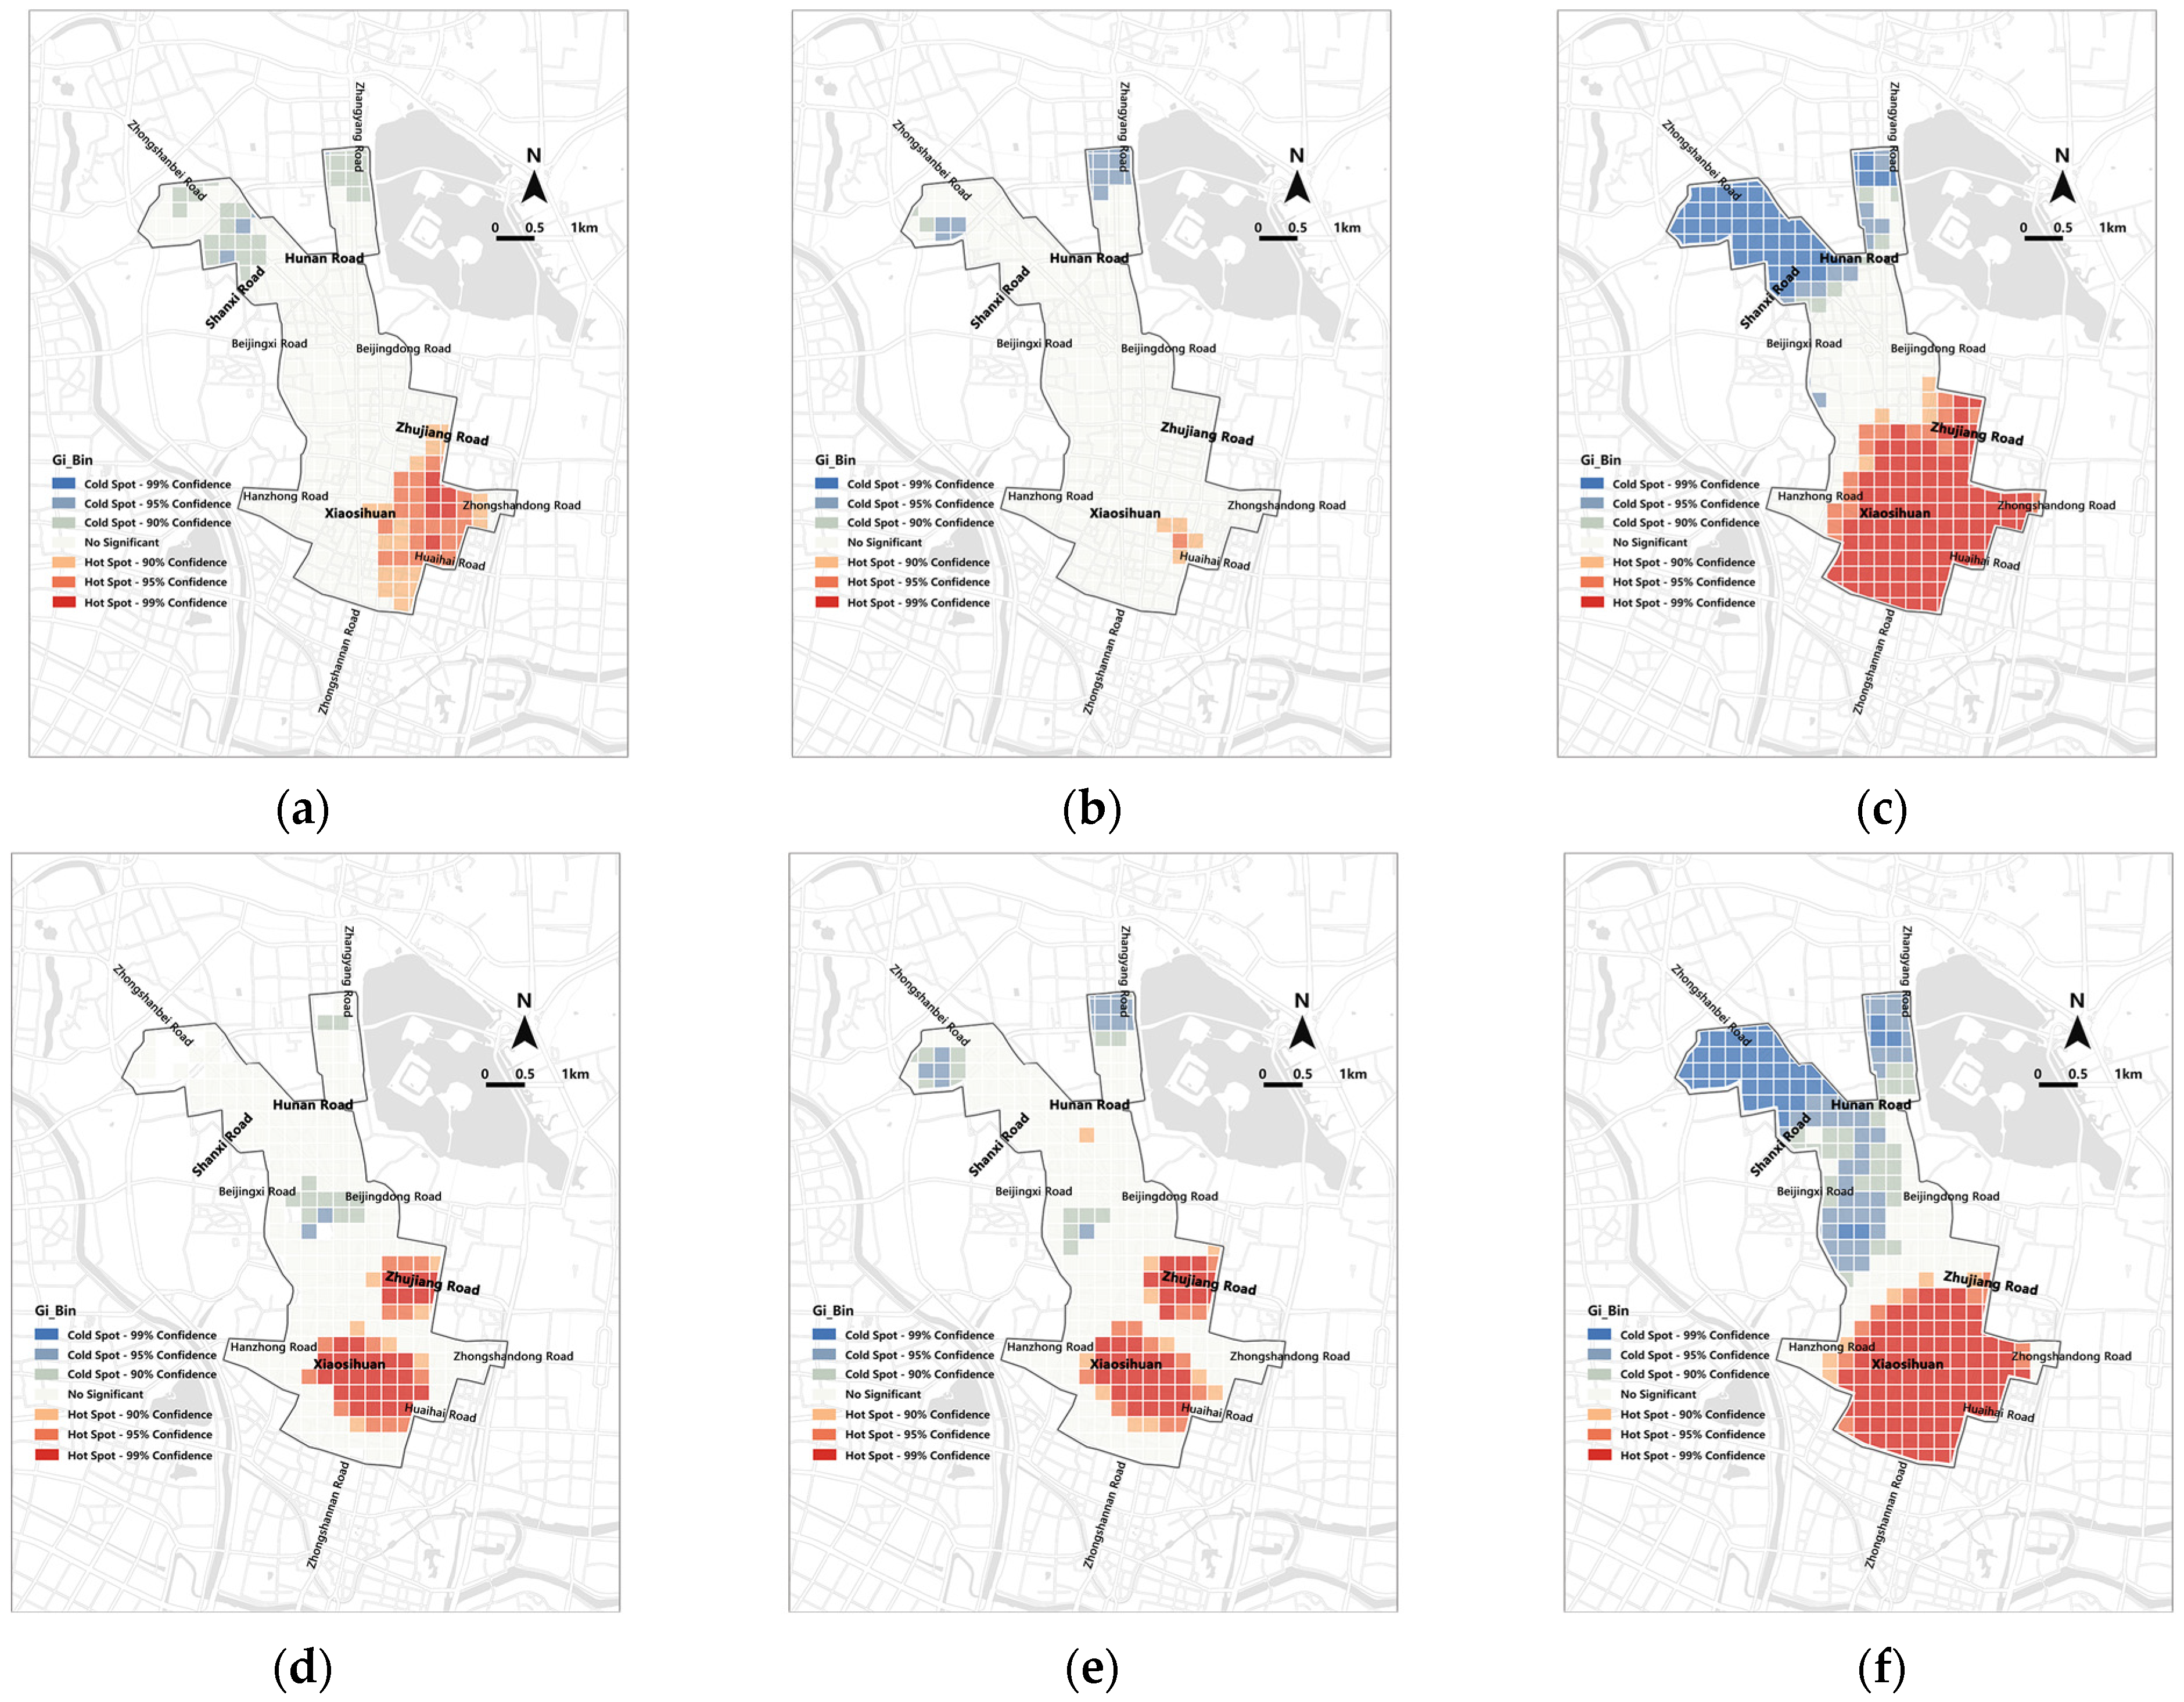
4.1.2. Agglomeration Distribution Characteristics

The nearest neighbor analysis (Table 2) reveals that both B&Ms and B&Cs showed a clustered distribution with a nearest neighbor index (NNI) of <1. However, specifically, the NNI of both B&M stores was <0.25; thus, their spatial clustering was the most significant. In contrast, B&C showed weaker clustering characteristics. In addition, the spatial agglomeration of B&C restaurants was slightly stronger than that of B&C retail.
In terms of numbers, B&Cs collectively established a prominent a hot spot area centered on Xiaosihuan and Zhujiang Road (Figure 6). The vicinity of Zhongshanbei Road and Zhongyang Road, extending to the areas around Yunnan Road and Beijingdong Road, was characterized as a cold spot, indicating lower B&C activity. Specifically, the spatial distribution of B&C restaurants was similar to the overall distribution characteristics. In contrast, B&C retail stores formed a significant hotspot area in and around Xiaosihuan and Zhujiang Road with Zhujiang Road and Zhongshan Road as the boundary.
B&Cs overall, B&C restaurants, and B&C retail stores showed PPI values of 49%, 63% and 23%, respectively. Overall, B&Cs formed a hotspot centered on Zhongshandong Road. In addition, sporadic cold spots were formed near Zhongshanbei Road and Zhongshan Road on the northern edge of the central area. Specifically, B&C restaurants had the only hot spot along Huaihai Road. Moreover, B&C retail stores had a large area of hot spots in the south of Zhujiang Road and a large area of cold spots in the north of Hunan Road.

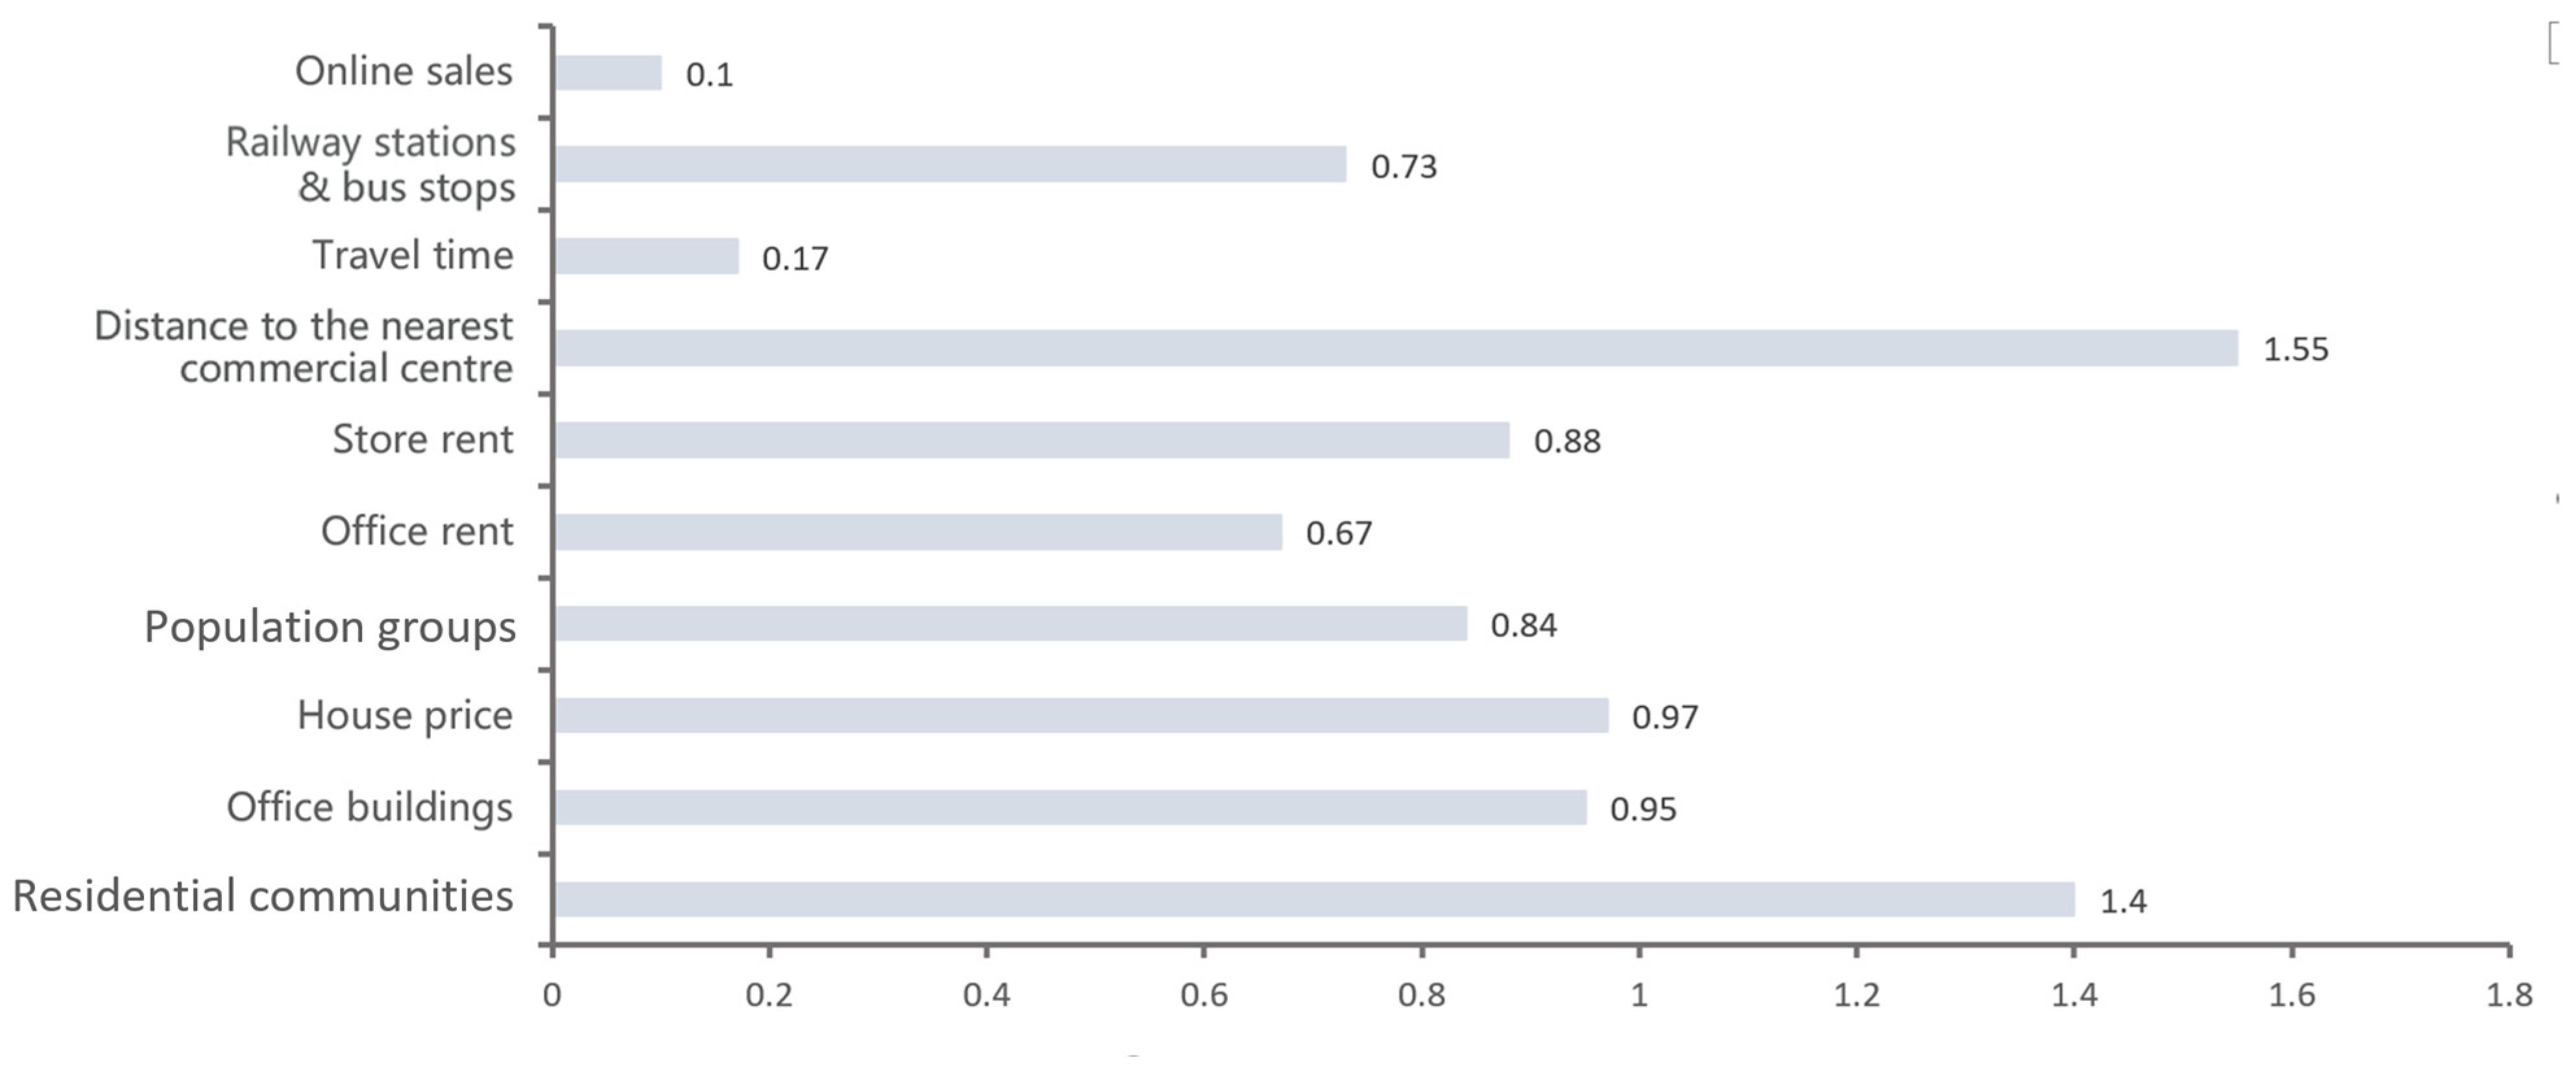
4.1.3. Relative Importance of Influencing Factors

The RFR analysis showed an R2 of 0.87 for the test set and 0.65 for the validation set with a low mean average error value. This suggested that the RFR had a relatively good level of credibility (Figure 7). According to the coefficient of the degree of influence of each factor on the scale of B&Cs, the demand factor was greater than the cost factor. Specifically, the number of residential communities in the demand scale, the number of office buildings, and the distance to the nearest CCN in the traffic cost had a relatively large impact on the location of B&Cs.
In this regard, we conducted a more detailed analysis. (1) In CBDs, the demand generated by large urban populations has always been an important factor in facilitating business expansion. The instant delivery model stimulated an increase in consumer demand, which led to the expansion of B&Cs. However, the impact of the number of residential communities was significantly greater than the number of office buildings, suggesting that B&Cs were placed closer to the neighborhoods. (2) The prosperity of just-in-time delivery services is also closely linked to the income levels of consumers and the diversity of population groups. Interestingly, house prices have a more pronounced impact compared to other demographic factors, suggesting B&Cs favor locations in higher-value residential areas. (3) While store rent is generally considered crucial for location decisions, it appears to have a minimal impact on B&C site selection within CBDs, which is likely due to uniformly high rental costs across these areas. (4) Contrary to expectations, traffic costs do not deter B&C development. Combining the high contribution of spatial distance to the nearest CCN with the low contribution of walking time to the nearest CCN, B&Cs tended to be located in non-core locations in commercial areas. Furthermore, in CBDs, where good transport infrastructure is generally distributed and travel is predominantly by foot, transport costs are not considered one of the most important principles for site selection. (5) Although online sales volume has a relatively minor effect on B&C location choices, it still positively contributes to their clustering. This suggests that higher online sales will indeed drive the agglomeration of some B&Cs. In addition, this may imply that as the overall online sales of B&Cs in certain locations increase, more food delivery rider resources will be brought in, thereby improving delivery efficiency and thereby enhancing B&Cs’ online competitive strength. In general, in contrast to B&Ms, the principle of location selection for B&Cs is more flexible. More importantly, there may be certain positions that make online competition more favorable for B&Cs, which requires further investigation.

4.2. Characteristics of Online Sales Efficiency under the Location Mechanism

To further analyze the actual impact of zone on B&C online sales efficiency, we used a combination of isochronous circle analysis and the DBSCAN algorithm to identify the location characteristics of similar sales clusters for restaurants and retail stores. In addition, since part of the isochrone circle was beyond the scope of the central area (as shown in Figure 3), we chose to supplement this part of the retail and restaurant data to complete the study.

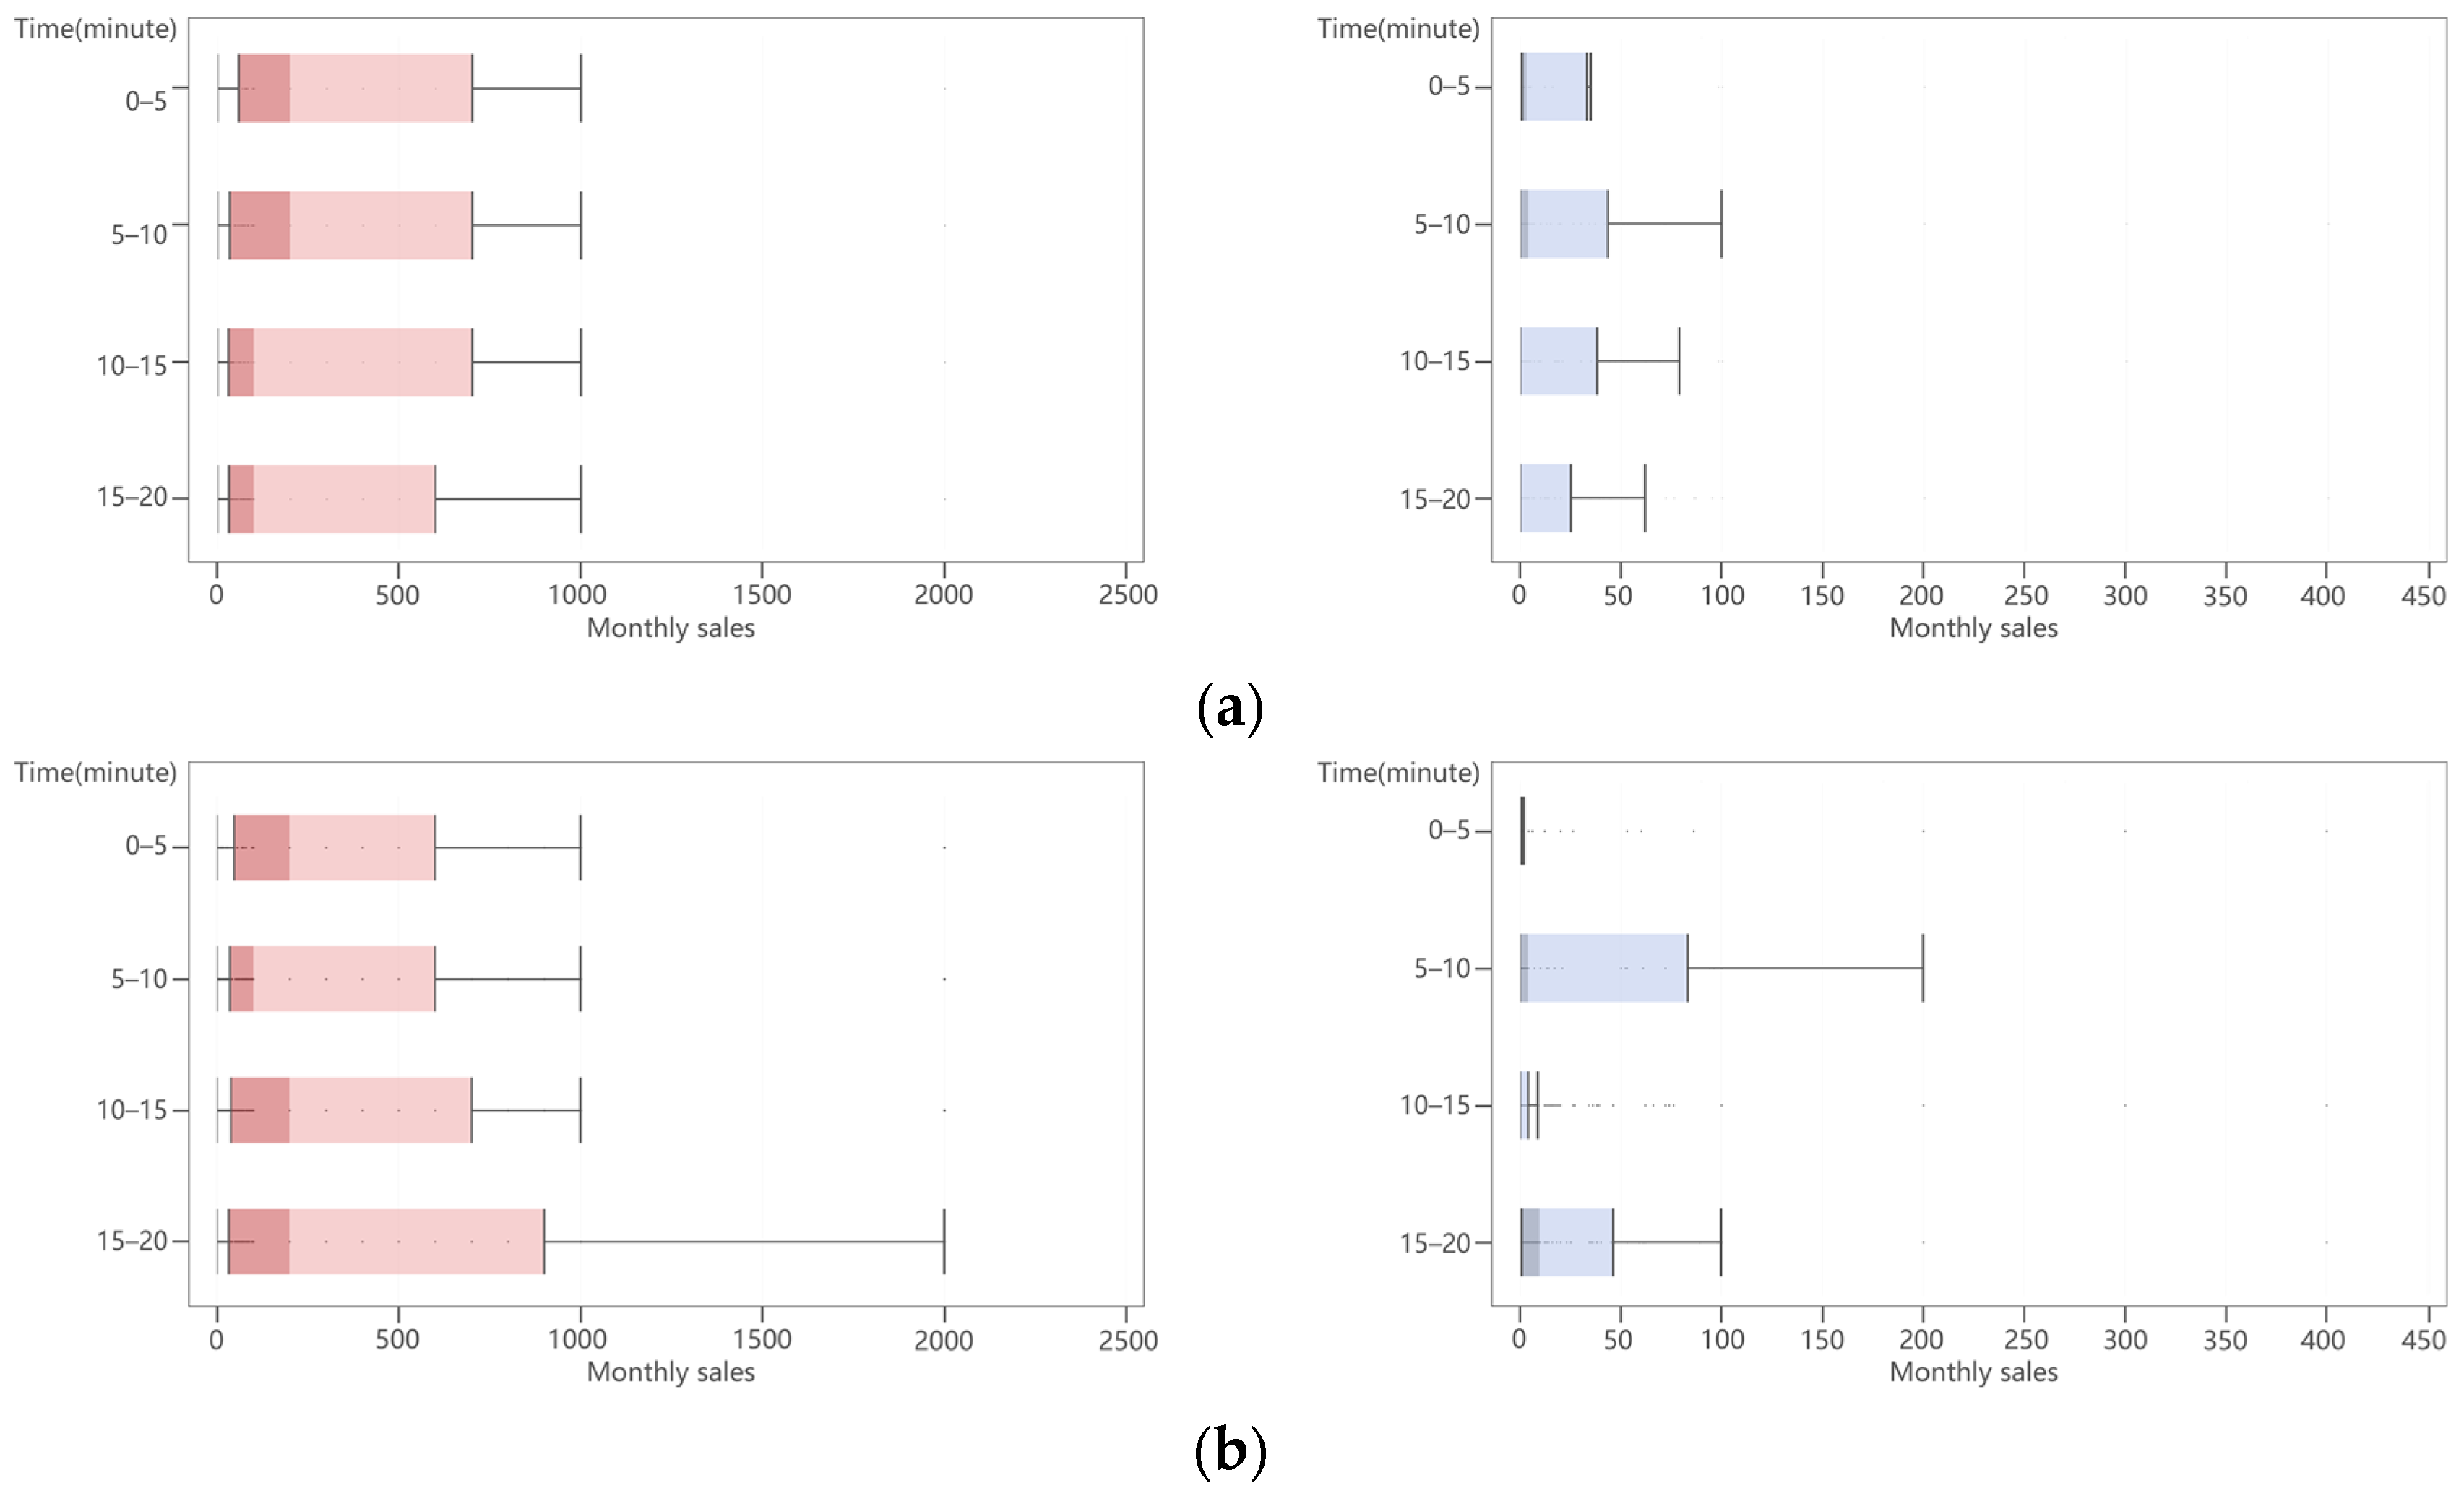
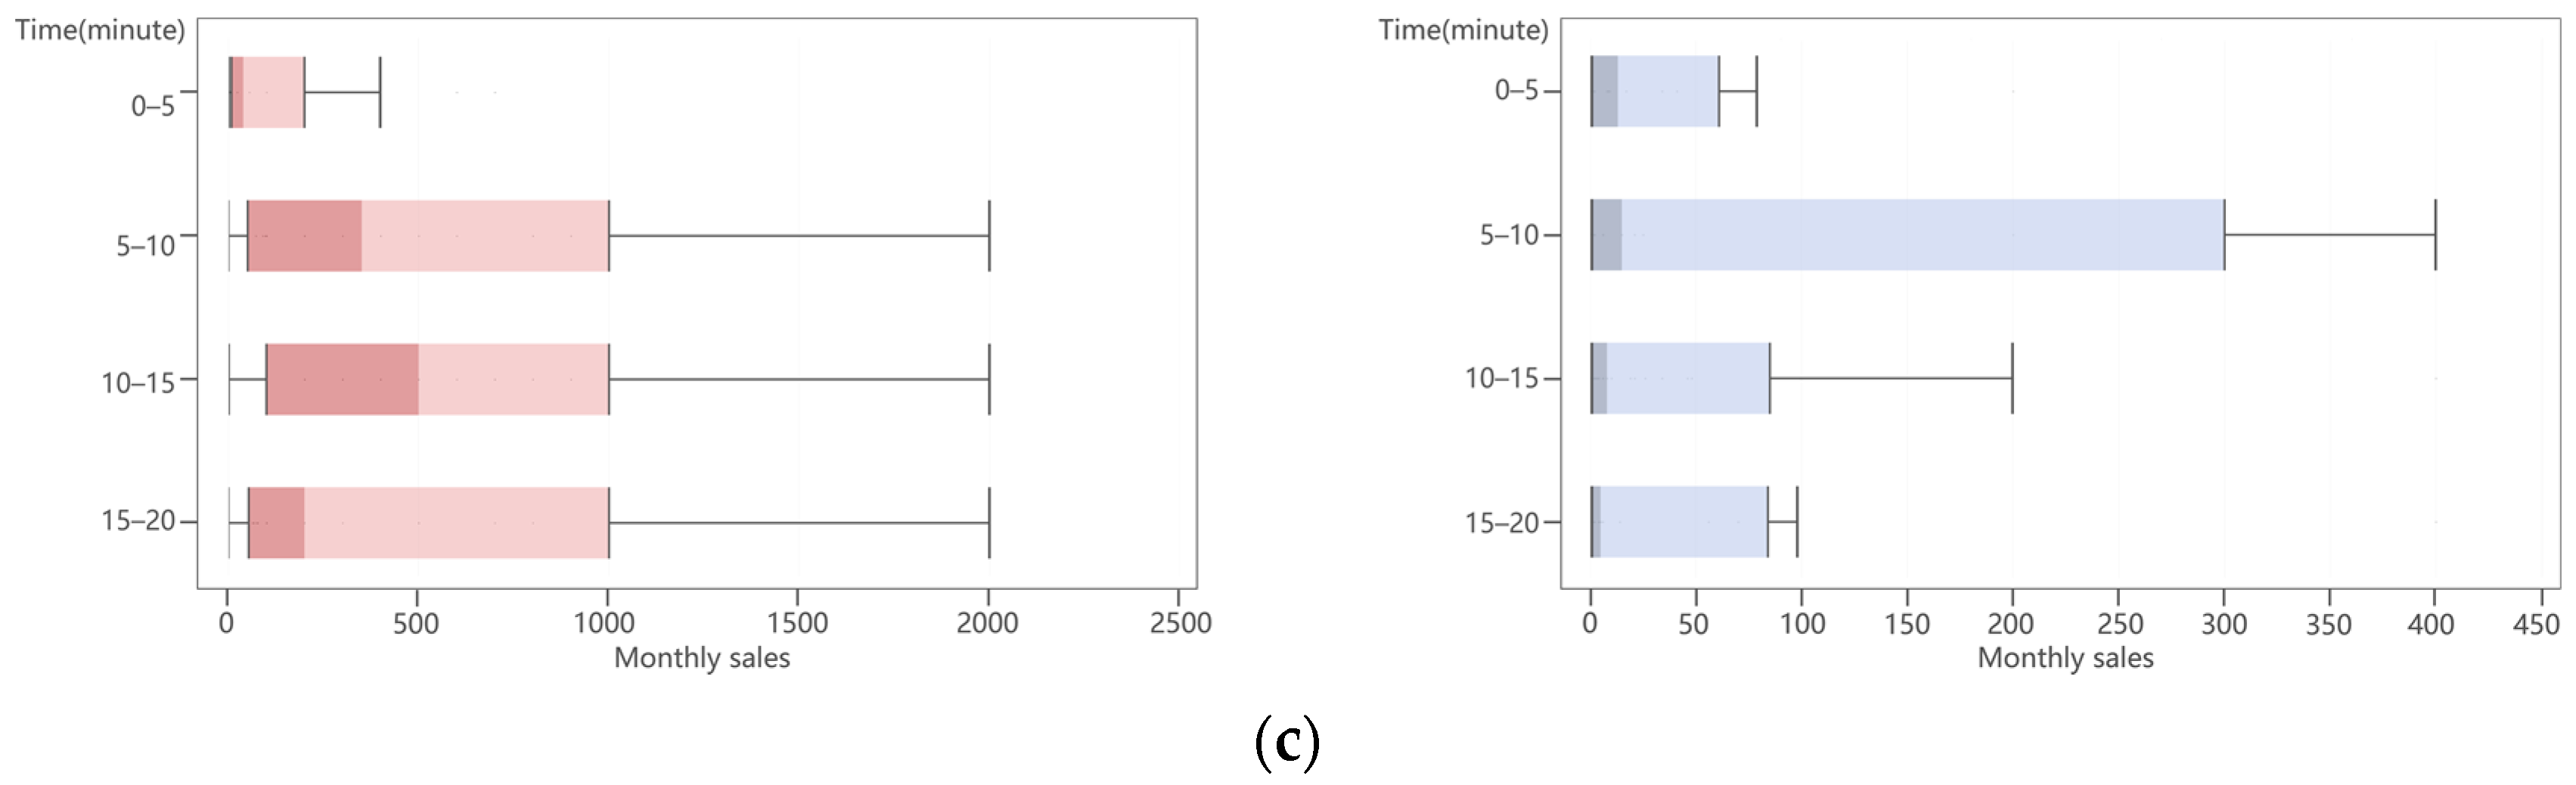
4.2.1. Changes in Online Sales Efficiency in Different Locations

By calculating the overall sales and average sales of B&C restaurants and retail stores within a 20-min walking distance around the three CCNs (Table 3), we observed clear changes in online sales efficiency. From the perspective of overall monthly sales, both online retail and restaurants showed a trend of Xiaosihuan > Zhujiang Road > Hunan-Shanxi Road. However, based on the average sales volume, we identified a trend of Zhujiang Road < Xiaosihuan < Hunan-Shanxi Road.
Box plots can directly convey information about the symmetry and distributional characteristics of the data, especially when comparing samples (Figure 8). Varying degrees of fluctuation were observed in monthly restaurant and retail sales around the different CCNs. In terms of differences in store types, restaurant sales fluctuated more than retail sales in terms of all levels of isochronous circles except for B&Cs around Xiaosihuan, where monthly sales fluctuated slightly. Meanwhile, Pearl River Road and Hunan Shanxi Road showed large fluctuations within the 5–20 min isochronous circle. The 5–15 min and 5–10 min isochronous circle areas represented the highest sales of restaurants and retail stores, respectively. In addition, since the 0–5 min walking range was the core area of CCN, the sales levels of the two types of stores were relatively low, and the fluctuations were also extremely small.

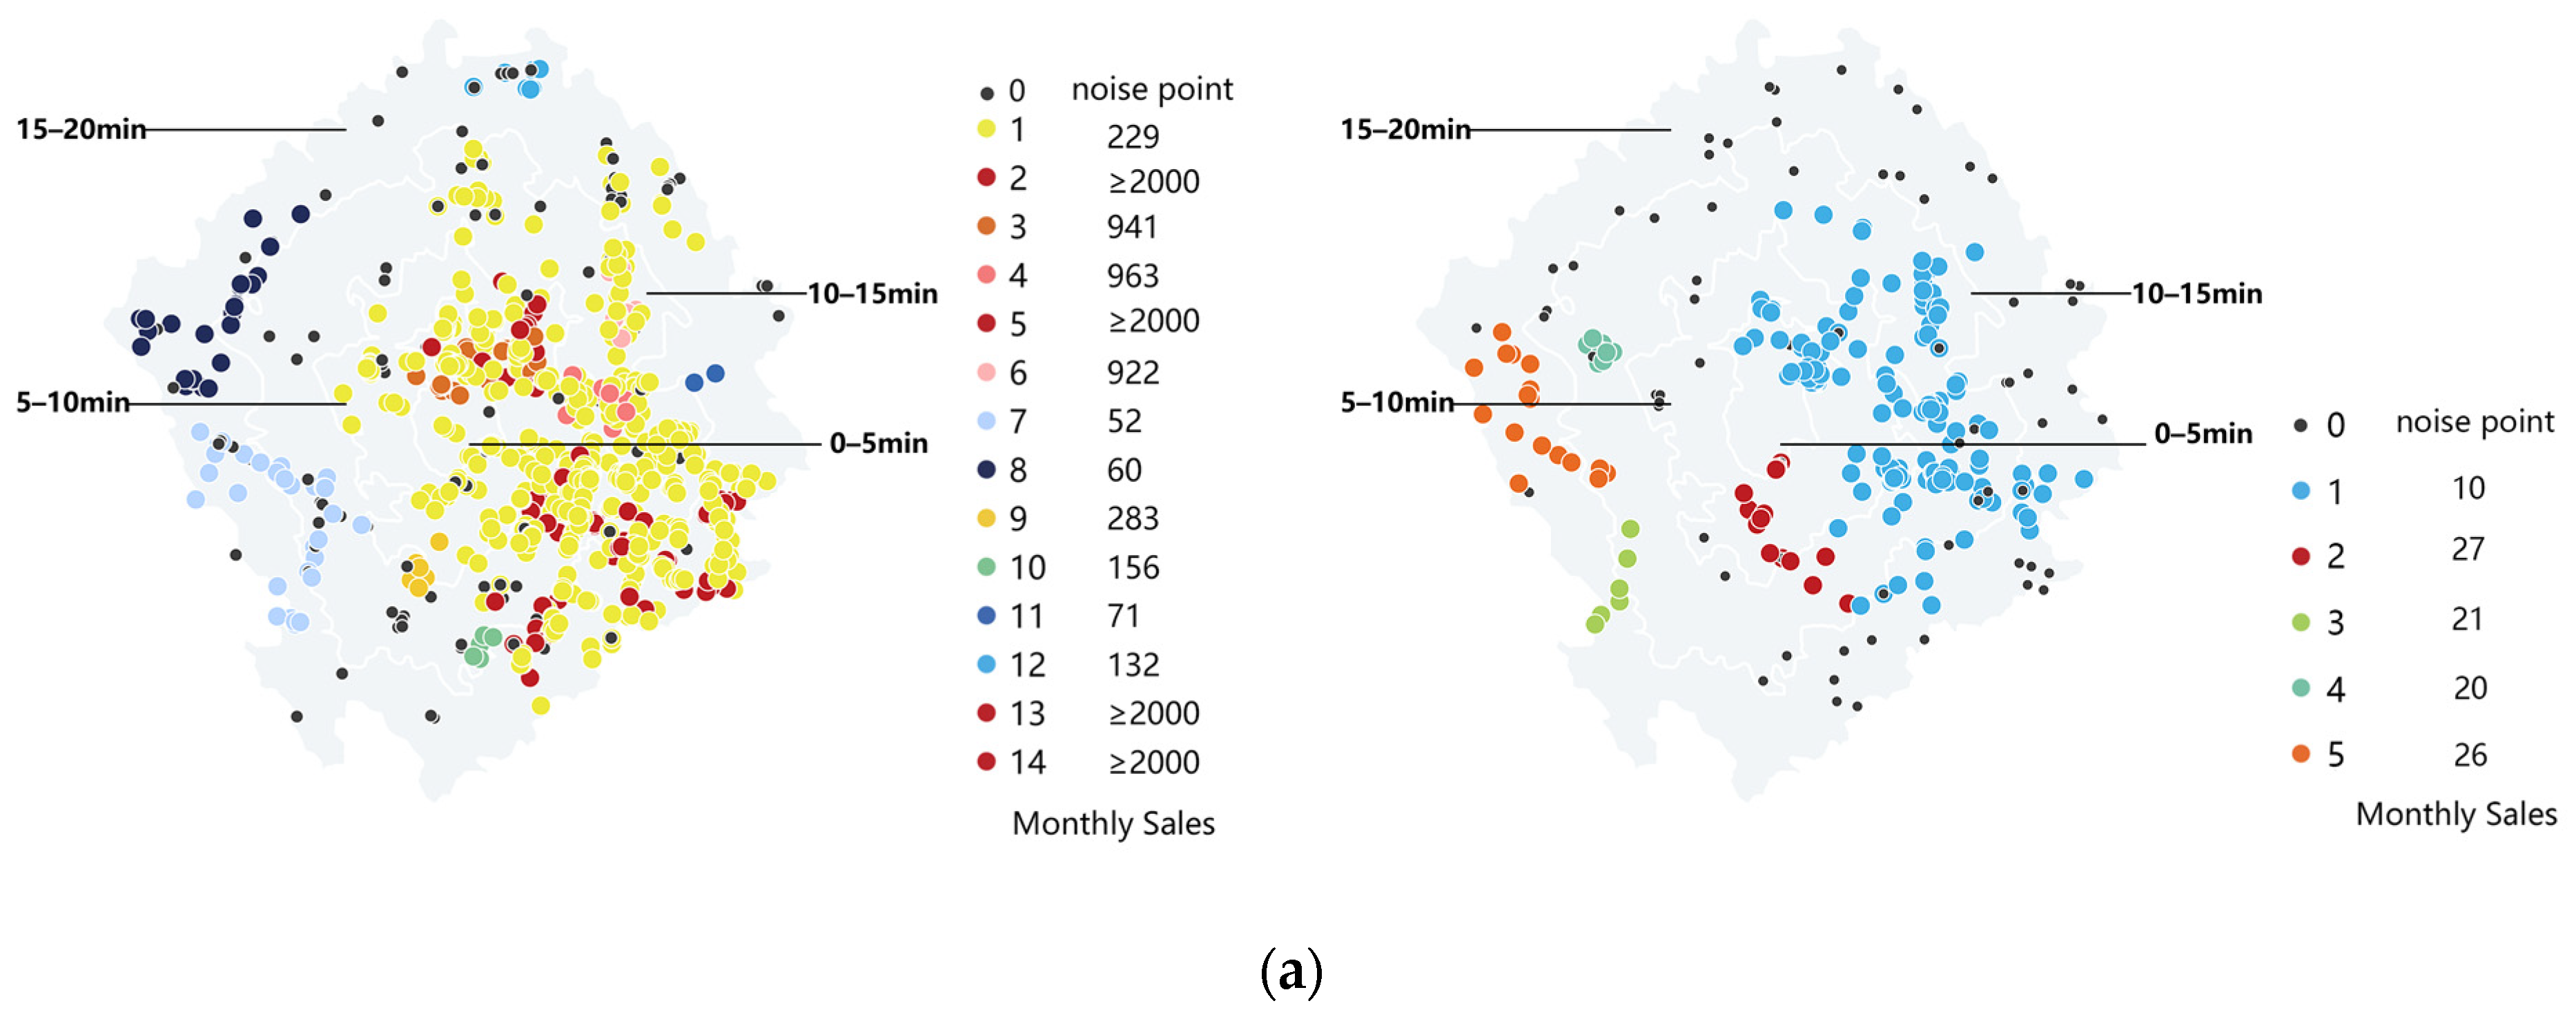
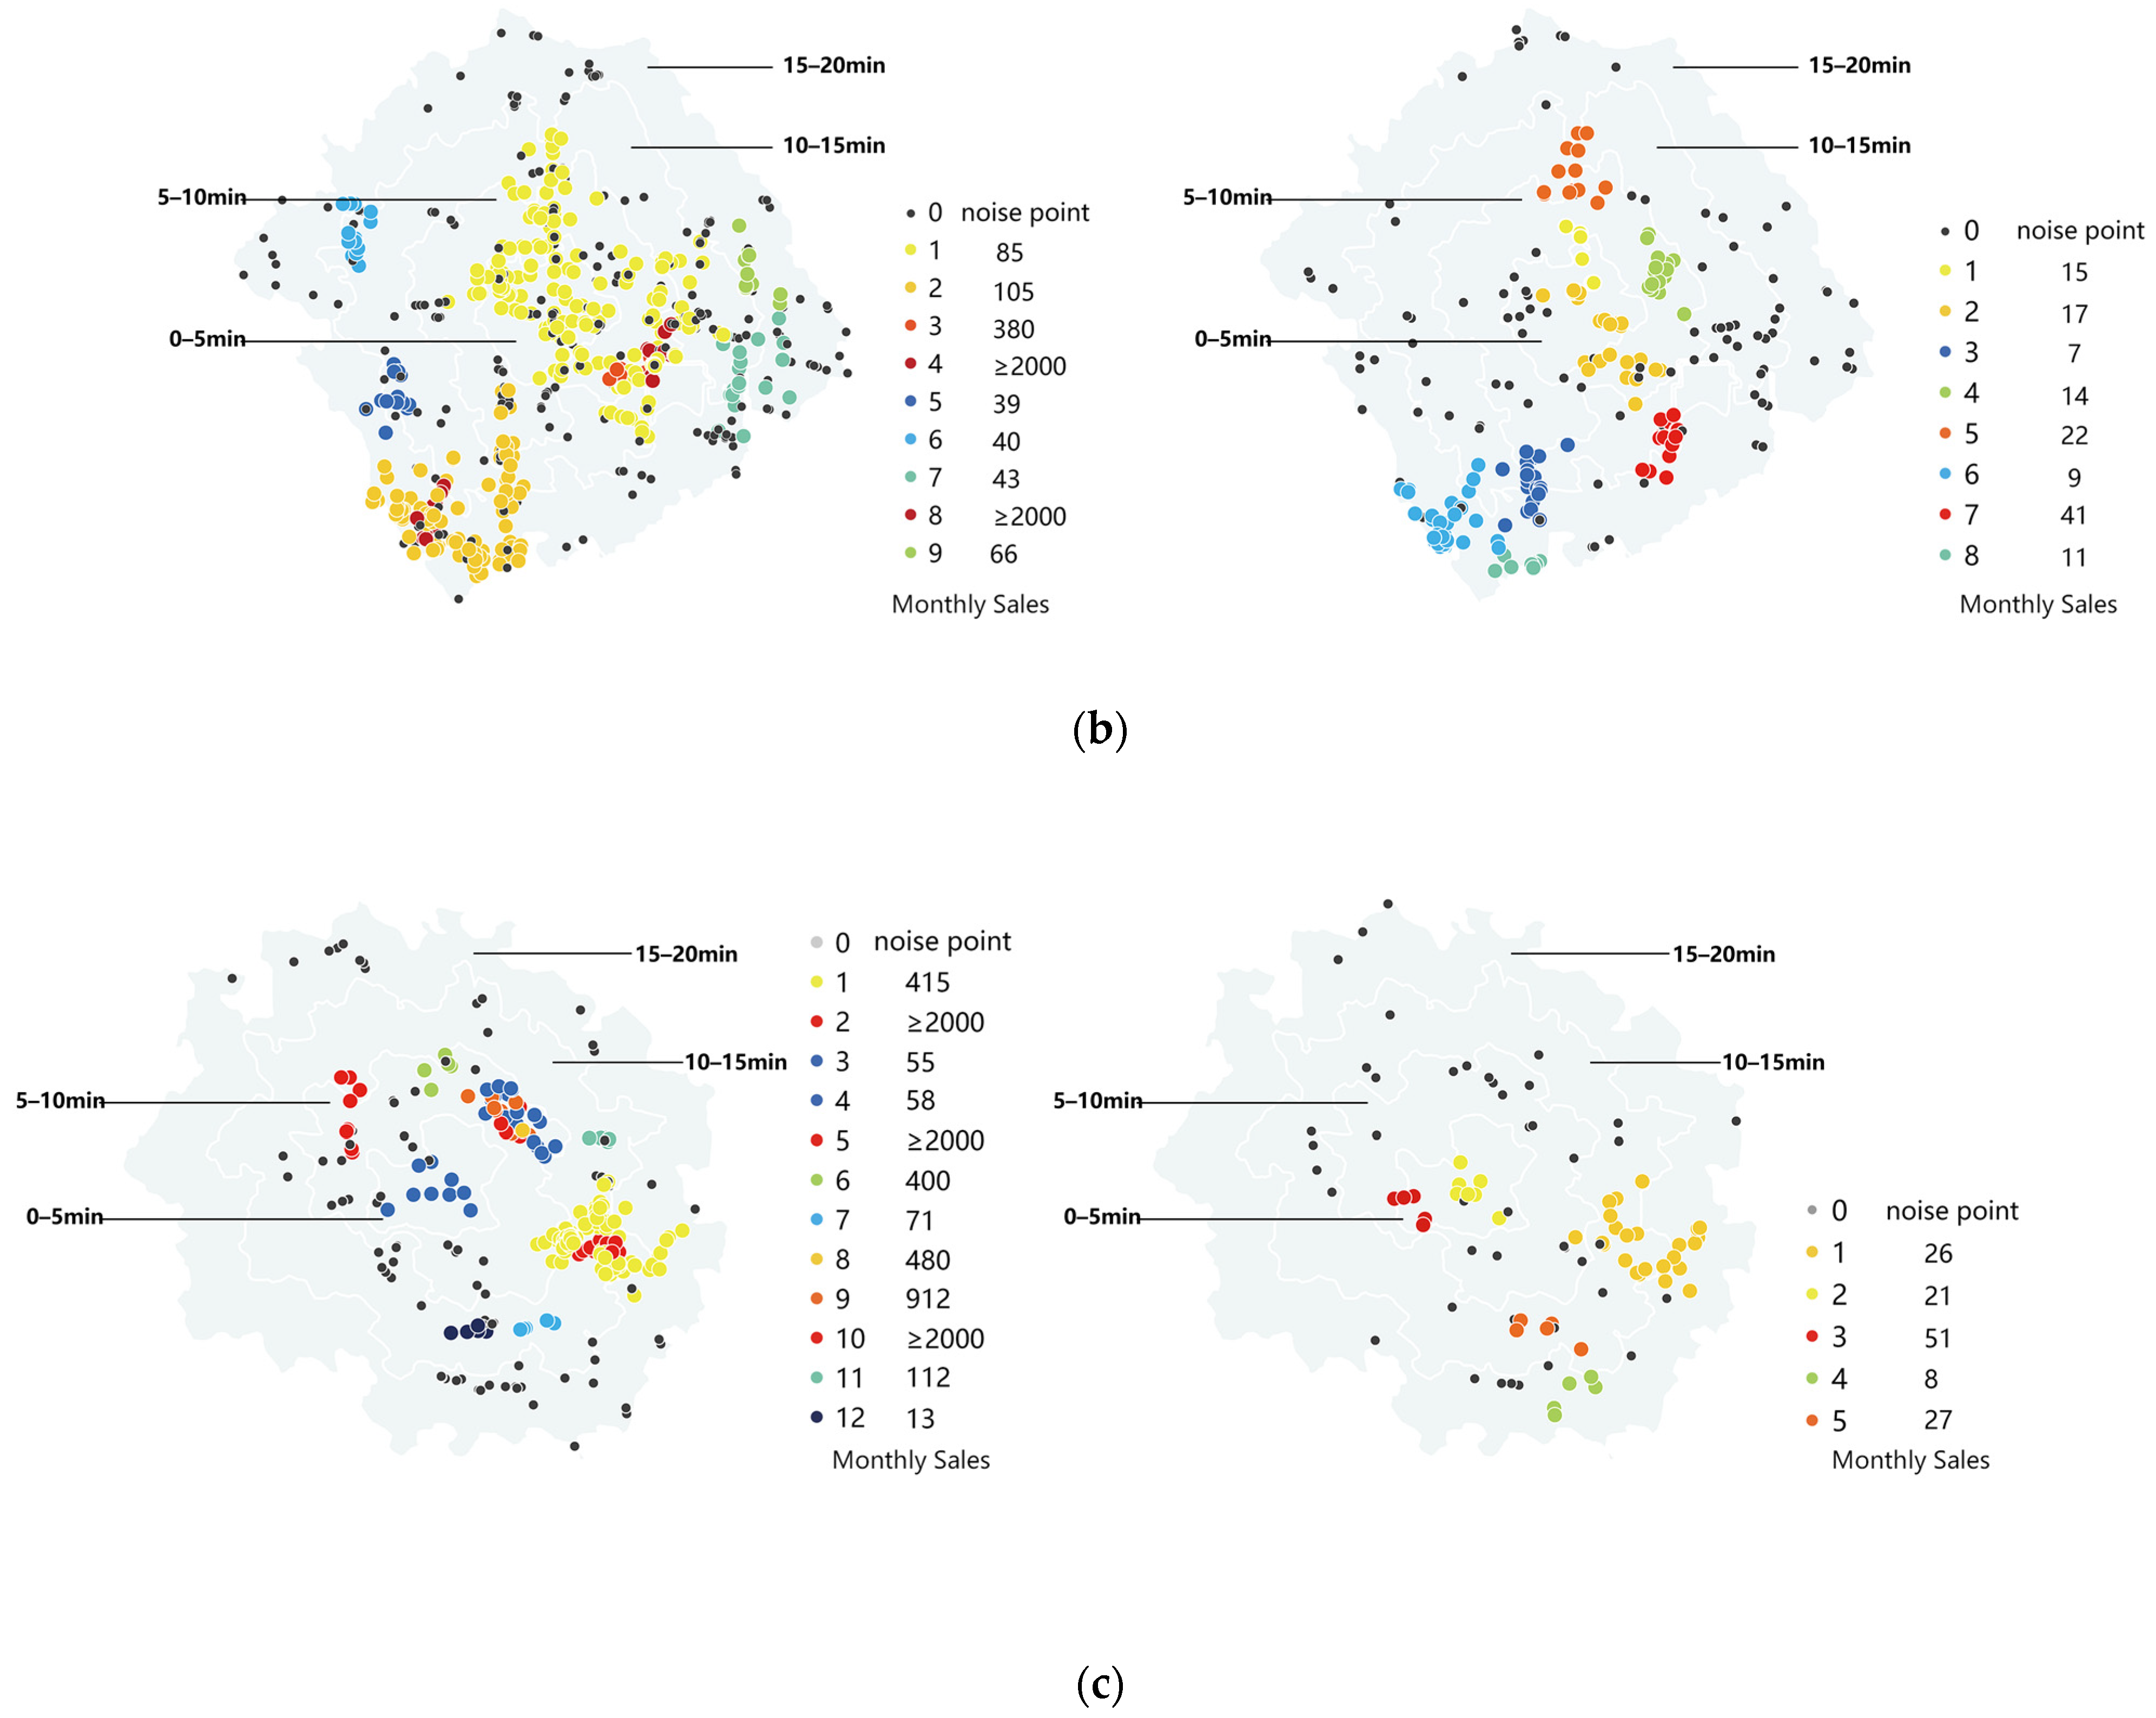
4.2.2. Cluster Distribution of Stores with Similar Sales Dynamics

The clustering results show that B&C restaurants and retail stores with similar monthly sales show similar spatial aggregation patterns (Figure 9). For B&C restaurants, the high-sales clusters (monthly sales > 2000) in Xiaosihuan were numerous, relatively concentrated in their locations, and spread across all time zones. In contrast, the number and scale of high-sales store clusters around Zhujiang Road have been significantly reduced. The high-sales store clusters maintained a certain proximity in space, and the locations were distributed within 5–10 min. Additionally, the smallest number of high-sales clusters around Hunan-Shanxi Road were relatively dispersed and distributed within a 5–15 min walk. Furthermore, overall, the online sales efficiency in core locations (0–5 min walk range) was relatively low.
Regarding B&C retail stores, the monthly sales within a 20-min walk from Xiaosihuan, Zhujiang Road, and Hunan-Shanxi Road were consistent with peaks not surpassing 51 and lows at 7. High-sales stores frequently appeared as isolated points, which were scattered throughout. By observing the location of the clusters, we found that the relatively high-sales clusters of B&C retail stores were mostly distributed within a 10–15-min walk, and they were always spatially adjacent to the relatively high-sales clusters of B&C restaurants. In addition, the number and size of stable sales clusters decreased with the decrease in the CCN level, whereas the average sales efficiency of clusters increased.

5. Discussion

5.1. Impact of ICT on Urban Commercial Space Structure

Digital platforms are widely recognized as significant drivers of changes in the spatial structure of cities. Our research demonstrates how ICTs contribute to the decentralization of both restaurants and retailers, marking a new phenomenon driven by the optimization of computer algorithms and the concentration of delivery personnel led by the new business model of the internet. Our findings align with prior research by relevant scholars [82]. However, it is important to note that the decentralized model manifests differently for restaurants and retailers. Catering businesses typically embrace digital platforms, resulting in a more homogeneous and networked spatial distribution. This is primarily due to the perishability and high-frequency consumption characteristics of food that require the delivery time to be shortened as much as possible, which is reflected in the store being close to residential areas and office buildings. It is noteworthy that the business form represented by the ghost kitchen does not have high space requirements and relies more on digital platforms, which is also an example of this phenomenon. In contrast, retail platformization faces clear limitations, with spatial distribution predominantly confined to CCNs and their surrounding areas. The reasons are twofold: first, retail goods are generally easy to store and do not have the perishability restrictions of catering food; second, most retail stores, except for convenience stores and supermarkets, rely on physical consumer visits and are typically situated in business districts. These physical spaces often feature social elements like experiential aspects and social attributes, which impede the full virtualization of this type of consumer behavior. Therefore, to some extent, this constrains the platform model for both. Existing research mainly examines the geographical shifts, consumer group preferences and geographical consumption patterns within the catering industry [15,66]. Our research delves into different business types encompassed by instant consumption. By comparing the changes in the spatial distribution patterns between these two businesses types, we contribute to the existing body of knowledge on alterations in the hierarchical structure of the urban business system under the influence of platformization.
Although we have highlighted that different business types lead to heterogeneous spatial structural changes, our research questions remain to explore the general mechanisms influencing the geographical distribution of B&Cs. Unlike traditional businesses, B&Cs exhibit distinct a certain geographical pattern. The results from RFR indicated that the distance to the nearest CCN and the number of surrounding residential communities are prominent factors influencing the distribution of B&Cs. to engage in competitive strategy. Specifically, the proximity to the nearest CCN has the greatest impact on the location selection of B&Cs, indicating that B&Cs are moving to non-core locations to engage in competitive strategy by avoiding congested commercial centers. Simultaneously, the vicinity of residential communities becomes a preferred relocation choice. In addition, although the positive correlation between online sales and B&Cs is weak, it is still an important clue to analyze micro-positions with comparative advantages. In CBDs, the relocation of shops caused by digital platforms has created an opportunity to change inactive space in buildings [25], creating a vibrant urban space and commercial system.

5.2. Dynamic Characteristics of B&C Sales in Different Locations

In this study, we employed the DBSCAN clustering algorithm to analyze the spatial location and sales data of online stores. We assessed relative location attributes using pedestrian traffic isochrone analysis, which helped us identify clusters of stores that exhibit similar sales trends. This methodology allows us to evaluate the sales efficiency of B&Cs in various locational contexts, thereby enriching our understanding of their location strategies in the competitive business landscape. Unlike previous studies that focused on location selection based on accessibility and characteristics of the built environment, our approach enables a more precise assessment of the relationship between a store’s micro-location decisions and its actual performance [83].
Isochronous analysis results indicate that at the central area level, overall sales for retail and restaurants are higher near dominant Central Commercial Nodes (CCNs), yet the average sales per store tend to be lower. This can be attributed to the aggregation of diverse and high-quality business resources around CCNs, which is in line with business location theory. Typically, platform users in and around CBDs have a spending preference for higher-quality commercial resources. However, intense homogeneous competition near CCNs leads to diminishing economic returns from clustering as the number of competitors increases. At the micro-location level, the 5–15 min and 5–10 min walking time ranges (relatively dominant micro-locations) starting from the CCN are the most active areas for restaurant and retail online sales, respectively. Additionally, different spatial location preferences are determined by the business model of each store. Stores situated in favorable locations usually have good capital chains, strong competitive merchandise, and high brand recognition, which are important factors contributing to commercial success. Nevertheless, it should be noted that the key to the success of online sales lies in digital marketing [63,66], that is, the substitution of digital traffic for pedestrian traffic. However, the current high cost of digital marketing puts stores which are located in in-between space at disadvantaged locations. On the contrary, stores in high-traffic areas have the opportunity to enhance their online presence and attract more digital traffic by influencing consumer behavior and perceptions [79,82].
In addition, the clustering results highlighted that B&C, encompassing both retail outlets and restaurants, tend to form clusters characterized by both spatial proximity and sales performance similarities. Notably, the clusters with the highest sales for both retail and restaurant sectors are geographically close or even overlap, which are predominantly situated within 5–15 min isochrone zones. Instant delivery usually adopts the working mode of centralized order taking and decentralized delivery [84]. Areas with high and stable order volumes will attract more delivery riders, which is determined by the timeliness required for just-in-time delivery. Shortening the waiting time for delivery is crucial for takeout services due to the perishable nature of food and because of fierce competition among similar stores. Consequently, stores located in areas with relatively high online sales can enhance their order delivery efficiency, thereby improving the advantages of online competition and forming favorable conditions for micro-location. From the perspective of spatial location, these micro-locations are often adjacent to or partially coincident with traditional advantageous locations, representing a novel insight. Therefore, our research has verified the conjecture of previous research on delivery rider resources and online competitive advantages [69], and it discovered the existence of micro-locations that are conducive to online competition.

5.3. Limitations and Future Research Directions

This study is subject to several limitations as follows. Firstly, due to technical difficulties, we were unable to obtain accurate monthly sales data above 1000, which might have led to a possible bias in the results of the analysis. Additionally, regarding the determination of the micro-dominant location, we used the walking time as the measurement method, which may not be the most accurate method for identifying the best location. Furthermore, the narrow spatial scale of our case study, coupled with individual variances within the dataset, may restrict the broader applicability of our findings. Most of the current relevant research is based on cross-sectional data at a single time. Research based on long-term series data can well demonstrate the dynamic process of ICT affecting urban commercial space. Moreover, long-term tracking research can profoundly reveal new commercial location principles in the Internet era and shape new understandings of urban space and technology.

6. Conclusions

Exploring the UCSS in the Internet age has always been an important topic in economic geography and business research, which is of key significance to the fields of urban planning, business location selection, and transportation. The integration of real-time traffic data and Origin–Destination Flow Data (ODFD), which encapsulates both spatial–temporal granularity and economic attributes, presents a unique opportunity to unveil novel geographic dimensions of digital urban consumption.
Taking Xinjiekou’s CBD in Nanjing, China as a case study, this study explored the trends and driving factors of UCSS of restaurants and retailers evolution at the micro-scale. In addition, we analyzed the micro-location preferences of B&C restaurants and retail stores from the perspective of business competition. Finally, we employed sales data to verify the correlation between location and online sales efficiency and possible micro-advantage locations. The main conclusions are as follows:
(1)
The UCSS of restaurants and retailers in CBDs is decentralized. Specifically, the restaurant space is more homogeneous, while the trend toward the decentralization of retail space is limited to the core commercial hinterland. This is related to the respective commercial attributes of both. In addition, B&Cs establishments tend to be more dispersed around the CCN, highlighting a clear path dependency phenomenon in the evolution of online businesses.
(2)
Demand scale and traffic costs greatly influence on the location of B&Cs. In short, in the commercial hinterland where surrounding residential communities and office buildings gather, the number of B&Cs will increase significantly. And economic costs have less impact than demand scale and transportation costs, suggesting that B&Cs are relatively less dependent on advantageous locations. In addition, there is a weak positive correlation between online sales and B&Cs aggregation.
(3)
The phenomenon in which high-sales B&Cs tend to cluster seems to suggests more delivery riders are allocated to these areas, forming a new micro-location advantage. Another phenomenon is that the CCN hinterland, with its own strong competitiveness in retail stores and restaurants, and its location around the concentration of delivery riders is ultimately the party that benefits the most from the platform.
This study contributes to our comprehension of the new phenomenon of micro-locational advantage and the new characteristic of UCSS for restaurants and retailers in CBDs by analyzing the geography of urban businesses under the influence of ICT. Ideally, ICT breaks down information barriers and smooths out location differences, which is conducive to the sharing of high-quality commercial resources and the establishment a new geographical phenomenon of consumption. Paradoxically, however, the ICT-induced commercial platforming seems to lead to a zero-sum game, amplifying the Matthew effect in business competition. Judging from the results, the biggest beneficiaries are the stores in commercial centers and their hinterlands. In light of these findings, we believe that the government should incorporate digital traffic into urban planning and management, establish corresponding rules or regulations, and prevent digital platforms from overly intervening in business by controlling digital traffic, so as to ensure the health and prosperity of the urban business environment. In fact, this study shows that ICT leads to more complex UCSS and economic geography phenomena, offering a fresh perspective on urban spatial planning and business management. In addition, the new business geography revealed by ODFD data can overcome the common problem of the oversimplified description of store locations in economic geography research [85]. In summary, this research applies new data generated by digital platforms to urban analysis to reveal business spatial distribution and identify economic dynamics, thus providing new insights into the urban business landscape and urban digital management planning.

Author Contributions

Methodology, Xinyu Hu, Gutao Zhang and Yi Shi; Software, Peng Yu and Gutao Zhang; Formal analysis, Peng Yu, Xinyu Hu and Gutao Zhang; Investigation, Yi Shi; Data curation, Gutao Zhang; Writing—original draft, Gutao Zhang; Writing—review and editing, Xinyu Hu; Supervision, Xinyu Hu and Yi Shi. All authors have read and agreed to the published version of the manuscript.

Funding

This work was supported by a project funded by the Priority Academic Program Development of Jiangsu Higher Education; National Natural Science Foundation of China: 52378048.

Data Availability Statement

The data, models, and code that support the findings of this study are available from the corresponding author upon reasonable request.

Conflicts of Interest

The authors declare no conflict of interest.

References

  1. Börjesson Rivera, M.; Håkansson, C.; Svenfelt, Å.; Finnveden, G. Including Second Order Effects in Environmental Assessments of ICT. Environ. Model. Softw. 2014, 56, 105–115. [Google Scholar] [CrossRef]
  2. Beckers, J.; Weekx, S.; Beutels, P.; Verhetsel, A. COVID-19 and Retail: The Catalyst for e-Commerce in Belgium? J. Retail. Consum. Serv. 2021, 62, 102645. [Google Scholar] [CrossRef]
  3. Alrawad, M.; Lutfi, A.; Alyatama, S.; Al Khattab, A.; Alsoboa, S.S.; Almaiah, M.A.; Ramadan, M.H.; Arafa, H.M.; Ahmed, N.A.; Alsyouf, A.; et al. Assessing Customers Perception of Online Shopping Risks: A Structural Equation Modeling—Based Multigroup Analysis. J. Retail. Consum. Serv. 2023, 71, 103188. [Google Scholar] [CrossRef]
  4. PR Newswire: Press Release Distribution, Targeting, Monitoring and Marketing. Available online: https://www.prnewswire.com (accessed on 3 November 2023).
  5. Weltevreden, J.W.J.; Atzema, O.A.L.C.; Frenken, K.; de Kruif, K.; van Oort, F.G. The Geography of Internet Adoption by Independent Retailers in the Netherlands. Environ. Plan. B Plan. Des. 2008, 35, 443–460. [Google Scholar] [CrossRef]
  6. Wong, T.-C. The Changing Role of the Central Business District in the Digital Era: The Future of Singapore’s New Financial District. Land Use Policy 2004, 21, 33–44. [Google Scholar] [CrossRef]
  7. Dadashpoor, H.; Yousefi, Z. Centralization or Decentralization? A Review on the Effects of Information and Communication Technology on Urban Spatial Structure. Cities 2018, 78, 194–205. [Google Scholar] [CrossRef]
  8. Elshaer, I.A.; Alrawad, M.; Lutfi, A.; Azazz, A.M.S. Social Commerce and Buying Intention Post COVID-19: Evidence from a Hybrid Approach Based on SEM–fsQCA. J. Retail. Consum. Serv. 2024, 76, 103548. [Google Scholar] [CrossRef]
  9. Sadowski, J. Cyberspace and Cityscapes: On the Emergence of Platform Urbanism. Urban Geogr. 2020, 41, 448–452. [Google Scholar] [CrossRef]
  10. Heitz, A. The Logistics Dualization in Question: Evidence from the Paris Metropolitan Area. Cities 2021, 119, 103407. [Google Scholar] [CrossRef]
  11. Shapiro, A. Platform Urbanism in a Pandemic: Dark Stores, Ghost Kitchens, and the Logistical-Urban Frontier. J. Consum. Cult. 2023, 23, 168–187. [Google Scholar] [CrossRef]
  12. Malecki, E.J. The Geography of the Internet: Cities, Regions and Internet Infrastructure in Europe. Reg. Stud. 2013, 47, 1375–1376. [Google Scholar] [CrossRef]
  13. Li, L.; Wang, D. Do Neighborhood Food Environments Matter for Eating through Online-to-Offline Food Delivery Services? Appl. Geogr. 2022, 138, 102620. [Google Scholar] [CrossRef]
  14. Zhang, S.; Luan, H.; Zhen, F.; Kong, Y.; Xi, G. Does Online Food Delivery Improve the Equity of Food Accessibility? A Case Study of Nanjing, China. J. Transp. Geogr. 2023, 107, 103516. [Google Scholar] [CrossRef]
  15. Ben-Elia, E.; Zhen, F. ICT, Activity Space–Time and Mobility: New Insights, New Models, New Methodologies. Transportation 2018, 45, 267–272. [Google Scholar] [CrossRef]
  16. Maruyama, M.; Wu, L.; Huang, L. The Modernization of Fresh Food Retailing in China: The Role of Consumers. J. Retail. Consum. Serv. 2016, 30, 33–39. [Google Scholar] [CrossRef]
  17. Shi, Y.; Tao, T.; Cao, X.; Pei, X. The Association between Spatial Attributes and Neighborhood Characteristics Based on Meituan Take-out Data: Evidence from Shanghai Business Circles. J. Retail. Consum. Serv. 2021, 58, 102302. [Google Scholar] [CrossRef]
  18. Ferreri, M.; Sanyal, R. Platform Economies and Urban Planning: Airbnb and Regulated Deregulation in London. Urban Stud. 2018, 55, 3353–3368. [Google Scholar] [CrossRef]
  19. Rossetti, T.; Yoon, S.-Y.; Daziano, R.A. Social Distancing and Store Choice in Times of a Pandemic. J. Retail. Consum. Serv. 2022, 65, 102860. [Google Scholar] [CrossRef]
  20. Dal Fiore, F.; Mokhtarian, P.L.; Salomon, I.; Singer, M.E. “Nomads at Last”? A Set of Perspectives on How Mobile Technology May Affect Travel. J. Transp. Geogr. 2014, 41, 97–106. [Google Scholar] [CrossRef]
  21. Dominici, A.; Boncinelli, F.; Gerini, F.; Marone, E. Determinants of Online Food Purchasing: The Impact of Socio-Demographic and Situational Factors. J. Retail. Consum. Serv. 2021, 60, 102473. [Google Scholar] [CrossRef]
  22. Das, M.; Ramalingam, M. What Drives Product Involvement and Satisfaction with OFDs amid COVID-19? J. Retail. Consum. Serv. 2022, 68, 103063. [Google Scholar] [CrossRef]
  23. Kim, W.; Wang, X.C. The Adoption of Alternative Delivery Locations in New York City: Who and How Far? Transp. Res. Part A Policy Pract. 2022, 158, 127–140. [Google Scholar] [CrossRef]
  24. Kim, S.; Woo, A. Streetscape and Business Survival: Examining the Impact of Walkable Environments on the Survival of Restaurant Businesses in Commercial Areas Based on Street View Images. J. Transp. Geogr. 2022, 105, 103480. [Google Scholar] [CrossRef]
  25. Talamini, G.; Li, W.; Li, X. From Brick-and-Mortar to Location-Less Restaurant: The Spatial Fixing of on-Demand Food Delivery Platformization. Cities 2022, 128, 103820. [Google Scholar] [CrossRef]
  26. Wu, C.; Smith, D.; Wang, M. Simulating the Urban Spatial Structure with Spatial Interaction: A Case Study of Urban Polycentricity under Different Scenarios. Comput. Environ. Urban Syst. 2021, 89, 101677. [Google Scholar] [CrossRef]
  27. Zhao, L.; Liu, C.; Liu, X.; Liu, K.; Shi, Y. Urban Spatial Structural Options for Air Pollution Control in China: Evidence from Provincial and Municipal Levels. Energy Rep. 2021, 7, 93–105. [Google Scholar] [CrossRef]
  28. Hong, S.; Hui, E.C.; Lin, Y. Relationship between Urban Spatial Structure and Carbon Emissions: A Literature Review. Ecol. Indic. 2022, 144, 109456. [Google Scholar] [CrossRef]
  29. Salvati, L.; Zambon, I.; Chelli, F.M.; Serra, P. Do Spatial Patterns of Urbanization and Land Consumption Reflect Different Socioeconomic Contexts in Europe? Sci. Total Environ. 2018, 625, 722–730. [Google Scholar] [CrossRef] [PubMed]
  30. Liu, K.; Murayama, Y.; Ichinose, T. Using a New Approach for Revealing the Spatiotemporal Patterns of Functional Urban Polycentricity: A Case Study in the Tokyo Metropolitan Area. Sustain. Cities Soc. 2020, 59, 102176. [Google Scholar] [CrossRef]
  31. Ren, Y.; Tian, Y.; Xiao, X. Spatial Effects of Transportation Infrastructure on the Development of Urban Agglomeration Integration: Evidence from the Yangtze River Economic Belt. J. Transp. Geogr. 2022, 104, 103431. [Google Scholar] [CrossRef]
  32. Wang, D.; Law, F.Y.T. Impacts of Information and Communication Technologies (ICT) on Time Use and Travel Behavior: A Structural Equations Analysis. Transportation 2007, 34, 513–527. [Google Scholar] [CrossRef]
  33. Ozbilen, B.; Wang, K.; Akar, G. Revisiting the Impacts of Virtual Mobility on Travel Behavior: An Exploration of Daily Travel Time Expenditures. Transp. Res. Part A Policy Pract. 2021, 145, 49–62. [Google Scholar] [CrossRef]
  34. Barns, S. Platform Urbanism: Negotiating Platform Ecosystems in Connected Cities; Springer: Singapore, 2020; ISBN 978-981-329-724-1. [Google Scholar]
  35. Narayan, D. Platform Capitalism and Cloud Infrastructure: Theorizing a Hyper-Scalable Computing Regime. Environ. Plan. Econ. Space 2022, 54, 911–929. [Google Scholar] [CrossRef]
  36. Mouratidis, K.; Papagiannakis, A. COVID-19, Internet, and Mobility: The Rise of Telework, Telehealth, e-Learning, and e-Shopping. Sustain. Cities Soc. 2021, 74, 103182. [Google Scholar] [CrossRef]
  37. Verhetsel, A.; Beckers, J.; Cant, J. Regional Retail Landscapes Emerging from Spatial Network Analysis. Reg. Stud. 2022, 56, 1829–1844. [Google Scholar] [CrossRef]
  38. Xu, L.; Li, F.; Huang, K.; Ning, J. A Two-Layer Location Choice Model Reveals What’s New in the “New Retail”. Ann. Am. Assoc. Geogr. 2021, 113, 635–657. [Google Scholar] [CrossRef]
  39. Kim, H.; Ryu, M.H.; Lee, D.; Kim, J.H. Should a Small-Sized Store Have Both Online and Offline Channels? An Efficiency Analysis of the O2O Platform Strategy. J. Retail. Consum. Serv. 2022, 64, 102823. [Google Scholar] [CrossRef]
  40. Formánek, T.; Sokol, O. Location Effects: Geo-Spatial and Socio-Demographic Determinants of Sales Dynamics in Brick-and-Mortar Retail Stores. J. Retail. Consum. Serv. 2022, 66, 102902. [Google Scholar] [CrossRef]
  41. Roig-Tierno, N.; Baviera-Puig, A.; Buitrago-Vera, J.; Mas-Verdu, F. The Retail Site Location Decision Process Using GIS and the Analytical Hierarchy Process. Appl. Geogr. 2013, 40, 191–198. [Google Scholar] [CrossRef]
  42. Reigadinha, T.; Godinho, P.; Dias, J. Portuguese Food Retailers—Exploring Three Classic Theories of Retail Location. J. Retail. Consum. Serv. 2017, 34, 102–116. [Google Scholar] [CrossRef]
  43. Zhang, J.; Robinson, D.T. Investigating Path Dependence and Spatial Characteristics for Retail Success Using Location Allocation and Agent-Based Approaches. Comput. Environ. Urban Syst. 2022, 94, 101798. [Google Scholar] [CrossRef]
  44. Kickert, C.; vom Hofe, R.; Haas, T.; Zhang, W.; Mahato, B. Spatial Dynamics of Long-Term Urban Retail Decline in Three Transatlantic Cities. Cities 2020, 107, 102918. [Google Scholar] [CrossRef]
  45. Lin, G.; Chen, X.; Liang, Y. The Location of Retail Stores and Street Centrality in Guangzhou, China. Appl. Geogr. 2018, 100, 12–20. [Google Scholar] [CrossRef]
  46. Xiong, W.; Yang, J. Delineating and Characterizing the Metropolitan Fringe Area of Shanghai—A Spatial Morphology Perspective. Land 2023, 12, 2086. [Google Scholar] [CrossRef]
  47. Lee, J.; Kim, Y. “A Newcomer” versus “First Mover”: Retail Location Strategy for Differentiation. Prof. Geogr. 2018, 70, 22–33. [Google Scholar] [CrossRef]
  48. Gong, X.; Zhang, K.Z.K.; Chen, C.; Cheung, C.M.K.; Lee, M.K.O. What Drives Trust Transfer from Web to Mobile Payment Services? The Dual Effects of Perceived Entitativity. Inf. Manag. 2020, 57, 103250. [Google Scholar] [CrossRef]
  49. Aranda, E.; Martín, V.J.; Santos, J. Competitive Convergence in Retailing. Econ. Res.-Ekon. Istraživanja 2018, 31, 206–227. [Google Scholar] [CrossRef]
  50. Carpio-Pinedo, J.; Romanillos, J.; Aparicio, D.; Martín-Caro, M.S.H.; García-Palomares, J.C.; Gutiérrez, J. Towards a New Urban Geography of Expenditure: Using Bank Card Transactions Data to Analyze Multi-Sector Spatiotemporal Distributions. Cities 2022, 131, 103894. [Google Scholar] [CrossRef]
  51. Rajakallio, K.; Cuthbertson, R.; Pulkka, L.; Junnila, S. Creating Urban Platforms—Opportunities and Challenges for Innovation in Commercial Real Estate Development. Cities 2018, 77, 92–103. [Google Scholar] [CrossRef]
  52. Dirsehan, T.; Cankat, E. Role of Mobile Food-Ordering Applications in Developing Restaurants’ Brand Satisfaction and Loyalty in the Pandemic Period. J. Retail. Consum. Serv. 2021, 62, 102608. [Google Scholar] [CrossRef]
  53. Wu, M.; Pei, T.; Wang, W.; Guo, S.; Song, C.; Chen, J.; Zhou, C. Roles of Locational Factors in the Rise and Fall of Restaurants: A Case Study of Beijing with POI Data. Cities 2021, 113, 103185. [Google Scholar] [CrossRef]
  54. Meena, P.; Kumar, G. Online Food Delivery Companies’ Performance and Consumers Expectations during COVID-19: An Investigation Using Machine Learning Approach. J. Retail. Consum. Serv. 2022, 68, 103052. [Google Scholar] [CrossRef]
  55. Li, H.; Yu, B.X.B.; Li, G.; Gao, H. Restaurant Survival Prediction Using Customer-Generated Content: An Aspect—Based Sentiment Analysis of Online Reviews. Tour. Manag. 2023, 96, 104707. [Google Scholar] [CrossRef]
  56. Philp, S.; Dolega, L.; Singleton, A.; Green, M. Archetypes of Footfall Context: Quantifying Temporal Variations in Retail Footfall in Relation to Micro-Location Characteristics. Appl. Spat. Anal. Policy 2022, 15, 161–187. [Google Scholar] [CrossRef]
  57. Torrens, P.M. Data Science for Pedestrian and High Street Retailing as a Framework for Advancing Urban Informatics to Individual Scales. Urban Inform. 2022, 1, 9. [Google Scholar] [CrossRef]
  58. Borowska-Stefańska, M.; Kowalski, M.; Kurzyk, P.; Rochmińska, A.; Wiśniewski, S. How Transport Shapes the Landscape of Large-Format Food Retail Trade? Retail Geography in Poland—An Interactive Measure. Appl. Geogr. 2022, 149, 102818. [Google Scholar] [CrossRef]
  59. Li, L.; Feng, R.; Xi, J.; Wang, F. Spatial Drivers and Effects of Urban Food Accessibility: Comparison of Conventional and Online-to-Offline Services. Appl. Geogr. 2023, 152, 102894. [Google Scholar] [CrossRef]
  60. Combs, T.B.; Ornstein, J.T.; Chaitan, V.L.; Golden, S.D.; Henriksen, L.; Luke, D.A. Draining the Tobacco Swamps: Shaping the Built Environment to Reduce Tobacco Retailer Proximity to Residents in 30 Big US Cities. Health Place 2022, 75, 102815. [Google Scholar] [CrossRef]
  61. Gutierrez, L.E.; Elorriaga, N.; Gibbons, L.; Melendi, S.; Chaparro, M.; Calandrelli, M.; Lanas, F.; Mores, N.; Ponzo, J.; Poggio, R.; et al. Attributes of the Food and Physical Activity Built Environments from the Southern Cone of Latin America. Sci. Data 2021, 8, 291. [Google Scholar] [CrossRef]
  62. Nilsson, I.M.; Smirnov, O.A. Measuring the Effect of Transportation Infrastructure on Retail Firm Co-Location Patterns. J. Transp. Geogr. 2016, 51, 110–118. [Google Scholar] [CrossRef]
  63. Qin, X.; Zhen, F.; Zhang, S. Housing Space and ICT Usage: A Cross Sectional Case Study in the Netherlands. Cities 2021, 114, 103208. [Google Scholar] [CrossRef]
  64. Duch-Brown, N.; Grzybowski, L.; Romahn, A.; Verboven, F. The Impact of Online Sales on Consumers and Firms. Evidence from Consumer Electronics. Int. J. Ind. Organ. 2017, 52, 30–62. [Google Scholar] [CrossRef]
  65. Kim, D.Y.; Kim, S.Y. The Impact of Customer-Generated Evaluation Information on Sales in Online Platform-Based Markets. J. Retail. Consum. Serv. 2022, 68, 103016. [Google Scholar] [CrossRef]
  66. Liu, W.; Choi, T.-M.; Niu, X.; Zhang, M.; Fan, W. Determinants of Business Resilience in the Restaurant Industry During the COVID-19 Pandemic: A Textual Analytics Study on an O2O Platform Case. IEEE Trans. Eng. Manag. 2022, 1–14. [Google Scholar] [CrossRef]
  67. Ayatac, H.; Dokmeci, V. Location Patterns of Restaurants in Istanbul. Curr. Urban Stud. 2017, 05, 202–216. [Google Scholar] [CrossRef]
  68. Schaer, O.; Kourentzes, N.; Fildes, R. Predictive Competitive Intelligence with Prerelease Online Search Traffic. Prod. Oper. Manag. 2022, 31, 3823–3839. [Google Scholar] [CrossRef]
  69. Norris, J.J.; Xiong, H. Ride-Sharing and the Geography of Consumption Industries. Econ. J. 2023, 133, 2449–2482. [Google Scholar] [CrossRef]
  70. Jiangsu Channel·Central Broadcasting Network. Available online: http://js.cnr.cn/ (accessed on 3 November 2023).
  71. Nanjing Bureau of Statistics. Available online: http://tjj.nanjing.gov.cn/ (accessed on 3 November 2023).
  72. Meituan—Helping Everyone Eat Better and Live Better. Available online: https://www.meituan.com/ (accessed on 3 November 2023).
  73. Nanjing Municipal Planning and Natural Resources Bureau. Available online: http://ghj.nanjing.gov.cn/ (accessed on 3 November 2023).
  74. State Administration for Market Regulation. Available online: https://www.samr.gov.cn/ (accessed on 3 November 2023).
  75. Alibaba Group Official Website-Alibaba Group. Available online: https://www.alibabagroup.com/ (accessed on 3 November 2023).
  76. Chen, Y.; Zhang, B.; Li, M.; Zhou, R.Z.; Xu, Z. Concatenating Daily Exercise Routes with Public Sports Facilities, Bicycle Lanes, and Green Spaces: A Feasibility Analysis in Nanjing, China. Land 2022, 11, 2251. [Google Scholar] [CrossRef]
  77. Hu, X.; Yang, H.; Zhang, Y. Research on the Spatial Arrangement of Retail Business in the Central City of China’s Megacity-A Case Study of Nanjing. IOP Conf. Ser. Earth Environ. Sci. 2018, 153, 032026. [Google Scholar] [CrossRef]
  78. Barros, F.M.; Peres, C.A.; Pizo, M.A.; Ribeiro, M.C. Divergent Flows of Avian-Mediated Ecosystem Services across Forest-Matrix Interfaces in Human-Modified Landscapes. Landsc. Ecol. 2019, 34, 879–894. [Google Scholar] [CrossRef]
  79. Wu, R.; Wang, J.; Zhang, D.; Wang, S. Identifying Different Types of Urban Land Use Dynamics Using Point-of-Interest (POI) and Random Forest Algorithm: The Case of Huizhou, China. Cities 2021, 114, 103202. [Google Scholar] [CrossRef]
  80. ELSamen, A.A.A.; Hiyasat, R.I. Beyond the Random Location of Shopping Malls: A GIS Perspective in Amman, Jordan. J. Retail. Consum. Serv. 2017, 34, 30–37. [Google Scholar] [CrossRef]
  81. Zhang, F.; Ji, Y.; Lv, H.; Ma, X.; Kuai, C.; Li, W. Investigating Factors Influencing Takeout Shopping Demand under COVID-19: Generalized Additive Mixed Models. Transp. Res. Part D Transp. Environ. 2022, 107, 103285. [Google Scholar] [CrossRef] [PubMed]
  82. Shah, F.; Liu, Y.; Shah, Y.; Ul Haq, I.; Mukred, M.; Hussain, S.; Alasaly, M.S. A Blockchain Technique for Trade Credit Maintainability Using the Role of Information and Communication Technology. J. Math. 2022, 2022, 9621342. [Google Scholar] [CrossRef]
  83. Wang, Z.; He, S.Y. Impacts of Food Accessibility and Built Environment on On-Demand Food Delivery Usage. Transp. Res. Part Transp. Environ. 2021, 100, 103017. [Google Scholar] [CrossRef]
  84. Zhang, F.; Ji, Y.; Lv, H.; Zhang, Y.; Phil, B.; Fan, J. Travel Satisfaction of Delivery Electric Two-Wheeler Riders: Evidence from Nanjing, China. Transp. Res. Part A Policy Pract. 2022, 162, 253–266. [Google Scholar] [CrossRef]
  85. Akturk, M.S.; Ketzenberg, M. Impact of Competitor Store Closures on a Major Retailer. Prod. Oper. Manag. 2022, 31, 715–730. [Google Scholar] [CrossRef]
Figure 1. Location of the research area.
Ijgi 13 00044 g001
Figure 2. Steps of the scope definition of the central area. Platform Penetration Index (PPI).
Ijgi 13 00044 g002
Figure 3. Isochronous maps generated by dynamic traffic with three CCNs as the origins.
Ijgi 13 00044 g003
Figure 4. An illustration of sales volume difference as a measure of the relative efficiency of online stores.
Ijgi 13 00044 g004
Figure 5. Kernel density analysis for B&Ms and B&Cs. (a) B&M stores; (b) B&C stores; (c) B&C restaurants; (d) B&C retail stores.
Ijgi 13 00044 g005aIjgi 13 00044 g005b
Figure 6. Hot spot area identification for numbers and PPI. (a) Number of B&Cs; (b) number of B&C restaurants; (c) number of B&C retail stores; (d) PPI of B&Cs; (e) PPI of B&C restaurants; (f) PPI of B&C retail stores.
Ijgi 13 00044 g006
Figure 7. The relative importance of various determinants in the distribution of takeout stores.
Ijgi 13 00044 g007
Figure 8. Box plot of monthly sales in each walking time cost circle starting from CCNs (restaurants on the left, retail stores on the right). (a) Xiaosihuan; (b) Zhujiang Road; (c) Hunan-Shanxi Road.
Ijgi 13 00044 g008aIjgi 13 00044 g008b
Figure 9. DBSCAN clustering results based on spatial geographic coordinates and sales data (restaurant on the left, retail on the right). (a) Xiaosihuan; (b) Zhujiang Road; (c) Hunan-Shanxi Road.
Ijgi 13 00044 g009aIjgi 13 00044 g009b
Table 1. Definition and descriptive analysis of the variables.
Factors IndicatorsMeanMedianSDMaxMinUnitNotes
Demand factorsDemand scaleResidential
communities
34.743512.16633/Number within 500 m
Office buildings25.702512.16531/Number within 500 m
Diversity of demandHouse price38,111.9338,481.525750.0554,49121,324.07Yuan/square meterAverage value within 500 m
Population groups1.751.790.352.640.50/POI type mix within 100 m
Office rent1.761.620.653.40.48Yuan/month/square meterAverage value within 500 m
Cost factorsEconomic costsStore rent8.486.869.74158.331.21Yuan/month/square meterAverage value within 100 m
Traffic costsDistance to nearest commercial center639.50598.83332.971531.3441.75meter/
Travel time962.61968.5422.92196948SecondWalking
Railway stations and bus stops10.36102.8202/Number within 500 m
Commercial performance Online sales504.3314646.36000 0/Sales volume within 500 m
Table 2. Average nearest neighbor distance analysis of take-out providers in Nanjing.
Z ValueNNI Valuep ValueAverage Nearest Distance (Observed) ExpectedDistribution Pattern
RestaurantB&M−79.6245700.2288370.0000009.1409 m39.9449 mGreatly clustered
B&C−77.3500120.3859060.00000012.8128 m33.2018 mFairly clustered
RetailB&M−80.1530450.2439520.0000009.2596 m37.9565 mGreatly clustered
B&C−31.5522840.4768730.00000029.9797 m62.8673 mSlightly clustered
Table 3. Sales statistics within a 20-min walk of the three CCNs.
Sales
Retail Restaurant
AverageSumAverageSum
Xiaosihuan13150,199586578,462
Zhujiang Road14645,979510399,405
Hunan-Shanxi Road21221,028844255,106
Disclaimer/Publisher’s Note: The statements, opinions and data contained in all publications are solely those of the individual author(s) and contributor(s) and not of MDPI and/or the editor(s). MDPI and/or the editor(s) disclaim responsibility for any injury to people or property resulting from any ideas, methods, instructions or products referred to in the content.

