


Spatial Accessibility of Public Electric Vehicle Charging Services in China
1
School of Geography, Nanjing Normal University, Nanjing 210023, China
2
Jiangsu Center for Collaborative Innovation in Geographical Information Resource Development and Application, Nanjing Normal University, Nanjing 210023, China
3
College of Hydrology and Water Resources, Hohai University, Nanjing 210024, China
*
Author to whom correspondence should be addressed.
ISPRS Int. J. Geo-Inf. 2023, 12(12), 478; https://doi.org/10.3390/ijgi12120478
Submission received: 2 September 2023
/
Revised: 20 November 2023
/
Accepted: 23 November 2023
/
Published: 25 November 2023
(This article belongs to the Special Issue Innovative GIS Models and Approaches for Large Environmental and Urban Applications in the Age of AI)
Abstract
:Decarbonizing the transport sector using electric vehicles (EVs) is a vital pathway for China to achieve the carbon peak and carbon neutrality goals. Despite the unprecedented growth of EV diffusion in China, little information is available for the spatial accessibility of public electric vehicle charging services (EVCSs). This study developed an applicable accessibility measurement framework to examine the city-level accessibility of EVCSs in China using the Gaussian two-step floating catchment area (G2SFCA) method. G2SFCA takes the EV charging stations with charging piles as supply and the EV ownership data as demand. The results indicate that (1) the eastern region of China has the highest density of EV charging stations (69.1%), followed by the central region, while the western region has the lowest density; (2) the spatial accessibility of EVCSs has a different pattern, where the central region has the highest accessibility, followed by the eastern and western regions; (3) the spatial mismatch between EVCSs and EV diffusion in the eastern region is larger than that of the other two regions, which may be attributed to the suboptimal layout of EV charging stations and the inconsistent pace between EV penetration and EV charging station construction; and (4) there is a significant spatial inequity in the accessibility of EVCSs across both all three regions and the entirety of China, with the western region exhibiting the highest inequity, followed by the central and eastern regions. Based on these findings, policy implications are drawn for different regions in China, which may aid policymakers in crafting strategic policies and subsidy programs to foster the advancement of EVCSs.
1. Introduction
Global warming poses a serious threat and a severe challenge to human survival and sustainable development [1,2]. To maintain global warming below 1.5 °C, the Chinese government pledged to release implementation plans to reach peak carbon dioxide (CO2) emissions before 2030 and carbon neutrality before 2060 in response to the Paris Agreement [3,4]. Decarbonizing the transport sector using electric vehicles (EVs) is one of the crucial pathways to meet the two goals [4,5]. EVs use electric motors instead of internal combustion engines and play a vital role in combating global climate change by reducing carbon dioxide emissions and dependence on fossil fuels [6].
More than 10 million EVs were expected to be used globally by the end of 2020, with global EV registrations increasing by 41% by 2020 [6]. China has one of the biggest markets for EVs [7]. In fact, EV registrations increased from 1.37 million in 2020 to 3.52 million in 2021, which is the highest growth speed among countries worldwide. Although the growth of EV adoption in China is unprecedented, the EV market still faces several barriers to rapid EV penetration, such as range anxiety, long charging times, and inadequate charging infrastructure [6,8]. Among them, the charging infrastructure is an essential prerequisite for accelerating EV diffusion [8,9]. At present, 50–80% of worldwide charging events for EVs are completed at regular (private) charging stations (i.e., homes and workplaces) instead of public charging stations [10]. Sufficient public charging stations along travel corridors are highly desired to alleviate range anxiety and enable long-distance driving, which in turn would stimulate the growth of the EV market [8]. Therefore, the development of public charging stations is an urgent requirement and increasing concerns have been raised worldwide to satisfy the increasing demand for charging [6,8]. The Chinese government has issued various policies to promote the construction of charging infrastructure, such as the guidance of coordinating and accelerating the integrated construction of parking lots and charging infrastructure released in 2016. However, little knowledge is available about the spatial convenience and variation in public charging services after the rapid implementation of these policies in China. Policymakers and urban planners must obtain an in-depth understanding of the spatial serviceability of EVCSs, which would facilitate the optimization and adjustment of the layout of EVCSs according to the rapid growth of EV adoption in China [8,9,11].
As an important public infrastructure service, the convenience of EVCSs can be measured by accessibility [12,13,14,15,16]. Accessibility is usually defined as the ease and comfort associated with arriving at a destination (i.e., public services) and includes spatial and non-spatial accessibility [12,17,18,19]. Non-spatial accessibility refers to the tendency of people to select public services, whereas spatial accessibility refers to the availability and proximity to public services [20,21]. The former often includes the attribute characteristics of facilities and demand within geographical units. The latter, which is widely employed, considers not only the demand and facility supply, but also the spatial impedance between the demand and the facilities. Various methods have been proposed to calculate spatial accessibility, including utility-based, gravity-based, and opportunity-based methods [17,18,22,23]. Among them, the two-step floating catchment area (2SFCA) method and its variants, which are typical representatives of opportunity-based spatial accessibility methods, have been widely applied in numerous public services, such as health care [24,25,26,27,28], green spaces [29,30], food stores [31,32], fire services [20,21], transportation [15,16,33], and EVCSs [14,34]. Current measurements for EVCSs, like many public services in measuring accessibility, often take the population of a spatial unit as the demand. However, the population reflects potential demand rather than real demand, which results in the inaccurate measurement of the accessibility of EVCSs [25]. Meanwhile, they mainly concentrate on spatial accessibility within individual cities; therefore, little information is available for the spatial accessibility of EVCSs at a large scale, such as a country. Especially, EV diffusion is thriving in China and limited knowledge of the spatial accessibility of EVCSs may hamper the growth of the EV market, which may further hinder the achievement of the carbon peak and carbon neutrality goals of the Chinese government.
This study focused on measuring the spatial accessibility of EVCSs and sought to fill the research gap to provide reliable EVCS accessibility for policymakers and urban planners in China. To fulfill this object, we aim to answer three research questions: (1) How can we appropriately measure the spatial accessibility of EVCSs? (2) What is the spatial pattern of accessibility of EVCSs in different regions across China? (3) What about the spatial equity for the spatial accessibility of EVCSs in different regions? In this study, an applicable accessibility measurement framework was developed to understand access to EVCSs. Then, the development process of the EVCSs in China was sorted. Further, the spatial accessibility of the EVCSs and the characteristics of spatial patterns and equity were presented. Finally, potential policy implications were drawn for the future development of EVCSs in China.
2. Study Area and Data
2.1. Changes and Growth of EVCSs in China
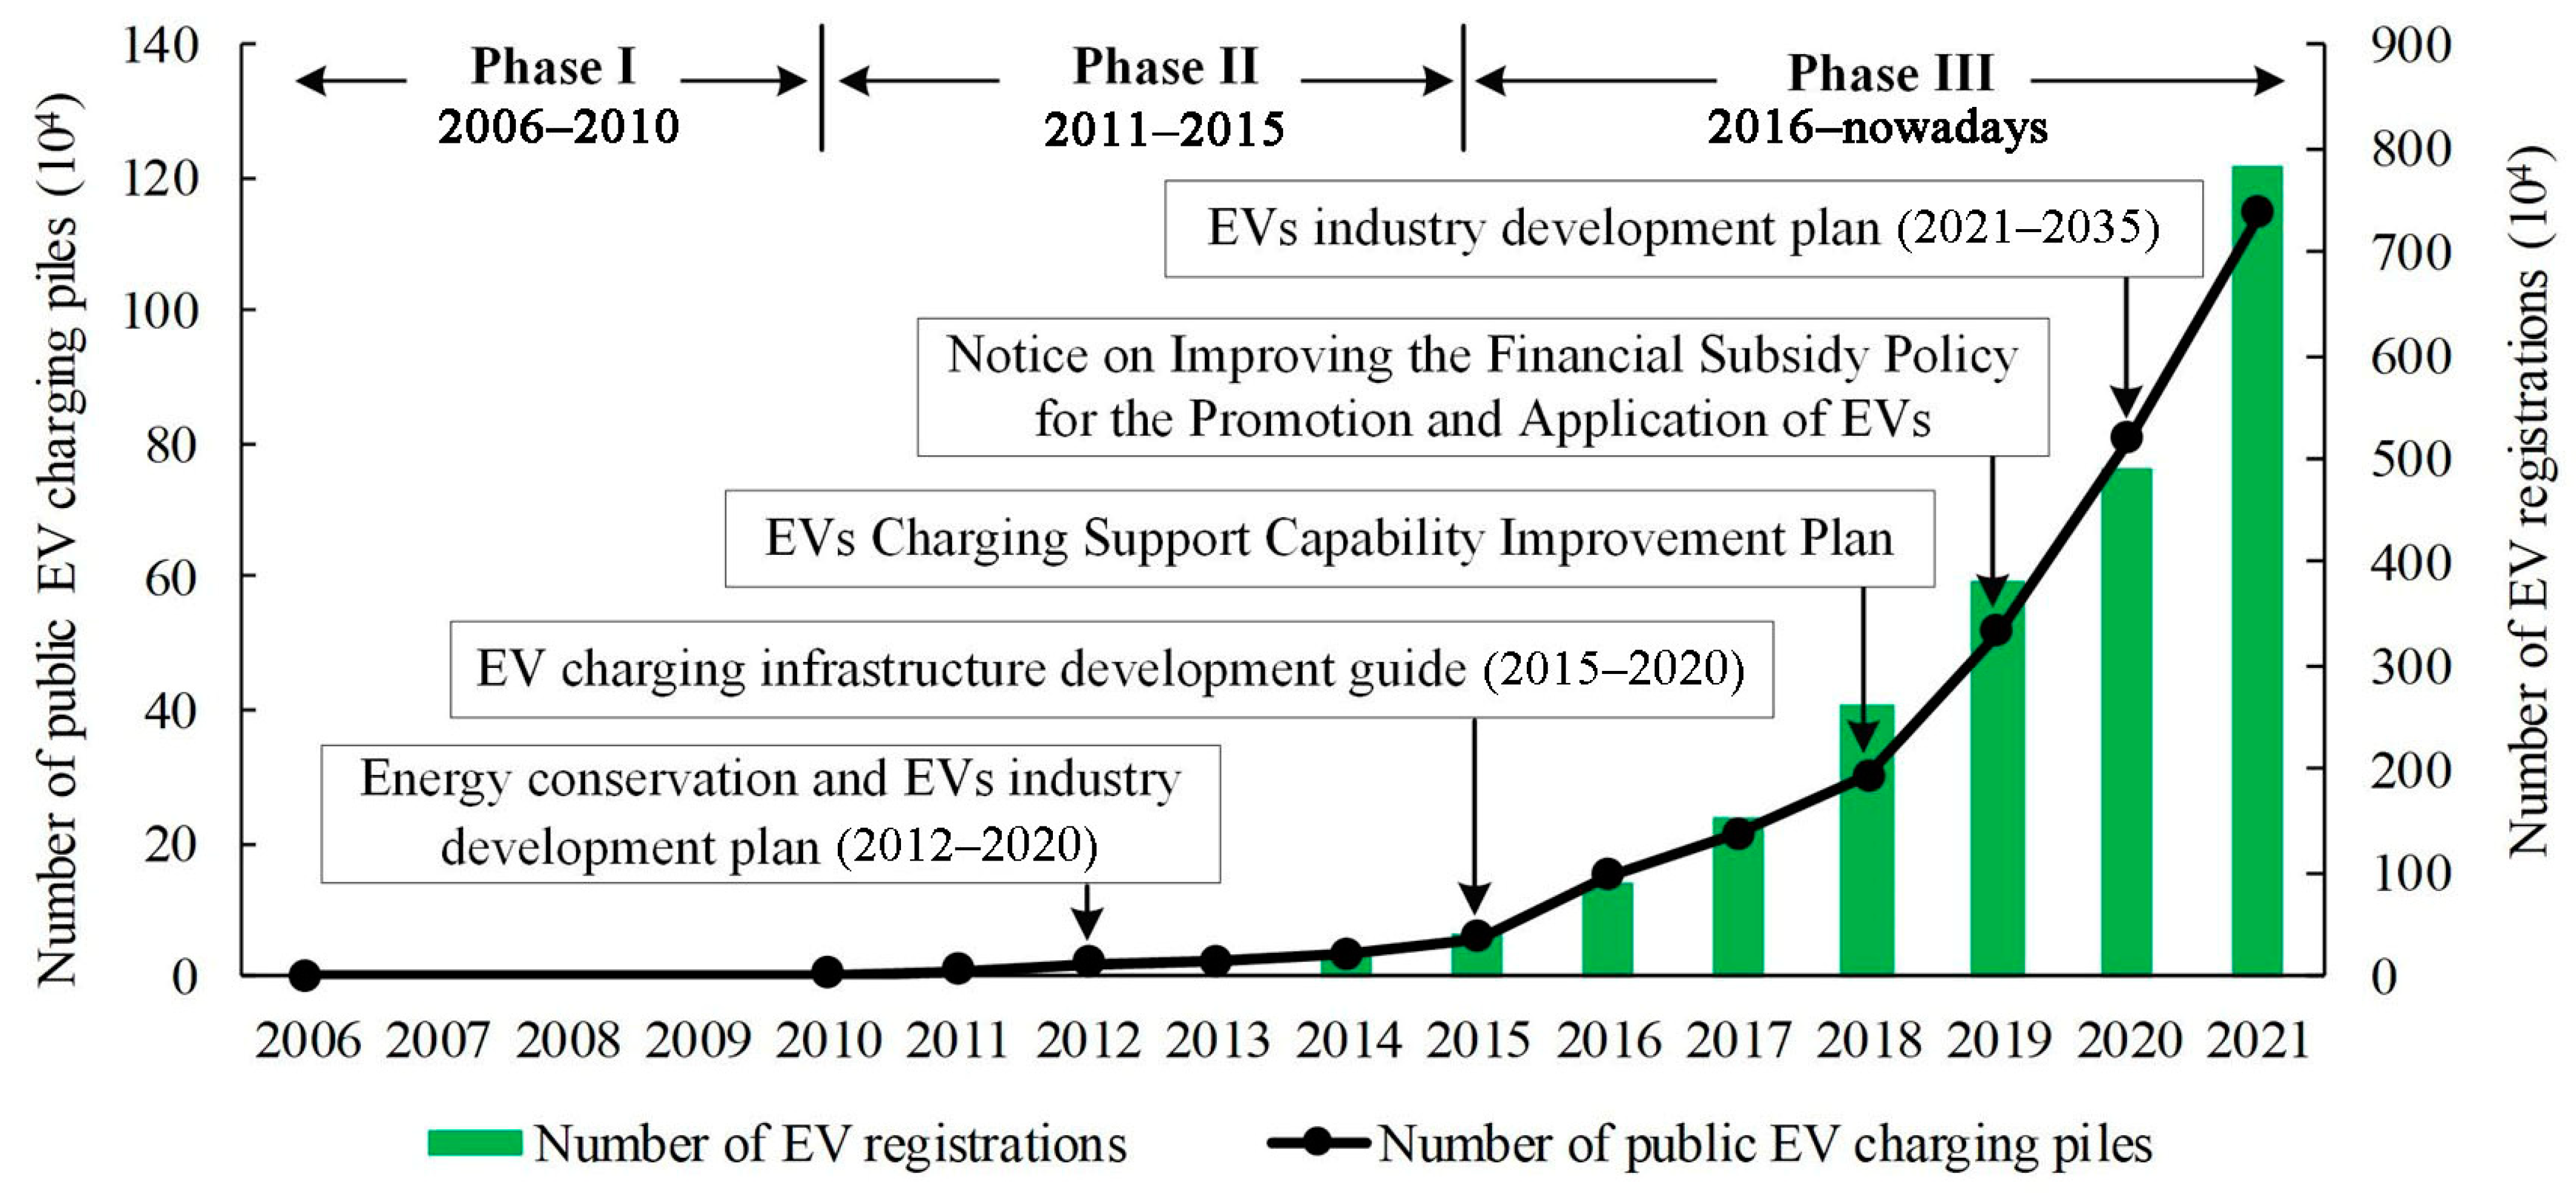
As a new infrastructure in China, the government has made significant efforts to promote the construction of EVCSs. To date, this construction has undergone three stages (Figure 1).
(1) Phase I: early stage (2006–2010). In 2006, BYD, a well-known EV manufacturer in China (https://www.bydglobal.com/en/index.html), built an EV charging station at their Shenzhen headquarters. Owing to the low penetration rate (<1.1%) of private EVs in China, the charging stations built at this stage were mainly for electric buses. Further, the number of public charging facilities was relatively small, consisting of only 1100 EV charging piles.
(2) Phase II: market-opening stage (2011–2015). At the end of 2010, the State Grid Corporation of China built its first public EV charging station, ultimately welcoming investment in the EVCS market. Thereafter, the Chinese government released its first national plan for EV construction, the Energy Conservation and EV Industry Development Plan (2012–2020). Since then, EVCS development has been included in the renovation of old cities and new city construction plans. At this stage, the number of EV charging facilities began to show an upward trend, as shown in Figure 1.
(3) Phase III: rapid expansion stage (2016–present). The EV charging infrastructure development guide (2015–2020) was proposed at the end of 2015, which projected the number of EV charging facilities to be established in China by 2020. This guide divided China into the eastern, central, and western regions. The eastern region includes Liaoning, Shandong, the Yangtze River Delta region, Fujian, Guangdong, and Hainan provinces, and the Beijing–Tianjin–Hebei region. The central region includes Jilin, Heilongjiang, Inner Mongolia, Shaanxi, Shanxi, Gansu, Henan, Hubei, Hunan, Jiangxi, Chongqing, Sichuan, Guizhou, and Yunnan provinces. The western region involves Ningxia, Xinjiang, Qinghai, Tibet, and Guangxi provinces. In the following analysis, the defined eastern, central, and western regions in terms of this guide were used as the spatial units. From late 2015 to 2016, ridesharing companies such as EVCARD (https://www.evcard.com/), GoFun (https://m.shouqiev.com/), CAOCAO (https://www.caocaokeji.cn/), and others began to put forward EV sharing services in several cities. As shown in Figure 1, the number of EV registrations and EV charging facilities markedly increased under the incentive of policy and the market and were 18.7-fold and 19.7-fold greater in 2021 than in 2015, respectively.
2.2. Data Collection
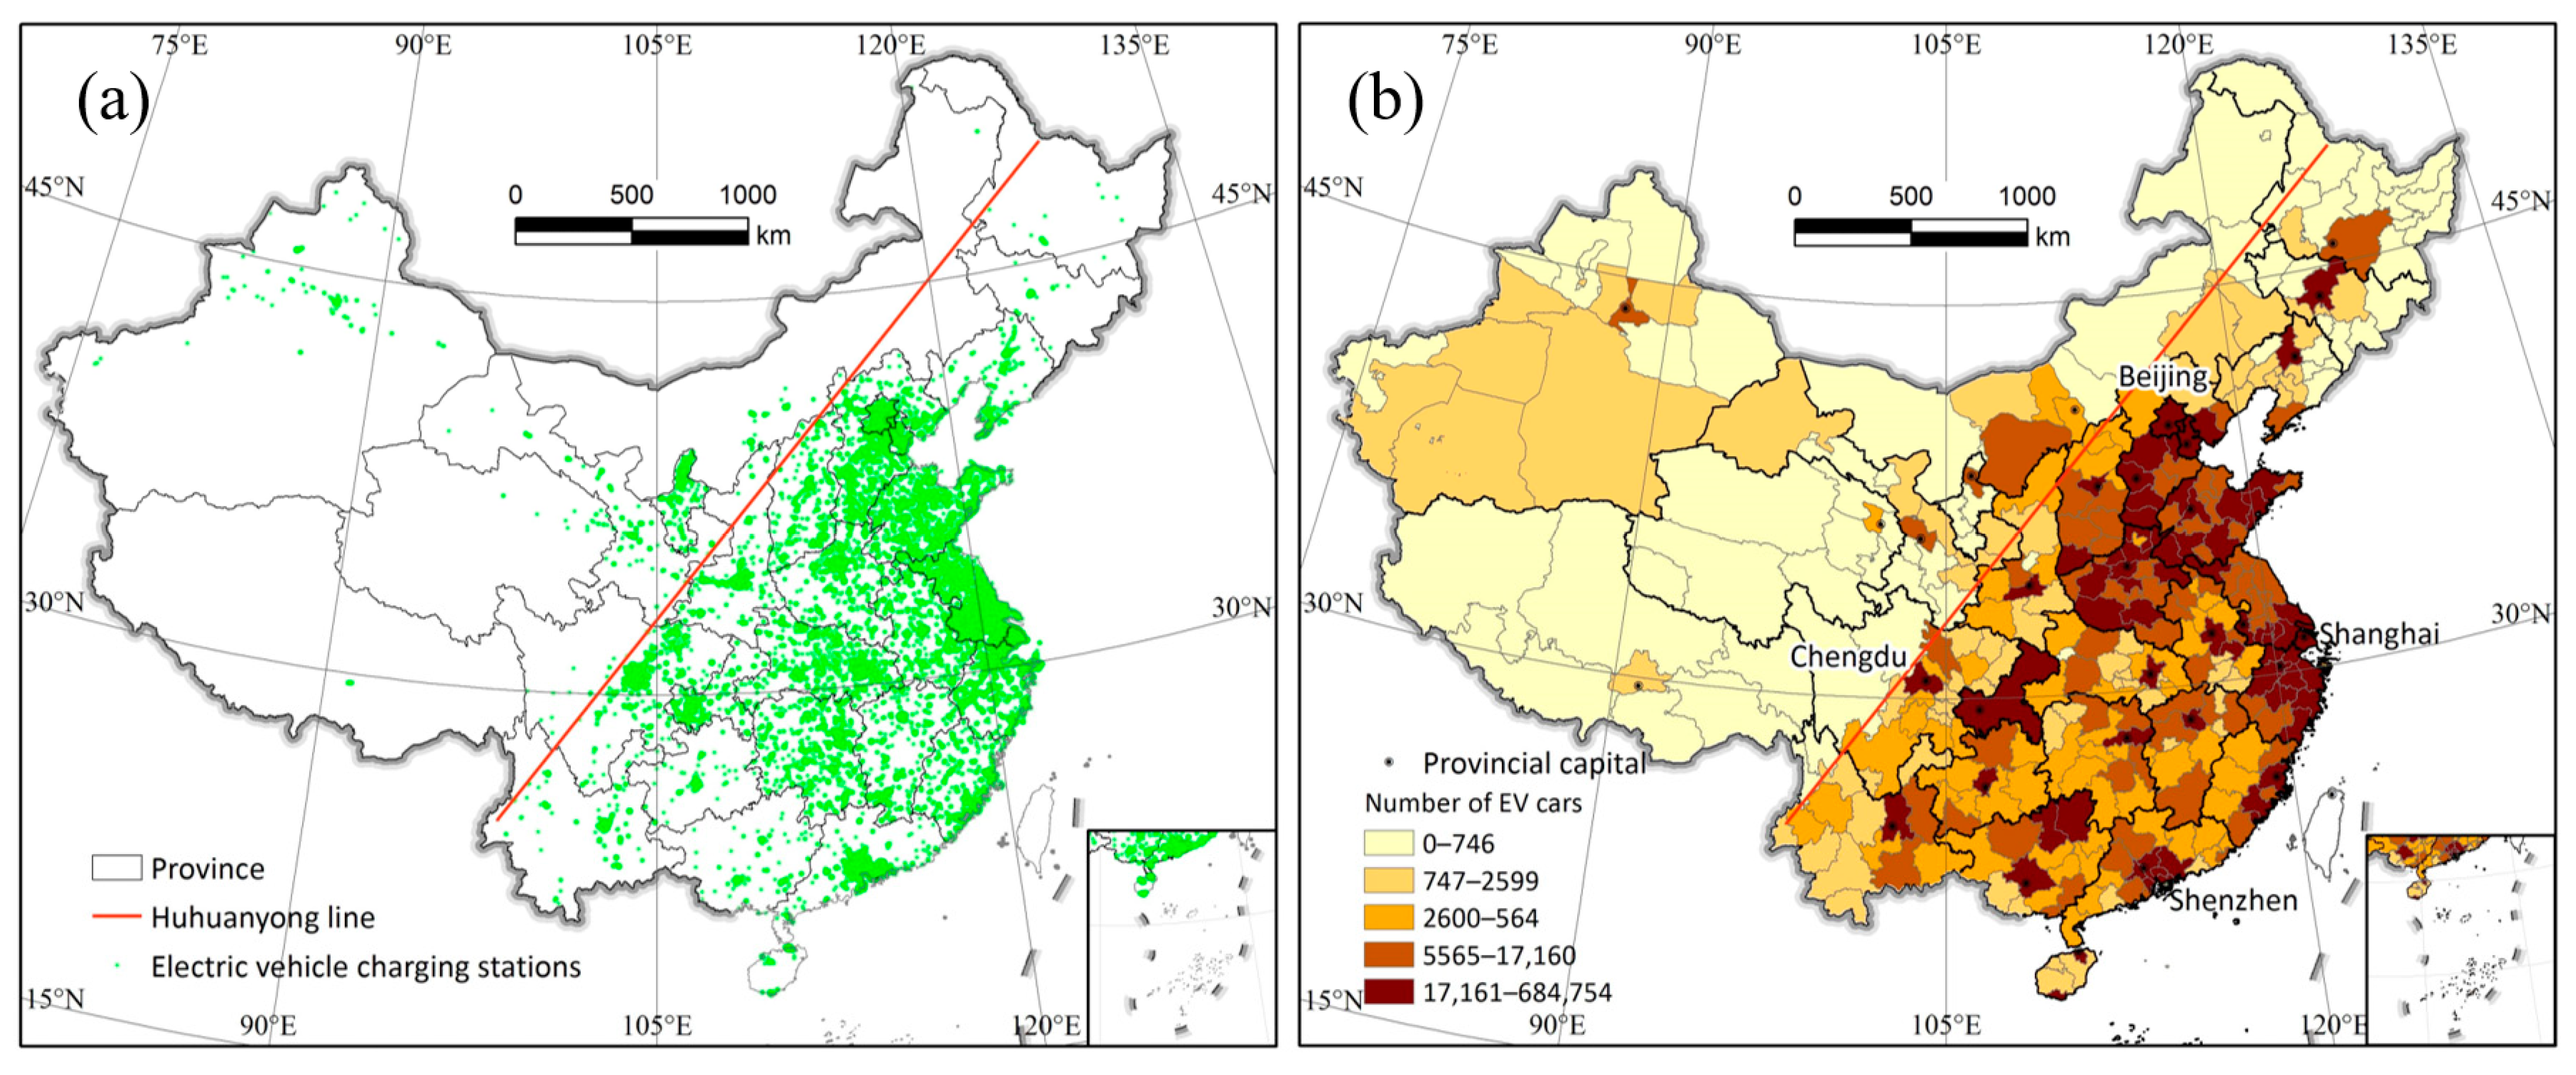
Three datasets were used in this study. The first dataset was the city-level administrative boundary data in mainland China, which was used as the basic spatial unit for measuring the accessibility of EVCSs. The city-level boundary dataset was collected from the National Catalogue Service for Geographic Information (https://www.webmap.cn/main.do?method=index, accessed on 20 December 2022). Due to the relatively low number of vehicles in specific cities across a few Chinese provinces (i.e., fifteen cities in Hainan province and nine cities in Xinjiang province), these cities within each province share the identical title number of vehicle license plates. The boundaries of such cities with the same title number are merged as a single unit because the demand information (i.e., the ownership details of EVs) for EVCSs can only be obtained based on the title number of the vehicle license plates in measuring the accessibility of EVCSs. For example, cities like Wuzhishan, Dongfang, Baisha, Changjiang, and Lingshui in Hainan province are consolidated as a single unit because they are all numbered “Qiong C”. This consolidation facilitates the process of collecting data on the demand for EVCSs. The second dataset was the public EV charging stations of China obtained from the Charging Bar platform (www.bjev520.com, accessed on 25 December 2022), as shown in Figure 2a. We specifically selected EV charging stations categorized as “public” and “social open” on the Charging Bar platform to define our dataset of public EV charging stations. This dataset served as the facility supply of EVCSs, including 32,704 charging stations and 328,709 charging piles. We acquired the coordinates and equipped charging piles of each public EV charging station on 25 December 2022. The last dataset was the ownership data of EVs for each city in China from the National Bureau of Statistics (https://data.stats.gov.cn/, accessed on 20 December 2022), as shown in Figure 2b. The city-level ownership data of EVs in 2021 were used to reflect the potential demand for EVCSs in measuring the spatial accessibility.
3. Methodology
The 2SFCA method, which was proposed by Luo and Wang [35], comprehensively considers the potential demand, facility supply capacity, and impedance in the measurement of spatial accessibility for several public services [17,20,25,36,37]. However, this method employs a dichotomous travel impedance tool in which the same weight is used within a catchment area under the given threshold, whereas the areas outside the catchment are considered to be unavailable [35]. The Gaussian 2SFCA (G2SFCA) was further developed to overcome the shortcomings of dichotomous impedance through a Gaussian decay function to describe the weight change in different spatial impedances [38]. G2SFCA is regarded as a more reasonable method for measuring access to public services [14,38,39]. Therefore, G2SFCA was employed in this study to measure the spatial accessibility of EVCSs in China.
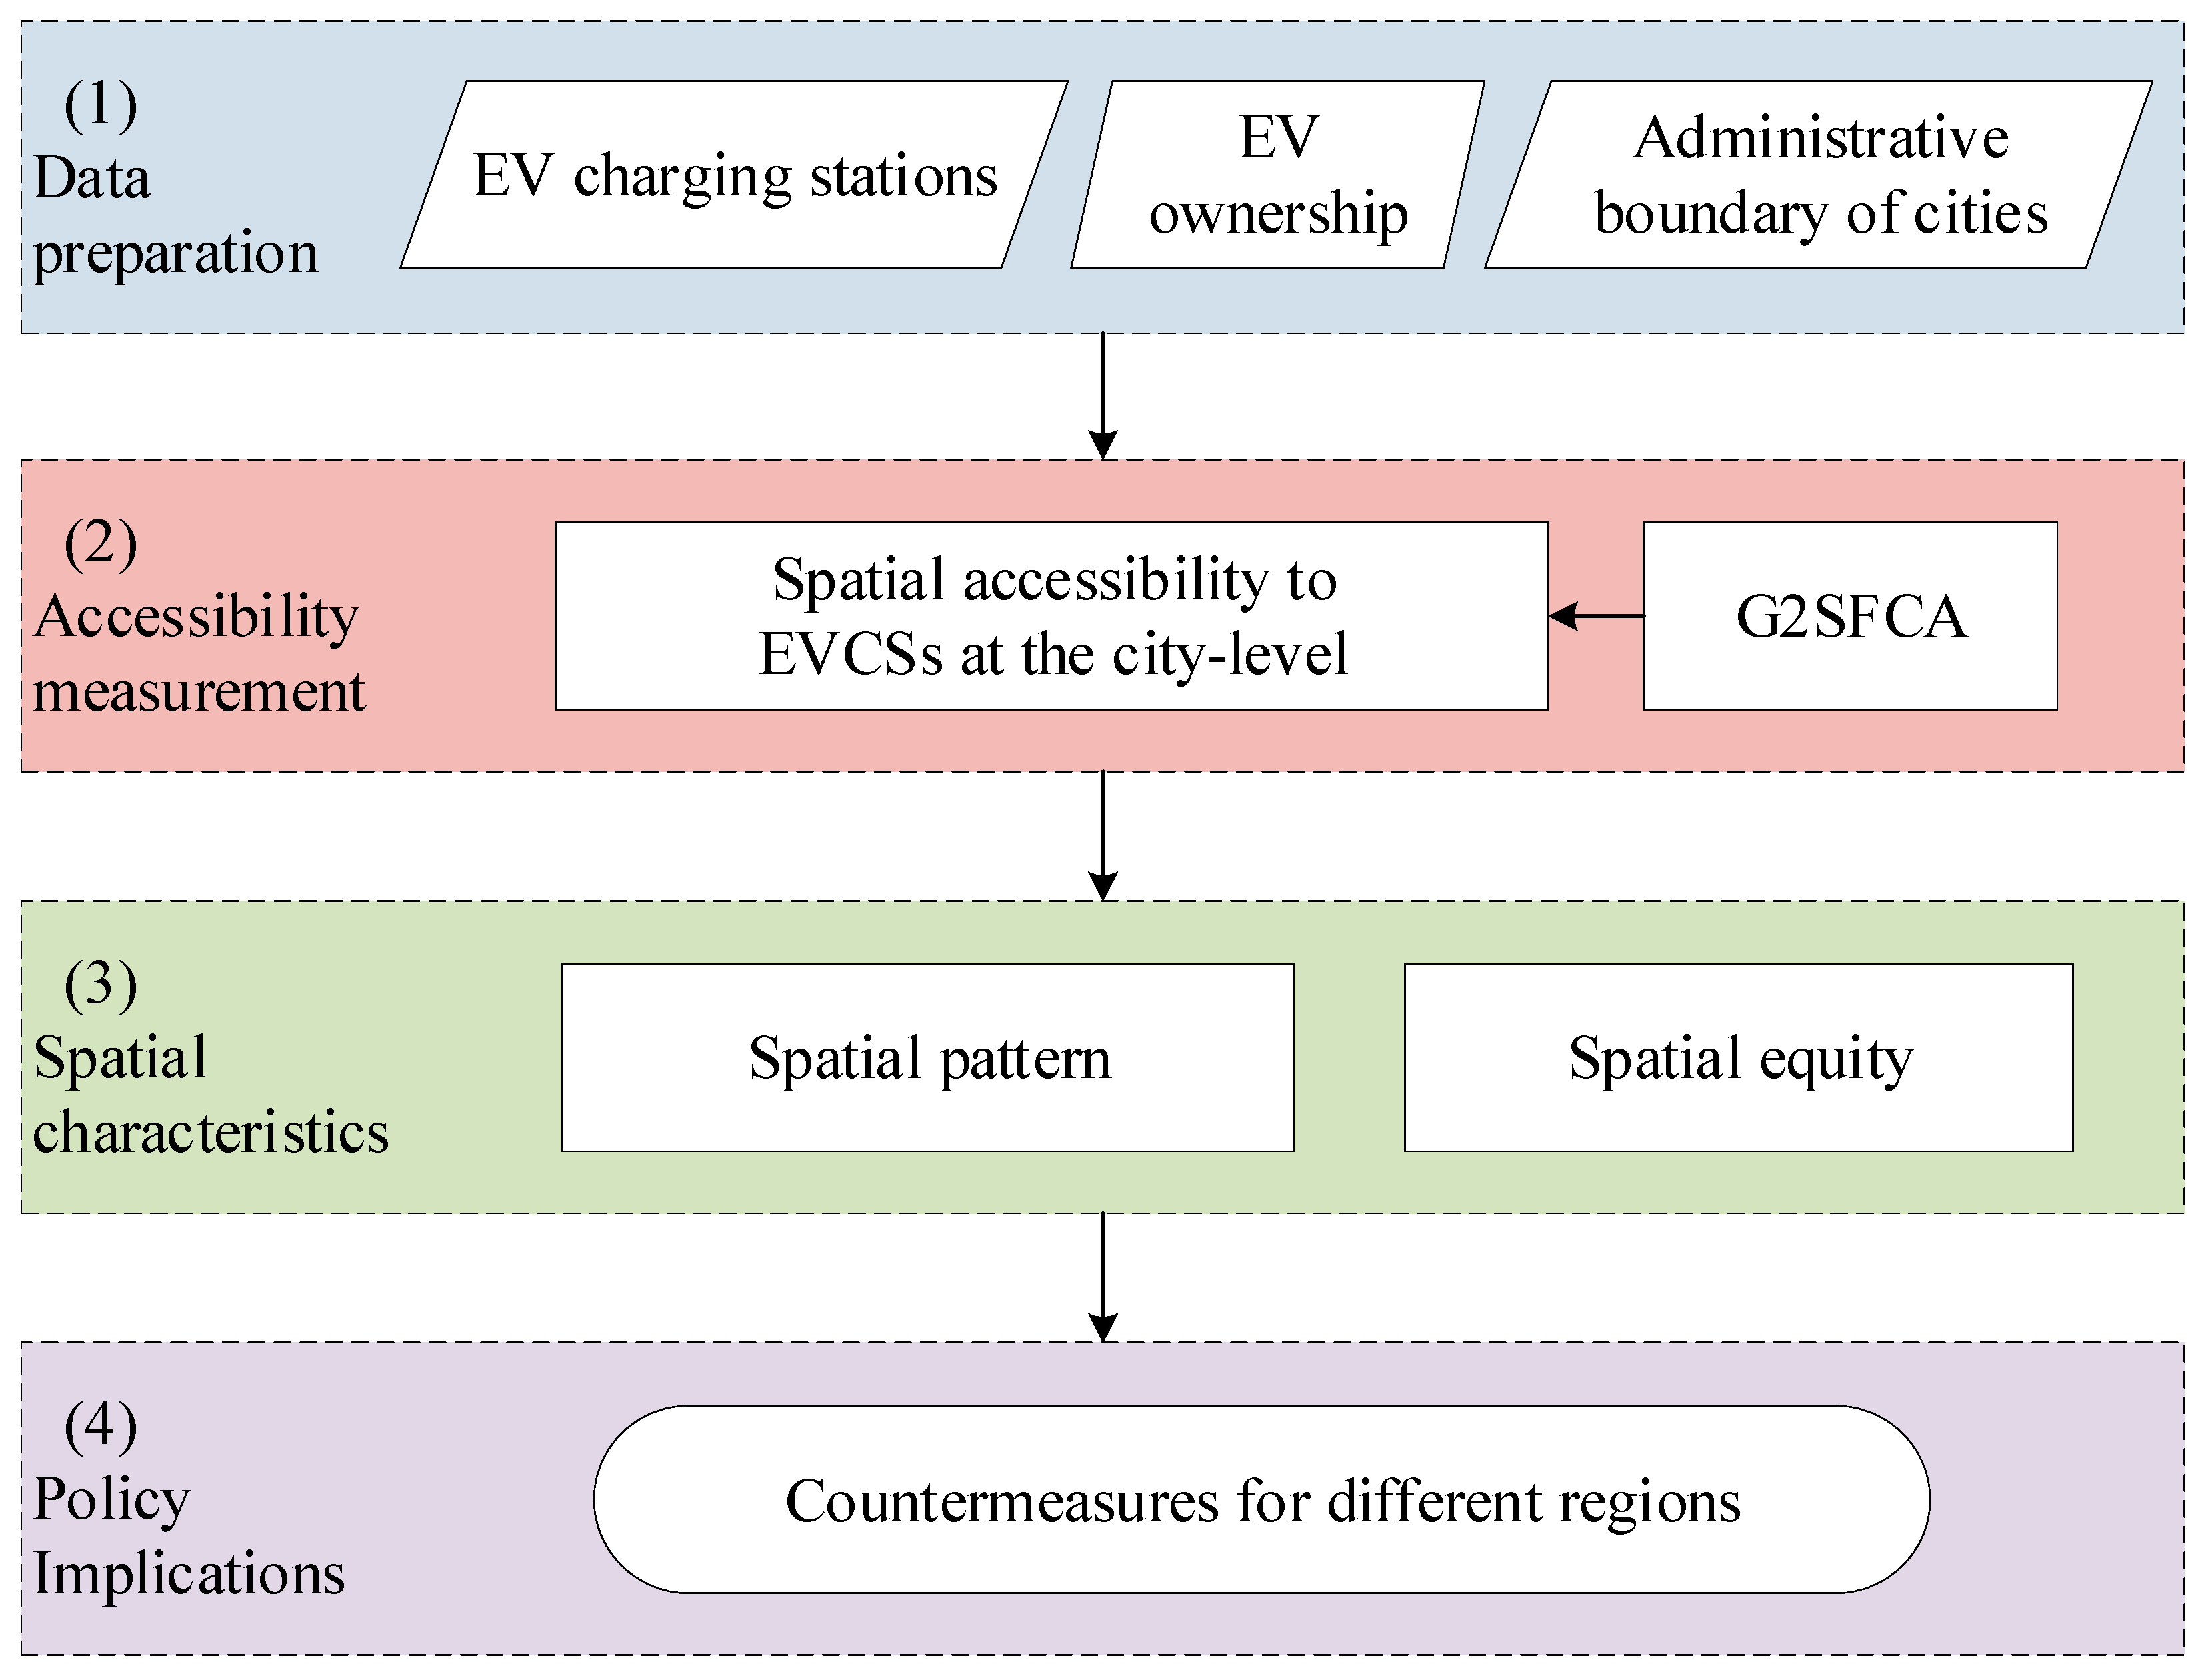
3.1. Research Framework
The research framework is shown in Figure 3 and involves the following four stages.
- (1)
- Preparation of the input datasets, including the public EV charging stations as the supply facilities, the city-level ownership data of EVs in 2021 as the potential demand, and the administrative boundaries of cities in mainland China.
- (2)
- Calculation of the spatial accessibility of EVCSs in mainland China at the city level using the G2SFCA.
- (3)
- (4)
- Proposal of implications and countermeasures for policymakers and urban planners to develop EVCSs based on an analysis of the spatial characteristics of access to EVCSs in mainland China.
3.2. G2SFCA Method
G2SFCA is an extension of 2SFCA using the Gaussian decay function and comprises two steps [38].
In the first step, the supply-to-demand ratio was calculated for each facility within a catchment area under a given spatial impedance threshold [35,39]. For each public EV charging station , the method searches for all demand locations () within a spatial impedance threshold from . Thereafter, the Gaussian decay function () was used to compute the spatial impedance weight for each demand location, and the sum of the weighted demands was calculated as the denominator of the supply to demand [17,38]. Finally, the supply-to-demand ratio at the EV charging station was computed as:
where is the distance between demand location and public EV charging station , is the predefined threshold of spatial impedance, is the demand (i.e., the number of EVs) at location , is the supply capacity (i.e., the number of charging piles) at EV charging station , and is the weight of the Gaussian decay function [17,29,38], which is expressed as follows:
In the second step, for each demand location , the model searched for all EV charging stations () within the threshold from . Thereafter, the accessibility of demand location was estimated by summing the weighted supply-to-demand ratio of stations () and their impedance decay weight using
To format the catchment area in G2SFCA [17,38], the threshold was set to an empirical value of 20 km, as the average radius of city centers in China is approximately 20 km [42,43]. Note that the empirical threshold is not travel distance but Euclidean distance. There are two reasons for the use of Euclidean distance. On one hand, this study focuses on the city-level accessibility in a large-scale area as the city-level ownership data of EVs is the finest-level data that can be available in China for reflecting the demand for public EV charging stations. On the other hand, travel distance is often used to measure accessibility of EVCSs at fine levels within a city [14].
The G2SFCA method is executed using Arcpy within ArcGIS software (version 10.8). The G2SFCA takes the demand data and facility supply as inputs to calculate the spatial accessibility of EVCSs.
3.3. Spatial Pattern and Equity Methods
The global and local Moran’s I are employed to quantitatively analyze the spatial patterns of the accessibility of EVCSs [40]. The global Moran’s I can characterize the global degree of spatial autocorrelation for PV power plants with its value between −1 and 1. A higher global Moran’s I value indicates a stronger positive clustering, while a lower value means a more negative clustering. The global Moran’s I is calculated by
where is the accessibility of EVCSs for city , is the mean of , is the spatial weight between city and city , and is the number of spatial units (i.e., cities) indexed by and .
The local Moran’s I measures the local indicators of spatial autocorrelation (LISA) and it can uncover the local clusters for the accessibility of EVCSs [40]. The local Moran’s I evaluates the clustering and the statistical significance for the accessibility of EVCSs within each city [40]. It yields a value from −1 to 1 and it is easy to find clusters at a local level [40]. The local Moran’s I can be expressed as
The global and local Moran’s I are calculated with GeoDa software (version 1.12.1.161) in this study.
The Gini coefficient is a typical indicator in economics to illustrate the inequality in income between residents and it has been widely used to evaluate the spatial equity in various geoscience fields in past years [30,39]. It is adopted to evaluate the spatial equity of the accessibility of EVCSs. The Gini index is defined as the ratio of the area between the line of equality and the Lorenz curve [41]. The Gini index can be calculated as half of the relative mean absolute difference. The mean absolute difference is the average absolute difference of all pairs of items of the spatial units and the relative mean absolute difference is the mean absolute difference divided by the average. The Gini index for the accessibility of EVCSs can be computed by
The Gini index ranges from 0 to 1, with higher values (closer to 1) indicating greater inequity in accessibility of EVCSs and lower values (closer to 0) signifying greater equity. An alert of inequality is triggered when the Gini index exceeds 0.4, while values above 0.6 reflect high levels of inequality in accessibility of EVCSs.
The Gini index is computed using the Python programming language in this study.
4. Results
4.1. Spatial Pattern of EV Charging Stations
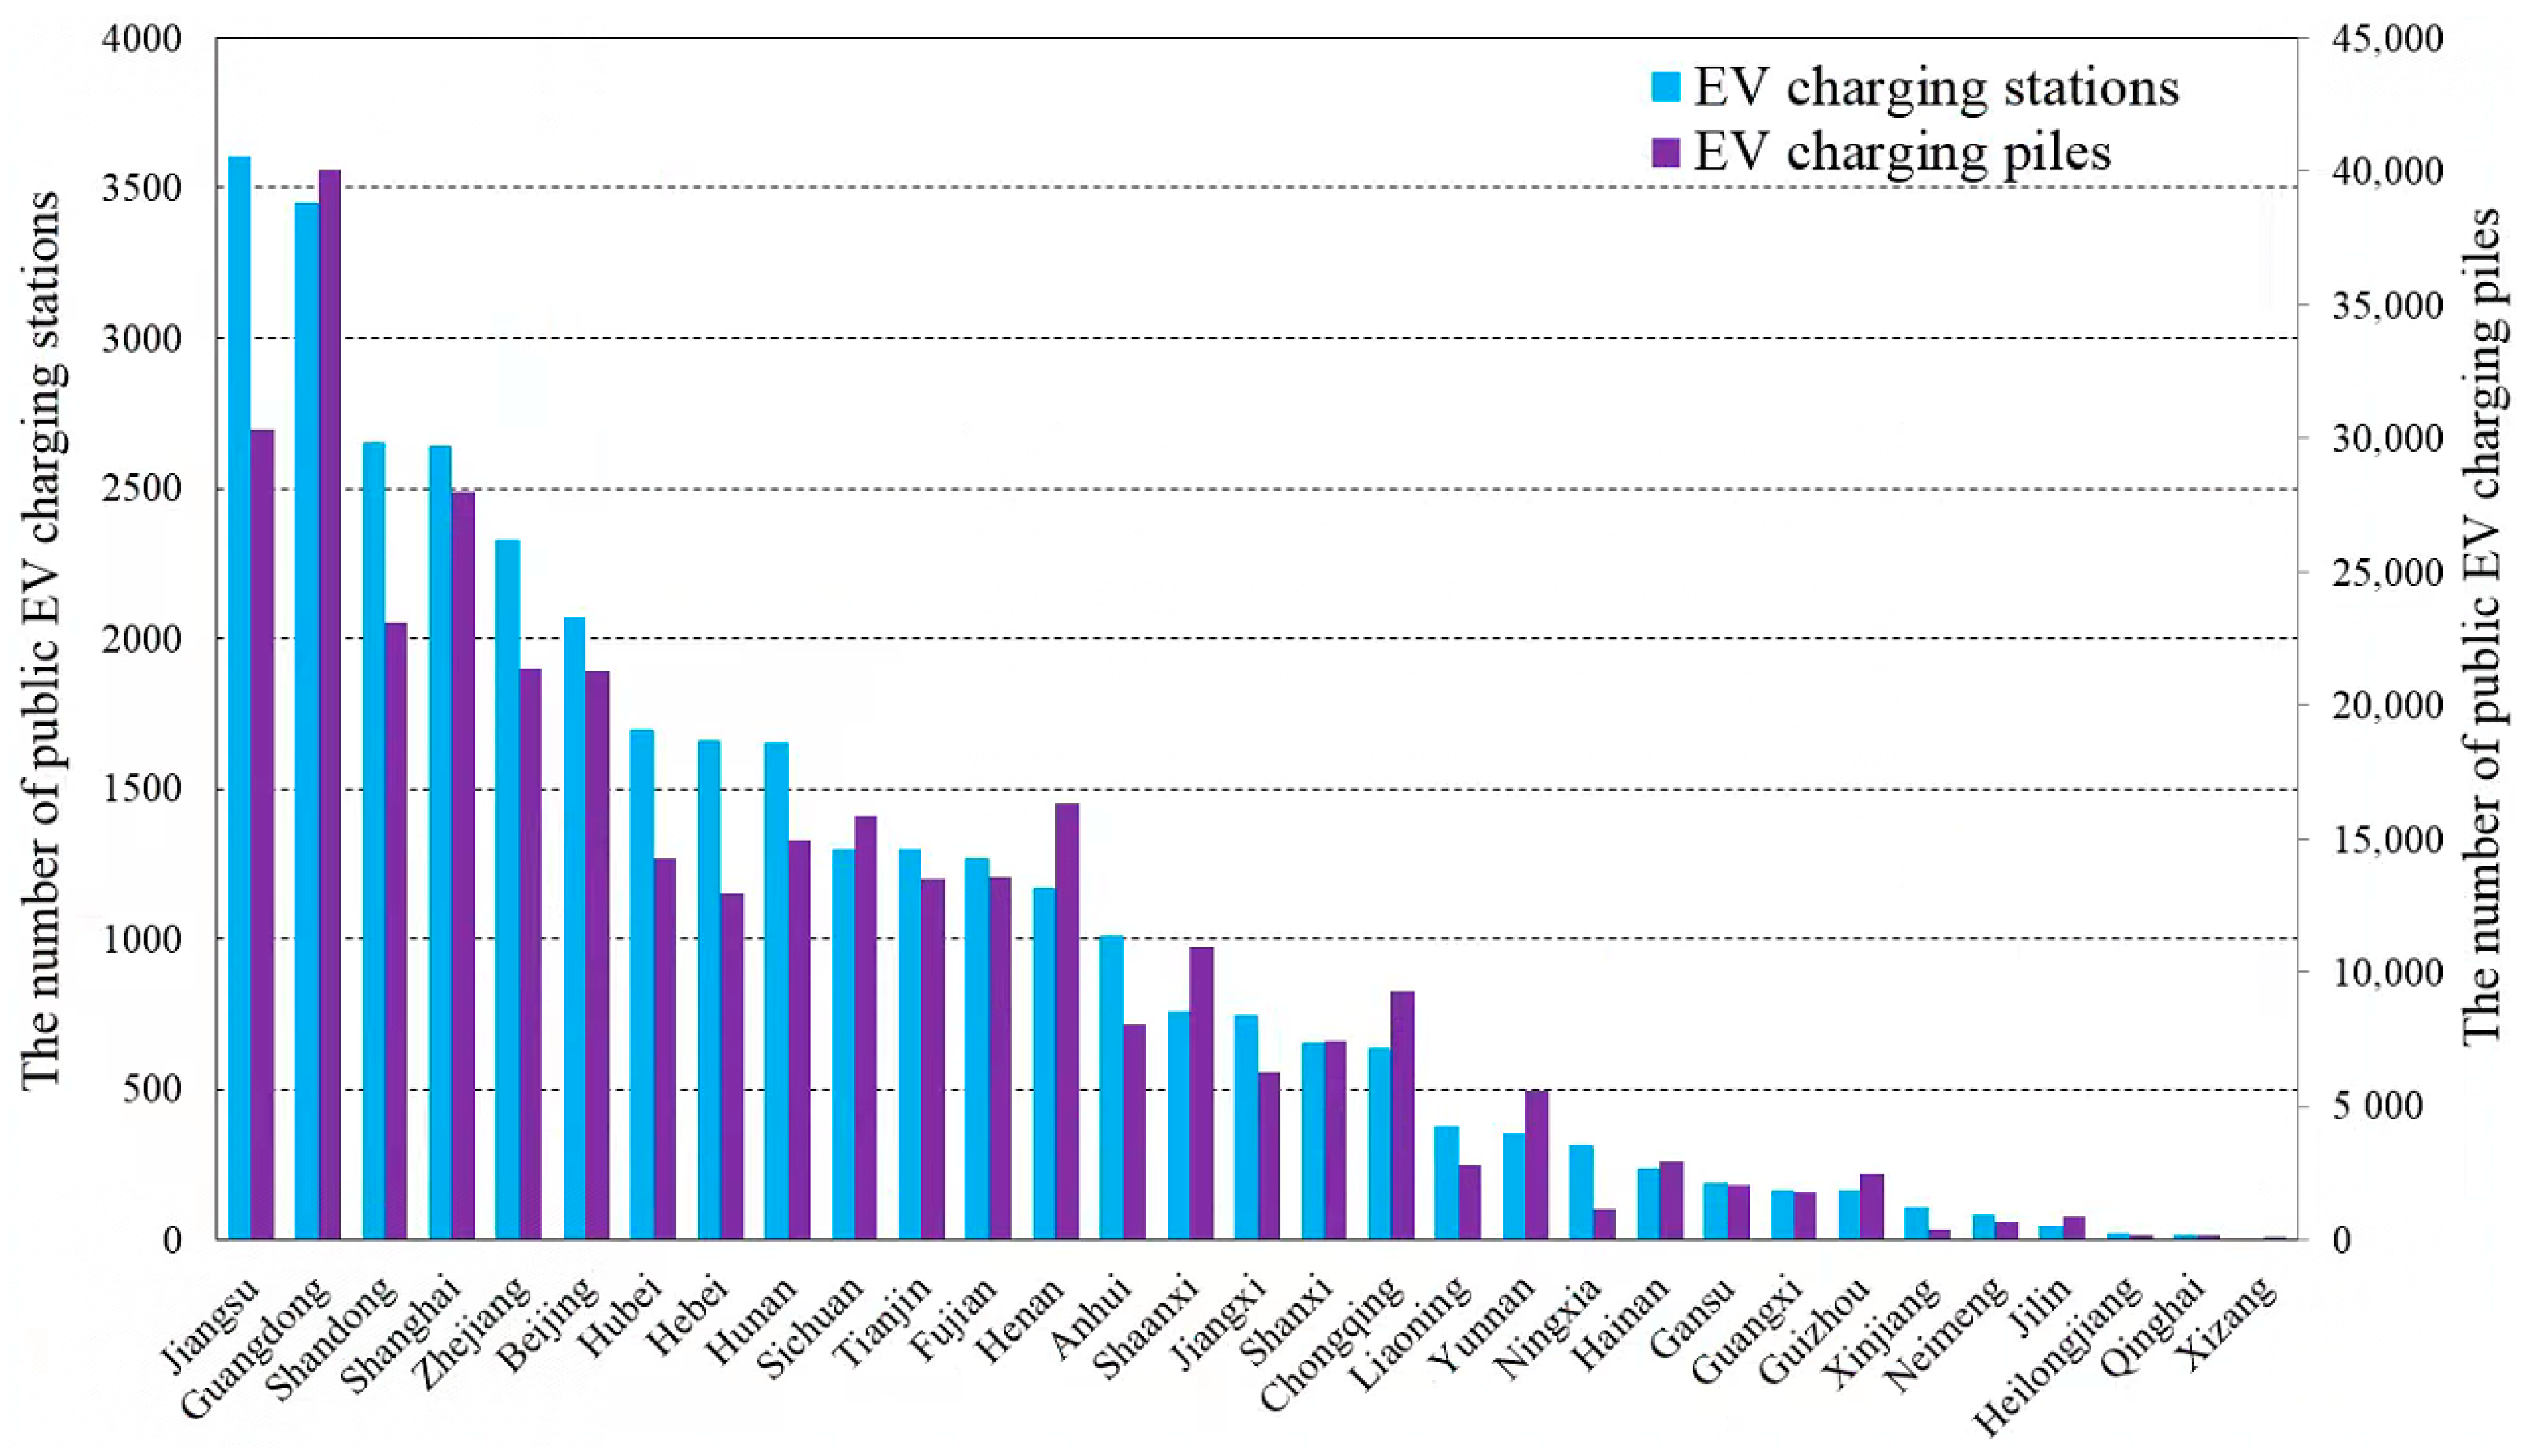
The spatial distribution of public EV charging stations in Figure 2a and the number within each province in Figure 4 show that most charging stations are distributed in the southeast area of the Huhuanyong line, southeast of which has over 90% of the population of China. It is of particular prominence in the three major urban agglomerations of Beijing–Tianjin–Hebei, Yangtze River Delta, and Pearl River Delta. Jiangsu province has the most charging stations while Guangdong province has the most charging piles, as shown in Figure 4. Jiangsu and Guangdong provinces both rank top two in the number of charging stations and charging piles. The global Moran’s I with queen contiguity weights was employed to analyze the spatial association of the number of EV charging stations; the value is 0.17, indicating a relatively significant spatial aggregation of EV charging stations. Overall, based on visual examination and the number of charging stations within each province, a notable spatial difference is observed, with most charging stations distributed in the southeast area of the Huhuanyong line, except for the northeast region and a high density of charging stations located in the eastern coastal regions from the core areas of Beijing–Tianjin–Hebei region to the core areas of Pearl River Delta region. Except high-density regions, Shanxi, Shaanxi, Henan, Anhui, Jiangxi, Hunan, Hubei, Chongqing, and Sichuan provinces have more scattered stations than other provinces.
Table 1 displays the number of charging stations and piles in the three regions. It shows that the eastern region of China has the largest number of charging stations and piles, followed by the central region, and the western region has the least number of charging stations and piles. This result is consistent with that obtained via visual inspection. Table 1 reveals that the number of charging piles is almost ten times the number of charging stations in the eastern and central regions. The eastern region of China has more than two times the charging stations and piles of the central region. The gaps between the east, center, and west are largely due to the early development of EVCS construction in the eastern region and the late promotion of EVCS construction in the western region. At the same time, regional development is another important reason for the spatial inequity in EVCSs because the eastern region has the best economic development, followed by the central and the western regions.
4.2. Non-Spatial Accessibility of EVCSs
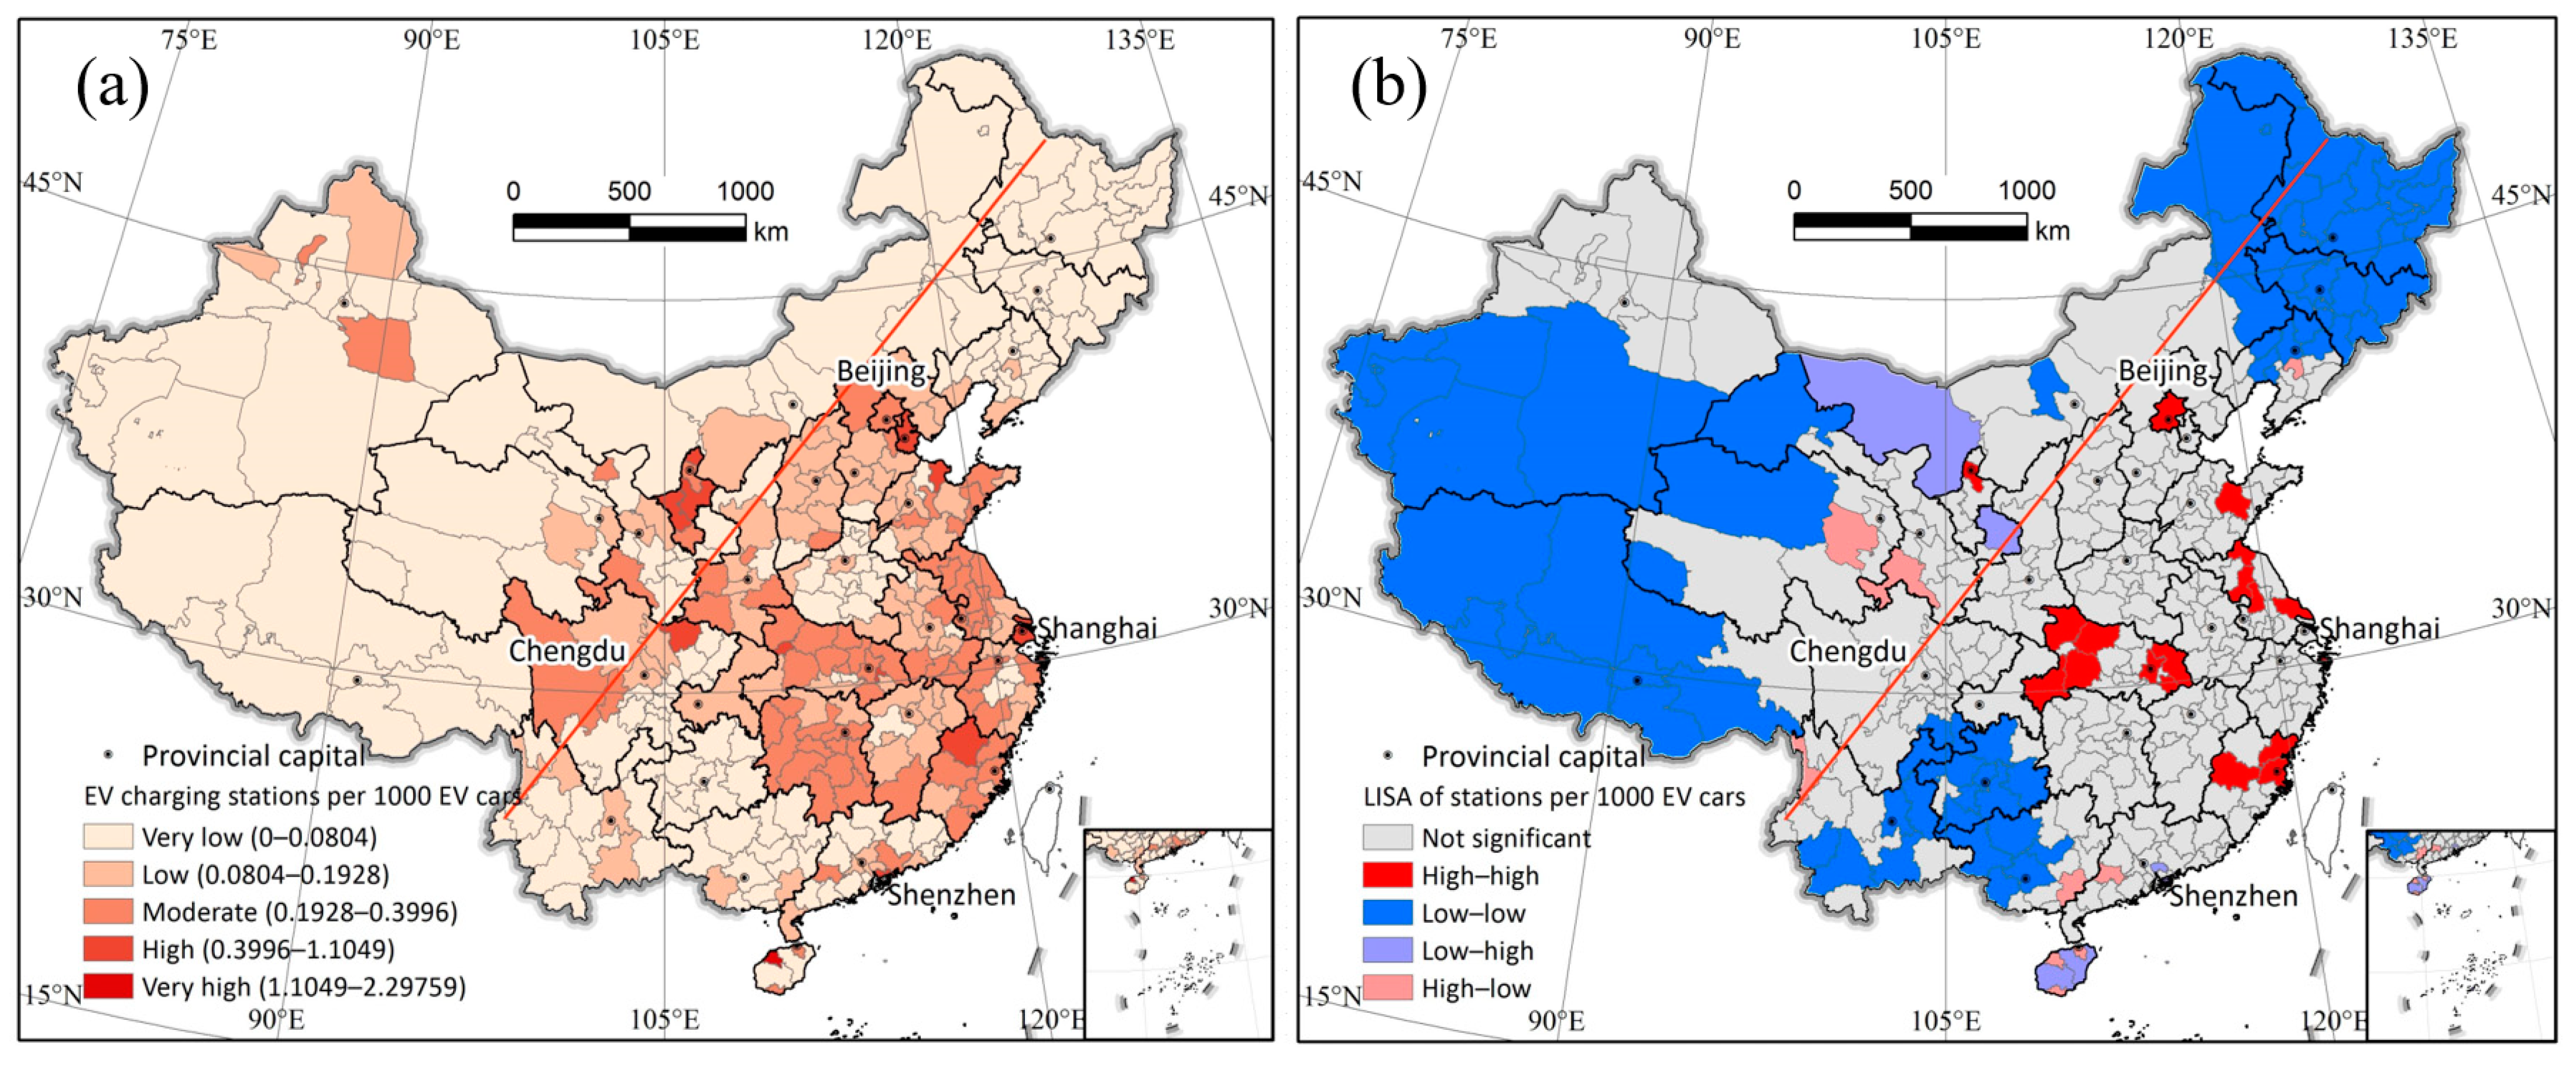
We calculated the EV charging stations per 1000 EV cars as a measurement of the non-spatial accessibility of EVCSs for each city, as shown in Figure 5. The non-spatial accessibility of EVCSs was classified into five levels (i.e., very low, low, moderate, high, and very high) using the natural break method in Figure 5a. It implies that cities with high and very high accessibility are mainly distributed in the eastern and central regions of China. The high-high clusters detected using LISA in Figure 5b are also distributed in these two regions. Most cities with the very-low level of accessibility are located in northeastern, northwestern, and southwestern China. From the perspective of non-spatial accessibility of EVCSs, the eastern region has the highest EV charging stations per 1000 EV cars, followed by the central and western regions in Figure 5.
4.3. Spatial Accessibility of EVCSs
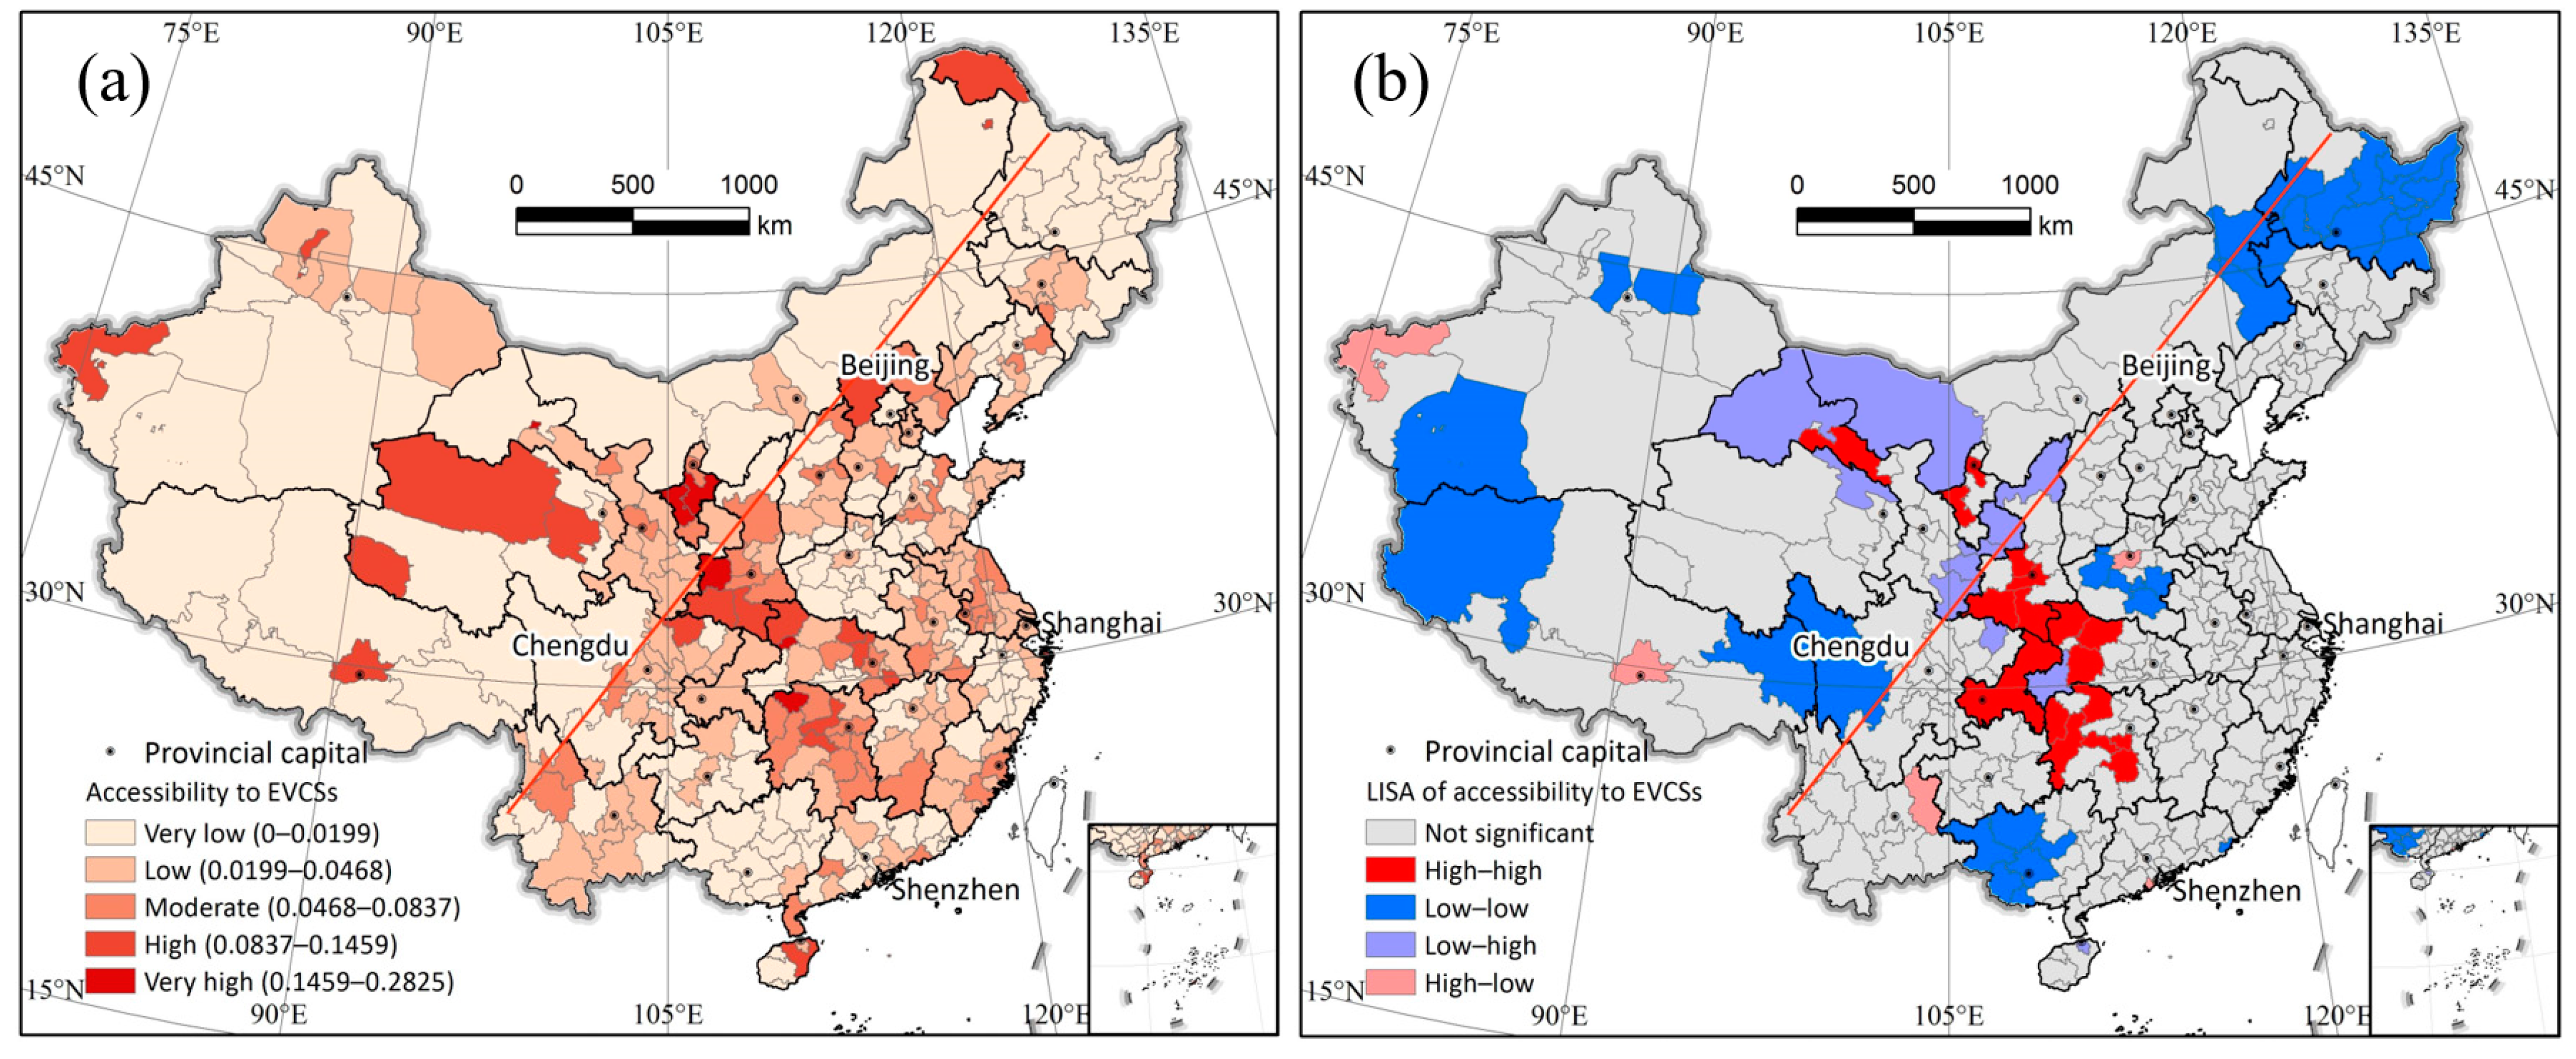
With G2SFCA, we estimated the city-level spatial accessibility of EVCSs and evaluated its LISA using the local Moran’s I, as shown in Figure 6. Spatial accessibility was also divided into five levels (i.e., very low, low, moderate, high, and very high) with the natural break method. The statistics of spatial accessibility are shown in Table 2 and the number of cities for different accessibility levels is displayed in Table 3.
(1) Overall, the distribution of accessibility of EVCSs according to G2SFCA shows a significant spatial disparity in Figure 6a. Cities with high and very high accessibility are mainly distributed in the central region of China, such as Hunan, Hubei, and Shaanxi provinces. The LISA result for accessibility of EVCSs in Figure 6b confirms the finding that most high-high clusters are distributed in the central region. Unexpectedly, most cities in the eastern coastal area with a high density of EV charging stations have a moderate level or low level, even a very-low level, of accessibility. Although a minority of EV charging stations are located in the northwest area of the Huhuanyong line, there are several cities with high and very high accessibility. The reason may be the different EV diffusion and EVCS development speeds in the three regions. EV diffusion in the eastern region of China is too rapid to keep pace with its EVCSs development, as indicated in Figure 2b. In contrast, the EVCS development in the central and western regions catches up with their EV penetration. However, most cities, in the eastern region in particular, still have a very low accessibility of EVCSs, indicating that the spatial equity of EVCSs urgently needs to be improved through the development of charging stations.
(2) Regions: Table 2 and Table 3 further confirm the visual findings in Figure 6. The maximum of the accessibility scores in the western region is the largest, followed by the central and eastern regions in Table 2. The mean of the accessibility scores in Table 2 implies that the central region is the highest, followed by the eastern and western regions. The coefficient of variation (CV), which is the ratio of the standard deviation to the mean, is calculated to quantitatively measure the disparity of accessibility in Table 2. It can be found that the western region has the largest disparity, followed by the central region, and the eastern region has the smallest disparity in accessibility of EVCSs. Table 3 shows that the cities with very low and low accessibility account for 46% and 33%, respectively. Cities with high and very high accessibility only account for 7%, suggesting that many cities should further promote the development of ECVSs in China.
4.4. Spatial Equity of EVCSs
The Gini index of the non-spatial and spatial accessibility of EVCSs, as shown in Table 4, reveals a substantially unequal distribution of the accessibility of EVCSs across both the whole of China and its three regions. All Gini indices exceed 0.4, with some even surpassing 0.6, signifying a pronounced inequality in EVCS accessibility. Notably, non-spatial accessibility exhibits a marginally greater level of inequality compared to spatial accessibility, as evident from its higher Gini index. Moreover, Table 4 underscores the regional variations in spatial inequity, with the western region exhibiting the highest inequity, followed by the central region, while the eastern region displays the lowest spatial inequity.
5. Discussion
5.1. Comparison between Non-Spatial and Spatial Accessibility of EVCSs
Usually, accessibility includes non-spatial and spatial measurements. In this study, the EV charging stations per 1000 EV cars was calculated as the non-spatial accessibility of EVCSs. The spatial accessibility of EVCSs was quantified using G2SFCA within our proposed framework. Comparing the two forms of accessibility is useful to explore their difference. As shown in Figure 5 and Figure 6, the western region has a similar pattern in the non-spatial and spatial accessibility of EVCSs, in that most cities have low and very-low levels of accessibility. The central region exhibits slightly more cities with high and very-high levels of spatial accessibility compared to non-spatial accessibility. In contrast, in the eastern region, more cities have high and very-high levels of non-spatial accessibility than spatial accessibility. This means that the spatial pattern of non-spatial accessibility aligns more closely with the economic development. However, it is crucial to note that non-spatial accessibility fails to account for spatial impedance, which greatly impacts the convenience of EV charging. The spatial accessibility measured using our proposed framework considers spatial impedance, offering a more reasonable assessment of EVCS accessibility. It further implies that the EV charging stations may have an unreasonable layout and need a reevaluation in the eastern region in spite of their high density.
5.2. Advantages of the Proposed Framework
This study focuses on measuring the large-scale spatial accessibility of EVCSs to provide macroscopic knowledge of EV charging stations and EV diffusion in China. It is different from previous measurements of access to public EVCSs, which are usually examined within individual cities [14,34]. The community and grid cell within a city are often used as the units to calculate the accessibility of EVCSs. The spatial accessibility of EVCSs within a city is beneficial to uncover the accessibility inequity and spatial mismatch between EV ownership and EVCSs, which is useful for the layout optimization of EV charging stations within a city [9,11,44]. In contrast, the city-level spatial accessibility of EVCSs in this study intends to provide a macroscopic understanding across China for policymakers and urban planners. The findings from the city-level spatial accessibility of EVCSs in China is helpful for policymakers to adjust and optimize the issued subsidies and strategic policies to maintain the spatial match between EV ownership and access to EVCSs, which can further play a key role in achieving the carbon peak and carbon neutrality goals in China.
Due to a lack of data, most spatial accessibility measurements of public services take population as the demand in calculating accessibility [22,30,31,36,38]. For public EVCSs, Park, Kang, Goldberg, and Hammond [14] adopted the float population within grids as demand in Seoul and Li, Luo, and Song [34] employed the population within communities as demand in Beijing to measure the accessibility of EVCSs. Such measured accessibility of public services is regarded as the potential accessibility, as the population used is not the real demand in measuring accessibility [25]. Here, we collected the EV ownership data within each city as the real demand to examine the accessibility of public EVCSs, which can be considered the observed accessibility [25]. The EV ownership data can characterize the real demand of EVCSs instead of the potential demand by population. Thus, the calculated spatial accessibility of EVCSs in this study is a reliable and accurate measurement for EV policymaking in China.
5.3. Policy Implications for EVCSs
Some policy implications can be proposed from this study for China. First, according to our findings, the eastern region of China should enhance the strategy policies and subsidies for the promotion of EVCSs because many cities including the first-tier cities have low and very low accessibility. The eastern region of China has the best economic development and the EV diffusion speed is very fast, according to Figure 2b. Yet, the EVCS development in this region does not catch up with EV diffusion. Especially, despite the relatively high density of EV charging stations, the deployment of EV charging stations should be reevaluated to provide guidelines for the spatial optimization of EV charging stations in the eastern region. Second, the strategy policies and subsidies in the central region can be adjusted to promote EV diffusion, as this region has more cities with high and very high accessibility. Third, the strategy policies and subsidies for EVCSs and EV diffusion can be phased out in the western region, as it has several cities with high and very high accessibility. Although the western region has relatively better accessibility, the EV number is significantly lower than other regions. The crucial reason may be that the relatively low temperature in the western region significantly decreases the range of EVs. Last, the future strategy policies and subsidies in different regions should pay attention to the spatial equity of EVCS accessibility, because the three regions and the whole of China exhibit significant spatial inequity in the accessibility of EVCSs, as shown in Table 4.
5.4. Limitations
Despite our results, this study still has its limitations. We only examined the city-level spatial accessibility of EVCSs in China, as only city-level real demand (i.e., EV ownership) for EVCSs is available across China at a large scale. The finer-level (e.g., county and grid) accessibility of EVCSs within cities can be examined using potential EV ownership data at finer levels in the future. The finer-level policy implications can be drawn for different regions.
6. Conclusions
In this study, we developed an applicable accessibility measurement framework to capture the spatial characteristics of EVCSs. The developed framework was applied to a case study in China to measure the city-level accessibility of EVCSs and the characteristics of accessibility were explored in different regions. The results show that the spatial distribution of EV charging stations is highly consistent with the Huhuanyong line, except for northeastern China, which has a low density of charging stations due to the cold weather. The eastern region has the highest density of EV charging stations, followed by the central region, and the western region has the lowest density of EV charging stations. However, the spatial accessibility of EVCSs shows a different spatial pattern. Most cities in the eastern region exhibit low spatial accessibility, while cities with high and very-high levels of spatial accessibility are mainly distributed in the central region. Furthermore, significant spatial inequity in the accessibility of EVCSs is found across all three regions and the whole of China and it has a similar pattern to the distribution of EV charging stations in the three regions. According to the findings, several policy implications were proposed for the Chinese government to coordinate the EVCS development and EV diffusion to realize the carbon peak and carbon neutrality goals. This study also offers insights into forthcoming EVCS accessibility measurement in other study areas.
Author Contributions
Conceptualization, Yuehong Chen; methodology, Yu Chen and Yuehong Chen; formal analysis, Yu Chen and Yuqi Lu; writing—original draft preparation, Yu Chen and Yuehong Chen; writing—review and editing, Yuqi Lu. All authors have read and agreed to the published version of the manuscript.
Funding
This research was funded in part by the National Natural Science Foundation of China [No. 42171173, No. 42071315, and No. 42171171] and in part by the 111 Program of China (No. D19002).
Institutional Review Board Statement
Not applicable.
Informed Consent Statement
Not applicable.
Data Availability Statement
All data relevant to the study are presented in the article. For further inquiries regarding the reuse of data, please contact the corresponding authors.
Conflicts of Interest
The authors declare no conflict of interest.
References
- McGlade, C.; Ekins, P. The geographical distribution of fossil fuels unused when limiting global warming to 2°. Nature 2015, 517, 187–190. [Google Scholar] [CrossRef]
- Zhao, X.; Ma, X.; Chen, B.; Shang, Y.; Song, M. Challenges toward carbon neutrality in china: Strategies and countermeasures. Resour. Conserv. Recycl. 2022, 176, 105959. [Google Scholar] [CrossRef]
- Duan, H.; Zhou, S.; Jiang, K.; Bertram, C.; Harmsen, M.; Kriegler, E.; van Vuuren, D.P.; Wang, S.; Fujimori, S.; Tavoni, M. Assessing china’s efforts to pursue the 1.5 °c warming limit. Science 2021, 372, 378–385. [Google Scholar] [CrossRef]
- Fang, K.; Li, C.; Tang, Y.; He, J.; Song, J. China’s pathways to peak carbon emissions: New insights from various industrial sectors. Appl. Energy 2022, 306, 118039. [Google Scholar] [CrossRef]
- Zhou, N.; Price, L.; Yande, D.; Creyts, J.; Khanna, N.; Fridley, D.; Lu, H.; Feng, W.; Liu, X.; Hasanbeigi, A. A roadmap for china to peak carbon dioxide emissions and achieve a 20% share of non-fossil fuels in primary energy by 2030. Appl. Energy 2019, 239, 793–819. [Google Scholar] [CrossRef]
- IEA. Global Ev Outlook: Accelerating Ambitions Despite the Pandemic. 2021. Available online: https://iea.blob.core.windows.net/assets/ed5f4484-f556-4110-8c5c-4ede8bcba637/GlobalEVOutlook2021.pdf (accessed on 31 December 2022).
- Sun, M.; Shao, C.; Zhuge, C.; Wang, P.; Yang, X.; Wang, S. Uncovering travel and charging patterns of private electric vehicles with trajectory data: Evidence and policy implications. Transportation 2022, 49, 1409–1439. [Google Scholar] [CrossRef]
- Funke, S.Á.; Sprei, F.; Gnann, T.; Plötz, P. How much charging infrastructure do electric vehicles need? A review of the evidence and international comparison. Transp. Res. Part D Transp. Environ. 2019, 77, 224–242. [Google Scholar] [CrossRef]
- Pagany, R.; Ramirez Camargo, L.; Dorner, W. A review of spatial localization methodologies for the electric vehicle charging infrastructure. Int. J. Sustain. Transp. 2019, 13, 433–449. [Google Scholar] [CrossRef]
- Hardman, S.; Jenn, A.; Tal, G.; Axsen, J.; Beard, G.; Daina, N.; Figenbaum, E.; Jakobsson, N.; Jochem, P.; Kinnear, N. A review of consumer preferences of and interactions with electric vehicle charging infrastructure. Transp. Res. Part D Transp. Environ. 2018, 62, 508–523. [Google Scholar] [CrossRef]
- Pan, L.; Yao, E.; Yang, Y.; Zhang, R. A location model for electric vehicle (ev) public charging stations based on drivers’ existing activities. Sustain. Cities Soc. 2020, 59, 102192. [Google Scholar] [CrossRef]
- Hansen, W.G. How accessibility shapes land use. J. Am. Inst. Plan. 1959, 25, 73–76. [Google Scholar] [CrossRef]
- Chen, Y.; Jin, F.; Lu, Y.; Chen, Z.; Yang, Y. Development history and accessibility evolution of land transportation network in beijing-tianjin-hebei region over the past century. J. Geogr. Sci. 2018, 28, 1500–1518. [Google Scholar] [CrossRef]
- Park, J.; Kang, J.-Y.; Goldberg, D.W.; Hammond, T.A. Leveraging temporal changes of spatial accessibility measurements for better policy implications: A case study of electric vehicle (ev) charging stations in seoul, south korea. Int. J. Geogr. Inf. Sci. 2022, 36, 1185–1204. [Google Scholar] [CrossRef]
- Jin, F.; Wang, C.; Li, X.; Wang, J.E. China’s regional transport dominance: Density, proximity, and accessibility. J. Geogr. Sci. 2010, 20, 295–309. [Google Scholar] [CrossRef]
- Zhang, L.; Lu, Y. Regional accessibility of land traffic network in the yangtze river delta. J. Geogr. Sci. 2007, 17, 351–364. [Google Scholar] [CrossRef]
- Chen, X.; Jia, P. A comparative analysis of accessibility measures by the two-step floating catchment area (2sfca) method. Int. J. Geogr. Inf. Sci. 2019, 33, 1739–1758. [Google Scholar] [CrossRef]
- Song, Y.; Tan, Y.; Song, Y.; Wu, P.; Cheng, J.C.; Kim, M.J.; Wang, X. Spatial and temporal variations of spatial population accessibility to public hospitals: A case study of rural–urban comparison. GIScience Remote Sens. 2018, 55, 718–744. [Google Scholar] [CrossRef]
- Huang, J.; Levinson, D.; Wang, J.; Zhou, J.; Wang, Z.-J. Tracking job and housing dynamics with smartcard data. Proc. Natl. Acad. Sci. USA 2018, 115, 12710–12715. [Google Scholar] [CrossRef] [PubMed]
- Chen, Y.; Li, Y.; Wu, G.; Zhang, F.; Zhu, K.; Xia, Z.; Chen, Y. Exploring spatiotemporal accessibility of urban fire services using real-time travel time. Int. J. Environ. Res. Public Health 2021, 18, 4200. [Google Scholar] [CrossRef]
- Mao, K.; Chen, Y.; Wu, G.; Huang, J.; Yang, W.; Xia, Z. Measuring spatial accessibility of urban fire services using historical fire incidents in nanjing, china. ISPRS Int. J. Geo-Inf. 2020, 9, 585. [Google Scholar] [CrossRef]
- McGrail, M.R.; Humphreys, J.S. Measuring spatial accessibility to primary health care services: Utilising dynamic catchment sizes. Appl. Geogr. 2014, 54, 182–188. [Google Scholar] [CrossRef]
- Wang, F. From 2sfca to i2sfca: Integration, derivation and validation. Int. J. Geogr. Inf. Sci. 2021, 35, 628–638. [Google Scholar] [CrossRef] [PubMed]
- Tao, Z.; Cheng, Y. Modelling the spatial accessibility of the elderly to healthcare services in beijing, china. Environ. Plan. B Urban Anal. City Sci. 2019, 46, 1132–1147. [Google Scholar] [CrossRef]
- Wang, J.; Du, F.; Huang, J.; Liu, Y. Access to hospitals: Potential vs. Observed. Cities 2020, 100, 102671. [Google Scholar] [CrossRef]
- Langford, M.; Higgs, G.; Fry, R. Multi-modal two-step floating catchment area analysis of primary health care accessibility. Health Place 2016, 38, 70–81. [Google Scholar] [CrossRef]
- Polzin, P.; Borges, J.; Coelho, A. An extended kernel density two-step floating catchment area method to analyze access to health care. Environ. Plan. B Plan. Des. 2014, 41, 717–735. [Google Scholar] [CrossRef]
- Ni, J.; Liang, M.; Lin, Y.; Wu, Y.; Wang, C. Multi-mode two-step floating catchment area (2sfca) method to measure the potential spatial accessibility of healthcare services. ISPRS Int. J. Geo-Inf. 2019, 8, 236. [Google Scholar] [CrossRef]
- Li, L.; Du, Q.; Ren, F.; Ma, X. Assessing spatial accessibility to hierarchical urban parks by multi-types of travel distance in shenzhen, china. Int. J. Environ. Res. Public Health 2019, 16, 1038. [Google Scholar] [CrossRef]
- Lan, T.; Liu, Y.; Huang, G.; Corcoran, J.; Peng, J. Urban green space and cooling services: Opposing changes of integrated accessibility and social equity along with urbanization. Sustain. Cities Soc. 2022, 84, 104005. [Google Scholar] [CrossRef]
- Hu, L.; Zhao, C.; Wang, M.; Su, S.; Weng, M.; Wang, W. Dynamic healthy food accessibility in a rapidly urbanizing metropolitan area: Socioeconomic inequality and relative contribution of local factors. Cities 2020, 105, 102819. [Google Scholar] [CrossRef]
- Dai, D.; Wang, F. Geographic disparities in accessibility to food stores in southwest mississippi. Environ. Plan. B Plan. Des. 2011, 38, 659–677. [Google Scholar] [CrossRef]
- Wang, L.; Zhang, W.; Duan, X. Understanding accessibility changes from the development of a high-speed rail network in the yangtze river delta, china: Speed increases and distance deductions. Appl. Spat. Anal. Policy 2019, 12, 1011–1029. [Google Scholar] [CrossRef]
- Li, G.; Luo, T.; Song, Y. Spatial equity analysis of urban public services for electric vehicle charging—Implications of chinese cities. Sustain. Cities Soc. 2022, 76, 103519. [Google Scholar] [CrossRef]
- Luo, W.; Wang, F. Measures of spatial accessibility to health care in a gis environment: Synthesis and a case study in the chicago region. Environ. Plan. B Plan. Des. 2003, 30, 865–884. [Google Scholar] [CrossRef] [PubMed]
- Kanuganti, S.; Sarkar, A.K.; Singh, A.P. Evaluation of access to health care in rural areas using enhanced two-step floating catchment area (e2sfca) method. J. Transp. Geogr. 2016, 56, 45–52. [Google Scholar] [CrossRef]
- Xing, L.; Liu, Y.; Wang, B.; Wang, Y.; Liu, H. An environmental justice study on spatial access to parks for youth by using an improved 2sfca method in wuhan, china. Cities 2020, 96, 102405. [Google Scholar] [CrossRef]
- Dai, D. Black residential segregation, disparities in spatial access to health care facilities, and late-stage breast cancer diagnosis in metropolitan detroit. Health Place 2010, 16, 1038–1052. [Google Scholar] [CrossRef] [PubMed]
- Guo, S.; Song, C.; Pei, T.; Liu, Y.; Ma, T.; Du, Y.; Chen, J.; Fan, Z.; Tang, X.; Peng, Y. Accessibility to urban parks for elderly residents: Perspectives from mobile phone data. Landsc. Urban Plan. 2019, 191, 103642. [Google Scholar] [CrossRef]
- Anselin, L. Local indicators of spatial association—Lisa. Geogr. Anal. 1995, 27, 93–115. [Google Scholar] [CrossRef]
- Rogerson, P.A. The gini coefficient of inequality: A new interpretation. Lett. Spat. Resour. Sci. 2013, 6, 109–120. [Google Scholar] [CrossRef]
- Shi, K.; Wu, Y.; Liu, S.; Chen, Z.; Huang, C.; Cui, Y. Mapping and evaluating global urban entities (2000–2020): A novel perspective to delineate urban entities based on consistent nighttime light data. GIScience Remote Sens. 2023, 60, 2161199. [Google Scholar] [CrossRef]
- Long, Y.; Han, H.; Tu, Y.; Shu, X. Evaluating the effectiveness of urban growth boundaries using human mobility and activity records. Cities 2015, 46, 76–84. [Google Scholar] [CrossRef]
- Chen, Y.; Wu, G.; Chen, Y.; Xia, Z. Spatial location optimization of fire stations with traffic status and urban functional areas. Appl. Spat. Anal. Policy 2023, 16, 771–788. [Google Scholar] [CrossRef]
Figure 1.
Development of EVCSs in China (2006–2021).

Figure 2.
Experimental data. (a) Spatial distribution of public EV charging stations and (b) city-level ownership data of EVs.
Figure 2.
Experimental data. (a) Spatial distribution of public EV charging stations and (b) city-level ownership data of EVs.

Figure 3.
Research framework.

Figure 4.
EV charging stations and piles in each province.

Figure 5.
EV charging stations per 1000 EV cars (a) and their LISA (b).

Figure 6.
City-level spatial accessibility of EVCSs (a) and its LISA in China (b).


Table 1.
Statistics of public EV charging stations and piles in different regions.
| Stations | Piles | Rate of Stations (%) | Rate of Piles (%) | |
|---|---|---|---|---|
| Eastern region | 22,600 | 217,973 | 69.10 | 66.31 |
| Central region | 9481 | 107,186 | 28.99 | 32.61 |
| Western region | 623 | 3350 | 1.91 | 1.08 |
| In Total | 32,704 | 328,709 | 100 | 100 |
Table 2.
Statistics of the city-level spatial accessibility of EVCSs in China.
| Minimum | Maximum | Mean | Standard Deviation | Coefficient of Variation | |
|---|---|---|---|---|---|
| Eastern region | 0 | 0.133 | 0.032 | 0.024 | 0.75 |
| Central region | 0 | 0.228 | 0.033 | 0.036 | 1.09 |
| Western region | 0 | 0.283 | 0.029 | 0.054 | 1.86 |
| Whole | 0 | 0.283 | 0.032 | 0.036 | 1.125 |
Table 3.
Number of cities with different levels of spatial accessibility of EVCSs in China.
| Very Low | Low | Moderate | High | Very High | |
|---|---|---|---|---|---|
| Eastern region | 45 | 49 | 22 | 2 | 0 |
| Central region | 80 | 57 | 24 | 10 | 4 |
| Western region | 35 | 7 | 2 | 6 | 3 |
| Whole | 160 | 113 | 48 | 18 | 7 |
Table 4.
Gini index of accessibility of EVCSs in China.
| Eastern Region | Central Region | Western Region | Whole | |
|---|---|---|---|---|
| Non-spatial accessibility | 0.4670 | 0.5463 | 0.6930 | 0.5418 |
| Spatial accessibility | 0.4011 | 0.5266 | 0.748 | 0.52843 |
Disclaimer/Publisher’s Note: The statements, opinions and data contained in all publications are solely those of the individual author(s) and contributor(s) and not of MDPI and/or the editor(s). MDPI and/or the editor(s) disclaim responsibility for any injury to people or property resulting from any ideas, methods, instructions or products referred to in the content. |
© 2023 by the authors. Licensee MDPI, Basel, Switzerland. This article is an open access article distributed under the terms and conditions of the Creative Commons Attribution (CC BY) license (https://creativecommons.org/licenses/by/4.0/).
Share and Cite
MDPI and ACS Style
Chen, Y.; Chen, Y.; Lu, Y. Spatial Accessibility of Public Electric Vehicle Charging Services in China. ISPRS Int. J. Geo-Inf. 2023, 12, 478. https://doi.org/10.3390/ijgi12120478
AMA Style
Chen Y, Chen Y, Lu Y. Spatial Accessibility of Public Electric Vehicle Charging Services in China. ISPRS International Journal of Geo-Information. 2023; 12(12):478. https://doi.org/10.3390/ijgi12120478
Chicago/Turabian StyleChen, Yu, Yuehong Chen, and Yuqi Lu. 2023. "Spatial Accessibility of Public Electric Vehicle Charging Services in China" ISPRS International Journal of Geo-Information 12, no. 12: 478. https://doi.org/10.3390/ijgi12120478
Note that from the first issue of 2016, this journal uses article numbers instead of page numbers. See further details here.