Article

A Comprehensive Evaluation of Machine Learning and Classical Approaches for Spaceborne Active-Passive Fusion Bathymetry of Coral Reefs

1
School of Geography and Ocean Science, Nanjing University, Nanjing 210023, China
2
Collaborative Innovation Center for the South Sea Studies, Nanjing University, Nanjing 210023, China
3
Jiangsu Provincial Key Laboratory of Geographic Information Science and Technology, Nanjing University, Nanjing 210023, China
4
Collaborative Innovation Center of Novel Software Technology and Industrialization, Nanjing University, Nanjing 210023, China
*
Author to whom correspondence should be addressed.
ISPRS Int. J. Geo-Inf. 2023, 12(9), 381; https://doi.org/10.3390/ijgi12090381
Submission received: 11 July 2023 / Revised: 11 September 2023 / Accepted: 15 September 2023 / Published: 19 September 2023
(This article belongs to the Topic Advances in Earth Observation and Geosciences)

Abstract

:
Satellite-derived bathymetry (SDB) techniques are increasingly valuable for deriving high-quality bathymetric maps of coral reefs. Investigating the performance of the related SDB algorithms in purely spaceborne active–passive fusion bathymetry contributes to formulating reliable bathymetric strategies, particularly for areas such as the Spratly Islands, where in situ observations are exceptionally scarce. In this study, we took Anda Reef as a case study and evaluated the performance of eight common SDB approaches by integrating Sentinel-2 images with Ice, Cloud, and Land Elevation Satellite-2 (ICESat-2). The bathymetric maps were generated using two classical and six machine-learning algorithms, which were then validated with measured sonar data. The results illustrated that all models accurately estimated the depth of coral reefs in the 0–20 m range. The classical algorithms (Lyzenga and Stumpf) exhibited a mean absolute error (MAE), root mean square error (RMSE), and mean absolute percentage error (MAPE) of less than 0.990 m, 1.386 m, and 11.173%, respectively. The machine learning algorithms generally outperformed the classical algorithms in accuracy and bathymetric detail, with a coefficient of determination (R2) ranging from 0.94 to 0.96 and an RMSE ranging from 1.034 m to 1.202 m. The multilayer perceptron (MLP) achieved the highest accuracy and consistency with an RMSE of as low as 1.034 m, followed by the k-nearest neighbor (KNN) (1.070 m). Our results provide a practical reference for selecting SDB algorithms to accurately obtain shallow water bathymetry in subsequent studies.

1. Introduction

According to the International Hydrographic Organization (IHO), more than half of the shallow marine waters of the world remain uncharted or poorly explored [1,2,3]. Shallow water regions, as zones of contact between the sea and the land or surrounding islands, maintain the viability and richness of marine ecosystems [4,5,6]. Accurate bathymetric mapping is essential for various applications, including climate change monitoring, marine navigation, habitat monitoring, and risk assessment [7,8,9,10]. Especially in the South China Sea (SCS), where over 200 coral reefs or islands are under the dual pressure of climate change and human activities [11,12,13]. Therefore, shallow water bathymetric information in the region must be urgently surveyed.
The two of the most commonly applied shallow water topographic methods are (1) the single or multibeam echo sounding based on a ship-based platform and (2) the bathymetric lidar data acquired from airborne systems, which can provide accurate measurements [14,15]. However, these approaches may not be applicable in remote, protected, or disputed sea areas that cannot be easily reached by ships and aircraft [16,17]. In particular, any in situ measurements of coral reefs are challenging for the remote Spratly Islands [11,18], which contain the elements of the present political situation. Currently, in situ measurements for acquiring bathymetric maps in remote coral reefs can be replaced using satellite-derived bathymetry (SDB) [19,20,21,22].
There are three categories for shallow water bathymetric mapping using SDB models: physics-based, empirical-based, and machine-learning approaches [23,24,25]. The physics-based strategies rely on the theory of radiation transmission, which describes the physical correlations among depth, inherent optical properties, bottom albedo, and spectral information [26]. These methods require no prior knowledge of water depth but are generally computationally expensive [18]. The linear band model [27] and the band ratio model [28] are widely used empirical models for bathymetric inversion. The empirical methods combining Sentinel-2 and Ice, Cloud, and Land Elevation Satellite-2 (ICESat-2) data have recently become a hot research topic [4,13,29,30].
Furthermore, many recent works suggested applying flexible machine-learning techniques to enhance the efficiency and accuracy of bathymetry retrieval in transparent waters [16,25,30,31,32,33]. Susa [25] demonstrated the performance of random forest (RF), and extreme gradient boosting (XGBoost) outperformed traditional techniques in nearshore bathymetry. Duan et al. assessed the bathymetric potential of multilayer perceptron (MLP), support vector machine (SVM), and RF and found that the MLP is superior [15]. Xie et al. employed the SVM, BP, and RF to achieve an overall root mean square error (RMSE) below 1.5 m [34]. Other models, including the light gradient boosting machine (LGBM) [35] and the k-nearest neighbor (KNN) [36], were also applied to SDB methods and produced reliable bathymetric predictions. However, few studies adequately quantified the relative accuracy and reliability between numerous machine learning and classical approaches under the same scenarios. Especially for coral reefs bathymetry in the Spratly Islands, the choice of bathymetry inversion methods in the satellite-derived active-passive fusion still lacks scientific references, primarily due to the lack of field observations.
Therefore, we evaluated the performance of two classical models (Lyzenga and Stumpf) and six machine learning models (LGBM, XGBoost, RF, SVM, KNN, and MLP) for bathymetry estimation, using Anda Reef as a case study. First, the time series Sentinel-2 images were synthesized by applying a median filter on the Google Earth Engine (GEE) platform. Second, the bathymetric points, which were accurately obtained from the ICESat-2 via manual interactive annotation, were used to train the water depth retrieval model. Finally, benefiting from in situ data, we systematically evaluated the bathymetric performance of classical and machine learning models using both visual and quantitative statistical parameters. We also discussed the performance differences between the inversion models, as well as the application perspectives and potential limitations of SDB. This work showed the potential of utilizing only satellite data for bathymetry estimation in the Spratly Islands, providing a valuable reference for selecting appropriate SDB algorithms in optically shallow water regions.
The main highlights of this study can be summarized as follows: (1) We estimated coral reef bathymetry by fusing ICESat-2 and Sentinel-2 data, and further validated the potential of spaceborne bathymetry in the Spratly Islands using valuable sonar measurement data. (2) We conducted a comprehensive assessment of eight prevalent SDB methods, including two classical algorithms and six machine learning algorithms, which provide practical references for future research when choosing SDB algorithms.

2. Study Area and Data
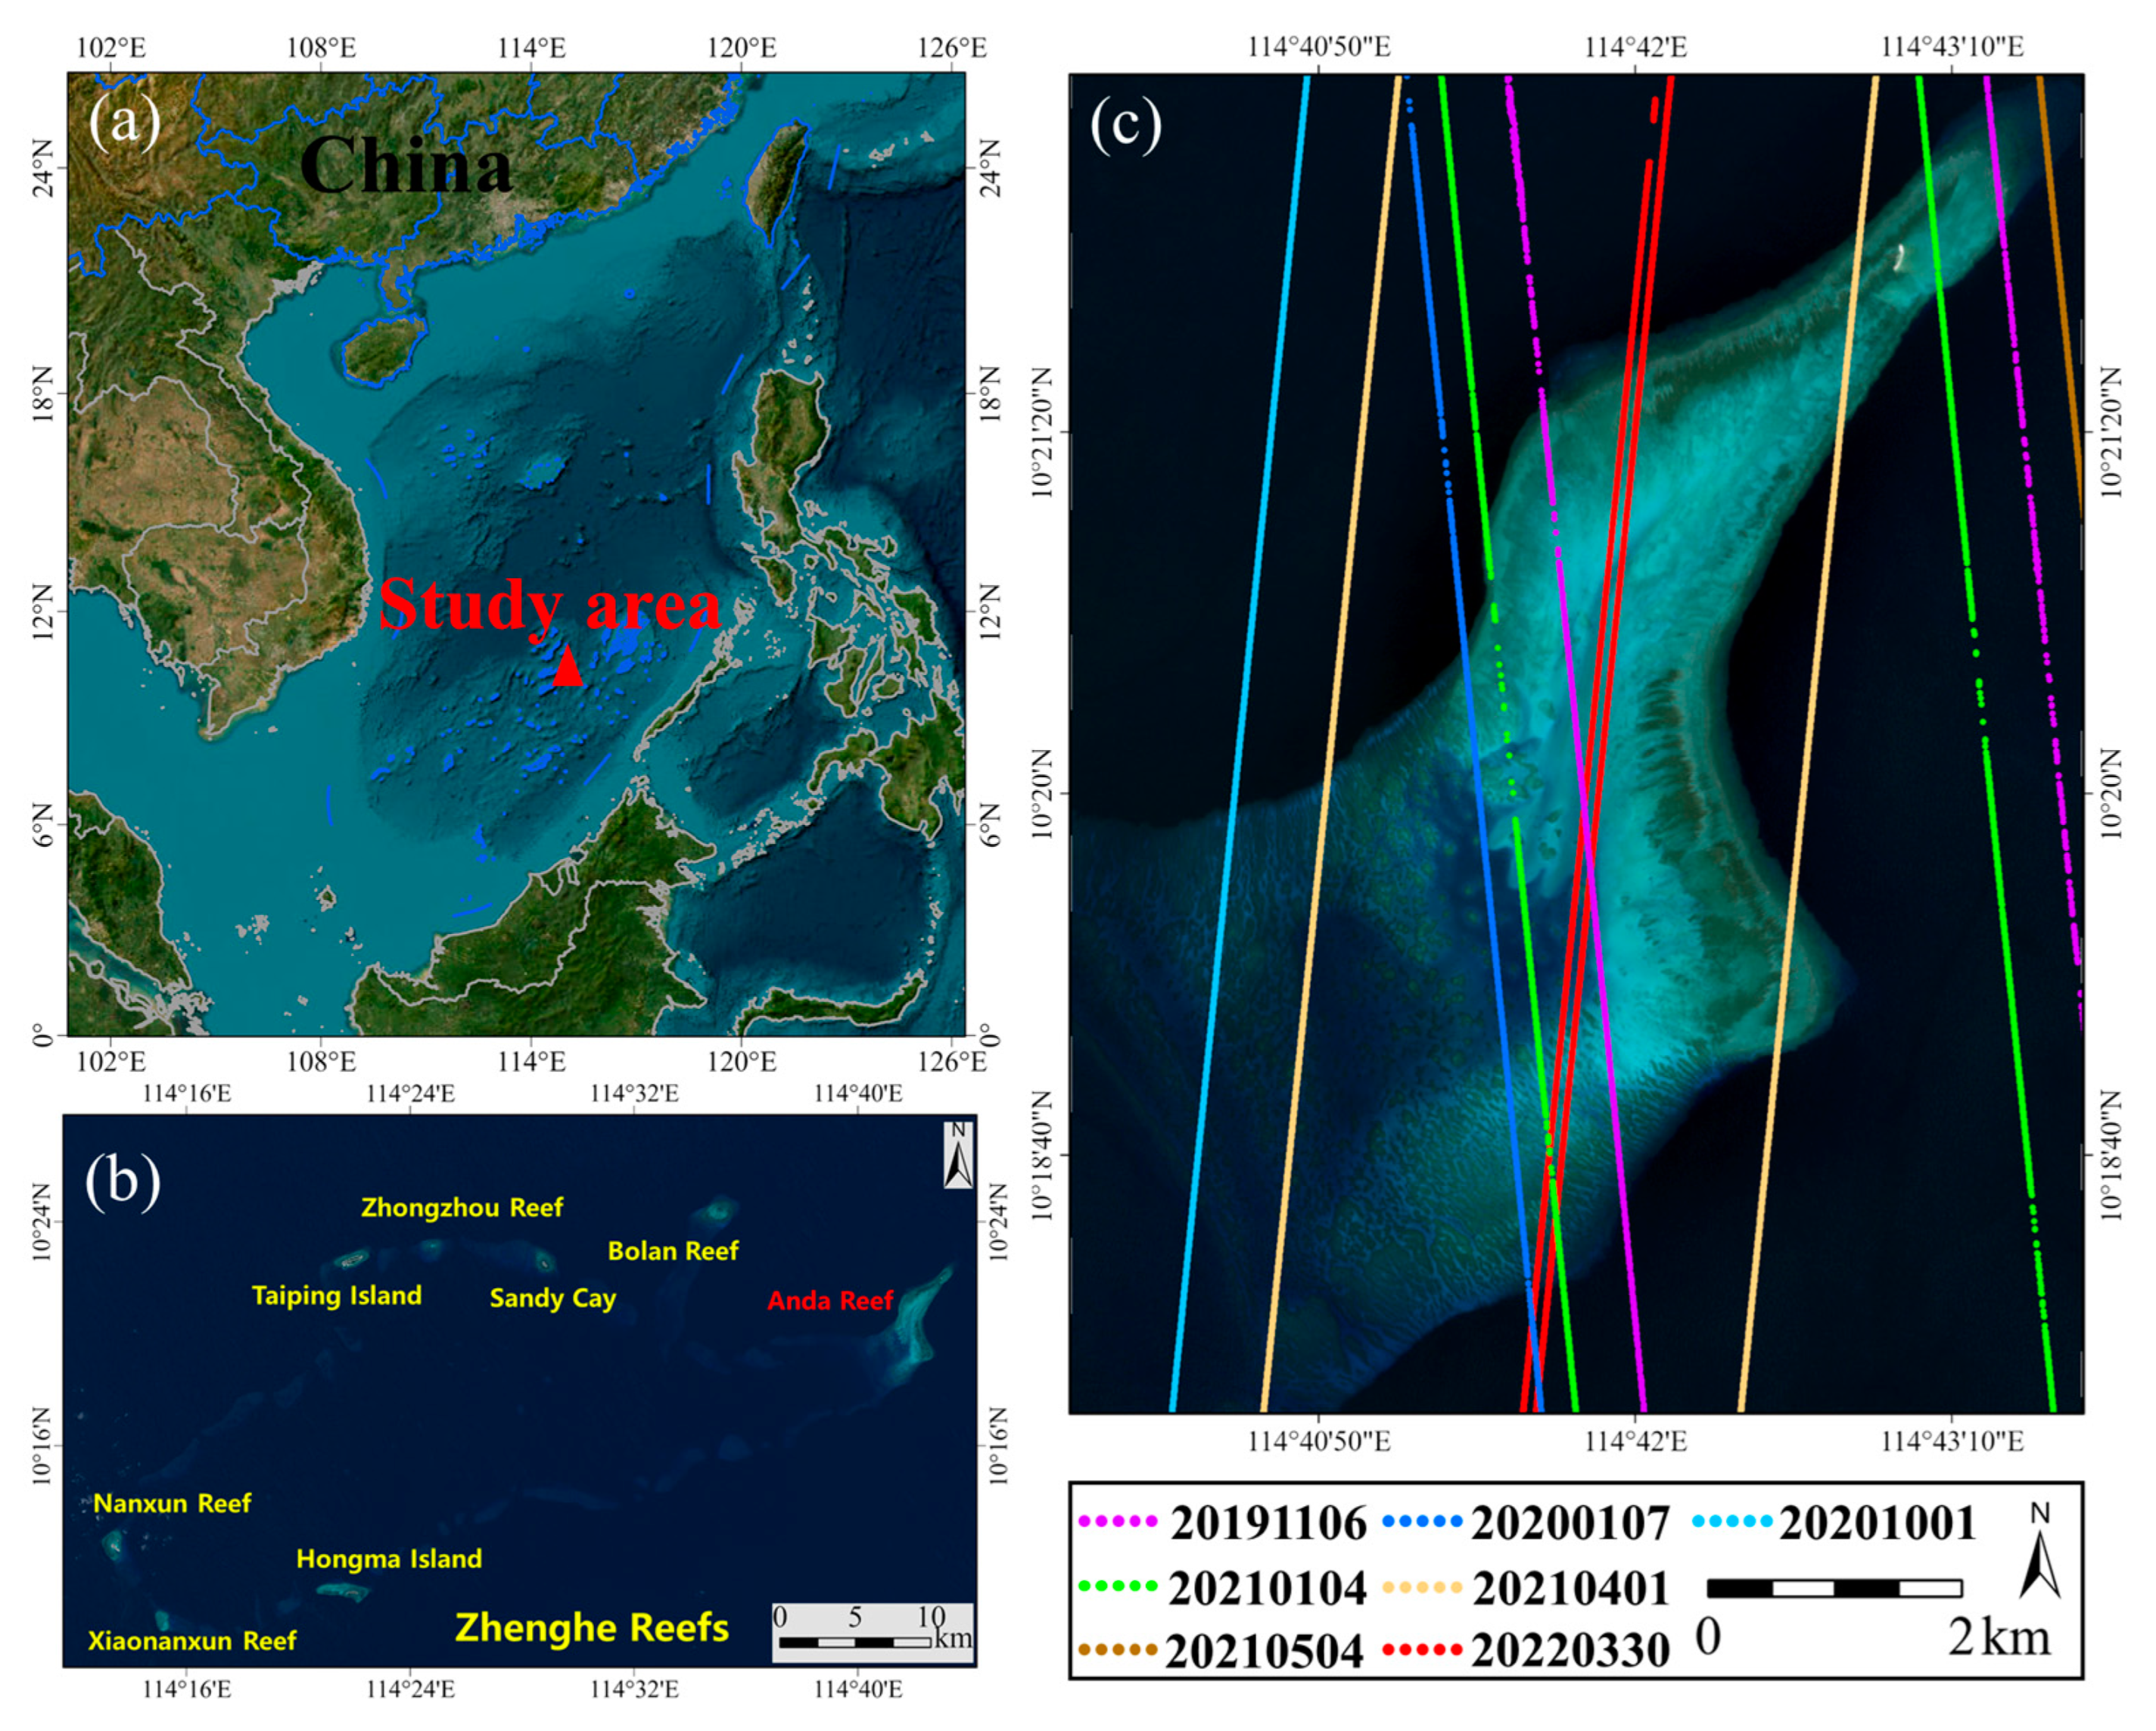
2.1. Study Area

The Anda Reef (10°21′ N, 114°42′ E) is located at the eastern end of Zhenghe Reefs in the Spratly Islands (Figure 1). The area of Anda Reef is 22.86 km2 and ranks first among Zhenghe Reefs. Anda Reef has an irregular shape. It is a northeast-oriented reef with a sharp protrusion, which is approximately 11 km in length from northeast to southwest and 0.3–5 km in width. Regarding the bathymetric distribution, Anda Reef shows a shallow north and deep south trend, with shallow water depths of 2 m or less in the northeastern part and up to 20 m in the southern region. The edges of Anda Reef clearly show a transition between deep and shallow zones. This study primarily focuses on the shallow water areas (0–20 m) of the Anda reef, while deeper areas beyond the reef are not considered. In addition, Anda Reef is an unenclosed atoll with a southwest outlet, which can accommodate some small boats.

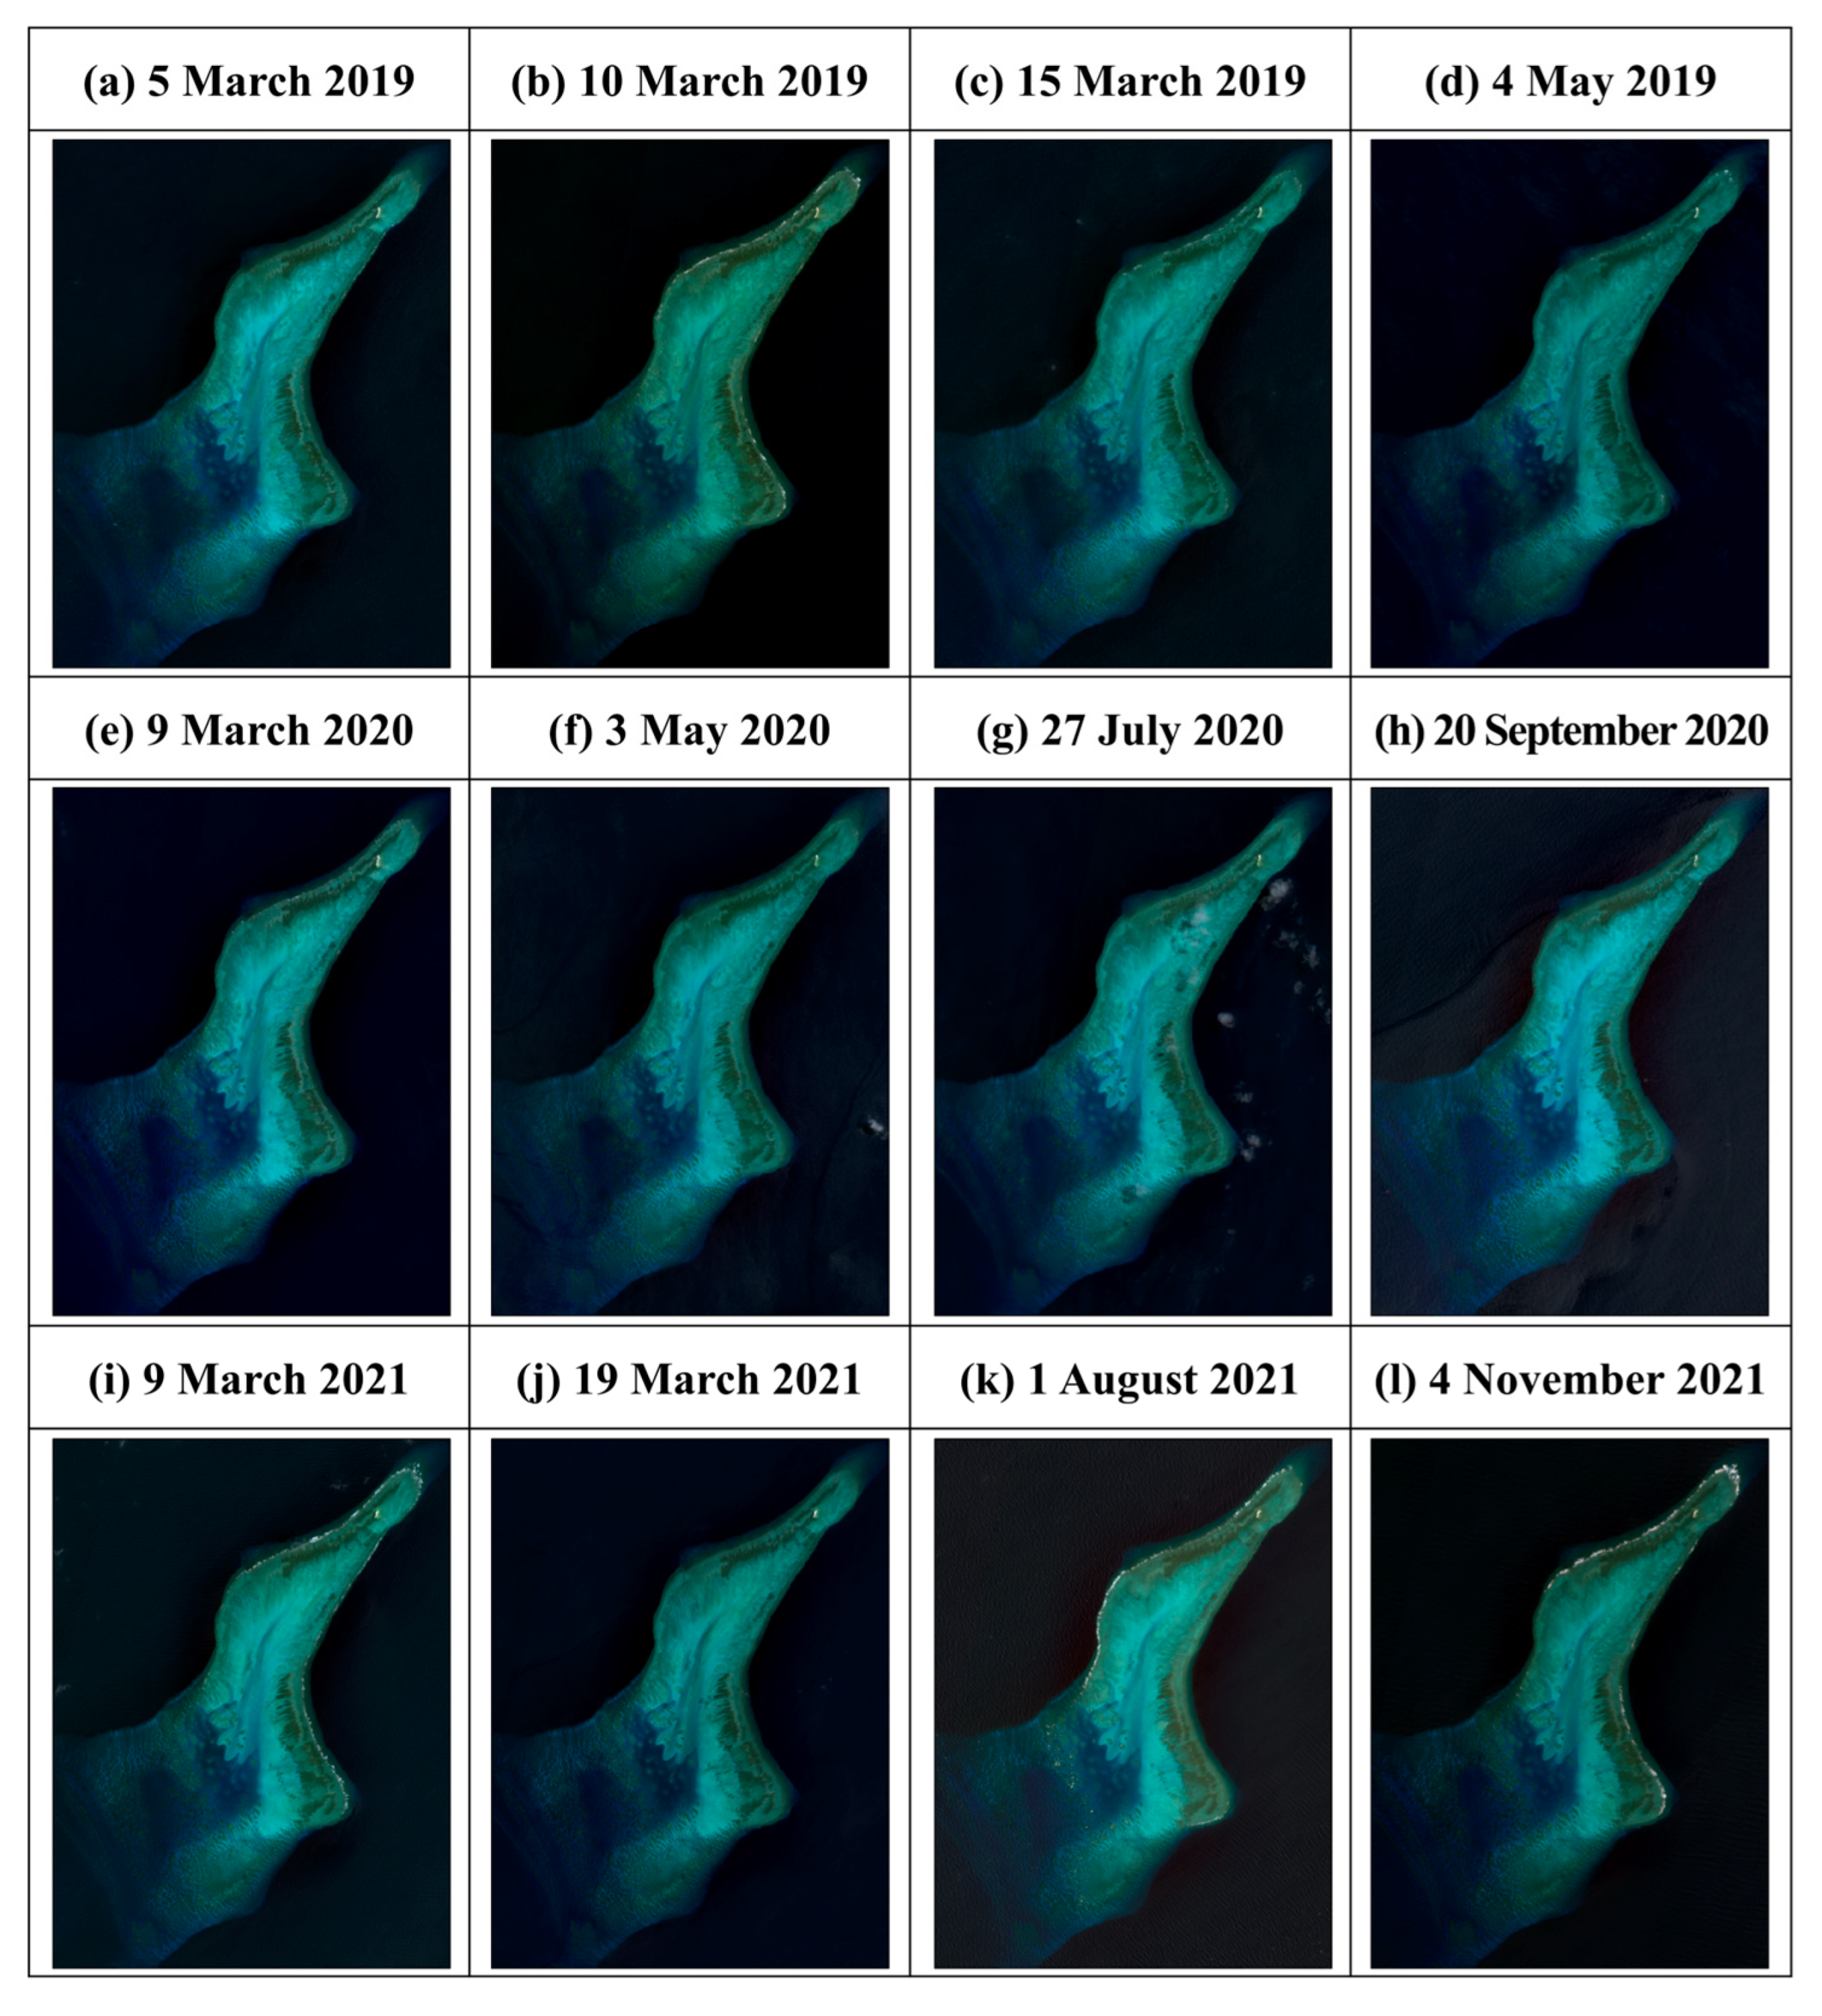
2.2. Sentinel-2 Imagery

The Sentinel-2A and Sentinel-2B, launched on 23 June 2015, and 7 March 2017, respectively, have global coverage with a revisit interval of 5 days [37]. The Sentinel-2 with the Multispectral Instrument (MSI) can effectively monitor temporal changes in land, vegetation, snow, and ice [38]. It has 13 bands with varying resolutions, and detailed spectral information can be found in the User Manual [39]. Compared with other available multispectral sensors, Sentinel-2 is used for bathymetric inversion because of the free-access policy and high resolution [37]. These images were obtained from the GEE platform (https://earthengine.google.com/) (accessed on 16 September 2023), which offers a broad range of remote sensing products [40]. A total of 12 high-quality Sentinel-2 images were used in this study, with four images per year from 2019 to 2021, as illustrated in Figure 2.

2.3. ICESat-2 Datasets

The ICESat-2 satellite, launched in September 2018, utilizes a 532 nm laser with a 17 m footprint to measure the global surface elevation [41]. It comprises three strong and weak pairs, with a separation of 90 m between each pair and 3.3 km spacing between pairs of beams. The energy ratio of strong and weak beams in each laser pair is 4:1 [42]. With an altitude of about 500 km and a high repetition rate of 10 KHz, the distance between neighboring lasers is around 70 cm along the track [43,44]. The ICESat-2 ATL03 product contains geolocated photon data that provide information on elevation, coordinates (latitude, longitude), and time. See the official documentation for comprehensive data information [41,45]. The ATL03 data were queried and obtained from the NSIDC (https://nsidc.org/data/ATL03/versions/5) (accessed on 16 September 2023).

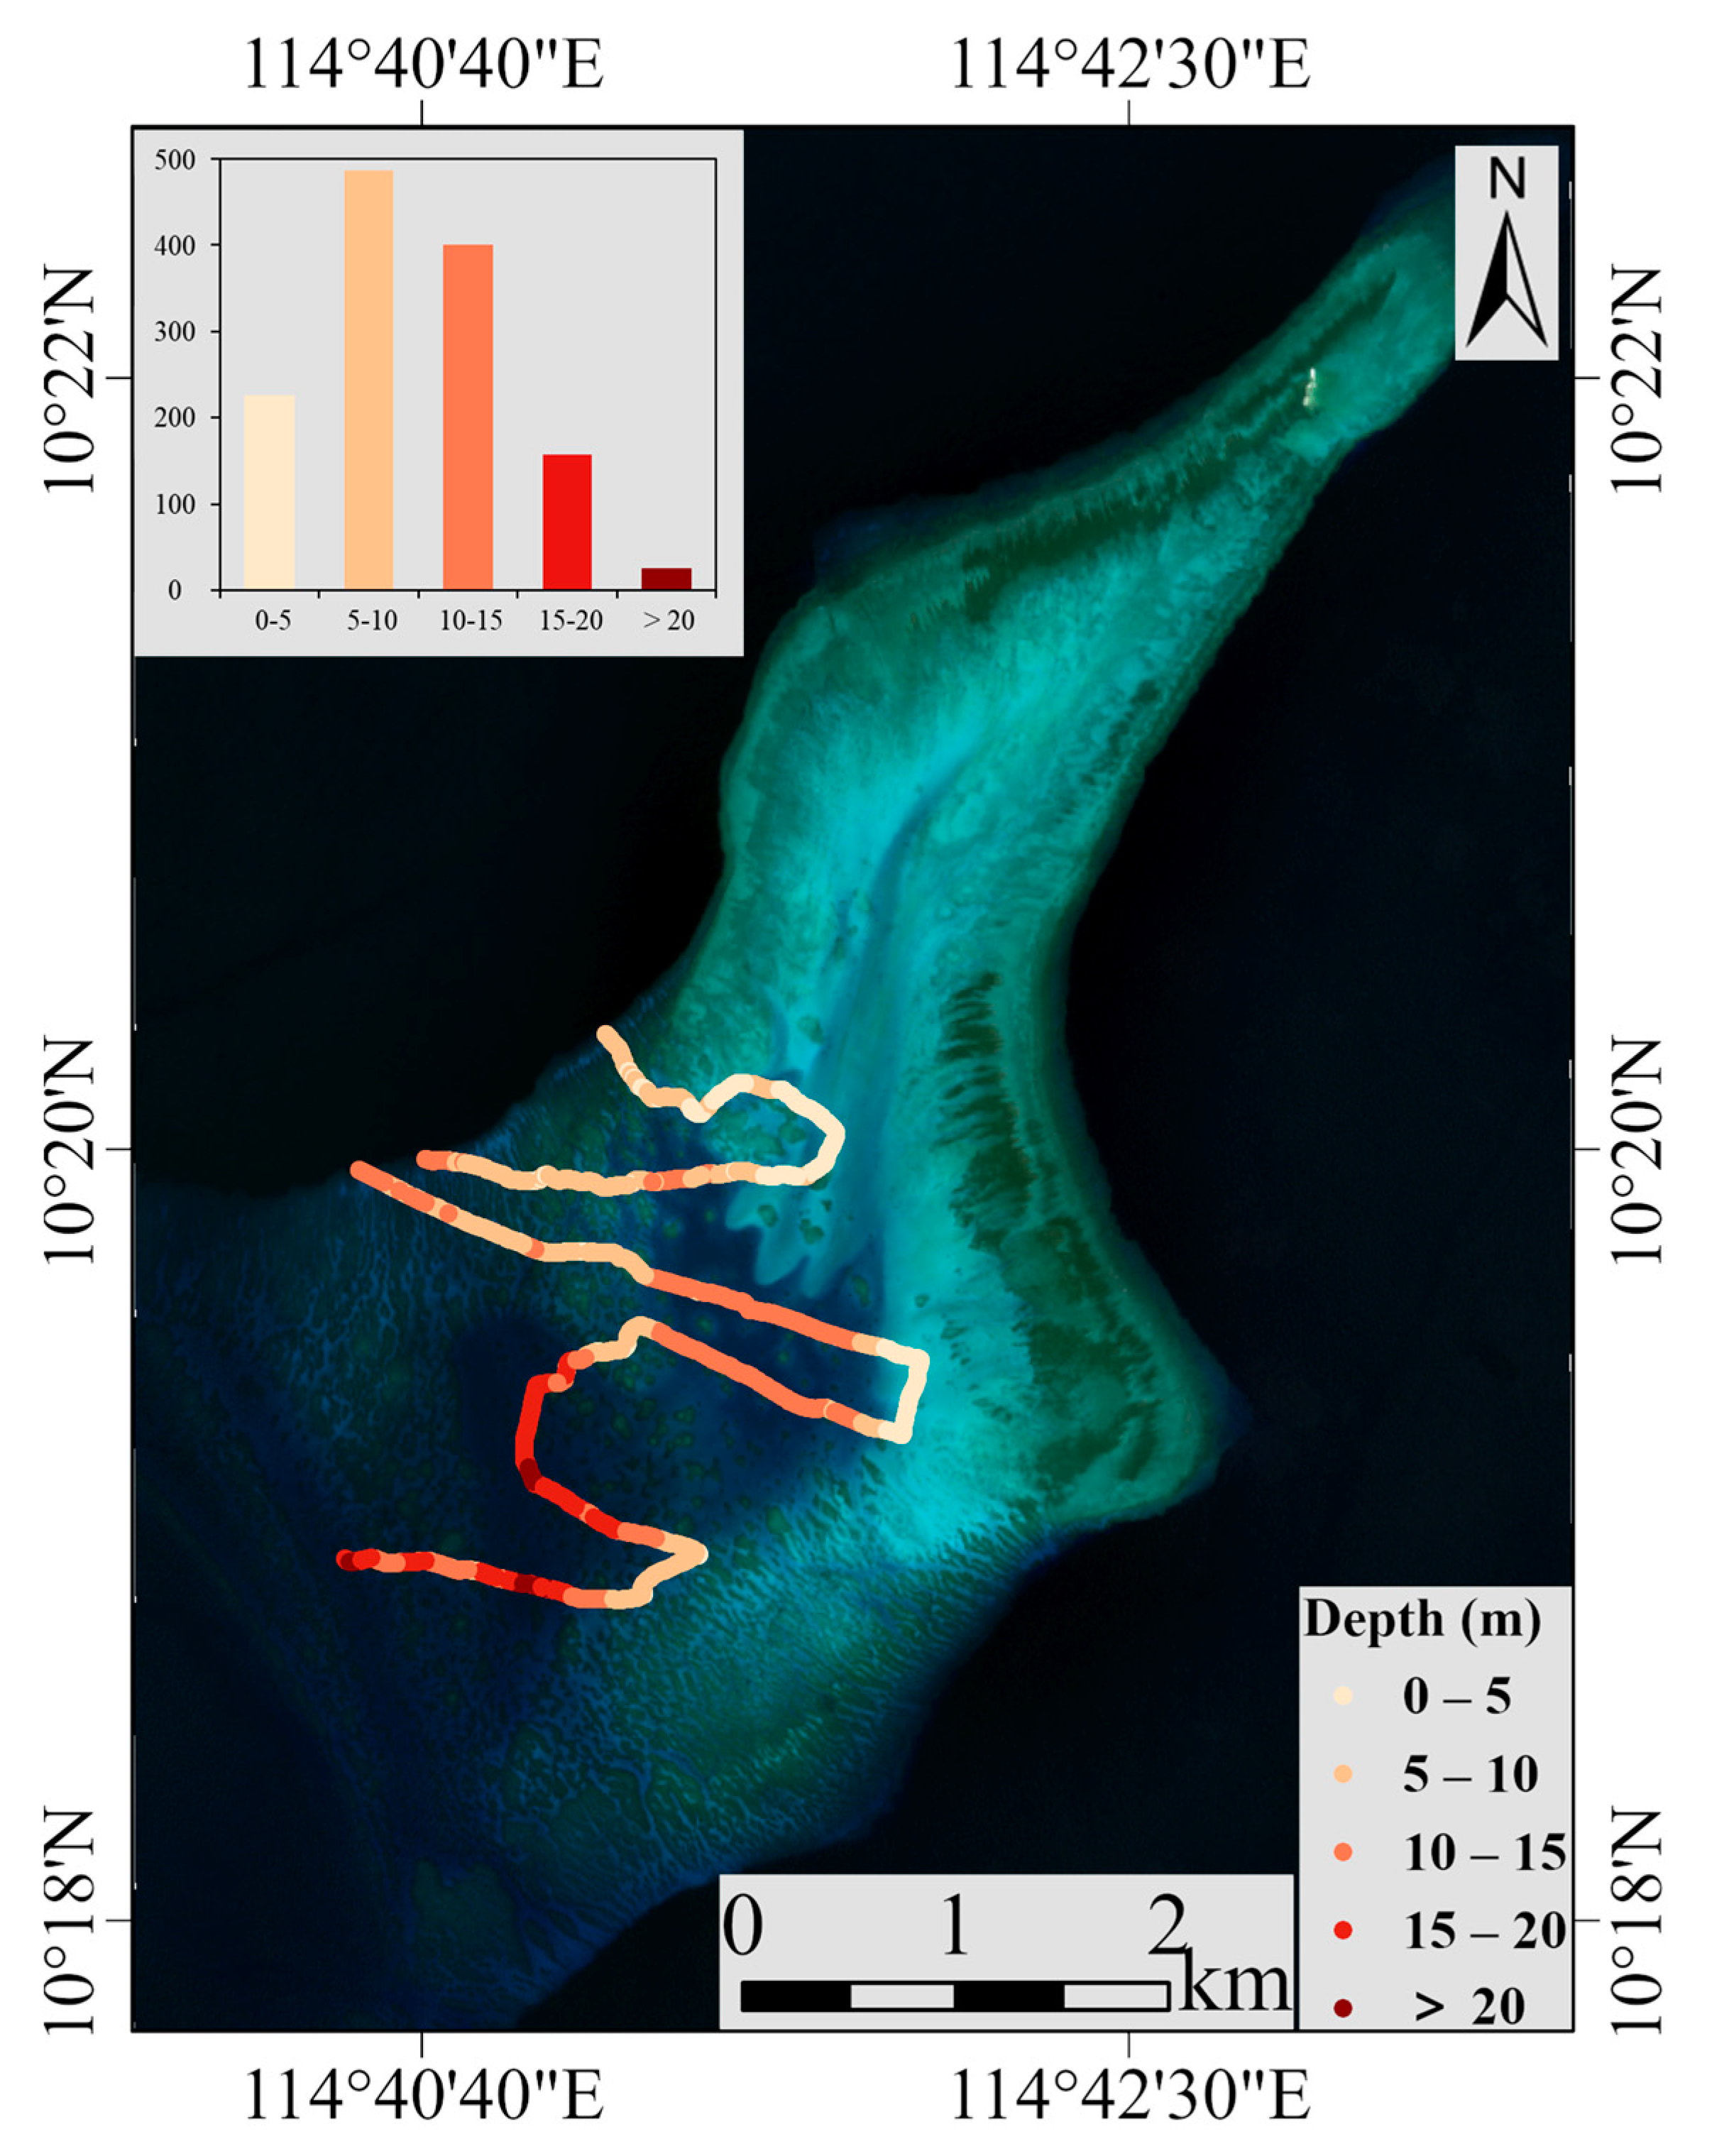
2.4. In Situ Sonar Data
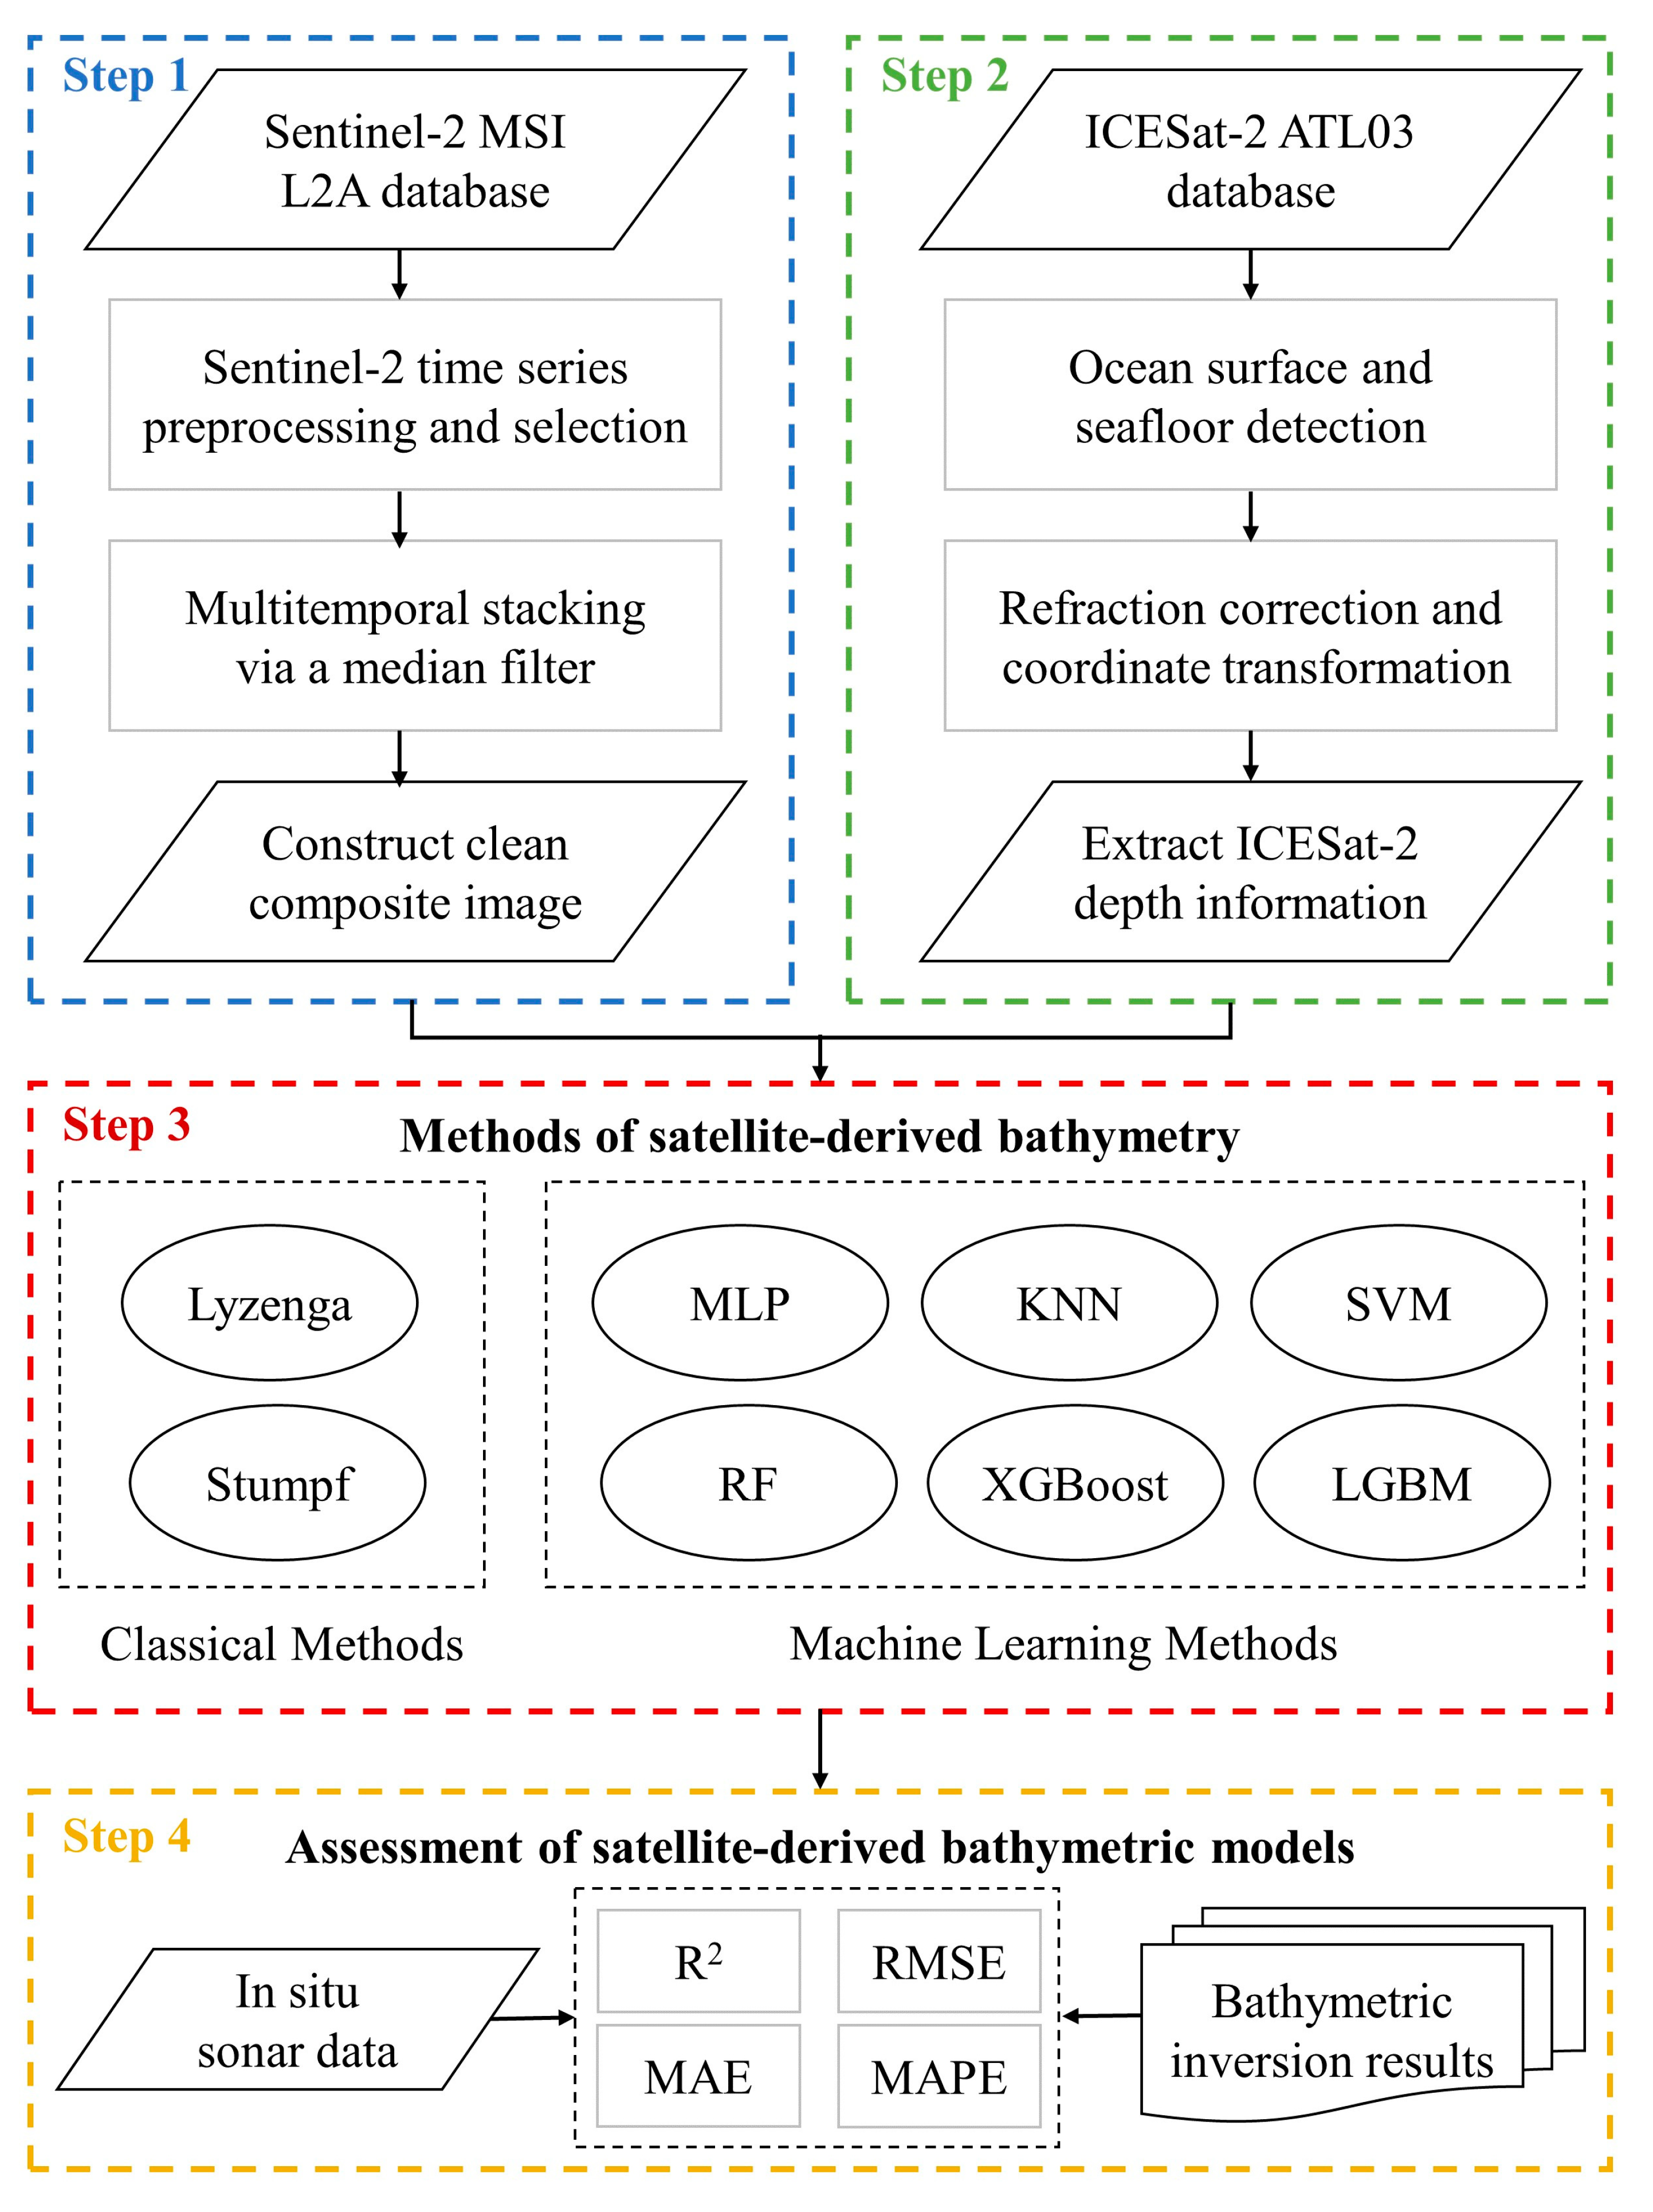
The sonar measurements of Anda Reef were conducted on 21 January 2018, using the Odom Hydrotrac II single-beam bathymetry system [46]. The data were superimposed into the matching 10 m pixel of the Sentinel-2 imagery, and the mean value was calculated as the final water depth. The spatial distribution and frequency distribution histograms of sonar data in the shallow water area are shown in Figure 3. A total of 1294 points were surveyed, covering a route length of 12.45 km. The maximum, minimum, and mean values of the measured data are 1.73, 21.13, and 9.85 m, respectively. The performance of various SDB models was verified using the following water depths ranging from 0 to 20 m: 0–5 m (226), 5–10 m (488), 10–15 m (400), and 15–20 m (157). The tidal correction was applied to the field measurements of Anda Reef, resulting in bathymetry data referenced to the mean sea level (MSL). Although water depth may have changed between field measurements and the acquisition of satellite data (ICESat-2 and Sentinel-2), the topography of remote reefs, particularly for areas such as the Spratly Islands, is generally considered to be stable or only slightly variable [29,46,47].

3. Methods

We proposed a multialgorithm evaluation framework of classical and machine learning methods for SDB (Figure 4). First, the Sentinel-2 images were processed, filtered, and median synthesized based on the GEE platform. Second, the ICESat-2 bathymetric information was extracted precisely by manual tagging, refraction-corrected, and tide-corrected. Third, the bathymetric maps were retrieved from eight SDB models by integrating the optimal Sentinel-2 image with ICESat-2 bathymetric data. Finally, an independent dataset from in situ measured data was used for validating the eight bathymetric results.

3.1. Sentinel-2 Data Preprocessing

We used the GEE platform to preprocess and obtain the time series images for developing SDB. The GEE provides sufficient satellite imagery, enabling quick dataset processing and output visualization [40]. The Sentinel-2 Level 2A dataset that had undergone radiometric calibration and atmospheric correction was employed in this study. The 10 m resolution bands, namely, B2, B3, and B4, were included in constructing the inversion model for consistency with previous studies [23,48]. All images of the study area were geometrically projected into WGS 1984 UTM Zone 50N.
Although the majority of the selected images were close to the best conditions for satellite observation, a few images were still noisy (Figure 2). For instance, an image obtained on 27 July 2020, contains a small amount of cloud cover. To effectively address the hindering factors present in the satellite images of the study area, such as clouds, sun glint, white caps, and sensor-related noises, we adopted the median function to construct a composited image [29,49]. First, we selected reliable reference images with almost no clouds, sun glare and water turbidity of Anda Reef from 2019 to 2021 in the GEE platform. Then, the 12 selected Sentinel-2 images (four per year) were synthesized using a median filter method to improve bathymetric inversion accuracy. We believe the composite of 12 high-quality images sufficiently minimizes image-induced uncertainty.

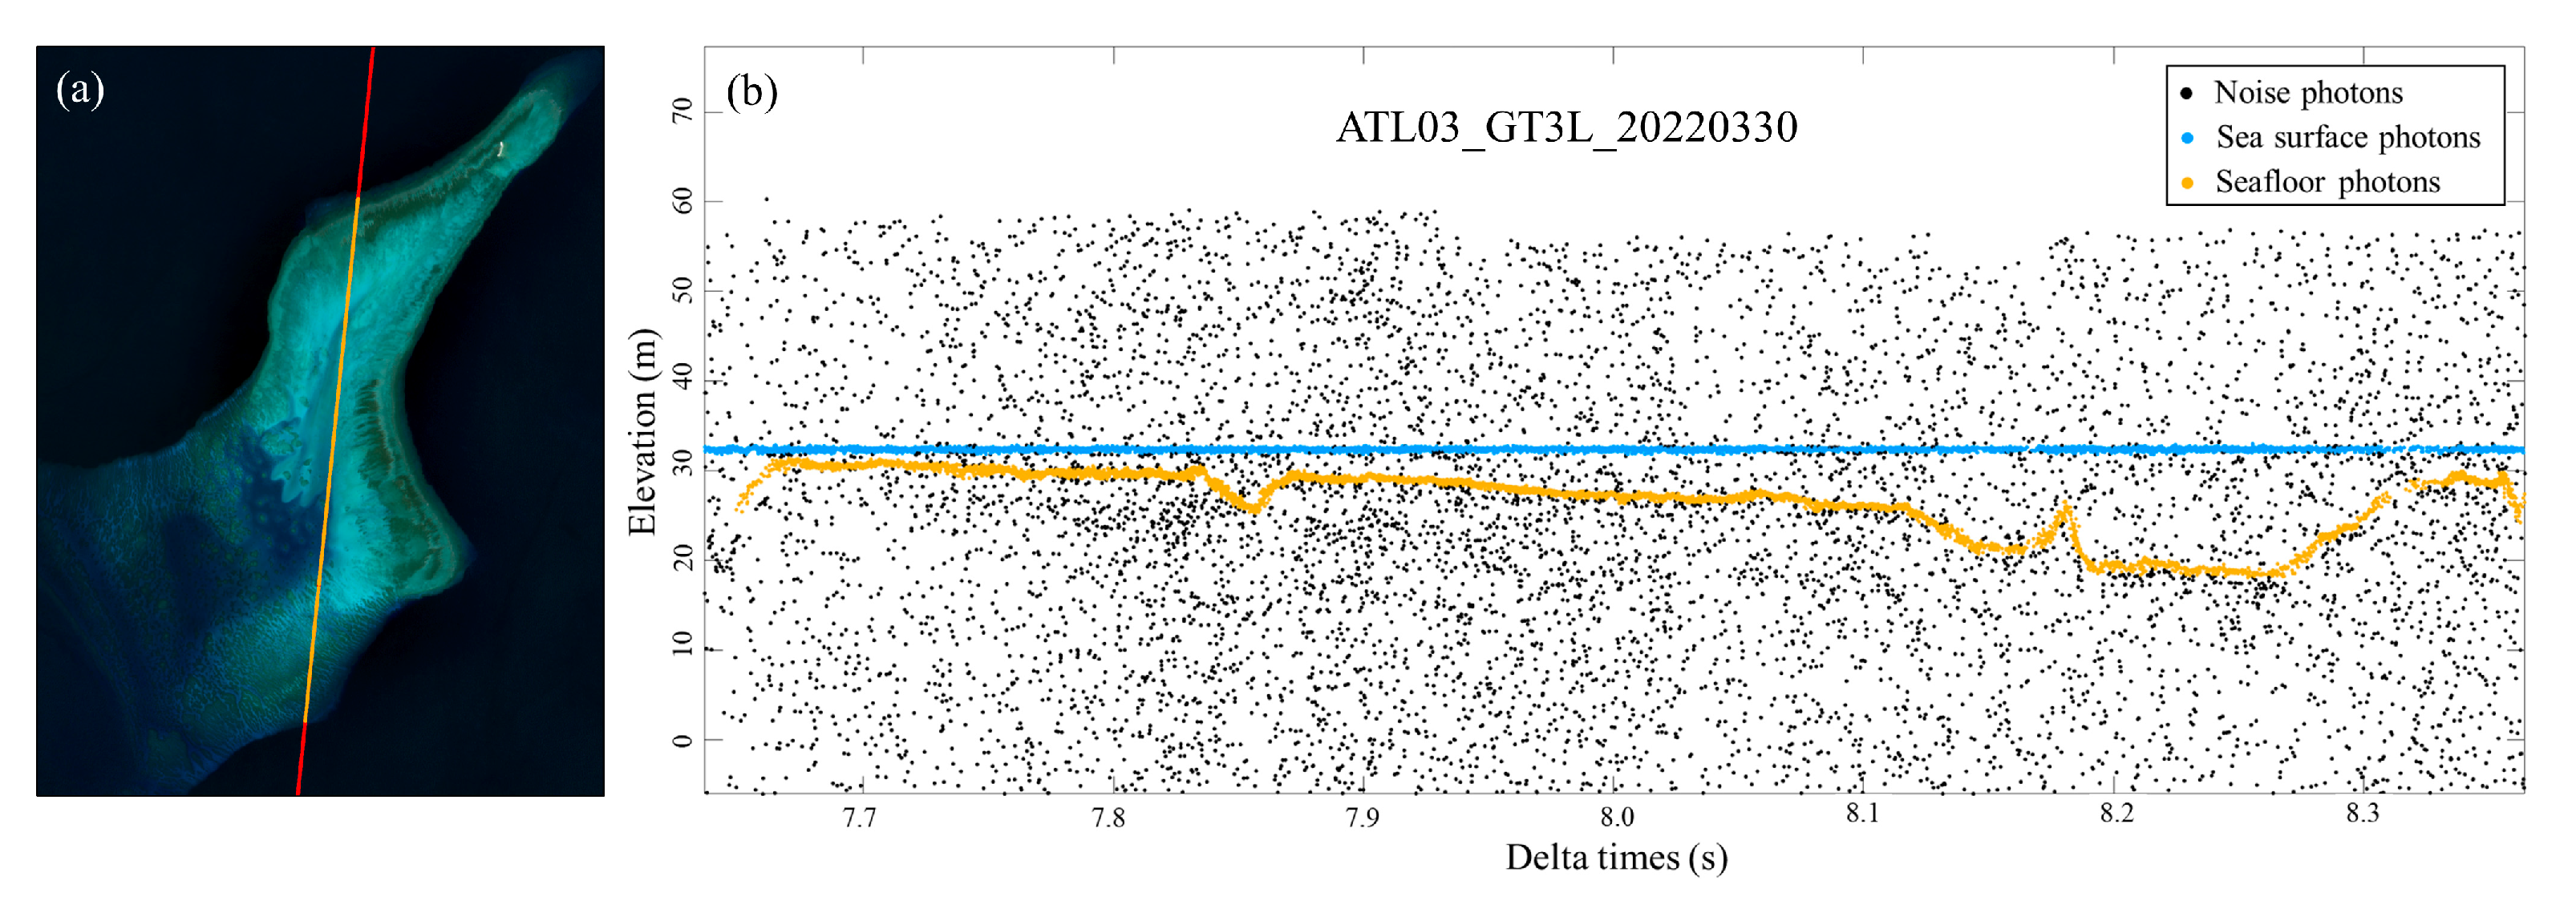
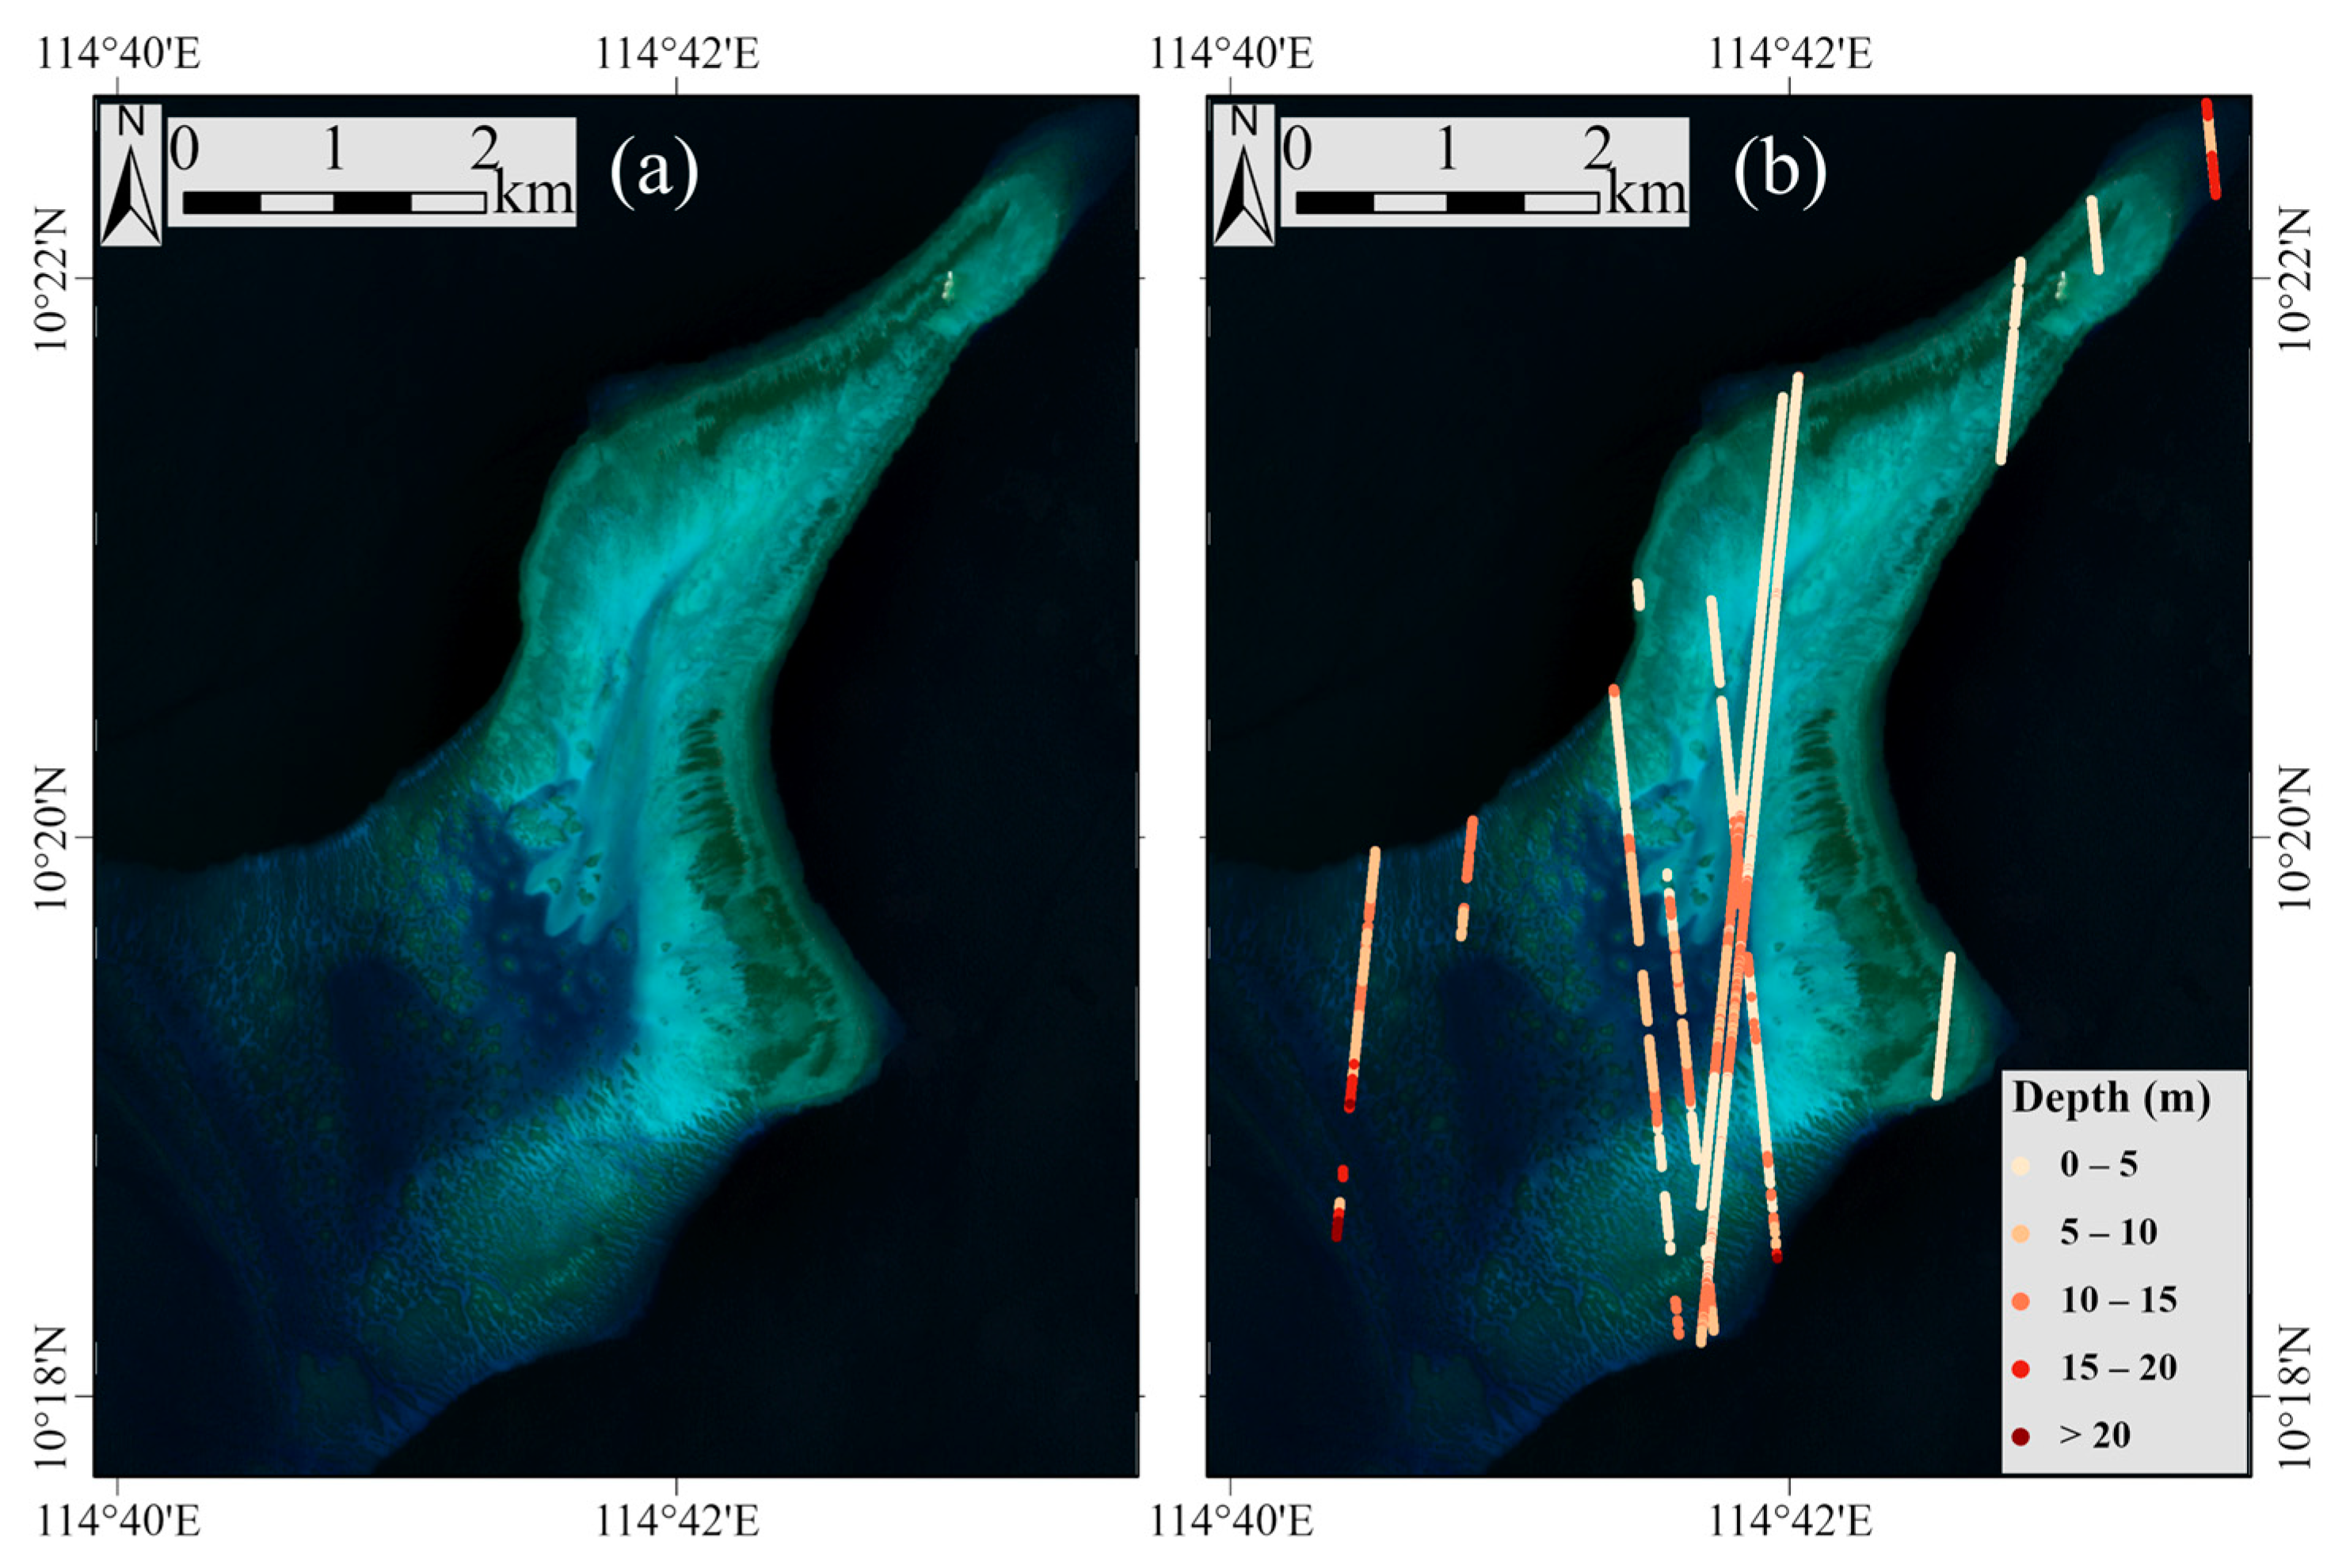
3.2. ICESat-2 Bathymetric Point Extraction

ICESat-2 satellites can deliver precise bathymetric points in optically shallow water areas, but the ATL03 product contains significant noise. However, existing denoising algorithms and high-level data products for detecting underwater signals are still exploratory, requiring further optimization for their generality and reliability in bathymetry [5,50]. Accordingly, we accurately extracted the bathymetric points by manual interactive annotation with the PhotonLabeler software developed by Malambo and Popescu [51]. PhotonLabeler software provides an accessible graphical user interface for visually interpreting and manually labeling ICESat-2 products. For example, Figure 5 displays the results of photon classification using the beam collected on 30 March 2022.
The ICESat-2 products do not currently consider refraction at the air-water interface, which causes an overestimation of the distance traversed through water [52,53]. In this work, we applied the refraction correction model proposed by Parrish et al. [52], as shown in Equation (1), where the refractive indices for air n a and seawater n w were set to 1.00029 and 1.34116, respectively.
z n = z o ( n a / n w )
where z n is the corrected depth, z o is the initial depth, n a and   n w represent the refractive indices of air and seawater, respectively. Subsequently, we made the tidal correction of ICESat-2 bathymetric photons to ensure that the depth reference matched the measured data. Finally, the ICESat-2 depth was stacked into 10 m pixels of Sentinel-2 image and averaged to generate the final prior bathymetric information.

3.3. Methods of SDB

In this study, we built two classical methods (Lyzenga and Stumpf) and six machine learning models (LGBM, XGBoost, RF, SVM, KNN, and MLP). Many previous studies have shown that these algorithms effectively estimate water depth [3,6,11,16,30,54]. The red, green, and blue bands of Sentinel-2 images and ICESat-2 water depth were split into training and test datasets with a segmentation ratio of 8:2. Additionally, we conducted 500 random experiments to ensure the accuracy of these inversion models and performed the grid search cross-validation approach to identify the best hyperparameters. The setting of these parameters brings promising preliminary results for bathymetric derivation.

3.3.1. Classical Methods

(1)
Lyzenga
The Lyzenga model, first developed by Lyzenga [27], has a long history and can be used as a reference for comparing bathymetric inversion methods, as follows:
z = a 0 + i = 1 N a i ln [ R ( λ i ) R ( λ i ) ]
where z is the water depth (m), a 0 and a i are linear regression coefficients, N is the number of bands, R ( λ i ) represents the reflectance of the ith band, and R ( λ i ) represents the reflectance of deep-water pixels for the ith band.
(2)
Stumpf
The Stumpf model is simple, representative, and widely used for generating bathymetric maps, as follows:
z = m 1 ln ( n R ( λ i ) ) ln ( n R ( λ j ) ) m 0
where z is water depth, R ( λ i ) and R ( λ j ) are the reflectance for bands i and j , the values of m 1 and m 0 are adjustable parameters to convert the estimated water depth to the actual depth, and n is a fixed constant (commonly set to 1000).

3.3.2. Machine Learning Methods

(1)
MLP
The MLP model has been widely used in many kinds of research due to its robust processing and self-learning capacity [15,17,55,56]. MLP comprises an input, output, and several hidden layers. The input layer acquires external modeling factor data for each pixel, which is then processed through one or more middle layers before being transmitted to the output layer. The output layer generates the final prediction result of the network, i.e., the estimated water depth. The optimal hyperparameters of the MLP model are presented in Table 1.
(2)
KNN
The KNN model is a nonparametric machine learning algorithm that estimates a continuous dependent variable using K nearest training samples from the feature space [3,36,57]. Its principle is to apply methods, such as Euclidean distance and Manhattan distance, to calculate the distance between the current point to be classified and the known points. We can use this algorithm to find the nearest K points to the point to be classified and then calculate the weighted average of these K points’ water depth to obtain the point’s estimated water depth. The optimal hyperparameters of the KNN model are presented in Table 1.
(3)
SVM
The SVM model, with the radial basis function (RBF) kernel, can effectively address minor sample problems and establish a reliable relationship between satellite imagery and water depth [16,58,59]. Furthermore, the nonlinear kernel function of SVM, which transforms the training set into a high-dimensional feature space, enhances the generalization capacity. The SVM model achieves its best performance by selecting a suitable kernel parameter and tuning the model inputs. The optimal hyperparameters of the SVM model are presented in Table 1.
(4)
RF
The RF model is an ensemble learning regression technique for bathymetric inversion [30,34,60,61]. RF models build an ensemble of decision trees called a forest using bootstrap resampling on the training dataset. Each decision tree in the forest is constructed independently. Averaging or taking the majority vote of the forecasts from all decision trees yields the final estimation value for the RF model. The optimal hyperparameters of the RF model are presented in Table 1.
(5)
XGBoost
The XGBoost model is a tree-based boosting algorithm [25,62,63]. It creates decision trees for the model in an iterative manner and generates decision trees in series, with each subsequent tree learning to correct the mistakes of the previous tree. The algorithm incorporates a regularization term that helps regulate the complexity of the model and prevent overfitting. Thus, the computation requirements are reduced, and the optimal solution is obtained quickly. The optimal hyperparameters of the XGBoost model are presented in Table 1.
(6)
LGBM
The LGBM model is a tree-based learning algorithm-based gradient boosting framework used for various applications, including ranking and classification problems [35,64,65,66]. This model constructs a histogram-based segmentation approach instead of the conventional presorted traversal. Additionally, it can directly explore k discrete feature nodes using the histogram algorithm optimization to locate the optimal splitting node. The optimal hyperparameters of the LGBM model are presented in Table 1.

3.4. Accuracy Assessment

The accuracy of SDB results was further validated by in situ measurements using the following statistical metrics: coefficient of determination (R2), mean absolute error (MAE), RMSE, and mean absolute percentage error (MAPE).
R 2 = ( i = 1 n ( y i y ¯ i ) ( o i o ¯ i ) ) 2 i = 1 n ( y i y ¯ i ) 2 i = 1 n ( o i o ¯ i ) 2
MAE = 1 n i = 1 n y i o i
  RMSE = 1 n i = 1 n y i o i 2
MAPE = 100 % n i = 1 n o i y i y i
where n represents the number of observations, y i is the measured depth, o i is the estimated depth, y ¯ i and o ¯ i are the mean values of all measured and estimated depths, respectively.

4. Results

4.1. Optimal Sentinel-2 Imagery and ICESat-2 Bathymetric Points

In this study, we employed a total of 12 high-quality Sentinel-2 images from 2019 to 2021, selecting four images per year that are close to the best conditions for satellite observation, as shown in Figure 2. However, despite being the best for several years, a few images were still noisy. To obtain an optimal clean water mosaic image, the selected images were synthesized using a median filter, as depicted in Figure 6a. Obviously, the median composite image had no cloud coverage, sun glint, and water turbidity. This approach helps to minimize the uncertainty caused by images when comparing different bathymetric estimation algorithms, enhancing the reliability and accuracy of the subsequent analysis.
We acquired 2614 available ICESat-2 bathymetric points of Anda Reef, and only water depths of less than 20 m were used to train the bathymetry inversion model. Figure 6b illustrates the distribution characteristics of bathymetric points over the Anda Reef, which covers a wide range of spatial regions and depth intervals. We can find that the effective bathymetric trajectory of ICESat-2 is characterized by a discontinuous distribution, with intermittent photons commonly occurring in deep water areas. Additionally, the bathymetric points were more densely distributed in shallow water regions, as fewer photons can reach the seafloor with increasing water depth. This phenomenon also indicates a positive correlation between the bathymetric points and the surface reflectance.

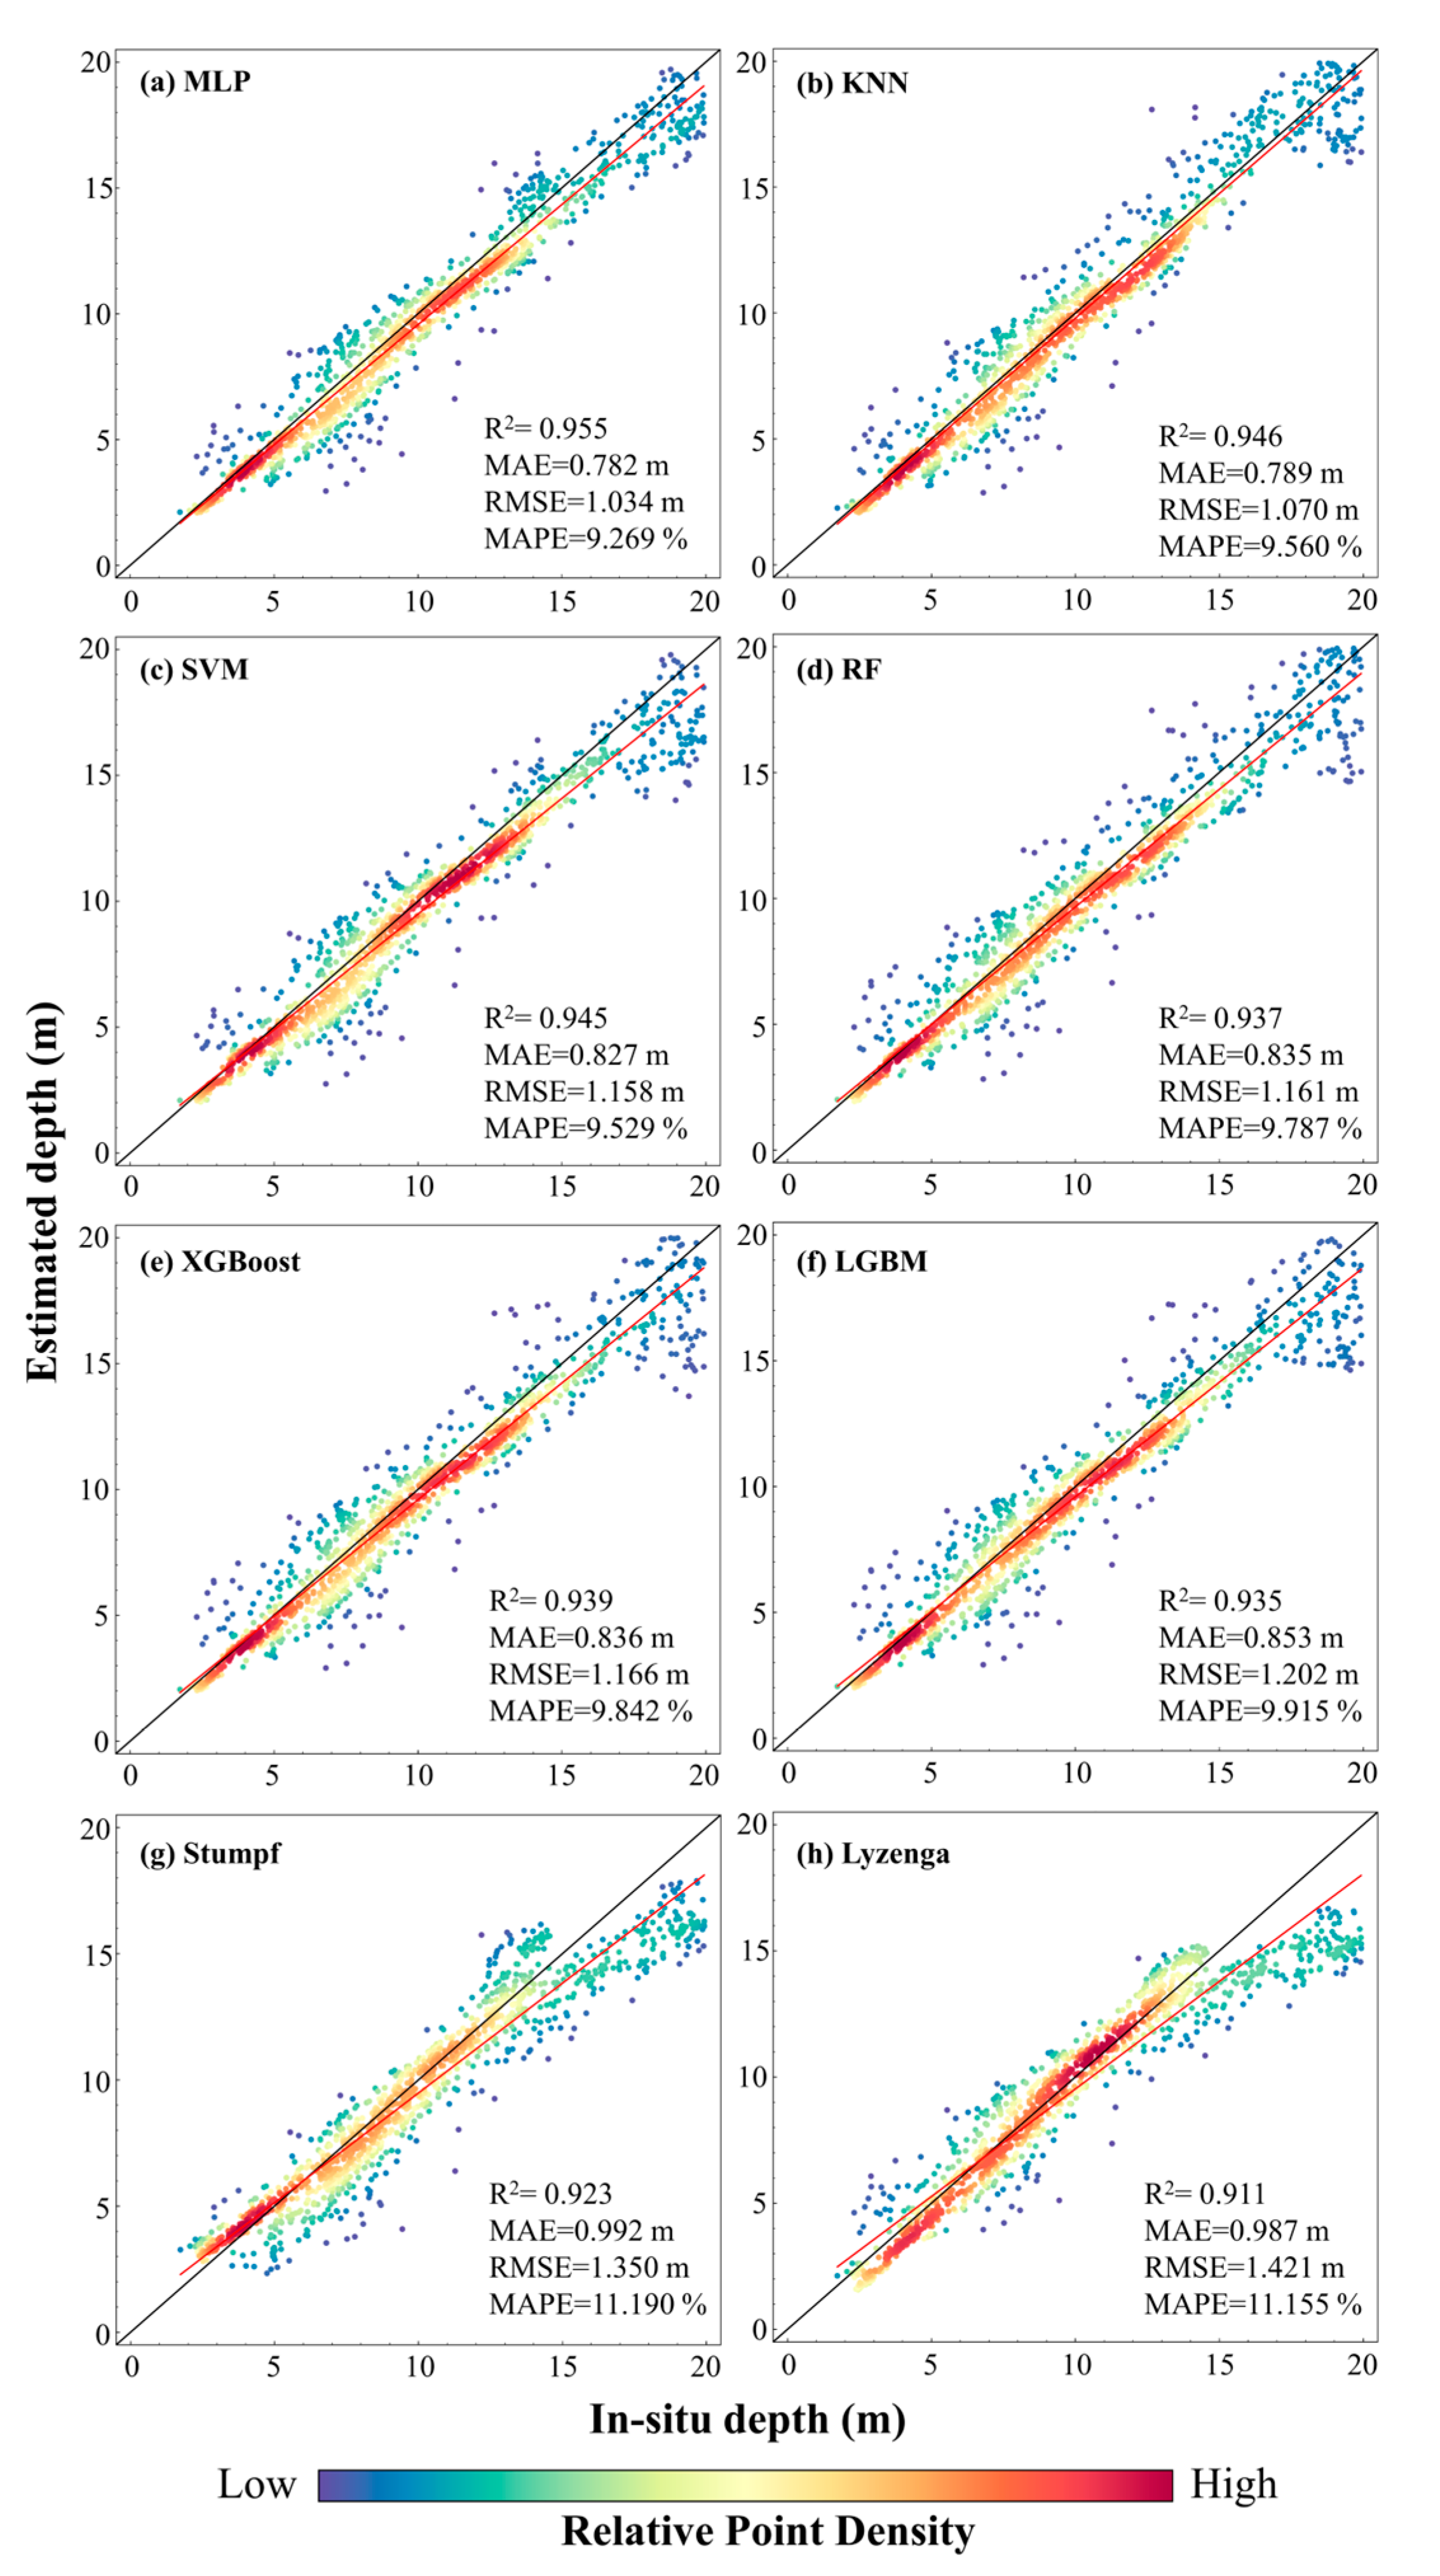
4.2. Accuracy Assessment of SDB Models

As illustrated in Figure 7, scatter density plots were generated for each model using measured depth, and four statistical indicators were summarized to assess their stability and robustness. The R2 values of eight SDB methods were more than 0.91, showing good agreement between predicted and measured depths. In terms of MAE and RMSE, the bathymetry accuracy of these models ranked as follows: MLP > KNN > SVM > RF > XGBoost > LGBM > Stumpf > Lyzenga. Machine learning models outperform the classical models, with a low MAE (0.782–0.853 m) and RMSE (1.034–1.202 m), proving their superior nonlinear fitting abilities in water depth inversion. The MLP (1.034 m) and KNN (1.070 m) achieved exceptionally high accuracy and consistency, with RMSE values below 1.10 m. The MLP exhibited a notable improvement of 0.387 m compared to the RMSE of the worst-performing Lyzenga (1.421 m).
We further calculated the MAE and RMSE of these SDB models to varying depths from 0–20 m, as presented in Table 2. The results demonstrated a general negative correlation between the accuracy of various SDB models and increasing depth. Machine learning methods exhibited comparable bathymetry errors in the 5–10 m, with the RMSE ranging from 1.135 to 1.194 m. The MLP showed superior performance compared to other inversion models, achieving RMSE values of only 0.605 m and 1.367 m in the 0–5 m and 15–20 m, respectively. These excellent performances were directly reflected in the water depth estimation, leading to the highest overall accuracy achieved by the MLP. However, classical models remarkably underestimated the deep water (Figure 7), and their performance was inferior to those of machine learning models. In the depth ranges of 15–20 m, the Lyzenga model displayed unsatisfactory performance, with a considerably higher RMSE of 3.233 m than the other models.

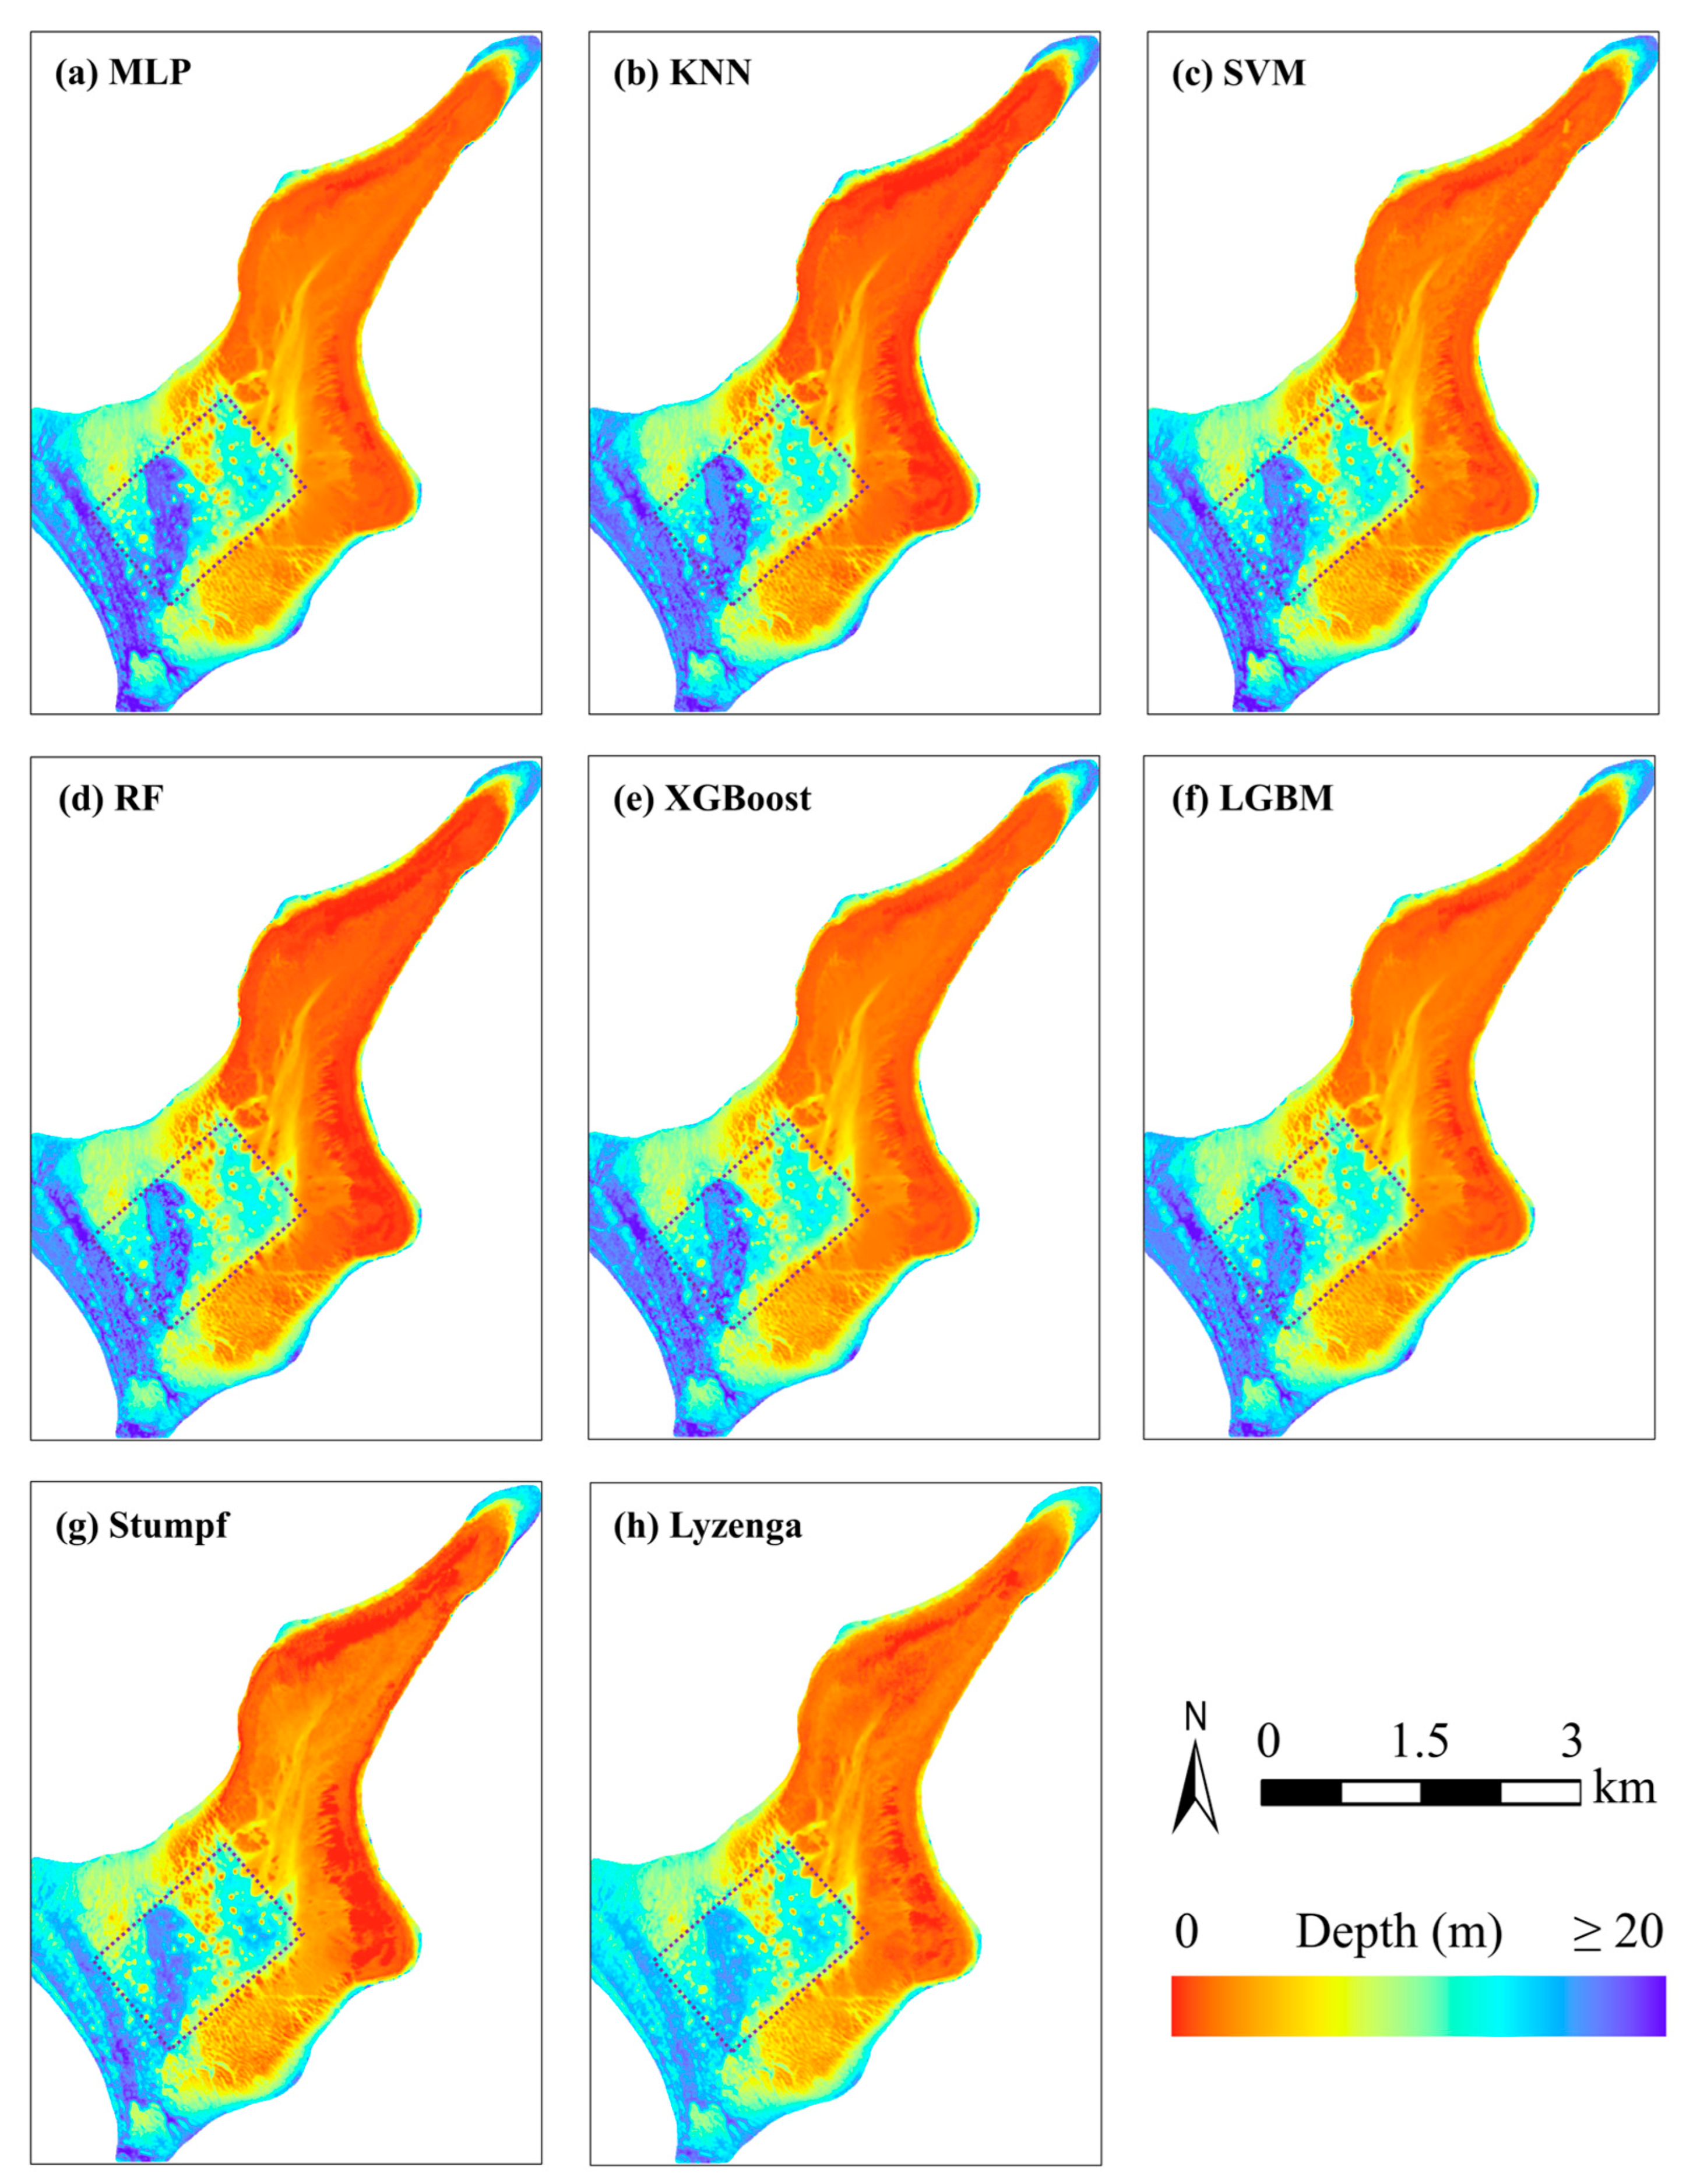
4.3. Bathymetric Mapping of SDB Models

The bathymetric maps of Anda Reef generated by classical and machine learning models are depicted in Figure 8. All SDB models show satisfactory results overall, with no significant visual differences. The depth prediction of these models effectively reflected the coherent spatial distribution patterns of the Anda reef, which gradually increased from northeast to southwest. The maximum depth and most of the deep-water area are distributed in the southwestern part of the coral reef. Machine learning methods provide richer details and better spatial continuity than classical methods, particularly in deep water. The MLP performs the best, as indicated by the purple box line. Bathymetric maps derived from classical approaches have lower depth than machine learning models, with the deepest color bands (i.e., deep water) always appearing in the latter. The Lyzenga displayed apparent discrepancies, particularly in the central regions of Anda Reef, where it consistently underestimates water depths compared to other models.
As illustrated in Figure 9, we constructed bathymetric variation profiles of the Anda Reef from various orientations, namely P1, P2, P3, and P4, with the aim of further evaluating the consistency and reliability of eight estimation models. Figure 9a provides a direct comparison of the bathymetric inversion results with measured sonar data, while the three subsequent figures show representative profile lines reflecting water depth changes (Figure 9b–d). In general, the depth profiles generated from various SDB models largely showed consistent variation trends, especially in areas where the bathymetry varies gently. The bathymetric capability and stability of these models in shallow water are higher than in deep water, which is consistent with the segmental validation results in Table 2. However, at locations exhibiting sharp transitions in water depth, the discrepancies between the bathymetric inversion results and the measured sonar data are evident, as depicted in Figure 9a. This trend becomes particularly evident when the water depth exceeds 15 m, where the depth variations between all models increase sharply. In addition, compared with the profile depths extracted from classical models, those extracted from machine learning displayed high consistency that can express numerous topographic undulations. In deep water areas, the profile depths obtained from the Lyzenga and Stumpf methods are commonly lower than those obtained from other models. This factor was also visually reflected in the scatter plots (Figure 7), indicating that the classical models performed poorly within the depth range of 15–20 m.

5. Discussion

5.1. Comparative Analysis of SDB Models

The selection of SDB methods directly affects bathymetric accuracy, highlighting the need for further exploration, especially in the Spratly Islands [30,35]. Our findings showed that classical and machine learning models produced satisfactory bathymetric results for Anda Reef. Among the SDB models, MLP had the lowest RMSE of 1.034 m, while Lyzenga had the highest RMSE of 1.421 m. The depth profiles generated by various models largely align with the trends observed in sonar measurements, with machine learning models exhibiting superior inversion capabilities compared to classical models. The discrepancies between the inversion results and sonar data emerged at locations with abrupt depth transitions, especially in deeper waters exceeding 15 m. Such deviations are largely limited by the bathymetric capabilities of satellite data sources and SDB models in accurately capturing sharp depth variations within complex coral reef topography. The bathymetric performances of SDB models used in this study align with or are better than those recorded in previous investigations, although differing site conditions may limit the comparability of results [11,13,16,67]. Furthermore, our results indicated that multiple machine-learning models could achieve excellent and comparable bathymetric accuracy when provided with sufficient training data and the same background conditions, which has rarely been discussed in previous studies.
The effect of different machine learning algorithms on bathymetric accuracy is closely related to their fundamental mathematical framework, data processing strategies, and hyperparameter configurations. For example, the MLP algorithm, with the multi-layer network structure, exhibited more significant advantages when dealing with global and intricate relationships, resulting in excellent bathymetric accuracy [15,56]. Similarly, the distance-based KNN algorithm, benefiting from substantial training data, achieved high prediction accuracy, although it might be more sensitive to noise [3,57]. On the other hand, tree-based models, such as XGBoost [25] and LGBM [35], are relatively complex in design but did not show the anticipated accuracy in this study. This suggests that the inherent complexity of models may not always directly correlate with prediction accuracy. Furthermore, although we rigorously chose optimal hyperparameters for our experiments, each algorithm is characterized by specific hyperparameter combinations and applicable scopes, which undeniably play pivotal roles in model performance. Consequently, obtaining better bathymetric results requires both selecting a suitable model and carefully optimizing it according to dataset characteristics.
The adequate ICESat-2 training data from Anda Reef ensured the reliability of machine learning models and enabled a fair comparison of their best performance. However, machine learning algorithms may face limitations when there is a lack of extensive training data. Earlier studies indicated that the bathymetric errors of SDB models exhibited an overall decreasing trend and eventually stabilized with the increasing training data [15,68]. Moreover, machine learning models may be sensitive to environmental heterogeneity, which could necessitate calibration when applied to other sites with varying sample characteristics. Noteworthy, although machine learning models outperformed classical models, the feasibility and convenience of classical models for large-scale mapping should not be ignored. Many studies have shown that classical models can construct valid models with only a limited number of calibration points and exhibit excellent generalization ability, which enhances the utility of such models [15,48,69].

5.2. Application Perspectives and Potential Limitations of SDB Models

5.2.1. Application Perspectives of SDB Models in the Spratly Islands

The SDB methods have demonstrated the capability of integrating ICESat-2 with multispectral imagery for reliable bathymetric retrieval in optically shallow water areas [7,49,60]. Recently, several studies successfully produced bathymetric maps of specific areas in the Spratly Islands using this approach, overcoming the limitations of traditional in situ measurements. For example, Zhang et al. proposed an SDB method based on ICESat-2 diffuse attenuation signals to obtain the bathymetric maps of Zhongye Island [4]. Hsu et al. employed three semi-empirical functions to derive the bathymetric maps of six coral reefs in the SCS by merging ICESat-2 with Sentinel-2 [69]. Nguyen et al. evaluated the potential of bathymetry retrieval using ICESat-2 and Sentinel-2 for five islands in the SCS, obtaining an RMSE ranging from 0.66 m to 1.87 m [11]. The development of active-passive (e.g., ICESat-2/Sentinel-2) fusion bathymetry holds promise for producing accurate shallow water bathymetric maps across the Spratly Islands and globally.

5.2.2. Potential Limitations Analysis of SDB Models

The SDB methods offer a bathymetric view on a global scale; however, they inevitably possess the following limitations. The accuracy of the water depth estimation can be influenced by various factors, including data quality, water conditions and bottom features [59]. The SDB methods are mainly applicable to shallow water regions, where the availability and accuracy of bathymetry information could seriously reduce once water depths exceed 20 m. In addition, due to cloud coverage restricting the quantity of photons hitting the ground, ICESat-2 may provide a poor record of bathymetric data, even in near islands with high transparency [69]. The generality and reliability of the existing processing algorithms for ICESat-2 bathymetric photons are still exploratory. On the other hand, the reliability of satellite imagery plays a crucial role in the accuracy of bathymetry inversion. Situations when high-quality images are limited in some regions, such as no or few cloud-free images, are unavoidable. Moreover, some works have successfully monitored coral reefs using deep-learning-based approaches [70,71,72,73]. Clearly, there is a great potential to utilize deep learning for coral reef bathymetry, which can also help to more accurately obtain the bathymetric maps at large scales. Future improvements may benefit from additional data processing methods and further exploration of machine learning or deep learning techniques.

6. Conclusions

This study presented a comprehensive framework to evaluate the various bathymetric inversion methods by coupling ICESat-2 and Sentinel-2. Two classical models (Lyzenga and Stumpf) and six machine learning models (LGBM, XGBoost, RF, SVM, KNN, and MLP) were used to generate accurate topographic features of Anda Reef in the Spratly Islands. The accuracy of the bathymetric results was then validated with the in situ measurements. Our findings indicated that all SDB models could reflect the water depth distribution of coral reefs, but performance and accuracy generally decreased with increasing water depths, notably higher than 15 m. The average R2 and RMSE of classical models were 0.917 m and 1.386 m, respectively, within the depth range of 0–20 m. By contrast, machine learning techniques efficiently improved the bathymetric accuracy, and the mean R2 and RMSE can be as low as 0.943 m and 1.132 m, respectively. The MLP achieved the highest accuracy with an RMSE of 1.034, surpassing the performance of other models in deep waters (15–20 m). Overall, machine learning models exhibited superior reliability and generalizability compared to classical models, improving accuracy and topographic detail. The findings show that combining satellite data and machine learning approaches, specifically the MLP model, can effectively derive bathymetry in highly transparent waters. Future research will investigate the feasibility and robustness of more machine learning or deep learning techniques in complex water types, including turbid waters and coastal regions.

Author Contributions

Conceptualization, Liang Cheng and Jian Cheng; methodology, Jian Cheng; software, Jian Cheng; validation, Liang Cheng, Jian Cheng and Sensen Chu; formal analysis, Jian Cheng; investigation, Liang Cheng, Sensen Chu and Jian Cheng; resources, Liang Cheng; data curation, Liang Cheng; writing—original draft, Jian Cheng; writing—review and editing, Jian Cheng, Sensen Chu, Jizhe Li, Qixin Hu, Li Ye, Zhiyong Wang, Hui Chen and Liang Cheng; visualization, Jian Cheng, Jizhe Li and Qixin Hu; supervision, Liang Cheng; project administration, Liang Cheng; funding acquisition, Liang Cheng. All authors have read and agreed to the published version of the manuscript.

Funding

This work was supported by the National Key Research and Development Program of China (Liang Cheng, grant number 2022YFB3903603) and the National Natural Science Foundation of China (Sensen Chu, grant number 42001401).

Data Availability Statement

Data underlying the results presented in this paper are not publicly available at this time but may be obtained from the authors upon reasonable request.

Acknowledgments

The authors express their gratitude for the support from the ICESat-2 data download from NSIDC (https://nsidc.org/data/ATL03/versions/5) (accessed on 16 September 2023) and Sentinel-2 data download from either Earth Explorer-USGS (https://earthexplorer.usgs.gov/) (accessed on 16 September 2023) or data archive embedded in GEE platform (https://earthengine.google.com/) (accessed on 16 September 2023). The authors also thank the editor and anonymous reviewers for reviewing the paper.

Conflicts of Interest

The authors declare no conflict of interest.

References

  1. Caballero, I.; Stumpf, R.P. Confronting turbidity, the major challenge for satellite-derived coastal bathymetry. Sci. Total Environ. 2023, 870, 161898. [Google Scholar] [CrossRef]
  2. Cesbron, G.; Melet, A.; Almar, R.; Lifermann, A.; Tullot, D.; Crosnier, L. Pan-European Satellite-Derived Coastal Bathymetry—Review, User Needs and Future Services. Front. Mar. Sci. 2021, 8, 740830. [Google Scholar] [CrossRef]
  3. Eugenio, F.; Marcello, J.; Mederos-Barrera, A.; Marqués, F. High-Resolution Satellite Bathymetry Mapping: Regression and Machine Learning-Based Approaches. IEEE Trans. Geosci. Remote Sens. 2021, 60, 1–14. [Google Scholar] [CrossRef]
  4. Zhang, X.; Ma, Y.; Li, Z.; Zhang, J. Satellite derived bathymetry based on ICESat-2 diffuse attenuation signal without prior information. Int. J. Appl. Earth Obs. Geoinf. 2022, 113, 102993. [Google Scholar] [CrossRef]
  5. Chen, Y.; Le, Y.; Zhang, D.; Wang, Y.; Qiu, Z.; Wang, L. A photon-counting LiDAR bathymetric method based on adaptive variable ellipse filtering. Remote Sens. Environ. 2021, 256, 112326. [Google Scholar]
  6. Kutser, T.; Hedley, J.; Giardino, C.; Roelfsema, C.; Brando, V.E. Remote sensing of shallow waters–A 50 year retrospective and future directions. Remote Sens. Environ. 2020, 240, 111619. [Google Scholar] [CrossRef]
  7. Babbel, B.J.; Parrish, C.E.; Magruder, L.A. ICESat-2 elevation retrievals in support of satellite-derived bathymetry for global science applications. Geophys. Res. Lett. 2021, 48, e2020GL090629. [Google Scholar] [CrossRef]
  8. Thomas, N.; Pertiwi, A.P.; Traganos, D.; Lagomasino, D.; Poursanidis, D.; Moreno, S.; Fatoyinbo, L. Space-borne cloud-native satellite-derived Bathymetry (SDB) models using ICESat-2 and sentinel-2. Geophys. Res. Lett. 2021, 48, e2020GL092170. [Google Scholar] [CrossRef]
  9. Niroumand-Jadidi, M.; Bovolo, F.; Bruzzone, L. SMART-SDB: Sample-specific multiple band ratio technique for satellite-derived bathymetry. Remote Sens. Environ. 2020, 251, 112091. [Google Scholar] [CrossRef]
  10. Lu, X.; Hu, Y.; Omar, A.; Yang, Y.; Vaughan, M.; Rodier, S.; Garnier, A.; Ryan, R.; Getzewich, B.; Trepte, C. Nearshore bathymetry and seafloor property studies from Space lidars: CALIPSO and ICESat-2. Opt. Express 2022, 30, 36509–36525. [Google Scholar] [CrossRef]
  11. Nguyen, V.-A.; Ren, H.; Huang, C.-Y.; Tseng, K.-H. Bathymetry derivation in shallow water of the South China Sea with ICESat-2 and Sentinel-2 data. J. Appl. Remote Sens. 2021, 15, 044513. [Google Scholar] [CrossRef]
  12. Chen, H.; Chu, S.; Zhuang, Q.; Duan, Z.; Cheng, J.; Li, J.; Ye, L.; Yu, J.; Cheng, L. FSPN: End-to-end full-space pooling weakly supervised network for benthic habitat mapping using remote sensing images. Int. J. Appl. Earth Obs. Geoinf. 2023, 118, 103264. [Google Scholar] [CrossRef]
  13. Li, S.; Wang, X.H.; Ma, Y.; Yang, F. Satellite-Derived Bathymetry with Sediment Classification Using ICESat-2 and Multispectral Imagery: Case Studies in the South China Sea and Australia. Remote Sens. 2023, 15, 1026. [Google Scholar] [CrossRef]
  14. Cao, B.; Fang, Y.; Gao, L.; Hu, H.; Jiang, Z.; Sun, B.; Lou, L. An active-passive fusion strategy and accuracy evaluation for shallow water bathymetry based on ICESat-2 ATLAS laser point cloud and satellite remote sensing imagery. Int. J. Remote Sens. 2021, 42, 2783–2806. [Google Scholar] [CrossRef]
  15. Duan, Z.; Chu, S.; Cheng, L.; Ji, C.; Li, M.; Shen, W. Satellite-derived bathymetry using Landsat-8 and Sentinel-2A images: Assessment of atmospheric correction algorithms and depth derivation models in shallow waters. Opt. Express 2022, 30, 3238–3261. [Google Scholar] [CrossRef]
  16. Zhou, W.; Tang, Y.; Jing, W.; Li, Y.; Yang, J.; Deng, Y.; Zhang, Y. A Comparison of Machine Learning and Empirical Approaches for Deriving Bathymetry from Multispectral Imagery. Remote Sens. 2023, 15, 393. [Google Scholar] [CrossRef]
  17. Zhong, J.; Sun, J.; Lai, Z.; Song, Y. Nearshore Bathymetry from ICESat-2 LiDAR and Sentinel-2 Imagery Datasets Using Deep Learning Approach. Remote Sens. 2022, 14, 4229. [Google Scholar] [CrossRef]
  18. Huang, W.; Zhao, J.; Ai, B.; Sun, S.; Yan, N. Bathymetry and Benthic Habitat Mapping in Shallow Waters From Sentinel-2A Imagery: A Case Study in Xisha Islands, China. IEEE Trans. Geosci. Remote Sens. 2022, 60, 1–12. [Google Scholar] [CrossRef]
  19. Nguyen, T.; Liquet, B.; Mengersen, K.; Sous, D. Mapping of coral reefs with multispectral satellites: A review of recent papers. Remote Sens. 2021, 13, 4470. [Google Scholar] [CrossRef]
  20. Leng, Z.; Zhang, J.; Ma, Y.; Zhang, J. ICESat-2 Bathymetric Signal Reconstruction Method Based on a Deep Learning Model with Active–Passive Data Fusion. Remote Sens. 2023, 15, 460. [Google Scholar] [CrossRef]
  21. Wang, B.; Ma, Y.; Zhang, J.; Zhang, H.; Zhu, H.; Leng, Z.; Zhang, X.; Cui, A. A noise removal algorithm based on adaptive elevation difference thresholding for ICESat-2 photon-counting data. Int. J. Appl. Earth Obs. Geoinf. 2023, 117, 103207. [Google Scholar] [CrossRef]
  22. Li, N.; Tang, Q.; Chen, Y.; Dong, Z.; Li, J.; Fu, X. Satellite-derived bathymetry integrating spatial and spectral information of multispectral images. Appl. Opt. 2023, 62, 2017–2029. [Google Scholar] [CrossRef]
  23. Zhang, X.; Chen, Y.; Le, Y.; Zhang, D.; Yan, Q.; Dong, Y.; Han, W.; Wang, L. Nearshore bathymetry based on ICESat-2 and multispectral images: Comparison between sentinel-2, landsat-8, and testing Gaofen-2. IEEE J. Sel. Top. Appl. Earth Observ. Remote Sens. 2022, 15, 2449–2462. [Google Scholar] [CrossRef]
  24. Peng, K.; Xie, H.; Xu, Q.; Huang, P.; Liu, Z. A Physics-Assisted Convolutional Neural Network for Bathymetric Mapping Using ICESat-2 and Sentinel-2 Data. IEEE Trans. Geosci. Remote Sens. 2022, 60, 1–13. [Google Scholar] [CrossRef]
  25. Susa, T. Satellite derived bathymetry with Sentinel-2 imagery: Comparing traditional techniques with advanced methods and machine learning ensemble models. Mar. Geod. 2022, 45, 435–461. [Google Scholar] [CrossRef]
  26. Lee, Z.; Shangguan, M.; Garcia, R.A.; Lai, W.; Lu, X.; Wang, J.; Yan, X. Confidence measure of the shallow-water bathymetry map obtained through the fusion of Lidar and multiband image data. J. Remote Sens. 2021, 2021. [Google Scholar] [CrossRef]
  27. Lyzenga, D.R. Passive remote sensing techniques for mapping water depth and bottom features. Appl. Opt. 1978, 17, 379–383. [Google Scholar] [CrossRef] [PubMed]
  28. Stumpf, R.P.; Holderied, K.; Sinclair, M. Determination of water depth with high-resolution satellite imagery over variable bottom types. Limnol. Oceanogr. 2003, 48, 547–556. [Google Scholar] [CrossRef]
  29. Xu, N.; Ma, X.; Ma, Y.; Zhao, P.; Yang, J.; Wang, X.H. Deriving highly accurate shallow water bathymetry from Sentinel-2 and ICESat-2 datasets by a multitemporal stacking method. IEEE J. Sel. Top. Appl. Earth Obs. Remote Sens. 2021, 14, 6677–6685. [Google Scholar] [CrossRef]
  30. Yang, H.; Guo, H.; Dai, W.; Nie, B.; Qiao, B.; Zhu, L. Bathymetric mapping and estimation of water storage in a shallow lake using a remote sensing inversion method based on machine learning. Int. J. Digit. Earth 2022, 15, 789–812. [Google Scholar] [CrossRef]
  31. Pertiwi, A.; Carpenter, S.; Thomas, N.; Lee, C.B.; Traganos, D. Evaluating Multilinear and Machine Learning Regression Methods for Satellite-derived Bathymetry Mapping Using ICESat-2 and Sentinel-2 Data on Google Earth Engine. In Proceedings of the AGU Fall Meeting Abstracts, New Orleans, LA, USA, 13–17 December 2021; p. G54A–03. [Google Scholar]
  32. Chu, S.; Cheng, L.; Cheng, J.; Zhang, X.; Zhang, J.; Chen, J.; Liu, J. Shallow water bathymetry based on a back propagation neural network and ensemble learning using multispectral satellite imagery. Acta Oceanol. Sin. 2023, 42, 154–165. [Google Scholar] [CrossRef]
  33. Guo, X.; Jin, X.; Jin, S. Shallow Water Bathymetry Mapping from ICESat-2 and Sentinel-2 Based on BP Neural Network Model. Water 2022, 14, 3862. [Google Scholar] [CrossRef]
  34. Xie, C.; Chen, P.; Zhang, Z.; Pan, D. Satellite-derived bathymetry combined with Sentinel-2 and ICESat-2 datasets using machine learning. Front. Earth Sci. 2023, 11, 453. [Google Scholar] [CrossRef]
  35. Xie, T.; Kong, R.; Nurunnabi, A.; Bai, S.; Zhang, X. Machine Learning Method-based Inversion of Shallow Bathymetric Maps Using ICESat-2 ATL03 Data. IEEE J. Sel. Top. Appl. Earth Obs. Remote Sens. 2023, 16, 3697–3714. [Google Scholar] [CrossRef]
  36. Kibele, J.; Shears, N.T. Nonparametric empirical depth regression for bathymetric mapping in coastal waters. IEEE J. Sel. Top. Appl. Earth Obs. Remote Sens. 2016, 9, 5130–5138. [Google Scholar] [CrossRef]
  37. Drusch, M.; Del Bello, U.; Carlier, S.; Colin, O.; Fernandez, V.; Gascon, F.; Hoersch, B.; Isola, C.; Laberinti, P.; Martimort, P. Sentinel-2: ESA’s optical high-resolution mission for GMES operational services. Remote Sens. Environ. 2012, 120, 25–36. [Google Scholar] [CrossRef]
  38. Phiri, D.; Simwanda, M.; Salekin, S.; Nyirenda, V.R.; Murayama, Y.; Ranagalage, M. Sentinel-2 data for land cover/use mapping: A review. Remote Sens. 2020, 12, 2291. [Google Scholar] [CrossRef]
  39. European Space Agency (ESA). User Handbook; ESA Standard Document; ESA: Paris, France, 2015; Volume 64, p. 64. [Google Scholar]
  40. Gorelick, N.; Hancher, M.; Dixon, M.; Ilyushchenko, S.; Thau, D.; Moore, R. Google Earth Engine: Planetary-scale geospatial analysis for everyone. Remote Sens. Environ. 2017, 202, 18–27. [Google Scholar] [CrossRef]
  41. Markus, T.; Neumann, T.; Martino, A.; Abdalati, W.; Brunt, K.; Csatho, B.; Farrell, S.; Fricker, H.; Gardner, A.; Harding, D. The Ice, Cloud, and land Elevation Satellite-2 (ICESat-2): Science requirements, concept, and implementation. Remote Sens. Environ. 2017, 190, 260–273. [Google Scholar] [CrossRef]
  42. Popescu, S.; Zhou, T.; Nelson, R.; Neuenschwander, A.; Sheridan, R.; Narine, L.; Walsh, K. Photon counting LiDAR: An adaptive ground and canopy height retrieval algorithm for ICESat-2 data. Remote Sens. Environ. 2018, 208, 154–170. [Google Scholar] [CrossRef]
  43. Abdalati, W.; Zwally, H.J.; Bindschadler, R.; Csatho, B.; Farrell, S.L.; Fricker, H.A.; Harding, D.; Kwok, R.; Lefsky, M.; Markus, T. The ICESat-2 laser altimetry mission. Proc. IEEE 2010, 98, 735–751. [Google Scholar] [CrossRef]
  44. Smith, B.; Fricker, H.A.; Holschuh, N.; Gardner, A.S.; Adusumilli, S.; Brunt, K.M.; Csatho, B.; Harbeck, K.; Huth, A.; Neumann, T. Land ice height-retrieval algorithm for NASA's ICESat-2 photon-counting laser altimeter. Remote Sens. Environ. 2019, 233, 111352. [Google Scholar] [CrossRef]
  45. Neumann, T.; Brenner, A.; Hancock, D.; Robbins, J.; Saba, J.; Harbeck, K.; Gibbons, A.; Lee, J.; Luthcke, S.; Rebold, T. ATLAS/ICESat-2 L2A Global Geolocated Photon Data, Version 5; NASA National Snow and Ice Data Center Distributed Active Archive Center: Boulder, CO, USA, 2021. [Google Scholar]
  46. Chu, S.; Cheng, L.; Ruan, X.; Zhuang, Q.; Zhou, X.; Li, M.; Shi, Y. Technical framework for shallow-water bathymetry with high reliability and no missing data based on time-series sentinel-2 images. IEEE Trans. Geosci. Remote Sens. 2019, 57, 8745–8763. [Google Scholar] [CrossRef]
  47. Li, J.; Knapp, D.E.; Schill, S.R.; Roelfsema, C.; Phinn, S.; Silman, M.; Mascaro, J.; Asner, G.P. Adaptive bathymetry estimation for shallow coastal waters using Planet Dove satellites. Remote Sens. Environ. 2019, 232, 111302. [Google Scholar] [CrossRef]
  48. Ma, Y.; Xu, N.; Liu, Z.; Yang, B.; Yang, F.; Wang, X.H.; Li, S. Satellite-derived bathymetry using the ICESat-2 lidar and Sentinel-2 imagery datasets. Remote Sens. Environ. 2020, 250, 112047. [Google Scholar] [CrossRef]
  49. Li, J.; Knapp, D.E.; Lyons, M.; Roelfsema, C.; Phinn, S.; Schill, S.R.; Asner, G.P. Automated global shallow water bathymetry mapping using Google Earth Engine. Remote Sens. 2021, 13, 1469. [Google Scholar] [CrossRef]
  50. Ashphaq, M.; Srivastava, P.K.; Mitra, D. Review of near-shore satellite derived bathymetry: Classification and account of five decades of coastal bathymetry research. J. Ocean Eng. Sci. 2021, 6, 340–359. [Google Scholar] [CrossRef]
  51. Malambo, L.; Popescu, S. Photonlabeler: An inter-disciplinary platform for visual interpretation and labeling of icesat-2 geolocated photon data. Remote Sens. 2020, 12, 3168. [Google Scholar] [CrossRef]
  52. Parrish, C.E.; Magruder, L.A.; Neuenschwander, A.L.; Forfinski-Sarkozi, N.; Alonzo, M.; Jasinski, M. Validation of ICESat-2 ATLAS bathymetry and analysis of ATLAS’s bathymetric mapping performance. Remote Sens. 2019, 11, 1634. [Google Scholar] [CrossRef]
  53. Ranndal, H.; Sigaard Christiansen, P.; Kliving, P.; Baltazar Andersen, O.; Nielsen, K. Evaluation of a statistical approach for extracting shallow water bathymetry signals from ICESat-2 ATL03 photon data. Remote Sens. 2021, 13, 3548. [Google Scholar] [CrossRef]
  54. Thomas, N.; Lee, B.; Coutts, O.; Bunting, P.; Lagomasino, D.; Fatoyinbo, L. A purely spaceborne open source approach for regional bathymetry mapping. IEEE Trans. Geosci. Remote Sens. 2022, 60, 1–9. [Google Scholar] [CrossRef]
  55. Gardner, M.W.; Dorling, S. Artificial neural networks (the multilayer perceptron)—A review of applications in the atmospheric sciences. Atmos. Environ. 1998, 32, 2627–2636. [Google Scholar] [CrossRef]
  56. Liu, S.; Gao, Y.; Zheng, W.; Li, X. Performance of two neural network models in bathymetry. Remote Sens. Lett. 2015, 6, 321–330. [Google Scholar] [CrossRef]
  57. Alevizos, E. A combined machine learning and residual analysis approach for improved retrieval of shallow bathymetry from hyperspectral imagery and sparse ground truth data. Remote Sens. 2020, 12, 3489. [Google Scholar] [CrossRef]
  58. Surisetty, V.A.K.; Venkateswarlu, C.; Gireesh, B.; Prasad, K.; Sharma, R. On improved nearshore bathymetry estimates from satellites using ensemble and machine learning approaches. Adv. Space Res. 2021, 68, 3342–3364. [Google Scholar] [CrossRef]
  59. Ashphaq, M.; Srivastava, P.K.; Mitra, D. Preliminary examination of influence of Chlorophyll, Total Suspended Material, and Turbidity on Satellite Derived-Bathymetry estimation in coastal turbid water. Reg. Stud. Mar. Sci. 2023, 62, 102920. [Google Scholar] [CrossRef]
  60. Mudiyanselage, S.; Abd-Elrahman, A.; Wilkinson, B.; Lecours, V. Satellite-derived bathymetry using machine learning and optimal Sentinel-2 imagery in South-West Florida coastal waters. Gisci. Remote Sens. 2022, 59, 1143–1158. [Google Scholar] [CrossRef]
  61. Biau, G.; Scornet, E. A random forest guided tour. Test 2016, 25, 197–227. [Google Scholar] [CrossRef]
  62. Fan, C.; Song, C.; Liu, K.; Ke, L.; Xue, B.; Chen, T.; Fu, C.; Cheng, J. Century-scale reconstruction of water storage changes of the largest lake in the inner mongolia plateau using a machine learning approach. Water Resour. Res. 2021, 57, e2020WR028831. [Google Scholar] [CrossRef]
  63. Zhang, Y.; Liu, J.; Shen, W. A review of ensemble learning algorithms used in remote sensing applications. Appl. Sci. 2022, 12, 8654. [Google Scholar] [CrossRef]
  64. Huber, S.; Hansen, L.B.; Nielsen, L.T.; Rasmussen, M.L.; Sølvsteen, J.; Berglund, J.; Paz von Friesen, C.; Danbolt, M.; Envall, M.; Infantes, E. Novel approach to large-scale monitoring of submerged aquatic vegetation: A nationwide example from Sweden. Integr. Environ. Assess. Manag. 2022, 18, 909–920. [Google Scholar] [CrossRef] [PubMed]
  65. Dong, L.; Qi, J.; Yin, B.; Zhi, H.; Li, D.; Yang, S.; Wang, W.; Cai, H.; Xie, B. Reconstruction of Subsurface Salinity Structure in the South China Sea Using Satellite Observations: A LightGBM-Based Deep Forest Method. Remote Sens. 2022, 14, 3494. [Google Scholar] [CrossRef]
  66. Ke, G.; Meng, Q.; Finley, T.; Wang, T.; Chen, W.; Ma, W.; Ye, Q.; Liu, T.-Y. Lightgbm: A highly efficient gradient boosting decision tree. Adv. Neural Inf. Process. Syst. 2017, 30, 3149–3157. [Google Scholar]
  67. Liu, Y.; Zhao, J.; Deng, R.; Liang, Y.; Gao, Y.; Chen, Q.; Xiong, L.; Liu, Y.; Tang, Y.; Tang, D. A downscaled bathymetric mapping approach combining multitemporal Landsat-8 and high spatial resolution imagery: Demonstrations from clear to turbid waters. ISPRS J. Photogramm. Remote Sens. 2021, 180, 65–81. [Google Scholar] [CrossRef]
  68. Chu, S.; Cheng, L.; Cheng, J.; Zhang, X.; Liu, J. Comparison of six empirical methods for multispectral satellite-derived bathymetry. Mar. Geod. 2023, 46, 149–174. [Google Scholar] [CrossRef]
  69. Hsu, H.-J.; Huang, C.-Y.; Jasinski, M.; Li, Y.; Gao, H.; Yamanokuchi, T.; Wang, C.-G.; Chang, T.-M.; Ren, H.; Kuo, C.-Y. A semi-empirical scheme for bathymetric mapping in shallow water by ICESat-2 and Sentinel-2: A case study in the South China Sea. ISPRS J. Photogramm. Remote Sens. 2021, 178, 1–19. [Google Scholar] [CrossRef]
  70. Akbari Asanjan, A.; Das, K.; Li, A.; Chirayath, V.; Torres-Perez, J.; Sorooshian, S. Learning instrument invariant characteristics for generating high-resolution global coral reef maps. In Proceedings of the 26th ACM SIGKDD International Conference on Knowledge Discovery & Data Mining, Virtual, CA, USA, 6–10 July 2020; pp. 2617–2624. [Google Scholar]
  71. Gonzalez-Rivero, M.; Beijbom, O.; Rodriguez-Ramirez, A.; Bryant, D.E.; Ganase, A.; Gonzalez-Marrero, Y.; Herrera-Reveles, A.; Kennedy, E.V.; Kim, C.J.; Lopez-Marcano, S. Monitoring of coral reefs using artificial intelligence: A feasible and cost-effective approach. Remote Sens. 2020, 12, 489. [Google Scholar] [CrossRef]
  72. Modasshir, M.; Rekleitis, I. Enhancing coral reef monitoring utilizing a deep semi-supervised learning approach. In Proceedings of the International Conference on Robotics and Automation (ICRA), Paris, France, 31 May–31 August 2020; pp. 1874–1880. [Google Scholar]
  73. Yu, X.; Ma, Y.; Farrington, S.; Reed, J.; Ouyang, B.; Principe, J.C. Fast segmentation for large and sparsely labeled coral images. In Proceedings of the International Joint Conference on Neural Networks (IJCNN), Budapest, Hungary, 14–19 July 2019; pp. 1–6. [Google Scholar]
Figure 1. The map of the study area. (a) Location of Anda Reef in the SCS region. (b) Location of Anda Reef in Zhenghe Reefs. (c) Different colored lines of ICESat-2 trajectories represent the data obtained on different dates.
Ijgi 12 00381 g001
Figure 2. The 12 high-quality Sentinel-2 images of Anda Reef, four images per year from 2019 to 2021. Most images are close to the best conditions for visual judgment (e.g., almost no clouds, low turbidity, and low white caps).
Ijgi 12 00381 g002
Figure 3. The spatial distribution of in situ observations of Anda Reef.
Ijgi 12 00381 g003
Figure 4. The multialgorithm evaluation framework of classical and machine learning methods for SDB by integrating Sentinel-2 images and ICESat-2 ATL03.
Ijgi 12 00381 g004
Figure 5. The ATL03 GT3L data of Anda Reef on 30 March 2022. (a) Spatial distribution of the track. The red line indicates the whole trajectory and the yellow line depicts the seafloor signal photon. (b) The classification results of the sea surface and seafloor photons.
Ijgi 12 00381 g005
Figure 6. (a) The optimal composite Sentinel-2 image. (b) The distribution characteristics of ICESat-2 bathymetric points.
Ijgi 12 00381 g006
Figure 7. Accuracy analysis of eight models based on the measured data: (a) MLP, (b) KNN, (c) SVM, (d) RF, (e) XGBoost, (f) LGBM, (g) Stumpf, and (h) Lyzenga.
Ijgi 12 00381 g007
Figure 8. Bathymetric maps of Anda Reef developed from (a) MLP, (b) KNN, (c) SVM, (d) RF, (e) XGBoost, (f) LGBM, (g) Stumpf, and (h) Lyzenga. The purple box line compares the local detail of various SDB bathymetry maps.
Ijgi 12 00381 g008
Figure 9. Depth profiles of bathymetric maps using eight SDB methods for Anda Reef. (ad) represent profiles along transect P1, P2, P3, and P4, respectively, where P1 is the depth segments of the measured sonar data. The black arrows indicate the direction of the profile line. The red box lines highlight areas with significant differences in the various bathymetric maps.
Ijgi 12 00381 g009
Table 1. The optimal hyperparameters of six machine learning models were used in this study. Unmentioned hyperparameters are default.
ModelsOptimal Hyperparameters
MLPhidden_layer_sizes = (20, 15), activation = tanh, solver = lbfgs,
alpha = 0.0001, max_iter = 100,000
KNNn_estimators = 5, p = 1, algorithm = brute, weights = uniform.
SVMkernel = rbf, gamma = 1000, penalty parameters C = 100
RFn_estimators = 600, max_depth = 14, min_samples_leaf = 1,
min_samples_split = 2, bootstrap = True
XGBoostn_estimators = 600, max_depth = 6, gamma = 0.1, subsample = 0.6
LGBMn_estimators = 400, max_depth = 3, num_leaves = 8,
boosting_type = gbdt, feature_ fraction = 0.9
Table 2. The MAE and RMSE values of eight SDB models at various depth ranges.
ModelsAccuracy IndicatorWater Depth (m) (the Number of Validation Points)
0–5 (226)5–10 (488)10–15 (400)15–20 (157)
LyzengaMAE (m)0.6970.7230.6653.042
RMSE (m)0.8520.9580.8853.233
StumpfMAE (m)0.5610.8540.8352.440
RMSE (m)0.7271.1311.1122.623
LGBMMAE (m)0.4520.8590.7791.603
RMSE (m)0.8091.1361.0092.038
XGBoostMAE (m)0.4440.8880.7361.496
RMSE (m)0.7591.1510.9711.910
RFMAE (m)0.4420.8690.7841.421
RMSE (m)0.7921.1511.1051.808
SVMMAE (m)0.3820.9280.6771.532
RMSE (m)0.6331.1940.8781.969
KNNMAE (m)0.4540.8680.7341.164
RMSE (m)0.6961.1350.9961.430
MLPMAE (m)0.3910.9050.7121.137
RMSE (m)0.6051.1510.9171.367
The bold numbers represent the highest accuracy within each water depth interval.
Disclaimer/Publisher’s Note: The statements, opinions and data contained in all publications are solely those of the individual author(s) and contributor(s) and not of MDPI and/or the editor(s). MDPI and/or the editor(s) disclaim responsibility for any injury to people or property resulting from any ideas, methods, instructions or products referred to in the content.

