Article

Assessing Potable Water Access and Its Implications for Households’ Livelihoods: The Case of Sibi in the Nkwanta North District, Ghana

1
Department of Geography and Planning, The University of Toledo, Toledo, OH 45840, USA
2
Department of Geography and Regional Planning, University of Cape Coast, Cape Coast, Ghana
3
Centre for Coastal Management, African Centre of Excellence in Coastal Resilience, University of Cape Coast, Cape Coast, Ghana
*
Author to whom correspondence should be addressed.
ISPRS Int. J. Geo-Inf. 2023, 12(9), 365; https://doi.org/10.3390/ijgi12090365
Submission received: 30 July 2023 / Revised: 23 August 2023 / Accepted: 30 August 2023 / Published: 2 September 2023

Abstract

:
Despite water being a basic human need, the residents of Sibi in Ghana’s Nkwanta North District struggle to obtain potable water, which negatively influences their livelihoods. This study aimed to evaluate the impacts on households’ livelihoods due to difficulties in accessing potable water and accordingly give policy recommendations. Data were collected through questionnaire surveys, interviews, geographic information systems (GIS), and remote sensing (RS) techniques. Questionnaire surveys were administered to 314 randomly selected household heads. The results indicated that the water sources available in Sibi were not sufficient; the boreholes and public tabs/standpipes in the communities were not dependable for regular access. As a result, households needed to depend on distant streams and dams for water. The households generally spent more than two hours at the water sources to collect water. Evidently, the Sibi residents did not have sufficient access to potable water, which severely affected their livelihoods. It is recommended that government agencies collaborate with related non-governmental organizations (NGOs) to help expand potable water projects in Sibi, Ghana.

1. Introduction

Potable water access is a fundamental right of humans as it is crucial to meet their basic needs, such as drinking, cooking, personal hygiene, and sanitation [1]. Access to potable water is defined as “the ease of having a consistent supply of drinkable water close to the point of demand, that is, within everyone’s reach: at home, at school, at work, or in public spaces” [2]. Access to potable water is determined by how easily the residents of a community can reach a water point source. Usually, a water point source is considered accessible if it is within a 30-min walk or less than 2 km away [3]. Access to potable water remains a significant global challenge despite the United Nations’ (UN) efforts through Sustainable Development Goal Six. The Sustainable Development Goals (SDGs) report by the UN indicates that approximately 2.2 billion people around the world lack easy access to potable water [4], with approximately 400 million people in Sub-Saharan Africa lacking access to basic drinking water [5,6]. The UN report further predicts that approximately 700 million people will be displaced by 2030 if potable water access is not improved [4].
In Sub-Saharan Africa, access to potable water remains a challenge according to previous research [7]. For instance, Smiley [8] reported that primary water sources were located far away from homes, with some people in Dar es Salaam, Tanzania spending over 30 min queuing to access water. Similarly, Smits et al. [9] found that residents in Ward 16 of Bushbuckridge Local Municipality of South Africa experienced long wait times of over 4 h when collecting water. Díaz-Alcaide et al. [10] reported that people in the Centre Nord region of Burkina Faso traveled up to 500 m to access water.
This research focuses on Sibi in Ghana, which, like other Sub-Saharan African countries, experiences inadequate water access. Over the years, the government of Ghana has made efforts to address this by commissioning the Ghana Water Company Limited (GWCL) and formulating a National Water Policy to improve potable water access. However, these efforts have not yielded the expected results, and access to potable water is still a significant challenge in many communities in Ghana [11]. Previous studies showed that access to potable water is a major challenge in many Ghanaian communities. A report by UNICEF indicated that one out of every ten people spends more than 30 min to access potable water sources in Ghana [11]. Mahama et al. [12] reported that 97.7% of people in Accra, Ghana’s capital city, who traveled outside of their homes to obtain water spent a maximum of 30 min collecting it. Peprah, Oduro-Ofori, and Asante-Owusu [13] also reported that most residents in Awutu-Sanya East Municipality in Ghana accessed water from unhygienic sources such as rivers and unprotected wells. As a result, 80–90% of the sampled households in the Awutu-Sanya East Municipality waited in long queues daily to access potable water for domestic purposes [13]. Adjakloe [14] found that the Maryera community in Ghana spent an average of one hour to obtain water for their households.
The focus of the aforementioned water access studies in Sub-Saharan Africa, including Ghana, was primarily on urban areas, leading to a limited understanding of the challenges faced by rural communities in obtaining water. In addition, most of these studies have relied mainly on the social dimensions of water access, without considering the spatial locations and accessibility of water sources [8,12,13,14]. Hence, this research uses both social and spatial dimensions to examine water access and analyze how insufficient water access impacts the livelihoods of rural residents in Ghana. This is a critical issue that requires attention as access to potable water can significantly affect rural livelihoods [15], such as agricultural and domestic activities.
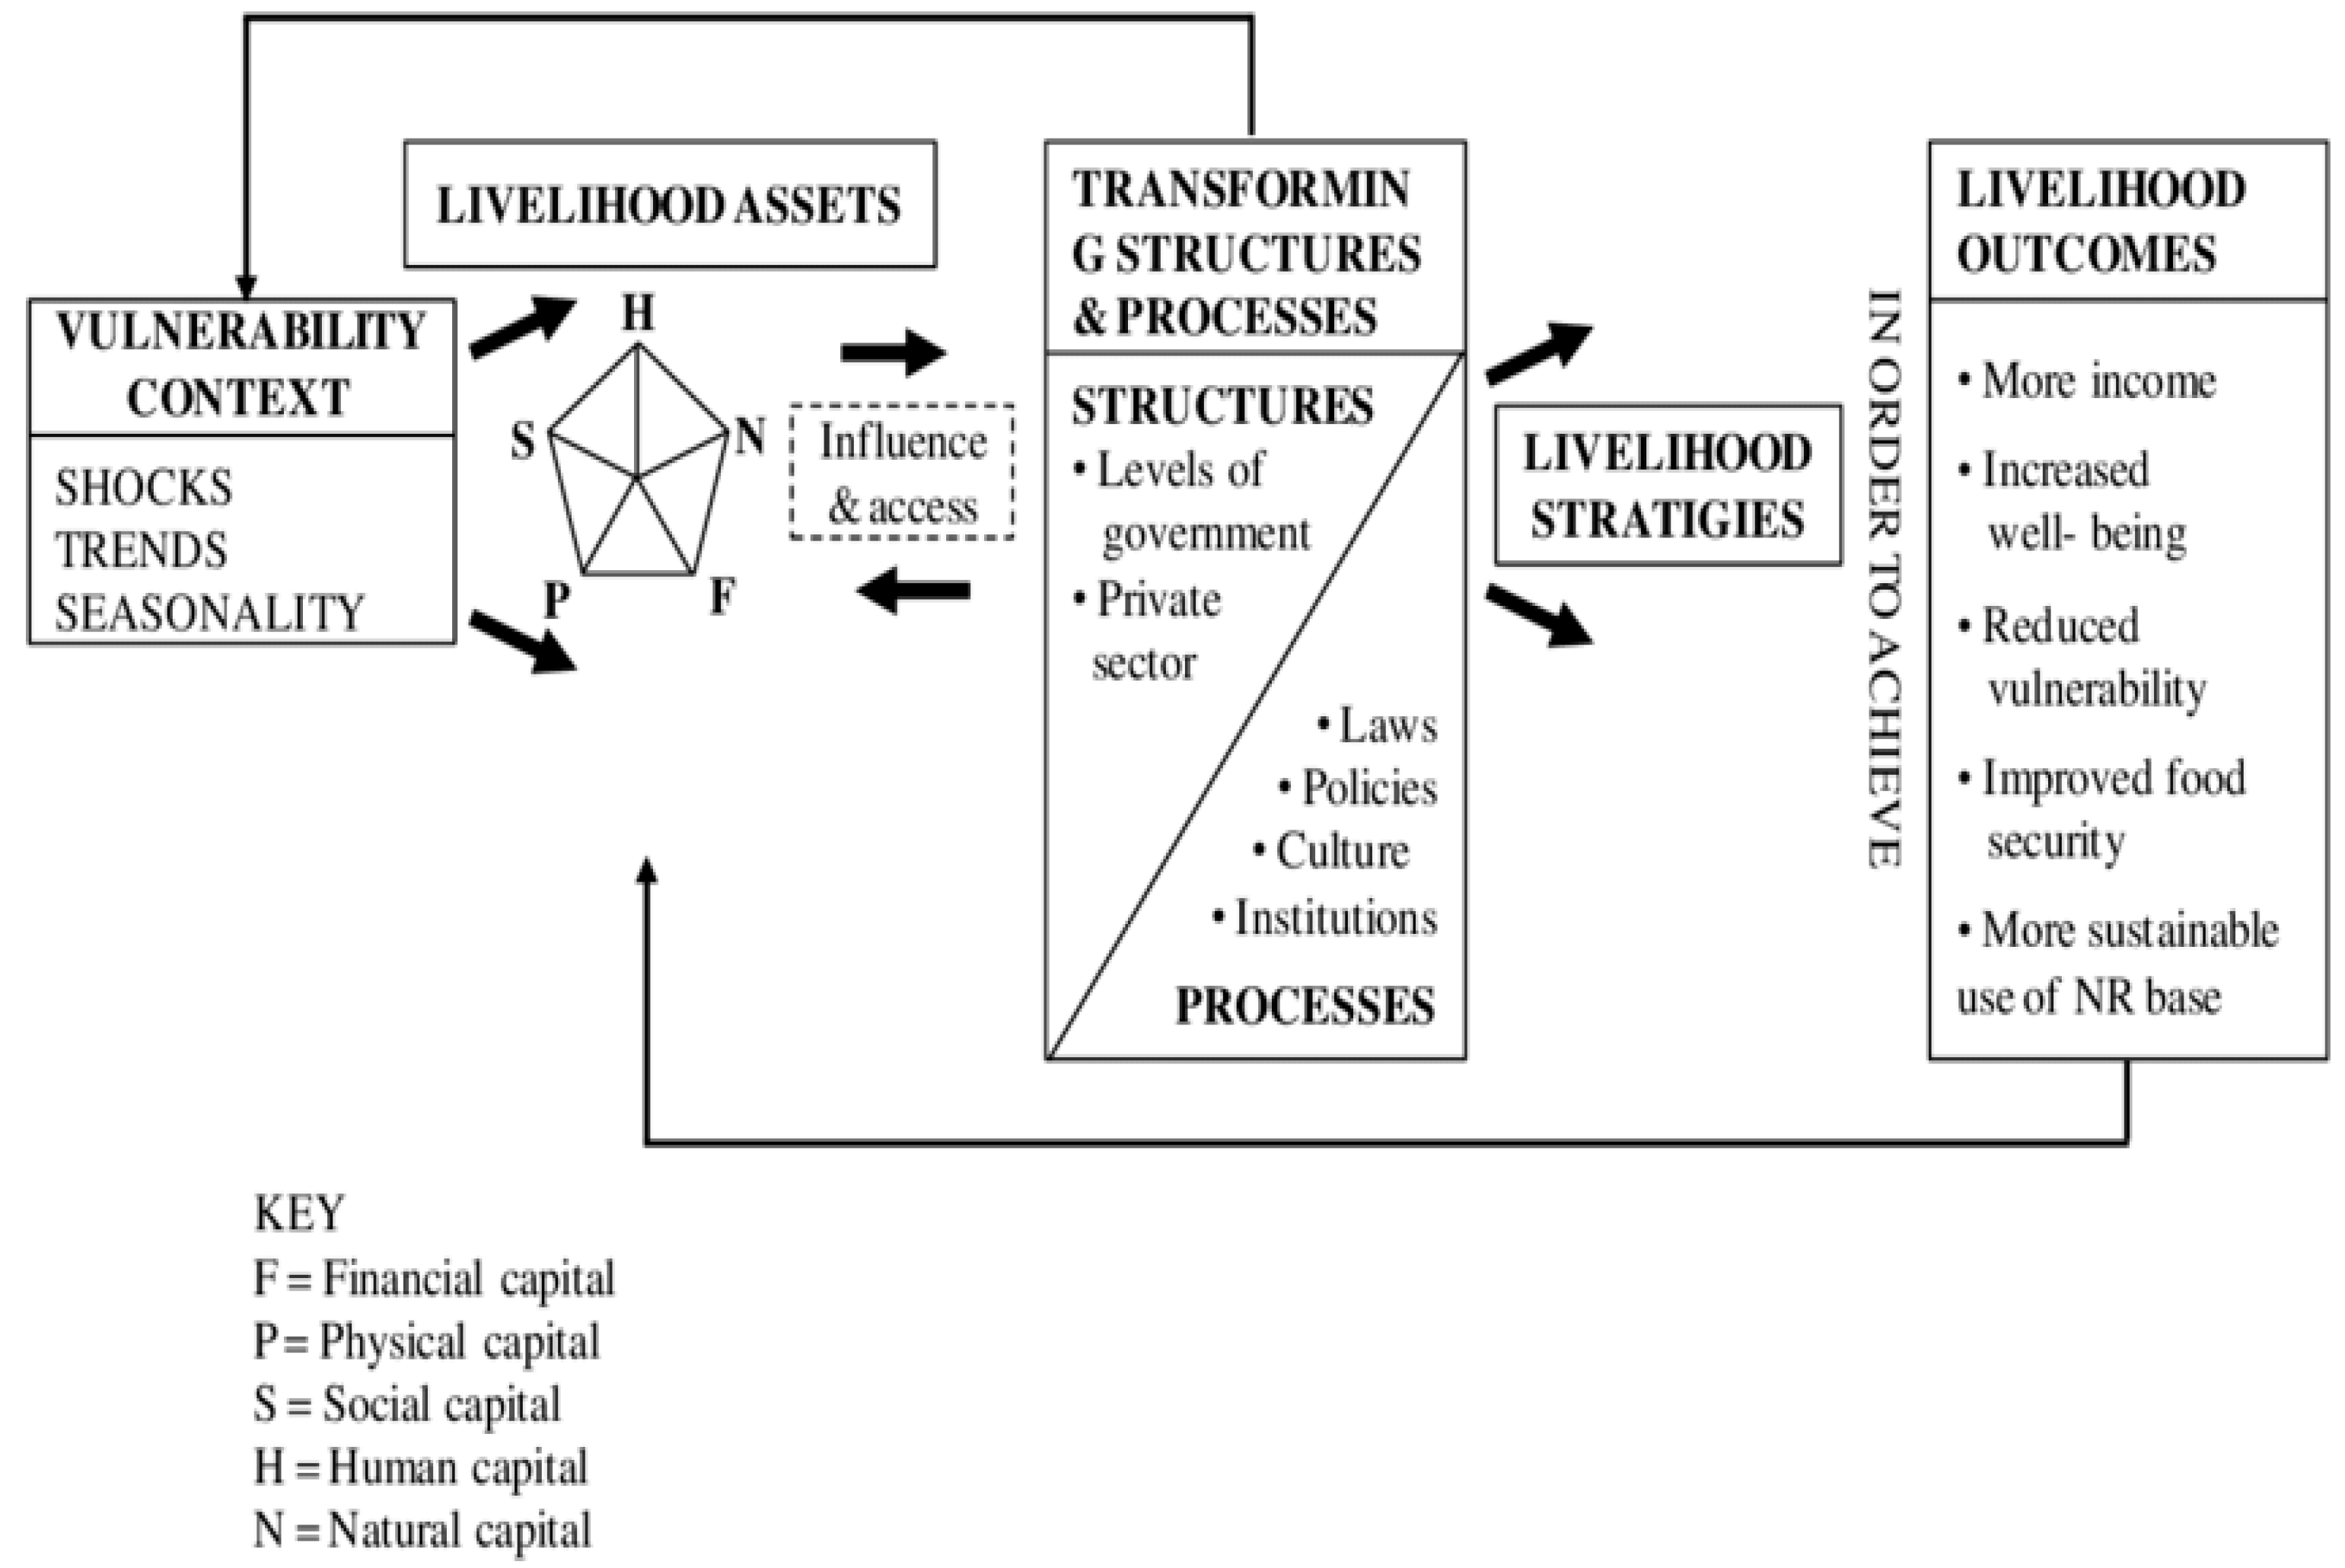
As defined by Chambers and Conway, livelihood encompasses how people live, including their access to food, income, and assets [16]. Access to safe and drinkable water is a crucial element of both tangible and intangible assets [17] for individuals. For households, having sufficient access to potable water can contribute to a healthier lifestyle, time and expenditure savings, empowerment, food security, and increased productivity and income [2,6,18,19]. These factors are all critical components of rural development and poverty reduction. Conversely, inadequate access to safe water resources can decrease labor productivity and increase the cost of water access, resulting in negative outcomes for economically disadvantaged populations [20,21]. The household water management strategies employed to regulate domestic water usage play significant roles in determining the availability of the water supply, as they directly impact the aggregated demand for water resources [22]. Jonah, Maitho, and Omware’s [23] research in Nakuru, Kenya indicated that potable water availability, quality, and affordability determined the community’s level of household assets, thereby impacting the community’s livelihoods. They reported that the majority of the population in Nakuru was affected by water quality issues as most people suffered from diarrhea, dysentery, and amoebiasis after using the water. The ill health of these people as a result of the lack of quality potable water affected their livelihoods; the health status affects the ability of an individual to carry out their livelihood activities and access sources of income [24].
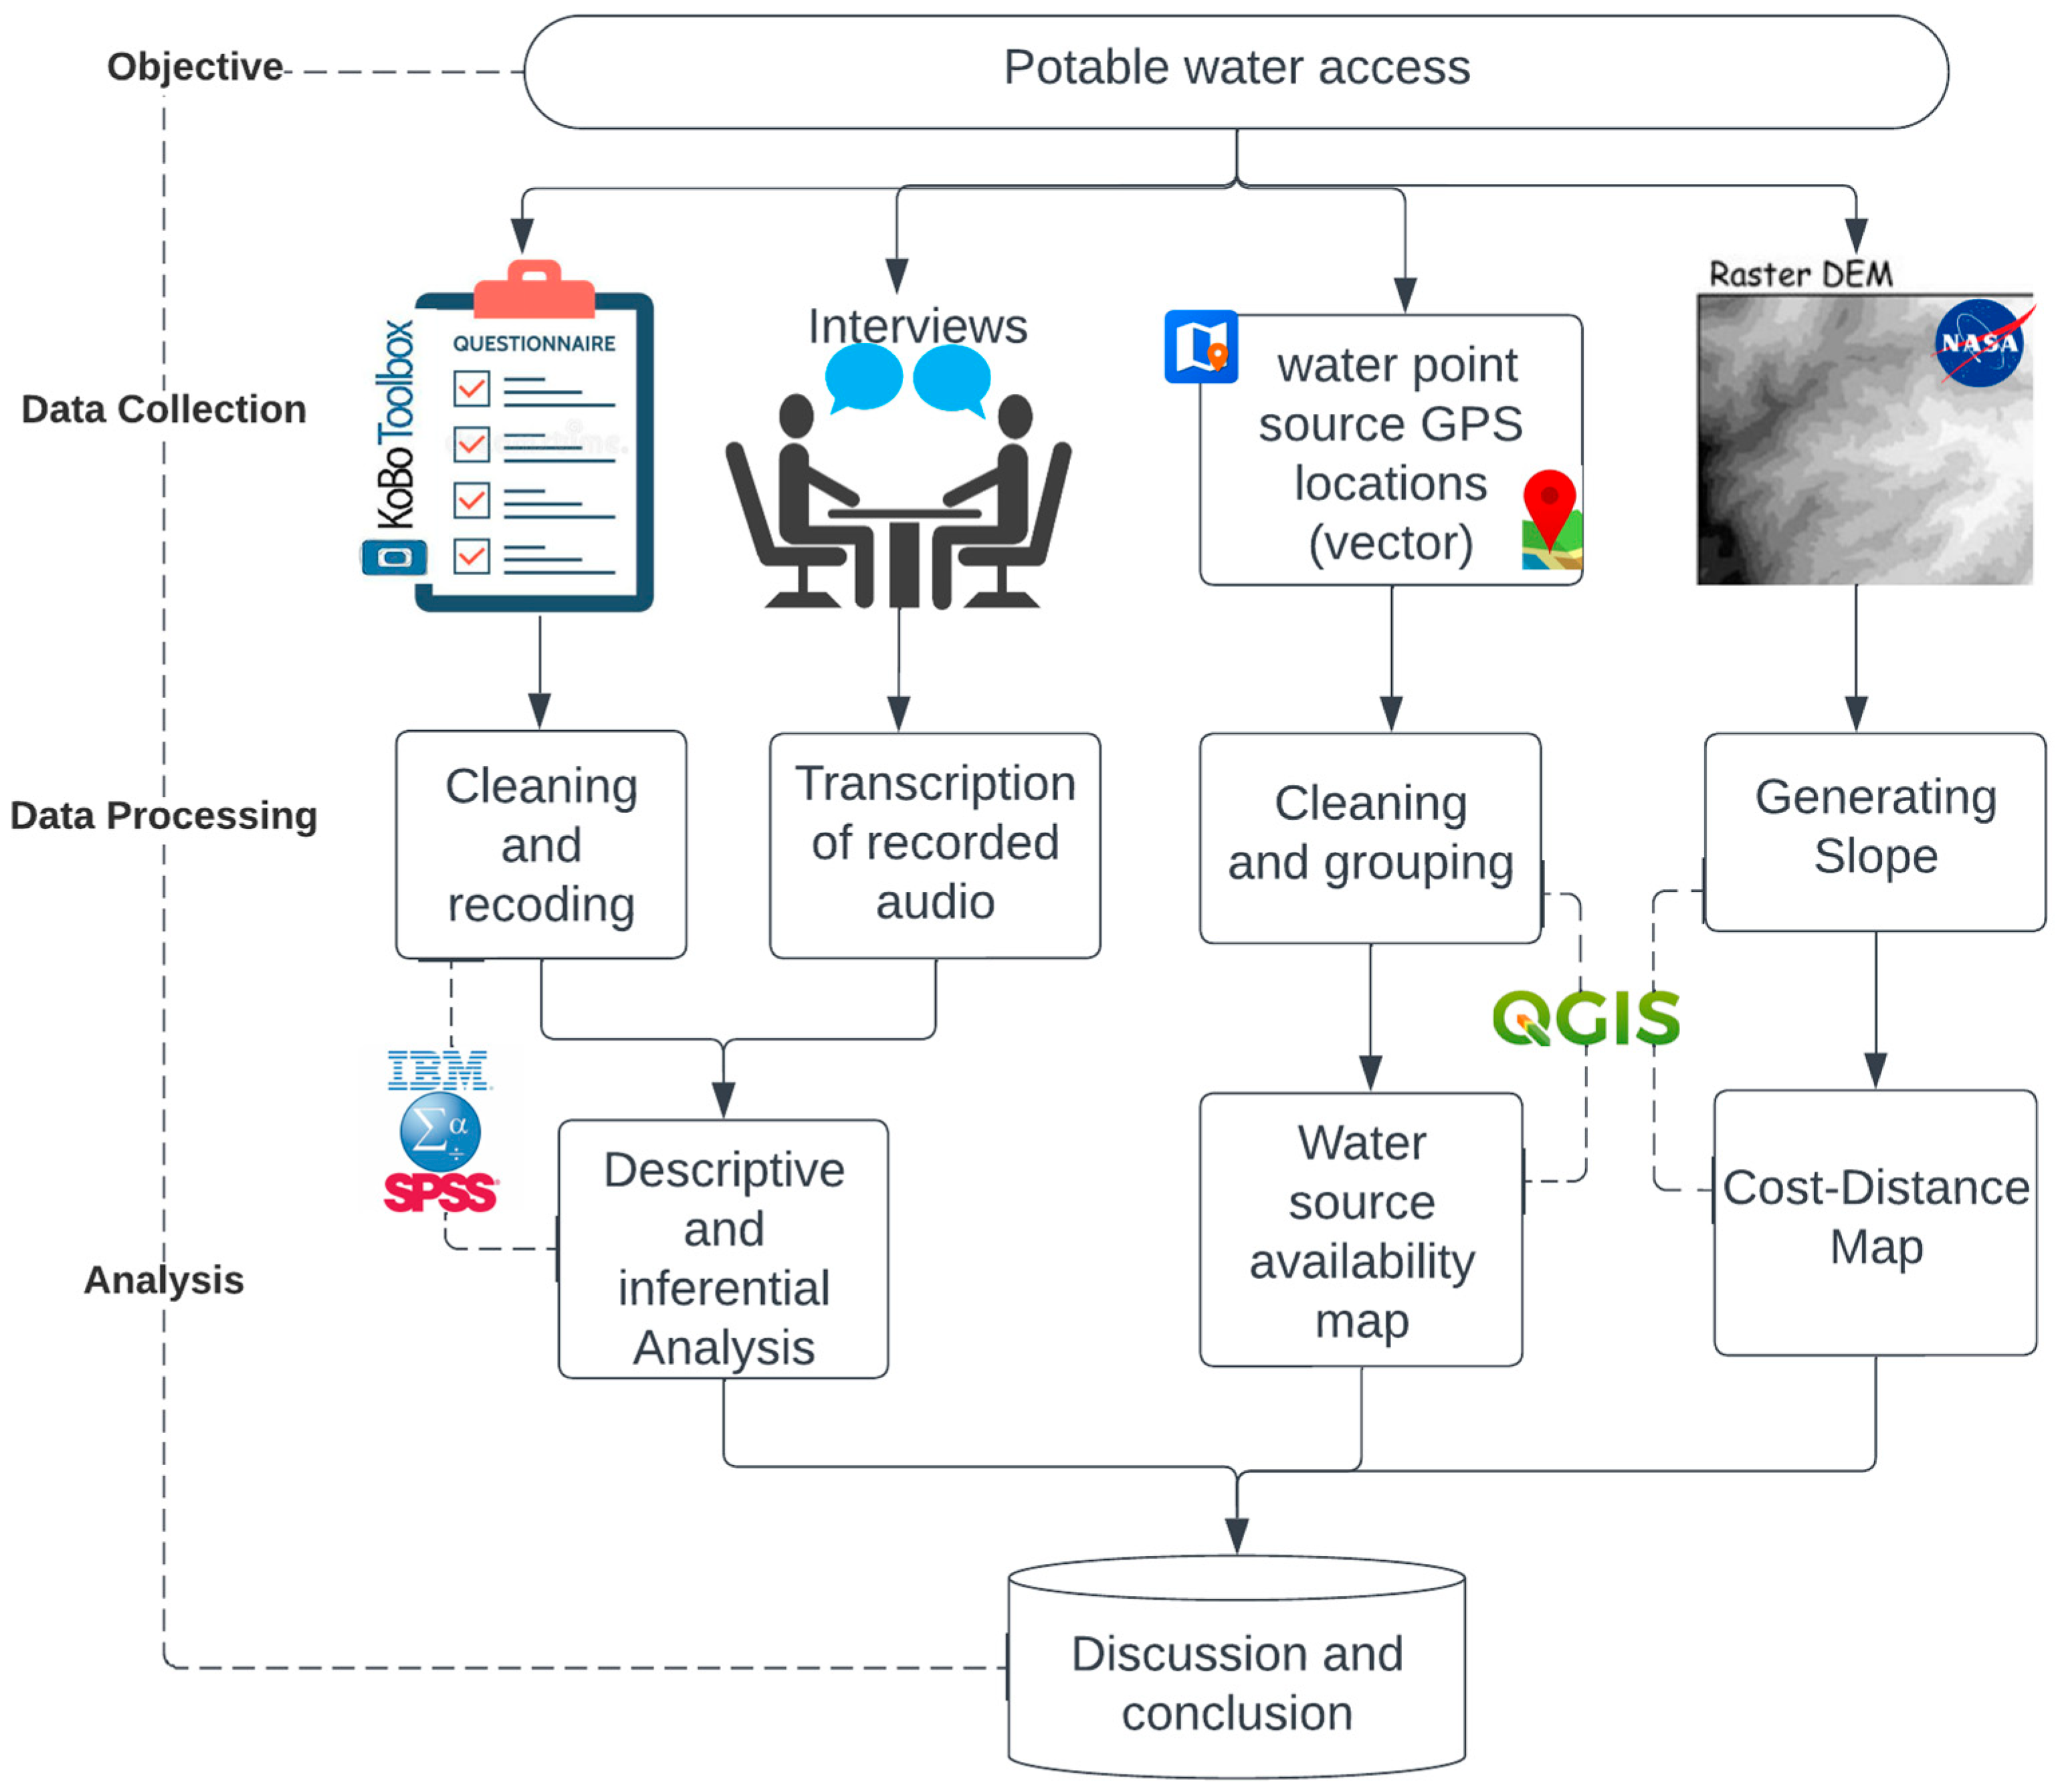
The aforementioned situations are not different from that of the Sibi community in Ghana. The main objective of this study is to evaluate the impacts on households’ livelihoods due to difficulties in accessing potable water in Sibi and accordingly give policy recommendations. Specifically, the study maps the available water sources, assesses the level of access to potable water, investigates the effects of potable water non-access on livelihoods, and determines the coping and management strategies used by households in Sibi.

2. Study Area

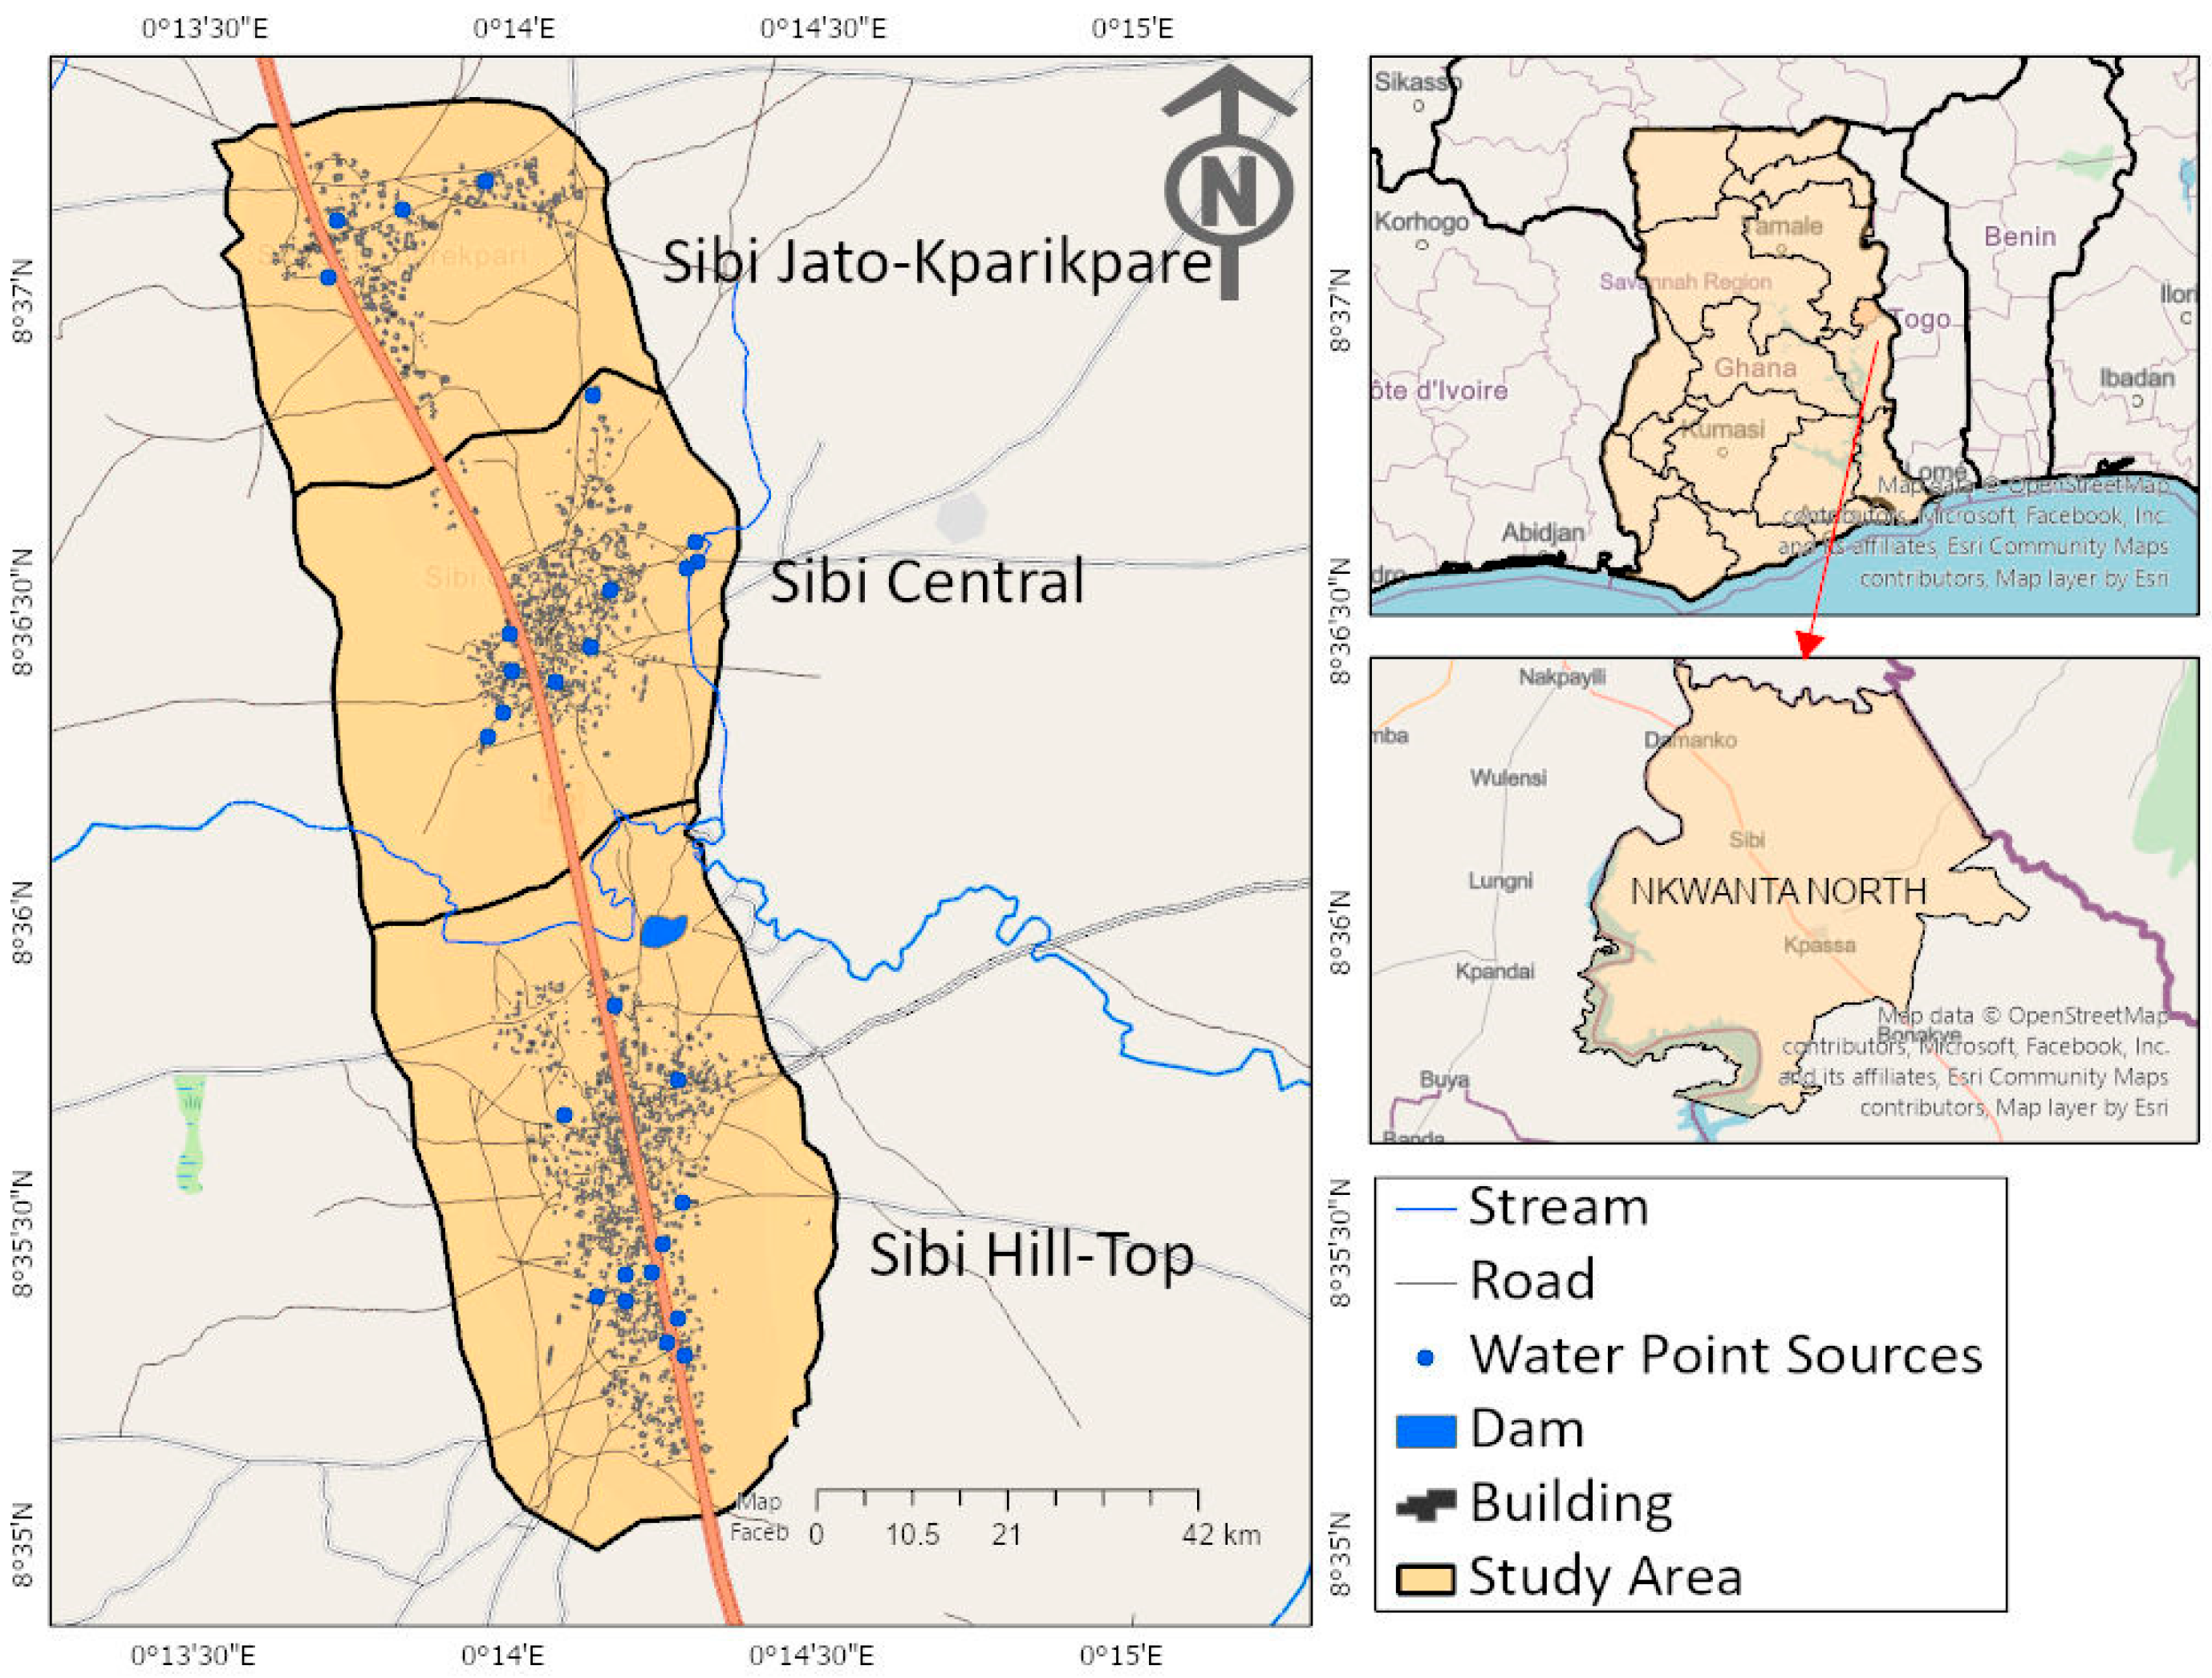
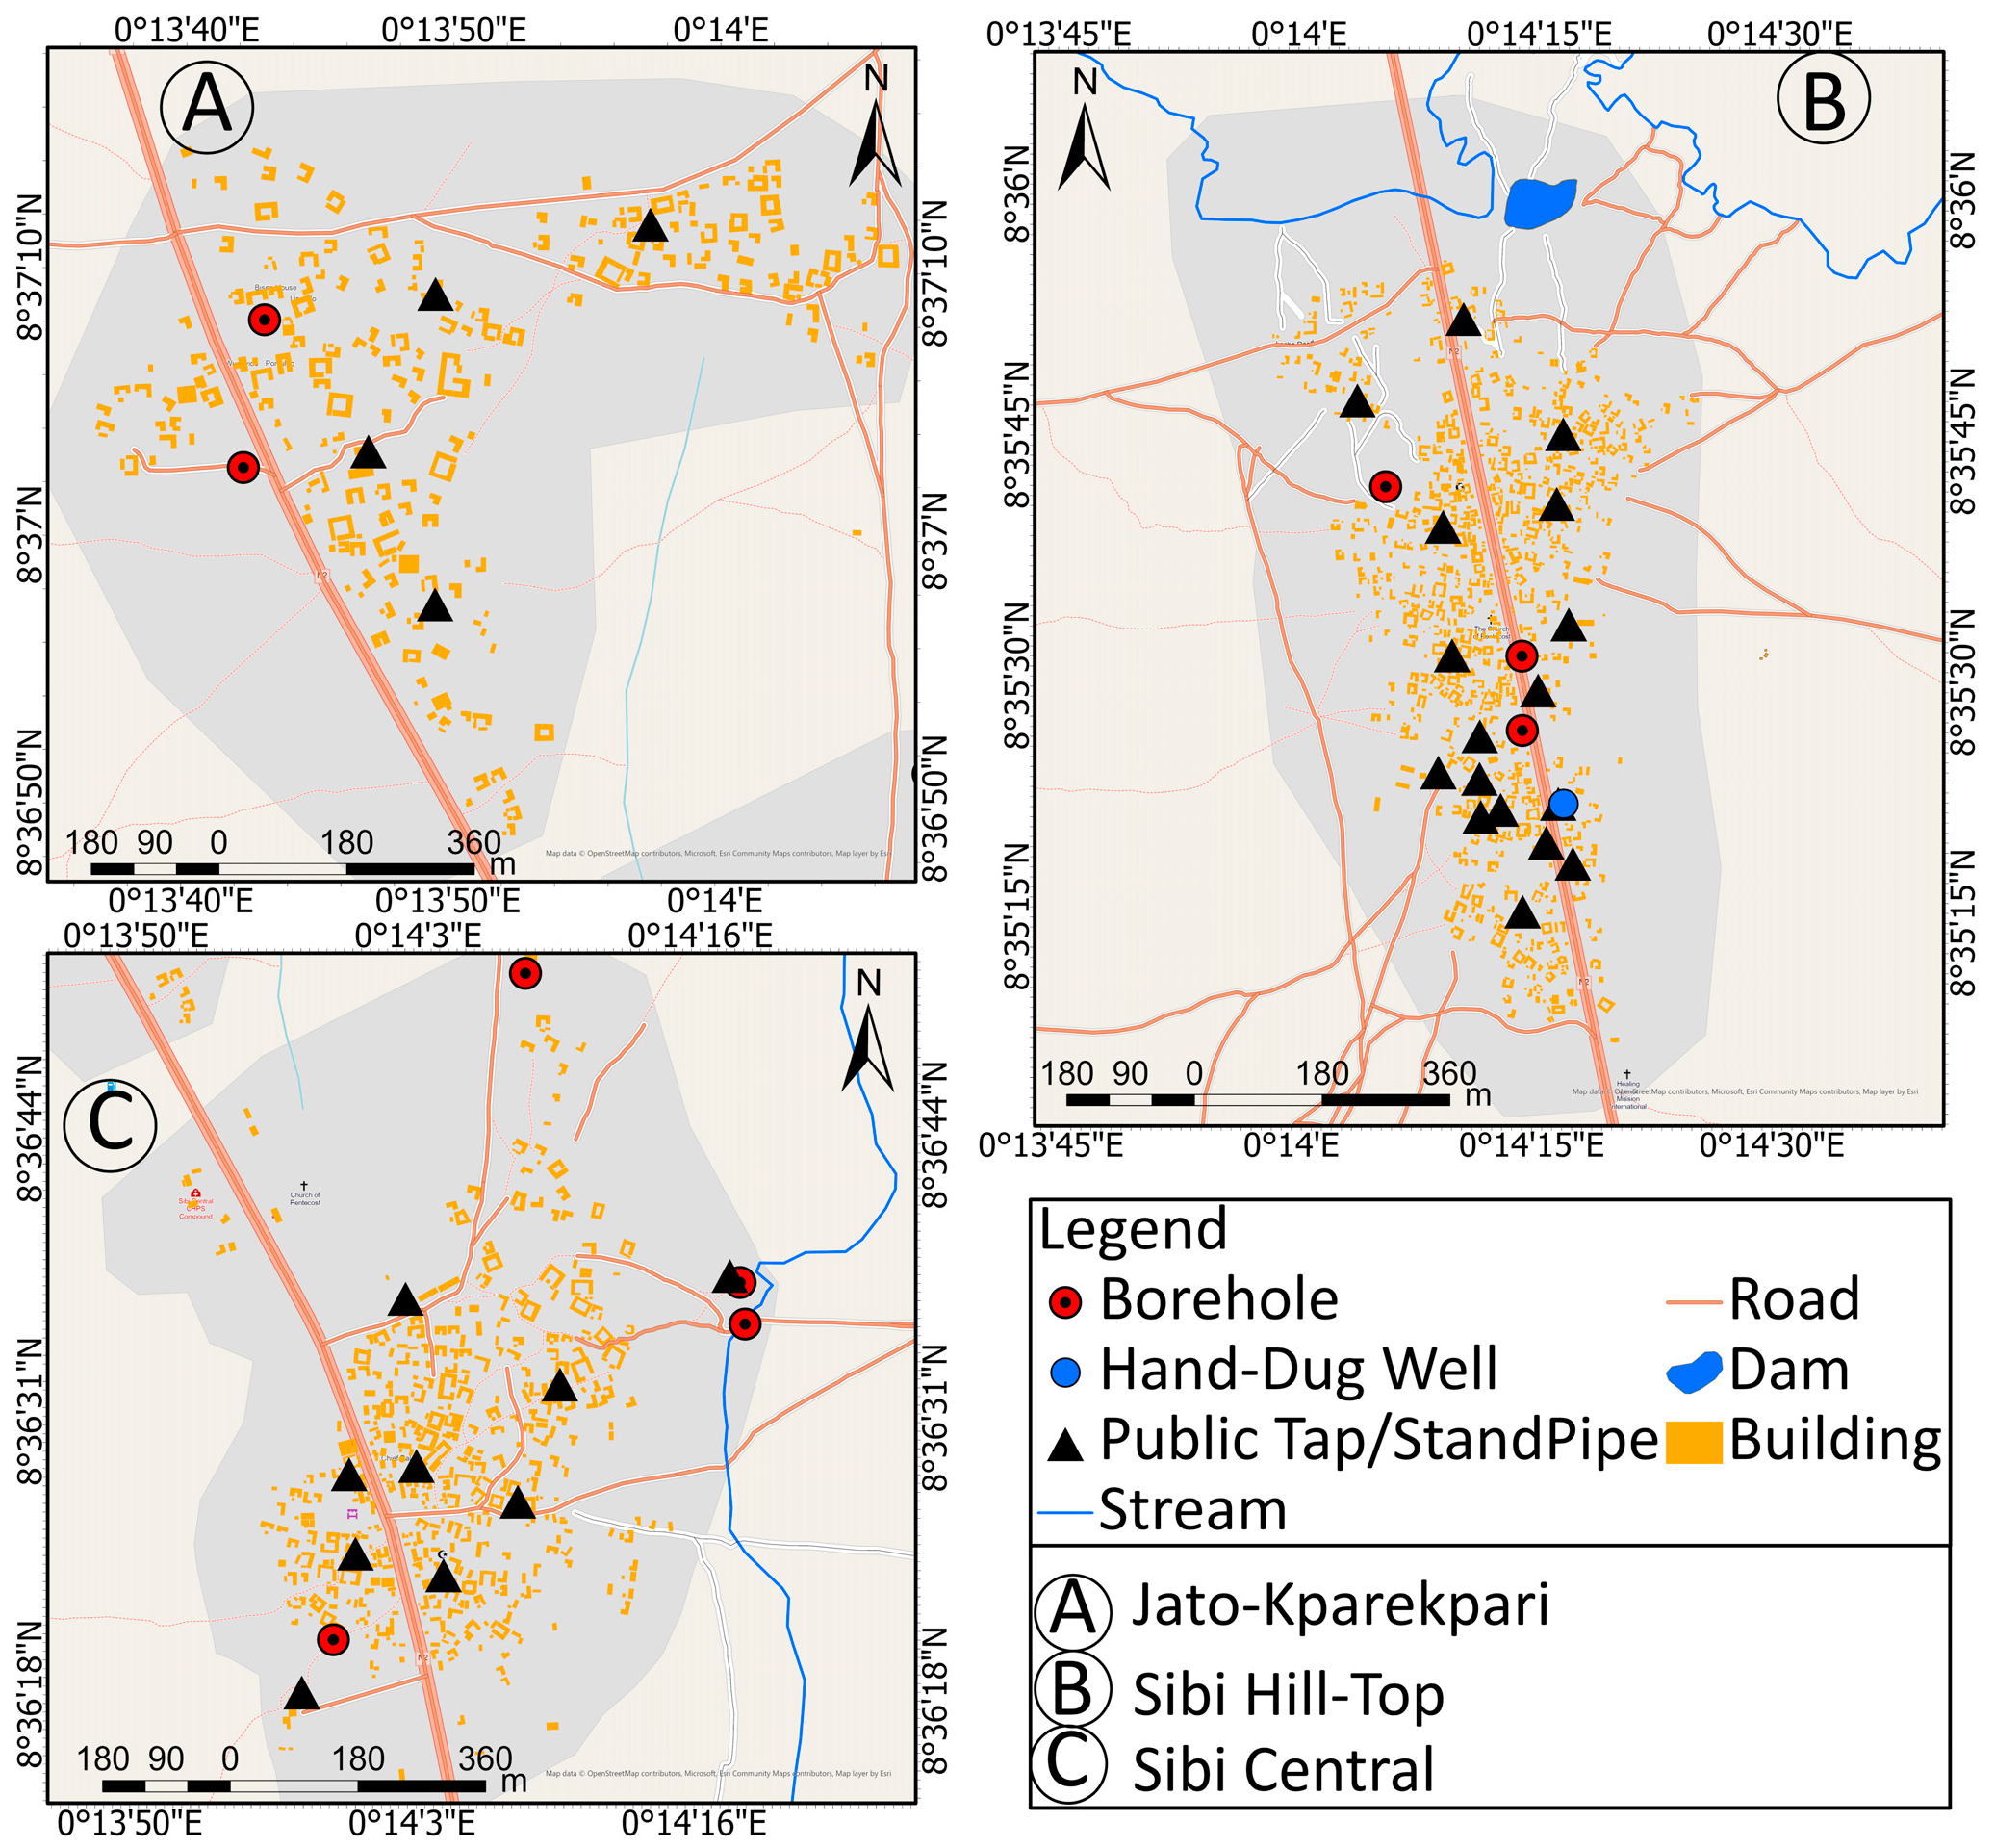
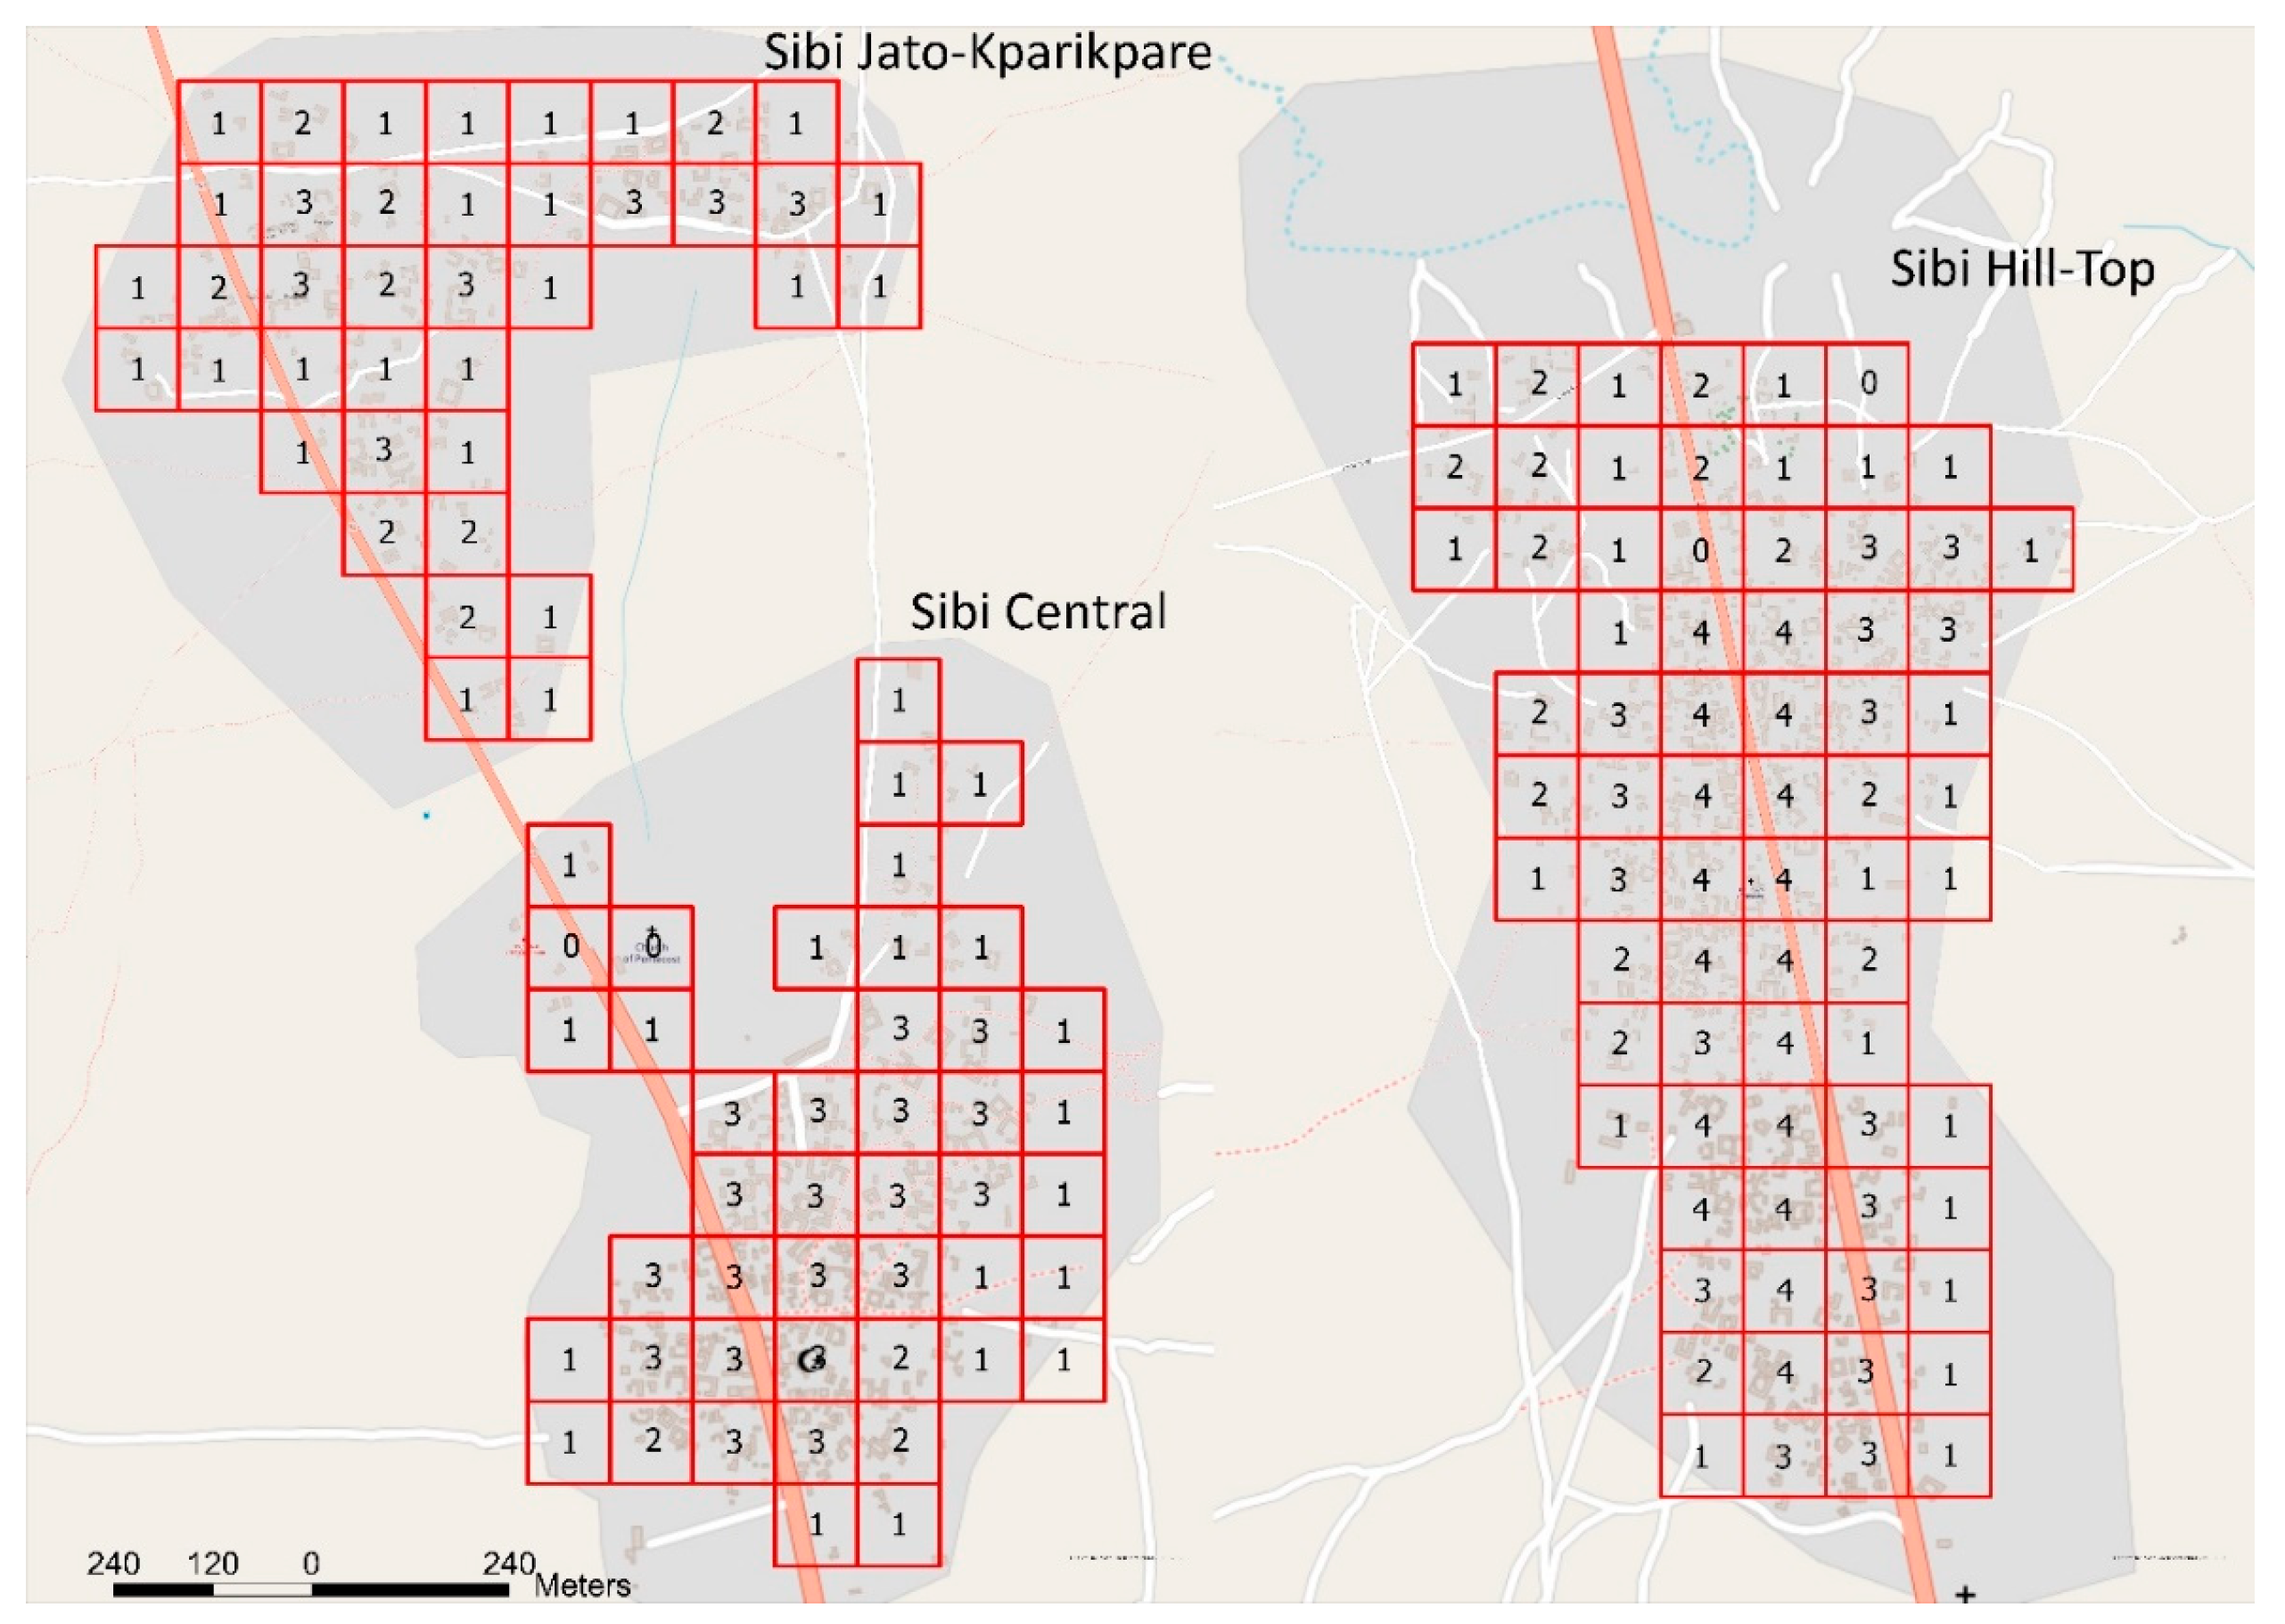
The study area of this research was Sibi, which is located in the Nkwanta North District of Ghana. Sibi is made up of three communities: Sibi Hill Top, Sibi Central, and Sibi Jato-Kparikpare. Sibi is located between latitude 8°35′00″ N and 8°38′00″ N and longitude 0°13′30″ E and 0°14′35″ E (Figure 1). It is located at the center of the Nkwanta North District of Ghana. The Nkwanta North District shares boundaries with the Nkwanta South District to the south, Nanumba South District to the north, Kpandai District to the west, and the Republic of Togo to the east (Figure 1). This study was conducted in 2021. The population growth rate of this district was 2.3% [25], and, based on this, the population of Sibi was projected to be 10,687 in 2021 and the projected number of household heads was 1467. Currently, the population of the community is estimated to reach approximately 15,000 [26]. The Nkwanta North District forms part of the tropical climatic zone, characterized by double maxima rainfall (i.e., between April and July and between August and September). The dry season, however, is between November and March. Average annual rainfall ranges from 922 mm to 1874 mm. This district is endowed with several rivers and streams, the most important of which are the Oti and Kpassa Rivers, which flow from Togo [26]. Despite having a piped water system, it is evidenced that the residents of Sibi still travel long distances to neighboring towns to access domestic water, particularly during the dry season, when the water source for pipe systems and surface groundwater dries up [27]. Residents in Sibi usually use walking as their main mode of transport to water sources.

3. Methods

This study employed a combination of quantitative and qualitative methods. These methods were carefully chosen to address the research objectives (Figure 2). This was essential because it provided a multi-dimensional understanding of potable water access and its impact on households’ livelihoods in Sibi. Quantitative methods allowed us to conduct systematic and statistical analyses of the availability, reliability, affordability, and waiting time of households in accessing water sources. Further, qualitative methods promoted a deeper understanding of the experiences, perceptions, and challenges faced by the community members. These insights could uncover nuanced aspects that quantitative data may not capture, such as cultural beliefs, social dynamics, and community-specific factors affecting water access. Figure 2 shows a summary of the methods that were used in this study.

3.1. Data Collection

Both quantitative and qualitative data were used to achieve the research objectives. Quantitative data included the spatial locations of the water point sources and households’ locations, the digital elevation model (DEM), and survey responses from the household heads, while qualitative data included interview responses from the community leaders (Figure 2). The spatial locations of the water point sources were acquired by visiting and mapping GPS locations and functionality information using the SW-Maps android application (version 2.7). This procedure was accomplished with the help of the residents, who helped the field mapping officer to identify the locations of the water point sources and the functionality information of these sources. The field mapping officer then recorded the GPS locations of the water point sources with their functionality information. This participatory mapping approach fostered community involvement and local knowledge integration. The major roads’ and households’ locations were acquired by creating and mapping buildings and roads on the TeachOpenStreetMap (TeachOSM) Tasking Manager website (tasks.teachosm.org) by the Humanitarian OpenStreetMap Team, Washington, D.C. 20005, United States (Accessed on 19 November 2021). This platform enabled the mapping of buildings, major roads, and surface water sources using high-resolution (50 cm per pixel) Bing satellite images and Maxar Premium Satellite images. The use of TeachOSM mapping tasks allowed for crowd-sourced mapping and was recommended by the sponsors of this research (YouthMappers). In addition, Aster’s digital elevation model (30 × 30 m resolution) data were downloaded from the NASA Earth data website for slope and cost–distance calculations. This DEM was used because it was the only available option for the study area.
To comprehensively understand the households’ perspectives on their levels of water access and how it affected their livelihoods, a survey was conducted using structured questionnaires adapted from Agyemang [28], subsequently modified, assessed by the research team, and piloted to ensure reliability and validity. The survey was conducted on 314 household heads who were chosen at random from the three geographically clustered communities. This survey was conducted using the KoboToolbox (version 2) mobile application. The use of KoboToolbox was deemed necessary because it helped to monitor the accuracy of the data in the field and also made it easy to download and store the data in Excel format. The questionnaire contained four sections: one for demographic characteristics and three for the research objectives (see Appendix C).
The sample size of 314 was estimated using Yamane’s formula (see Appendix A for details) [29], which has been widely used in many studies [30,31,32]. To ensure randomness and representation, a sampling grid of 100 by 100 square meters (see Appendix A, Figure A1) was generated for each community using the Tessellation tool in QGIS version 3.24. With this technique, 1 to 5 household heads were randomly selected from each grid and surveyed until each cluster’s sample size was obtained. This was done repeatedly until the targeted sample size for the entire study area was obtained. This technique was adopted because it was a robust and unbiased sampling approach and helped to facilitate the random selection of household heads. It is worth noting that most of the respondents were female (60%) as they are typically the ones who are responsible for collecting water for each household. Although we were able to explain the questions to them to make sure that they understood them well before answering, there was a possibility that respondents did not answer truthfully to some or all questions due to their incentive to improve water access in their community.
With the qualitative data, three interviews were conducted with key community authorities, including a chief and two assembly members (Appendix D). These individuals were deliberately selected and interviewed because they played a vital role as opinion leaders, bridging the gap between water users and managers. Their perspectives provided a valuable contextual understanding of the water access situation in the community and how the authorities were addressing this issue.
The study was conducted with strict adherence to ethical principles. Before beginning, the research topic was approved by both senior research supervisors at the Department of Geography and Regional Planning at the University of Cape Coast and the research board of YouthMappers (USAID Geocenter). This thorough review aimed to ensure that the research was viable and harmless to participants. Additionally, community leaders were consulted, and their consent was obtained through an introductory letter (see Appendix B) from the Department of Geography and Regional Planning at the University of Cape Coast. When collecting data, the researchers introduced themselves transparently and refrained from providing any false information. The respondents’ privacy was also respected, and they had the autonomy to choose whether to respond to certain questions or not. The right to anonymity was strictly maintained, and participants’ confidentiality was a top priority. These ethical measures, from topic approval to data collection and beyond, ensured the welfare of the participants.

3.2. Data Processing and Analysis

Our study used the availability, waiting time, distance to water sources, and affordability (monetary cost) dimensions of water access to measure the level of water access in Sibi. QGIS version 3.26 was used to analyze spatial data and generate maps of available water point sources, distance analysis, and cost–distance analysis (Figure 2). Cost–distance analysis was conducted to determine how slope and distance influenced the level of accessibility to water sources. Slope, in degrees, which was generated from the Aster DEM, was used to determine the cost–distance to water sources. Slope plays a significant role when it comes to the distance and cost of travel to access a facility [28] as it is one of the impediments to movement. This made it prudent to conduct a cost–distance analysis in this research. Additionally, household survey data were organized, analyzed, and interpreted using SPSS version 29. Descriptive statistics such as means, frequencies, and percentages were used to analyze the data. Additionally, a generalized linear model (gamma with log link function) was employed to assess the relationship between potable water access factors and residents’ livelihoods. Figure 2 shows the overall flow of this study.
An index was created to quantify the overall experienced livelihood impacts shown in the questionnaires. It was the mean value of the 5-point Likert scale scores from the responses to question 19 of the questionnaire (see Appendix C). This question evaluated the overall livelihoods of residents. These responses ranged from 1 to 5, where 1 represented “strongly disagree” and 5 represented “strongly agree”. A larger index suggested more severe overall livelihood impacts. A gamma with log link function generalized linear model (GLM) in SPSS version 29 was used to determine the relationships between the accessibility factors and the overall experienced impacts of limited potable water access on livelihoods. The dependent variable (overall index for experienced impacts on livelihoods) was not normally distributed; rather, it had positive skewness, as shown in Figure A2. As a result, the gamma with log link function GLM was used to fit the model so that its expected values could be predicted as a linear function of the explanatory variables [33]. The model was represented by the formula below.
g(Y) = β0 + β1×1 + β2×2 + β3×3 + …+ βnXn
where g() is the log link function that relates X linearly to Y, Y = dependent variable, Β0 = intercept, Βn = the coefficients of the independent variables, and Xn = independent variables.

3.3. Definition of Water Access

The term “water access” has no universal definition. Various international NGOs have provided definitions of potable water access using different criteria. The United Nations Development Programme (UNDP), the World Health Organization (WHO), the United Nations Children’s Fund (UNICEF), the Water Supply and Sanitation Collaborative Council (WSSCC), and the World Bank have all contributed to defining access to potable water. At the global scale, the UN’s Joint Monitoring Program (UN/JMP) and the World Health Organization define access to water based on the proportion of the population in each country that has improved water coverage [34]. The UN’s target for reducing the number of people without access to safe drinking water also includes considerations of affordability, reliability, and the environmental impact of the water supply [4].
The common criteria used by scholars to define water access are often derived from the UN/JMP classification of improved and unimproved sources [7,10,35]. Other scholars also define water access using time, distance, the quality of the source, and affordability [36,37,38]. Smiley [8] defined access to water using availability and reliability. Recently, many studies have defined water access using availability, reliability, affordability, distance, and time [10,39,40,41,42]. In the context of this study, potable water access is defined using availability, reliability, distance to water sources, waiting time, and affordability. These dimensions were deemed necessary as they are useful in understanding both spatial and socio-economic perspectives of access.

3.4. Definition of Livelihoods

According to the Food and Agriculture Organization (FAO) [43], a livelihood is defined as the activities and resources that sustain individuals’ well-being [16,43]. According to the Department for International Development (DFID) [44], “a livelihood is sustainable when it can cope with and recover from stresses and shocks and maintain or enhance its capabilities and assets both now and in the future, while not undermining the natural resource base”. The Sustainable Livelihood Framework (Figure 3), which was developed by DFID [44], aids in comprehending the livelihoods of marginalized populations, particularly the poor, through an asset or vulnerability approach. This framework (Figure 3) identifies five core assets—human, social, natural, physical, and financial capital—that contribute to resilience against vulnerabilities like shocks and seasonal variations [16,43,44].
It is evidenced from the existing literature that the Sustainable Livelihood Framework can be used to analyze the effect of water access on the livelihoods of people [23,45,46]. The Sustainable Livelihood Framework holds substantial relevance to this study. Potable water sources, both in terms of infrastructure and natural sources, align with the framework’s assets, specifically physical and natural capital. Access to potable water directly contributes to households’ capabilities and well-being [47,48,49,50,51] by enhancing their capacity to cope with vulnerabilities such as water scarcity and related risks. The framework’s vulnerability component, which considers exposure to risks and stresses, is pertinent to understanding the potential challenges that households face due to limited access to assets [44], such as a lack of potable water access. The Transforming Structures and Processes component emphasizes the role of institutions and policies in shaping equitable water access, indicating that policies affecting water resources play a pivotal role in shaping livelihood outcomes [44]. By examining potable water access within this framework, this study offers insights into how access to this essential resource influences households’ ability to pursue beneficial livelihood outcomes and achieve sustainable well-being.

3.5. Conceptual Framework

For the purpose of this study, we used access factors shown as follows: availability (water outlets), reliability (functionality), distance from households to water sources, waiting time, and money spent on water (affordability). The framework explains that when there are sufficient water sources, a shorter waiting time, a short distance from the household, and a lower cost of retrieving potable water, the potable water source is deemed accessible. This implies that the focus of access is on the ease of obtaining water from the source by measuring the distance to water sources, time spent collecting water, and money spent on water. The Access component of the framework is directly related to water management and livelihoods. This indicates that water access can influence water management activities and vice versa. The framework also shows a direct relationship between water access factors and livelihood outcomes. Figure 4 explains such connections among water access, water management, and livelihood activities.

4. Results

4.1. Access to Potable Water Sources

4.1.1. Availability

The locations of the available water point sources in the community were mapped using the SW-Maps android GPS application. Figure 5 shows that the available water sources within Sibi communities are streams, dams, a hand-dug well, boreholes, and public taps/standpipes (Figure 5). Most of the water sources are public taps or standpipes (30 out of 40). There are also eight boreholes and one hand-dug well. However, the water point sources identified in the communities do not cover all the sources used by Sibi households. Some households access water sources located even further away (e.g., outside of the study area).

4.1.2. Reliability (Functionality)

The reliability of the water sources was determined using the functionality of the mapped water sources. The results showed that out of the 30 standpipes, 18 were reliable as these sources were functioning at the time of this research. Twelve were not functioning due to mechanical issues. The hand-dug well was reliable at the time of research but always dries up during the dry season. Figure 6 shows the water sources in each of the Sibi communities (Jato-Kparikpare, Hill-Top, and Central) with the blue color showing functioning (reliable) ones and the red color showing non-functioning (non-reliable) ones.

4.1.3. Cost–Distance to the Water Point Sources

The result of the cost–distance analysis with the consideration of slope, as depicted in Figure 7, provides an understanding of the ease or difficulty in accessing potable water for households in Sibi communities. The blue color represents a lower cost–distance while the red color represents areas with a high cost–distance. The analysis reveals that the substantial majority of households (66%) have relatively easy access to potable water, with a cost–distance of less than 500 m. For approximately 27% of households, the cost–distance ranges from 500 to 1000 m, suggesting a somewhat moderate level of accessibility. Additionally, 7% of households face more topographical challenges, with a cost–distance exceeding 1000 m to reach water sources.

4.1.4. Time Waited to Fetch Water

The households were asked about the time for which they waited to access water from the water point sources that they accessed. Figure 8 shows that the respondents typically spent more than 30 min at almost all the water point sources. Approximately 87% of respondents spent more than 2 h at the public taps and 83% of the respondents spent more than 2 h at the boreholes. Among all the water point sources, approximately 55% of the responses indicated that they typically waited for less than 20 min to access sachet/bottled water. This is different from other sources.

4.1.5. The Cost of the Water

During the survey, households were asked about the average cost of their water sources. The average cost of these water sources was estimated for the dry season, which spans November to April in the following year, as this was the period in which they relied on these sources. As shown in Table 1, surface water from streams and rivers is free for most households. However, some reported spending up to 1750.5 Ghanaian Cedi (Gh¢) during the dry season. The average cost of accessing these surface water sources was Gh¢26.54. The second most accessible source was public taps, which cost, on average, Gh¢750.46. However, some households spent Gh¢2000 or more to access public taps, boreholes, and sachet/bottled water.

4.2. Household Water Management Strategies

To determine the water management strategies of the households in Sibi, the respondents were asked to identify the containers that they used to store water. Table 2 shows the different containers that were used for water collection in three Sibi communities. It indicates that, out of the 624 valid responses, 304 (48.7%) participants used pans as containers to collect water from the water sources. A Jerry can/gallon was the second most popular container (39.3%), followed by a bucket (11.7%). Figure 9 shows the pans used for collecting water in the study communities.
Table 3 shows the facilities used for storing water. Out of the 651 valid responses from the multiple-choice items, 285 (43.8%) indicated the drum/tank as the facility for storing water. Gallons (147, 22.6%) and clay pots (109, 16.7%) were also popular facilities in Sibi (Figure 10). Some households also used buckets and aluminum pots to store water. No household used the underground reservoir as a storage facility.
The respondents were also asked to identify the water management strategies that they adopted during the peak period of water stress. Table 4 shows the water management strategies adopted by Sibi households using multiple-choice questions. The results show that most households (308, 18.3%) identified a reduction in the quantity of water that they used for specific purposes. This was followed by rainwater harvesting for household use (304, 18.1%). A larger proportion of responses (299, 17.8%) also selected a reduction in the number of baths taken by the households. Some households (113, 6.7%) adopted the strategy of disallowing people from other households to use their stored water.

4.3. Experienced Effects of Limited Potable Water Access on the Livelihoods of Sibi Residents

The respondents were asked to indicate their level of agreement with the statements in Table 5, which explains how inadequate access to potable water impacted their livelihoods. The level of agreement was scored on a scale of 1 to 5, where 1 indicated strong disagreement and 5 indicated strong agreement. This scale was reclassified as agree, neutral, and disagree. Table 5 indicates that the vast majority of respondents agreed that limited potable water access influenced their livelihood activities. Both domestic and commercial activities were major concerns for the respondents, as 306 (98.4%) of them agreed that inadequate access to potable water slowed down their domestic and commercial activities. This finding is supported by the responses that inadequate access to potable water increased the workload for women, with 97.1% of the respondents agreeing with this statement.
In addition, the responses from the community authorities indicate that water stress is a major challenge for the community and has many negative impacts on the livelihood activities of the community members, including children’s education. These correspond well with what is shown in Table 5.
According to the chief, “During the dry season, residents walk for about 10 miles to Oti River to fetch water and as a result, the farming and business activities are halted for some period until the wet season”. He further suggested, “You see, when the water stress starts, the pupils or students in schools will have to all stop school because there is no water for them to bath and drink. Teachers are also not able to go to teach again. Those who are not from here will have to run to their hometowns until the wet season starts”.
The assembly member also stated, “If the water stress period starts, you will see that those (health personnel) from different places to treat us at clinics start leaving. If you ask them, they tell us: how they can treat patients when they don’t have water to drink? The teachers tell us the same thing that they cannot teach without water…”.
To quantitatively understand such impacts of inadequate water accessibility on livelihood activities, we used the GLM gamma log link to model these variables [52]. The Omnibus test result was statistically significant (p = 0.003 < 0.05), indicating a legitimate and meaningful model [33]. The GLM results (Table 6) revealed a significant relationship between the experienced impacts of limited water access on livelihoods and the distance to water sources (χ2 = 9.897, p = 0.002). This means that for each increase in distance to water sources, the livelihood impact increases by 0.048. The average cost of accessing potable water also shows a statistically significant relationship with the experienced impacts on livelihoods (χ2 = 3.957, p = 0.047), indicating that a dollar increase in the average cost of water will lead to a 0.015 increase in experienced impacts on livelihoods. The average waiting time does not have a statistically significant relationship with the experienced inadequate access to potable water impacts on livelihoods (χ2 = 0.043, p = 0.835), potentially because the residents are used to the long waiting times, as shown in Figure 8.

5. Discussion

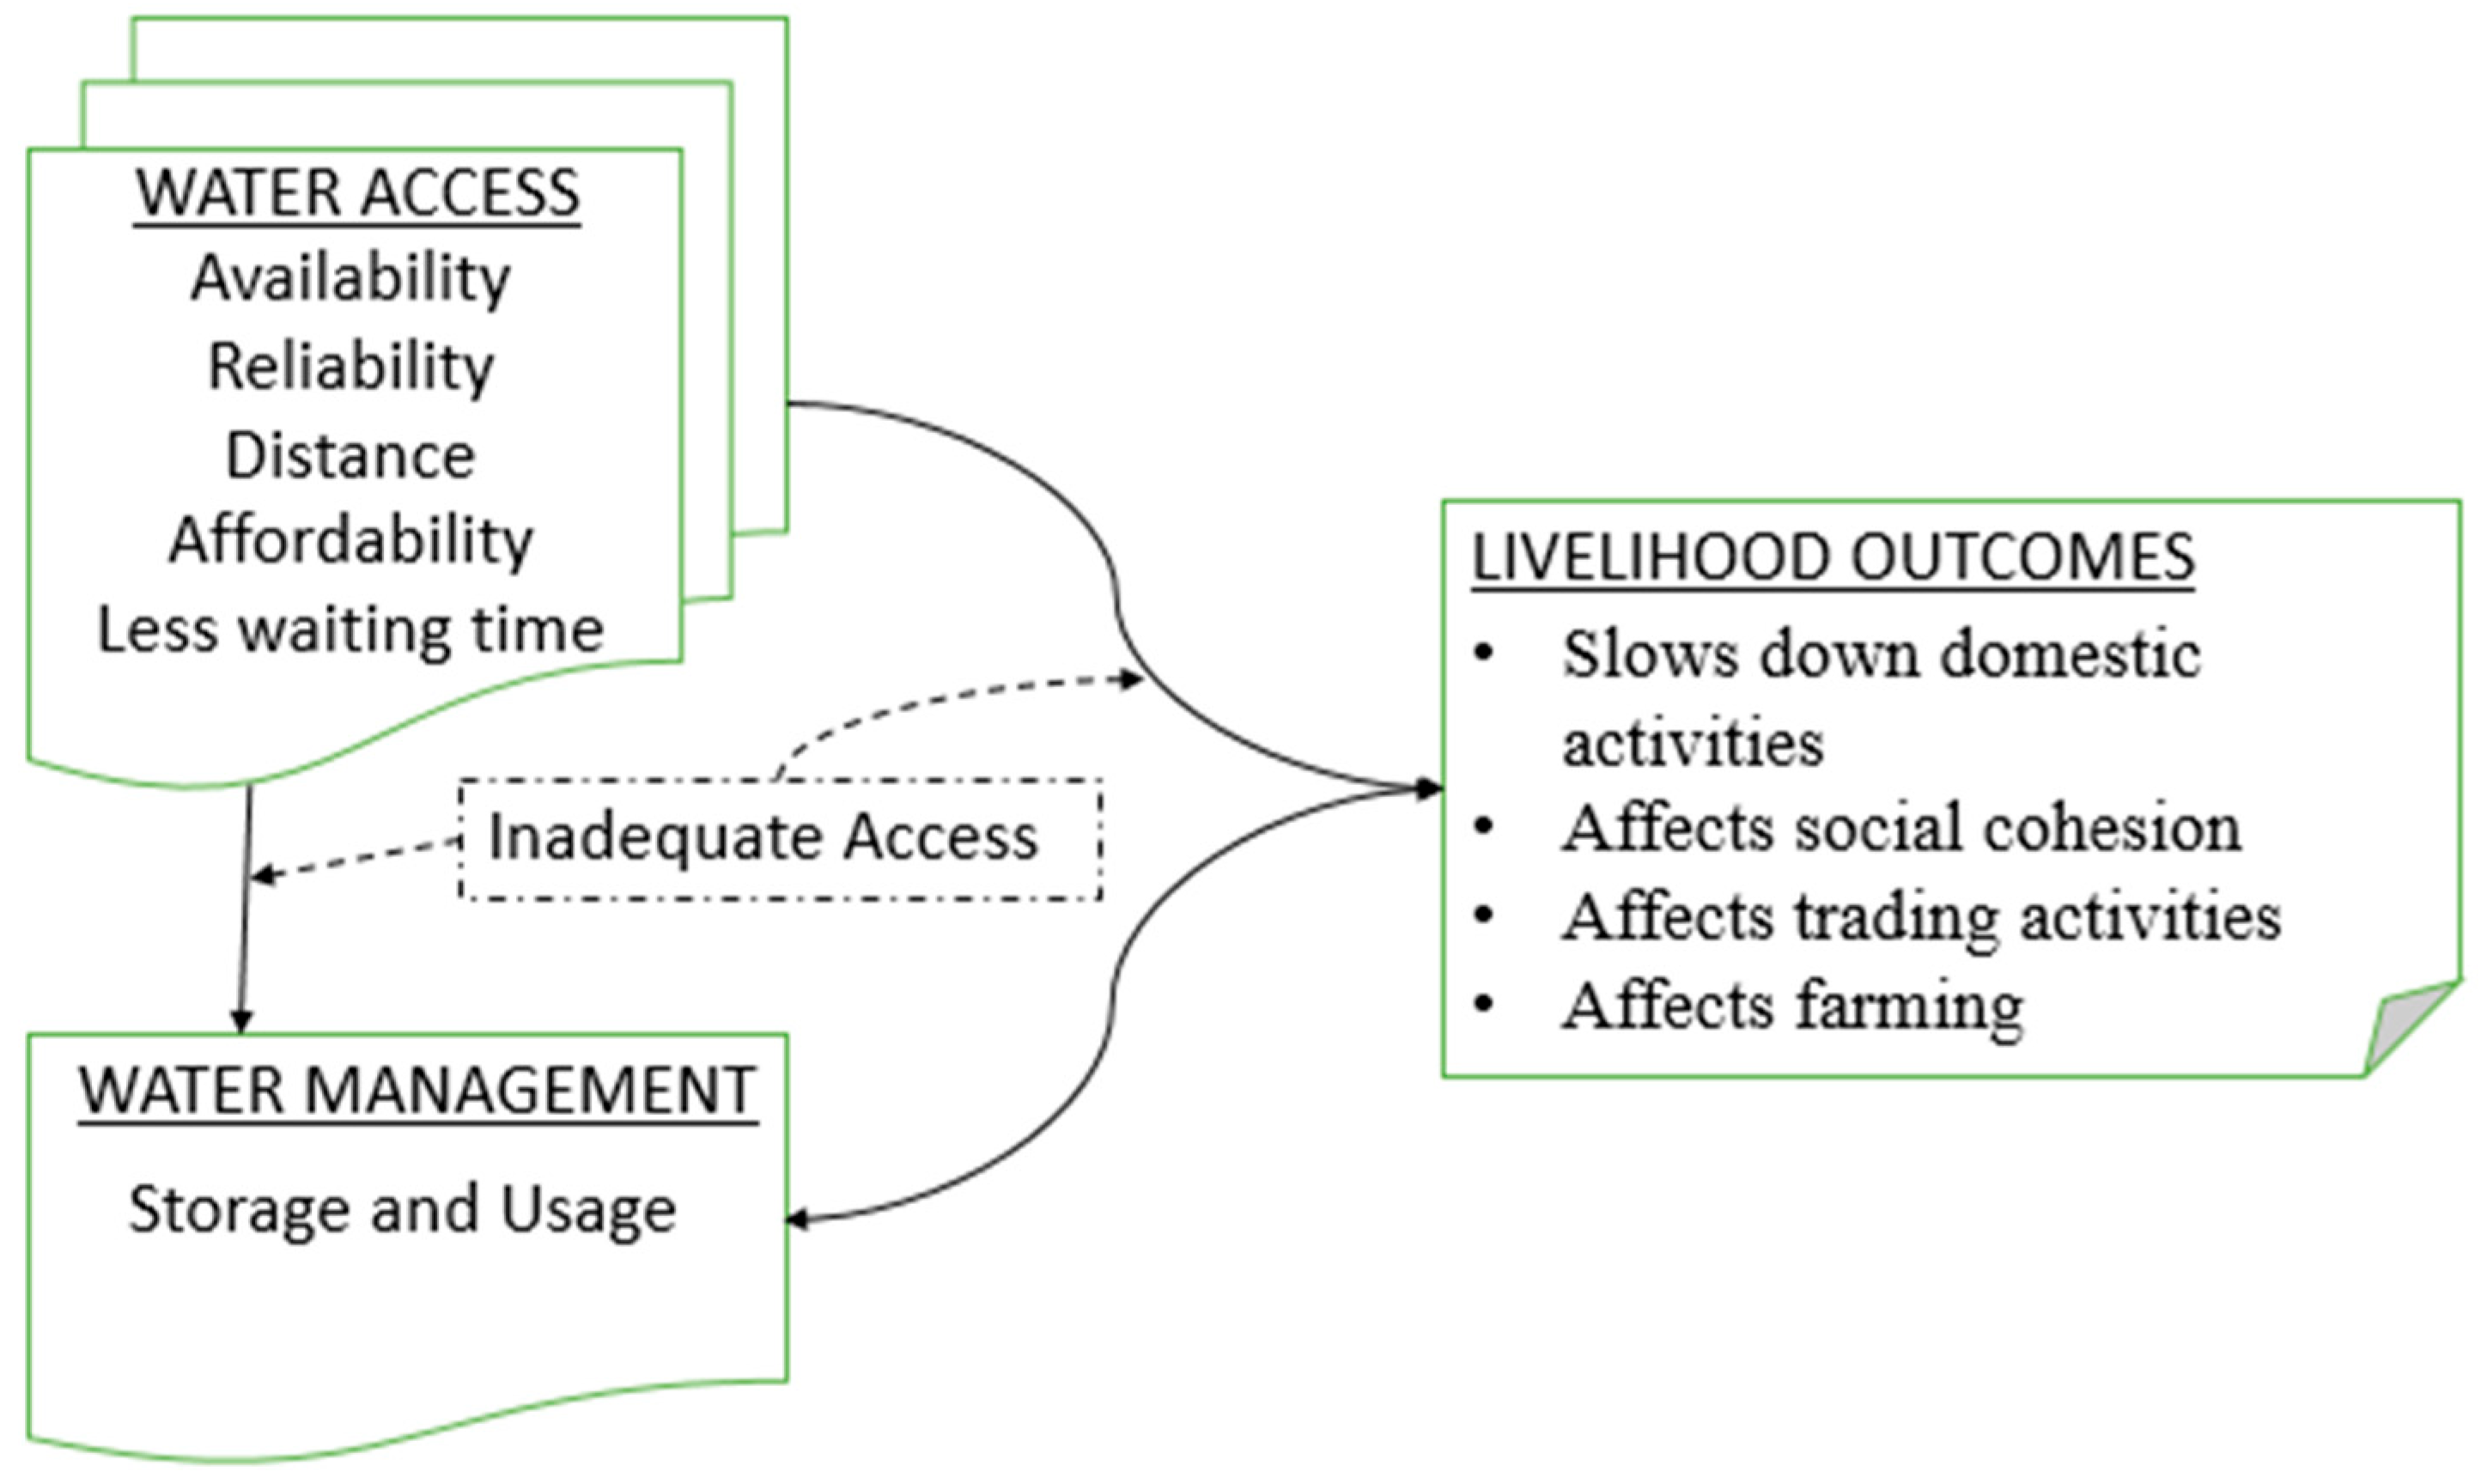
The study findings indicate that access to potable water in the three communities is influenced by various factors, including the availability and efficiency of water sources, the distance to water sources, the cost of accessing water, and the coping and management strategies adopted by households. These factors have significant implications for the livelihoods of the residents, as shown in Figure 3.
The availability of water sources plays a crucial role in determining access to potable water. Multiple water sources, including rivers, streams, dams, hand-dug wells, boreholes, and public standpipes, are identified in this study. These water sources are not efficient because most of them only flow seasonally. These findings align well with previous research conducted in various communities in Ghana. For example, research done by Jeil, Abass, and Ganle [53] in the Tatale-Sanguli district of Ghana’s northern region found that boreholes and streams/dugouts served as the main water sources for the local residents. Stream and dam water sources are easily accessible by residents. However, the quality of the water in the stream and dam is highly questionable, as both animals and humans use these sources. Jeil, Abass, and Ganle also found that the boreholes were not easily accessible by their study respondents as compared to streams and dams. Water sources included unprotected dug wells; surface sources like rivers, dams, and streams; vendors supplying water via small tanks or tanker trucks; and bottled water [54]. This is similar to the situation in Sibi, as our findings indicate that the boreholes and standpipes in the Sibi community are not reliable and the residents mostly rely on unprotected water sources such as streams and dams. These findings, coupled with the previous studies, suggest that these sources are commonly relied on in Ghanaian communities.
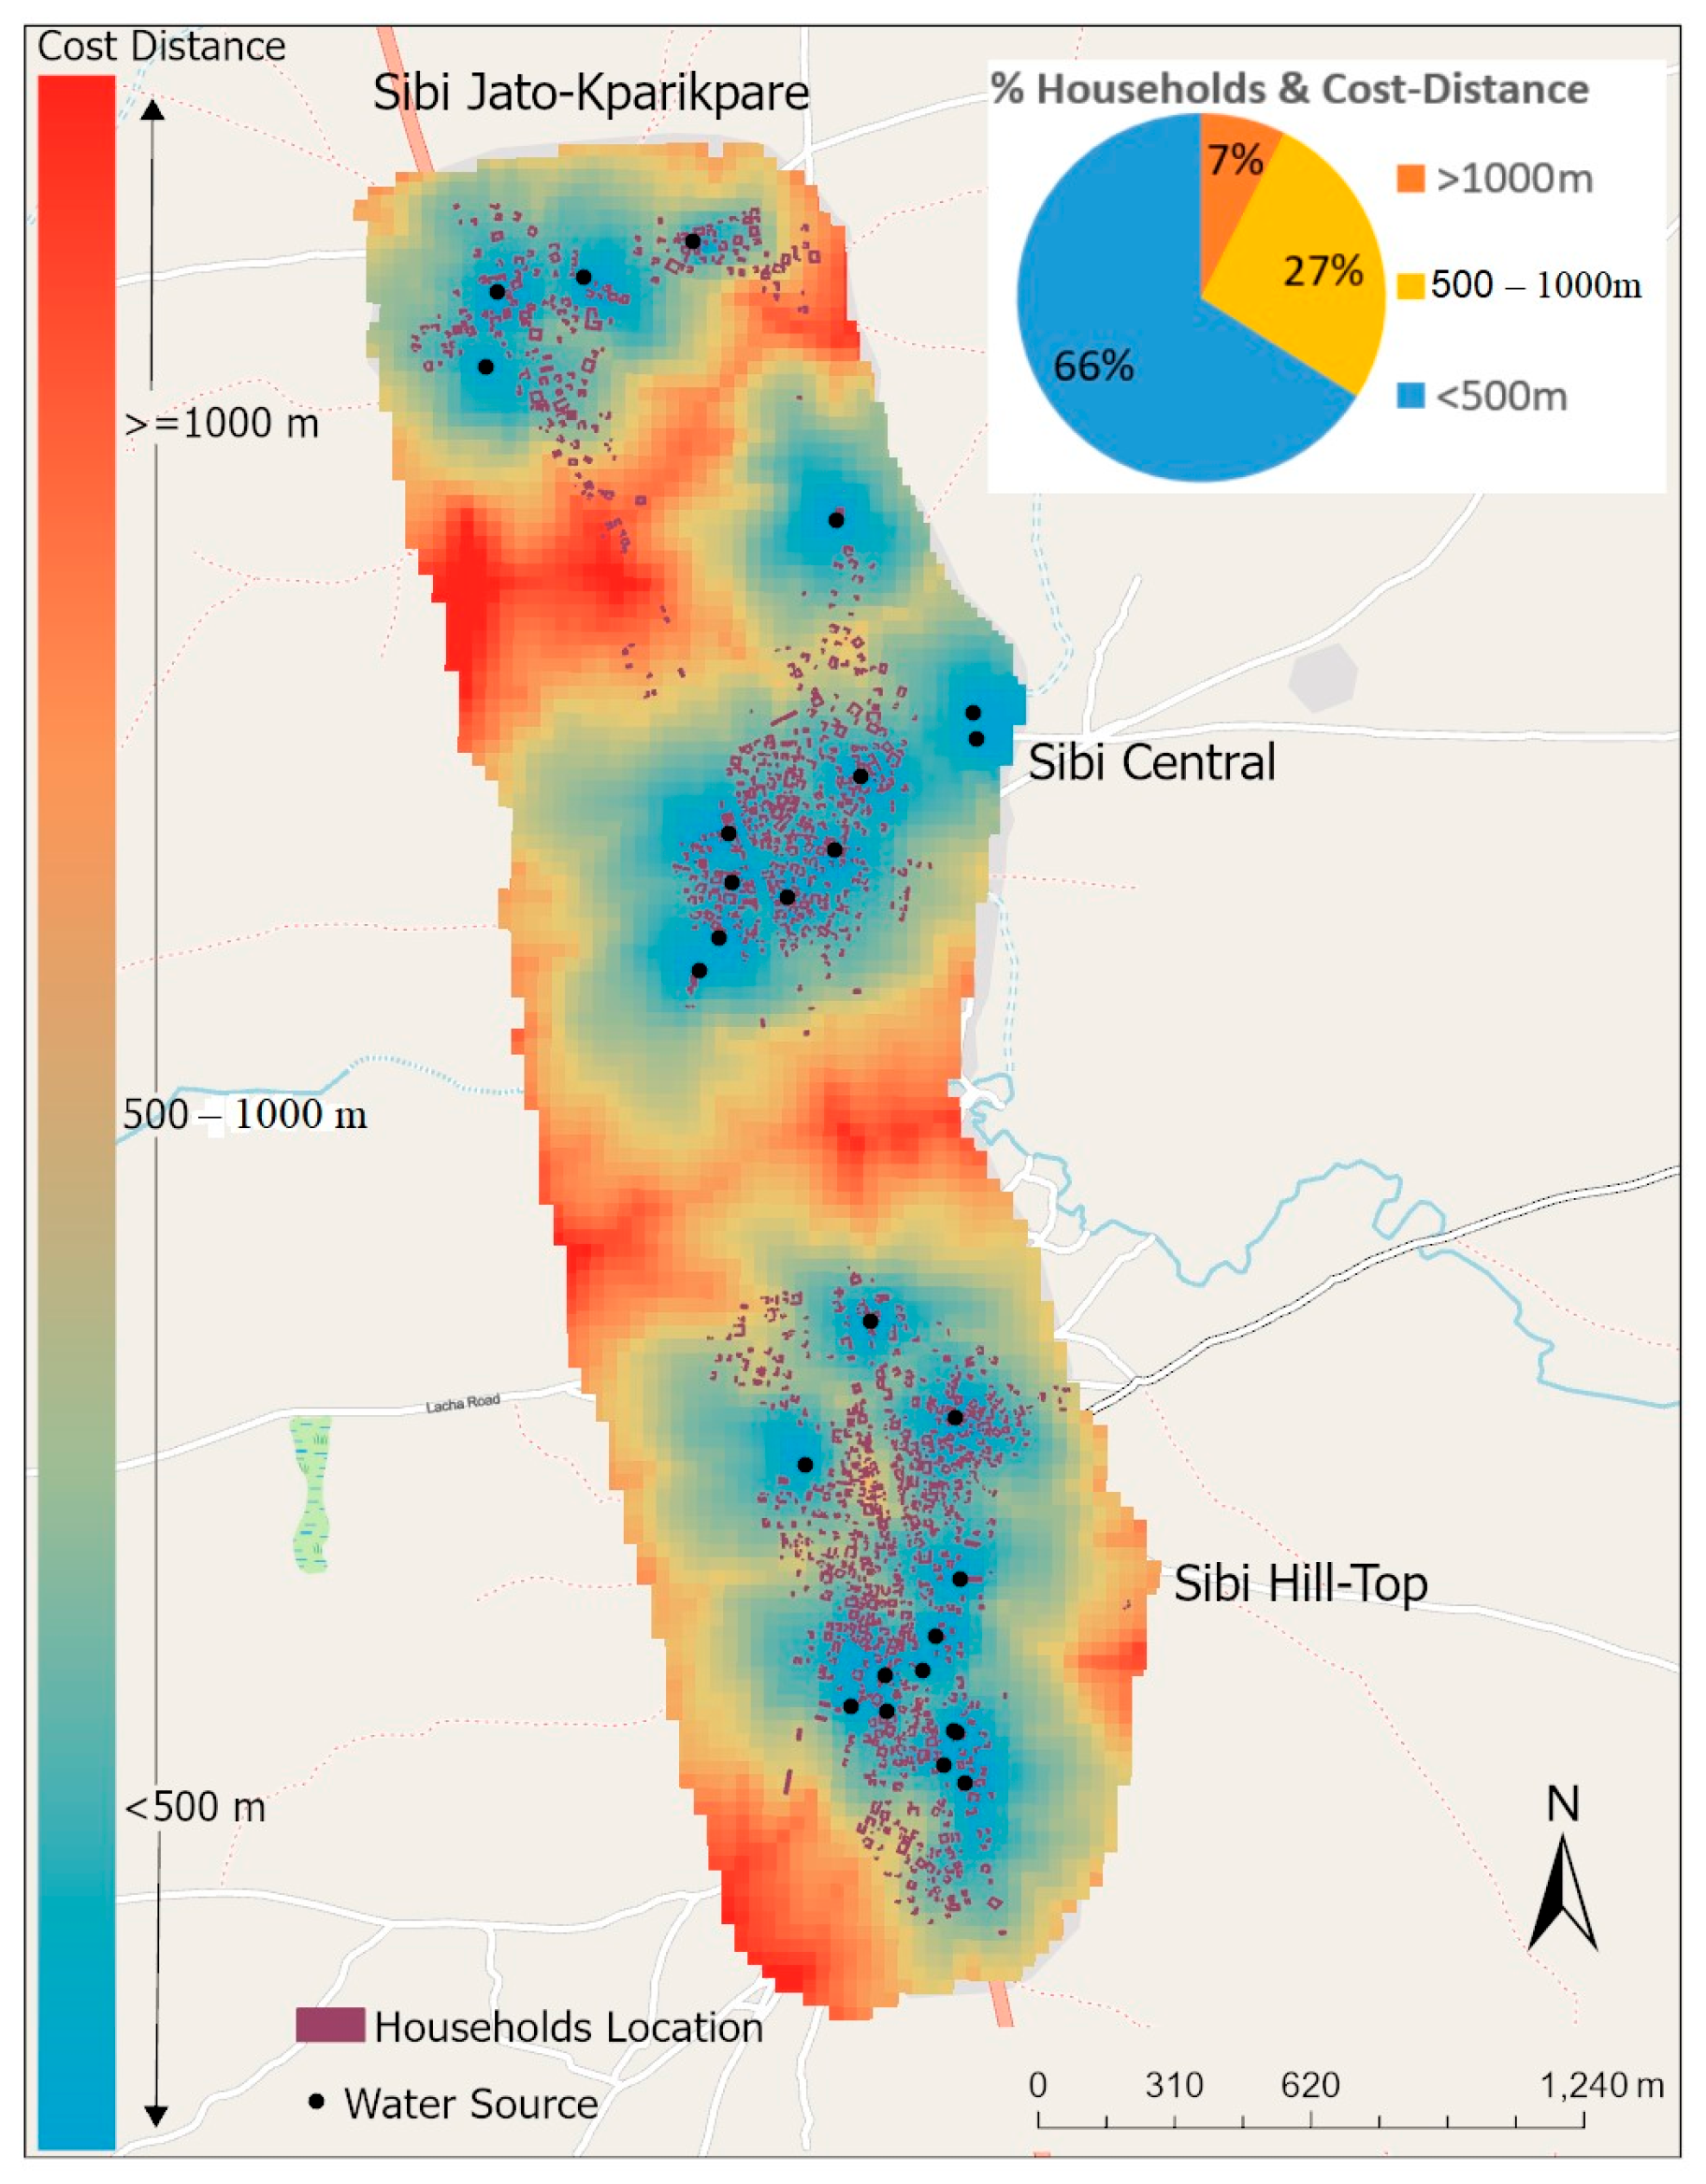
Households generally travel a distance of less than 1000 m (one kilometer) to access water sources within the community. However, it is observed that, during the dry season, residents are compelled to walk over 10 km to obtain water. This highlights the challenges faced by communities in accessing water, particularly during periods of water scarcity. To contextualize these findings, it is pertinent to refer to existing standards on water accessibility. Howard et al. [55] propose that access to water is deemed satisfactory when the distance traveled to access water does not exceed one kilometer. Similarly, the Ghana Water Company Limited [56], the regulatory body responsible for the water supply in Ghana, stipulates that if the target of providing water within household premises is not achieved, the maximum distance that an individual should travel to access water should not exceed 200 m. The findings of this study marginally align with these standards, indicating that 93% of households travel less than one kilometer in Sibi, Ghana. Furthermore, the study’s findings are consistent with the research conducted by Misati [57] in Kisii County, Kenya. Misati’s study reveals that the majority of water sources (92%) are located within a kilometer of households. This similarity suggests that communities in both Ghana and Kenya encounter comparable challenges regarding the proximity of water sources, emphasizing the importance of addressing distance-related barriers to water access in various contexts. Because of the data and resource limitations, we were not able to gauge the water supply capacity of water intake sites. The water supply capacity is also important in assessing the water demand. We plan to address this issue in a future study when such data are available.
The affordability of water access is a critical consideration in ensuring equitable and sustainable water access. The cost of accessing potable water affects households’ financial resources and can potentially create disparities in access, particularly for economically disadvantaged communities. The annual cost of potable water for respondents ranged from Gh¢15.67 (US$2.59) to Gh¢1318.03 (US$218.27) in a year. The study findings are not significantly different from the UNICEF/WHO [58] report on WASH, which suggests that households in Ghana spend an average of Gh¢138.9 (US$23) per capita per year on water. The majority of the respondents considered surface water sources as the cheapest sources as they had no monetary cost to them. This could be why most households choose to access surface water for domestic usage. This finding is similar to the situation in some urban communities in Ghana, as previous studies indicated that households in the Ga West Municipality of Ghana accessed water from surface water sources for domestic usage because these water sources were the cheapest for them [14].
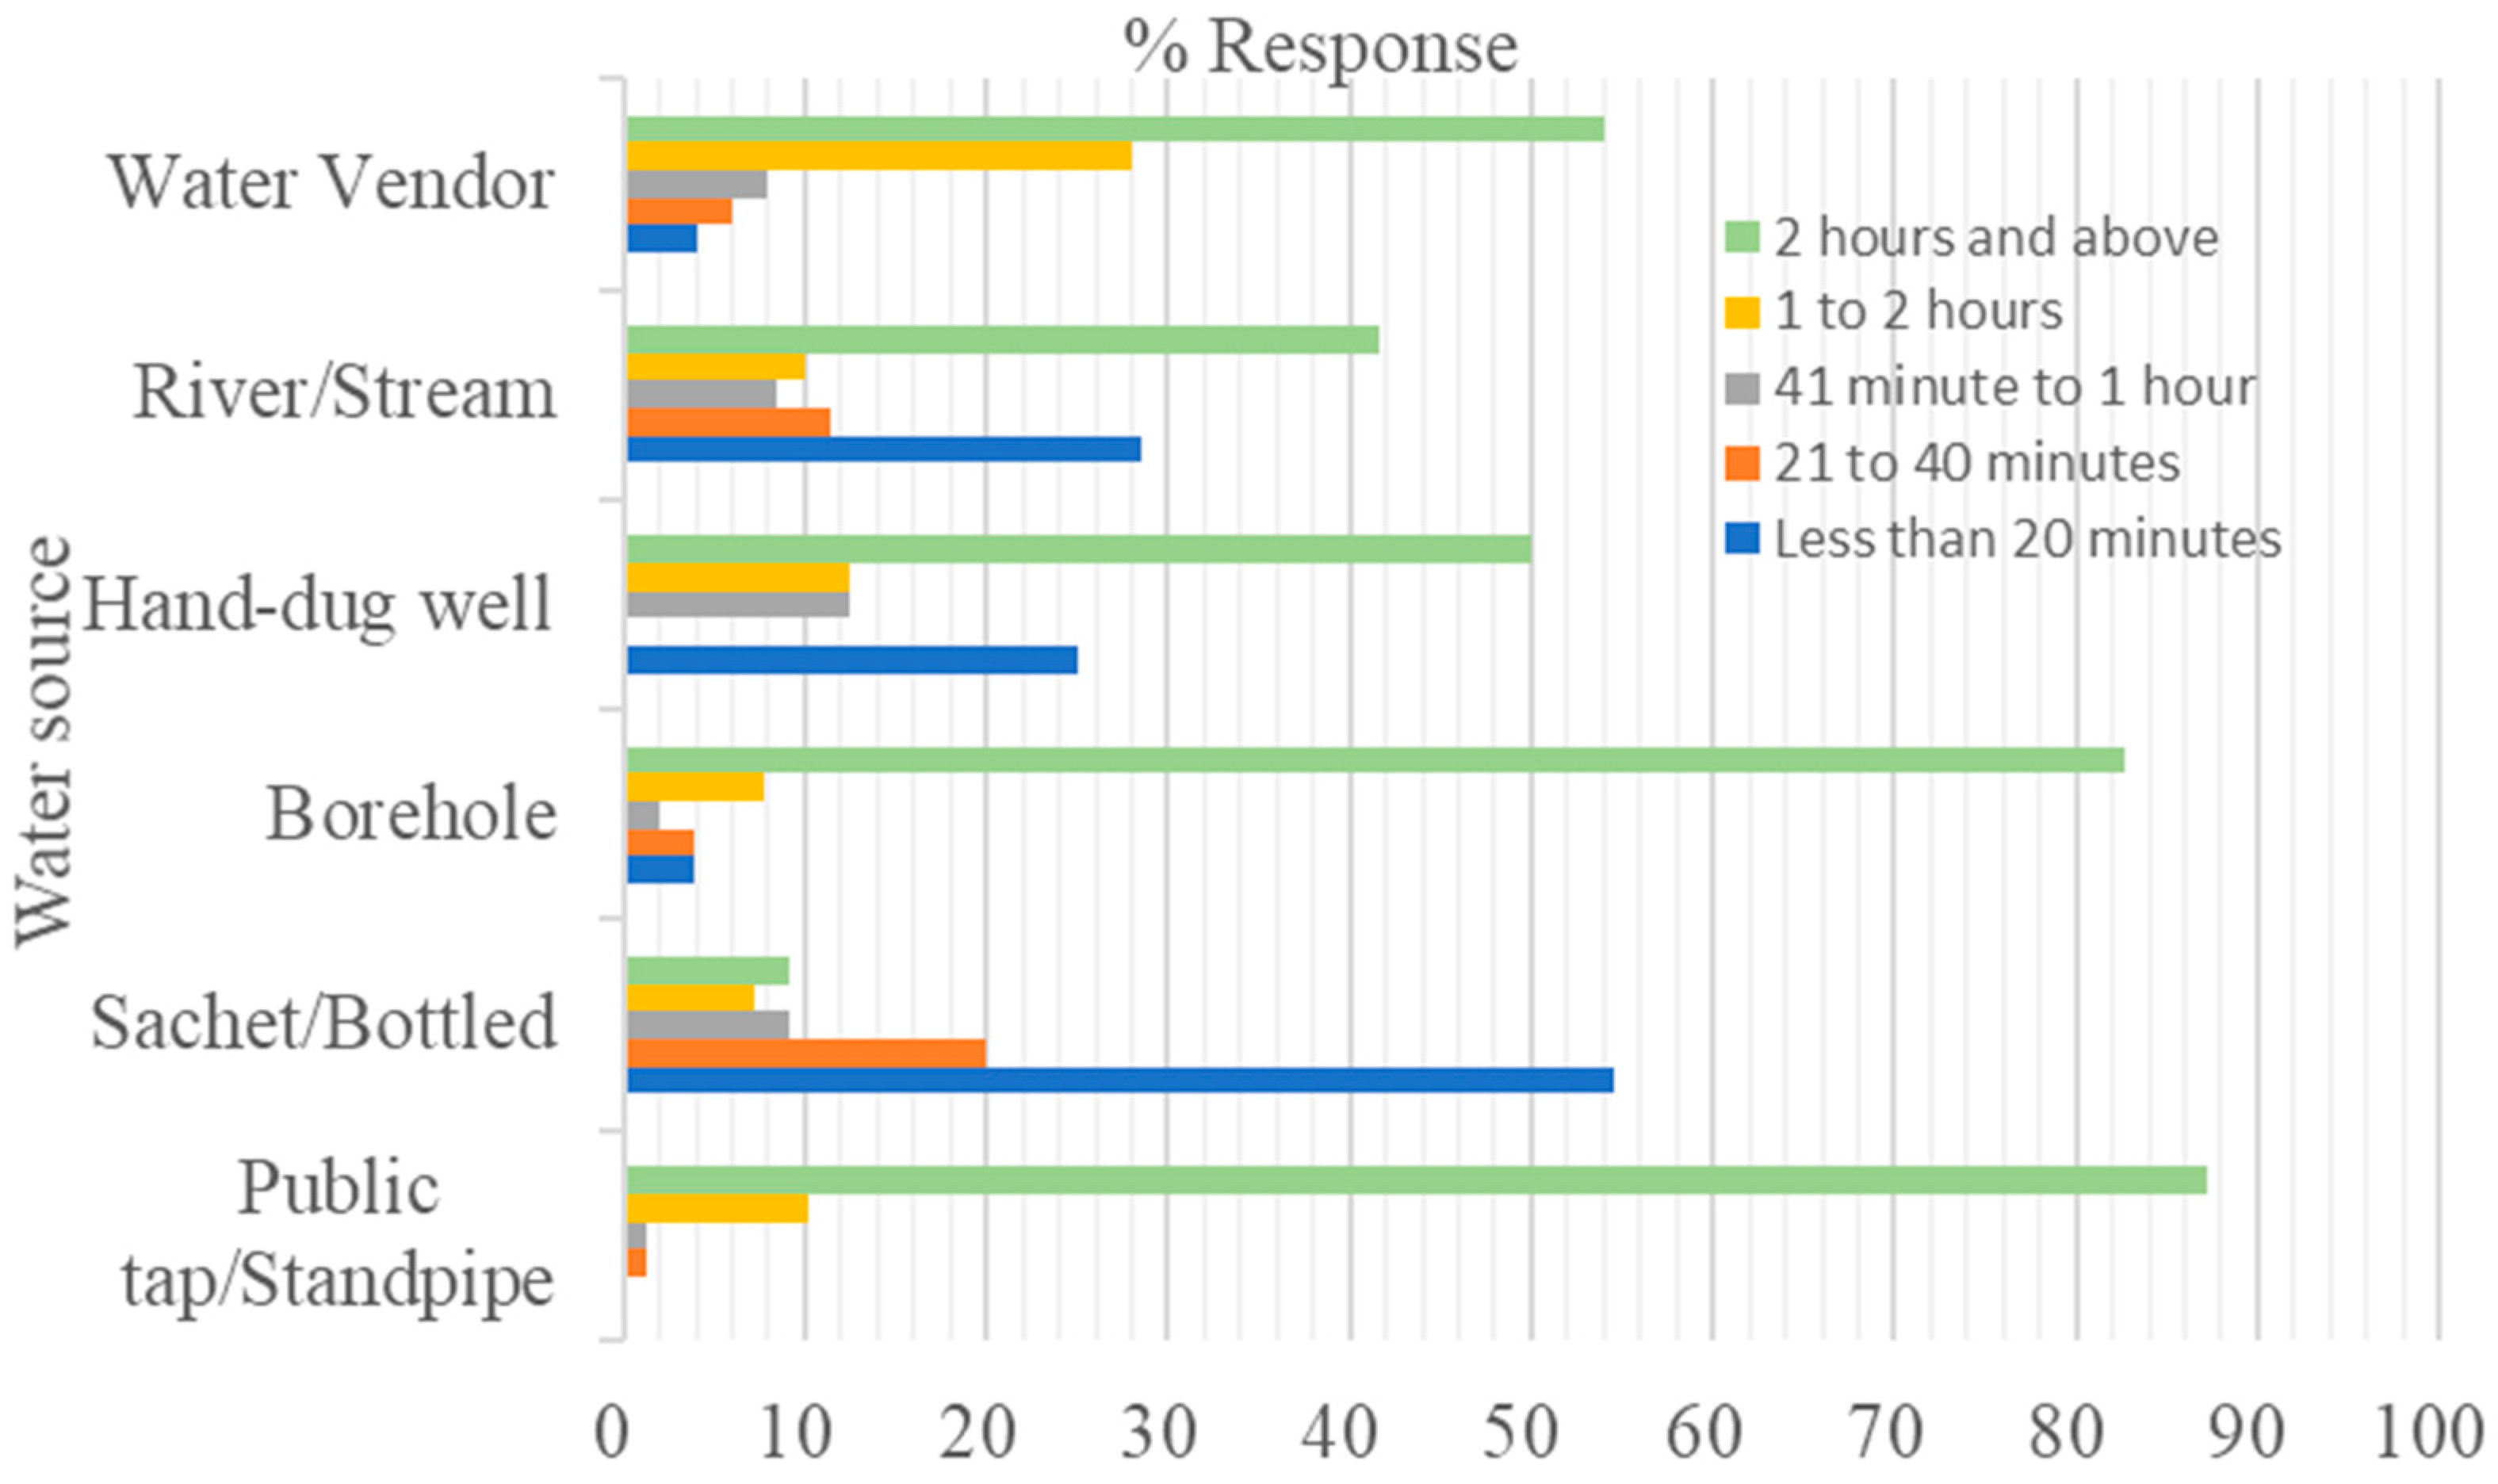
The United Nations [3] and the Sphere Project [59] specify that for one to have physical access to water, the collection time should not exceed 30 min. The collection time in this study is beyond the United Nations’ standard as the maximum average waiting time to access water in Sibi communities is more than 2 h. The longer collection time may be attributed to inadequate water from the available water sources. This situation is similar to that of other communities in Ghana and Africa. Adjakloe [14] found that an average of one (1) hour was spent accessing water for household use in the Maryera community in Ghana. Peprah et al. [13] found that the irregular flow of water from pipes resulted in long queues, leading to longer waiting times to access water in the Awutu-Senya East Municipality of Ghana. Jonah et al. [23] found that 55.4% of their study respondents spent more than 1 h fetching water. Smits et al. [9] also found that the waiting time to collect water in Ward 16 of Bushbuckridge Local Municipality of South Africa was more than 4 h. Jonah et al. [23] further explained that the long queues and waiting times were caused by the non-functionality of the water sources that were shared by many households from different communities.
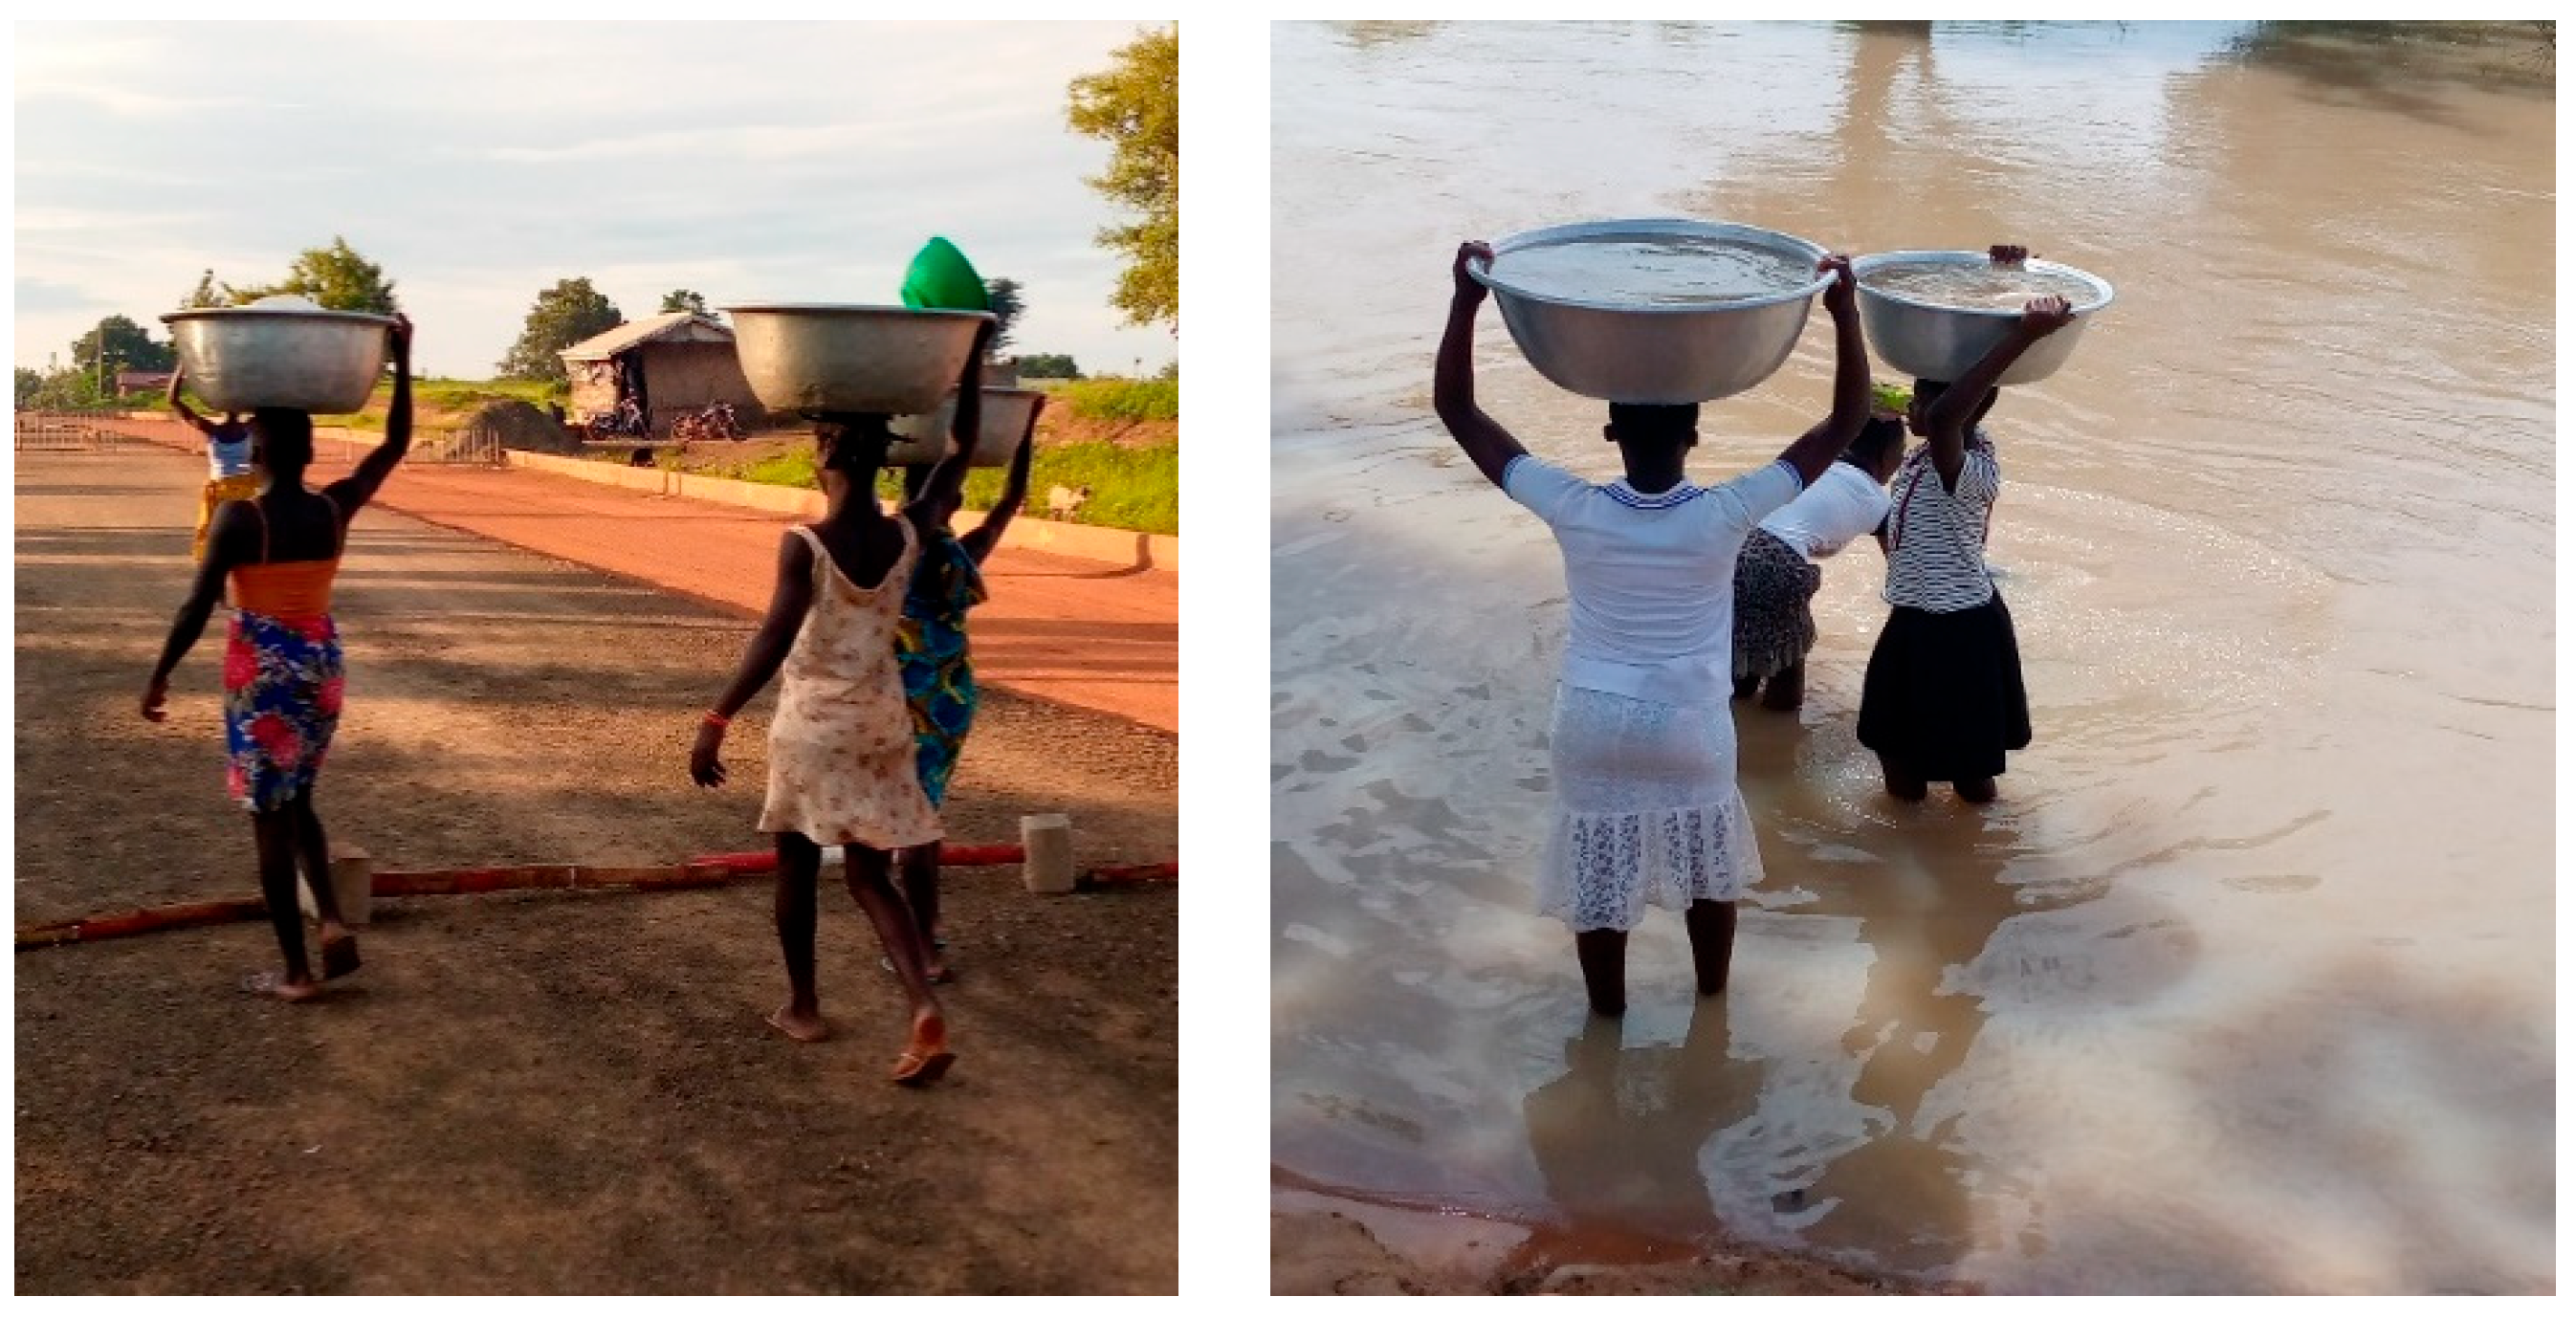
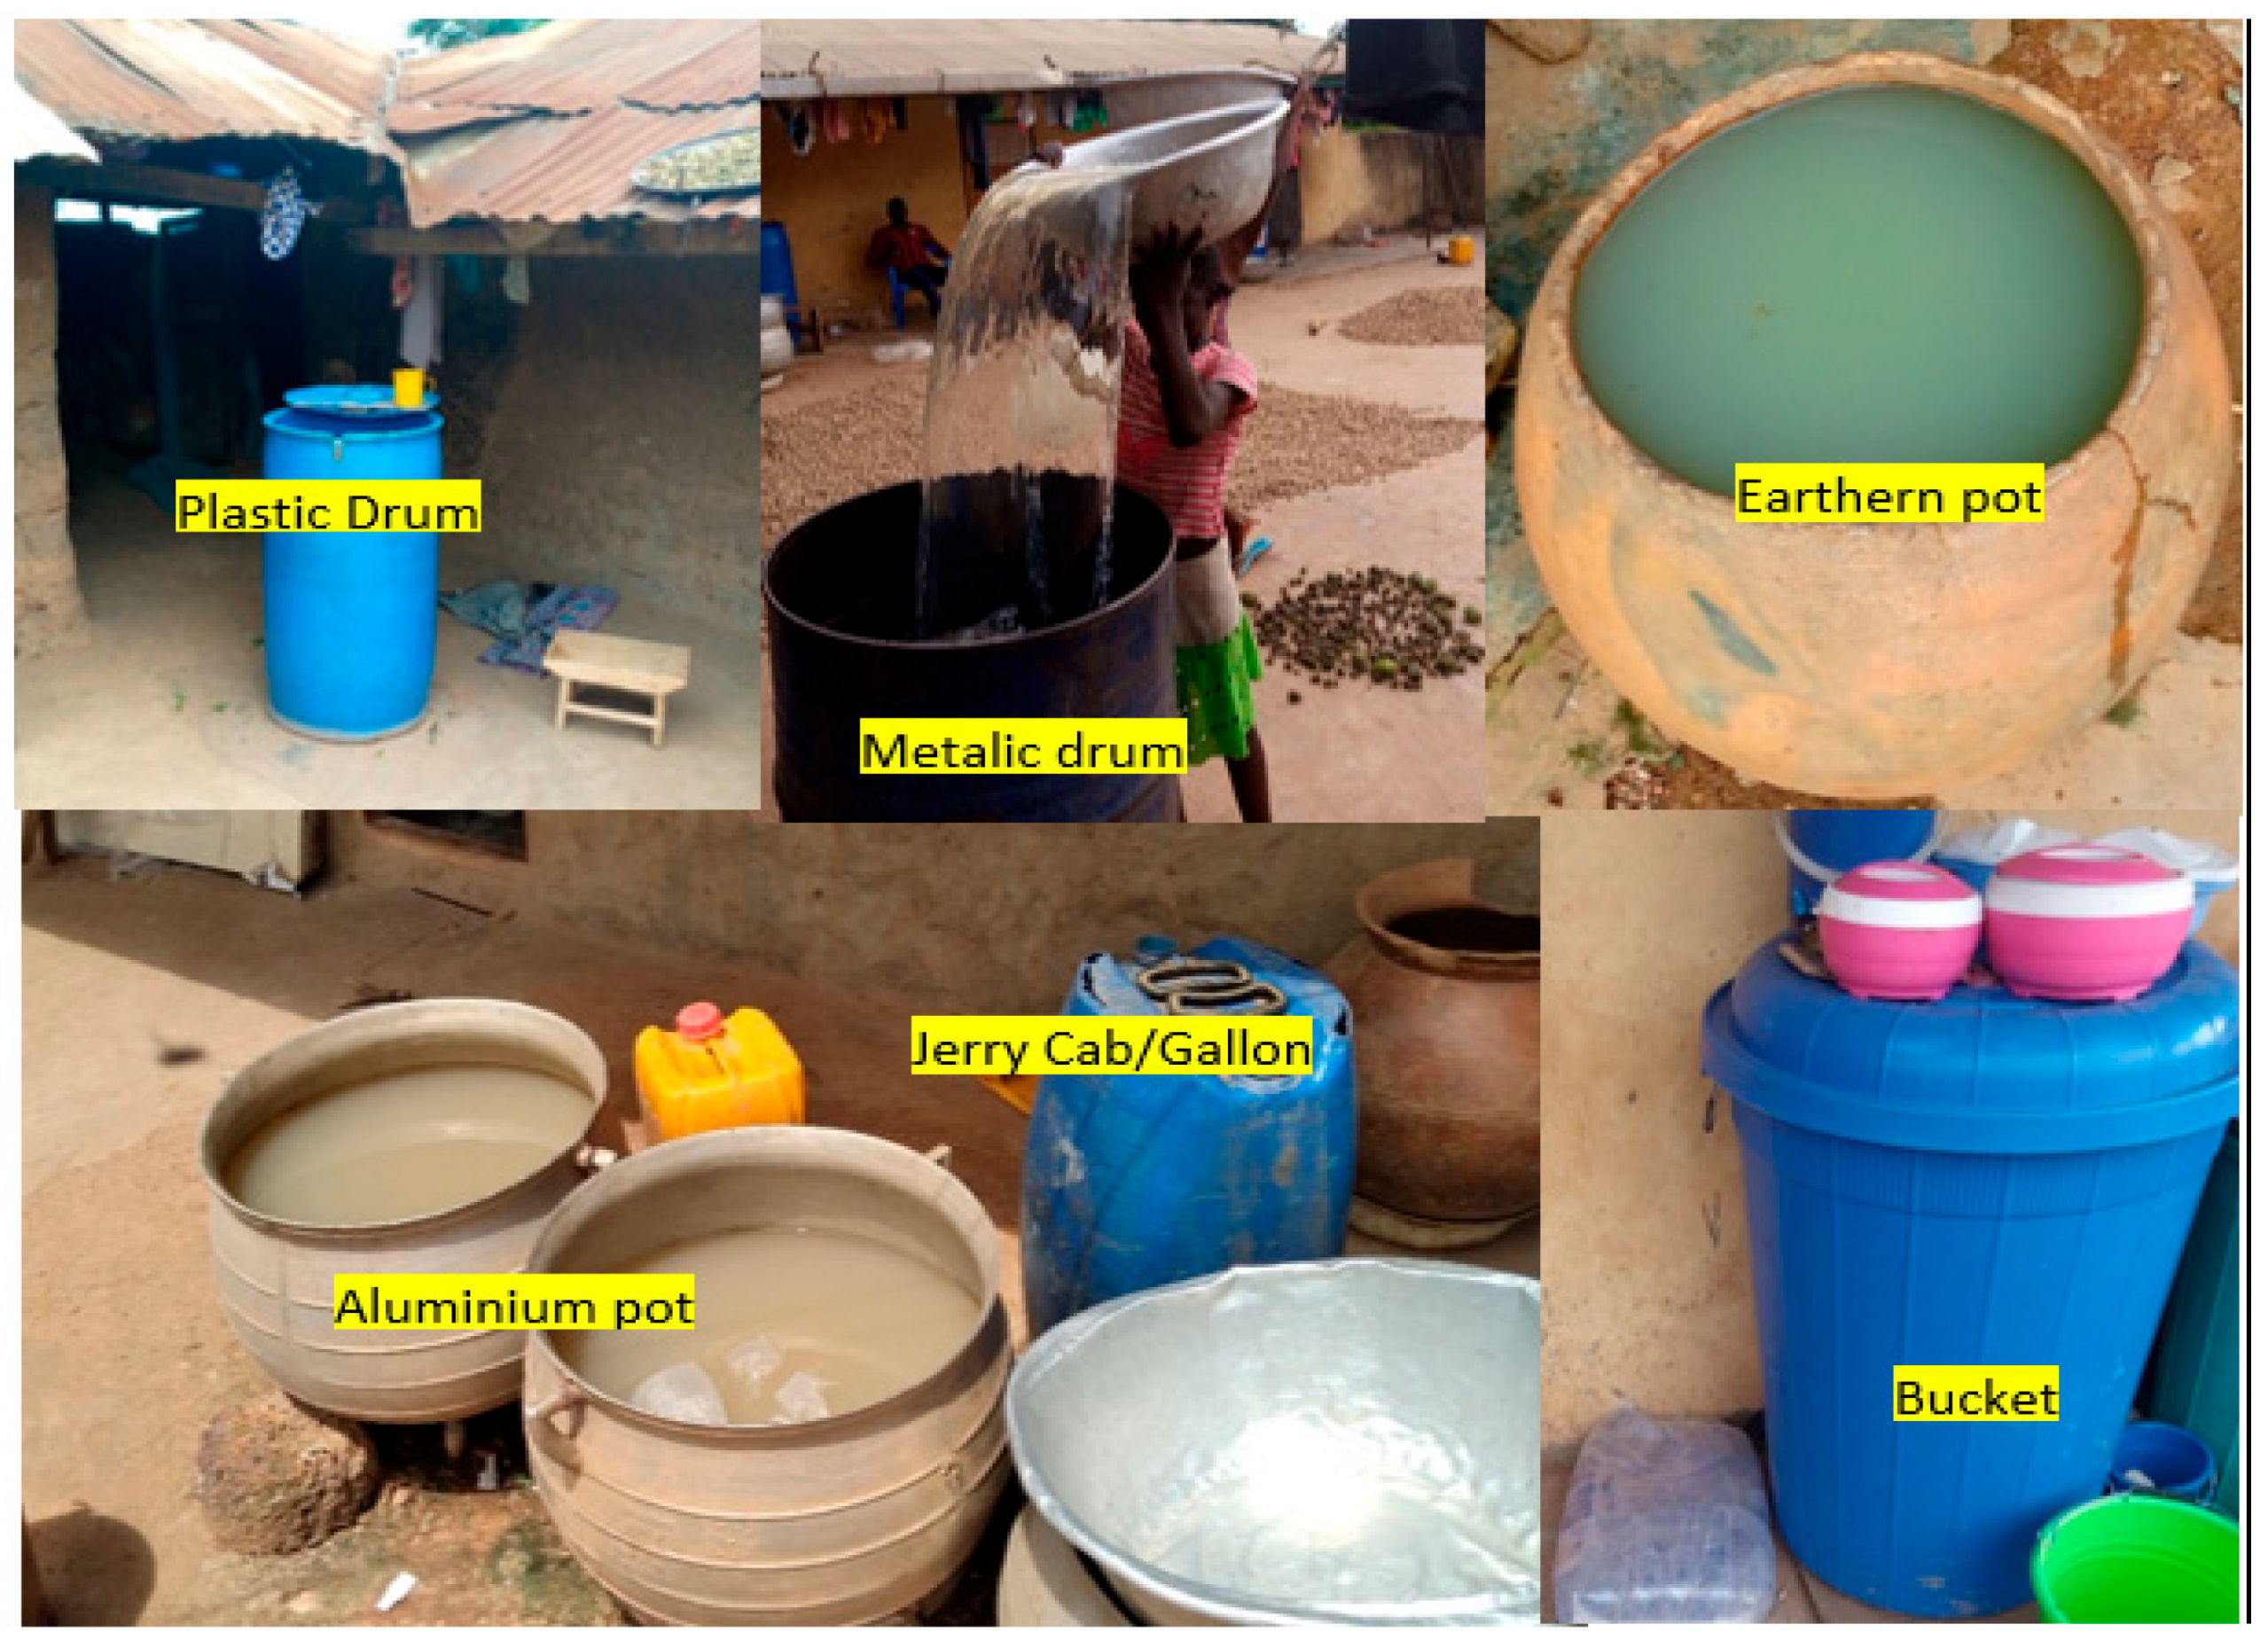
The main containers for the collection of water were the head pan, Jerry can, and bucket. Women mostly used head pans, while men used Jerry cans to collect water. Drums/tanks, Jerry cans/gallons, clay pots, aluminum pots, and buckets are used to store water. Drums/tanks, Jerry cans/gallons, and clay pots are used by most households in the three communities compared to the other facilities. Misati [57] also found that most of the Kisii households used Jerry cans to store their water.
This study revealed some of the water usage strategies adopted by households. A reduction in the quantity of water usage for some specific purposes, rainwater harvesting, and reductions in the number of baths per day were some of the most adopted strategies in the three communities. Some respondents also used sachet or bottled water for drinking purposes. These results align with Agyemang’s [28] research, which also found that households in the Sekyere Kumawu district of Ghana adopted such strategies to manage their water, e.g., using bottled water for drinking purposes, purchasing additional storage facilities, preventing others from using their stored water, and reducing the water quantities used for specific purposes.
Inadequate potable water access has significant impacts on the livelihoods of households. This study revealed that the distance to water sources and the cost of accessing water have significant effects on households’ livelihoods. These findings support Sorenson and colleagues’ research, which found that the distance and cost of fetching water significantly affected the livelihood status of individuals, especially women and children in low-income countries (including Ghana), as it was a time-consuming and physically demanding task that could have adverse effects on health, education, and income [60].
Surprisingly, waiting times did not have a significant impact on livelihood activities, which is contrary to the Sphere Project’s report [59], which suggested that longer waiting times reduced water consumption, increased non-potable water usage, and limited time for other activities. This inconsistency may be due to the fact that residents in Sibi are used to long waiting times, knowing that they will eventually obtain water. Additionally, from the personal experience of one of the authors, who lived in the community for over 20 years, it is known that most households engage in tuber cultivation during the rainy season and spend time at water sources during the dry season, when water stress is more prevalent, which increases the waiting time.
Based on the water access challenges faced by the communities in Sibi, we recommend that the local government and authorities collaborate closely with the Ghana Water Company Limited and water and sanitation NGOs to tackle the pressing issue of clean drinking water in the Sibi communities. Through combined resources and expertise, this joint effort could provide a thorough and long-lasting resolution to the water access difficulties. A collaborative task force should be created by the local government and authorities. This task force should comprise representatives from regulatory agencies, community leaders, and local government bodies to formulate a comprehensive plan for water infrastructure development that caters to the needs of the community. Adequate resources should be allocated to implement this plan, and regular water quality testing and enforcement of standards must be prioritized to ensure safe water consumption.
In addition, the Ghana Water Company Limited should initiate community engagement programs and provide technical training for the community members to help in water infrastructure maintenance. It is also recommended that NGOs and aid agencies partner with local community-based organizations to launch hygiene education campaigns and promote safe water storage practices. By allocating resources to capacity-building initiatives that empower local water management and governance structures, international donor organizations and global health entities can support sustainable water infrastructure projects and collaborate with local agencies for monitoring and evaluation. These targeted measures can serve as a transformative model to resolve water access challenges, not only in Sibi but also as a blueprint for global efforts toward equitable water access. Therefore, it is imperative that these recommendations be taken into consideration and implemented for the benefit of the Sibi community and beyond.

6. Conclusions

After assessing the access to potable water sources in Sibi, Ghana with both quantitative and qualitative methods, this study yields the following conclusions. First, Sibi residents do not have sufficient access to improved basic water sources; hence, they depend on unimproved sources such as streams or dams for domestic water use. Second, Sibi residents still rely on traditional methods of storing water, which affects the potability of the water that they consume. Third, such insufficient access to water has affected the livelihoods of Sibi people as more time and money that could be used for other livelihood activities are spent in collecting water.

Author Contributions

Conceptualization, Kingsley Kanjin; methodology, Kingsley Kanjin, Minxuan Lan; software, Kingsley Kanjin; validation, Richard Adade; formal analysis, Kingsley Kanjin; investigation, Kingsley Kanjin; resources, Kingsley Kanjin; data curation, Kingsley Kanjin; writing—original draft preparation, Kingsley Kanjin; writing—review and editing, Richard Adade, Julia Quaicoe, and Minxuan Lan; visualization, Kingsley Kanjin; supervision, Julia Quaicoe, and Richard Adade; project administration, Kingsley Kanjin; funding acquisition, Kingsley Kanjin. All authors have read and agreed to the published version of the manuscript.

Funding

This research was funded by YouthMappers. The United States Agency for International Development (USAID) generously supports the YouthMappers program through a grant from the USAID GeoCenter under Cooperative Agreement 7200AA18CA00015 and previously under Award #AID-OAA-G-15-00007.

Data Availability Statement

The building data can be accessed from the https://export.hotosm.org/en/v3/exports/new/describe. The water point sources data can be accessed from https://data.waterpointdata.org/dataset/Water-Point-Data-Exchange-Plus-WPdx-/eqje-vguj/data. The survey data presented in this study are available on request from the leading author. The data are not publicly available due to privacy reasons.

Acknowledgments

This research was supported by the YouthMappers Research Fellowship Award that was won by Kingsley Kanjin as a member of the University of Cape Coast YouthMappers Chapter. As a result, we wish to extend our profound appreciation to USAID and YouthMappers for the funding and for providing the opportunity to research this community issue in Ghana. We also express our deepest appreciation to members of the University of Cape Coast YouthMappers Chapter, especially Ebenazer Boateng, Bert Manieson, and Samuel Kofi Nyarve, for their full support and motivation during this research. Moreover, we extend our appreciation to our field research team members for their effort and commitment to the field activities of this research.

Conflicts of Interest

The authors declare that there is no conflict of interest.

Appendix A

Sample Size Estimation Using Yamane (1967) Formula
n = N 1 + N e 2
where n is the required sample size;
  • N is the total number of households;
  • e is the margin of error = 5%.
n = 1467 1 + 1467 0.05 2     n = 1467 1 + 3.6675     n = 1467 4.6675     n = 314.301 = 314
Table A1. Sample Size of the Target Population.
CommunityPopulation Size (2010)Households (2010)Projected Population (2021)Projected Households (2021)Sample Size
Sibi Hilltop43266135555787168
Sibi Central2107308347339584
Sibi Jato-Kparikpare1292222165928561
Total7725114310,6871467314
Source: Ghana Statistical Service (2010).
Figure A1. 100 m by 100 m square sampling grids.
Ijgi 12 00365 g0a1
Figure A2. Distribution of the overall livelihood impact index.
Ijgi 12 00365 g0a2

Appendix B

Ijgi 12 00365 i001

Appendix C

UNIVERSITY OF CAPE COAST
YOUTHMAPPERS
RESEARCH FELLOWSHIP
TOPIC: POTABLE WATER ACCESS AND ITS IMPACT ON LIVELIHOODS OF THE PEOPLE OF SIBI
QUESTIONNAIRE FOR HOUSEHOLDS
Dear Sir/Madam
This study seeks to investigate the “potable water accessibility and its implication on the livelihood of the residents of Sibi in Nkwanta North District, Oti Region. You are therefore being invited to share your views on the issues under investigation. The responses will be used for purely academic purposes. Your confidentiality is greatly assured.
Thank you.
Please respond to the following questions by filling the blank spaces or ticking [√] where appropriate.
SECTION A: DEMOGRAPHIC CHARACTERISTICS OF RESPONDENTS
(1)
Community…………………………….
(2)
Sex: Male [ ] Female [ ]
(3)
Age ………………………….……..
(4)
Marital status: Never married [ ] Married [ ] Divorced [ ] Widowed [ ] Co-habiting [ ] Separated [ ]
(5)
Educational level: No formal education [ ] Primary [ ] JHS/Middle [ ] Tertiary [ ] Secondary [ ] other (specify)………………
(6)
Number of persons in your household: ………………..……………………
(7)
How long have you been living in this community? ………………………………….
(8)
What is your occupation? …………………………………
(9)
On average, how much do you earn from your work? ………………………
SECTION B: ACCESSIBILITY TO POTABLE WATER
(10)
In general, what water point sources do you have easy access? [Tick all that apply].
Public tap/Standpipe [ ] Sachet water/Bottled water [ ] Bore-hole [ ] Hand-dug well [ ] River/Stream [ ] Water vendor [ ]
(11)
On average, how much does it cost you to access the following water sources. (please select cost range each water sources you access)
Water SourcesNothing1–500 Ghc501–1000 Ghc1001–1500 Ghc1501–2000 Ghc>2000 Ghc
Public tap/Standpipe
Sachet water/Bottled water
Bore-hole
Well
River/Stream
Water vendor
(12)
What are the existing restrictions to these water point sources you access?
……………………………………………………………………………….
(13)
What is the average waiting time you spend at these water point sources you access? Less than 20 min [ ] 21 to 40 min [ ] 41 min to 1 h [ ] 1 to 2 h [ ] 2 h and above [ ]
(14)
What is the average waiting time you spend at the water point source during the wet season?
Less than 20 min [ ] 21 to 40 min [ ] 41 min to 1 h [ ] 1 to 2 h [ ] 2 h and above [ ]
(15)
What is the average waiting time you spend at the water point source during the dry season?
Less than 20 min [ ] 21 to 40 min [ ] 41 min to 1 h [ ] 1 to 2 h [ ] 2 h and above [ ]
(16)
What will you say about the quality of water you access during the dry season?
Colored [ ] Good [ ] Bad odour [ ] Has some particles inside [ ] Other
(specify)…………………………………………………………..
(17)
What will you say about the quality of water you access during the wet season?
Colored [ ] Good [ ] Bad odour [ ] Has some particles inside [ ] Other
(specify)……………………….
SECTION C: EFFECTS OF VARYING POTABLE WATER ACCESS ON THE LIVELIHOODS OF THE PEOPLE OF SIBI.
(18)
How do you think the water accessibility issue affects your economic activities?
……………………………………………………………………………
(19)
Rate the following statement according to the degree to which water accessibility affects your livelihoods activities.
5 = Strongly Disagree, 4 = Disagree, 3 = Neutral, 2 = Agree, 1 = Strongly Agree
Statement54321
High water prices from water vendors affect my income
Water accessibility slows down domestic and commercial activities
Children usually are either late or absent from school
Long queues in fetching water, resulting in quarrels
Prices of food items increase due to a shortage of water
Workload of women in the households becomes very heavy
Precious time is wasted in the search for water that affects business
Water shortage affect my health
Water shortage affects farming production Easily
Easily access to potable water increases my income Easily
Easily access to potable water increase my farming production/business
SECTION D: THE COPING AND MANAGEMENT STRATEGIES
(20)
Who is responsible for the collection of water for the household? [Tick all that apply] Children [ ] Females/women [ ] Males/men [ ] Other (Specify)………………………….
(21)
What type of container is used for the collection of water?
Jerry Can/Gallon [ ] bucket [ ] Earthen pot [ ] Pan [ ] Other
Specify………………………………….…
(22)
How often do you collect water? Once a day [ ] Twice a day [ ] Three times or more
Within a day [ ]
Weekly [ ] Other Specify………………………
(23)
How do you transport your water in a container home? Head portage [ ] Handle it [ ]
By car [ ] Wheelbarrow [ ] Truck [ ] f. Other Specify………………..
(24)
Do you store water? Yes [ ] No [ ]
(25)
If yes, how frequent? Daily [ ] weekly [ ] monthly [ ]
(26)
What type of storage facility (ies) do you use for storing water?
Bucket [ ] Earthen pot [ ] Tank [ ] Jerry Can/Gallon [ ] Underground reservoir [ ] Others (please specify)………………………………………….
(27)
Which of these coping strategies of water management do you use? Tick (√) as appropriate, as many as those applied to you.
Reduction of water quantity use for a specific purpose [ ] Reuse of water [ ]
Reducing the number of baths taken by household per day [ ]
Disallowing external people from using your stored water [ ]
Purchasing of water from private vendors/tankers Use [ ]
Use of bottled and sachet water especially for drinking purposes [ ]
Purchase of more water storage tanks for households [ ]
Rainwater harvesting for household use [ ]
THANK YOU

Appendix D

Interview Guide for Town Authorities
This study seeks to investigate into the “potable water accessibility and its implication on livelihood of the people of Sibi. You are therefore being invited to share your views on the issues under investigation. The responses will be used for purely academic purposes. Your confidentiality is greatly assured. Thank you. I will be recording the session in order to write my report but will not share the tape with anyone.
Introductions: Please tell me a little about yourself, how long have you have lived in the community and the role you play in the supply of water to the household.
EFFECTS OF VARYING POTABLE WATER ACCESSIBILITY ON THE LIVELIHOODS
(1)
What is the relationship between access to potable water and household livelihoods activities?
(2)
How does access to potable water affect the health of the households?
(3)
How does access to potable water affect the education of the households?
(4)
How does access to potable water affect the social wellbeing of the households?
INSTITUTIONAL ARRANGEMENTS TO MANAGE WATER SOURCES IN THE COMMUNITY
(5)
Who is in charge of managing the various water point sources in the community?
(6)
Is such an institution up to her task/responsibilities? b. Why?
(7)
Are there some guidelines or rules on how private individuals become distributors of public pipe stands? b. Why?
(8)
Are there some NGOs or other institutions in charge of water-related issues in the community?
  • If yes, mention some and their activities
(9)
Are there some guidelines or rules on the usage and management of households on pipe stands?
(10)
How are the maintenance and repair of water point sources financed?
(11)
What are the things put in place to protect the various water point sources from encroachments and pollution?
(12)
What are the things put in place to improve on accessibility to potable water in the community?
APPROPRIATE WAYS OF INCREASING ACCESSIBILITY AND SUSTAINABILITY OF POTABLE WATER SOURCES
(13)
What is the obstacle to access to potable water in the community?
(14)
What are the threats to the sustainability of potable water?
(15)
What are the appropriate measures to improve upon the sustainability of potable water?
(16)
What are the appropriate measures to improve upon access to potable water?

References

  1. Samra, S.; Crowley, J.; Fawzi, M.C.S. The right to water in rural Punjab: Assessing equitable access to water through the Punjab rural water supply and sanitation project. Health Hum. Rights 2011, 13, 36–49. Available online: http://www.jstor.org/stable/healhumarigh.13.2.36 (accessed on 24 October 2022).
  2. Dinka, M.O. Safe Drinking Water: Concepts, Benefits, Principles, and Standards; IntechOpen: London, UK, 2018. [Google Scholar] [CrossRef]
  3. United Nations. Indicator 6.1.1 “Proportion of Population Using Safely Managed Drinking Water Services.”; UN Water: Geneva, Switzerland, 2015; Available online: https://www.sdg6monitoring.org/indicator-611/ (accessed on 24 October 2022).
  4. United Nations. The Sustainable Development Goals Report 2020; Department of Economic and Social Affairs: New York, NY, USA, 2020; Available online: https://unstats.un.org/sdgs/report/2020/The-Sustainable-Development-Goals-Report-2020.pdf (accessed on 24 October 2022).
  5. Holtz, L.; Golubski, C. Addressing Africa’s Extreme Water Insecurity; Policy Commons: Alexandria, VA, USA, 2023; Available online: https://policycommons.net/artifacts/4142848/addressing-africas-extreme-water-insecurity/4951991/ (accessed on 16 August 2023).
  6. WHO. Drinking Water: Economic and Social Effects; Key Facts; WHO: Geneva, Switzerland, 2022; Available online: https://www.who.int/news-room/fact-sheets/detail/drinking-water (accessed on 16 April 2023).
  7. Osei, L.; Amoyaw, J.; Boateng, G.O.; Boamah, S.; Luginaah, I. The paradox of water accessibility: Understanding the temporal and spatial dimensions of access to improved water sources in Rwanda. J. Water Sanit. Hyg. Dev. 2015, 5, 553–564. [Google Scholar] [CrossRef]
  8. Smiley, S.L. Defining and measuring water access: Lessons from Tanzania for moving forward in the post-Millennium Development Goal era. Afr. Geogr. Rev. 2016, 36, 168–182. [Google Scholar] [CrossRef]
  9. Smits, S.; Cousins, T.; Chauke, T. Access to Water and Poor Peoples’ Livelihoods: The Case of Ward 16 of Bushbuckridge Local Municipality; International Water and Sanitation Center: Den Haag, The Netherlands, 2007; pp. 1–43. [Google Scholar]
  10. Díaz-Alcaide, S.; Sandwidi, W.J.P.; Martínez-Santos, P.; Martín-Loeches, M.; Cáceres, J.L.; Seijas, N. Mapping Ground Water Access in Two Rural Communes of Burkina Faso. Water 2021, 13, 1356. [Google Scholar] [CrossRef]
  11. UNICEF. Water. Available online: https://www.unicef.org/ghana/water (accessed on 22 August 2023).
  12. Mahama, A.M.; Anaman, K.A.; Osei-Akoto, I. Factors influencing householders’ access to improved water in low-income urban areas of Accra, Ghana. J. Water Health 2014, 12, 318–331. [Google Scholar] [CrossRef] [PubMed]
  13. Peprah, C.; Oduro-ofori, E.; Asante-wusu, I. Analysis of Accessibility to Water Supply and Sanitation Services in the Awutu-Senya East Municipality, Ghana. J. Sustain. Dev. 2015, 8, 310–325. [Google Scholar] [CrossRef]
  14. Adjakloe, Y.A. Accessing Water for Domestic Use: The Challenges Faced in the Ga West Municipality, Ghana. Int. J. Soc. Sci. Humanit. Res. 2014, 2, 78–91. Available online: https://www.researchpublish.com/papers/accessing-water-for-domestic-use-the-challenges-faced-in-the-ga-west-municipality-ghana# (accessed on 24 October 2022).
  15. Jemmali, H.; Abu-Ghunmi, L. Multidimensional analysis of the water-poverty nexus using a modified Water Poverty Index: A case study from Jordan. Water Policy 2016, 18, 826–843. [Google Scholar] [CrossRef]
  16. Chambers, R.; Conway, G. Sustainable Rural Livelihoods: Practical Concepts for the 21st Century; IDS Discussion Paper 296; IDS: Brighton, UK, 1992. [Google Scholar]
  17. Smits, S. Water and Livelihoods. In Water and Environmental Health; Issue 2020; Water Engineering and Development Centre: Loughborough, UK, 2005; Available online: https://www.lboro.ac.uk/research/wedc/well/water-supply/ws-factsheets/water-and-livelihoods/ (accessed on 24 October 2022).
  18. Moriarty, P.; Butterworth, J. The Productive Use of Domestic Water Supplies: How Water Supplies Can Play a Wider Role in Livelihood Improvement and Poverty Reduction; Thematic Overview Paper; IRC International Water and Sanitation Centre: Den Haag, The Netherlands, 2003. [Google Scholar]
  19. World Health Organization (WHO); United Nations Children’s Fund (UNICEF). Progress on Drinking Water, Sanitation and Hygiene: 2015 Update and MDG Assessment; WHO Press: Geneva, Switzerland, 2017. [Google Scholar]
  20. Sen, A. Development as Freedom, 2nd ed.; Oxford University Press: Oxford, UK, 2001. [Google Scholar]
  21. Wang, J.; Xu, Z.; Huang, J.; Rozelle, S. Incentives in water management reform: Assessing the effect on water use, production, and poverty in the Yellow River Basin. Environ. Dev. Econ. 2005, 10, 769–799. [Google Scholar] [CrossRef]
  22. Grafton, R.Q.; Ward, M.B.; To, H.; Kompas, T. Determinants of residential water consumption: Evidence and analysis from a 10-country household survey. Water Resour. Res. 2011, 47, W08537. [Google Scholar] [CrossRef]
  23. Jonah, C.; Maitho, T.; Omware, Q. Water Access and Sustainable Rural Livelihoods: A Case of Elementaita Division in Nakuru County, Kenya. Int. J. Sci. Technol. Soc. 2015, 3, 9. [Google Scholar] [CrossRef]
  24. Mphande, F.A. Poverty, Health and Livelihoods. In Infectious Diseases and Rural Livelihood in Developing Countries; Springer Science and Business Media: Berlin/Heidelberg, Germany, 2016; pp. 1–187. [Google Scholar] [CrossRef]
  25. Ghana Statistical Service (GSS). 2010 Population and Housing Census. District Analytical Report: Nkwanta North District; Ghana Statistical Service: Accra, Ghana, 2014. [Google Scholar]
  26. Ghana Statistical Service (GSS). Ghana 2021 Population and Housing Census: General Report; Ghana Statistical Service: Accra, Ghana, 2021; Volume 3C. [Google Scholar]
  27. Ministry of Food and Agriculture. Nkwanta North District Profile. 2020. Available online: https://mofa.gov.gh/site/directorates/district-directorates/volta-region/296-nkwanta-north (accessed on 24 October 2022).
  28. Agyemang, O.O. Access to Potable Water and Livelihoods of Households in Sekyere Kumawu District; University of Cape Coast: Cape Coast, Ghana, 2019. [Google Scholar]
  29. Yamane, T. Statistics: An Introductory Analysis, 3rd ed.; Harper and Row: New York, NY, USA, 1967. [Google Scholar]
  30. Ahorlu, C.S.; Ndong, I.C.; Okyere, D.; Mensah, B.A.; Chu, C.E.; Enos, J.Y.; Abuaku, B. The Effect of Mass Testing, Treatment and Tracking on the Prevalence of Febrile Illness in Children under 15 in Ghana. Pathogens 2022, 11, 1118. [Google Scholar] [CrossRef] [PubMed]
  31. Ofoegbu, N.G.; Odoemelam, N. International financial reporting standards (IFRS) disclosure and performance of Nigeria listed companies. Cogent Bus. Manag. 2018, 5, 1542967. [Google Scholar] [CrossRef]
  32. Uakarn, C. Sample size estimation using Yamane and Cochran and Krejcie and Morgan and Green formulas and Cohen statistical power analysis by G*power and comparisons. Apheit Int. J. 2021, 10, 76–88. [Google Scholar]
  33. McCabe, C.J.; Halvorson, M.A.; King, K.M.; Cao, X.; Kim, D.S. Interpreting Interaction Effects in Generalized Linear Models of Nonlinear Probabilities and Counts. Multivar. Behav. Res. 2021, 57, 243–263. [Google Scholar] [CrossRef] [PubMed]
  34. UNICEF/WHO. Assessing the Affordability of Water, Sanitation and Hygiene: Ghana Country Case Study; Issue May; WHO: Geneva, Switzerland, 2021. [Google Scholar]
  35. Adams, E.A.; Boateng, G.O.; Amoyaw, J.A. Socioeconomic and Demographic Predictors of Potable Water and Sanitation Access in Ghana. Soc. Indic. Res. 2015, 126, 673–687. [Google Scholar] [CrossRef]
  36. Cassivi, A.; Johnston, R.; Waygood, E.O.D.; Dorea, C.C. Access to drinking water: Time matters. J. Water Health 2018, 16, 661–666. [Google Scholar] [CrossRef] [PubMed]
  37. Majuru, B.; Jagals, P.; Hunter, P.R. Assessing rural small community water supply in Limpopo, South Africa: Water service benchmarks and reliability. Sci. Total Environ. 2012, 435–436, 479–486. [Google Scholar] [CrossRef]
  38. Devi, A.; Bostoen, K. Extending the critical aspects of the water access indicator using East Africa as an example. Int. J. Environ. Health Res. 2009, 19, 329–341. [Google Scholar] [CrossRef]
  39. Deshpande, A.; Miller-Petrie, M.K.; Lindstedt, P.A.; Baumann, M.M.; Johnson, K.B.; Blacker, B.F.; Abbastabar, H.; Abd-Allah, F.; Abdelalim, A.; Abdollahpour, I.; et al. Mapping geographical inequalities in access to drinking water and sanitation facilities in low-income and middle-income countries, 2000–2017. Lancet Glob. Health 2020, 8, e1162–e1185. [Google Scholar] [CrossRef]
  40. Tallman, P.S.; Collins, S.; Salmon-Mulanovich, G.; Rusyidi, B.; Kothadia, A.; Cole, S. Water insecurity and gender-based violence: A global review of the evidence. WIREs Water 2022, 10, e1619. [Google Scholar] [CrossRef]
  41. Gondo, R.; Kolawole, O.D. Household water access and COVID-19 in Karoi town, Zimbabwe. Sci. Afr. 2022, 16, e01145. [Google Scholar] [CrossRef] [PubMed]
  42. Yilret Nanle, V.; Abdul Latip, N.; Karem, R. Resident’s water accessibility towards sustainability: The case of informal settlements of Jos Metropolis, Nigeria. Plan. Malays. 2022, 20, 87–100. [Google Scholar] [CrossRef]
  43. Food and Agriculture Organization (FAO). Livelihoods Assessment and Analysis; FAO Elearning Academy: Rome, Italy, 2007; Available online: https://elearning.fao.org/course/view.php?id=166 (accessed on 16 August 2023).
  44. Department for International Development. Sustainable Livelihoods Guidance Sheets; DFID: London, UK, 1999; Available online: https://www.livelihoodscentre.org/documents/114097690/114438878/Sustainable+livelihoods+guidance+sheets.pdf/ (accessed on 16 August 2023).
  45. Walker, M.M. Negotiating access to water in central Mozambique: Implications for rural livelihoods. Econ. Anthropol. 2019, 6, 222–233. [Google Scholar] [CrossRef]
  46. Abraham, E.M.; Martin, A.M.; Cofie, O.; Raschid-Sally, L. Urban households’ access to water for livelihoods enhancement in Accra, Ghana. Waterlines 2015, 34, 139–155. [Google Scholar] [CrossRef]
  47. Miller, J.D.; Workman, C.L.; Panchang, S.V.; Sneegas, G.; Adams, E.A.; Young, S.L.; Thompson, A.L. Water Security and Nutrition: Current Knowledge and Research Opportunities. Adv. Nutr. 2021, 12, 2525–2539. [Google Scholar] [CrossRef] [PubMed]
  48. Miller, J.D.; Vonk, J.; Staddon, C.; Young, S.L. Is household water insecurity a link between water governance and well-being? A multi-site analysis. J. Water Sanit. Hyg. Dev. 2020, 10, 320–334. [Google Scholar] [CrossRef]
  49. Achore, M.; Bisung, E.; Kuusaana, E.D. Coping with water insecurity at the household level: A synthesis of qualitative evidence. Int. J. Hyg. Environ. Health 2020, 230, 113598. [Google Scholar] [CrossRef]
  50. Hargrove, A. Economic and Social Impacts on Well-Being: A Cross-National Multilevel Analysis of Determinants of Access to Water and Sanitation. Sociol. Inq. 2019, 90, 497–526. [Google Scholar] [CrossRef]
  51. Young, S.L. Viewpoint: The measurement of water access and use is key for a more effective food and nutrition policy. Food Policy 2021, 104, 102138. [Google Scholar] [CrossRef]
  52. Ram. Generalized Linear Model|What Does It Mean?–Great Learning. Great Learning Blog: Free Resources What Matters to Shape Your Career! 2022. Available online: https://www.mygreatlearning.com/blog/generalized-linear-models/#:~:text (accessed on 24 October 2022).
  53. Jeil, E.B.; Abass, K.; Ganle, J.K. “We are free when water is available”: Gendered livelihood implications of sporadic water supply in Northern Ghana. Local Environ. 2020, 25, 320–335. [Google Scholar] [CrossRef]
  54. Mats, L. Trends in Water Availability and Accessibility and Potential Impact on Nutrition in Africa; Stockholm, Sweden, 2011; Available online: http://v3.globalcube.net/clients/ntwv2/content/medias/download/SUNRAY_water_and_nutrition_in_Africa.pdf (accessed on 24 October 2022).
  55. Howard, G.; Ince, M.; Smith, M. Rapid Assessment of Drinking Water Quality: A Handbook for Implementation-Joint Monitoring for Water Supply and Sanitation; WEDC, Loughborough University: Loughborough, UK, 2003. [Google Scholar]
  56. Ghana Water Company. Ghana Water and Sanitation Sector. Performance Report; Ministry of Water Resources, Works and Housing: Accra, Ghana, 2010; Available online: https://www.washghana.net/sites/default/files/0993402f3e475dae0fbfb5f51a762723.pdf (accessed on 16 August 2023).
  57. Misati, A.G. Household safe water management in Kisii County, Kenya. Environ. Health Prev. Med. 2016, 21, 450–454. [Google Scholar] [CrossRef] [PubMed]
  58. United Nations Children’s Fund (UNICEF); World Health Organization. The Measurement and Monitoring of Water Supply, Sanitation and Hygiene (WASH) Affordability; WHO: New York, NY, USA, 2021. [Google Scholar]
  59. Sphere Project. Humanitarian Charter and Minimum Standards in Humanitarian Response, 3rd ed.; Practical Action Pub: Rugby, UK, 2011. [Google Scholar]
  60. Sorenson, S.B.; Morssink, C.; Campos, P.A. Safe access to safe water in low income countries: Water fetching in current times. Soc. Sci. Med. 2011, 72, 1522–1526. [Google Scholar] [CrossRef] [PubMed]
Figure 1. Geographical location of the study area within the Nkwanta North District of Ghana. Source: Authors’ construct, 2023.
Ijgi 12 00365 g001
Figure 2. A summary of the research methods.
Ijgi 12 00365 g002
Figure 3. Sustainable Livelihood Framework. Source: Adapted from DFID (1999).
Ijgi 12 00365 g003
Figure 4. Connections between water access, water management, and livelihoods. Source: Authors’ construct (2023).
Ijgi 12 00365 g004
Figure 5. Locations of available water point sources in the study communities.
Ijgi 12 00365 g005
Figure 6. Functionality of the water point sources in the three study communities.
Ijgi 12 00365 g006
Figure 7. Cost–distance to water point sources in the study communities.
Ijgi 12 00365 g007
Figure 8. Average waiting times of respondents at the water point sources.
Ijgi 12 00365 g008
Figure 9. Photo showing people collecting water with pans. Source: Authors captured (2021).
Ijgi 12 00365 g009
Figure 10. Water storage facilities. Source: Authors captured (2021).
Ijgi 12 00365 g010
Table 1. Annual cost (Gh¢) of accessing water by households.
Water Point SourceNMinimumMaximumModeMeanStd. Deviation
Public Tap7302000250.5750.46566.66
Sachet/Bottled Water51250.52000750.5774.98536.72
Borehole4802000250.5713.99578.85
Well160250.5015.6762.63
River/Stream31101750.5026.54187.1
Water Vendor480200020001318.03685.46
Note: Gh¢1.00 = US$0.1656 during the time that the data were collected, 2021.
Table 2. Containers used for collecting water by households.
CommunityContainers Used for Collecting WaterTotal
Jerry Can/GallonBucketEarthen PotPan
Sibi Hill-Top140451160346
Jato-Kparikpare5215162130
Sibi Central5313082148
Total N (%)245 (39.3)73 (11.7)2 (0.3) 304 (48.7)624 (100)
Table 3. Types of storage facilities used to store water by the households.
Storage Facility TypeSibi Hill-TopJato-KparikpareSibi CentralTotal (%)
Bucket4520671 (10.9)
Earthen Pot671527109 (16.7)
Drum/Tank1555278285 (43.8)
Gallon872535147 (22.6)
Underground Reservoir0000 (0.0)
Aluminum Pot1713939 (6.0)
Total N (%)371 (57.0)125 (19.2)155 (23.8)651 (100)
Table 4. Water usage strategies adopted by the households.
Management StrategiesSibi Hill-TopJato-KparikpareSibi
Central
N (%)
Reduction in water quantity use for a specific purpose1626284308 (18.3)
Reuse of water50182492 (5.5)
Reducing the number of baths taken by household per day1596278299 (17.8)
Disallowing external people from using stored water563423113 (6.7)
Purchasing of water from private vendors/tanker use1093651196 (11.6)
Use of bottled and sachet water, especially for drinking purposes1175043210 (12.5)
Purchase of more water storage tanks for household814239162 (9.6)
Rainwater harvesting for household use1576285304 (18.1)
Total N (%)891 (52.9)366 (21.7)427 (25.4)1684 (100)
Table 5. Experienced impacts of limited potable water access on livelihood activities.
AgreeDisagreeNeutral
Long queues in fetching water lead to quarrels302 (97.1)5 (1.6)4 (1.3)
Prices of food items increase due to the shortage of water209 (67.2)46 (14.8)56 (18)
The workload of women in the households becomes very heavy302 (97.1)6 (1.9)3 (1.0)
Precious time is wasted in the search for water, which affects business302 (97.1)3 (1.0)6 (1.9)
Water shortage affects health301 (96.8)6 (1.9)4 (1.3)
Water shortage affects farming productivity304 (97.7)1 (0.3)6 (1.9)
High water prices from water vendors affect income255 (82.0)24 (7.7)32 (10.3)
Water non-accessibility slows down domestic and commercial activities306 (98.4)3 (1.0)2 (0.6)
Table 6. GLM gamma log link model results.
ParameterBStd. ErrorHypothesis TestSig.95% Wald Confidence Interval
Wald Chi-SquaredfLowerUpper
(Intercept)0.1850.038423.1991<0.0010.110.26
Average Waiting Time0.0020.00750.04310.835−0.0130.016
Distance to Source (m)0.0480.01539.89710.0020.0180.078
Average Cost of Water ($)0.0150.00733.95710.04700.029
(Scale)0.0480.0038 0.0410.056
Dependent Variable: Overall index experienced impacts of inadequate potable water access on livelihoods
Disclaimer/Publisher’s Note: The statements, opinions and data contained in all publications are solely those of the individual author(s) and contributor(s) and not of MDPI and/or the editor(s). MDPI and/or the editor(s) disclaim responsibility for any injury to people or property resulting from any ideas, methods, instructions or products referred to in the content.

