Article

Spatial Distribution Characteristics and Influencing Factors on the Retail Industry in the Central Urban Area of Lanzhou City at the Scale of Daily Living Circles

School of Architecture and Urban Planning, Lanzhou Jiaotong University, Lanzhou 730070, China
*
Author to whom correspondence should be addressed.
ISPRS Int. J. Geo-Inf. 2023, 12(8), 344; https://doi.org/10.3390/ijgi12080344
Submission received: 24 June 2023 / Revised: 15 August 2023 / Accepted: 16 August 2023 / Published: 18 August 2023

Abstract

:
Using a people-centered approach to new urbanization, China has committed to building high-quality living environments through improving urban livability and promoting a stronger sense of belonging among residents. Retail stores serve as one of the most immediate and accessible destinations for residents’ consumption, and their spatial configuration has a direct impact on residents’ satisfaction and happiness in their daily lives. In this context, for the present study we selected the central urban area of Lanzhou City as the case study area. Based on POI data and using the daily life circle as the basic unit, we applied methods such as kernel density analysis, hotspot analysis, and the Shannon–Weaver index to analyze spatial distribution patterns of the retail industry. Furthermore, we applied Geodetector to analyze the impacts of four factors that are closely related to the retail industry: economic level, convenience level, market demand, and location. The conclusions are as follows: In the central urban area of Lanzhou, the retail industry exhibits a belt distribution pattern along the Yellow River. The density of distribution gradually decreases from the city center toward the outskirts, forming four prominent agglomeration centers. Overall, within the central urban area of Lanzhou, the spatial distribution of the retail industry at the scale of daily living circles shows that only a small proportion of the industry demonstrates noticeable clustering effects. In terms of spatial patterns, the retail industry at the scale of the daily living circles demonstrates similar characteristics in terms of diversity and agglomeration distribution. It exhibits a decreasing trend from the urban core toward the peripheral areas. The agglomeration distribution pattern of the retail industry in the central urban area of Lanzhou is considerably influenced by market demand, economic level, convenience, and location. The spatial distribution of the retail industry in the central urban area is primarily influenced by economic factors and convenience, while market demand plays a major role and location has a relatively minimal impact.

1. Introduction

Retail activities play a fundamental role in cities, as they drive rapid urban development, serve as one of the key elements that attract individuals to cities, and directly influence residents’ quality of life [1,2]. However, with the ongoing processes of urban transformation and development, major changes have occurred concerning the scale and types of cities and industries within them. Using a people-centered approach to new urbanization, China has committed to building high-quality living environments through improving urban livability and promoting a stronger sense of belonging among residents. Retail stores serve as one of the most immediate and accessible destinations for residents’ consumption, and their spatial configuration has a direct impact on residents’ satisfaction and happiness in their daily lives. Therefore, as an integral component of the urban commercial model, the study of spatial patterns and development within the urban retail industry can play a pivotal role in enhancing the urban spatial structure and maximizing economic benefits [3].
The study of commercial locations dates back to 1933, when Walter Christaller, in his book “Central Places in Southern Germany”, proposed the retail location theory, which is considered to be the origin of commercial location theory [4,5]. Subsequently, researchers began to explore various spatial expressions and models of retail distribution. For example, Berry and Davies discussed the layout of retail trade within cities and proposed theories on the hierarchical evolution of urban commercial centers [6]. Building upon these theoretical frameworks, and accompanied by the rapid development of information technology, geographic information science emerged, which is characterized by large volumes of data, high accuracy, and precise information [7]. In particular, point of interest (POI) data have been extensively used in research into urban spaces, mainly due to the convenience of accessing these data, the geographical coordinate accuracy, and the comprehensiveness of the information [8]. In recent years, researchers have used POI data to conduct studies into the spatial patterns of urban retail industry. For example, Wu et al. [9], Lin et al. [10], and Fang et al. [3] have explored this topic from various perspectives.
In this context, for the present study we selected the central urban area of Lanzhou City as the case study area. Based on POI data and using the daily life circle as the basic unit, we applied methods such as kernel density analysis, hotspot analysis (Getis–Ord G*), and the Shannon–Weaver index to analyze spatial distribution patterns of the retail industry. Furthermore, we applied Geodetector to analyze the impacts of four factors that are closely related to the retail industry: economic level, convenience level, market demand, and location. This research has both theoretical and practical importance. On the theoretical side, it enriches the research methods and systems of the urban retail industry, thereby making an important contribution to theoretical advancements in this field. On the practical side, it offers valuable reference data for urban planning, commercial site selection, and the optimization of retail industry layout, with important practical implications.

2. Literature Review

Early studies of retailing provided a solid foundation for the contemporary study of retailing. The central place theory, developed by Christaller in 1933, explains how retailing is hierarchically organized according to size and scope [11]. This theory lays the foundation for our understanding of the spatial distribution of retail stores and their interrelationships. August Losch proposed Losch’s location theory and Haff introduced the gravity model, which are two theoretical contributions regarding the optimal selection of retail store locations. These theories have had a significant impact on the study of spatial patterns in the retail industry [12,13]. In 1990, Porter proposed the theory of competitive advantage and the generalized theory of centrality, and the theory of competitive advantage has had a significant impact on the study of industrial clusters and the spatial pattern of retailing. His research explored the competitive advantage of industrial clusters and the factors of global competition, and it provides an important guide to understanding the agglomeration effect and competitive advantage of retail stores [14]. Early research focused on the analysis of traditional brick-and-mortar retail stores and lacked research on emerging formats such as online and omni-channel retailing. However, with the rapid development of new technologies in the late 20th century, the study of retailing has become more diverse. A variety of related studies have been conducted in the political, economic, technological, and geographic fields to adapt to the changes and developments in the retail industry. For example, Laura Yrjänä et al. formulated a sustainability framework and investigated the effects of sustainable development policies on retail industry planning through an extensive review of existing literature. They contend that retail industry policies can exert both favorable and unfavorable impacts on sustainable development, with the prevailing social environment of that time being the primary influencing factor [15]. Mai studied how the sharing economy affects retail industry profits and service quality. According to that analysis, the presence of complete ownership results in elevated customer expectations regarding service quality and provides increased value for businesses [16]. Goldman’s research revealed a direct relationship between the upgrading of the retail industry in developing countries by foreign retailers and economic disparities [17]. Research in the domains of political economy has predominantly concentrated on delineating the unique characteristics of the contemporary social milieu. Consequently, these research findings exhibit a tendency towards macroeconomic analysis, thereby offering limited guidance for the comprehensive retail industry at the urban level. Jin et al. undertook an analysis of the disruptive impact of emerging technologies on the conventional retail industry and proposed corresponding strategies. They evaluated three specific challenges posed by emerging technologies in the retail domain: born-digital brands, AI-enabled demand forecasting and product design, and collaborative consumption [18]. Badorf et al. discovered that the weather can have an impact on daily sales in the retail industry and that weather forecast information has a positive effect on the prediction of retail sales [19]. Tomáš Formánek established a correlation between store location and its distance from the city center, the presence of competitor stores, and population density, employing these variables as controlling factors to evaluate the sales dynamics within the retail industry [20]. Xiao et al. studied the spatial and temporal distribution pattern of pharmacies in China, revealing that pharmacies are unevenly distributed between cities and regions. They recommended the implementation of certain policies to address this situation [21]. Studies at the geographical technological level primarily concentrate on augmenting retail turnover and analyzing the spatial distribution within the retail industry but often overlook the influential factors underlying this distribution pattern.
The study of the retail industry has produced abundant outcomes and has exhibited a certain level of innovation in various specialized domains. Some researchers have employed mathematical models to elucidate the layout of the retail industry and analyze its associated factors. For example, Piovani et al. conducted a mathematical modeling analysis by considering the spatial distribution of the population and retailers in London [22]. Bao et al. developed a comprehensive model for analyzing the evolutionary dynamics of retail formats [23]. Zhou et al. employed GIS and the Huff model to investigate the selection of optimal locations for super shopping malls [24]. The quantitative studies accomplished by these mathematical models offer the advantage of objectivity. However, given the substantial heterogeneity across different regions in the retail industry, it is imperative to incorporate regional characteristics into research practices for practical applications. Typical data sources used for retail industry research encompass statistical data and survey data. For example, Li et al. analyzed the agglomeration characteristics of industrial space using business registration data. They believe that retail agglomeration is dominated by larger firms [25]. Borowska-Stefańska et al. employed commercial statistical data to examine the spatial distribution of retail stores [26]. Liang et al. utilized statistical yearbook data to study the relationship between digital technology and high-quality development of the retail industry. Their analysis revealed that during the initial stages of low-level digital technology development, it adversely affects the operational efficiency of the retail industry. However, as digital technology advances to a moderate to advanced level, it transforms into a positive influencing factor [27]. Lyu et al. conducted questionnaire surveys to investigate the relationship between consumers’ mindset and their shopping behavior while using smartphones in shopping mall environments [28]. The utilization of these novel data sources offer considerable advantages in both precision and comprehensiveness, particularly in their ability to accurately elucidate the characteristics and patterns of urban commercial structures. With the continuous refinement of geographic data, researchers are able to examine the patterns of retail industry activities from smaller scales and with greater accuracy. For example, Lutfi et al. conducted an analysis highlighting the crucial role geospatial big data play in research pertaining to the retail industry [29]. Carpio-Pinedo et al. analyzed the relationship between commercial spatial distribution and social space by using open cadastral, business registration, and social network data [30]. Romanillos et al. analyzed inter-sectoral business activities based on transaction data sourced from bank cards [31]. Chen et al. used POI data to study the correlation between the entity retail industry and commercial economic distribution [32]. Lee et al. utilized taxi travel data to examine the influence of shopping centers on the retail behavior of nearby residents [33]. With the continuous refinement of new geospatial data, the research perspective on the retail industry has expanded and diversified, and it now exhibits a multitude of characteristics. For example, Rice et al. discovered that alterations in lifestyle centers can influence clustering patterns within the retail industry [34]. Cai et al. examined the layout characteristics and identified existing issues within the retail industry by analyzing cities of varying scales and using them as case studies [35]. Zeng et al. investigated the functional convenience of upscale retail within communities and examined its interrelationships with land use, services, and facility scales [36]. Wang et al. examined the distribution characteristics and influencing factors of the retail industry at the street level [37]. Chung et al. investigated the spatial spillover effects of large shopping centers on nearby retail stores [38]. Geographic big data has been an important aid to retail research at different scales, but relatively little research has been done to explain the correlation between the distribution of retail facilities and the daily lives of residents.
Overall, major progress has been made in the relevant research fields. However, there are still some limitations that need to be addressed. First, studies into the spatial distribution characteristics and influencing factors of the retail industry using POI data are still in the initial, exploratory stages, primarily focusing on cities in developed regions in the eastern part of China. In contrast, there is a relative scarcity of research conducted into cities in underdeveloped regions in the western part of China. Second, most studies have primarily focused on investigating the distribution characteristics and influencing factors of the retail industry at the city (county) or street level. However, there have been relatively few studies that have specifically examined the retail industry at the scale of the daily living circles (DLCs). The present study aims to fill the aforementioned gaps and address the existing deficiencies in the literature.

3. Data and Methods

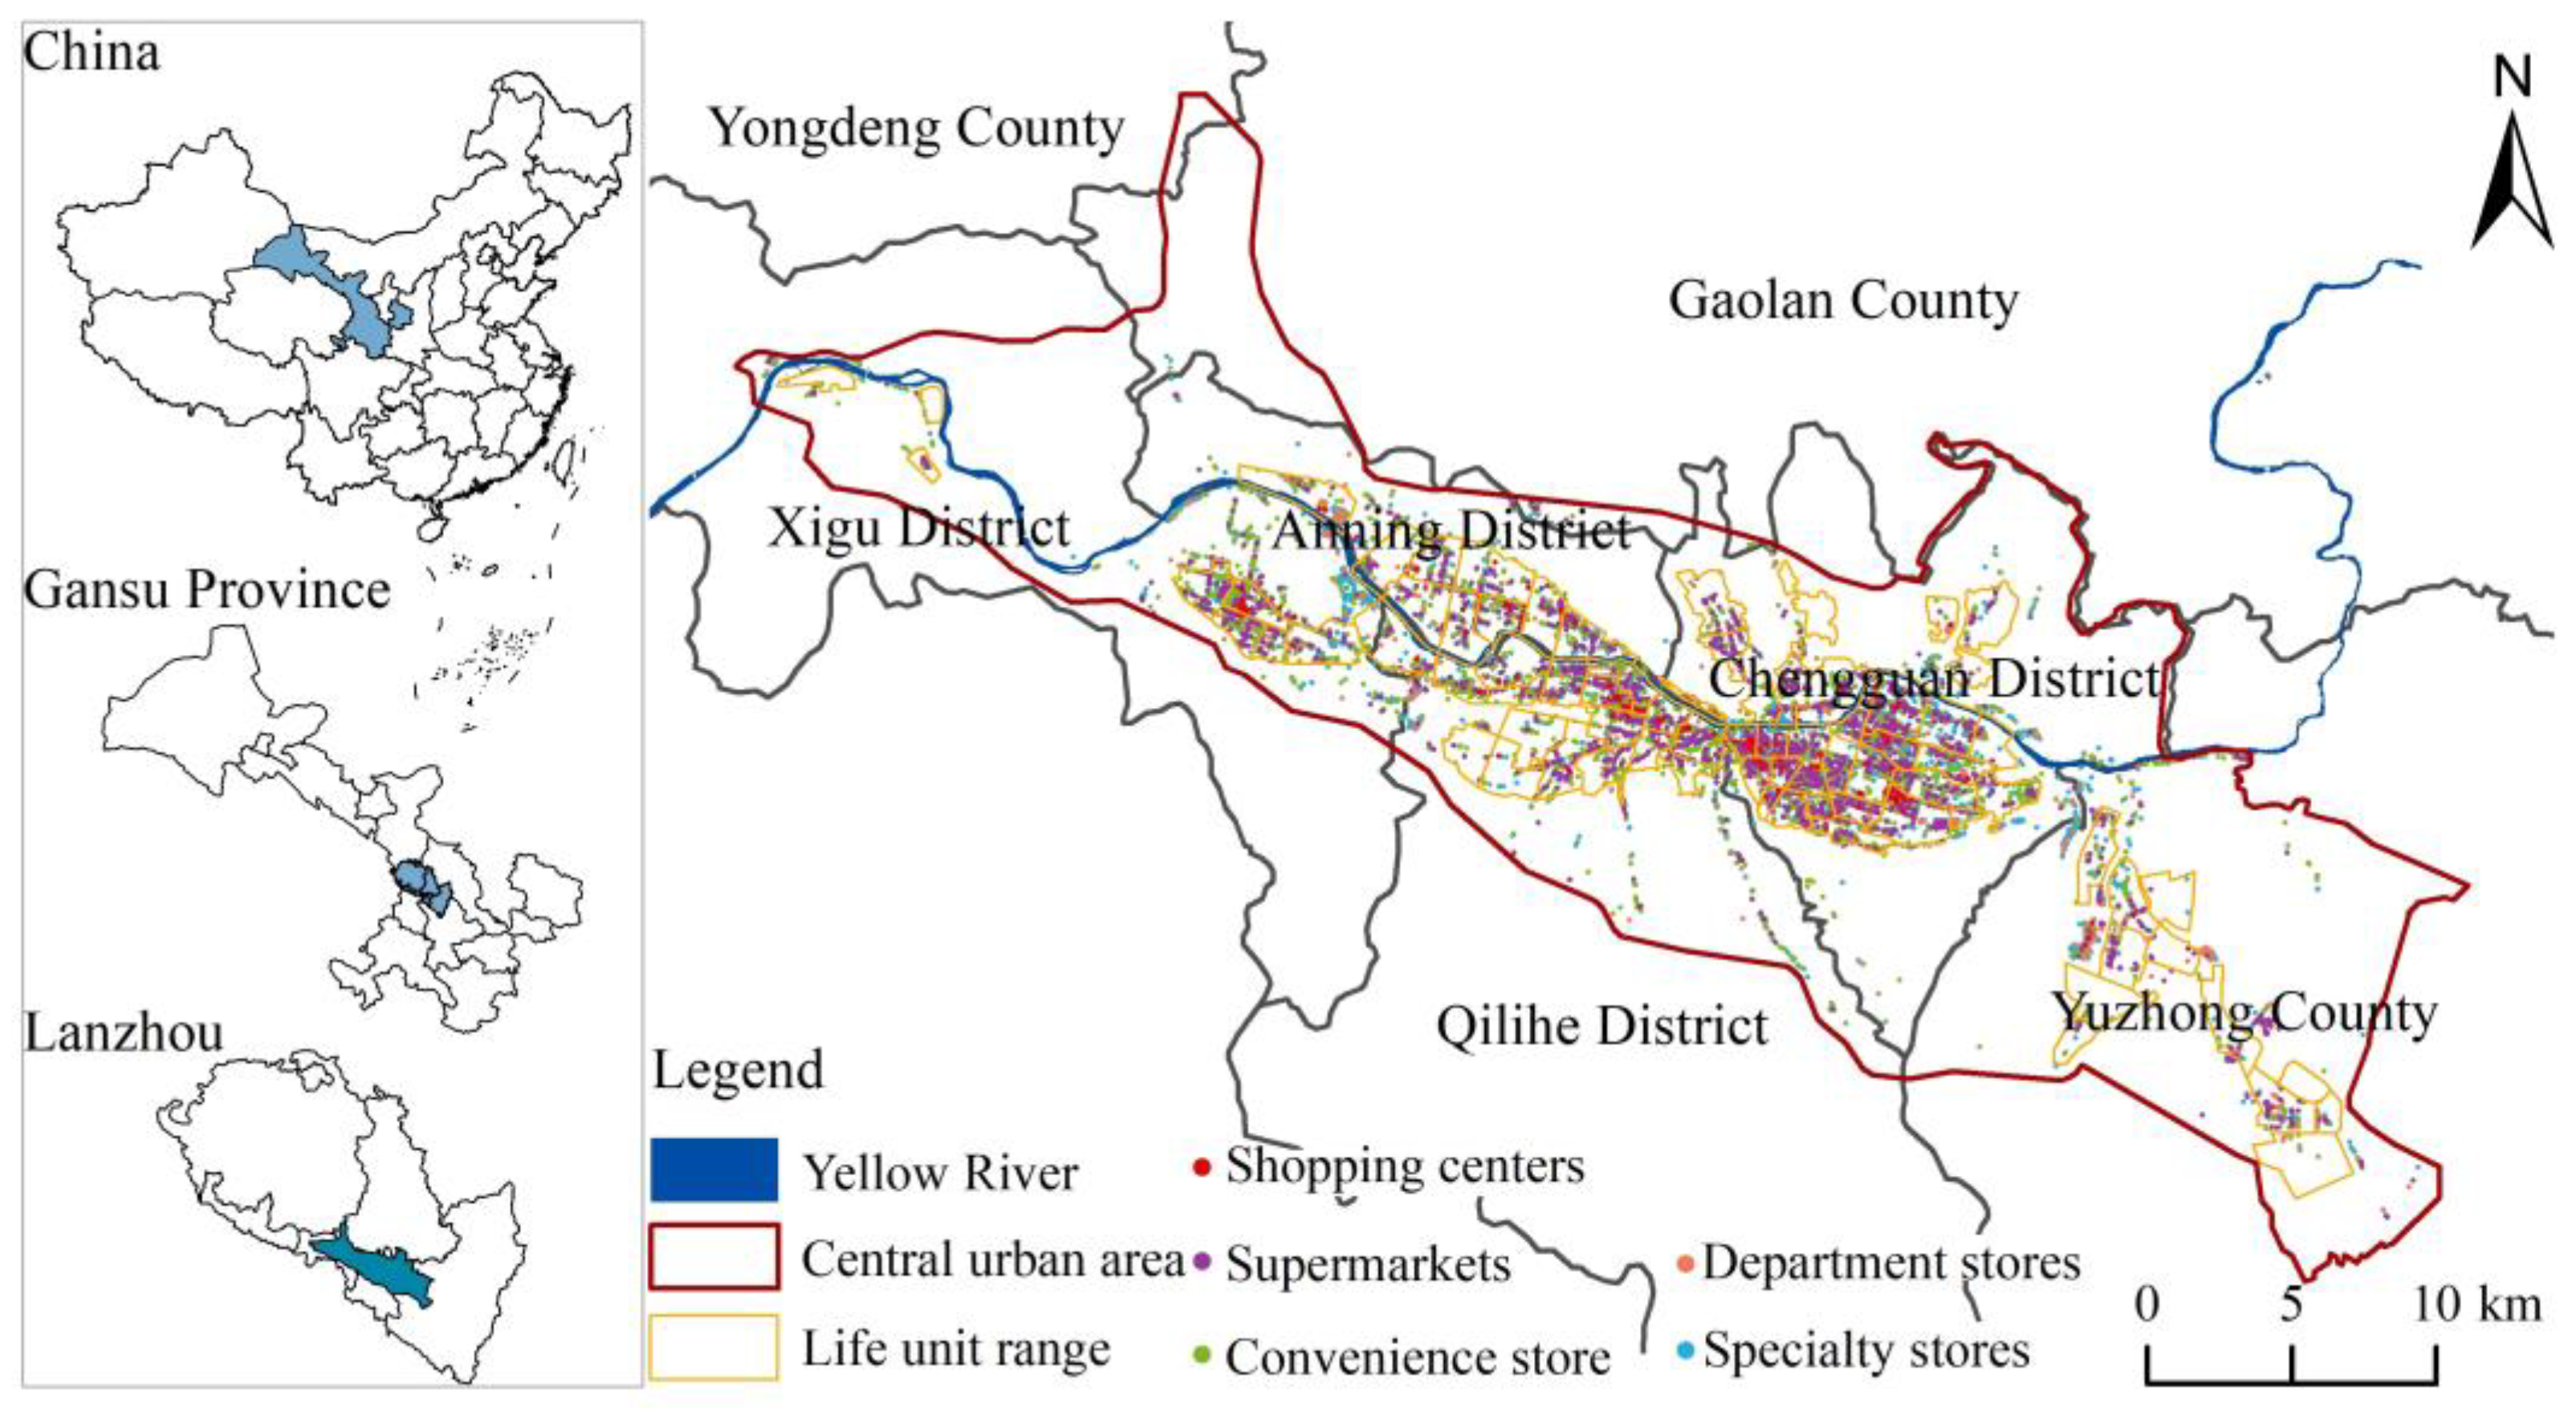
3.1. Study Area and Data Acquisition

Lanzhou City is the capital city of Gansu Province and serves as an important hub for population, traffic, and information flow in the northwest region of China. In the present study, the research area was defined as the central urban area outlined in the “Research and Guidelines for the Planning of 15-Minute Daily Living Circles in Lanzhou City”, which includes Chengguan District, Qilihe District, Xigu District, Anning District, and parts of Yuzhong County (Figure 1). The 15-minute daily living circle delineated by the study is used as the basic unit of statistics. The delineation of this living circle mainly takes into account factors such as population size, functional balance, and service radius, aiming at realizing that residents can meet the basic service functions required for their lives within the 15-minute walkable range. Using the Amap Open Platform, we collected retail industry POI data for the central urban area of Lanzhou City; the original data were then reclassified and organized (Table 1). We obtained data such as administrative boundaries, major roads, and rivers from the 1:1 million National Basic Geographic Database. Data for population density, land prices, and housing prices were sourced from multiple channels, including LandScan Global (2021), the land grade for urban commercial services in Lanzhou City, the Benchmark Land Price Map, and statistics from Anjuke.

3.2. Research Methodology

3.2.1. Kernel Density Analysis

The kernel density estimation method was used to analyze the overall spatial clustering of POI data [39,40]. The kernel density estimation method consists of overlaying a smooth surface above the point where it is located, and the value of the surface decreases as the distance from this point increases. When the distance is the search radius, the surface value is 0. The density map output in ArcGIS is a superposition of all the kernel surface values for each image element. The formula is as follows:
ρ = 1 r 2 i = 1 n 3 π 1 d i r 2 2
In this formula: r is the search radius, which is set based on the service radius of different levels of the retail industry; i represents all points within the search radius; and di is the distance from the selected point.

3.2.2. Hotspot Analysis (Getis–Ord G*) Method

Hotspot analysis is often used to analyze the spatial occurrence of clustering of point-event elements, and the method can be used to investigate the degree of clustering of retail in the DLCs [32,40]. To become a hotspot, three conditions need to be met: firstly, the current daily living circles need to have a high agglomeration value; secondly, the other daily living circles around the current daily living circles should also have a high value; and lastly, the value of the current DLC is very different from the sum total. The spatial agglomeration value of the DLC is the GIZ score, which is calculated as follows:
G i Z = j = 1 n W i , j X j X ¯ j = 1 n W i , j S n j = 1 n W i , j 2 j = 1 n W i , j 2 n 1 = j = 1 n W i , j X j j = 1 n X j n j = 1 n W i , j j = 1 n X j 2 n j = 1 n X j n 2 n j = 1 n W i , j 2 j = 1 n W i , j 2 n 1
In this formula, Xj represents the total value of the retail industry in the jth DLC; Wi,j denotes the spatial weight between the ith and jth DLC; n is the total number of DLCs; and GiZ represents the level of clustering.

3.2.3. Shannon–Weaver Index

The Shannon–Weaver index method was employed to analyze the diversity characteristics of the urban retail industry [41]. The formula is as follows:
H = i = 1 s P i log 2 P i = i = 1 s n i N log 2 n i N
In this formula, Pi represents the proportion of the quantity of the ith type of retail industry out of the total quantity of retail industries; ni represents the quantity of the ith type of retail industry; and N represents the total quantity of retail industries. A higher value of the index indicates a greater level of diversity.

3.2.4. Geodetector

A Geodetector was employed to conduct factor analysis, which included factor detection and interaction detection [42,43,44,45]. The formula is as follows:
q = 1 h = 1 L N h σ h 2 N σ 2
In this formula, q represents a measure of spatial heterogeneity, where a larger value indicates a stronger explanatory power of the detected factor for variable Y, and vice versa; h = 1,…, L denotes the classification or partition of variable Y or factor X. N h and N represent the number of units in the h-th class and the entire study area, respectively; σ h 2 represents the variance of the influencing factors in the h-th class, and σ 2 represents the variance of the Y values in the entire study area.

4. Results and Discussions

4.1. Retail Industry Spatial Distribution Characteristics

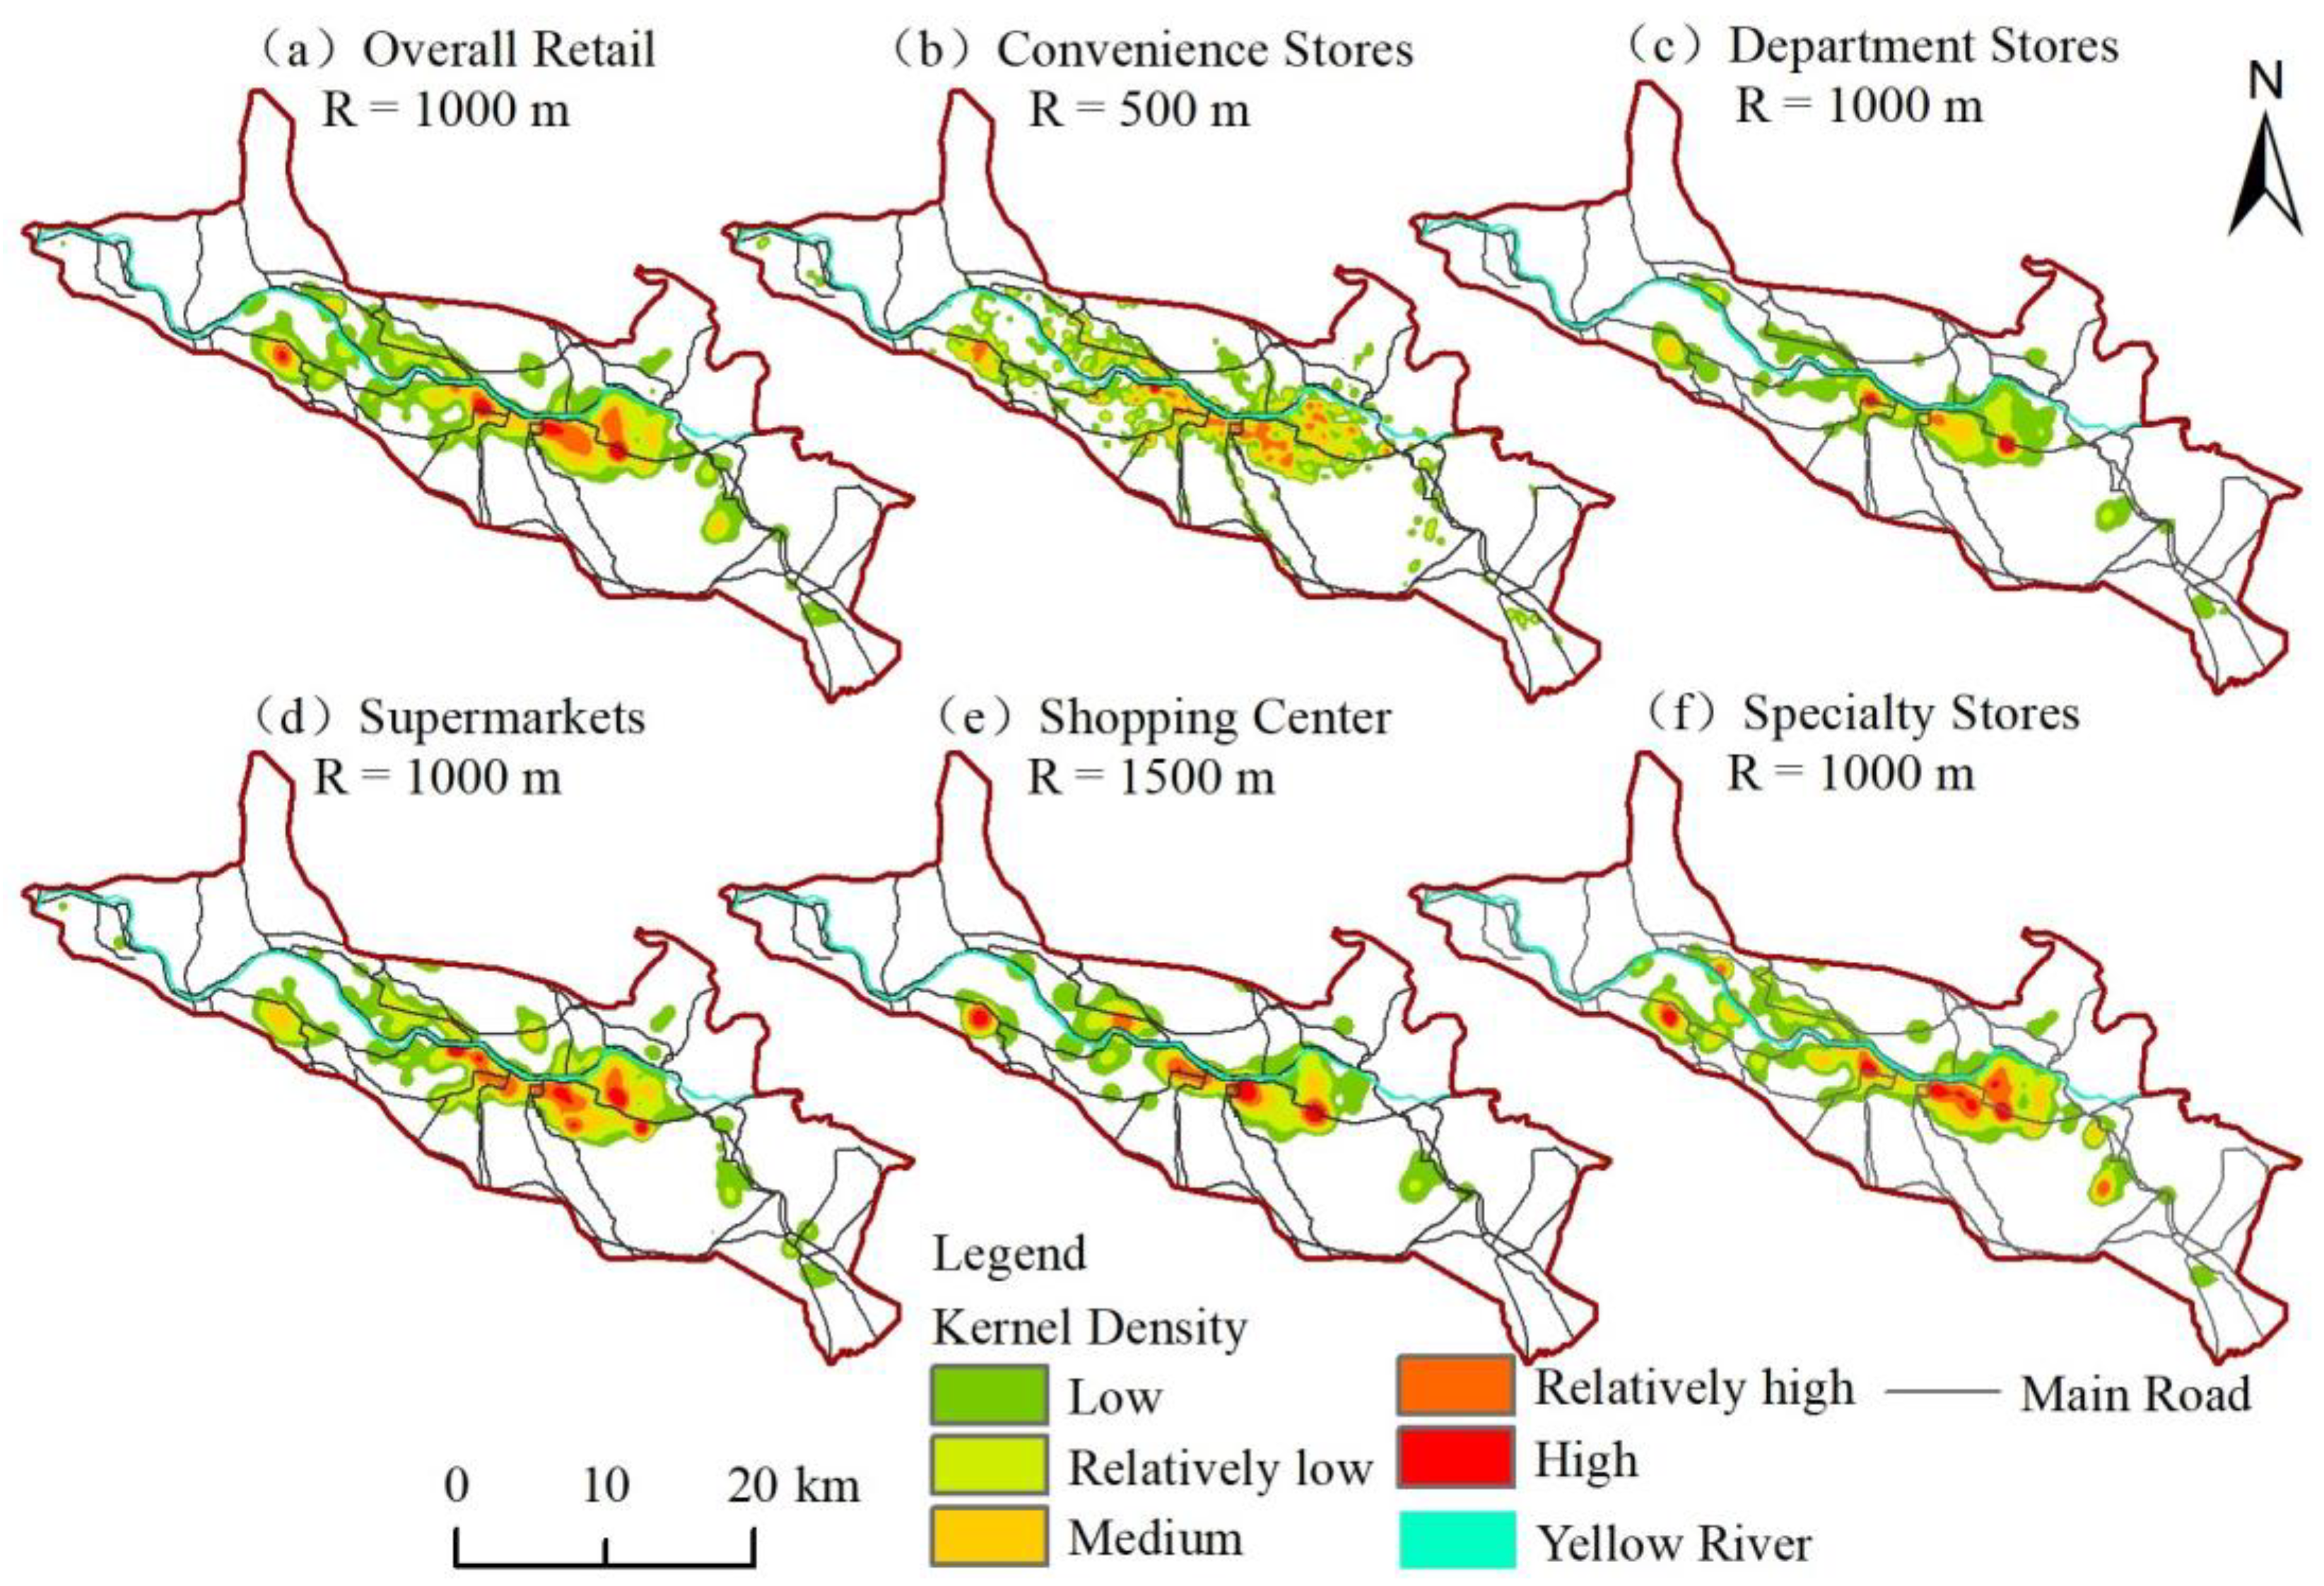
4.1.1. Spatial form Distribution Characteristics

The Nearest Neighbor Index (NNI) is often used to analyze the distribution patterns of spatial point elements. Using the GIS platform, spatial statistical tools were used to select the average nearest neighbor tool in the analysis model to analyze the retail POI in the central urban area of Lanzhou City. The NNI is 0.16 with a confidence level of over 99%. Therefore, the distribution of the retail industry in the central urban area of Lanzhou City demonstrates obvious spatial agglomeration characteristics. Kernel density estimation was employed to provide a more detailed analysis of the distribution of the retail industry. The bandwidth of the kernel density method is determined with reference to Silverman’s rule of thumb and the retail store service radius. The former helps to avoid the occurrence of ring-like patterns around sparse data points, while the latter represents one of the fundamental characteristics of the retail industry in China, as specified in the national standard for the retail industry (GB/T 18106-2021). The results were classified into five categories using the natural breaks (Jenks) method (Figure 2).
Overall, the retail industry service range covers the built-up area in the central urban area of Lanzhou City. The retail industry shows a clear, belt-like distribution along the Yellow River. The density of the retail industry decreases as one moves from the city center towards the outskirts. There are four notable agglomeration centers in the region: two agglomeration centers are located in Chengguan District, while Qilihe District and Xigu District have one each. Chengguan District is mainly concentrated in the eastern commercial district (which refers to the area in the city where commerce is more concentrated, and reference is made to the content of the Lanzhou City Commercial Network Plan), represented by Wangfujing Department Store, and the western commercial district centered around Zhangye Road Pedestrian Street. Qilihe District is primarily concentrated in the Xizhan commercial district, represented by Lanzhou Center. Xigu District is mainly concentrated near Jincheng Center Commercial Street.
Convenience stores are characterized by a more dispersed and evenly distributed pattern. They are primarily located in areas with high pedestrian traffic. Their distribution along the rail transit system is particularly noticeable, suggesting a focus on convenience for commuters. Department stores have a relatively smaller coverage area, and they exhibit significant agglomeration patterns in Lanzhou Center and the Wangfujing Department Store commercial districts. Supermarkets are concentrated in Qilihe District and Chengguan District, while other areas have lower densities of supermarkets. Shopping centers align with the major commercial districts of the central urban area, and they form agglomeration centers in the core commercial areas. Specialty stores are relatively evenly distributed, with two belt-like structures established within Chengguan District. These findings provide valuable insights into the spatial distribution and concentration of different types of retail establishments within Lanzhou City. Understanding these patterns can enable urban planners, businesses, and policymakers to make informed decisions regarding the development and improvement of the retail industry in the city.

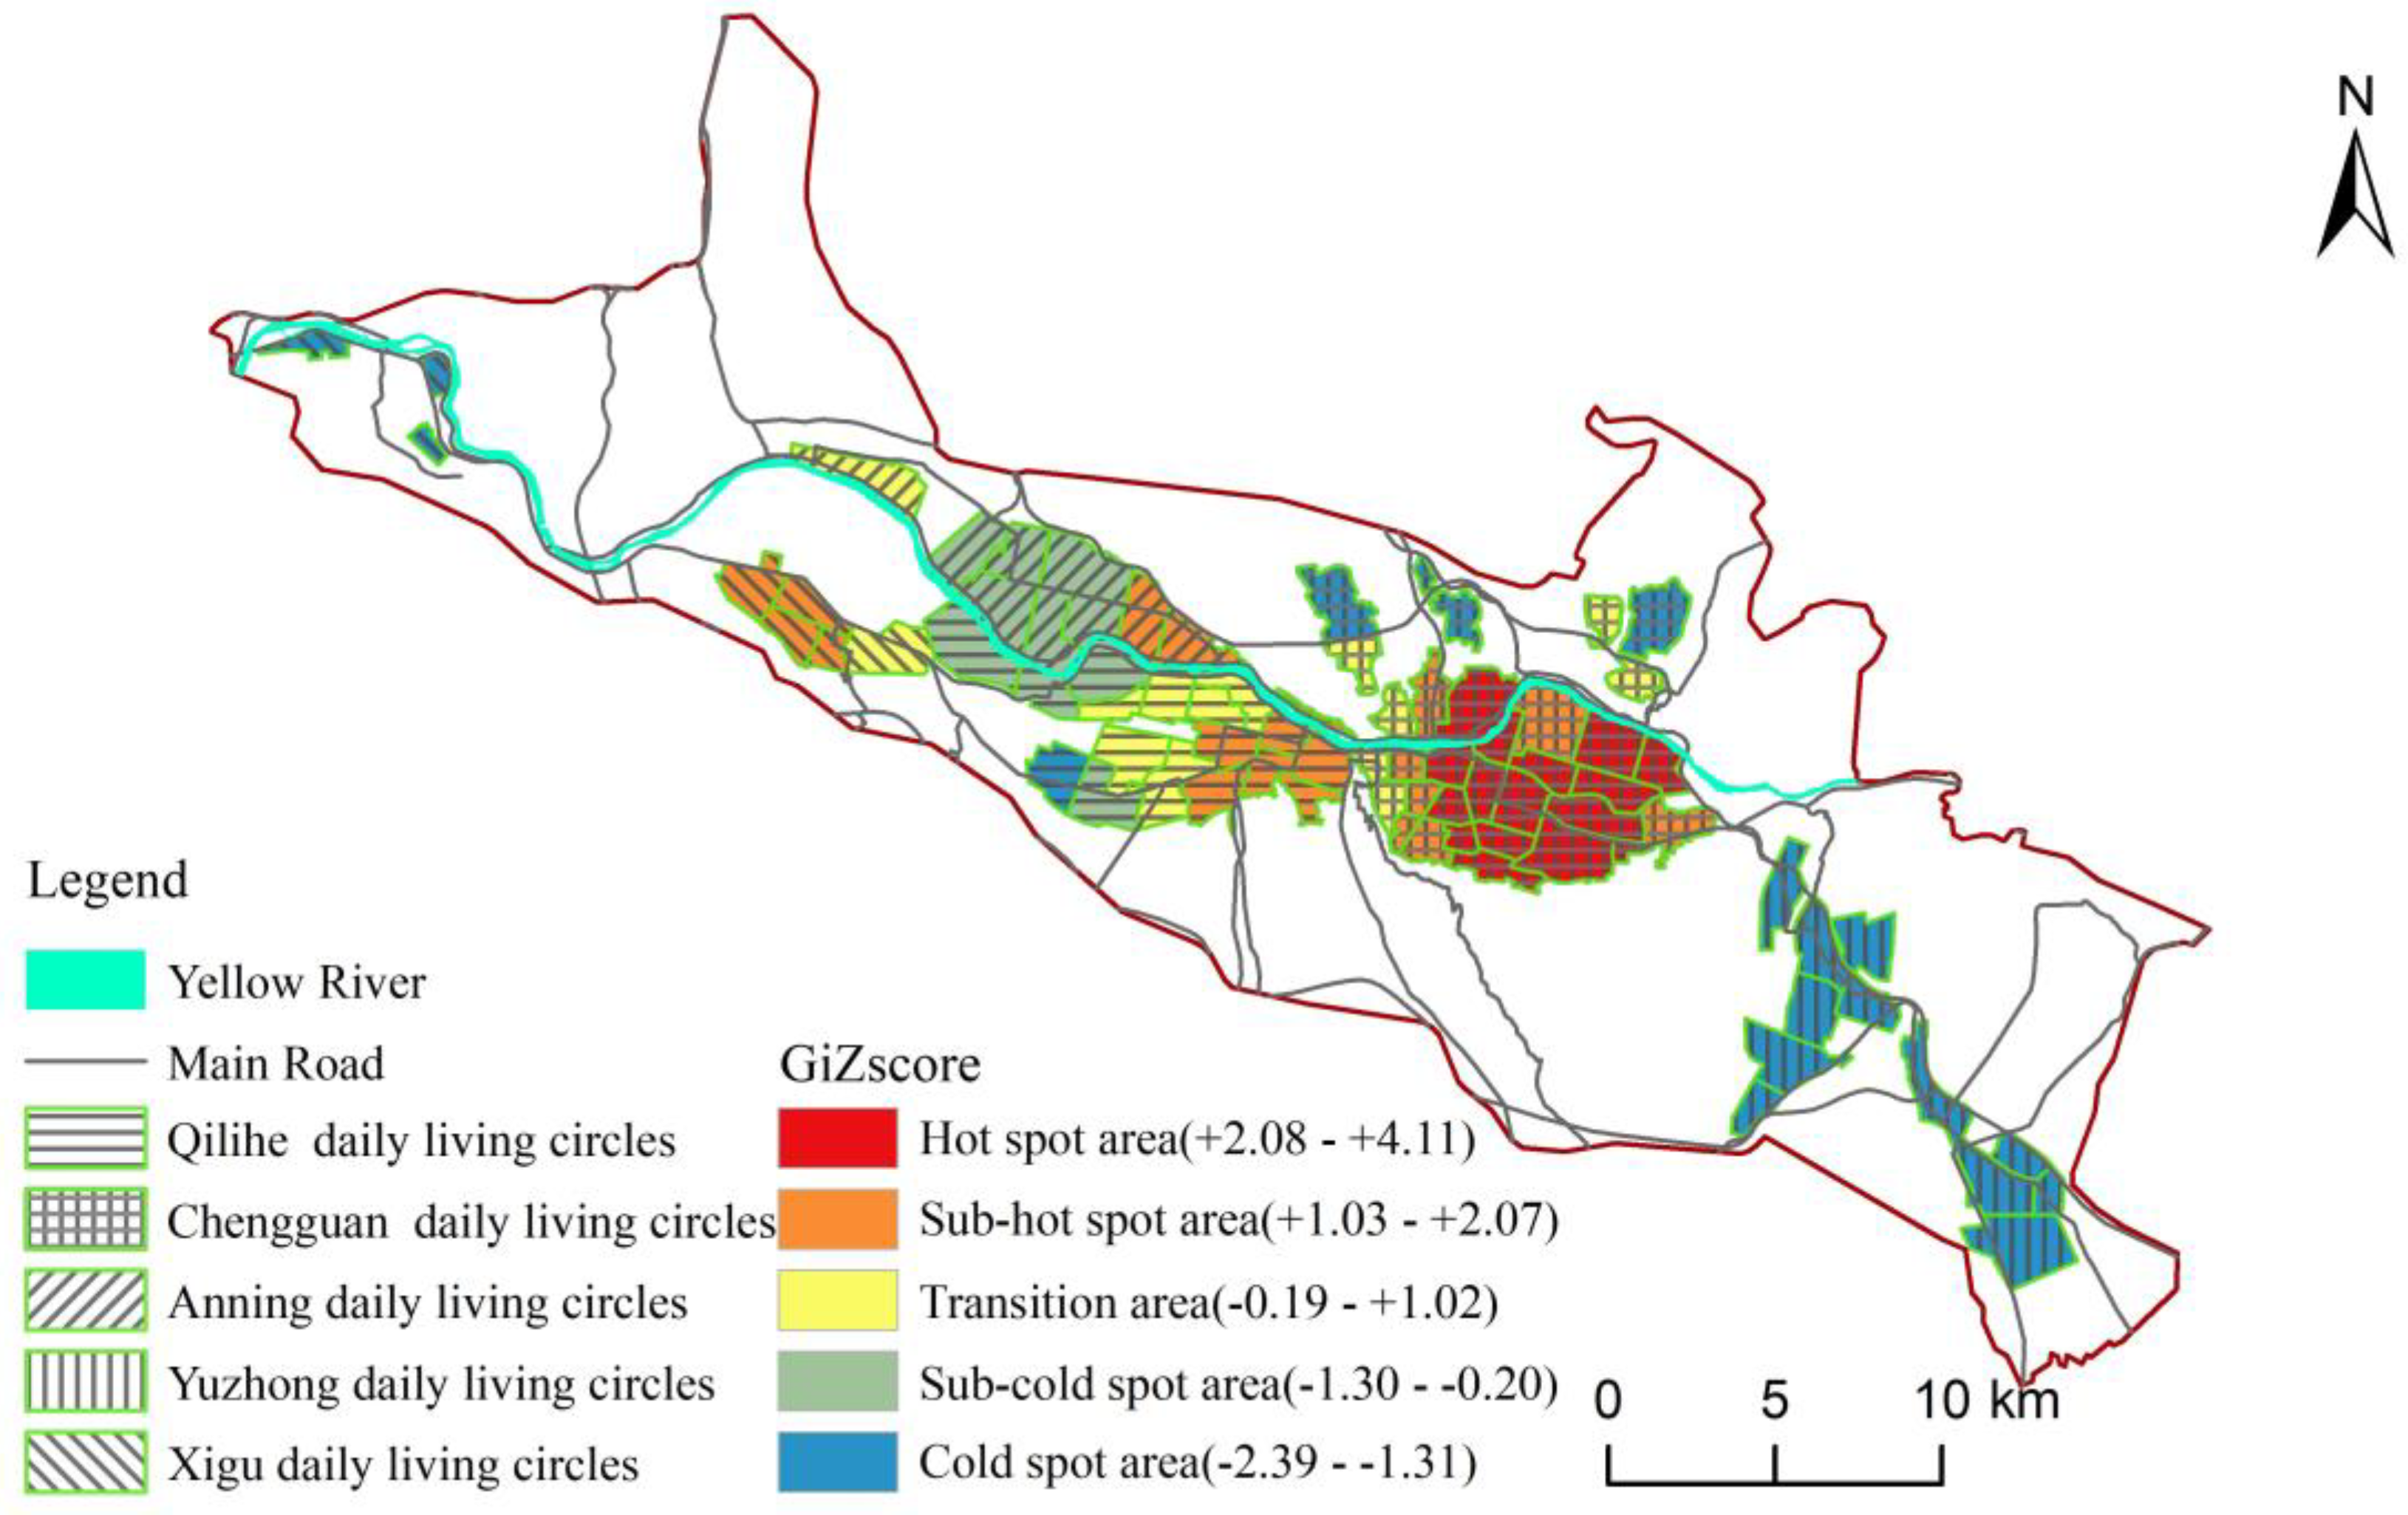
4.1.2. Agglomeration Distribution Characteristics at the Scale of the DLC

Further research was conducted to examine the agglomeration distribution characteristics of the retail industry at the scale of the DLC within the central urban area. Using GIS software, the tool “Generate Spatial Weights Matrix” was used to generate the spatial weights matrix. Based on the characteristics of the spatial relationship of DLCs, the “contigutiy edges corners” (the face elements of a node are neighboring elements) was chosen. Next, the Getis–Ord Gi* tool was applied to calculate the GIZscore. GIZscores were classified into five categories using the natural breaks technique (Figure 3). The results showed that there were 19 hotspots, 10 sub-hotspots, 20 sub-cold spots, and 16 cold spots. Overall, when examined at the scale of the DLC, only a small proportion of the retail industry demonstrated noticeable agglomeration patterns. The hotspots were primarily concentrated in Chengguan District, with a gradual decrease toward the west. Conversely, the cold spots were mainly observed in the outskirts and peripheral areas of the urban built-up area.
Based on the average scores of the agglomeration level of the retail industry at the scale of the DLCs, the ranking was as follows: Chengguan District > Qilihe District > Xigu District > Anning District > Yuzhong County. The retail industry in Chengguan District is mostly located within hotspots, suggesting a notable agglomeration pattern at the scale of the DLCs. The agglomeration level of the retail industry in Qilihe District gradually decreases from east to west, transitioning from hotspots to cold spots. Due to the dispersed nature of DLCs in Xigu District, some of them form independent clusters, resulting in a lower level of retail industry agglomeration. The retail industry in Anning District is relatively dispersed, with most establishments located in cold spot areas, which suggests a lower level of agglomeration at the scale of the DLC. The retail industry in Yuzhong County is predominantly located in cold spots, indicating the lowest level of agglomeration at the scale of the DLC.

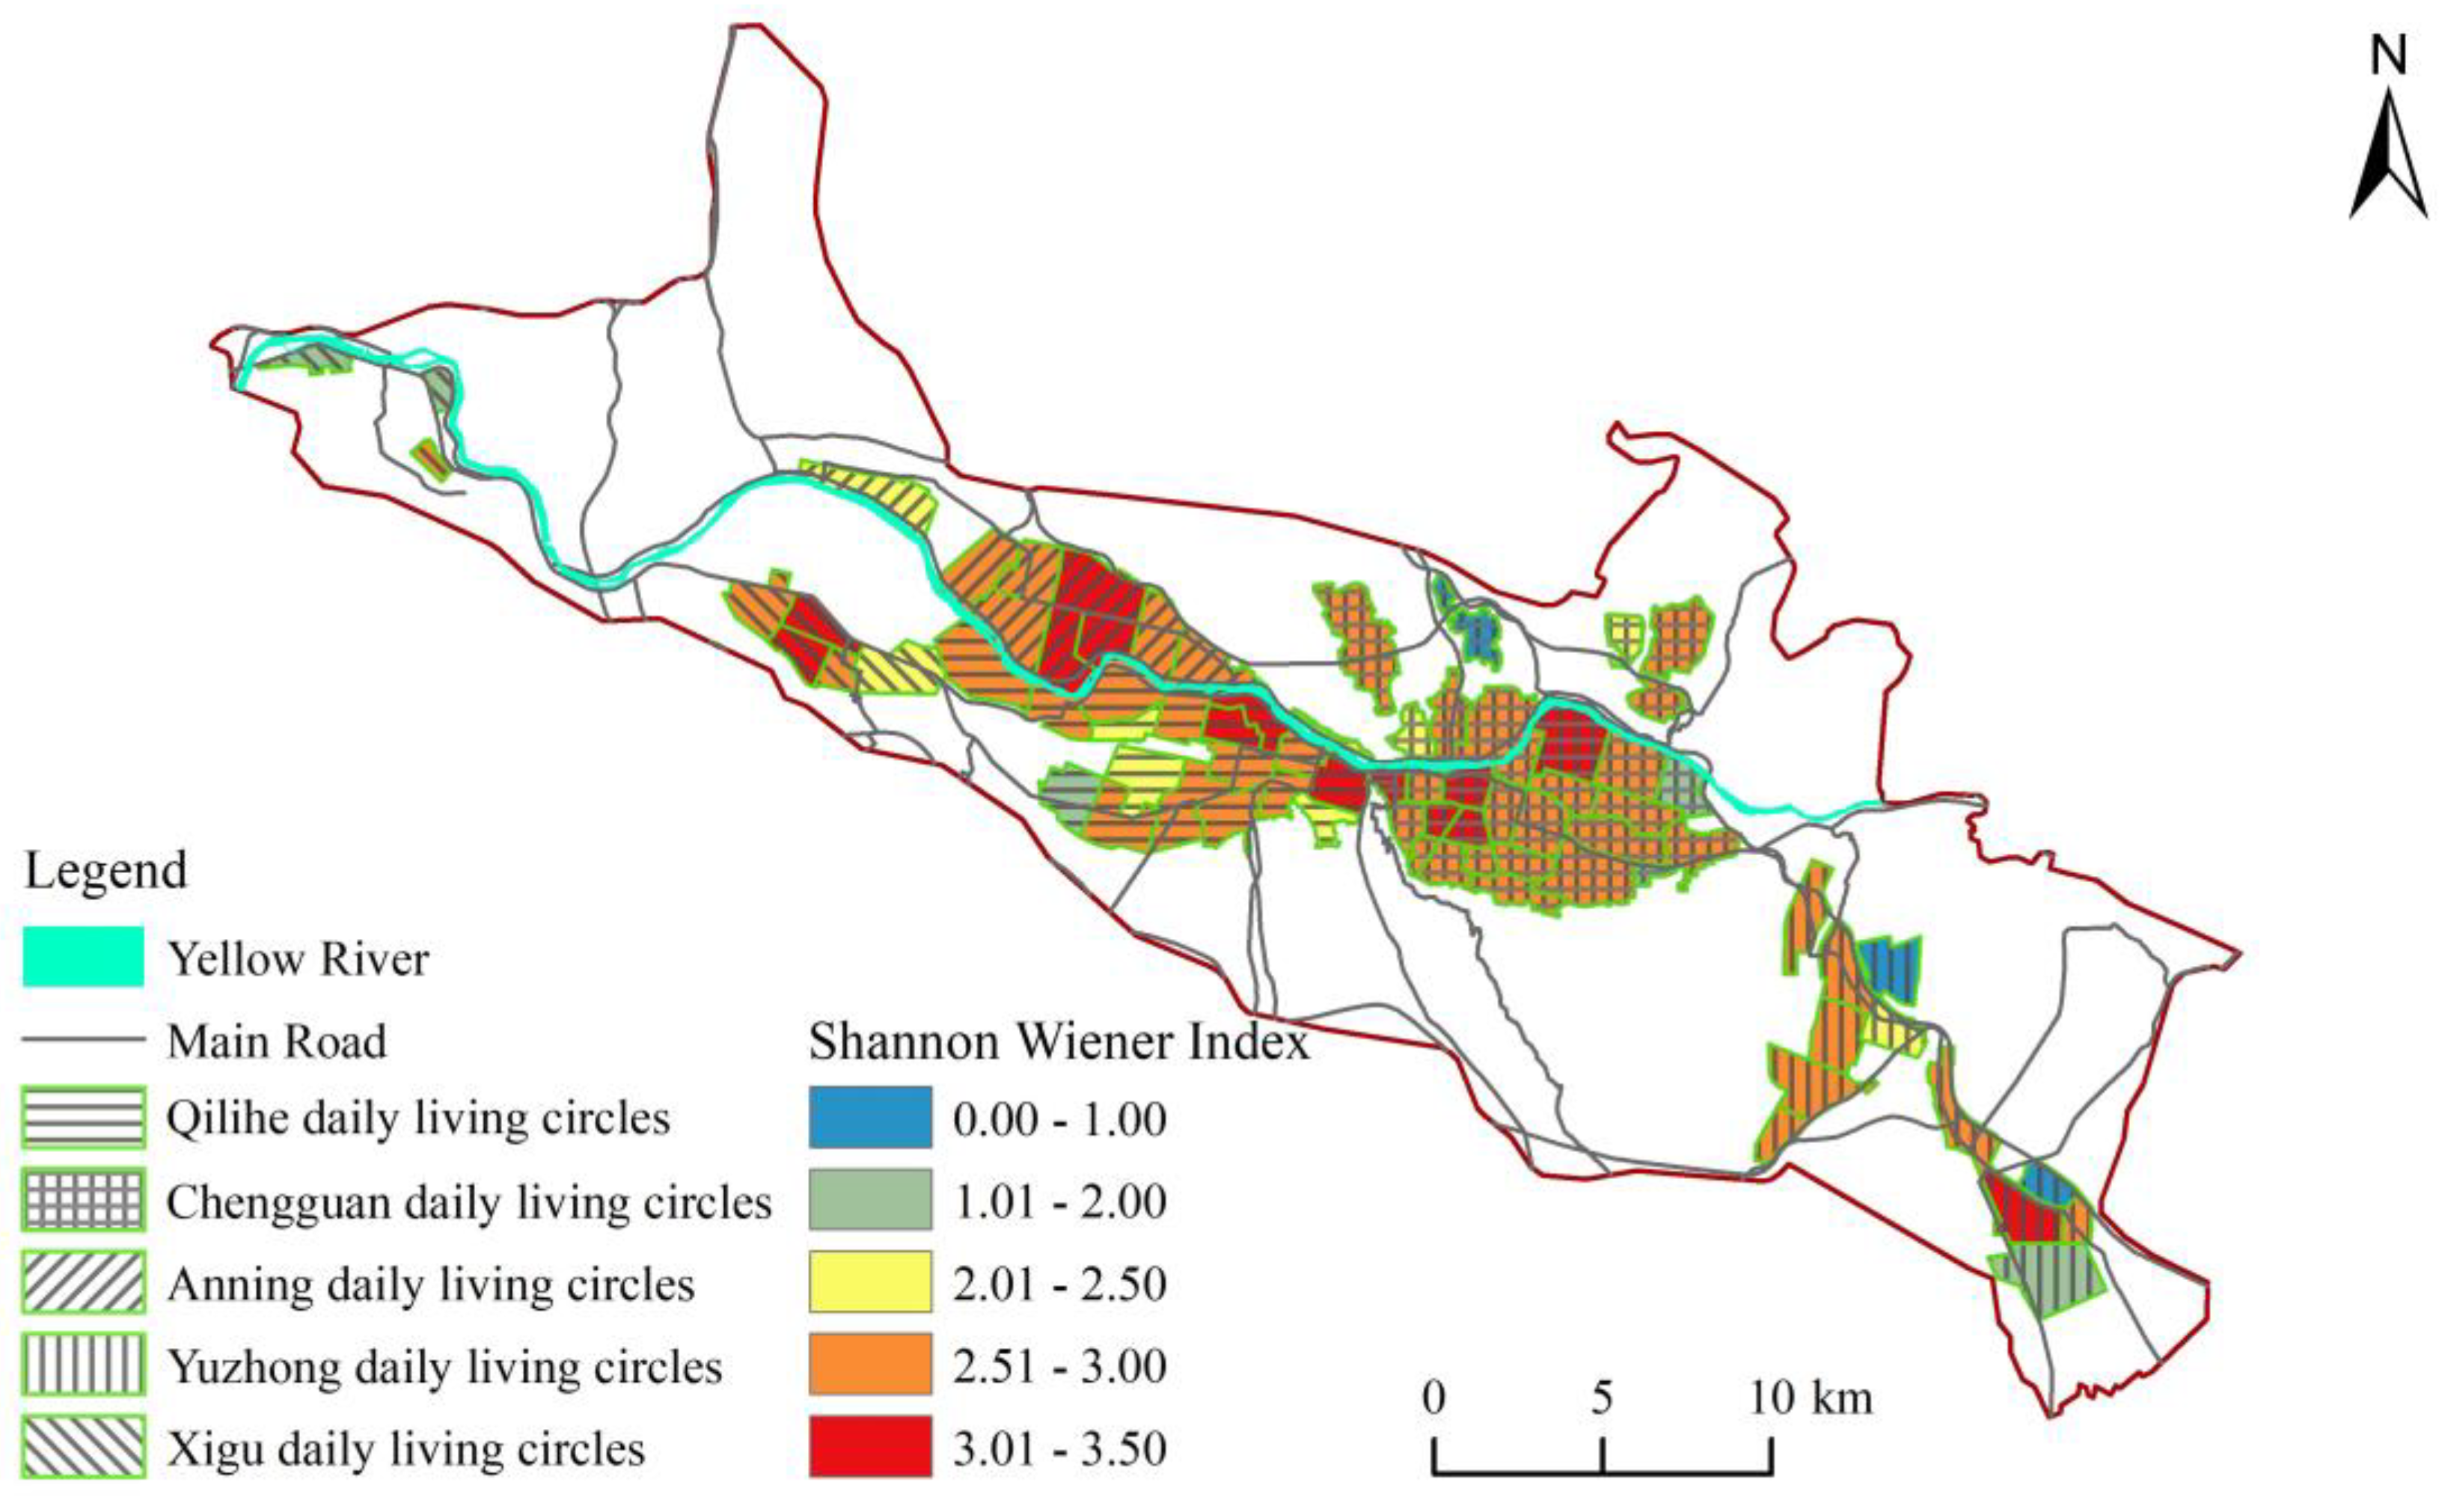
4.1.3. Diversity Distribution Characteristics at the Scale of the DLC

The retail industry POI data were classified and the Shannon–Weaver index was calculated based on the scale of the DLC, to analyze their diversity distribution characteristics (Figure 4). The overall diversity index of the retail industry within the central urban area was 2.63. A total of 70 DLCs had a diversity index exceeding 2.0, indicating that the majority of DLCs in the central urban area offer a wide range of retail formats, effectively catering to the needs of residents. There were 13 DLCs with a diversity index exceeding 3.0, accounting for 16.4% of the total DLCs analyzed, and these circles were predominantly situated in the core urban areas. Three DLCs had a diversity index of less than 1; these were primarily located on the outskirts of Yuzhong County and Chengguan District. These areas represent the interface between urban and rural regions, characterized by a limited number of retail stores and a lack of diversity in goods offered. From a spatial perspective, the diversity distribution of the retail industry at the scale of the DLC displays similar characteristics to the agglomeration distribution, with a noticeable decline from the core urban areas to the peripheral zones.

4.2. Analysis of Influencing Factors

4.2.1. Selection of Influencing Factors

Based on a comprehensive review of existing research findings [46,47,48,49] and considering the actual conditions and characteristics of the study area, we selected a set of influential indicators that are frequently used and are representative in four aspects, namely, market demand, economic level, convenience, and location. These indicators were used to construct an indicator system to analyze the influencing factors that affect the spatial distribution of the retail industry (Table 2).

4.2.2. Analysis of Influencing Factors

The quantified impact factor values in Table 2 were converted to type quantities and imported into the Geodetector. The analysis results using Geodetector are summarized in Table 3. In terms of the agglomeration distribution of the retail industry in the DLCs, each factor demonstrates a strong explanatory power, suggesting that market demand, economic level, convenience, and location all considerably influence the agglomeration patterns of the retail industry in the central urban area. In the case of the overall retail industry, factors such as land prices, housing prices, public transport coverage density, and road network density exhibit strong explanatory power for its distribution. This suggests that the distribution of the overall retail industry in the central urban area is primarily influenced by factors such as economic level and convenience. Population density also contributes to explaining the distribution of the retail industry, indicating the role market demand plays in shaping its spatial patterns. However, the explanatory power of agglomeration and centrality factors was relatively weak, suggesting that the influence of location on the distribution of the retail industry in the central urban area is relatively small.
Considering the various categories of the retail industry, department stores are primarily influenced by economic level, followed by market demand and convenience, with location having the least impact. Convenience stores are mainly influenced by convenience, followed by market demand and economic level, with location having the least impact. Supermarkets are primarily influenced by convenience, followed by economic level, with market demand and location having relatively less influence. Shopping centers are primarily influenced by convenience, followed by economic level and market demand, with location having the least impact. Specialty stores are primarily influenced by economic level, followed by convenience, with market demand and location having relatively less influence.
Considering the various influencing factors, market demand exerts a greater influence on the distribution of convenience stores and supermarkets, followed by specialty stores, while it has a relatively smaller impact on the distribution of department stores and shopping centers. Economic level has a greater impact on the distribution of specialty stores, followed by supermarkets and convenience stores, and has a relatively smaller impact on the distribution of department stores and shopping centers. Convenience has a greater impact on the distribution of convenience stores, followed by supermarkets and specialty stores, and has a relatively smaller impact on the distribution of shopping centers and department stores. Location factors play some role in the distribution of supermarkets, convenience stores, and specialty stores, although the influence is not very strong. However, location factors have minimal impact on the distribution of department stores and shopping centers.

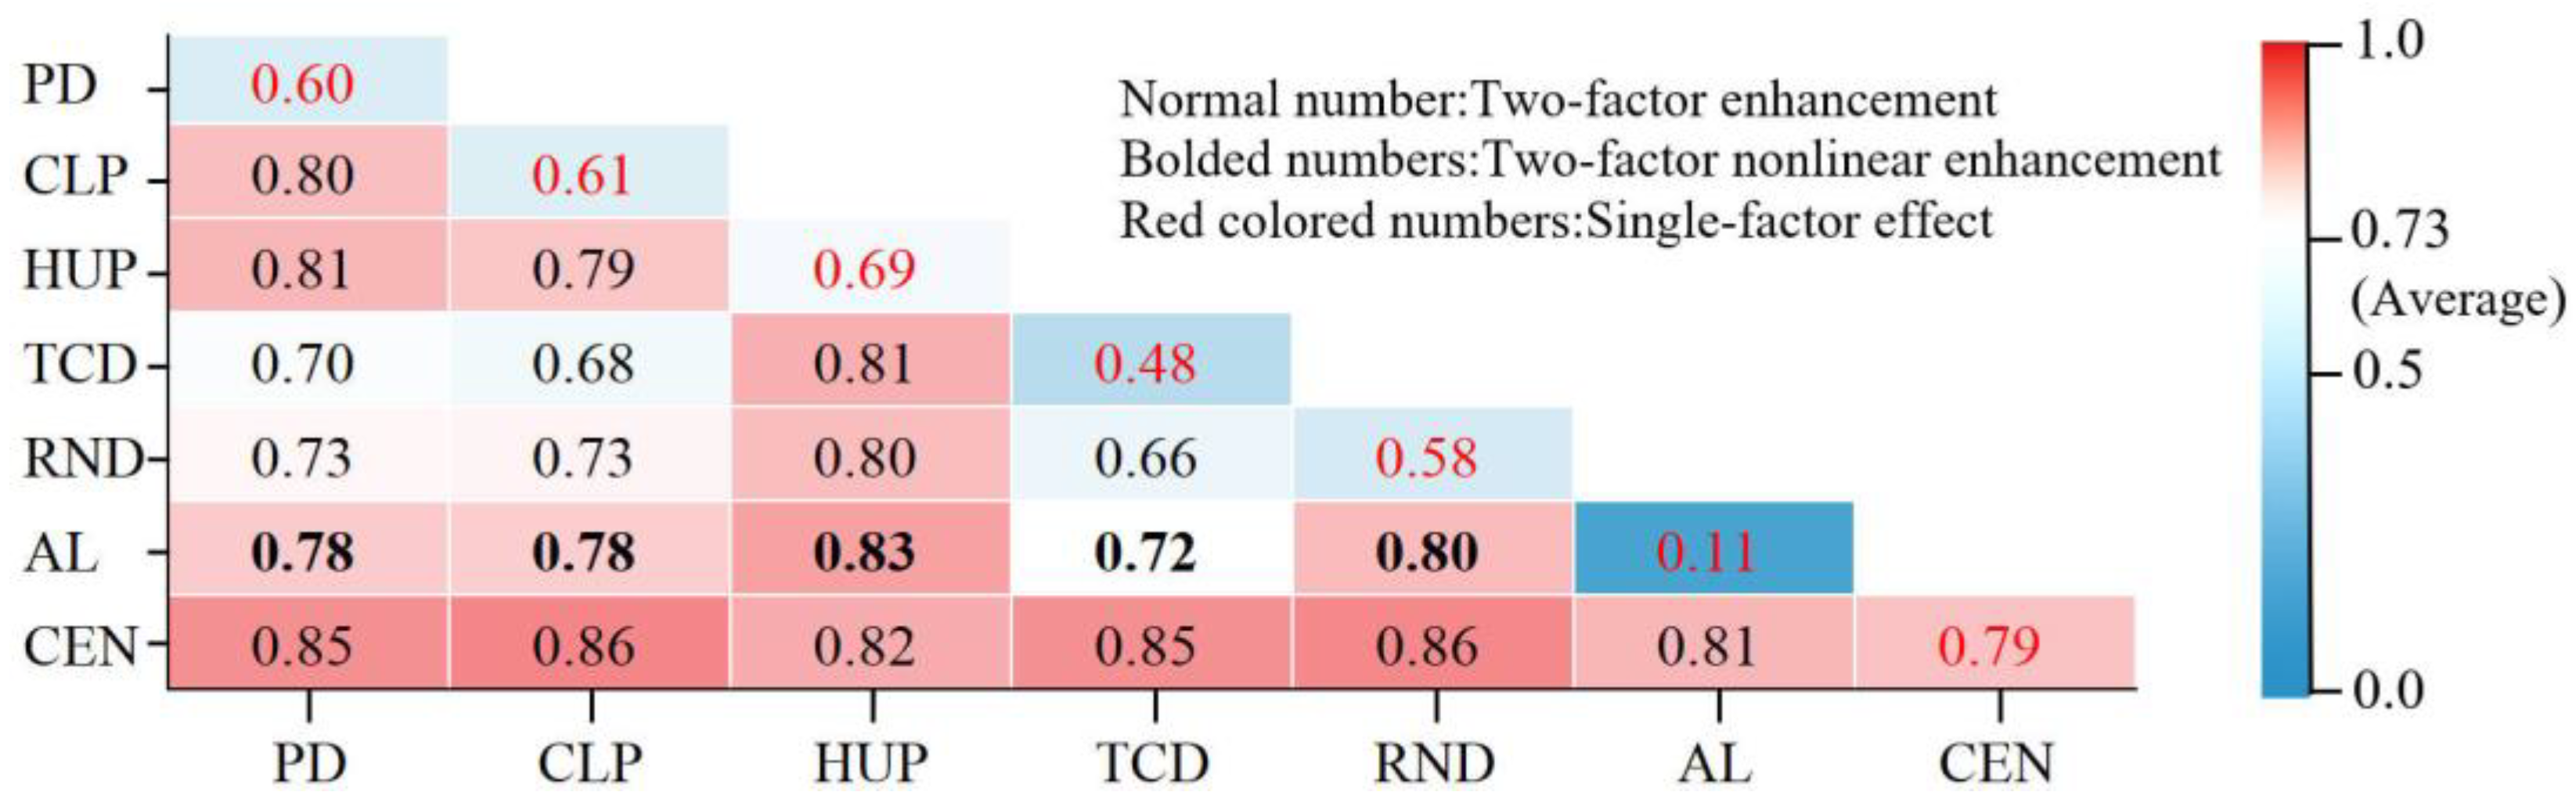
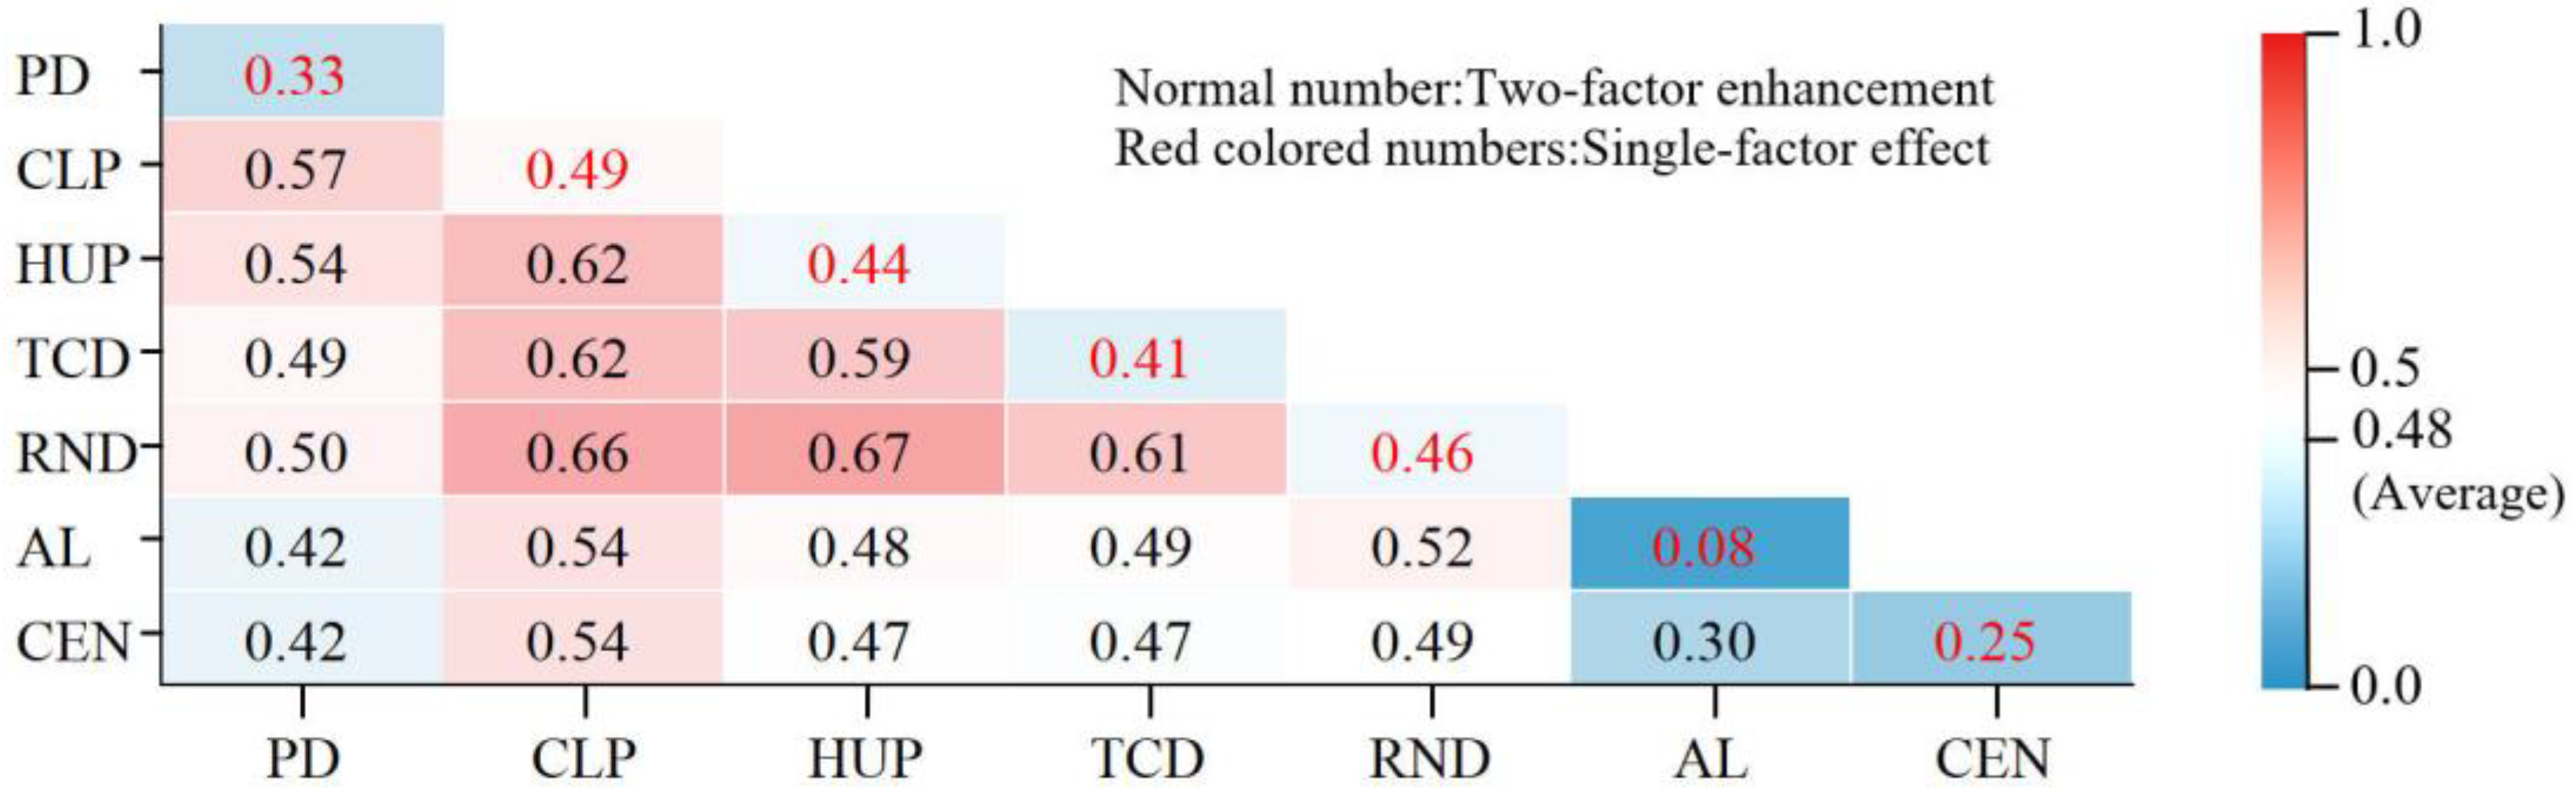
4.2.3. Analysis of Interacting Effects

Regarding the agglomeration distribution of the retail industry within DLCs, the combined effects resulting from the interaction of dual factors are generally stronger compared with the impacts of single factors (Figure 5). The enhancement effects can be categorized into two types: dual-factor enhancement and dual-factor non-linear enhancement. The influence of the agglomeration factor on the agglomeration distribution of the retail industry is weak when considered independently. However, when it interacts with other factors, it exhibits a stronger impact. The interaction effect between centrality and other factors was the most significant, resulting in the strongest combined effect and exerting the greatest overall impact on the agglomeration distribution of the retail industry.
In terms of the overall distribution of the retail industry, the interaction of dual factors has led to enhanced combined effects, which are generally stronger than the impacts of single factors (Figure 6). The influence of the agglomeration factor on the overall distribution of the retail industry is weak when considered independently. However, when it interacts with other relevant factors, its combined impact is strengthened. Considerable interaction effects exist among some factors, namely, land prices, house prices, public transportation coverage density, and road network density; these factors represent economic level and convenience. Together, these interactions contribute to a strong combined effect and result in a greater overall impact on the distribution of the retail industry.

4.3. Discussions

The study combines the spatial layout of the retail industry with geospatial big data, which more accurately portrays the layout of the retail industry in the city and the factors affecting the layout, in addition to using the DLC as the basic unit, which can more accurately reflect the differences in the access to retail industry by residents in the region. The spatial distribution of the retail industry in Lanzhou City is uneven, with significant agglomeration centers. However, with economic and social development, the city is increasingly pursuing coordinated development. The negative impact of this agglomeration on other regions needs extra attention in the process of urban development. Areas of high retail concentration tend to be the most economically prosperous areas of cities, and there is a marked difference in the distribution of retail in city centers and on the periphery of cities. Optimizing the rational allocation of retail resources within urban spaces has strong implications for the achievement of social justice. Of course, since the acquired geospatial big data are mostly cross-sectional data, only a static spatial analysis has been conducted in the research process. The spatial evolution of the retail industry can be fully explored when enough years of data are collected in the future.
Nonetheless, the study is still highly instructive for further improving the function and structure of the living area and narrowing the differences in the distribution of the number of retail businesses within the city. Inadequate construction of retail outlets occurs in living areas at the junction of urban and suburban areas. There is a gap between the number and variety of retail outlets in suburban areas compared to urban centers. The change of this difference can be considered firstly to improve the density of the road network. Secondly, for areas with less retail distribution, it is appropriate to establish commercial complexes of an appropriate size to drive the development of the local retail industry in the form of a business circle. Then, by adjusting the commercial land price to provide some subsidies to the areas with insufficient retail development, it is possible to adjust the shape of urban retail layout. For regions where the retail industry is more mature, attention should be paid to improving the consumption experience of residents in the retail industry, focusing on avoiding homogeneous competition in the same kind of retail industry, and appropriately spreading the agglomeration centers outward to form multi-level retail centers.

5. Conclusions

In the central urban area of Lanzhou, the retail industry exhibits a belt distribution pattern along the Yellow River. The density of distribution gradually decreases from the city center toward the outskirts, forming four prominent agglomeration centers; two are located in Chengguan District, while there is one each in Qilihe District and Xigu District. Among these agglomeration centers, convenience stores are characterized by a more dispersed and evenly distributed pattern, whereas department stores exhibit a relatively smaller coverage area. Supermarkets are mainly concentrated in Qilihe District and Chengguan District, while shopping centers form agglomeration centers in commercial core areas. Specialty stores, on the other hand, exhibit a relatively even distribution throughout the region.
Overall, within the central urban area of Lanzhou, the spatial distribution of the retail industry at the scale of the DLC shows that only a small proportion of the industry demonstrates noticeable clustering effects. Hotspots are concentrated in Chengguan District and gradually decrease toward the west, while cold spots are mainly located on the periphery of the urban built-up area. When considering the level of retail industry agglomeration, the order is Chengguan District > Qilihe District > Xigu District > Anning District > Yuzhong County. The retail formats within the central urban area offer a wide range of options, ensuring a diverse and comprehensive selection that effectively caters to the daily needs of residents. In terms of spatial patterns, the retail industry at the scale of the DLC demonstrates similar characteristics in terms of diversity and agglomeration distribution. It exhibits a decreasing trend from the urban core toward the peripheral areas.
The agglomeration distribution pattern of the retail industry in the central urban area of Lanzhou is significantly influenced by market demand, economic level, convenience, and location. These factors play a crucial role in shaping the spatial arrangement of retail establishments in this region. The spatial distribution of the retail industry in the central urban area is primarily influenced by economic factors and convenience, while market demand plays a major role and location has a relatively minimal impact. However, the impacts of these factors vary among different categories of retail, including convenience stores, department stores, supermarkets, shopping centers, and specialty stores.
Regarding the agglomeration distribution of the retail industry within the DLCs of Lanzhou’s central urban area, as well as the overall distribution of the retail industry, the combined effects are strengthened through the interaction of dual factors, which generally exhibit a stronger influence compared with individual factors alone. The agglomeration factor in particular exhibits notable enhancement, as its individual impact was initially modest but was considerably strengthened through interaction with other factors. The interaction between different factors gives rise to diverse combined effects, resulting in differences in their overall impact.

Author Contributions

Chenyu Lu and Changbin Yu designed the study and wrote the paper. Yu Xin analyzed the data. Wendi Zhang contributed to data collection and processing. All authors have read and agreed to the published version of the manuscript.

Funding

This study was funded by the National Natural Science Foundation of China (grant Nos. 42061054 and 41561110) and by the Science and Technology Program of Gansu Province (grant Nos. 21JR1RA234 and 20CX4ZA039).

Data Availability Statement

The data used to support the findings of this study are available from the corresponding author upon request.

Acknowledgments

We thank the anonymous reviewers and all of the editors that participated in the revision process.

Conflicts of Interest

The authors declare no conflict of interest.

References

  1. Orit, R.M. Retail fragmentation vs. urban livability: Applying ecological methods in urban geography research. Appl. Geogr. 2012, 35, 292–299. [Google Scholar]
  2. Rao, F.J.; Summers, R.J. Planning for retail resilience: Comparing Edmonton and Portland. Cities 2016, 58, 97–106. [Google Scholar] [CrossRef]
  3. Yao, F.; Mao, J.Y.; Liu, Q.H.; Huang, J. Exploratory space data analysis of spatial patterns of large-scale retail commercial facilities: The case of Gulou District, Nanjing, China. Front. Archit. Res. 2021, 10, 17–32. [Google Scholar]
  4. Tammiksaar, E.; Jauhiainen, J.S.; Pae, T.; Ahas, R. Edgar Kant, Estonian geography and the reception of Walter Christaller’s central place theory, 1933–1960. J. Hist. Geogr. 2018, 60, 77–88. [Google Scholar] [CrossRef]
  5. Guan, C.M. New Progress Abroad in the Research on Commercial Location. J. Beijing Technol. Bus. Univ. 2006, 6, 5–9. (In Chinese) [Google Scholar]
  6. Feng, J. Review on urban internal spatial structure in the western literature and it is enlightenment. City Plan. Rev. 2005, 8, 41–50. (In Chinese) [Google Scholar]
  7. Zhou, X.X.; Ding, Y.; Wu, C.B.; Huang, J.; Hu, C. Measuring the Spatial Allocation Rationality of Service Facilities of Residential Areas Based on Internet Map and Location-Based Service Data. Sustainability 2019, 11, 1337. [Google Scholar] [CrossRef]
  8. Jochen, M.; Ladeia, J.C.; Torrens, J.C.L.; Jain, M.; Macrorie, R.M.; Smith, S.R. Rethinking the governance of urban infrastructural transformations: A synthesis of emerging approaches. Curr. Opin. Environ. Sustain. 2022, 55, 101157. [Google Scholar]
  9. Wu, M.B.; Pei, T.; Wang, W.L.; Guo, S.; Song, C.; Chen, J.; Zhou, C. Roles of locational factors in the rise and fall of restaurants: A case study of Beijing with POI data. Cities 2021, 113, 103185. [Google Scholar] [CrossRef]
  10. Lin, G.; Chen, X.X.; Liang, Y.T. The location of retail stores and street centrality in Guangzhou, China. Appl. Geogr. 2018, 100, 12–20. [Google Scholar] [CrossRef]
  11. Christaller, W. Central Places in Southern Germany; Prentice Hall: Englewood Cliffs, NJ, USA, 1966. [Google Scholar]
  12. Losch, A. The Economics of Location; Stopler, W.P., Translator; Yale University Press: New Haven, CT, USA, 1954; pp. 1–52. [Google Scholar]
  13. Matthias, D.B.; Dirk, V.P.; Nico, V.W. An extended Huff-model for robustly benchmarking and predicting retail network performance. Appl. Geogr. 2014, 46, 80–89. [Google Scholar]
  14. Michael, E.P. National Competitiveness; CITIC Press Group: Beijing, China, 2009; ISBN 978-750-861-599-8. [Google Scholar]
  15. Yrjänä, L.; Rashidfarokhi, A.V. Looking at retail planning policy through a sustainability lens: Evidence from policy discourse in Finland. Land Use Policy 2018, 79, 190–198. [Google Scholar] [CrossRef]
  16. Mai, E.S.; Seth, K. How retailer ownership of vs. collaboration with sharing economy apps affects anticipated service quality and value co-creation. J. Bus. Res. 2022, 140, 684–692. [Google Scholar] [CrossRef]
  17. Goldman, A. The transfer of retail formats into developing economies: The example of China. J. Retail. 2001, 77, 221–242. [Google Scholar] [CrossRef]
  18. Jin, B.E.; Shin, D.C. Changing the game to compete: Innovations in the fashion retail industry from the disruptive business model. Bus. Horiz. 2020, 63, 301–311. [Google Scholar] [CrossRef]
  19. Florian, B.; Kai, H. The impact of daily weather on retail sales: An empirical study in brick-and-mortar stores. J. Retail. Consum. Serv. 2021, 52, 101921. [Google Scholar]
  20. Tomáš, F.; Ondřej, S. Location effects: Geo-spatial and socio-demographic determinants of sales dynamics in brick-and-mortar retail stores. J. Retail. Consum. Serv. 2022, 66, 102902. [Google Scholar]
  21. Xiao, X.; Li, J.Z.; Wang, Y.X. Uncovering spatiotemporal pattern and geographical equity of pharmacies in Chinese cities from 2008 to 2018. Health Policy Technol. 2022, 11, 100691. [Google Scholar] [CrossRef]
  22. Duccio, P.; Vassilis, Z.; Michael, B. Quantifying Retail Agglomeration using Diverse Spatial Data. Sci. Rep. 2017, 7, 5451. [Google Scholar]
  23. Bao, G.M.; Ye, Y.B. Construction of a comprehensive model for the evolution of retail formats. Financ. Trade Econ. 2006, 4, 48–51, 94. (In Chinese) [Google Scholar]
  24. Zhou, L.; An, Y. Research on location selection of super mall based on GIS Technology and Huff Model. In Proceedings of the International Conference on Economic Management and Green Development (ICEMGD 2018), Beijing, China, 29 July 2018; Atlantis Press: Paris, France, 2018. [Google Scholar]
  25. Li, J.M.; Zhang, W.Z.; Li, Y.; Yang, X.; Yu, J. The characteristics of industrial agglomeration based on micro-geographic data. Geogr. Res. 2016, 35, 95–107. (In Chinese) [Google Scholar]
  26. Borowska-Stefańska, M.; Kurzyk, M.K.; Rochmińska, A.; Wiśniewski, S. How transport shapes the landscape of large-format food retail trade? Retail geography in Poland—An interactive measure. Appl. Geogr. 2022, 149, 102818. [Google Scholar] [CrossRef]
  27. Liang, J.; Yan, F.; Yang, Y. Is digital technology promoting the development of high-quality retail? Empirical test based on panel threshold model. Econ. Manag. 2022, 36, 15–24. (In Chinese) [Google Scholar]
  28. Lyu, J.; Krasonikolakis, I.; Chen, C.H. Unlocking the shopping myth: Can smartphone dependency relieve shopping anxiety? —A mixed-methods approach in UK Omnichannel retail. Inf. Manag. 2023, 60, 103818. [Google Scholar]
  29. Lutfi, A.; Alrawad, M.; Alsyouf, A.; Almaiah, M.A.; Al-Khasawneh, A.; Al-Khasawneh, A.L.; Alshira’h, A.F.; Alshirah, M.H.; Saad, M.; Ibrahim, N. Drivers and impact of big data analytic adoption in the retail industry: A quantitative investigation applying structural equation modeling. J. Retail. Consum. Serv. 2023, 70, 103129. [Google Scholar] [CrossRef]
  30. José, C.P.; Javier, G. Consumption and symbolic capital in the metropolitan space: Integrating ‘old’ retail data sources with social big data. Cities 2020, 106, 102859. [Google Scholar]
  31. Carpio-Pinedo, J.; Romanillos, G.; Aparicio, D.; Martín-Caro, M.S.H.; García-Palomares, J.C.; Gutiérrez, J. Towards a new urban geography of expenditure: Using bank card transactions data to analyze multi-sector spatiotemporal distributions. Cities 2022, 131, 103894. [Google Scholar] [CrossRef]
  32. Chen, W.S.; Liu, L.; Liang, Y.T. Retail center recognition and spatial aggregating feature analysis of retail formats in Guangzhou based on POI data. Geogr. Res. 2016, 35, 703–716. (In Chinese) [Google Scholar]
  33. Lee, K.O.; Cheng, S.F. Neighborhood retail amenities and taxi trip behavior: A natural experiment in Singapore. Habitat Int. 2023, 131, 102714. [Google Scholar] [CrossRef]
  34. Rice, M.; Sorenson, M.; Aversa, O. The geography of lifestyle center growth: The emergence of a retail cluster format in the United States. J. Retail. Consum. Serv. 2022, 65, 102835. [Google Scholar] [CrossRef]
  35. Ailing, C.; Wang, J.; Li, J.X.; Du, Y. Spatial characteristics of retail stores in multiple-size of cities in the central region of China. Acta Sci. Nat. Univ. Pekin. 2018, 54, 1114–1122. (In Chinese) [Google Scholar]
  36. Zeng, J.; Yue, Y.; Gao, Q.L.; Gu, Y.; Ma, C. Identifying localized amenities for gentrification using a machine learning-based framework. Appl. Geogr. 2022, 145, 102748. [Google Scholar] [CrossRef]
  37. Wang, X.; Bai, Y.P.; Wang, F.; Ma, W. Spatial distribution of retailing and the influence factors in Xi’an city based on the street scale. J. Arid Land Resour. Environ. 2019, 33, 89–95. (In Chinese) [Google Scholar]
  38. Chung, H.; Ahn, D.Y.; Ahn, S. Spillover effects of a mega shopping complex on pre-existing, small retail shops over space, over time and across retail types. J. Retail. Consum. Serv. 2022, 65, 102518. [Google Scholar] [CrossRef]
  39. Chen, H.X.; Yang, D.G.; Li, J.Y.; Wu, R.W.; Huo, J.W. Distribution characteristics and influencing factors of commercial center and hotspots based on big data: A case of the main urban area of Urumqi City. Prog. Geogr. 2020, 39, 738–750. (In Chinese) [Google Scholar] [CrossRef]
  40. Yu, W.H.; Ai, T.H. The Visualization and Analysis of POI Features under Network Space Supported by Kernel Density Estimation. Acta Geod. Cartogr. Sin. 2015, 44, 82–90. (In Chinese) [Google Scholar]
  41. Zhao, F.X.; Zhang, R.; Xu, M.; Zheng, Y. Effects of biodiversity, dominant species and soil factors on community productivity in Lishan Mountain meadow, Shanxi province. J. Nat. Resour. 2019, 34, 2415–2426. (In Chinese) [Google Scholar]
  42. Lu, C.; Lan, X.T.; Shun, W. A Study on the Relationship between Natural Factors and Population Distribution in Beijing Using Geographical Detector. J. Nat. Resour. 2017, 32, 1385–1397. (In Chinese) [Google Scholar]
  43. Li, T. An analysis of spatial differentiation of tourism development level in border cities of Yunnan Province and influencing factors based on Geo-detector. World Reg. Stud. 2022, 31, 624–636. (In Chinese) [Google Scholar]
  44. Wang, J.F.; Xu, C.D. Geodetector: Principle and prospective. Acta Geogr. Sin. 2017, 72, 116–134. (In Chinese) [Google Scholar]
  45. Wang, N.; Wu, J.S.; Peng, Z.F. Spatial Pattern and Influencing Factors of Retailing in Shenzhen. Econ. Geogr. 2021, 41, 125–134. (In Chinese) [Google Scholar]
  46. Gao, Y.H.; Yang, Q.Q.; Liang, L.; Zhao, Y.H. Spatial Pattern and Influencing Factors of Retailing Industries in Xi’an Based on POI Data. Sci. Geogr. Sin. 2020, 40, 710–719. (In Chinese) [Google Scholar]
  47. Vyt, D.; Jara, M.; Mevel, O.; Morvan, T.; Morvan, N. The impact of convenience in a click and collect retail setting: A consumer-based approach. Int. J. Prod. Econ. 2022, 248, 108491. [Google Scholar] [CrossRef]
  48. Wang, H.; Wang, F.; Guo, M.Y. Spatiotemporal characteristics and determinants of residents’ shopping travel behaviors in China: Based on Chinese time use survey. Geogr. Res. 2022, 41, 2712–2725. (In Chinese) [Google Scholar]
  49. Guy, C.; Bennison, D.; Clarke, R. Scale economies and superstore retailing: New evidence from the UK. J. Retail. Consum. Serv. 2005, 12, 73–81. [Google Scholar] [CrossRef]
Figure 1. The boundary of the study area and the spatial location of the retail industry.
Ijgi 12 00344 g001
Figure 2. Density distribution of the retail industry.
Ijgi 12 00344 g002
Figure 3. The distribution of hotspots and cold spots in the retail industry, based on DLC.
Ijgi 12 00344 g003
Figure 4. Distribution of the diversity index in the retail industry at the scale of the DLC.
Ijgi 12 00344 g004
Figure 5. Results of dual-factor interaction analysis on the agglomeration distribution of the retail industry.
Ijgi 12 00344 g005
Figure 6. Results of dual-factor interaction analysis of the overall distribution of the retail industry.
Ijgi 12 00344 g006
Table 1. Retail industry POI classification and quantities.
CategoryContentQuantity
Department storesClothing, footwear, hats, leather goods, personal care products, cosmetics, and related shopping establishments3870
Convenience storesConvenience shops, corner stores3759
SupermarketsGrocery stores, general markets3213
Shopping centers Malls, specialty commercial streets171
Specialty stores Flower, bird, fish, and insect markets; home appliance and electronics stores; home furnishing and building materials markets; motorcycle sales; car sales; special trade places; sports goods stores; stationery stores; pharmaceutical and health product stores; specialty stores9082
Table 2. Factors influencing the spatial distribution of the retail industry.
DimensionIndicatorFactorAbridgeQuantitative Description
Market demandPopulation densityX1PDSum of the values of the number of pixels representing the population in the living area/Area of the DLC
Economic levelCommercial land priceX2CLPPercentage of commercial land use in the living area by type of commercial land use × Unit price of commercial land/Area of the DLC
Housing unit priceX3HUPFirstly, the house prices obtained from the Anjuke platform are interpolated using the Kriging spatial interpolation method to reflect the distribution of house prices in the central urban area, and then calculate the average house prices in Area of the DLC.
Convenience Public transport coverage densityX4TCDMake buffer zones of 300 m, 400 m, and 500 m for ordinary bus stations, bus rapid transit stations, and subway stations, respectively. Calculate the total area covered by public transportation in each living circle.
Road network density X5RNDLength of roads within the living area.
LocationAgglomeration levelX6ALThe Euclidean distance from the centroid of the living circle to the shopping complex.
CentralityX7CENThe Euclidean distance from the centroid of the living circle to their respective local government offices.
Note: In the subsequent text, abbreviations will be used to denote variable factors.
Table 3. Detection of factors influencing the distribution of the retail industry.
FactorGIZ-ScoreOverallDepartment StoresConvenience StoresSupermarketsShopping CentersSpecialty Stores
PD0.60 ***0.33 ***0.19 ***0.48 ***0.37 ***0.19 ***0.29 ***
CLP0.61 ***0.49 ***0.25 ***0.39 ***0.39 ***0.24 ***0.54 ***
HUP0.69 ***0.44 ***0.25 ***0.36 ***0.44 ***0.14 **0.43 ***
TCD0.48 ***0.41 ***0.20 ***0.50 ***0.44 ***0.24 ***0.39 ***
RND0.58 ***0.46 ***0.17 ***0.53 ***0.47 ***0.25 ***0.48 ***
AL0.11 *0.080.040.110.080.070.08
CEN0.79 ***0.25 ***0.11 *0.28 ***0.30 ***0.11 *0.25 ***
Note: *, **, and *** denote statistical significance at the 90%, 95%, and 99% confidence levels, respectively, based on tests of significance.
Disclaimer/Publisher’s Note: The statements, opinions and data contained in all publications are solely those of the individual author(s) and contributor(s) and not of MDPI and/or the editor(s). MDPI and/or the editor(s) disclaim responsibility for any injury to people or property resulting from any ideas, methods, instructions or products referred to in the content.

