
Identification of Urban Functional Zones Based on POI Density and Marginalized Graph Autoencoder

1
School of Geography and Ocean Science, Nanjing University, Nanjing 210023, China
2
Jiangsu Provincial Key Laboratory of Geographic Information Science and Technology, Nanjing University, Nanjing 210023, China
*
Author to whom correspondence should be addressed.
ISPRS Int. J. Geo-Inf. 2023, 12(8), 343; https://doi.org/10.3390/ijgi12080343
Submission received: 27 June 2023
/
Revised: 4 August 2023
/
Accepted: 15 August 2023
/
Published: 17 August 2023
Abstract
:With rapid urbanization, urban functional zones have become important for rational government and resource allocation. Points of interest (POIs), as informative and open-access data, have been widely used in studies of urban functions. However, most existing studies have failed to address unevenly or sparsely distributed POIs. In addition, the spatial adjacency of analysis units has been ignored. Therefore, we propose a new method for identifying urban functional zones based on POI density and marginalized graph autoencoder (MGAE). First, kernel density analysis was utilized to obtain the POI density and spread the effects of POIs to the surroundings, which enhanced the data from unevenly or sparsely distributed POIs considering the barrier effects of main roads and rivers. Second, MGAE performed feature extraction in view of the spatial adjacency to integrate features from the POIs of the surrounding units. Finally, the k-means algorithm was used to cluster units into zones, and semantic recognition was applied to identify the function category of each zone. A case study of Changzhou indicates that this method achieved an overall accuracy of 90.33% with a kappa coefficient of 0.88, which constitutes considerable improvement over that of conventional methods and can improve the performance of urban function identification.
Keywords:
urban functional zone; POI; kernel density analysis; graph autoencoder; k-means; Changzhou1. Introduction
Urban areas are important spaces for humans to live in and produce [1]. With accelerating urbanization, sites of social activities gradually converge to form functional zones with distinct characteristics, such as residential, industrial, and commercial areas. Urban functional zones reflect the complex spatial structures and social functions [2]. These zones are important for understanding the spatial distributions of urban economic and social activities [3]. Determining the changes in urban functional zones and land use [4] is not only beneficial for urban decision making and policy formulation [5], but is also crucial for the economy, society, and ecology of urban areas. Urban functional zones are widely utilized in many studies of the spatial distribution of urban carbon emissions [6,7,8,9], the quality of urban development [10,11,12,13,14], and the urban heat island effect [15,16,17,18,19], among others. Thus, understanding the distribution of urban functional zones is essential for optimizing urban spatial structures and future city planning [20].
Urban functional zones are commonly identified using multisource geographic data, such as remote sensing data [21,22,23,24,25,26,27], points of interest (POIs) [28,29,30], vehicle trajectory data [31,32,33,34,35], and mobile phone data [36,37,38,39,40,41]. Urban remote sensing data are mainly used to extract features in terms of their natural attributes (e.g., spectral, shape, and textural features) [42]. However, the formation of urban functions depends on the spatial agglomeration of living and production activities. Information obtained from urban remote sensing data alone cannot effectively reflect social information. In the last decade, the emergence of geospatial big data has led to novel methods for urban function research. Cai et al. [41] used GPS trajectory and check-in data to construct a travel pattern graph, to which the Node2vec method was applied to discern the features of urban areas for identifying the functional zones. Zhou et al. [34] used taxi trajectory data and proposed an hour-day-spectrum (HDS) approach to generate distribution waveforms of taxi pick-up and drop-off points to identify different social functions. Song et al. [39] used aggregated mobile phone data containing work and residence attributes to automatically identify urban functional zones based on a self-organizing map neural network model.
POIs, as a type of geospatial big data, describe the main locations and information of urban human activity, record the detailed geographic location and functional labels of urban places, and have advantages of easy access and processing. POIs are mainly obtained via the external interfaces of commercial map providers, such as Baidu and Amap. POIs are increasingly used to identify urban functions and monitor urban dynamics. In particular, applying POIs for urban functional identification requires the extraction of the social features of the analysis units. Two types of methods are commonly used:
- Statistics-based methods: These methods count the number of POIs located within each unit to calculate indicators. The units are often divided by road network data or grids and are large in size in order to ensure that they contain sufficient POIs for subsequent analysis. The indicators include the frequency density, category factor, and term frequency-inverse document frequency (TF-IDF) to quantify the socioeconomic characteristics. Chen et al. [30] calculated the POI density of each urban functional zone using the POI quadrat density method to identify single functional, mixed functional, and no-data areas within urban areas. Xie et al. [1] used the category factors of POIs as feature vectors and fused remote sensing and trajectory data to identify urban functional zones. Chen et al. [27] calculated the TF-IDF index and frequency density of POIs within units to quantify the social features of urban functional zones. However, POIs are unevenly distributed in urban areas, whereas some emerging urban districts contain sparse or no POIs. Therefore, statistical methods are insufficient for obtaining regional social attributes and judging zone types.
- Spatial-context-based methods: These methods combine the spatial contextual relationships of POIs and use machine learning methods to mine potential semantic features for functional identification. Commonly used models include Word2Vec [43] and Doc2Vec. Zhang et al. [44] proposed the GeoSemantic2vec algorithm for extracting urban functional zones from POI semantic and location information. Sun et al. [45] proposed the Block2vec model that uses the skip-gram framework to map the spatial correlations between POIs as well as mapping the study units into high-dimensional vectors to identify urban functions. Zhai et al. [28] combined POIs and a simplified Place2vec model to construct a POI-based spatial contextual relationship to detect urban functional zones at a neighborhood scale. However, in addition to the spatial adjacency between POIs, such a relationship also exists between the study units within urban areas, which is neglected in the feature extraction process.
Thus, existing methods using POIs to identify urban functional zones have two shortcomings. First, they fail to address unevenly or sparsely distributed POIs, rendering it impossible to make reasonable inferences about emerging urban areas in the urban functional identification process. Previous studies have often identified these zones as undefined zones, which cannot be used to guide urban spatial structure optimization. Second, previous functional identification studies have ignored the spatial adjacency between the analysis units. As the units are not isolated from each other, there are correlations between neighboring units (e.g., commercial and residential units are often adjacent, whereas industrial and residential units are well separated) [46]. Ignoring these spatial adjacency results in deficiency in the spatial context.
To address these problems, we developed an urban functional identification model based on POI density and marginalized graph autoencoder (MGAE). The study had dual objectives: (1) to mitigate the problem of unevenly or sparsely distributed POIs, the model obtains the POIs density using kernel density analysis that considers barriers (e.g., main roads and rivers) and spreads the effects of POIs to the surrounding areas, and (2) to integrate the spatial context of POIs and units to generate the representation vectors, the model introduces MGAE, a machine learning model that can apply graph autoencoder to learn feature representation, for feature learning. The spatial adjacencies of unit and POI features were integrated using MGAE to improve the accuracy of urban function identification. Our study is finally able to identify the type of urban functions in the study area. It can better characterize the distribution of urban areas and provide references for urban planning.
2. Study Area and Dataset
2.1. Study Area
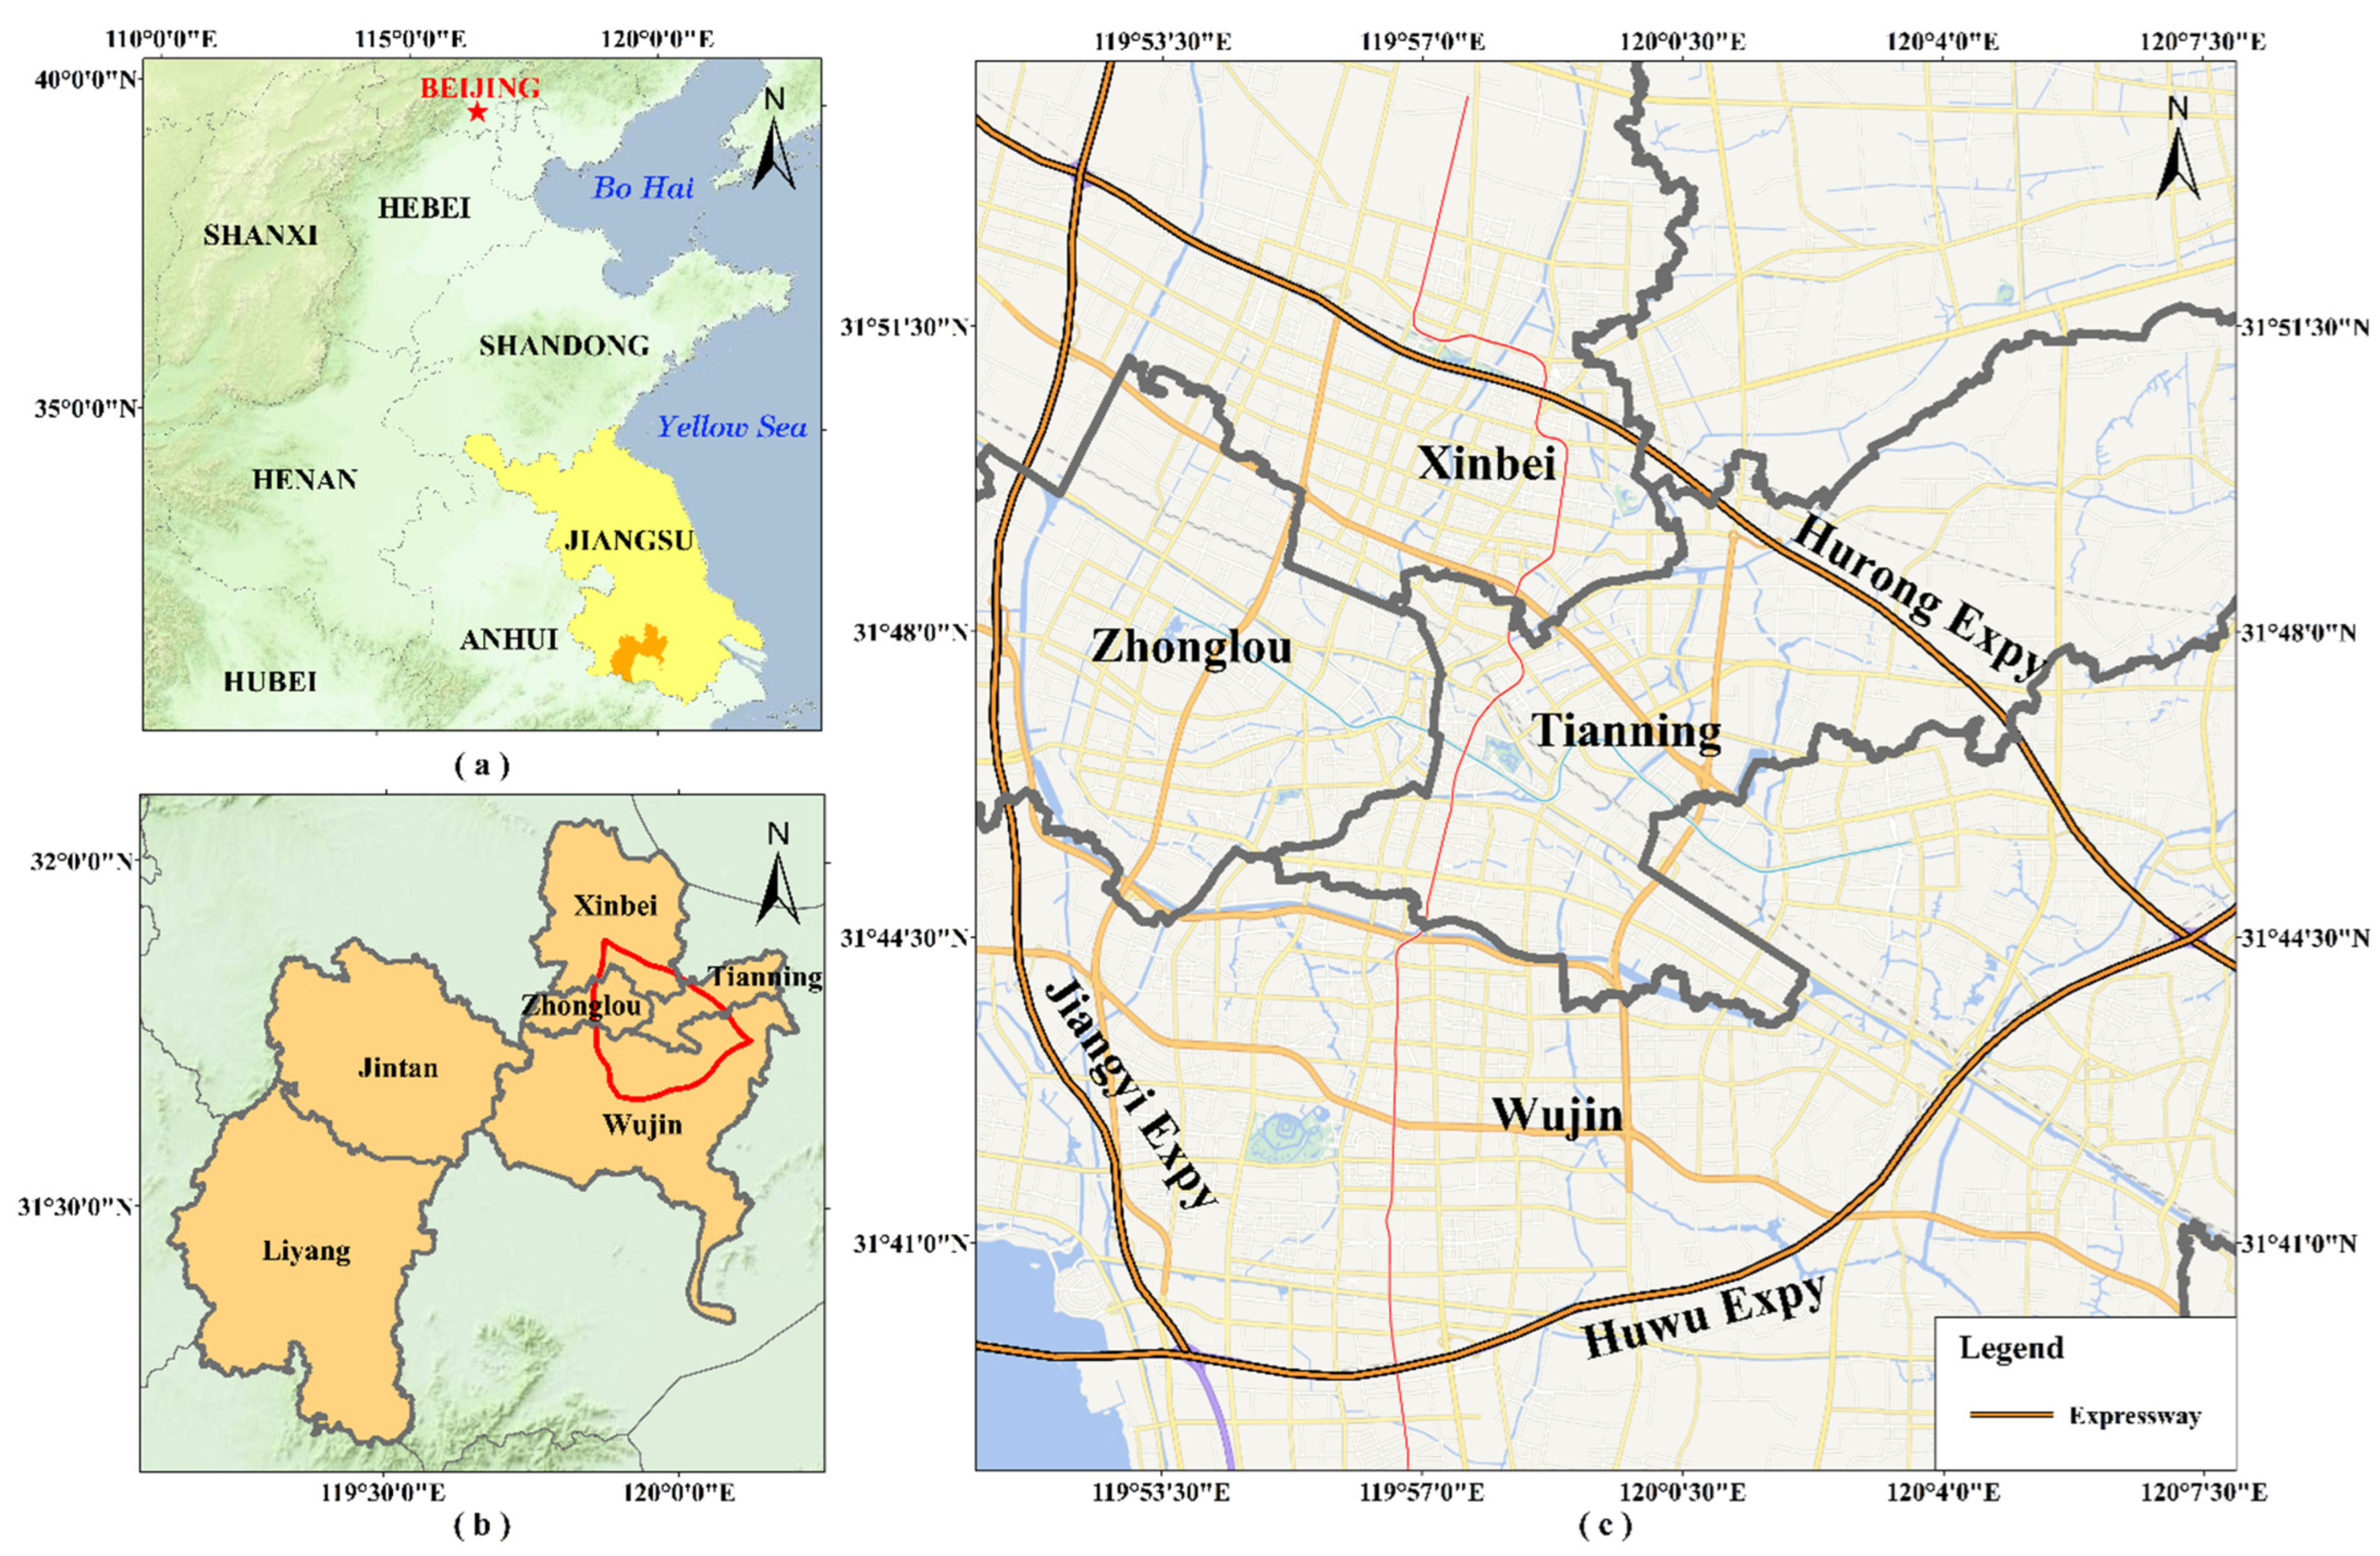
The downtown region of Changzhou was selected as the study area (Figure 1), which is surrounded by three expressways (i.e., Jiangyi, Huwu, and Hulong). Changzhou is located in southern Jiangsu Province in eastern China, and is a hub city in the Yangtze River Delta region. The city has a high level of urban development, an urbanization rate of over 70%, and diverse urban functions; thus, it is highly suitable for urban function identification. The study area covers 391.78 km2 and has a population of over 10 million.
2.2. Data Sources and Preprocessing
The data used in this study include POIs and land use data for Changzhou. The interface provided by Baidu maps (https://lbsyun.baidu.com/, accessed on 17 May 2022) was utilized to obtain the POIs in 2021. The land use data were obtained from the Natural Resources and Planning Bureau of Changzhou.
2.2.1. POIs
A total of 6,137,875 POIs in Changzhou were acquired using the application programming interface (API), and coordinate transformation was performed. Each POI contained attributes including name, latitude, longitude, and label. However, the raw POIs included duplicated pickups and some types exhibited low relevance to urban function. Therefore, a partial dataset was extracted to obtain 185,018 POIs, which were reclassified into 14 categories (Table 1), including finance, car service, culture and media, food, governmental and public organizations, hotel, public facility, residence, science and education, shopping mall, sports and recreation, tourism attraction, and transportation facility. The fields of each POI included the name, latitude, longitude, and reclassified label.
2.2.2. Land Use Data
In our study, land use data were used to divide the study area, which constituted vector data produced by the Natural Resource Administration of the Chinese government that is updated annually and comprises patches. Land use data were produced based on remote sensing image interpretations and field verification. These data can reflect the use of land at the time of investigation. The land use data had six categories, including farmland, woodland, grassland, water, residential land, and unused land. The patches in land use data were selected as the analysis units, and were assigned a function, such as “commercial”, following the evaluation of each patch. After removing roads and water, 36,710 units were used in the experiment.
3. Methodology
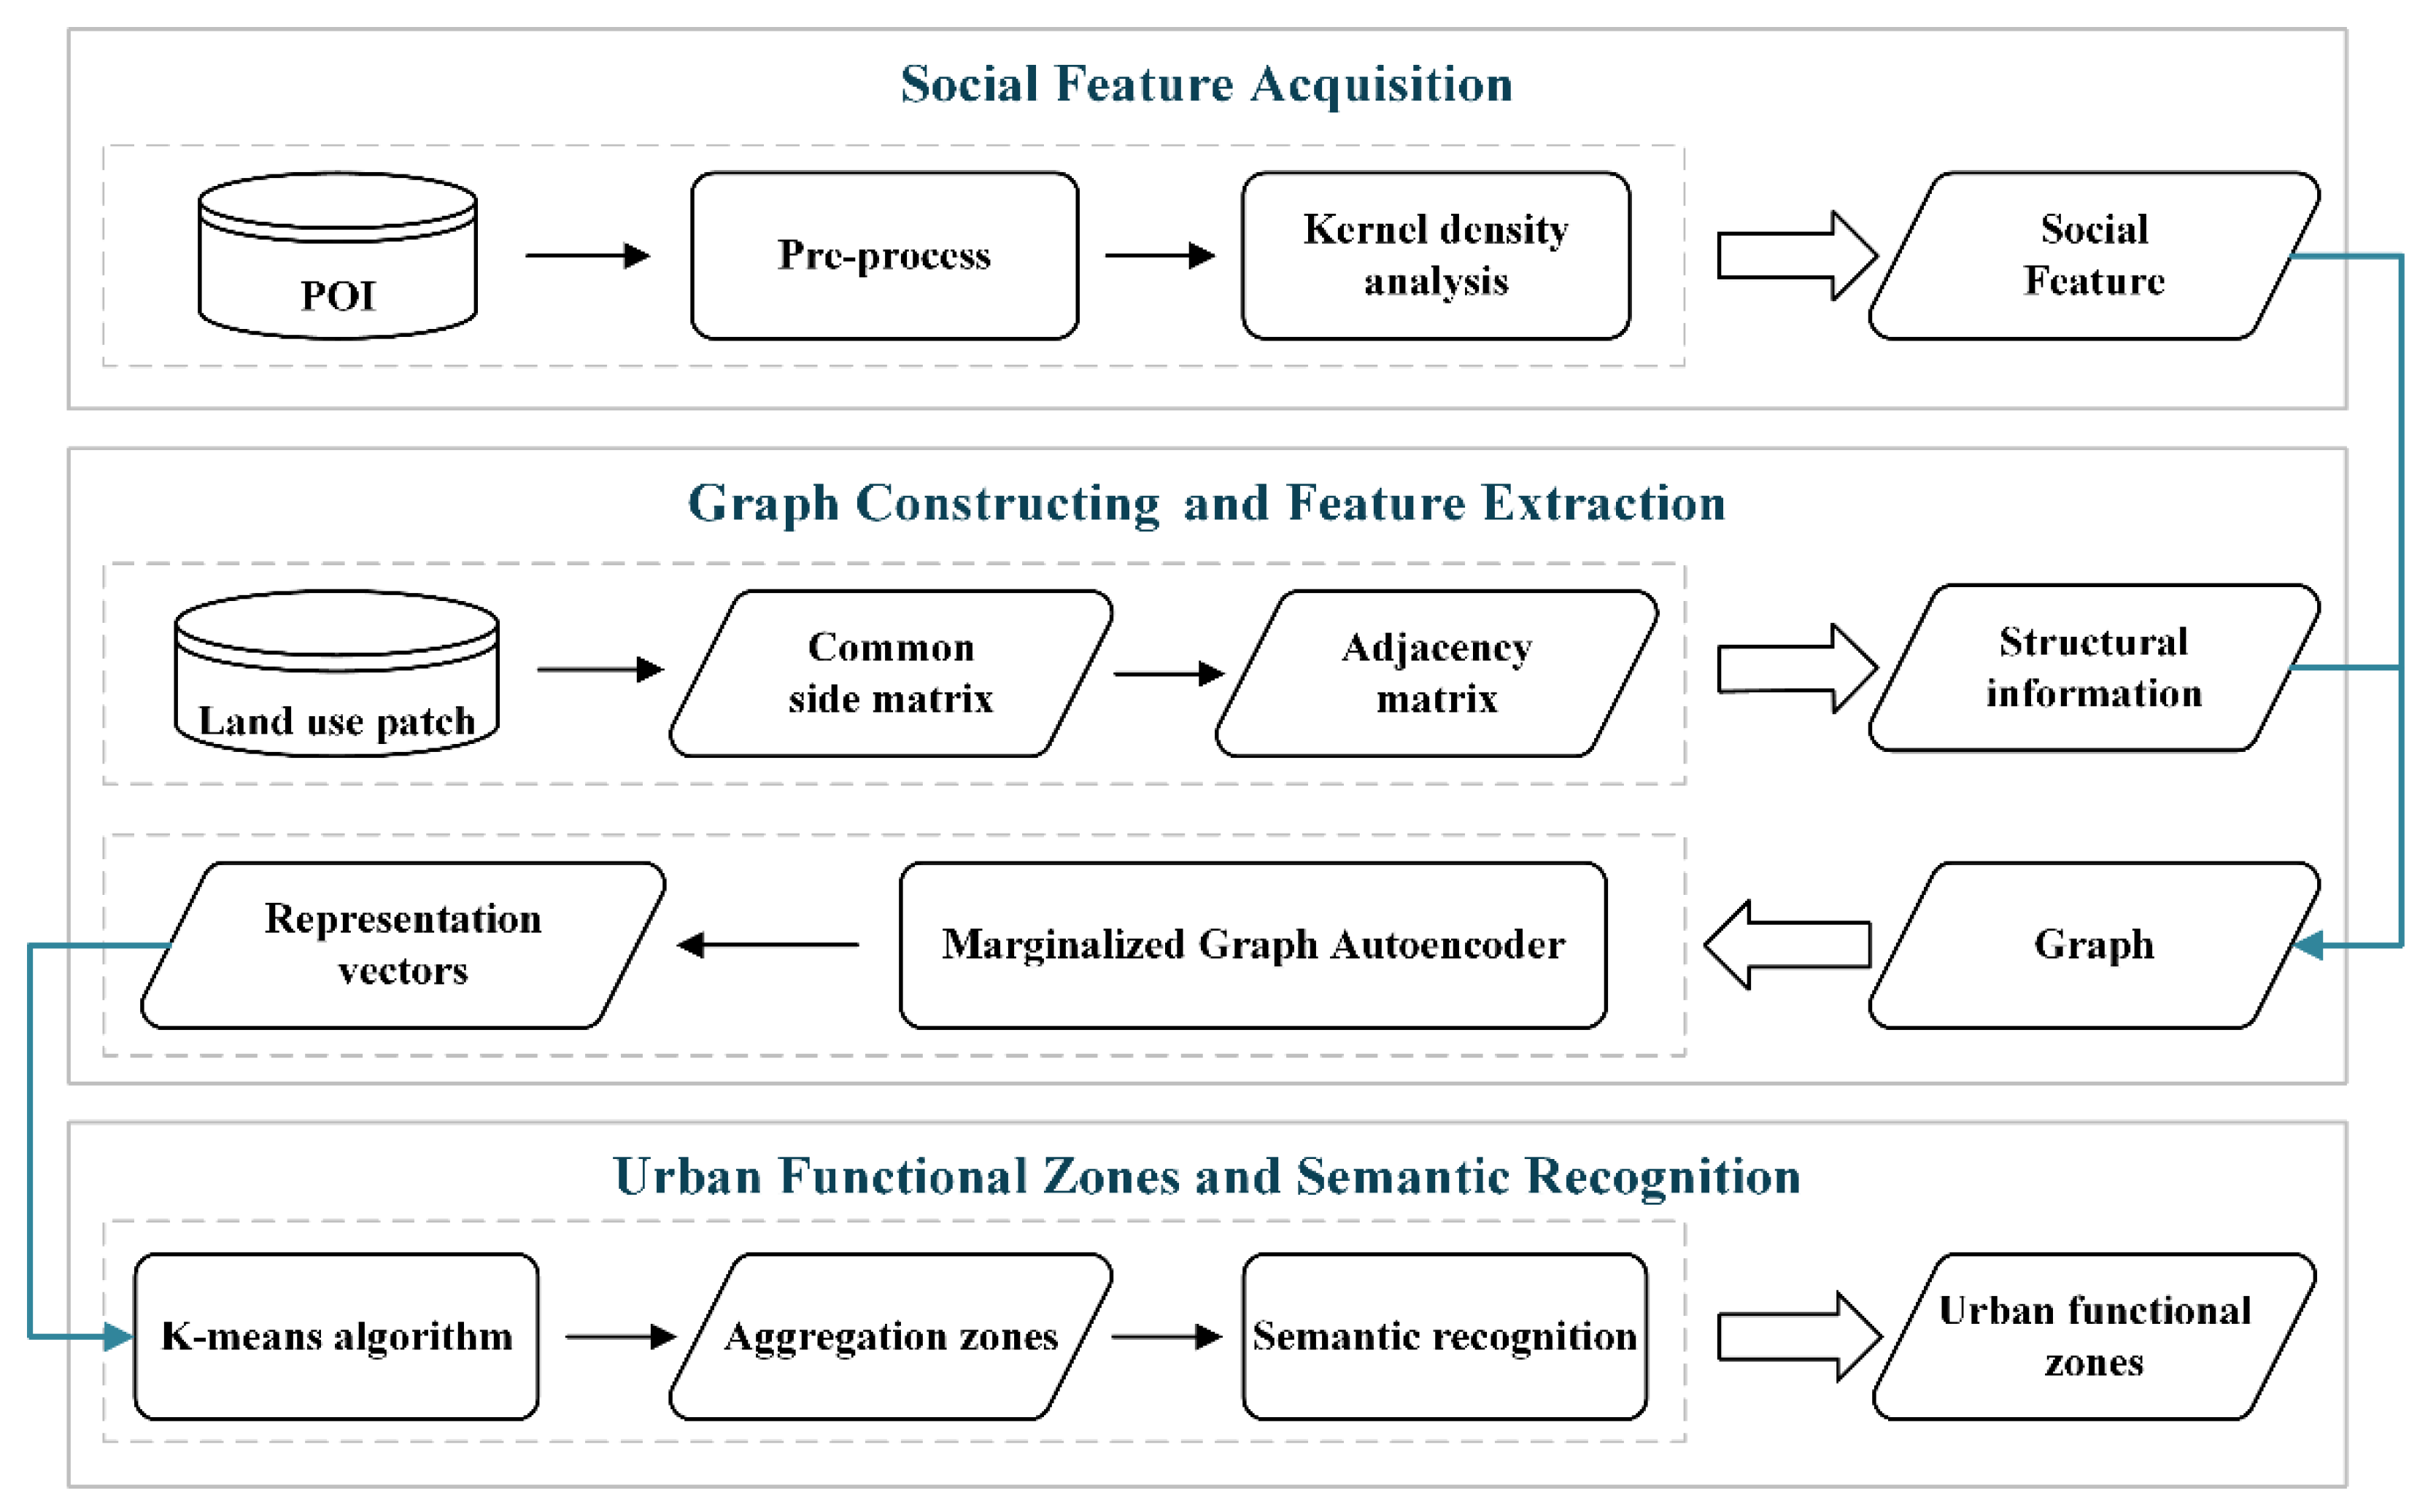
In this study, urban function was regarded as a comprehensive result impacted by POIs within the surrounding area, as well as the local structural information of the study area. Therefore, a method based on POI density and MGAE was proposed to identify urban functional zones. The general procedure of this method is illustrated in Figure 2. POIs were first preprocessed, including data de-duplication and reclassification, after which the effects of the POIs were spread to the surrounding area via kernel density analysis. Spatial adjacency between units was converted into a graph to represent local spatial structural features. The MGAE was used to integrate the spatial structure and content of units. Specifically, it could combine content between central and neighboring units in the graph and generate representation vectors.
Finally, the representation vectors were clustered using the k-means algorithm to divide the entire area into zones with relatively homogeneous urban functions, and semantic recognition was performed to determine the urban functional zone categories. Kernel density analysis, feature extraction, and clustering were performed using Python 3.0 as the programming language.
3.1. Kernel Density of POIs Considering Barrier Effects
Owing to the application of electronic map and location-based services (LBS), the number of POIs in urban areas has increased substantially; however, uneven POI distribution still exists. To address these problems, the kernel density analysis method was applied to fit the spatial distributions of POIs and spread their effects from a point to their surrounding areas. Then, the densities of different types of POIs were used to generate the features of each unit for subsequent identification [47].
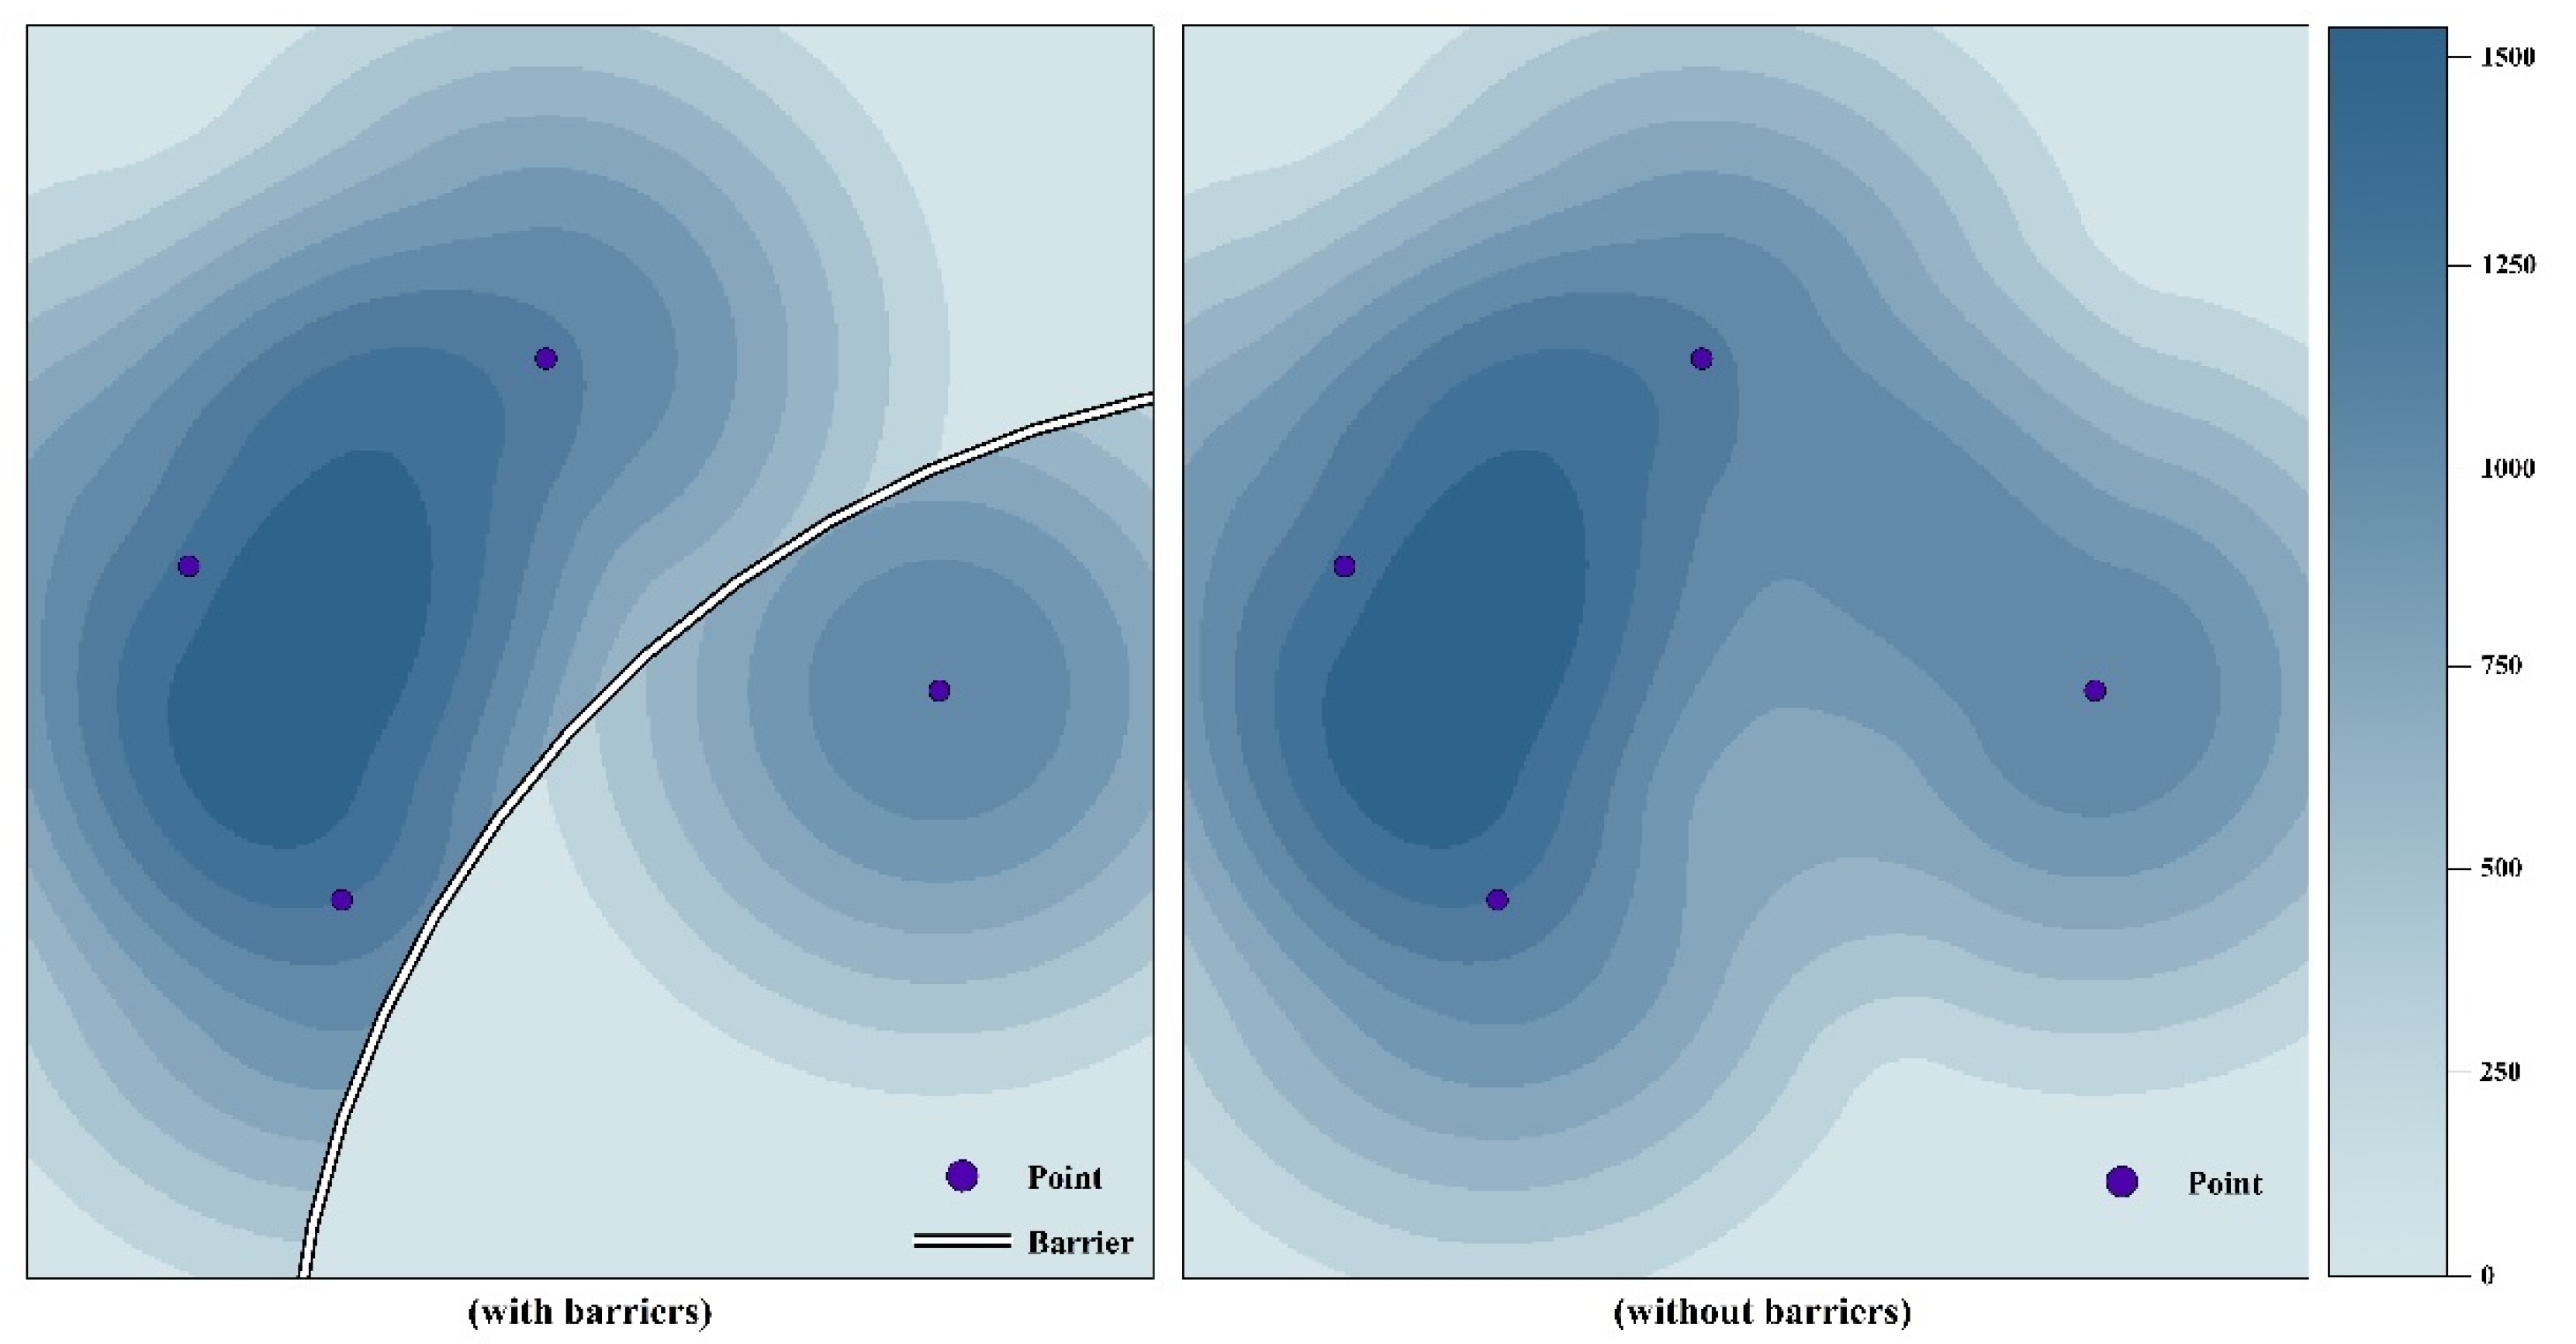
Because the main roads and rivers within a city will hinder the flow of people and economic activity on both sides, the spread of POIs should stop when encountering a road or river. In this study, expressways, primary roads, railroads, and rivers were set as barriers in the kernel density calculations. The roads and water of the study area were based on data from Map World in the National Platform of Common Geospatial Information Services (https://www.tianditu.gov.cn/, accessed on 13 April 2023). When a barrier was present between POIs and the grid to be calculated, these POIs were considered as belonging to other grids and were not incorporated in the accumulated kernel density calculation (Figure 3). The kernel function used in this study was the quartic kernel; the kernel density of grid in space was calculated as follows:
where is the bandwidth, is the total number of POIs within the bandwidth range and that have no barriers between the points and grid, and is the distance between the grid center and the i-th POI within the bandwidth range and without barriers between the point and grid ().
The choice of the bandwidth plays an important role in the results [48,49]. An excessively large bandwidth will produce results that are more biased toward showing global-scale spatial variations, while local details are lost. In contrast, a very small bandwidth is more suitable for expressing local spatial variations, but misses the overall spatial variations. After considering road and water barriers and spatial effects in the study area, the final bandwidth used in this study was taken as 100 m.
3.2. Extracting Features Using MGAE
Each unit is not isolated in an urban area, but is interconnected with and influenced by the surrounding units. Therefore, the urban function depends not only on the social attributes of a single unit, but also on the influences of the surrounding units. In this study, the units and their adjacent areas were converted into graphs to reflect the spatial structural features, and the MGAE was applied to perform unsupervised feature extraction of the local structure and generate the representation vectors [50].
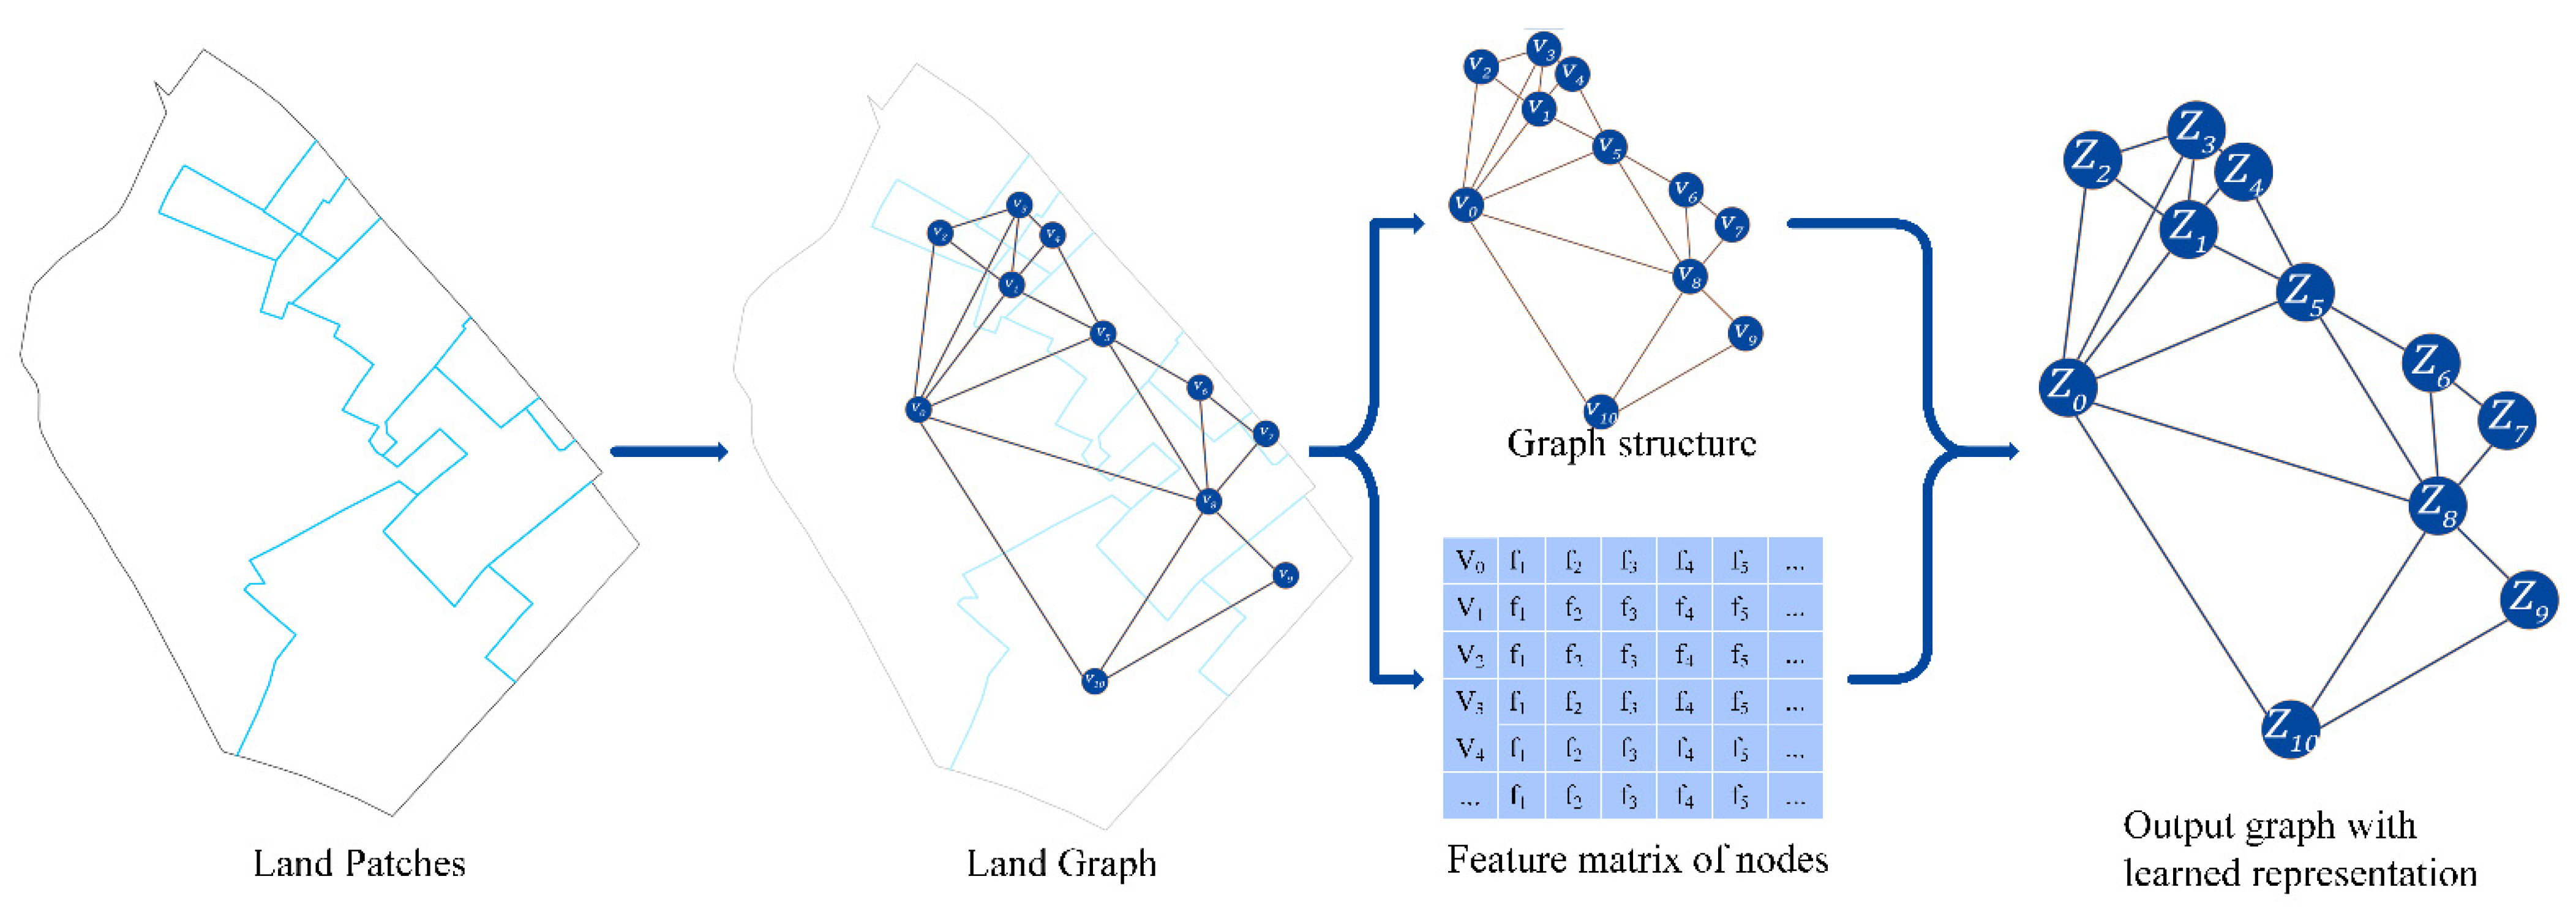
A graph construction procedure is illustrated in Figure 4. The graph consists of nodes and edges; binary adjacency matrix A is often used to describe graph structure. The graph is generally defined as . The node set represents patches in the land use data, and each node contains a d-dimensional feature vector that represents the density values of various types of POIs in patches. is the edge set. Each denotes an edge connecting two nodes. If a common edge exists between two patches, the two corresponding nodes are connected by one edge.
The MGAE model is a graph-based learning method with the advantage of not requiring labeled data for training. The MGAE model has the advantage of good performance and a fast training speed. It can also use the convolutional operation on the graph to extract structural features (Figure 4). The MGAE model replaces in the autoencoder loss function (Equation (2)) with the convolution formula in the graph convolutional network, and adds a regularization term to construct the loss function as follows:
where denotes the adjacency matrix of the graph data, denotes the degree matrix of , is the parameter matrix, is the regularization term, is a trade-off, is the original vector matrix, and is the vector matrix after random corruption.
3.3. Urban Function Clustering
Based on the vectors representation generated by the MGAE, further cluster analysis was conducted to divide the entire area into zones with relatively homogeneous urban functions. Cluster analysis is an unsupervised classification process that groups similar patches into the same cluster, that is, patches of similar urban function are identified in one cluster. In urban function studies, various clustering algorithms have been widely used, including the k-means algorithm and the OPTICS clustering algorithm. In this study, the k-means algorithm was used for cluster analysis.
The clustering results were evaluated using external and internal test methods. The external test method was used to compare the clustering results with the correct classification results of the dataset to determine the merits of the clustering method. The internal test method relied only on the dataset to evaluate the accuracy of the clustering results. As no correct labels existed for the dataset, the internal test method was used as the criterion for setting the training parameters of the model. We used two clustering internal test methods to select the optimal value of cluster number M: the sum of the squared error (SSE), as calculated using Equation (4), and the silhouette coefficient (SIL), as calculated using Equation (5) [51]:
where is the number of functional zones, denotes all units classified into the i-th functional zone, denotes the representation vector of the unit, and denotes the mean value of all units in the i-th functional zone.
where n is the number of units, a denotes the average distance of the j-th unit from the units of interzones, and b denotes the average distance of the j-th unit from the other units in intrazones.
3.4. Urban Functional Semantic Recognition
Although the geometry of the urban functional zones was extracted after clustering, the functional types of the zones remained unclear. Therefore, the semantic identification of each zone type was needed to determine the urban function of each zone. Thus, two common metrics for partitioning were used: frequency density (FD) and category factor (CF) [52,53]. The metrics were calculated using the following equations:
where denotes the number of the k-th POI type in the i-th functional zone, denotes the set of all units assigned to the i-th functional zone, and denotes the area of the j-th unit. A higher indicates that the k-th type of POI is more densely distributed in the i-th functional zone.
where, denotes the total number of the various POIs in the i-th functional zone, and and denote the numbers of the k-th type of POI and the total value of the POIs, respectively. denotes the level of aggregation of the k-th POI type in the i-th functional zone and compares the value of the k-th type of POIs in the i-th functional zone with the average value of all zones. A larger indicates that the k-th type of POIs is more concentrated in the i-th functional zone. In particular, if the value is greater than 1, it suggests that the average of the k-th POI type in the i-th functional zone is greater than the average of all k-th POI type in all zones. This means that the level of aggregation of the k-th POI type in the i-th functional zone is relatively high in all zones.
4. Results and Analysis
4.1. Determination of Model Parameter
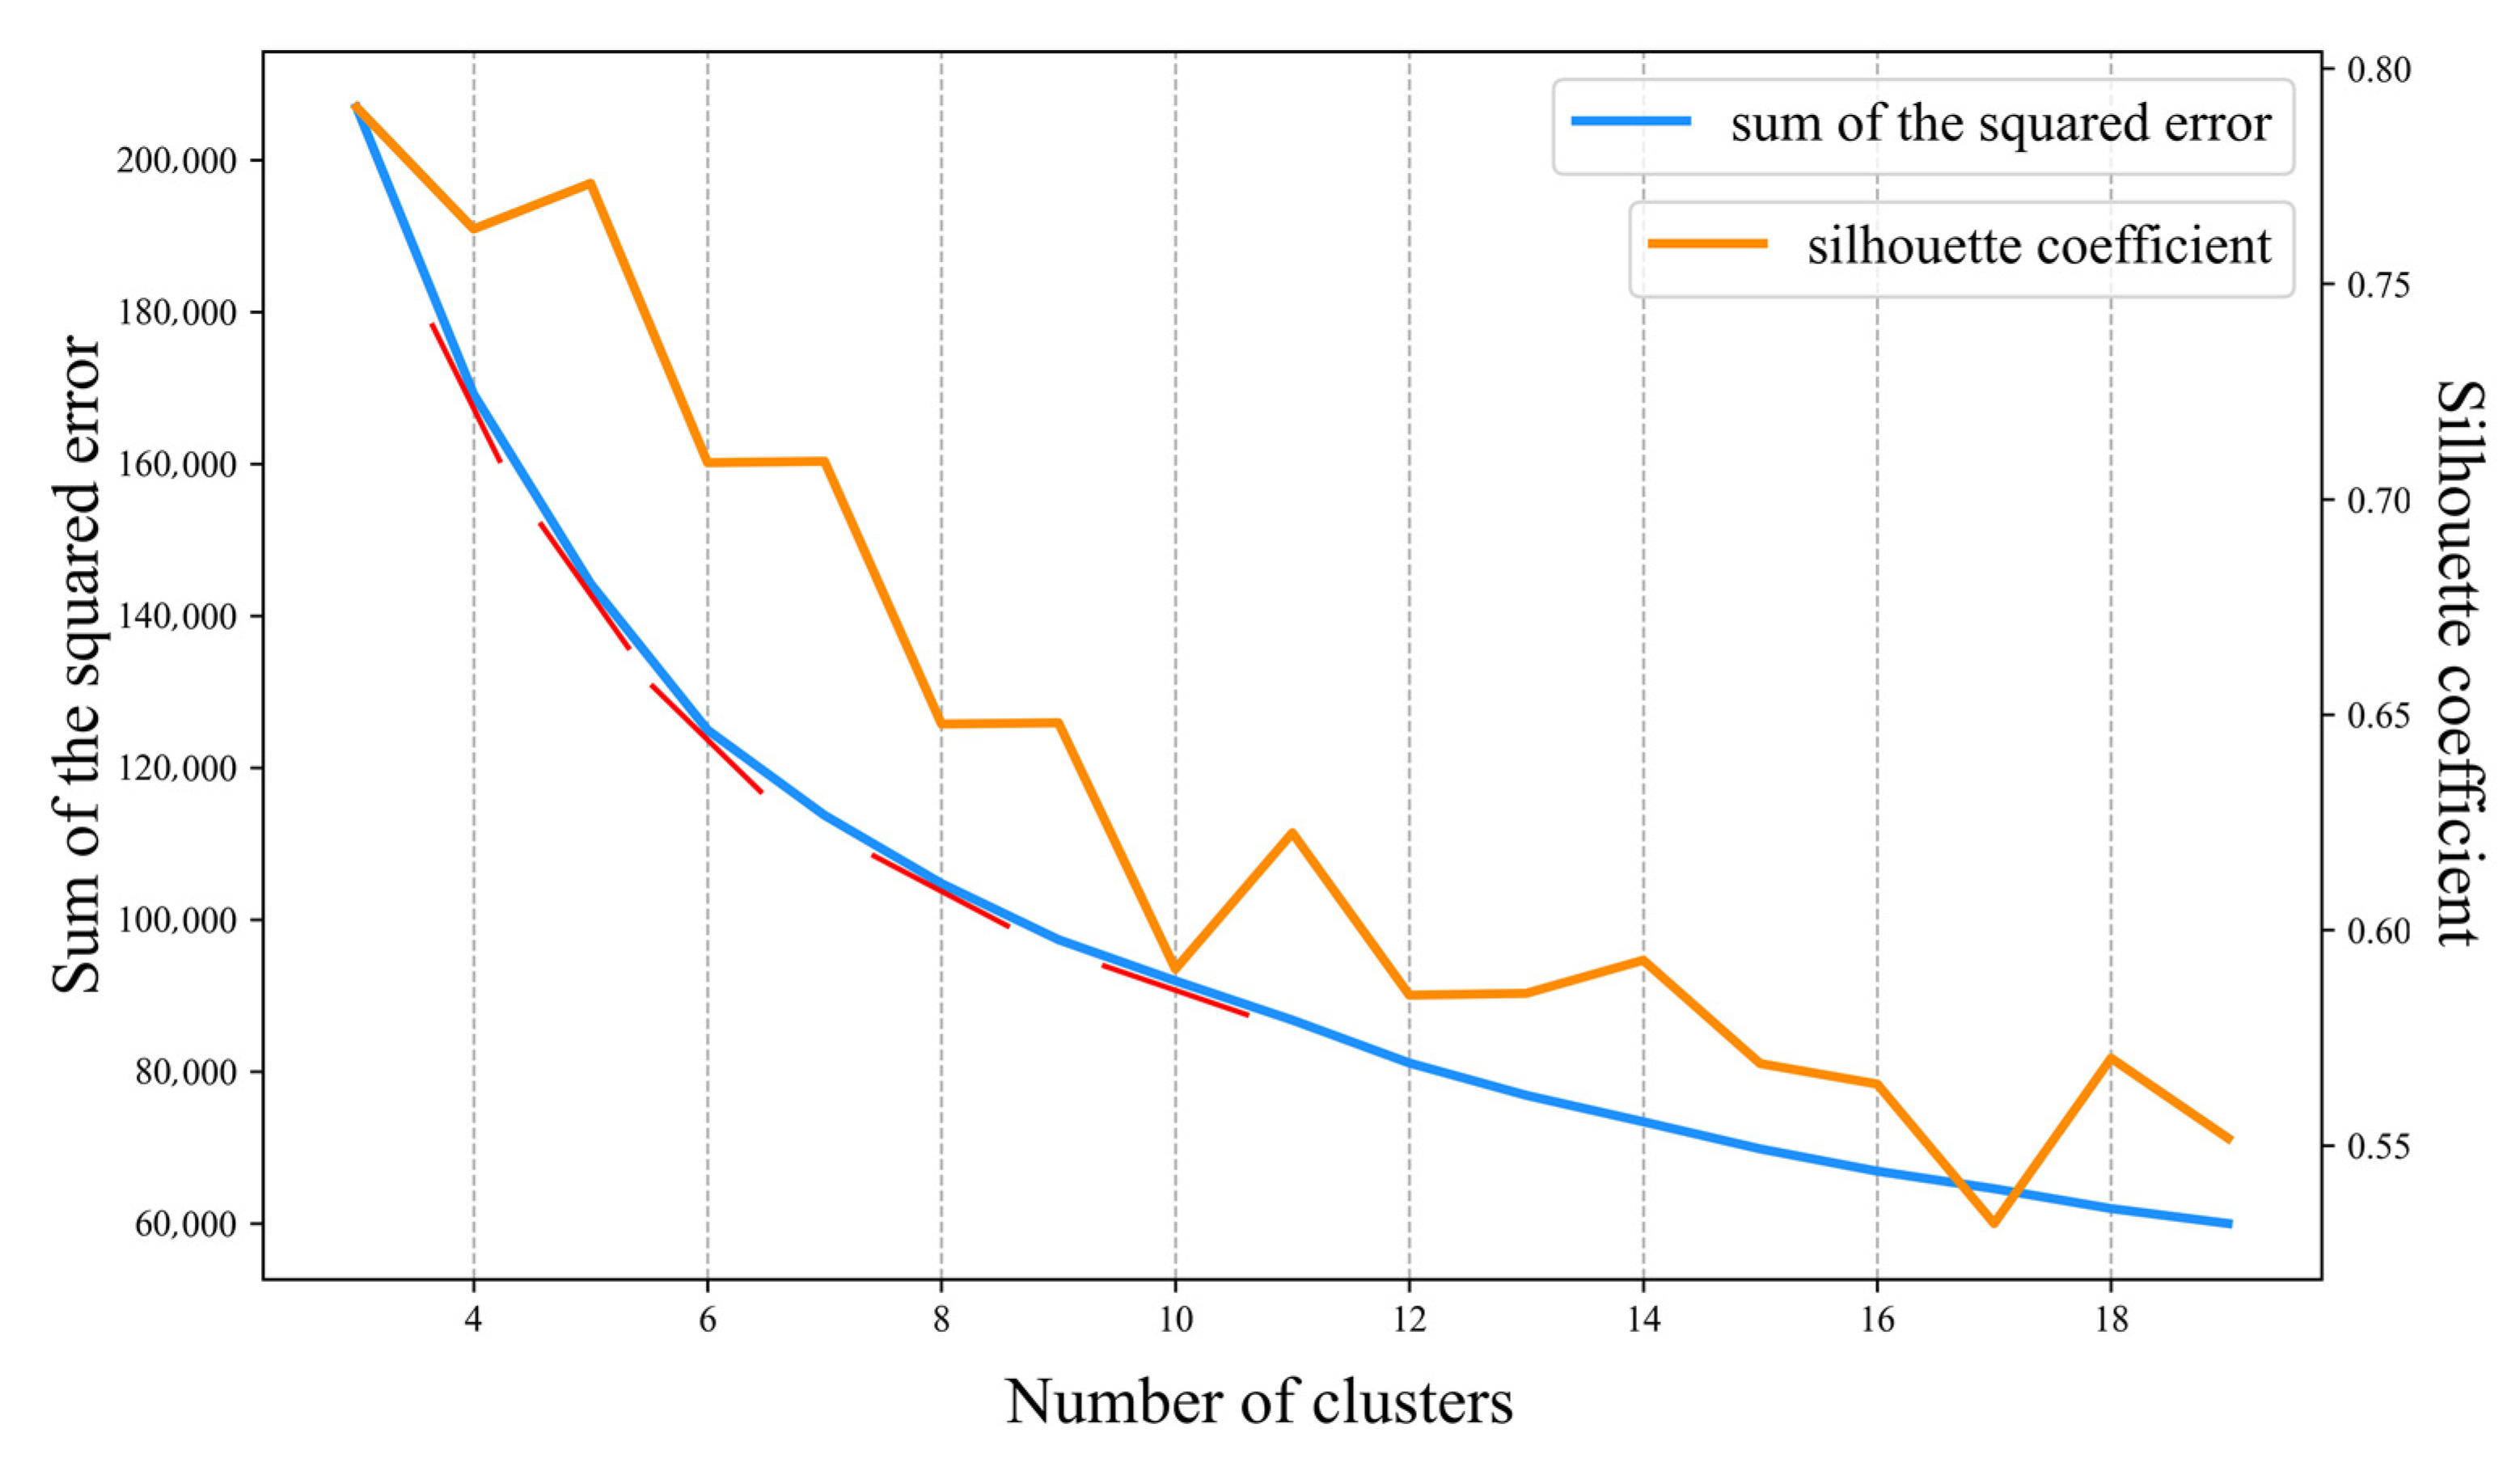
To test the clustering performance and determine the optimal number of clusters (M), we varied the number of clusters from 3 to 19 and repeated the analysis 10 times with each set of parameters to ensure the accuracy of the results. Figure 5 shows that the SSE and SIL gradually decreased as the number of clusters increased. The slope of the SSE curve varied widely when K ranged from 5 to 7, indicating that the optimal number of clusters should be within that range based on the elbow rule. When M = 5, the SIL curve reached a local maximum. Therefore, we selected M = 5 as the number of clusters for the experiment and subsequent analysis.
4.2. Accuracy Evaluation and Performance Comparison
A confusion matrix was used to evaluate the accuracy of the urban functional zone identification. Sixty patches in each of the five types of urban functional zones were selected randomly. Then, high-resolution remote sensing images and Map World data were utilized to artificially judge the urban functions. The evaluation results are listed in Table 2. The overall accuracy (OA) of the urban functional zone obtained using the method proposed herein reached 90.33%, and the kappa coefficient was 0.88.
To evaluate the urban function recognition performance, the proposed model was compared with commonly used models, including the Latent Dirichlet Allocation (LDA), TF-IDF, and marginalized Stacked Denoising Autoencoder (mSDA) [54]. mSDA is an unsupervised learning method for attribute data mining that uses linear denoisers as the basis for learning feature representation, simplifying the parameter estimation method, and reducing the training time. In total, 300 manually identified units were selected for each comparison (Table 3). Because TF-IDF considers only the distribution frequency of the POIs and ignores their semantic information, this method often has poor identification performance. Although LDA and mSDA extract semantic information of POIs, they ignore the spatial relationships between units in feature extraction; thus, they have lower accuracies than the proposed method. These experiments show that incorporating spatial relationships into attribute feature extraction can mine the features of districts more effectively, which in turn allows better performance in extracting urban functional zones.
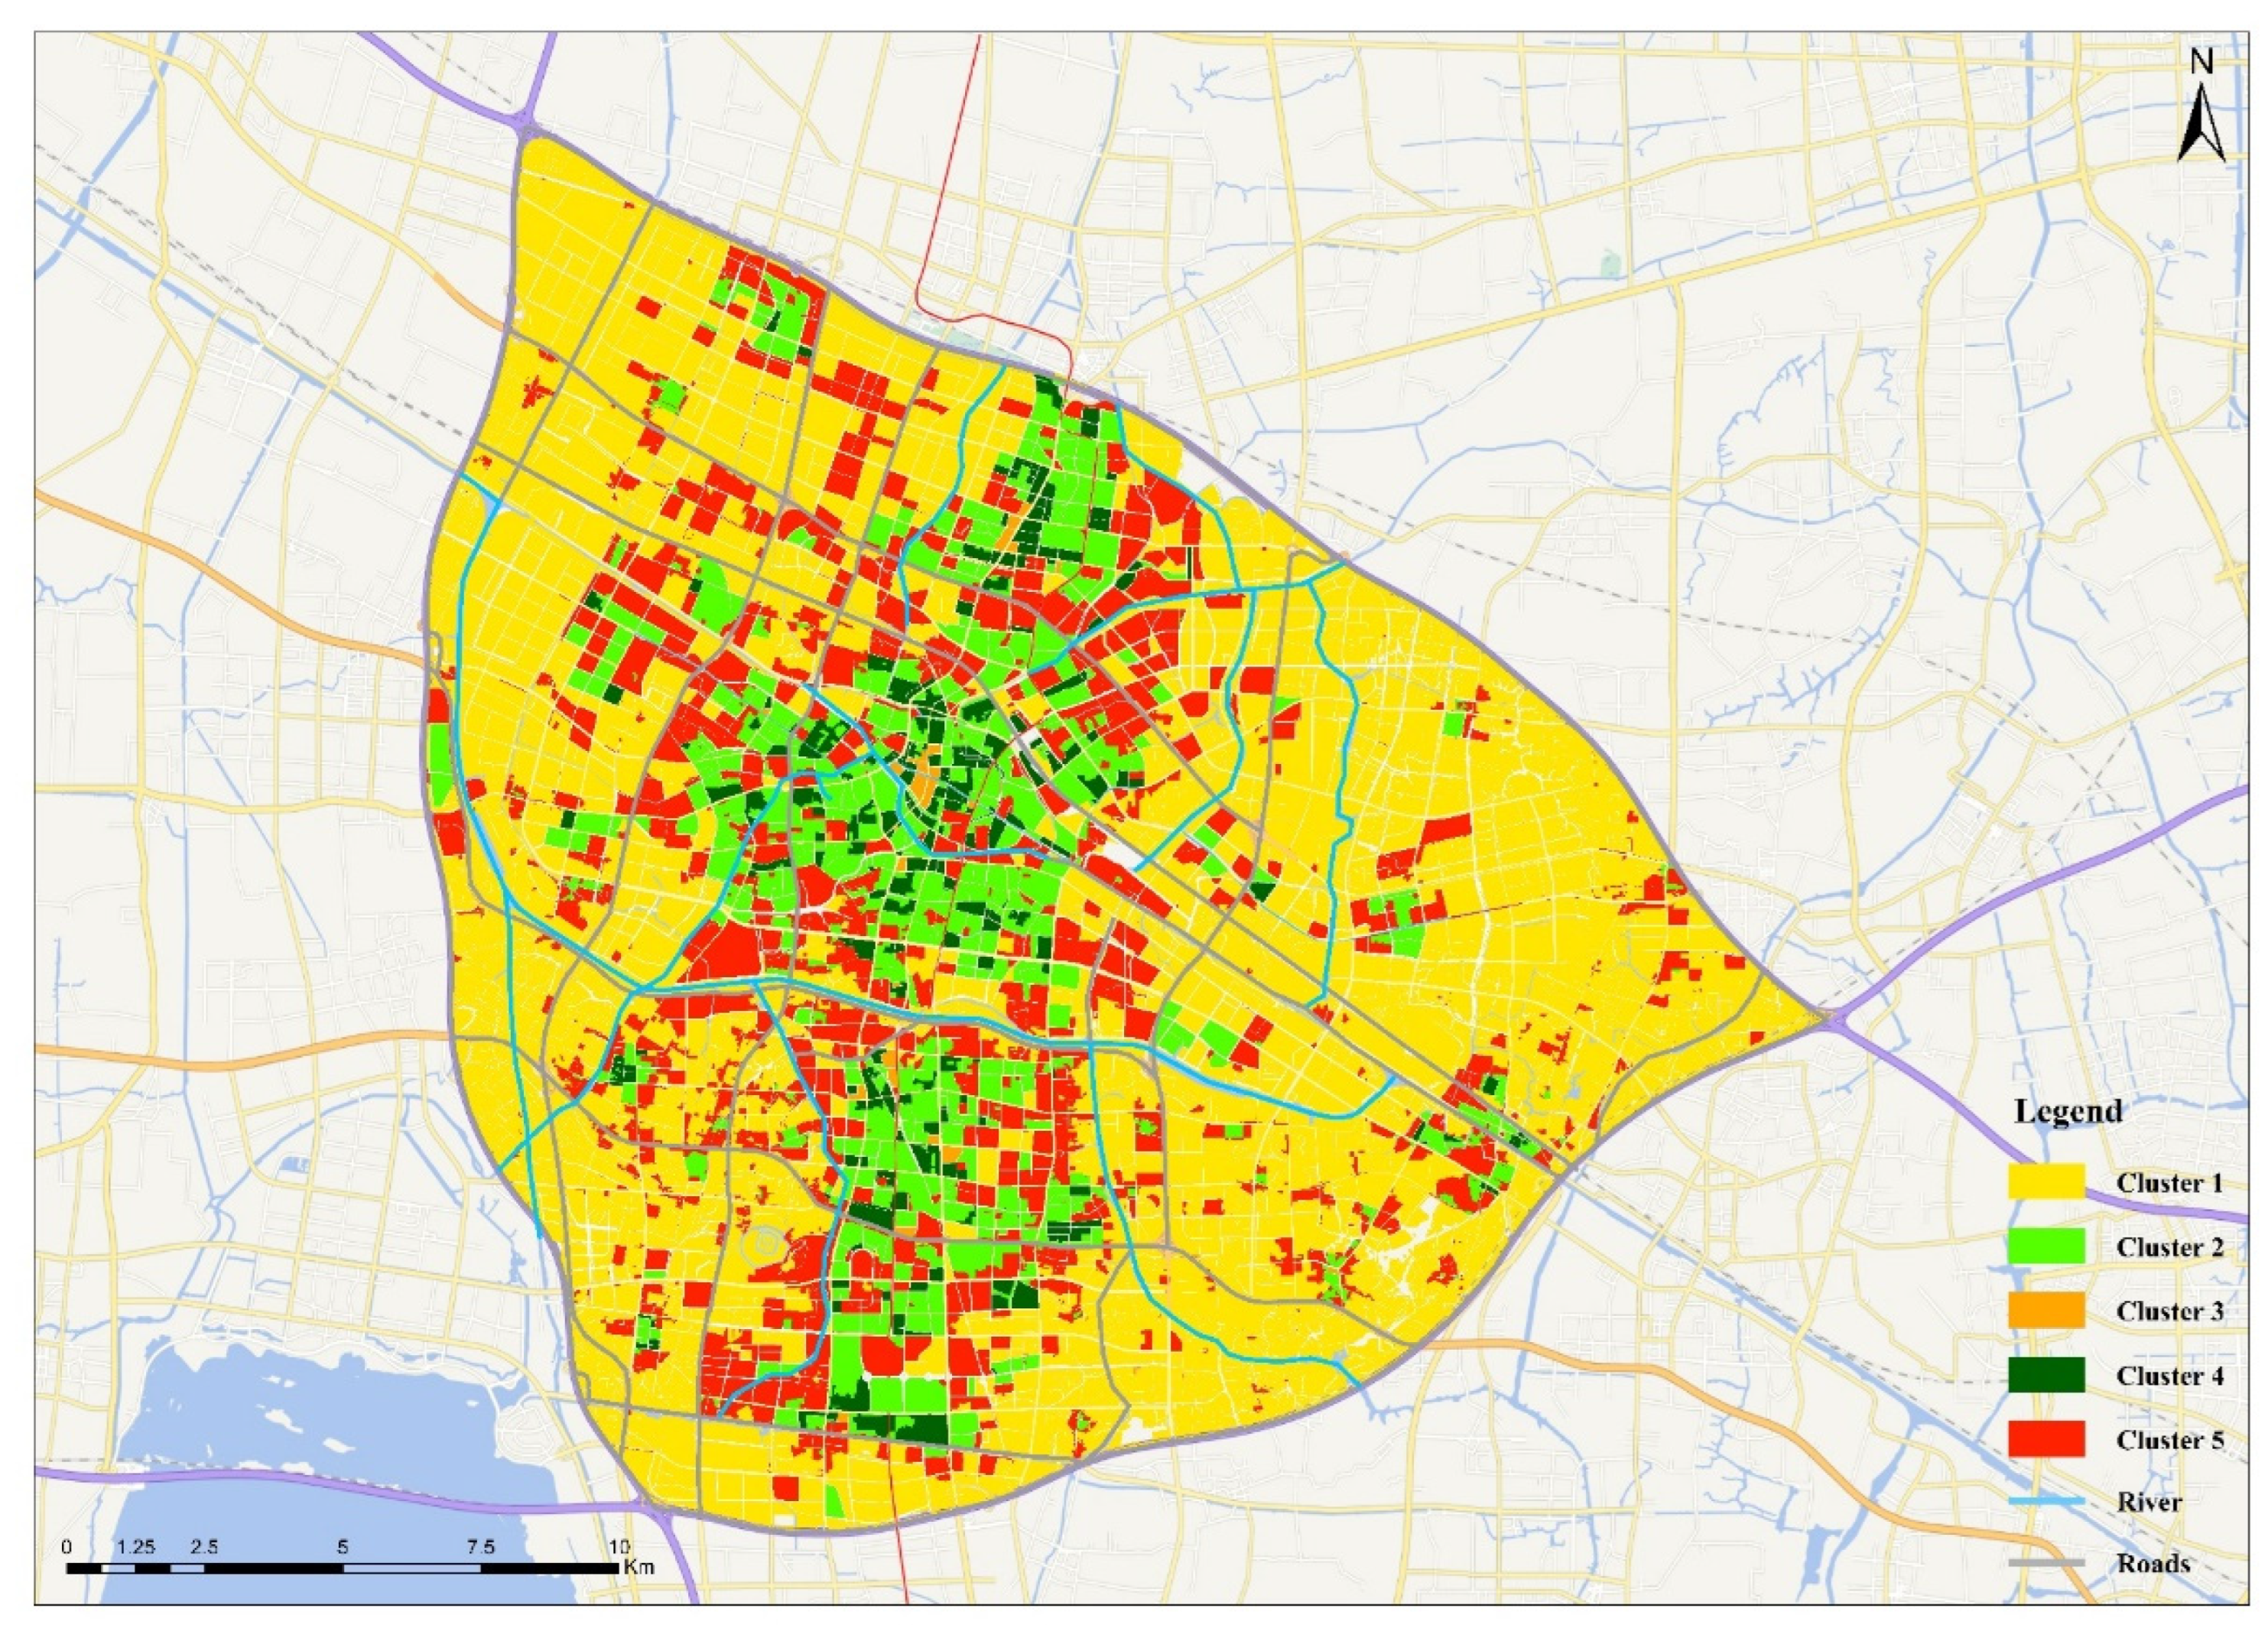
4.3. Urban Functional Zone Results
In Changzhou, five functional zones were identified using the proposed method (Figure 6 and Table 4). The regional clustering results are as follows:
Industrial zone (Cluster 1). This zone was mainly located at the edges of the study area and covered a large area. The overall FD value was low (Table 4), with a maximum value of only 42.986, and the distribution of POIs was sparse compared with those in other zones. The FD and CF values of the companies and industries were high. Thus, Cluster 1 is an industrial zone with large numbers of companies and industries and sparsely distributed infrastructure, and has the main production functions of the urban area.
Residential zone (Cluster 2). Cluster 2 had a high FD value (Table 4) of residences, residential buildings were densely distributed in the zone, and commercial and the number of community service POIs were also relatively high. Based on the CF value, all POIs in this zone were more relatively distributed. Therefore, Cluster 2 is a residential zone with densely distributed residential neighborhoods and rich functions.
Central business zone (Cluster 3). Cluster 3 was mainly distributed in the center of the study area, where commercial buildings such as South Street and Wanda Plaza are located. The POI frequency densities of businesses and life services were high in this zone (Table 4). Therefore, Cluster 3 is a central business zone with a high density of facilities and densely distributed business facilities, which take on the main commercial functions of the urban area.
Entertainment zone (Cluster 4). In this zone, the proportions of the hotel, finance, and entertainment POIs were higher than those in other districts. Some residential and living facilities were distributed in this zone, including People’s Park and Xintiandi Plaza. Therefore, this zone is an entertainment zone that undertakes urban leisure and entertainment functions.
Public services zone (Cluster 5). The tourism attraction and governmental organizations POIs within this zone were densely distributed and differed considerably from those in other zones (Table 4). Government buildings such as Changzhou Olympic Sports Center, train stations in Changzhou, and Changzhou library are located in this zone, as well as many restaurants, convenience stores, hotels, and other service establishments. Therefore, Cluster 5 is a public service zone that undertakes urban public service functions and meets the daily needs of people in the city.
The urban function identification results of some typical zones were compared with online maps and high-resolution remote sensing images for verification (Table 5). The results indicate that the proposed method can effectively identify urban functions in central Changzhou City with high recognition accuracy.
5. Discussion
5.1. Effect of Barriers on the Spread of POIs
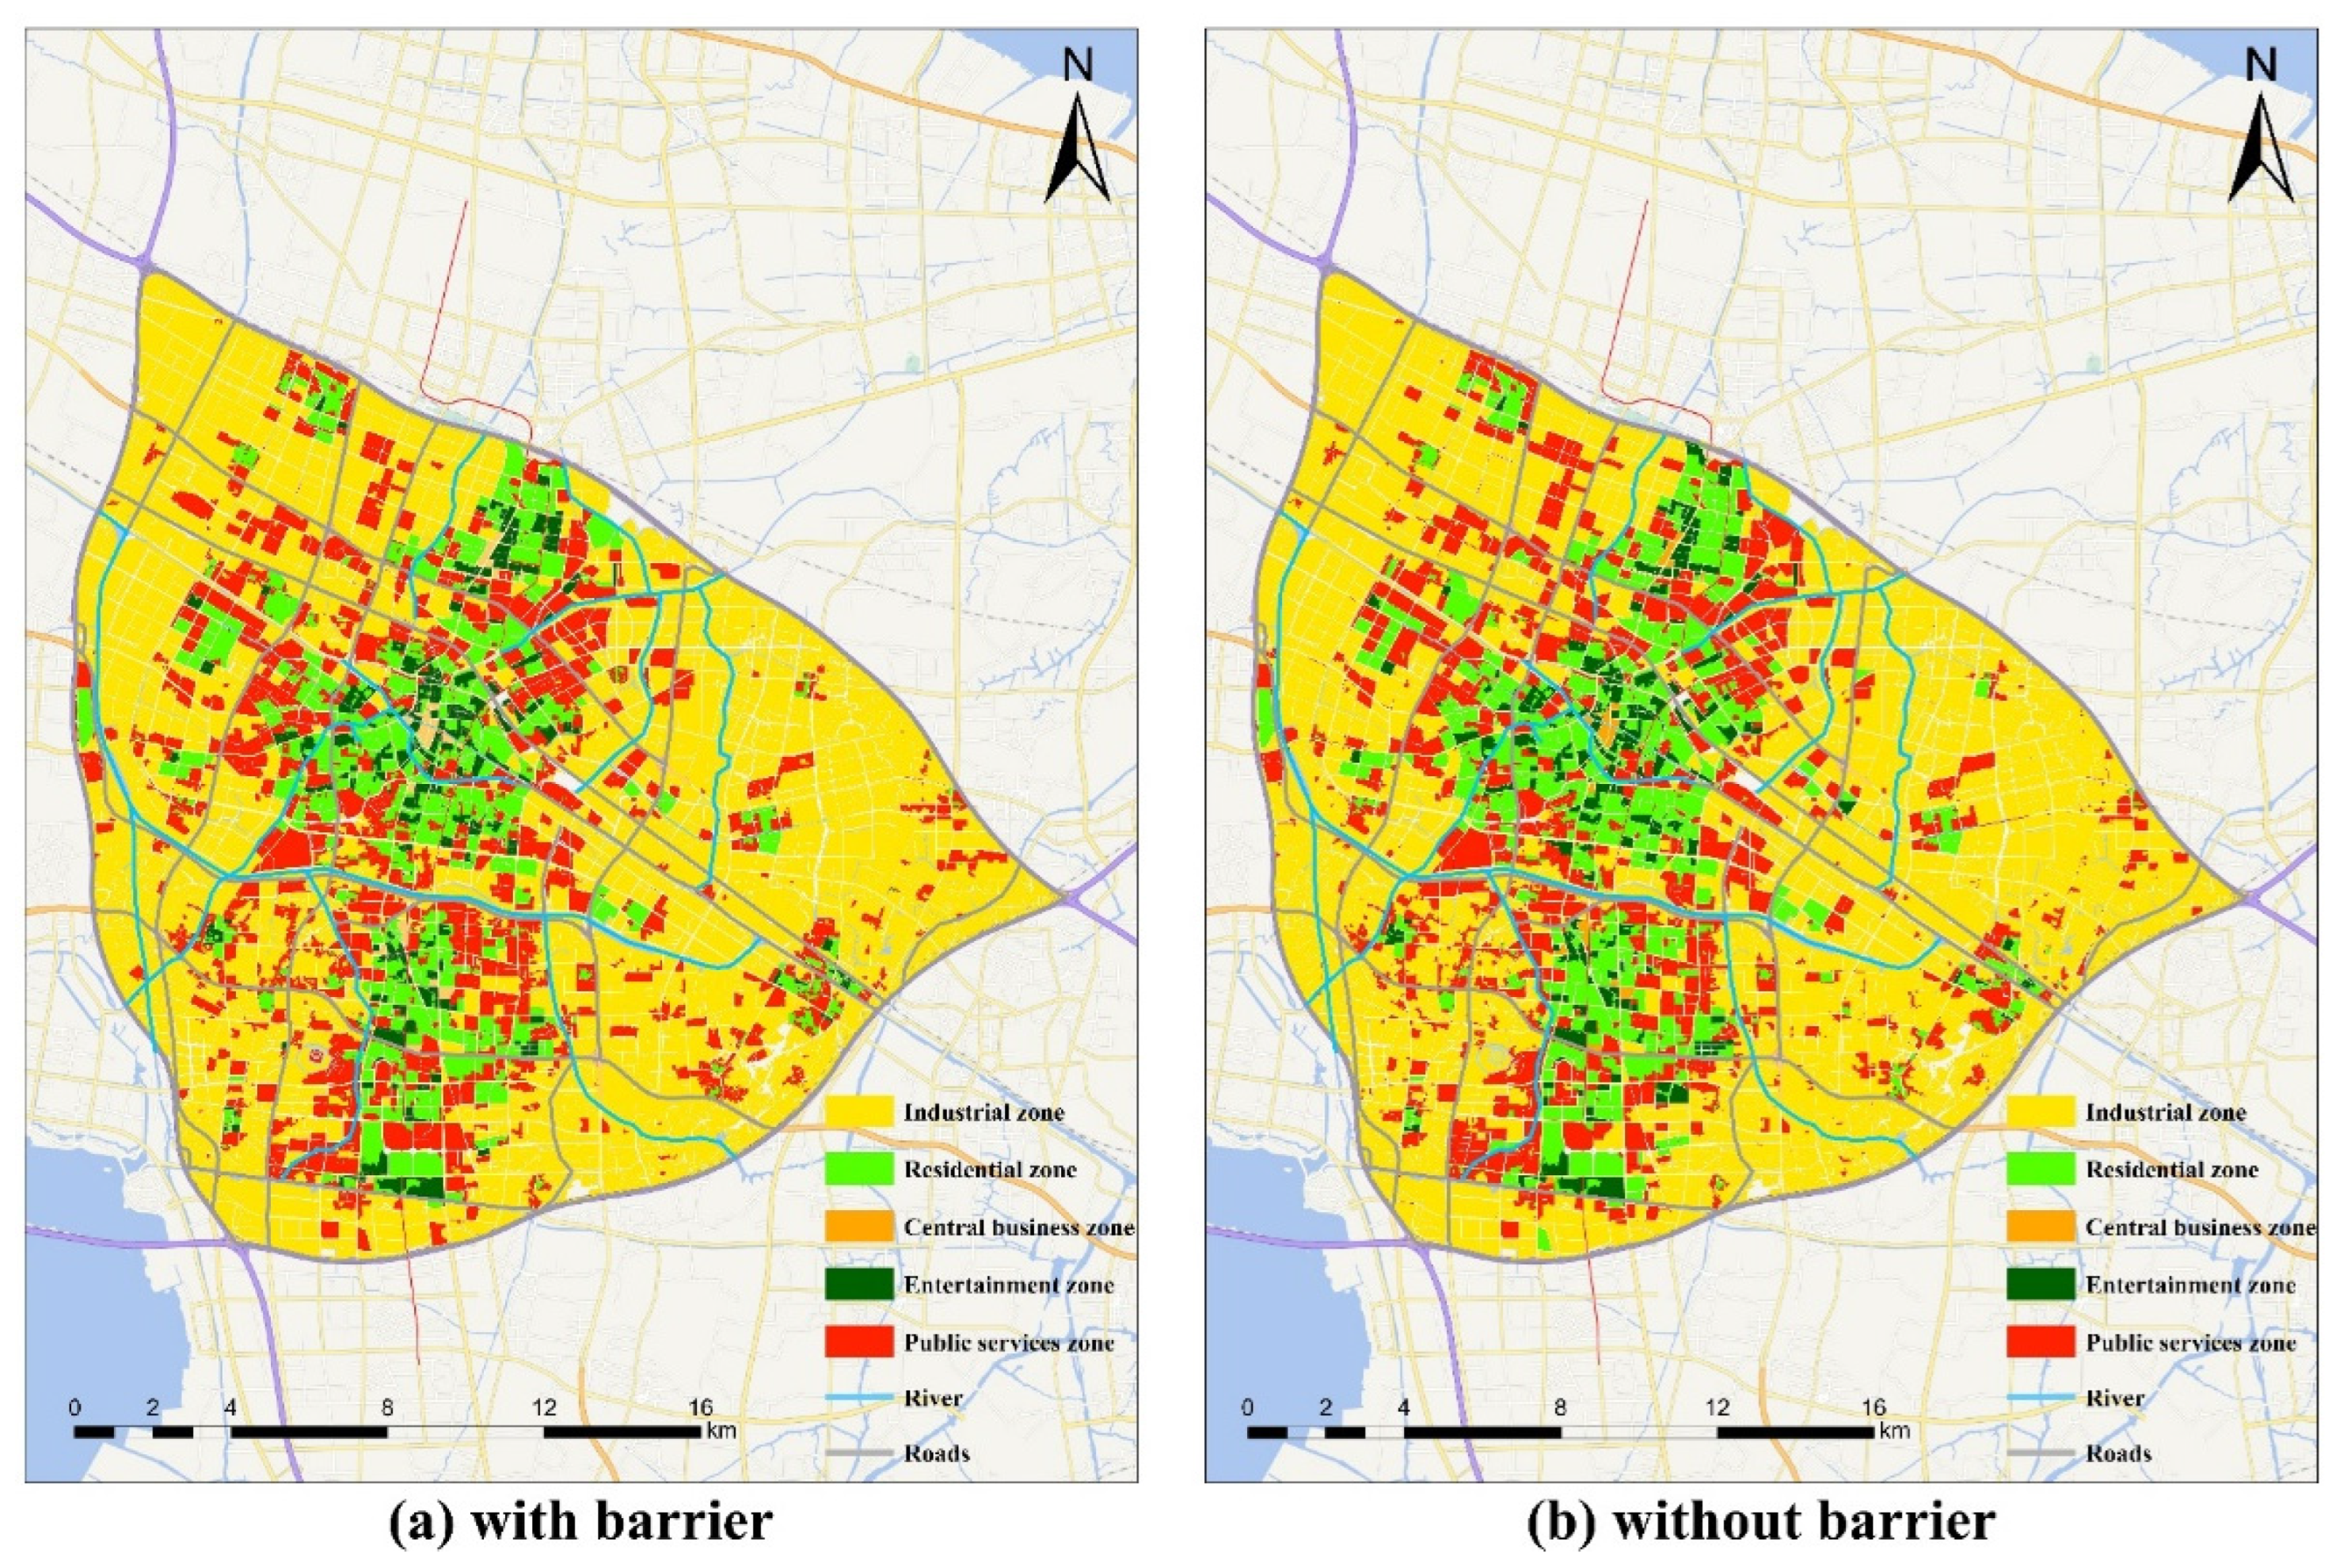
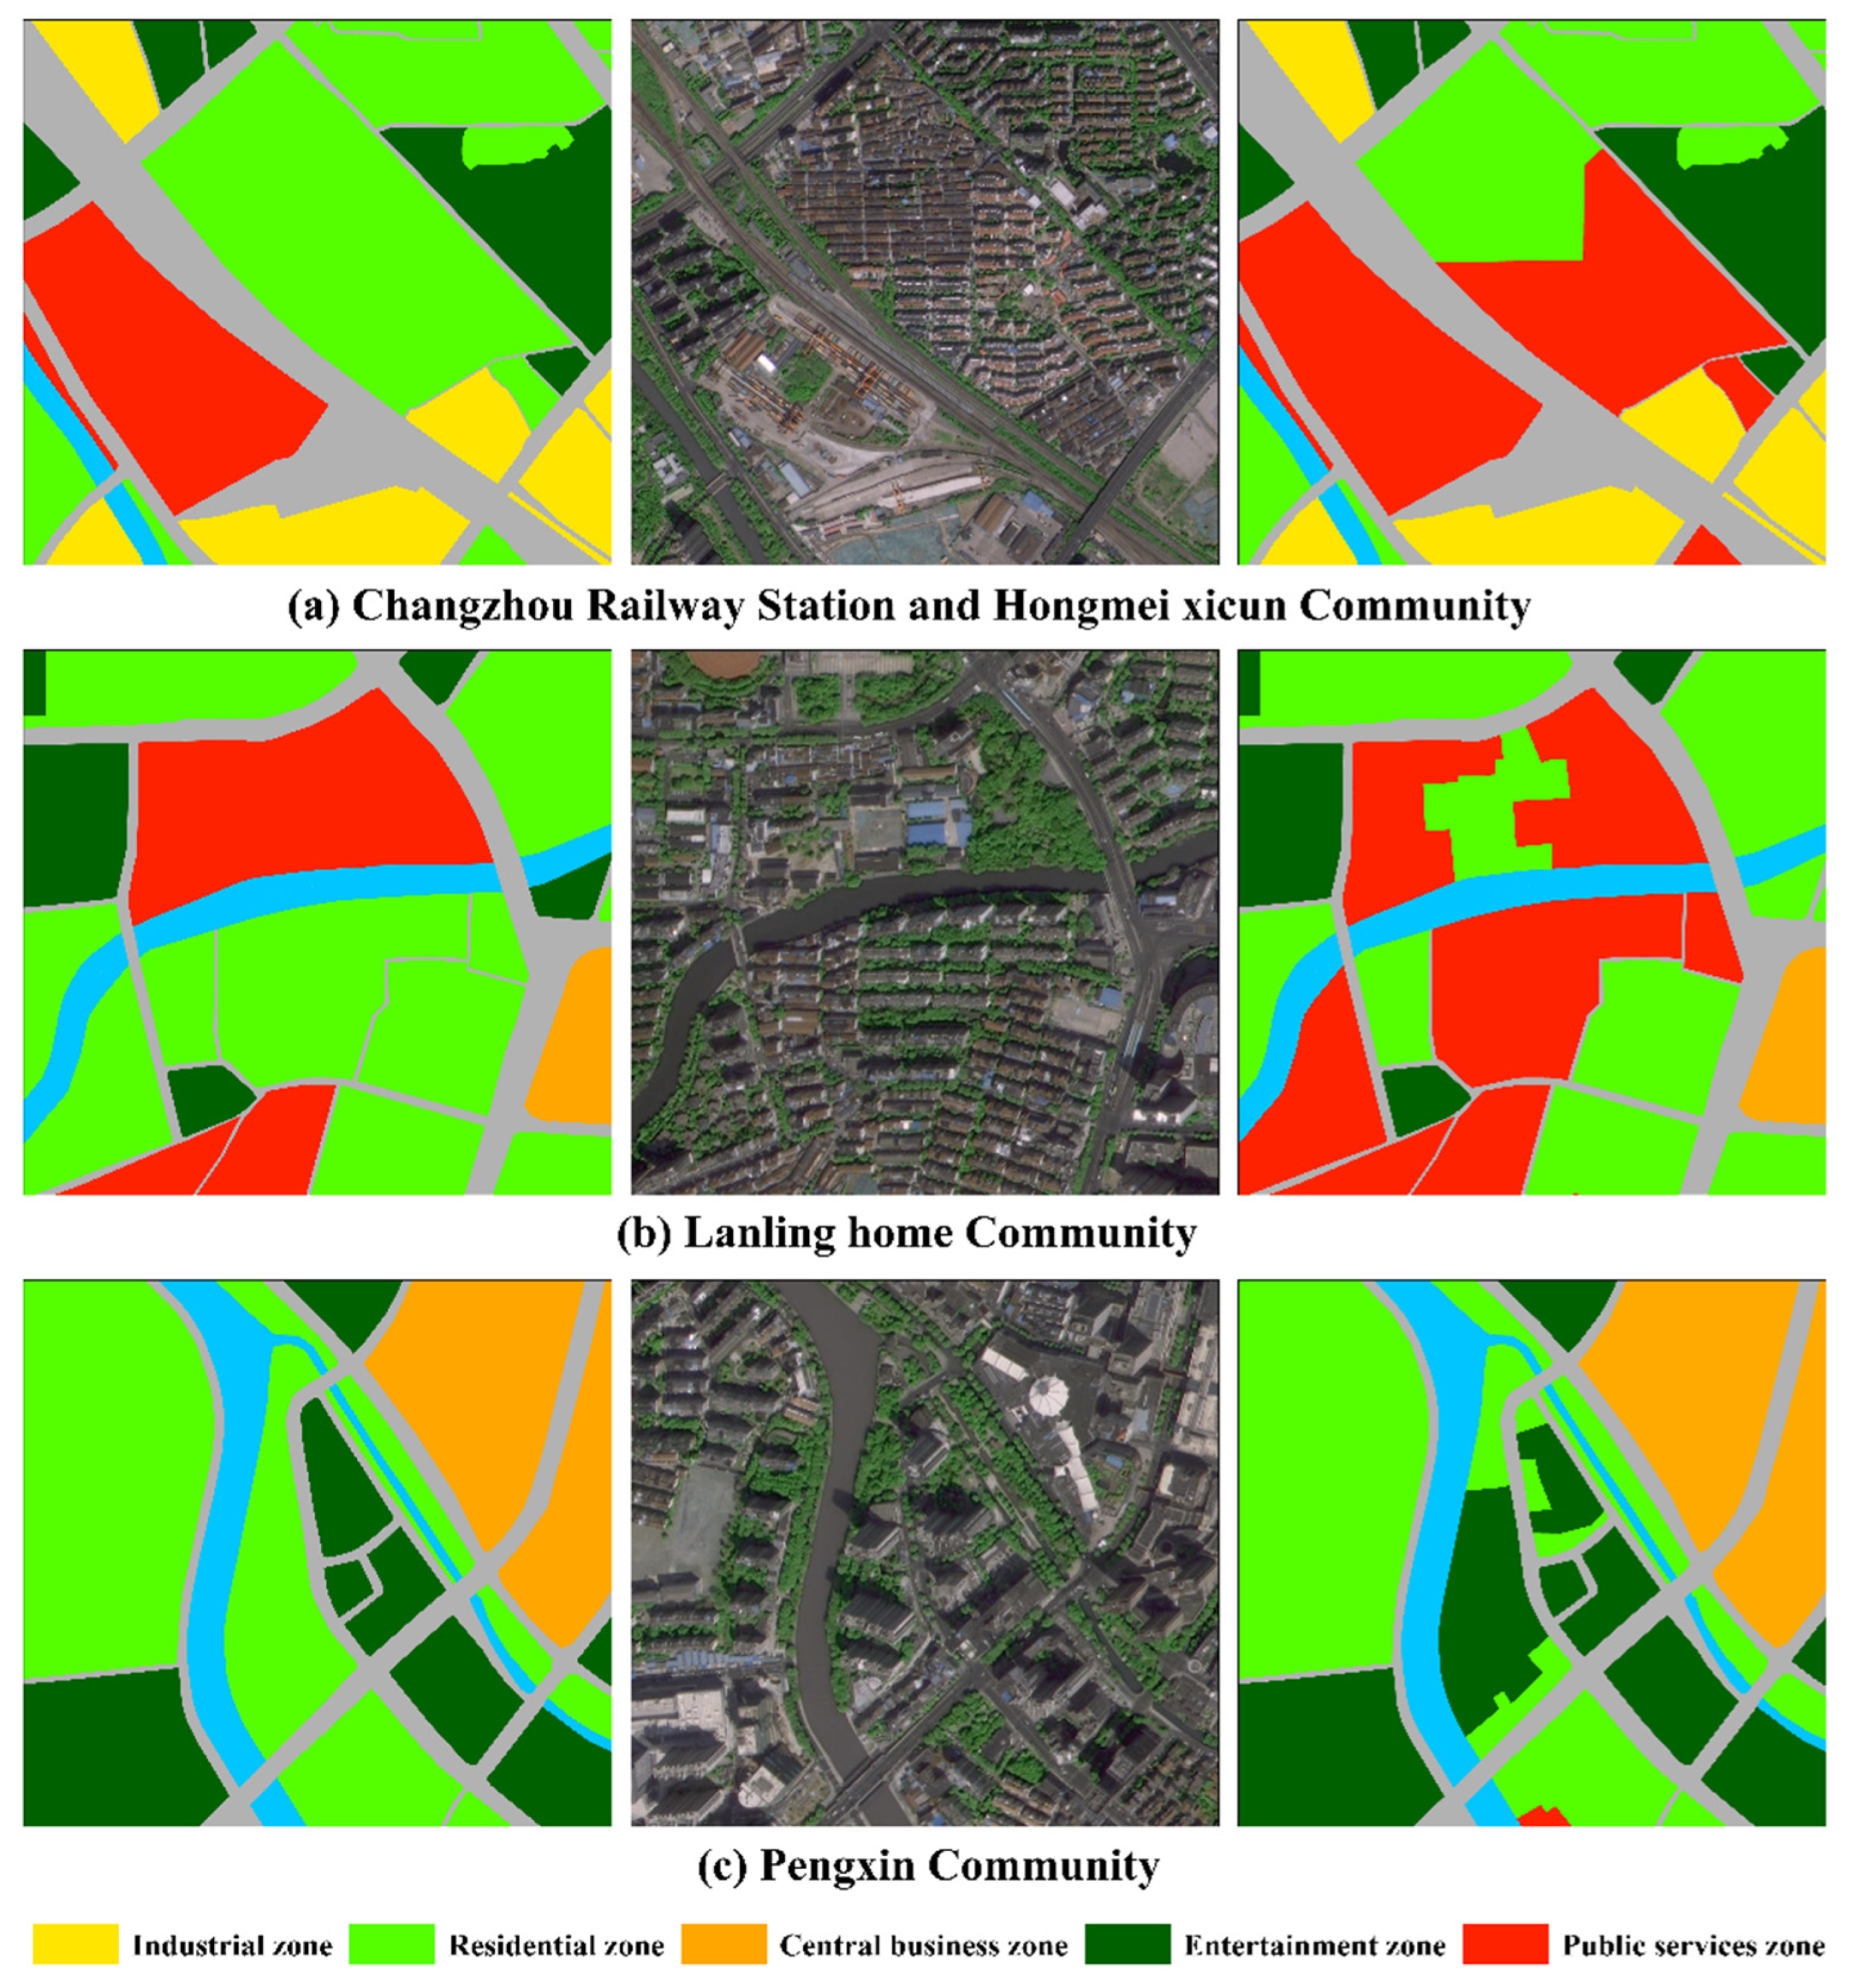
To investigate the effect of traffic on the spread of POIs and on urban functional zones, we conducted a comparative experiment without considering the traffic barrier phenomenon. The results with and without road and river barriers are shown in Figure 7. Without roads as barriers, the influence of some public service POIs near Changzhou Railway Station increased the values of the surrounding transportation facilities and factories, thereby causing the community to be incorrectly identified as a public service zone (Figure 8a). Figure 8b shows the Lanling home community. Without rivers as barriers, the interaction between the factory POIs on the northern side of the river and the residential POIs on the southern side caused the industries on the northern side to be incorrectly identified as residential zones, whereas the community on the southern side was identified as a public service zone. Figure 8c shows the Pengxin community. The Love Square area located in the northwest contained a large number of POIs related to entertainment and commerce. Without roads as barriers, the excessive commercial POIs reduced the role of residential POIs in the community, leading to incorrect identification. These examples indicate that the addition of barriers to kernel density analysis can effectively control the overspread of POIs and prevent the POIs of different zones from interacting with each other.
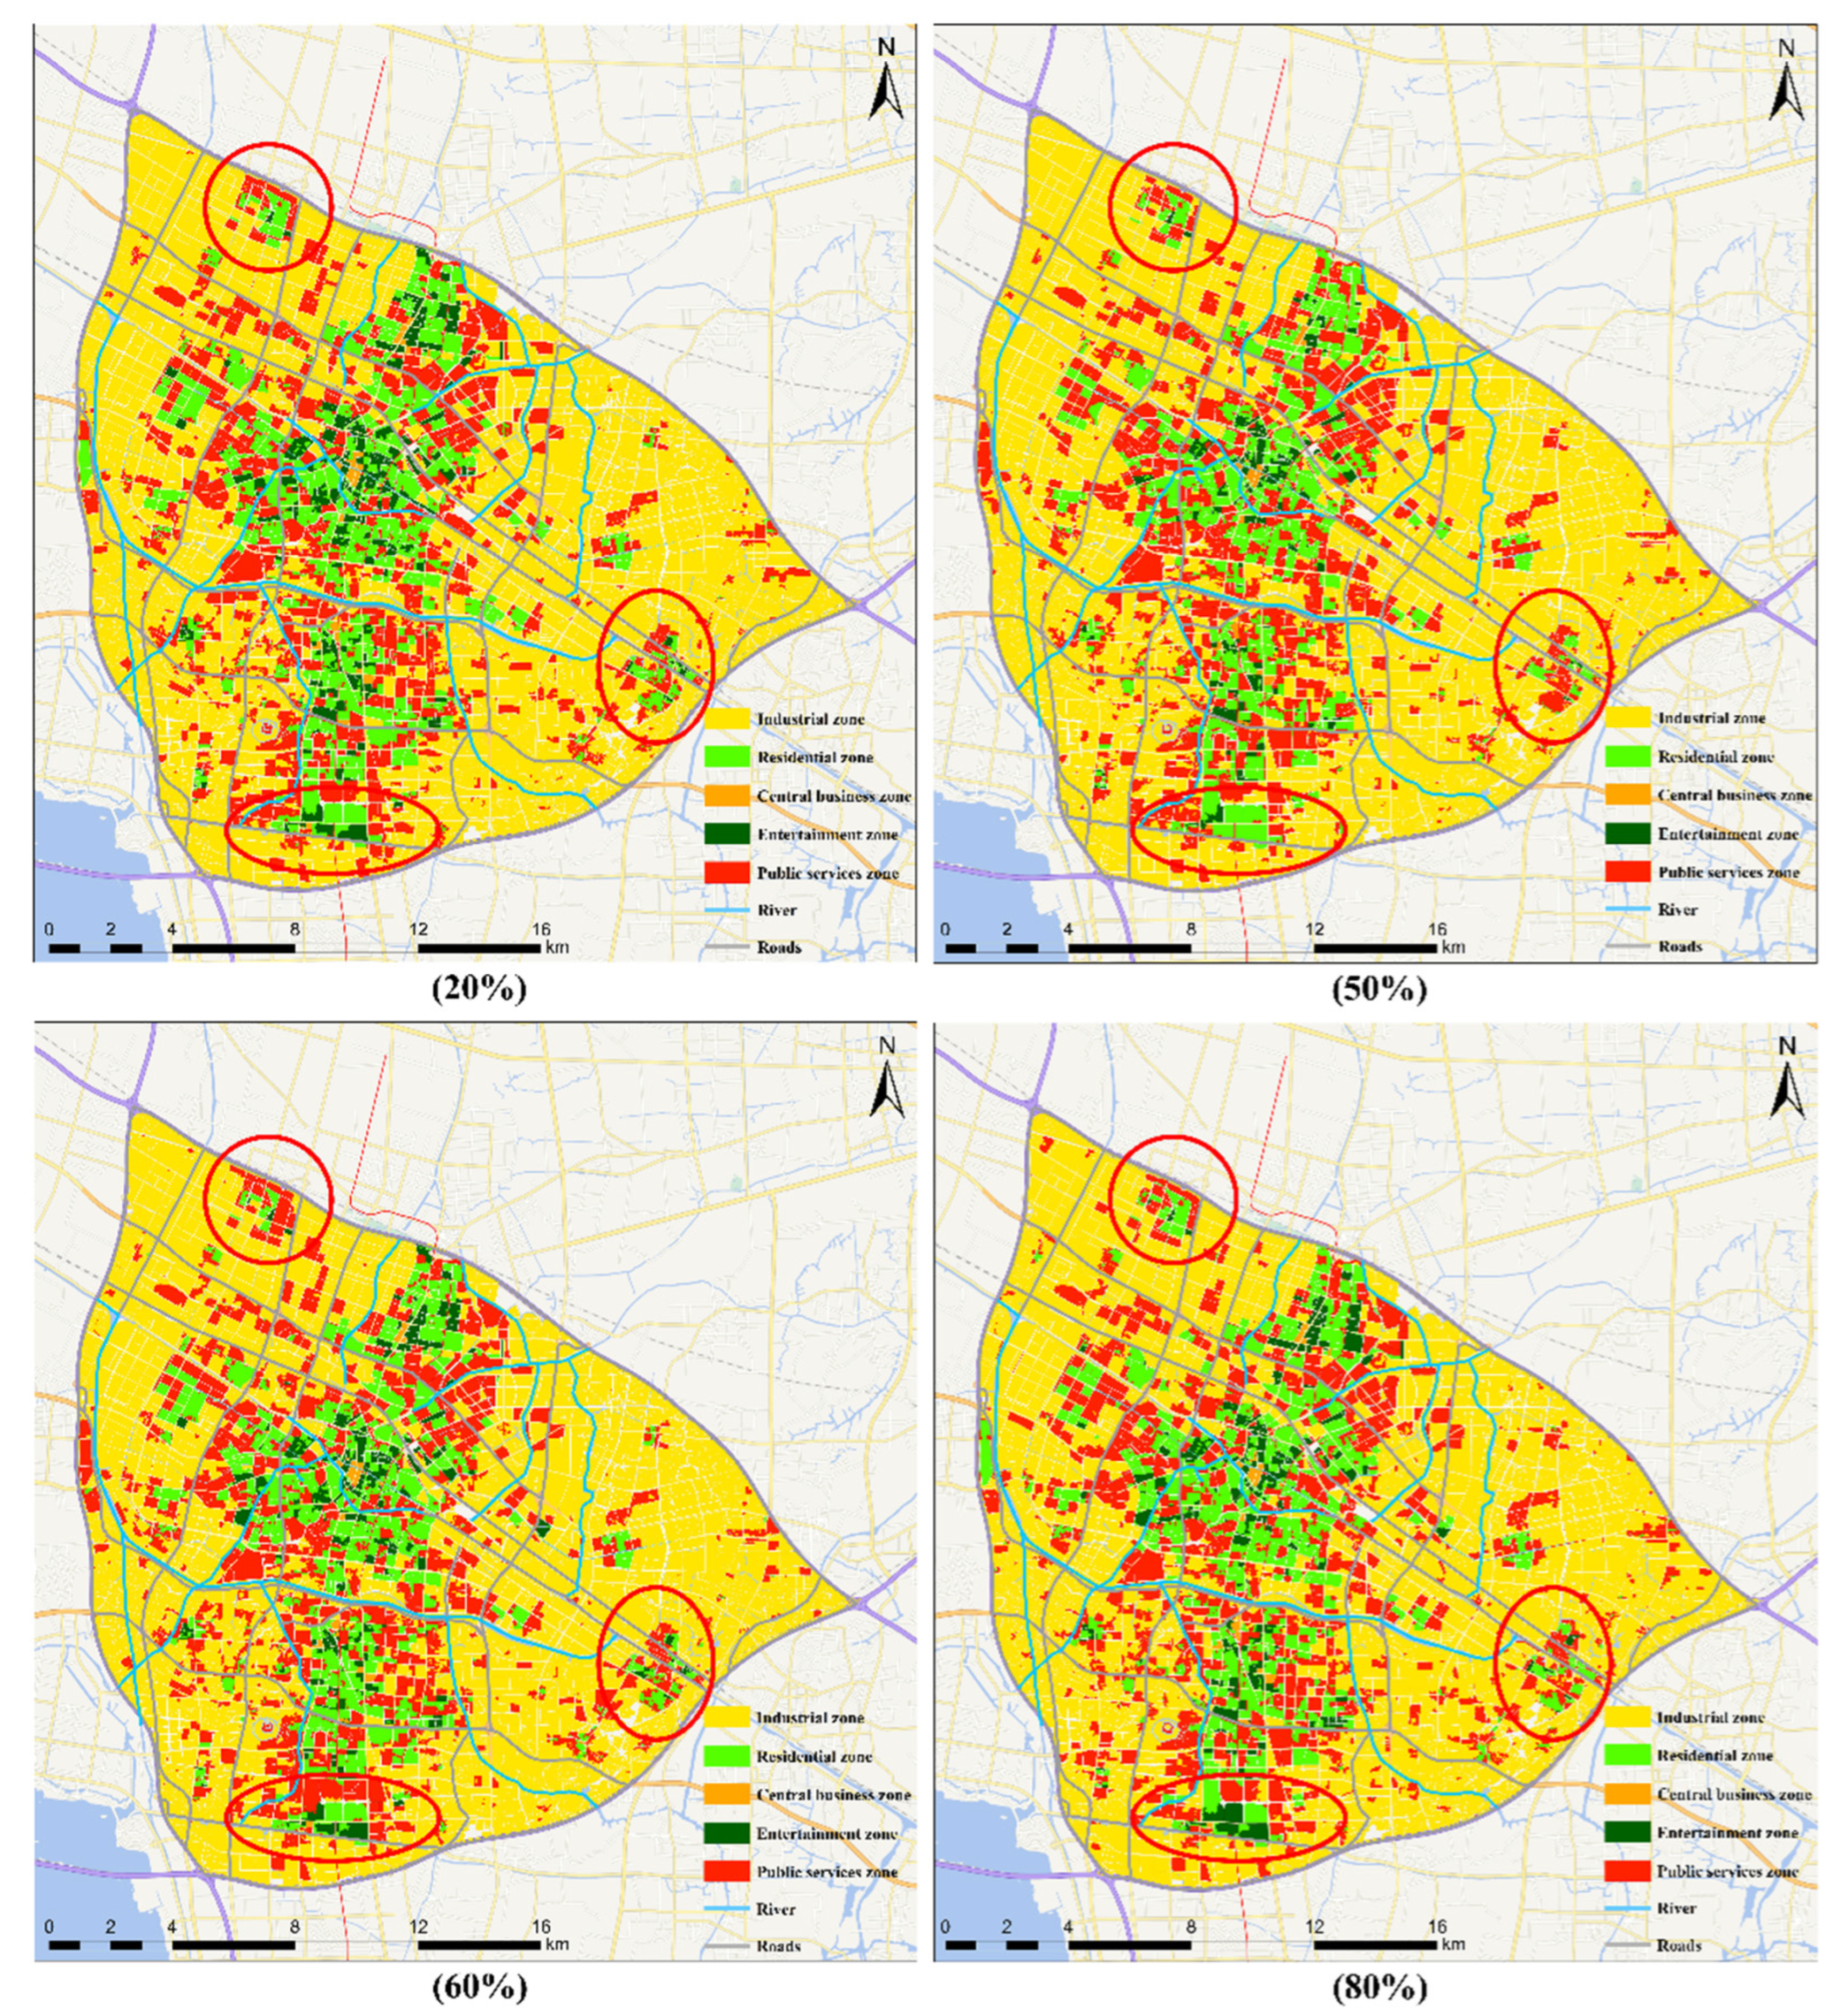
5.2. Stability of the Proposed Method against POI Dilution
To examine the stability of the proposed method, various types of POI points were removed from the total dataset using a random selection method at 20%, 30%, 50%, 60%, 80%, and 90% in equal proportions. The experimental result labels of the deleted data were statistically analyzed to determine their OA and kappa coefficients with the experimental result labels of the source data and the manual judgment of the true labels (Table 6 and Figure 9).
The results indicate that when the data dilution was less than 60%, the urban functional partitioning results did not differ considerably from the experimental results based on the original undiluted POIs, the label matching remained at 90%, and the overall accuracy with the manually identified labels remained above 70%. This indicates that the proposed method is stable when considering POI dilution and does not require a large number of POIs. However, when the amount of POI data fell below a certain threshold, the model could not obtain sufficient information from the POIs to correctly identify urban functions. In this scenario, it would be necessary to supplement the data sources to identify urban functional areas more comprehensively and accurately.
6. Conclusions
In this study, a new method for the identification of urban functional zones based on POI density and MGAE was proposed. The proposed method was applied in a case study of Changzhou City and the results were compared with those obtained using the LDA, TF-IDF, and mSDA methods for validation. The main conclusions are as follows:
- Kernel density analysis is effective for enhancing sparsely and unevenly distributed POIs to identify urban functional zones by obtaining the value of POI density and spreading the influences of POIs from points of origin to their surroundings. Thus, patches that do not contain POIs can also acquire the social features of the surrounding POIs, thereby solving the problem of uneven POI distribution. Moreover, kernel density analysis with barriers performed better in terms of representing the social features of the study area.
- Combining the spatial adjacency of the analysis units and social features can improve the performance of urban functional zone identification. This method addresses the problem of ignoring the functional correlations between units and more comprehensively explores the potential social information of POIs within units. The experiments demonstrate that our model performed better than the LDA, TF-IDF, and mSDA models, and the recognition accuracy was approximately 20% better.
In future work, we will integrate multiple source data of cities into the model. For example, social data such as vehicle trajectory data and mobile phone data reflect human activities to some extent, which have effects on urban functional zone. Moreover, optimizing the methods for quantifying the spillover effect of different social data on urban functional zoning or other applications remains to be explored. In addition, different applications of the results of urban functional zoning should be evaluated. A clear understanding the different types of urban functional zones, the structural patterns among these, and the evolution and current status of urban function will serve to provide guidance for urban governance and planning.
Author Contributions
Conceptualization, Runpeng Xu and Zhenjie Chen; methodology, Runpeng Xu; software, Runpeng Xu; validation, Runpeng Xu and Zhenjie Chen; formal analysis, Runpeng Xu; investigation, Runpeng Xu; resources, Runpeng Xu and Zhenjie Chen; data curation, Runpeng Xu; writing—original draft preparation, Runpeng Xu; writing—review and editing, Runpeng Xu, Zhenjie Chen, Feixue Li, and Chen Zhou. All authors have read and agreed to the published version of the manuscript.
Funding
This research was funded by the National Key Research & Development Program of China (No. 2022YFC3800802) and the National Natural Science Foundation of China (No. 42171396).
Data Availability Statement
The POI data are openly available at https://lbsyun.baidu.com/products/search, 17 May 2022. Map World data and the remote sensing images were obtained from https://www.tianditu.gov.cn/, 13 April 2023. The source code used in this study is available at https://github.com/xrp123/kernel_MGAE, 22 May 2023.
Acknowledgments
The authors thank the managing editor and anonymous referees for their constructive comments.
Conflicts of Interest
The authors declare no conflict of interest.
References
- Xie, L.; Feng, X.; Zhang, C.; Dong, Y.; Huang, J.; Liu, K. Identification of Urban Functional Areas Based on the Multimodal Deep Learning Fusion of High-Resolution Remote Sensing Images and Social Perception Data. Buildings 2022, 12, 556. [Google Scholar] [CrossRef]
- Bao, H.; Ming, D.; Guo, Y.; Zhang, K.; Zhou, K.; Du, S. DFCNN-Based Semantic Recognition of Urban Functional Zones by Integrating Remote Sensing Data and POI Data. Remote Sens. 2020, 12, 1088. [Google Scholar] [CrossRef]
- Ma, S.; Long, Y. Functional Urban Area Delineations of Cities on the Chinese Mainland Using Massive Didi Ride-Hailing Records. Cities 2020, 97, 102532. [Google Scholar] [CrossRef]
- Zhang, C.; Xu, L.; Yan, Z.; Wu, S. A GloVe-Based POI Type Embedding Model for Extracting and Identifying Urban Functional Regions. ISPRS Int. J. Geo-Inf. 2021, 10, 372. [Google Scholar] [CrossRef]
- Tu, W.; Cao, J.; Yue, Y.; Shaw, S.-L.; Zhou, M.; Wang, Z.; Chang, X.; Xu, Y.; Li, Q. Coupling Mobile Phone and Social Media Data: A New Approach to Understanding Urban Functions and Diurnal Patterns. Int. J. Geogr. Inf. Sci. 2017, 31, 2331–2358. [Google Scholar] [CrossRef]
- Chuai, X.; Feng, J. High Resolution Carbon Emissions Simulation and Spatial Heterogeneity Analysis Based on Big Data in Nanjing City, China. Sci. Total Environ. 2019, 686, 828–837. [Google Scholar] [CrossRef]
- Zheng, Y.; Du, S.; Zhang, X.; Bai, L.; Wang, H. Estimating Carbon Emissions in Urban Functional Zones Using Multi-Source Data: A Case Study in Beijing. Build. Environ. 2022, 212, 108804. [Google Scholar] [CrossRef]
- Shi, B.; Xiang, W.; Bai, X.; Wang, Y.; Geng, G.; Zheng, J. District Level Decoupling Analysis of Energy-Related Carbon Dioxide Emissions from Economic Growth in Beijing, China. Energy Rep. 2022, 8, 2045–2051. [Google Scholar] [CrossRef]
- Dai, S.; Zuo, S.; Ren, Y. A Spatial Database of CO2 Emissions, Urban Form Fragmentation and City-Scale Effect Related Impact Factors for the Low Carbon Urban System in Jinjiang City, China. Data Brief 2020, 29, 105274. [Google Scholar] [CrossRef]
- Shi, C.; Guo, N.; Zeng, L.; Wu, F. How Climate Change Is Going to Affect Urban Livability in China. Clim. Serv. 2022, 26, 100284. [Google Scholar] [CrossRef]
- Li, T.; Zheng, X.; Zhang, C.; Wang, R.; Liu, J. Mining Spatial Correlation Patterns of the Urban Functional Areas in Urban Agglomeration: A Case Study of Four Typical Urban Agglomerations in China. Land 2022, 11, 870. [Google Scholar] [CrossRef]
- Wu, Y.; Yuan, J. Is There a Regulation in the Expansion of Urban Spatial Structure? Empirical Study from the Main Urban Area in Zhengzhou, China. Sustainability 2022, 14, 2883. [Google Scholar] [CrossRef]
- Wang, M.; He, Y.; Meng, H.; Zhang, Y.; Zhu, B.; Mango, J.; Li, X. Assessing Street Space Quality Using Street View Imagery and Function-Driven Method: The Case of Xiamen, China. ISPRS Int. J. Geo-Inf. 2022, 11, 282. [Google Scholar] [CrossRef]
- Shi, T.; Hu, X.; Guo, L.; Su, F.; Tu, W.; Hu, Z.; Liu, H.; Yang, C.; Wang, J.; Zhang, J.; et al. Digital Mapping of Zinc in Urban Topsoil Using Multisource Geospatial Data and Random Forest. Sci. Total Environ. 2021, 792, 148455. [Google Scholar] [CrossRef]
- Yu, Z.; Jing, Y.; Yang, G.; Sun, R. A New Urban Functional Zone-Based Climate Zoning System for Urban Temperature Study. Remote Sens. 2021, 13, 251. [Google Scholar] [CrossRef]
- Huang, X.; Wang, Y. Investigating the Effects of 3D Urban Morphology on the Surface Urban Heat Island Effect in Urban Functional Zones by Using High-Resolution Remote Sensing Data: A Case Study of Wuhan, Central China. ISPRS J. Photogramm. Remote Sens. 2019, 152, 119–131. [Google Scholar] [CrossRef]
- Chen, S.; Haase, D.; Qureshi, S.; Firozjaei, M.K. Integrated Land Use and Urban Function Impacts on Land Surface Temperature: Implications on Urban Heat Mitigation in Berlin with Eight-Type Spaces. Sustain. Cities Soc. 2022, 83, 103944. [Google Scholar] [CrossRef]
- Wang, H.; Li, B.; Yi, T.; Wu, J. Heterogeneous Urban Thermal Contribution of Functional Construction Land Zones: A Case Study in Shenzhen, China. Remote Sens. 2022, 14, 1851. [Google Scholar] [CrossRef]
- Yang, Z.; Chen, Y.; Guo, G.; Zheng, Z.; Wu, Z. Characteristics of Land Surface Temperature Clusters: Case Study of the Central Urban Area of Guangzhou. Sustain. Cities Soc. 2021, 73, 103140. [Google Scholar] [CrossRef]
- Chen, Y.; Chen, X.; Liu, Z.; Li, X. Understanding the Spatial Organization of Urban Functions Based on Co-Location Patterns Mining: A Comparative Analysis for 25 Chinese Cities. Cities 2020, 97, 102563. [Google Scholar] [CrossRef]
- Cao, R.; Tu, W.; Yang, C.; Li, Q.; Liu, J.; Zhu, J.; Zhang, Q.; Li, Q.; Qiu, G. Deep Learning-Based Remote and Social Sensing Data Fusion for Urban Region Function Recognition. ISPRS J. Photogramm. Remote Sens. 2020, 163, 82–97. [Google Scholar] [CrossRef]
- Zhang, X.; Du, S.; Wang, Q. Hierarchical Semantic Cognition for Urban Functional Zones with VHR Satellite Images and POI Data. ISPRS J. Photogramm. Remote Sens. 2017, 132, 170–184. [Google Scholar] [CrossRef]
- Rosier, J.F.; Taubenböck, H.; Verburg, P.H.; van Vliet, J. Fusing Earth Observation and Socioeconomic Data to Increase the Transferability of Large-Scale Urban Land Use Classification. Remote Sens. Environ. 2022, 278, 113076. [Google Scholar] [CrossRef]
- Lu, W.; Tao, C.; Li, H.; Qi, J.; Li, Y. A Unified Deep Learning Framework for Urban Functional Zone Extraction Based on Multi-Source Heterogeneous Data. Remote Sens. Environ. 2022, 270, 112830. [Google Scholar] [CrossRef]
- Yang, C.; Yu, B.; Chen, Z.; Song, W.; Zhou, Y.; Li, X.; Wu, J. A Spatial-Socioeconomic Urban Development Status Curve from NPP-VIIRS Nighttime Light Data. Remote Sens. 2019, 11, 2398. [Google Scholar] [CrossRef]
- Guo, B.; Zhang, D.; Zhang, D.; Su, Y.; Wang, X.; Bian, Y. Detecting Spatiotemporal Dynamic of Regional Electric Consumption Using NPP-VIIRS Nighttime Stable Light Data–A Case Study of Xi’an, China. IEEE Access 2020, 8, 171694–171702. [Google Scholar] [CrossRef]
- Chen, S.; Zhang, H.; Yang, H. Urban Functional Zone Recognition Integrating Multisource Geographic Data. Remote Sens. 2021, 13, 4732. [Google Scholar] [CrossRef]
- Zhai, W.; Bai, X.; Shi, Y.; Han, Y.; Peng, Z.-R.; Gu, C. Beyond Word2vec: An Approach for Urban Functional Region Extraction and Identification by Combining Place2vec and POIs. Comput. Environ. Urban Syst. 2019, 74, 1–12. [Google Scholar] [CrossRef]
- Deng, Y.; Chen, R.; Yang, J.; Li, Y.; Jiang, H.; Liao, W.; Sun, M. Identify Urban Building Functions with Multisource Data: A Case Study in Guangzhou, China. Int. J. Geogr. Inf. Sci. 2022, 36, 2060–2085. [Google Scholar] [CrossRef]
- Chen, Y.; Yang, J.; Yang, R.; Xiao, X.; Xia, J.C. Contribution of Urban Functional Zones to the Spatial Distribution of Urban Thermal Environment. Build. Environ. 2022, 216, 109000. [Google Scholar] [CrossRef]
- Crooks, A.; Pfoser, D.; Jenkins, A.; Croitoru, A.; Stefanidis, A.; Smith, D.; Karagiorgou, S.; Efentakis, A.; Lamprianidis, G. Crowdsourcing Urban Form and Function. Int. J. Geogr. Inf. Sci. 2015, 29, 720–741. [Google Scholar] [CrossRef]
- Yuan, N.J.; Zheng, Y.; Xie, X.; Wang, Y.; Zheng, K.; Xiong, H. Discovering Urban Functional Zones Using Latent Activity Trajectories. IEEE Trans. Knowl. Data Eng. 2015, 27, 712–725. [Google Scholar] [CrossRef]
- Zhang, D.; Wan, J.; He, Z.; Zhao, S.; Fan, K.; Park, S.O.; Jiang, Z. Identifying Region-Wide Functions Using Urban Taxicab Trajectories. ACM Trans. Embed. Comput. Syst. 2016, 15, 36:1–36:19. [Google Scholar] [CrossRef]
- Zhou, T.; Liu, X.; Qian, Z.; Chen, H.; Tao, F. Automatic Identification of the Social Functions of Areas of Interest (AOIs) Using the Standard Hour-Day-Spectrum Approach. ISPRS Int. J. Geo-Inf. 2019, 9, 7. [Google Scholar] [CrossRef]
- Hu, S.; Gao, S.; Wu, L.; Xu, Y.; Zhang, Z.; Cui, H.; Gong, X. Urban Function Classification at Road Segment Level Using Taxi Trajectory Data: A Graph Convolutional Neural Network Approach. Comput. Environ. Urban Syst. 2021, 87, 101619. [Google Scholar] [CrossRef]
- Qi, T.; Zhang, W.; Yuan, T. Research on the Division of Functional Zones in Downtown Beijing Under the Background of Big Data. In Proceedings of the Spatial Data and Intelligence: First International Conference, SpatialDI 2020, Shanzhen, China, 8–9 May 2020. [Google Scholar]
- Shen, Y.; Karimi, K. Urban Function Connectivity: Characterisation of Functional Urban Streets with Social Media Check-in Data. Cities 2016, 55, 9–21. [Google Scholar] [CrossRef]
- Wu, Y.; Qiao, Y.; Yang, J. Urban Functional Area Division Based on Cell Tower Classification. IEEE Access 2019, 7, 171503–171514. [Google Scholar] [CrossRef]
- Song, Z.; Wang, H.; Qin, S.; Li, X.; Yang, Y.; Wang, Y.; Meng, P. Building-Level Urban Functional Area Identification Based on Multi-Attribute Aggregated Data from Cell Phones—A Method Combining Multidimensional Time Series with a SOM Neural Network. ISPRS Int. J. Geo-Inf. 2022, 11, 72. [Google Scholar] [CrossRef]
- Li, X.; Deng, Y.; Yuan, X.; Wang, Z.; Gao, C. Data-Driven Behavioral Analysis and Applications: A Case Study in Changchun, China. Phys. Stat. Mech. Its Appl. 2022, 596, 127164. [Google Scholar] [CrossRef]
- Cai, L.; Zhang, L.; Liang, Y.; Li, J. Discovery of Urban Functional Regions Based on Node2vec. Appl. Intell. 2022, 52, 16886–16899. [Google Scholar] [CrossRef]
- Hu, S.; He, Z.; Wu, L.; Yin, L.; Xu, Y.; Cui, H. A Framework for Extracting Urban Functional Regions Based on Multiprototype Word Embeddings Using Points-of-Interest Data. Comput. Environ. Urban Syst. 2020, 80, 101442. [Google Scholar] [CrossRef]
- Yao, Y.; Li, X.; Liu, X.; Liu, P.; Liang, Z.; Zhang, J.; Mai, K. Sensing Spatial Distribution of Urban Land Use by Integrating Points-of-Interest and Google Word2Vec Model. Int. J. Geogr. Inf. Sci. 2017, 31, 825–848. [Google Scholar] [CrossRef]
- Zhang, Y.; Chen, Z.; Zheng, X.; Chen, N.; Wang, Y. Extracting the Location of Flooding Events in Urban Systems and Analyzing the Semantic Risk Using Social Sensing Data. J. Hydrol. 2021, 603, 127053. [Google Scholar] [CrossRef]
- Sun, Z.; Jiao, H.; Wu, H.; Peng, Z.; Liu, L. Block2vec: An Approach for Identifying Urban Functional Regions by Integrating Sentence Embedding Model and Points of Interest. ISPRS Int. J. Geo-Inf. 2021, 10, 339. [Google Scholar] [CrossRef]
- Xu, Y.; Jin, S.; Chen, Z.; Xie, X.; Hu, S.; Xie, Z. Application of a Graph Convolutional Network with Visual and Semantic Features to Classify Urban Scenes. Int. J. Geogr. Inf. Sci. 2022, 36, 2009–2034. [Google Scholar] [CrossRef]
- Yang, J.; Zhu, J.; Sun, Y.; Zhao, J. Delimitating Urban Commercial Central Districts by Combining Kernel Density Estimation and Road Intersections: A Case Study in Nanjing City, China. ISPRS Int. J. Geo-Inf. 2019, 8, 93. [Google Scholar] [CrossRef]
- Heidenreich, N.-B.; Schindler, A.; Sperlich, S. Bandwidth Selection for Kernel Density Estimation: A Review of Fully Automatic Selectors. AStA Adv. Stat. Anal. 2013, 97, 403–433. [Google Scholar] [CrossRef]
- Li, Z.-W.; He, P. Data-Based Optimal Bandwidth for Kernel Density Estimation of Statistical Samples. Commun. Theor. Phys. 2018, 70, 728. [Google Scholar] [CrossRef]
- Wang, C.; Pan, S.; Long, G.; Zhu, X.; Jiang, J. MGAE: Marginalized graph autoencoder for graph clustering. In Proceedings of the 2017 ACM on Conference on Information and Knowledge Management, Singapore, 6–10 November 2017; pp. 889–898. [Google Scholar] [CrossRef]
- Rousseeuw, P.J. Silhouettes: A Graphical Aid to the Interpretation and Validation of Cluster Analysis. J. Comput. Appl. Math. 1987, 20, 53–65. [Google Scholar] [CrossRef]
- Cai, J.; Chen, Y. A Novel Unsupervised Deep Learning Method for the Generalization of Urban Form. Geo-Spat. Inf. Sci. 2022, 25, 568–587. [Google Scholar] [CrossRef]
- Verburg, P.H.; de Nijs, T.C.M.; Ritsema van Eck, J.; Visser, H.; de Jong, K. A Method to Analyse Neighbourhood Characteristics of Land Use Patterns. Comput. Environ. Urban Syst. 2004, 28, 667–690. [Google Scholar] [CrossRef]
- Chen, M.; Xu, Z.; Weinberger, K.; Sha, F. Marginalized denoising autoencoders for domain adaptation. arXiv 2012, arXiv:1206.4683. [Google Scholar] [CrossRef]
Figure 1.
(a) Location of the Jiangsu Province and Changzhou City in China. (b) Location of the study area in Changzhou City. (c) The study area.
Figure 1.
(a) Location of the Jiangsu Province and Changzhou City in China. (b) Location of the study area in Changzhou City. (c) The study area.

Figure 2.
Methodological framework applied in this study.

Figure 3.
Role of barriers on the spread of points of interest (POIs).

Figure 4.
Graph construction procedure used in this study and the framework of the marginalized graph autoencoder (MGAE); vi represents the initial node and Zi represents features of nodes after training.
Figure 4.
Graph construction procedure used in this study and the framework of the marginalized graph autoencoder (MGAE); vi represents the initial node and Zi represents features of nodes after training.

Figure 5.
Changes in the sum of the squared error (SSE) and silhouette coefficients (SIL) with increasing number of clusters (M). The red lines indicate the slope of the curve.
Figure 5.
Changes in the sum of the squared error (SSE) and silhouette coefficients (SIL) with increasing number of clusters (M). The red lines indicate the slope of the curve.

Figure 6.
Urban functional identification results with k-means clustering.

Figure 7.
Comparison of urban function identification in barrier kernel density analysis. (a) Results with road and water barriers and (b) without barriers.
Figure 7.
Comparison of urban function identification in barrier kernel density analysis. (a) Results with road and water barriers and (b) without barriers.

Figure 8.
Comparison of urban function identification in barrier kernel density analysis. (a) Changzhou Railway Station and Hongmei xicun Community. (b) Lanling home Community. (c) Pengxin Community.
Figure 8.
Comparison of urban function identification in barrier kernel density analysis. (a) Changzhou Railway Station and Hongmei xicun Community. (b) Lanling home Community. (c) Pengxin Community.

Figure 9.
Urban function identification results under different data dilution ratios. Red circles indicate areas of high variability.
Figure 9.
Urban function identification results under different data dilution ratios. Red circles indicate areas of high variability.


Table 1.
POI reclassification standards and numbers.
| Reclassified Label | Description | Number | Proportion |
|---|---|---|---|
| Finance | ATMs; banks; pawn shops; credit unions | 1871 | 1.01% |
| Car service | Car detailing; car sales; car accessories; car inspection centers | 5092 | 2.75% |
| Corporate and factory | Plants and mines, parks; agriculture, forestry, and horticulture; office buildings, companies | 25,058 | 13.54% |
| Culture and media | Exhibition galleries; cultural palaces; radio and television | 590 | 0.32% |
| Food | Chinese restaurants; snack fast food restaurants; cake and dessert shops; foreign restaurants; bars | 22,313 | 12.06% |
| Governmental and public organizations | Government agencies | 5032 | 2.72% |
| Hotel | Star hotels; express hotels; hostels; guesthouses | 1549 | 0.84% |
| Public facility | Medical; living services | 21,692 | 11.72% |
| Residence | Interior buildings; dormitories; residential areas | 40,906 | 22.11% |
| Science and education | Training institutions; primary schools; kindergartens; secondary schools; universities | 4875 | 2.63% |
| Shopping mall | Department stores; shopping centers; home appliances; digital; stores; shopping areas | 41,452 | 22.40% |
| Sports and recreation | Sports fitness; entertainment | 5026 | 2.72% |
| Tourism attraction | Tourist attractions; water systems; natural features | 1465 | 0.79% |
| Transportation facility | Entrances/exits; subway stations; bus stops; bus lines; subway lines; transportation facilities | 8097 | 4.38% |
Table 2.
Confusion matrix results of urban functional zones.
| Cluster 1 | Cluster 2 | Cluster 3 | Cluster 4 | Cluster 5 | Total | |
|---|---|---|---|---|---|---|
| Cluster 1 | 58 | 1 | 0 | 1 | 0 | 60 |
| Cluster 2 | 0 | 53 | 0 | 1 | 6 | 60 |
| Cluster 3 | 0 | 2 | 58 | 0 | 0 | 60 |
| Cluster 4 | 0 | 6 | 0 | 51 | 3 | 60 |
| Cluster 5 | 8 | 1 | 0 | 0 | 51 | 60 |
| Total | 66 | 63 | 58 | 53 | 60 | 300 |
Table 3.
Overall accuracies and kappa coefficients of the functional area classification models.
| Index | Model | OA | Kappa |
|---|---|---|---|
| 1 | LDA | 62.68% | 0.52 |
| 2 | TF-IDF | 57.35% | 0.54 |
| 3 | mSDA | 34.58% | 0.26 |
| 4 | Proposed model | 90.33% | 0.88 |
Table 4.
Overall POI frequency densities and category factor.
| Frequency Density | |||||
|---|---|---|---|---|---|
| C1 | C2 | C3 | C4 | C5 | |
| Science and education | 1.953 | 40.677 | 439.445 | 79.841 | 19.102 |
| Corporate and factory | 42.986 | 125.100 | 639.795 | 306.240 | 92.937 |
| Food | 5.615 | 206.407 | 2101.777 | 410.648 | 70.115 |
| Hotel | 0.249 | 14.094 | 120.966 | 35.756 | 4.673 |
| Finance | 0.219 | 18.934 | 118.130 | 53.171 | 3.252 |
| Tourism attraction | 1.554 | 7.767 | 38.747 | 10.348 | 8.696 |
| Public facility | 7.822 | 187.733 | 2076.261 | 374.303 | 74.047 |
| Governmental and public organizations | 2.880 | 43.085 | 60.483 | 66.548 | 24.395 |
| Sports and recreation | 1.330 | 50.711 | 357.227 | 96.667 | 14.791 |
| Car service | 3.328 | 30.691 | 27.406 | 111.475 | 25.363 |
| Shopping mall | 13.945 | 359.059 | 4127.951 | 776.116 | 132.032 |
| Transportation facility | 2.362 | 47.689 | 238.151 | 105.754 | 21.385 |
| Residence | 17.253 | 399.193 | 639.795 | 538.780 | 200.408 |
| Culture and media | 0.199 | 4.840 | 31.186 | 10.937 | 2.586 |
| Category Factor | |||||
| C1 | C2 | C3 | C4 | C5 | |
| Science and education | 0.715 | 0.986 | 1.485 | 0.998 | 1.025 |
| Corporate and factory | 3.092 | 0.596 | 0.425 | 0.752 | 0.980 |
| Food | 0.456 | 1.109 | 1.575 | 1.139 | 0.834 |
| Hotel | 0.290 | 1.085 | 1.298 | 1.420 | 0.796 |
| Finance | 0.212 | 1.210 | 1.052 | 1.753 | 0.460 |
| Tourism attraction | 1.976 | 0.654 | 0.455 | 0.449 | 1.620 |
| Public facility | 0.651 | 1.035 | 1.596 | 1.065 | 0.904 |
| Governmental and public organizations | 1.037 | 1.027 | 0.201 | 0.819 | 1.288 |
| Sports and recreation | 0.474 | 1.197 | 1.176 | 1.177 | 0.773 |
| Car service | 1.168 | 0.713 | 0.089 | 1.336 | 1.305 |
| Shopping mall | 0.607 | 1.034 | 1.657 | 1.153 | 0.842 |
| Transportation facilities | 0.765 | 1.022 | 0.712 | 1.170 | 1.015 |
| Residence | 0.744 | 1.139 | 0.254 | 0.793 | 1.266 |
| Culture and media | 0.604 | 0.971 | 0.872 | 1.132 | 1.148 |
Table 5.
Comparisons of the identification results with remote sensing images and Map World.
| Identification District | Identification Results | Map World | Remote Sensing Images |
|---|---|---|---|
| South Street |  |  |  |
| Changzhou Olympic Sports Center |  |  |  |
| Pubei Community |  |  |  |
| Xingrong High-tech Company |  |  |  |
Table 6.
Overall accuracy (OA) and kappa coefficient analysis after data dilution.
| Percentage Dilution | OA (True Label) | Kappa (True Label) | OA (Experiment Label) | Kappa (Experiment Label) |
|---|---|---|---|---|
| 20% | 79.33% | 0.74 | 93.13% | 0.79 |
| 30% | 78.33% | 0.73 | 92.62% | 0.77 |
| 50% | 72.00% | 0.68 | 91.73% | 0.75 |
| 60% | 71.67% | 0.65 | 91.23% | 0.73 |
| 80% | 69.00% | 0.61 | 89.65% | 0.69 |
| 90% | 53.33% | 0.41 | 80.26% | 0.40 |
Disclaimer/Publisher’s Note: The statements, opinions and data contained in all publications are solely those of the individual author(s) and contributor(s) and not of MDPI and/or the editor(s). MDPI and/or the editor(s) disclaim responsibility for any injury to people or property resulting from any ideas, methods, instructions or products referred to in the content. |
© 2023 by the authors. Licensee MDPI, Basel, Switzerland. This article is an open access article distributed under the terms and conditions of the Creative Commons Attribution (CC BY) license (https://creativecommons.org/licenses/by/4.0/).
Share and Cite
MDPI and ACS Style
Xu, R.; Chen, Z.; Li, F.; Zhou, C. Identification of Urban Functional Zones Based on POI Density and Marginalized Graph Autoencoder. ISPRS Int. J. Geo-Inf. 2023, 12, 343. https://doi.org/10.3390/ijgi12080343
AMA Style
Xu R, Chen Z, Li F, Zhou C. Identification of Urban Functional Zones Based on POI Density and Marginalized Graph Autoencoder. ISPRS International Journal of Geo-Information. 2023; 12(8):343. https://doi.org/10.3390/ijgi12080343
Chicago/Turabian StyleXu, Runpeng, Zhenjie Chen, Feixue Li, and Chen Zhou. 2023. "Identification of Urban Functional Zones Based on POI Density and Marginalized Graph Autoencoder" ISPRS International Journal of Geo-Information 12, no. 8: 343. https://doi.org/10.3390/ijgi12080343
Note that from the first issue of 2016, this journal uses article numbers instead of page numbers. See further details here.