


Location Scheme of Routine Nucleic Acid Testing Sites Based on Location-Allocation Models: A Case Study of Shenzhen City

Abstract
:1. Introduction
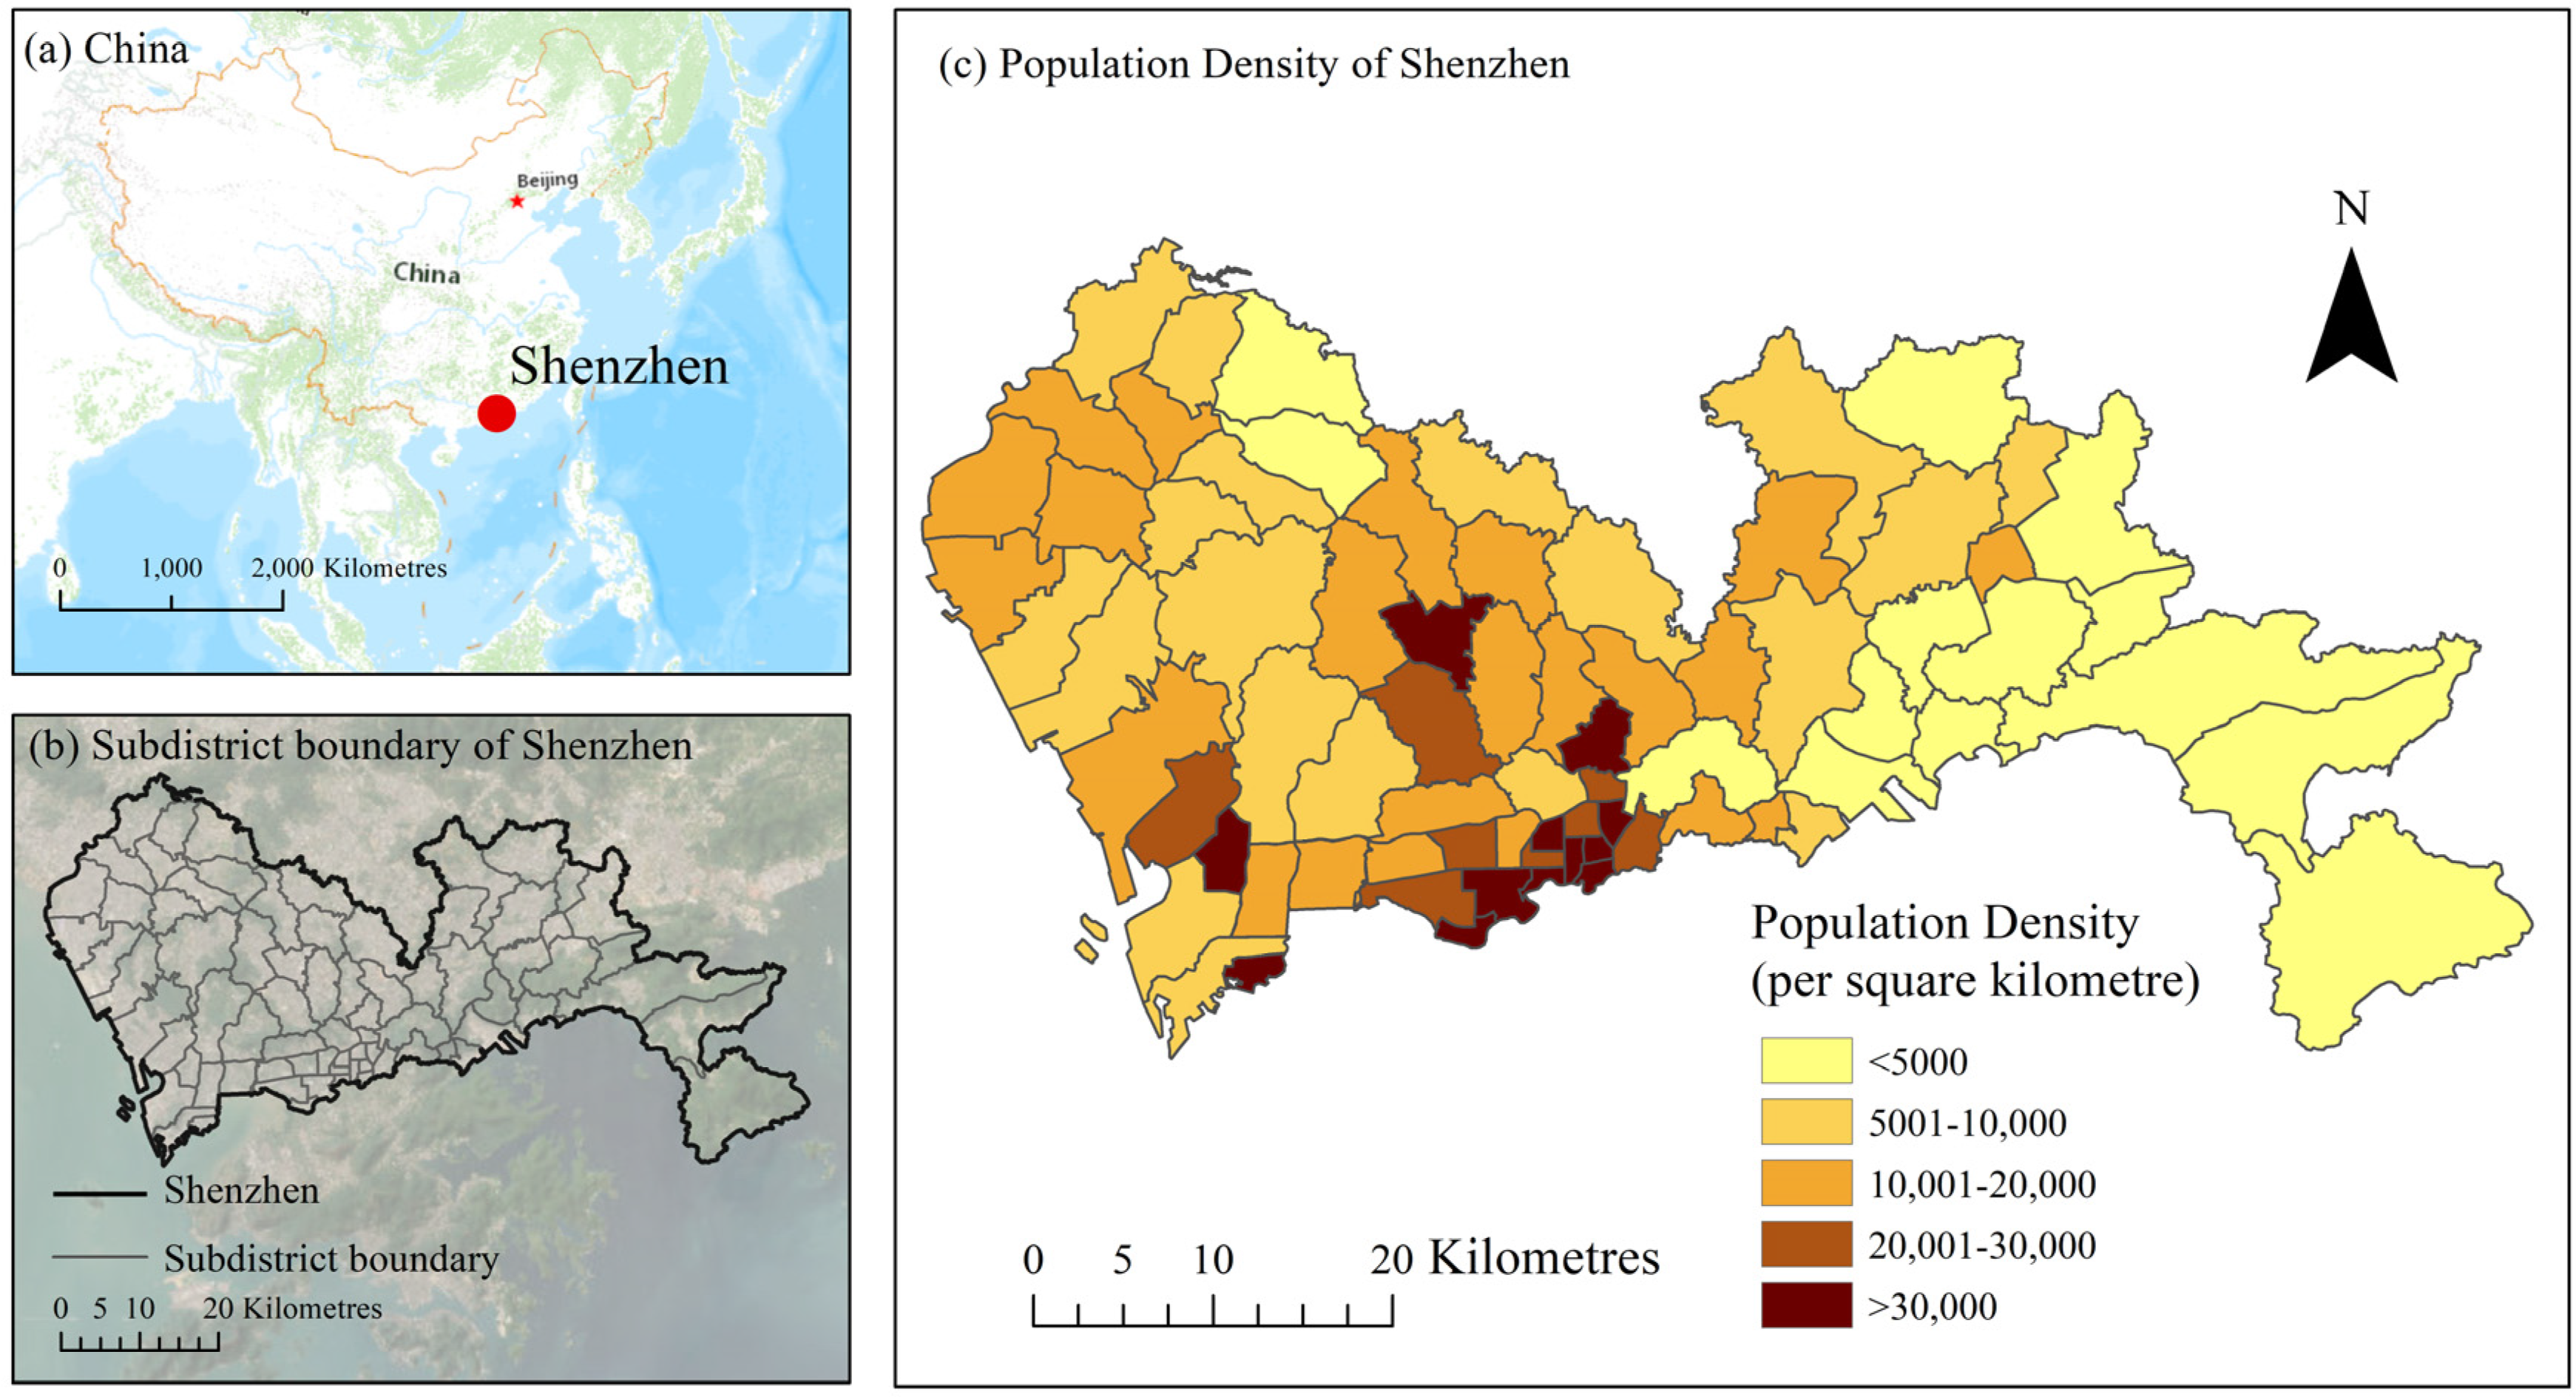
2. Study Area and Data
2.1. Study Area
2.2. Data Collection and Processing
- POI data
- Road vector data
- Administrative boundary vector
- Population data
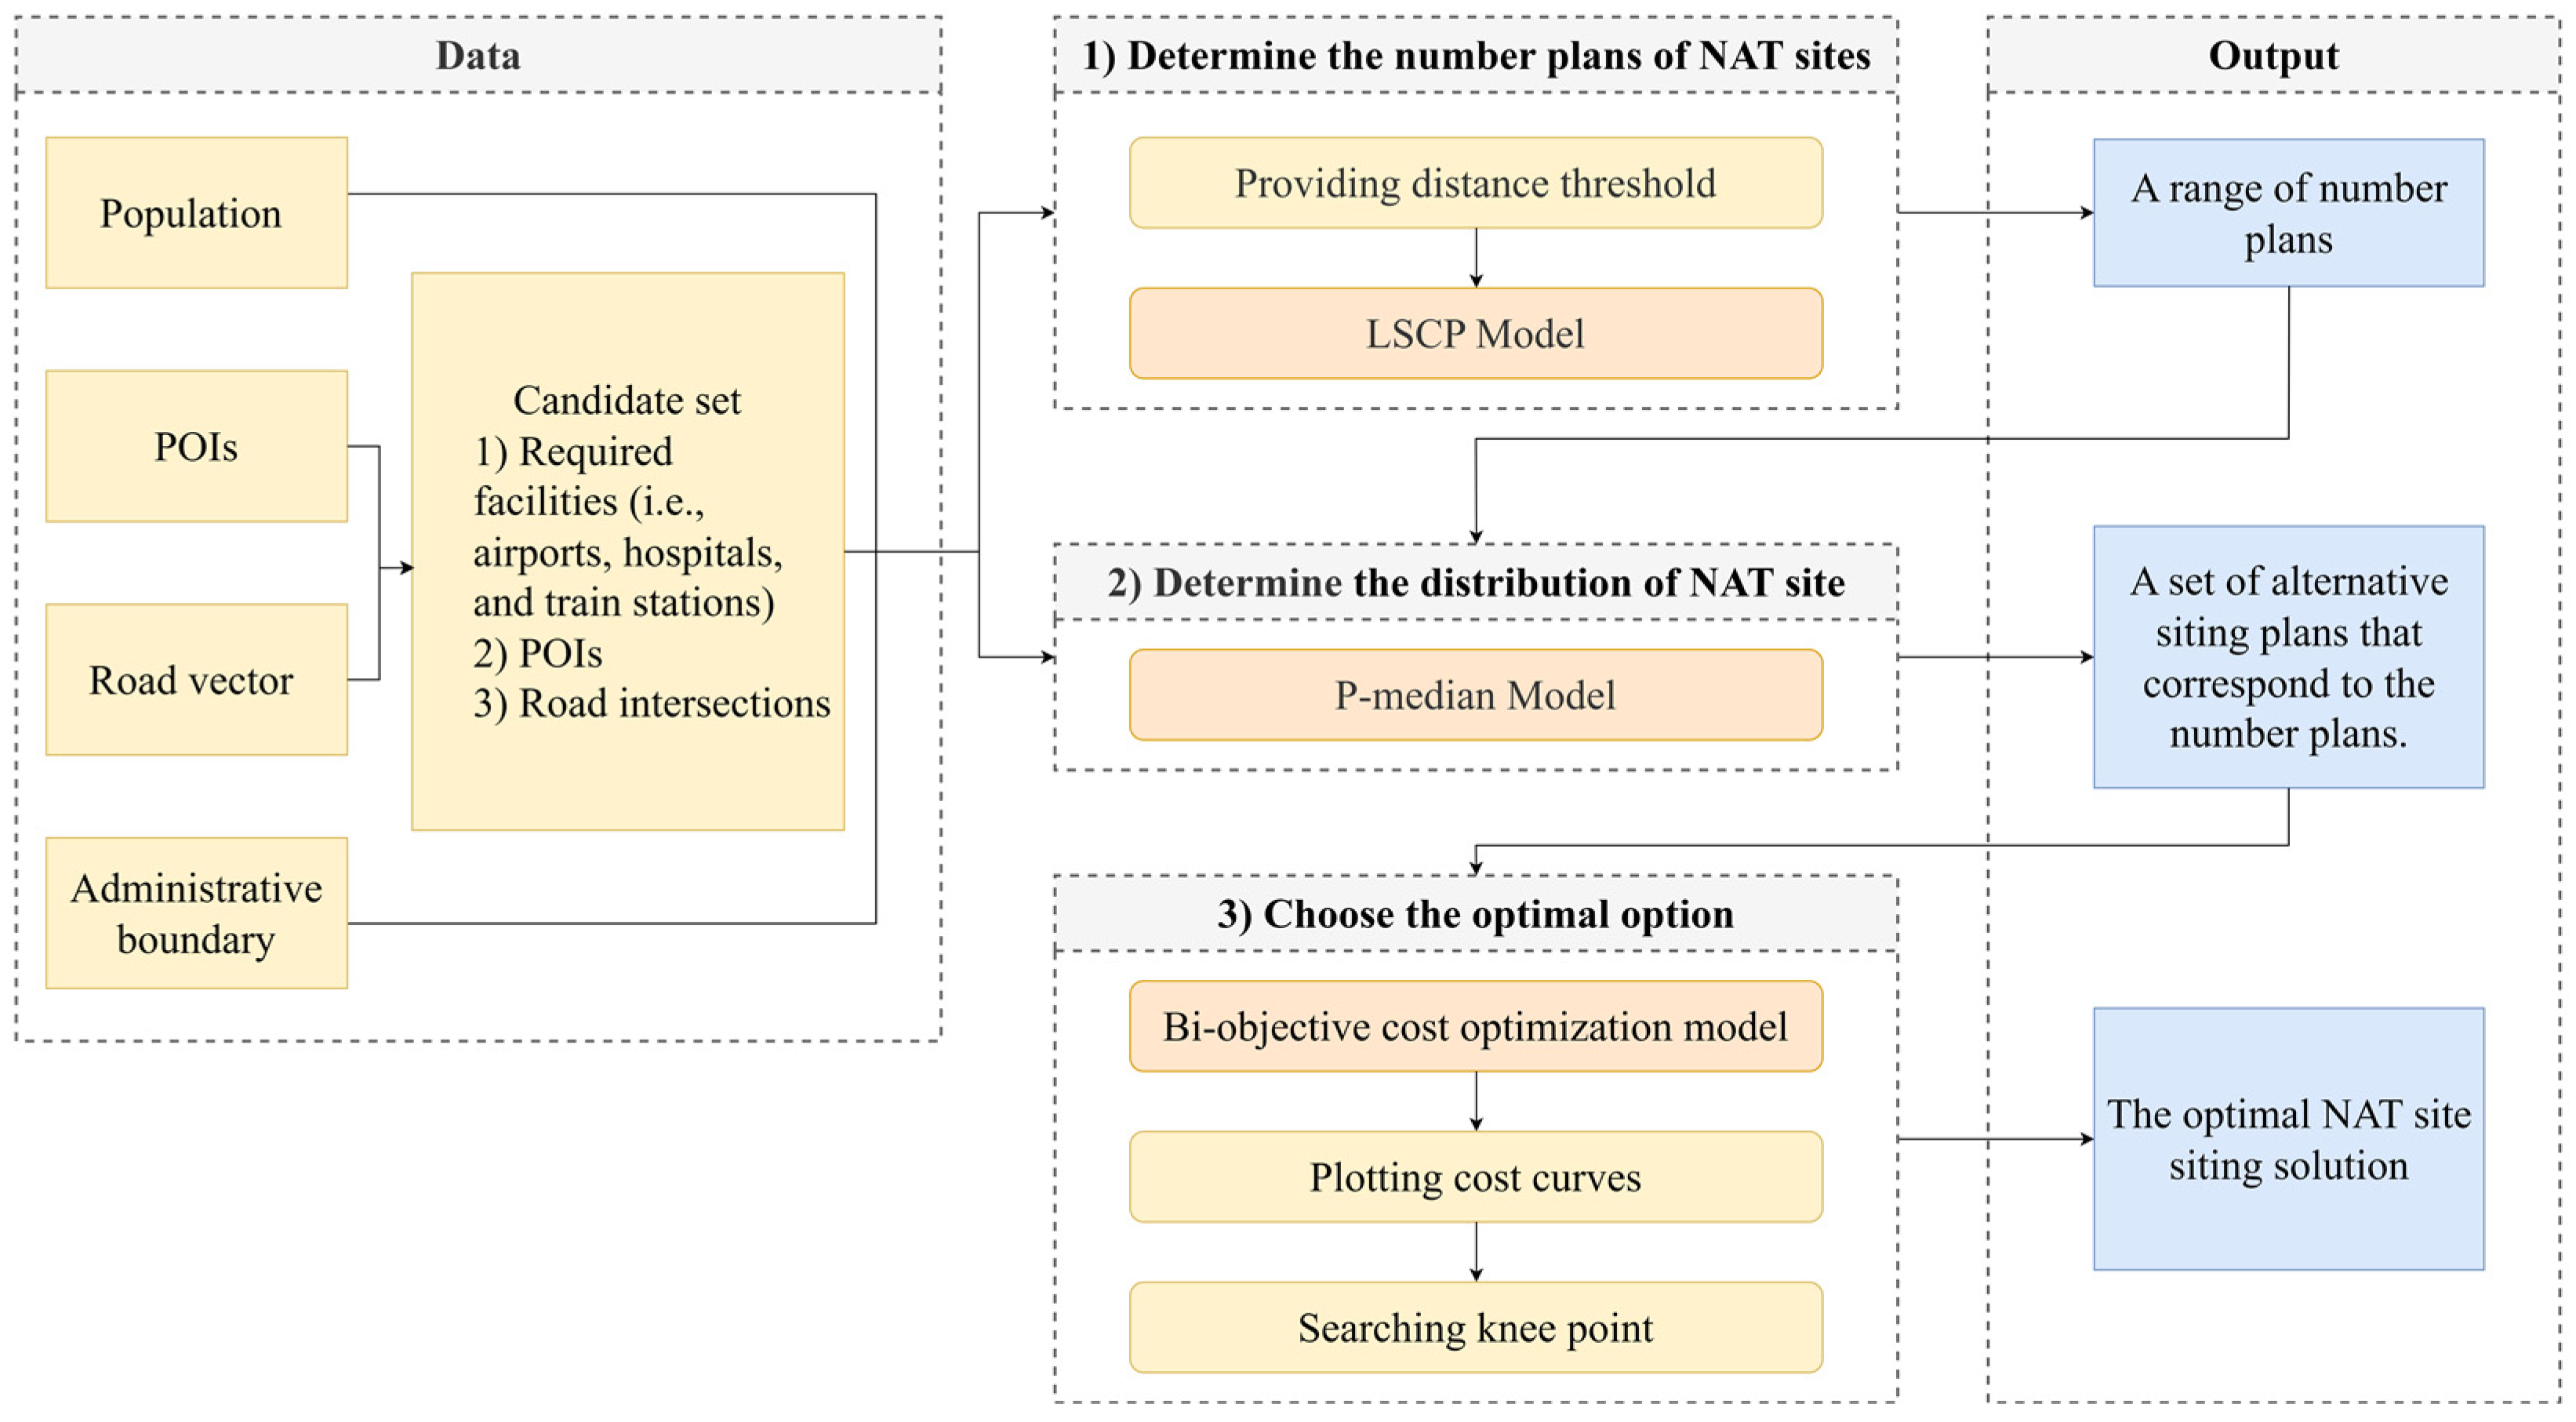
3. Methods
3.1. Determining the Number Plans of NAT Sites
3.2. Determining the Alternative Siting Plans of NAT Sites under Different Number Plans
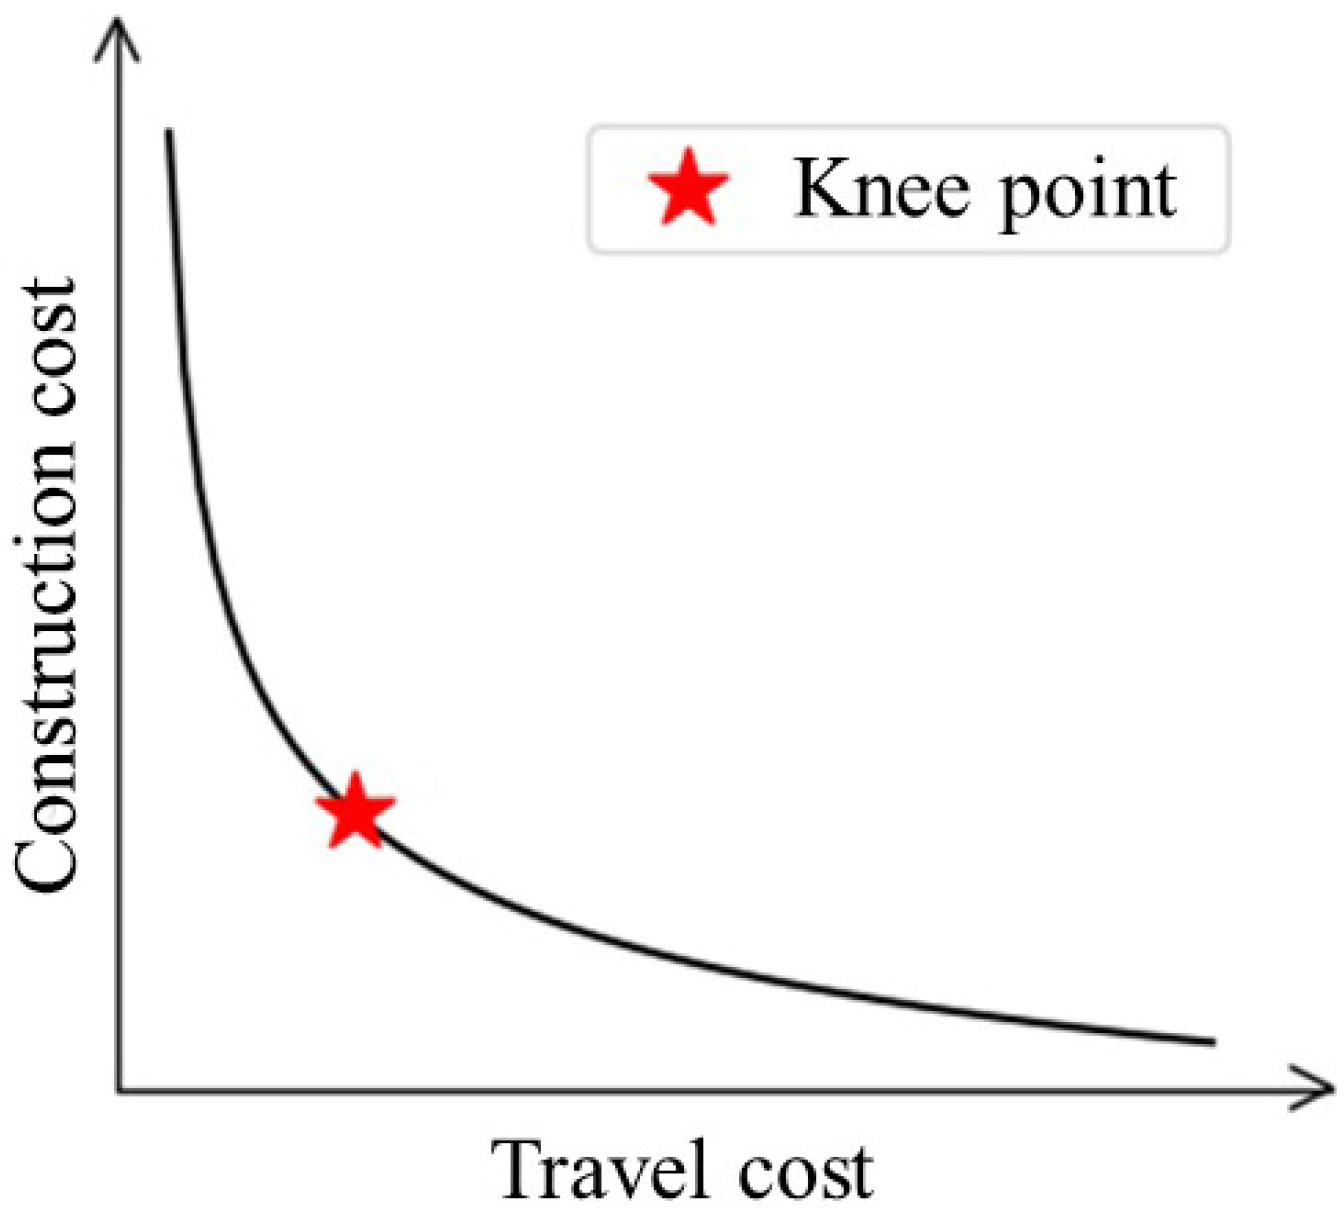
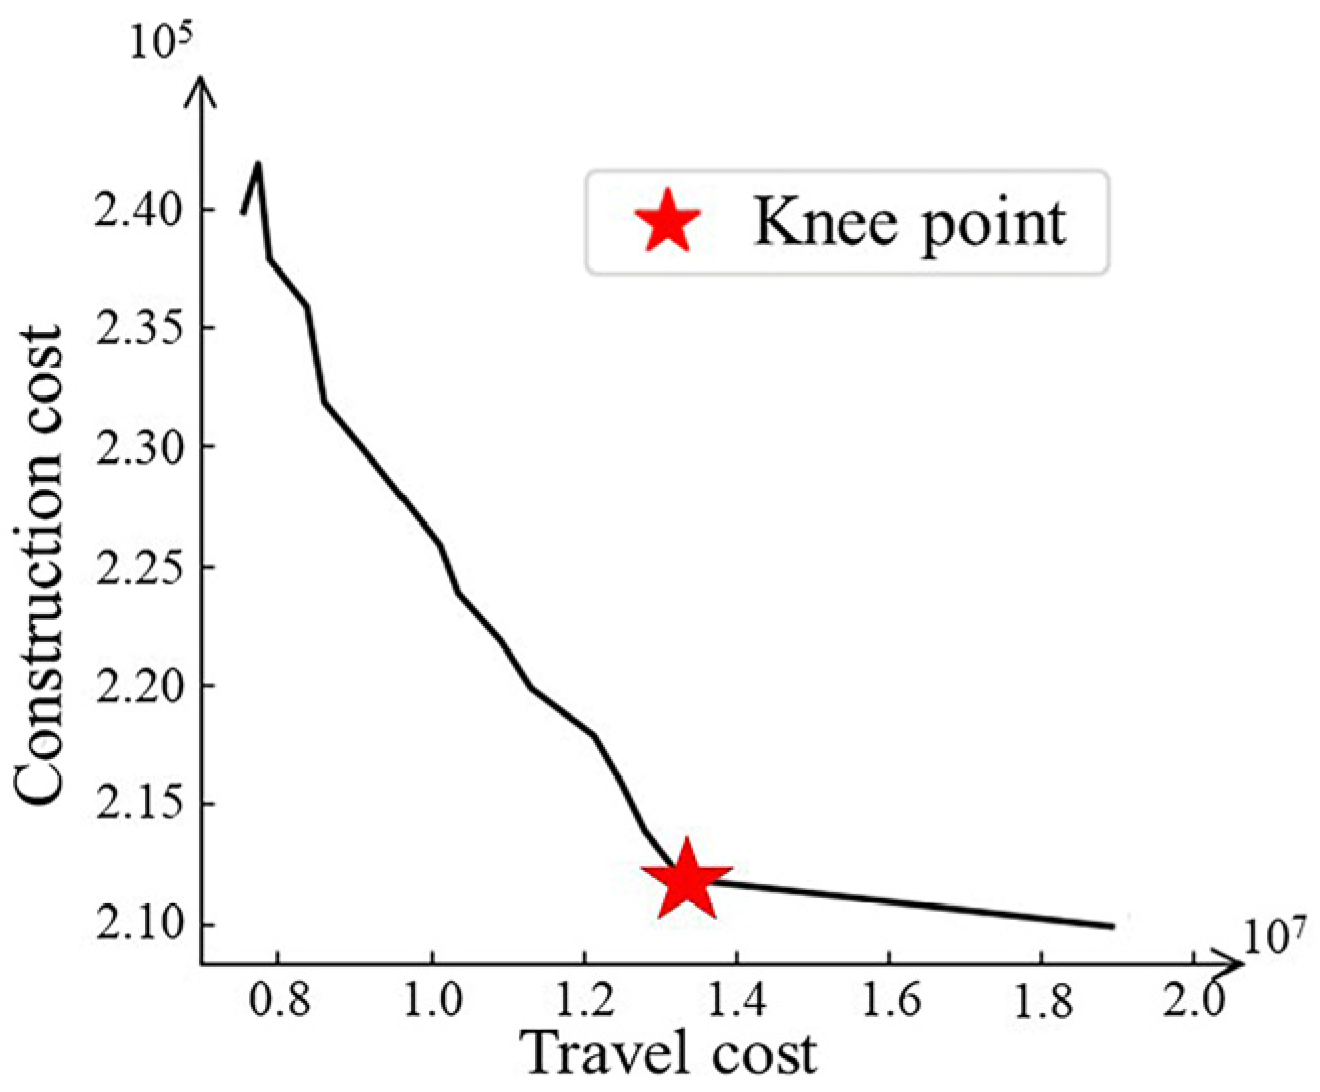
3.3. Choosing the Optimal Siting Solution
4. Results
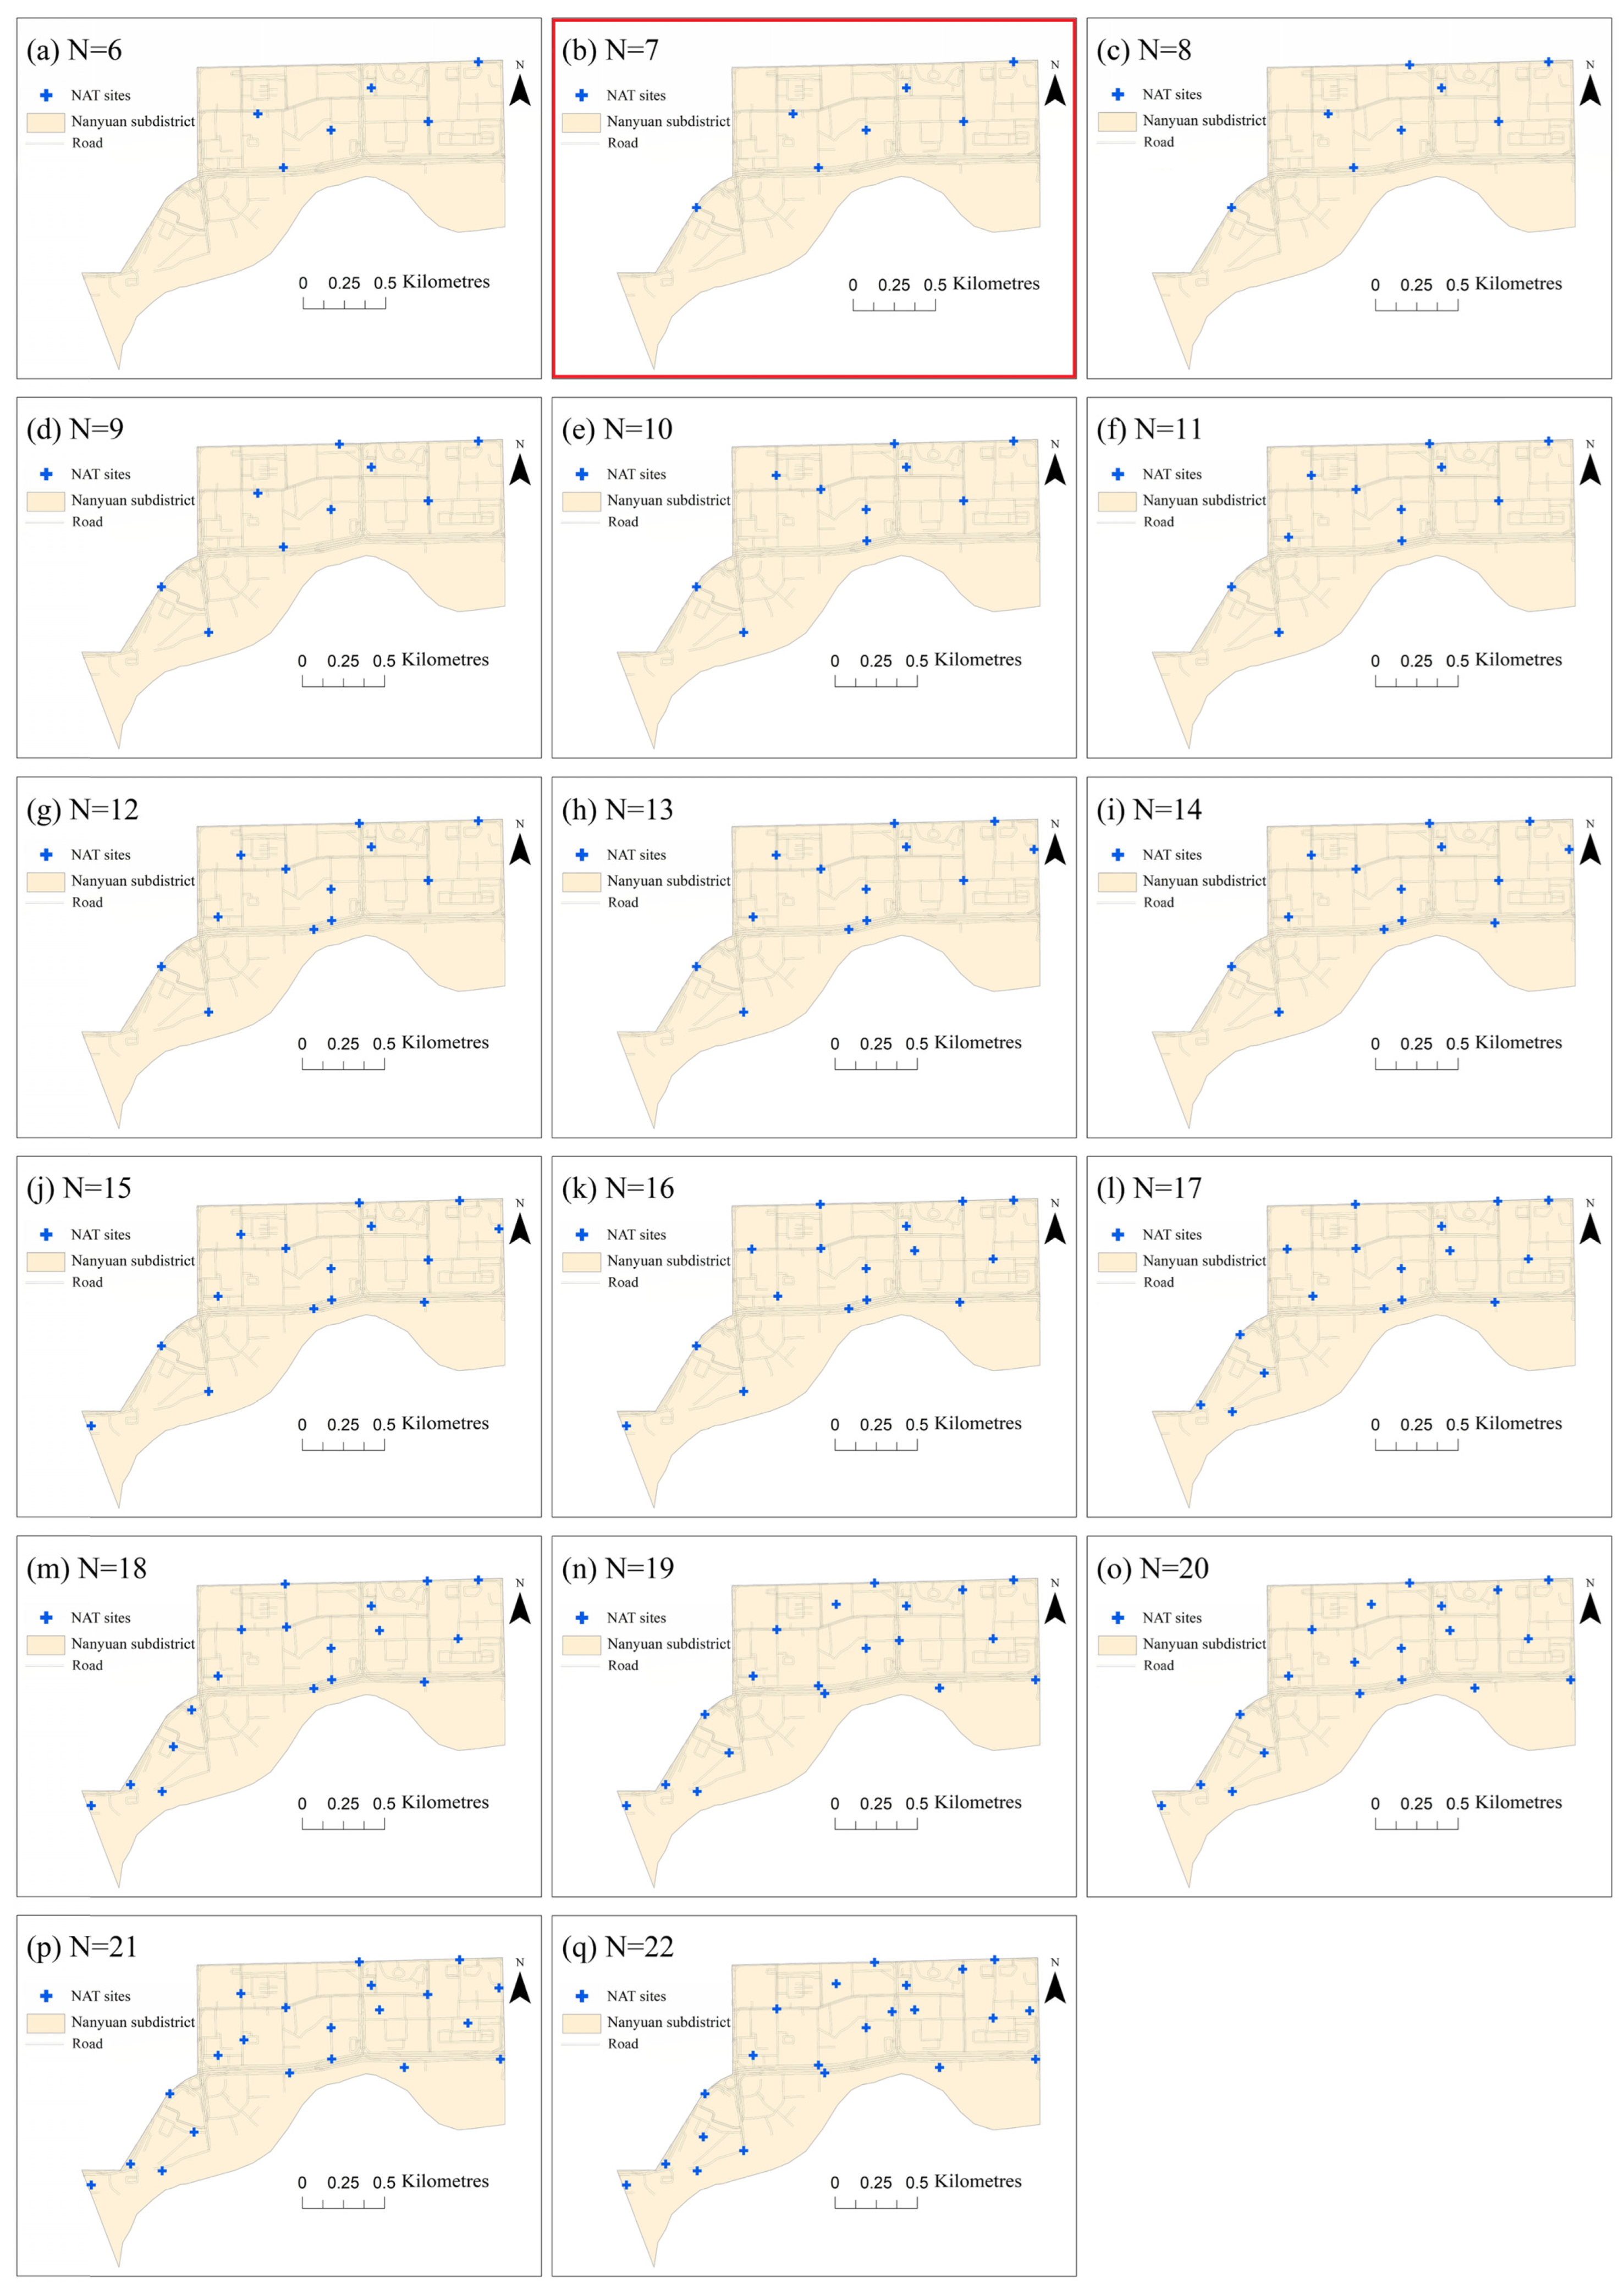
4.1. Example of the Determination of Siting Plans at the Subdistrict Level
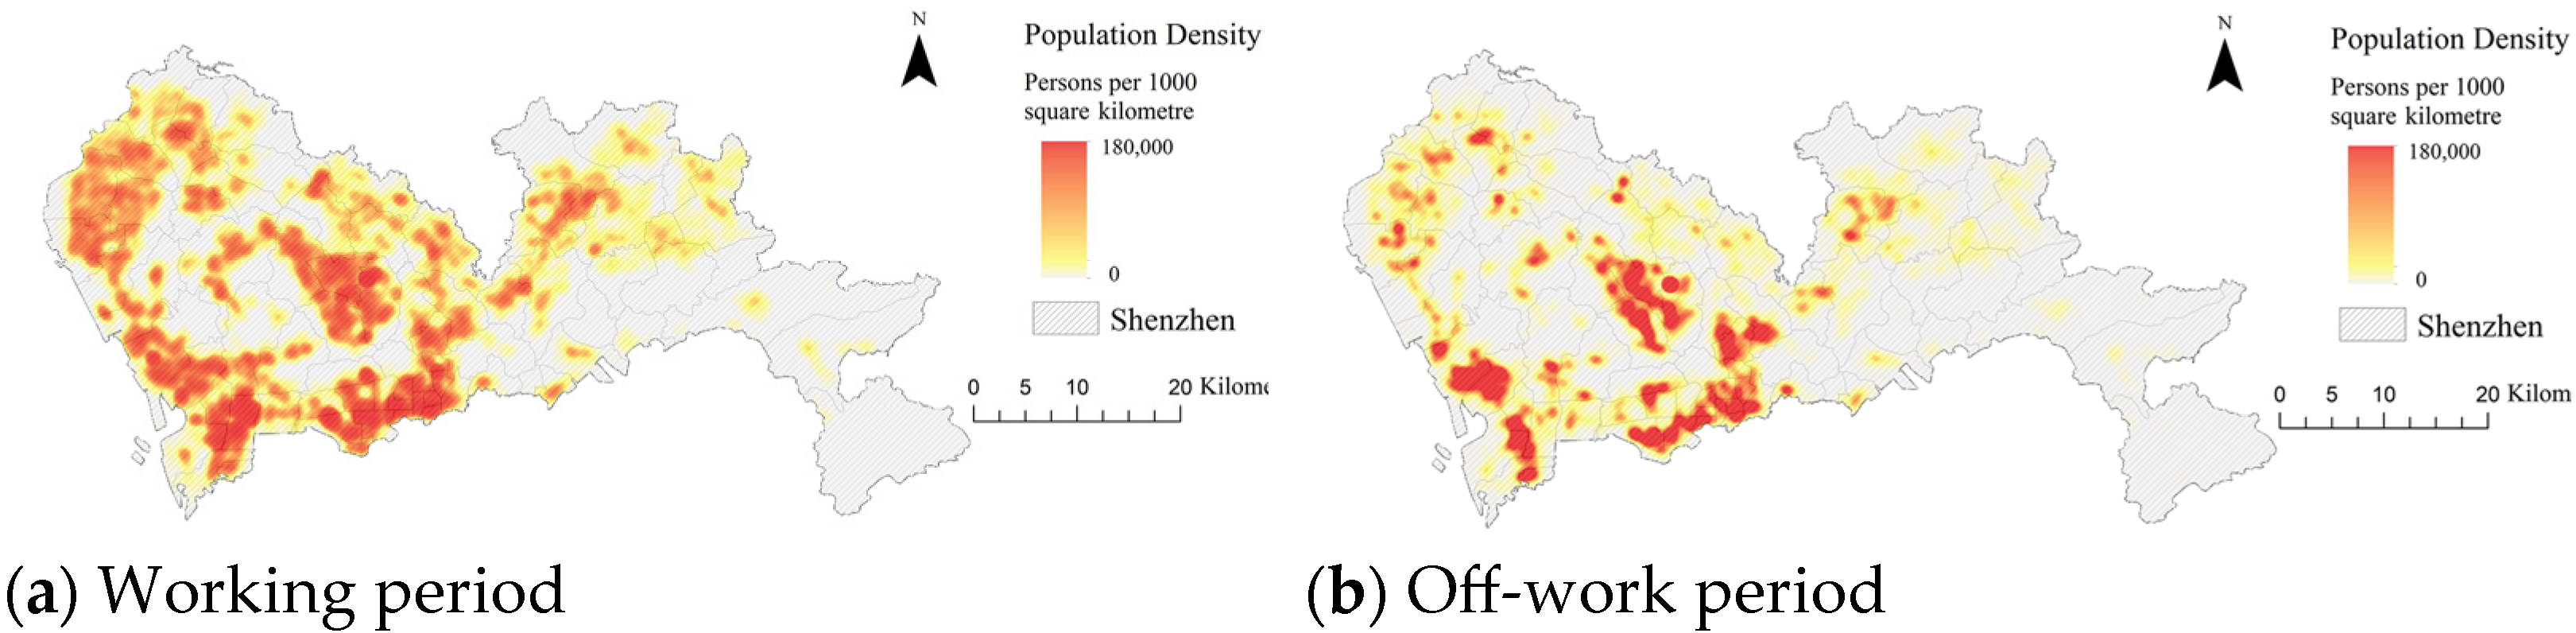
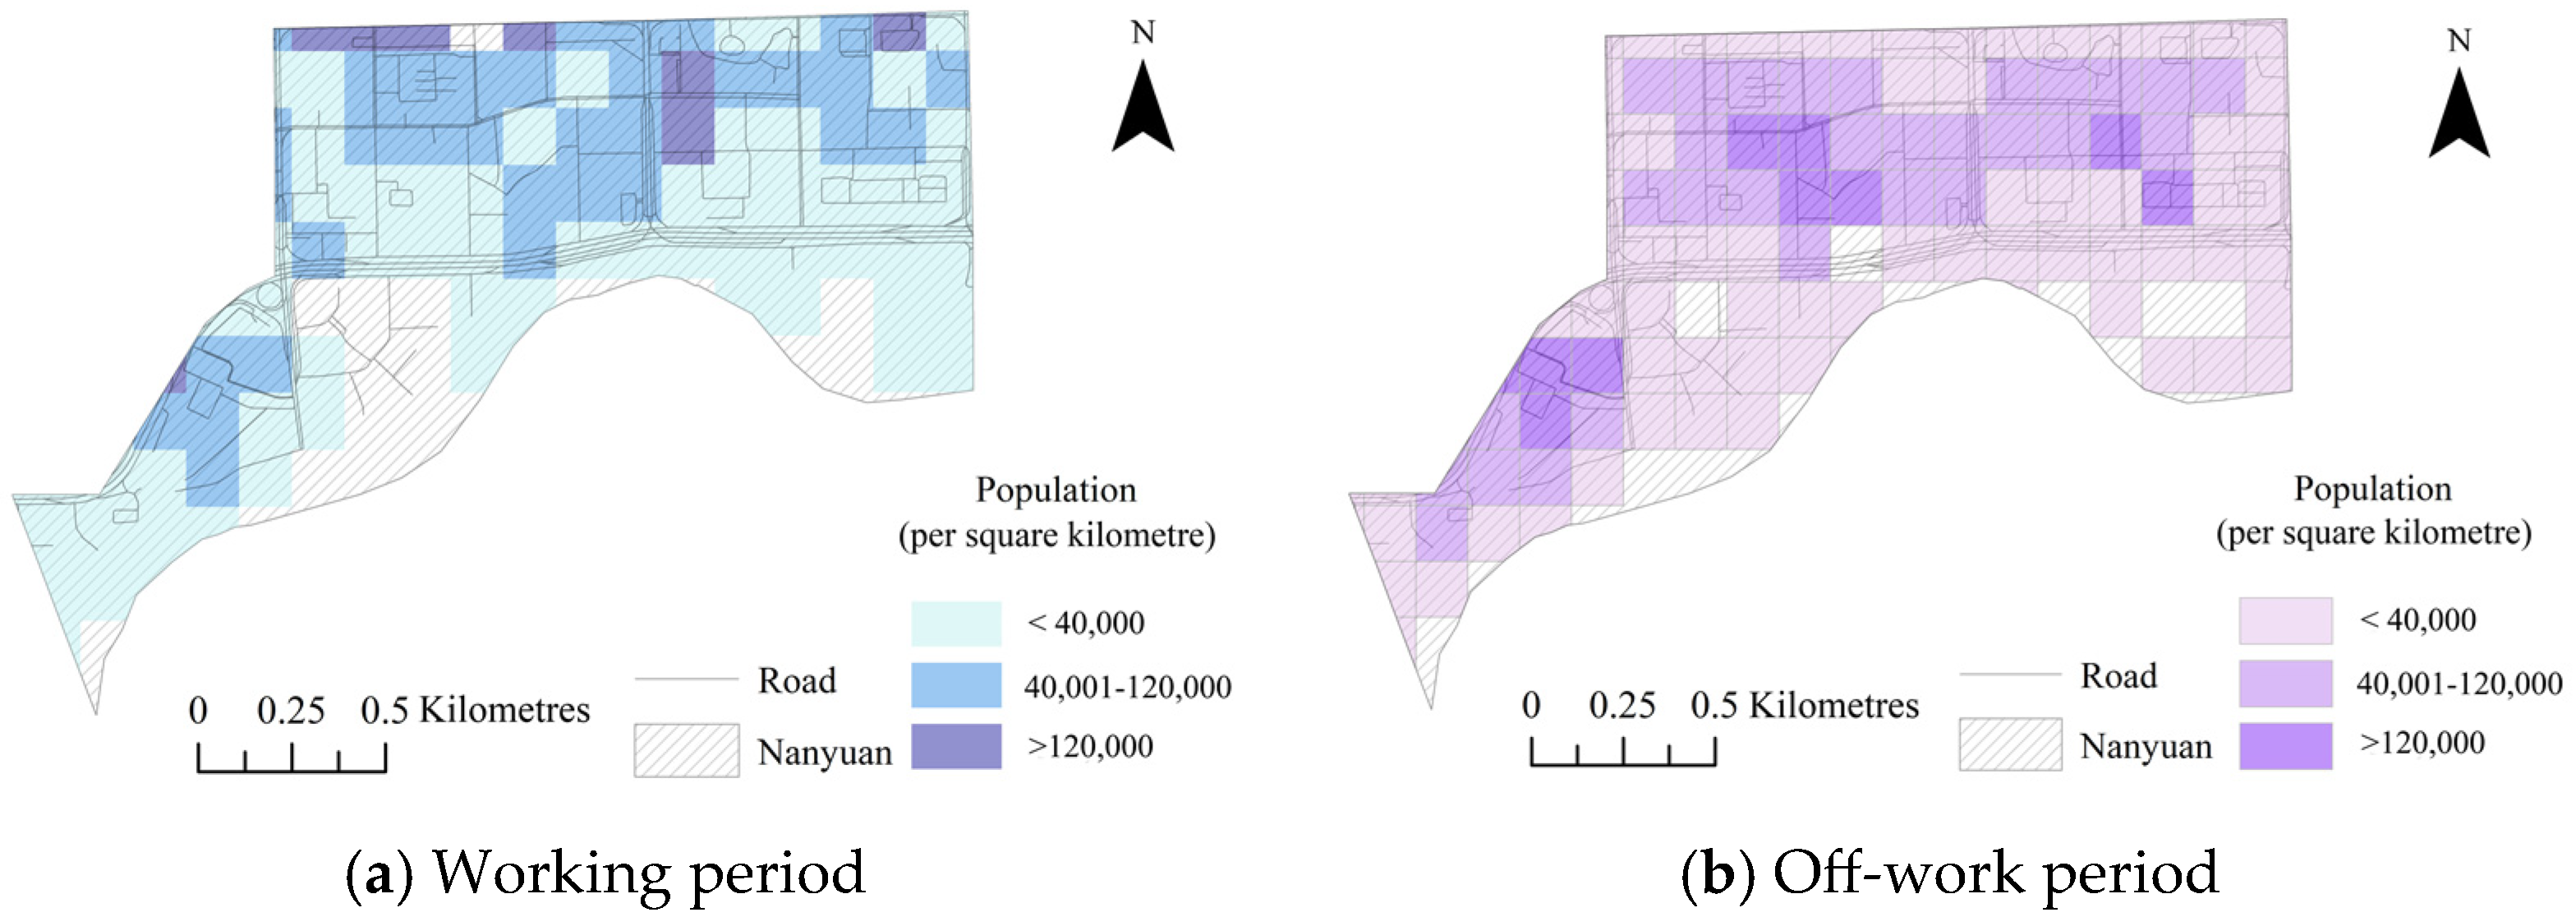
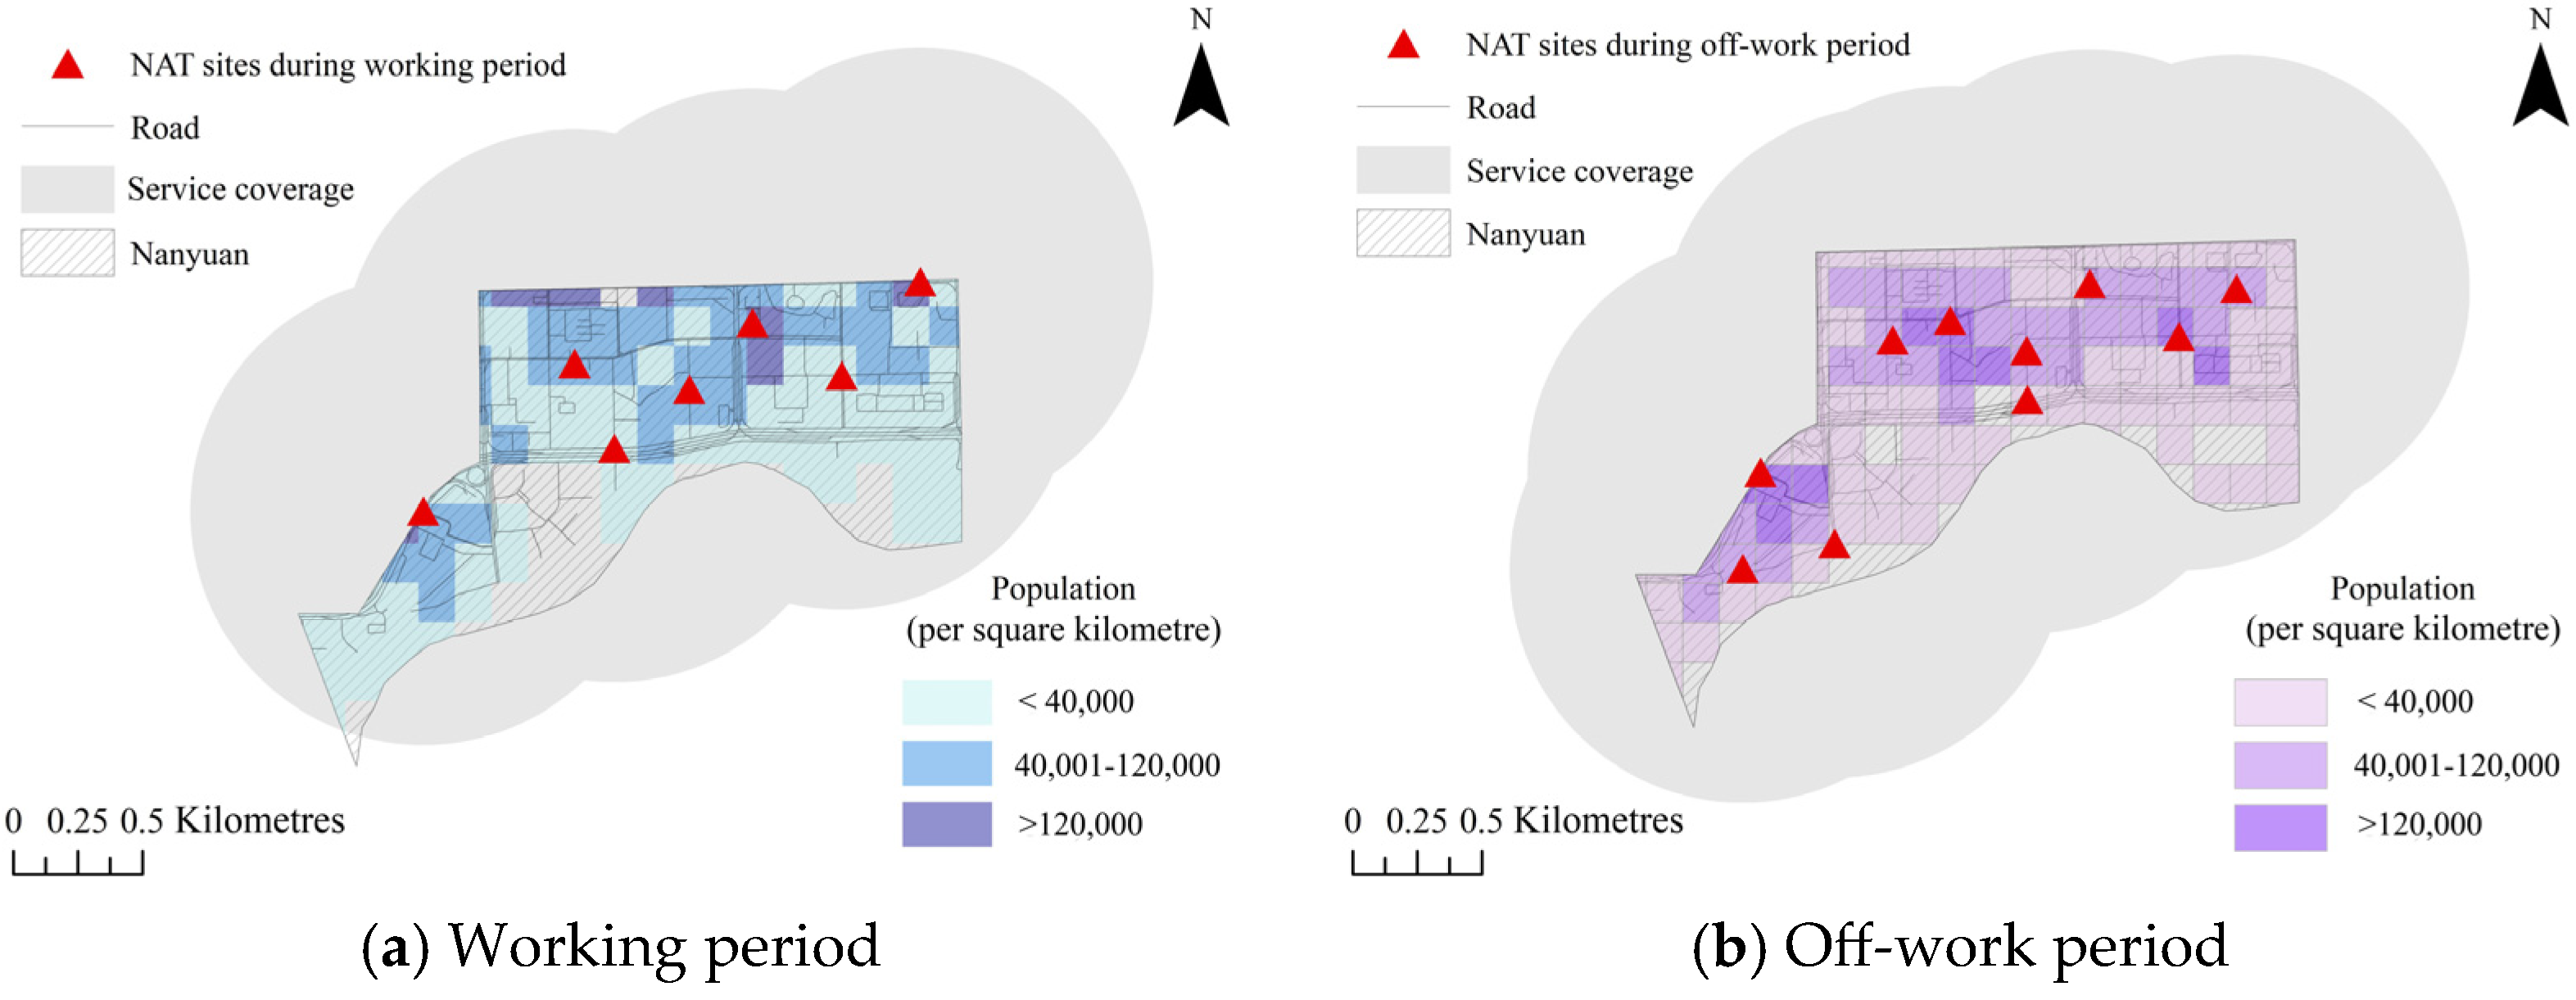
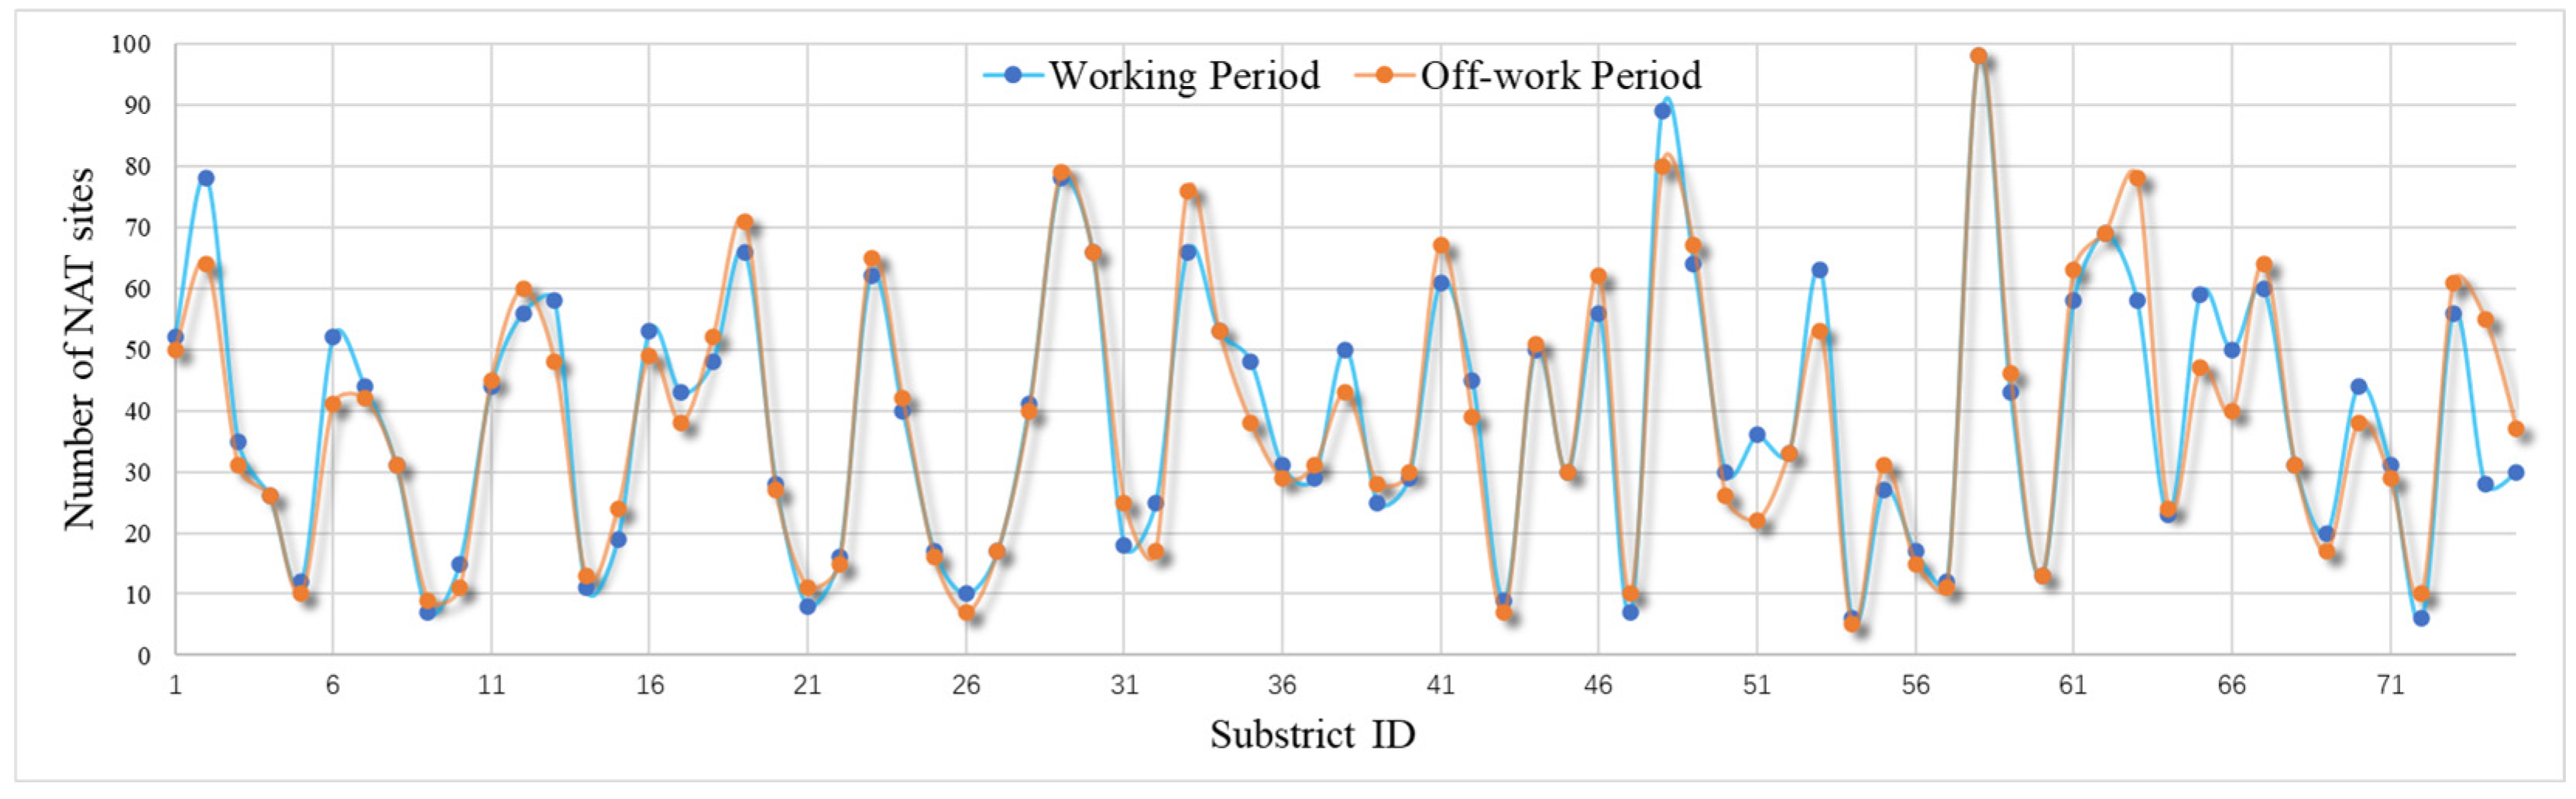
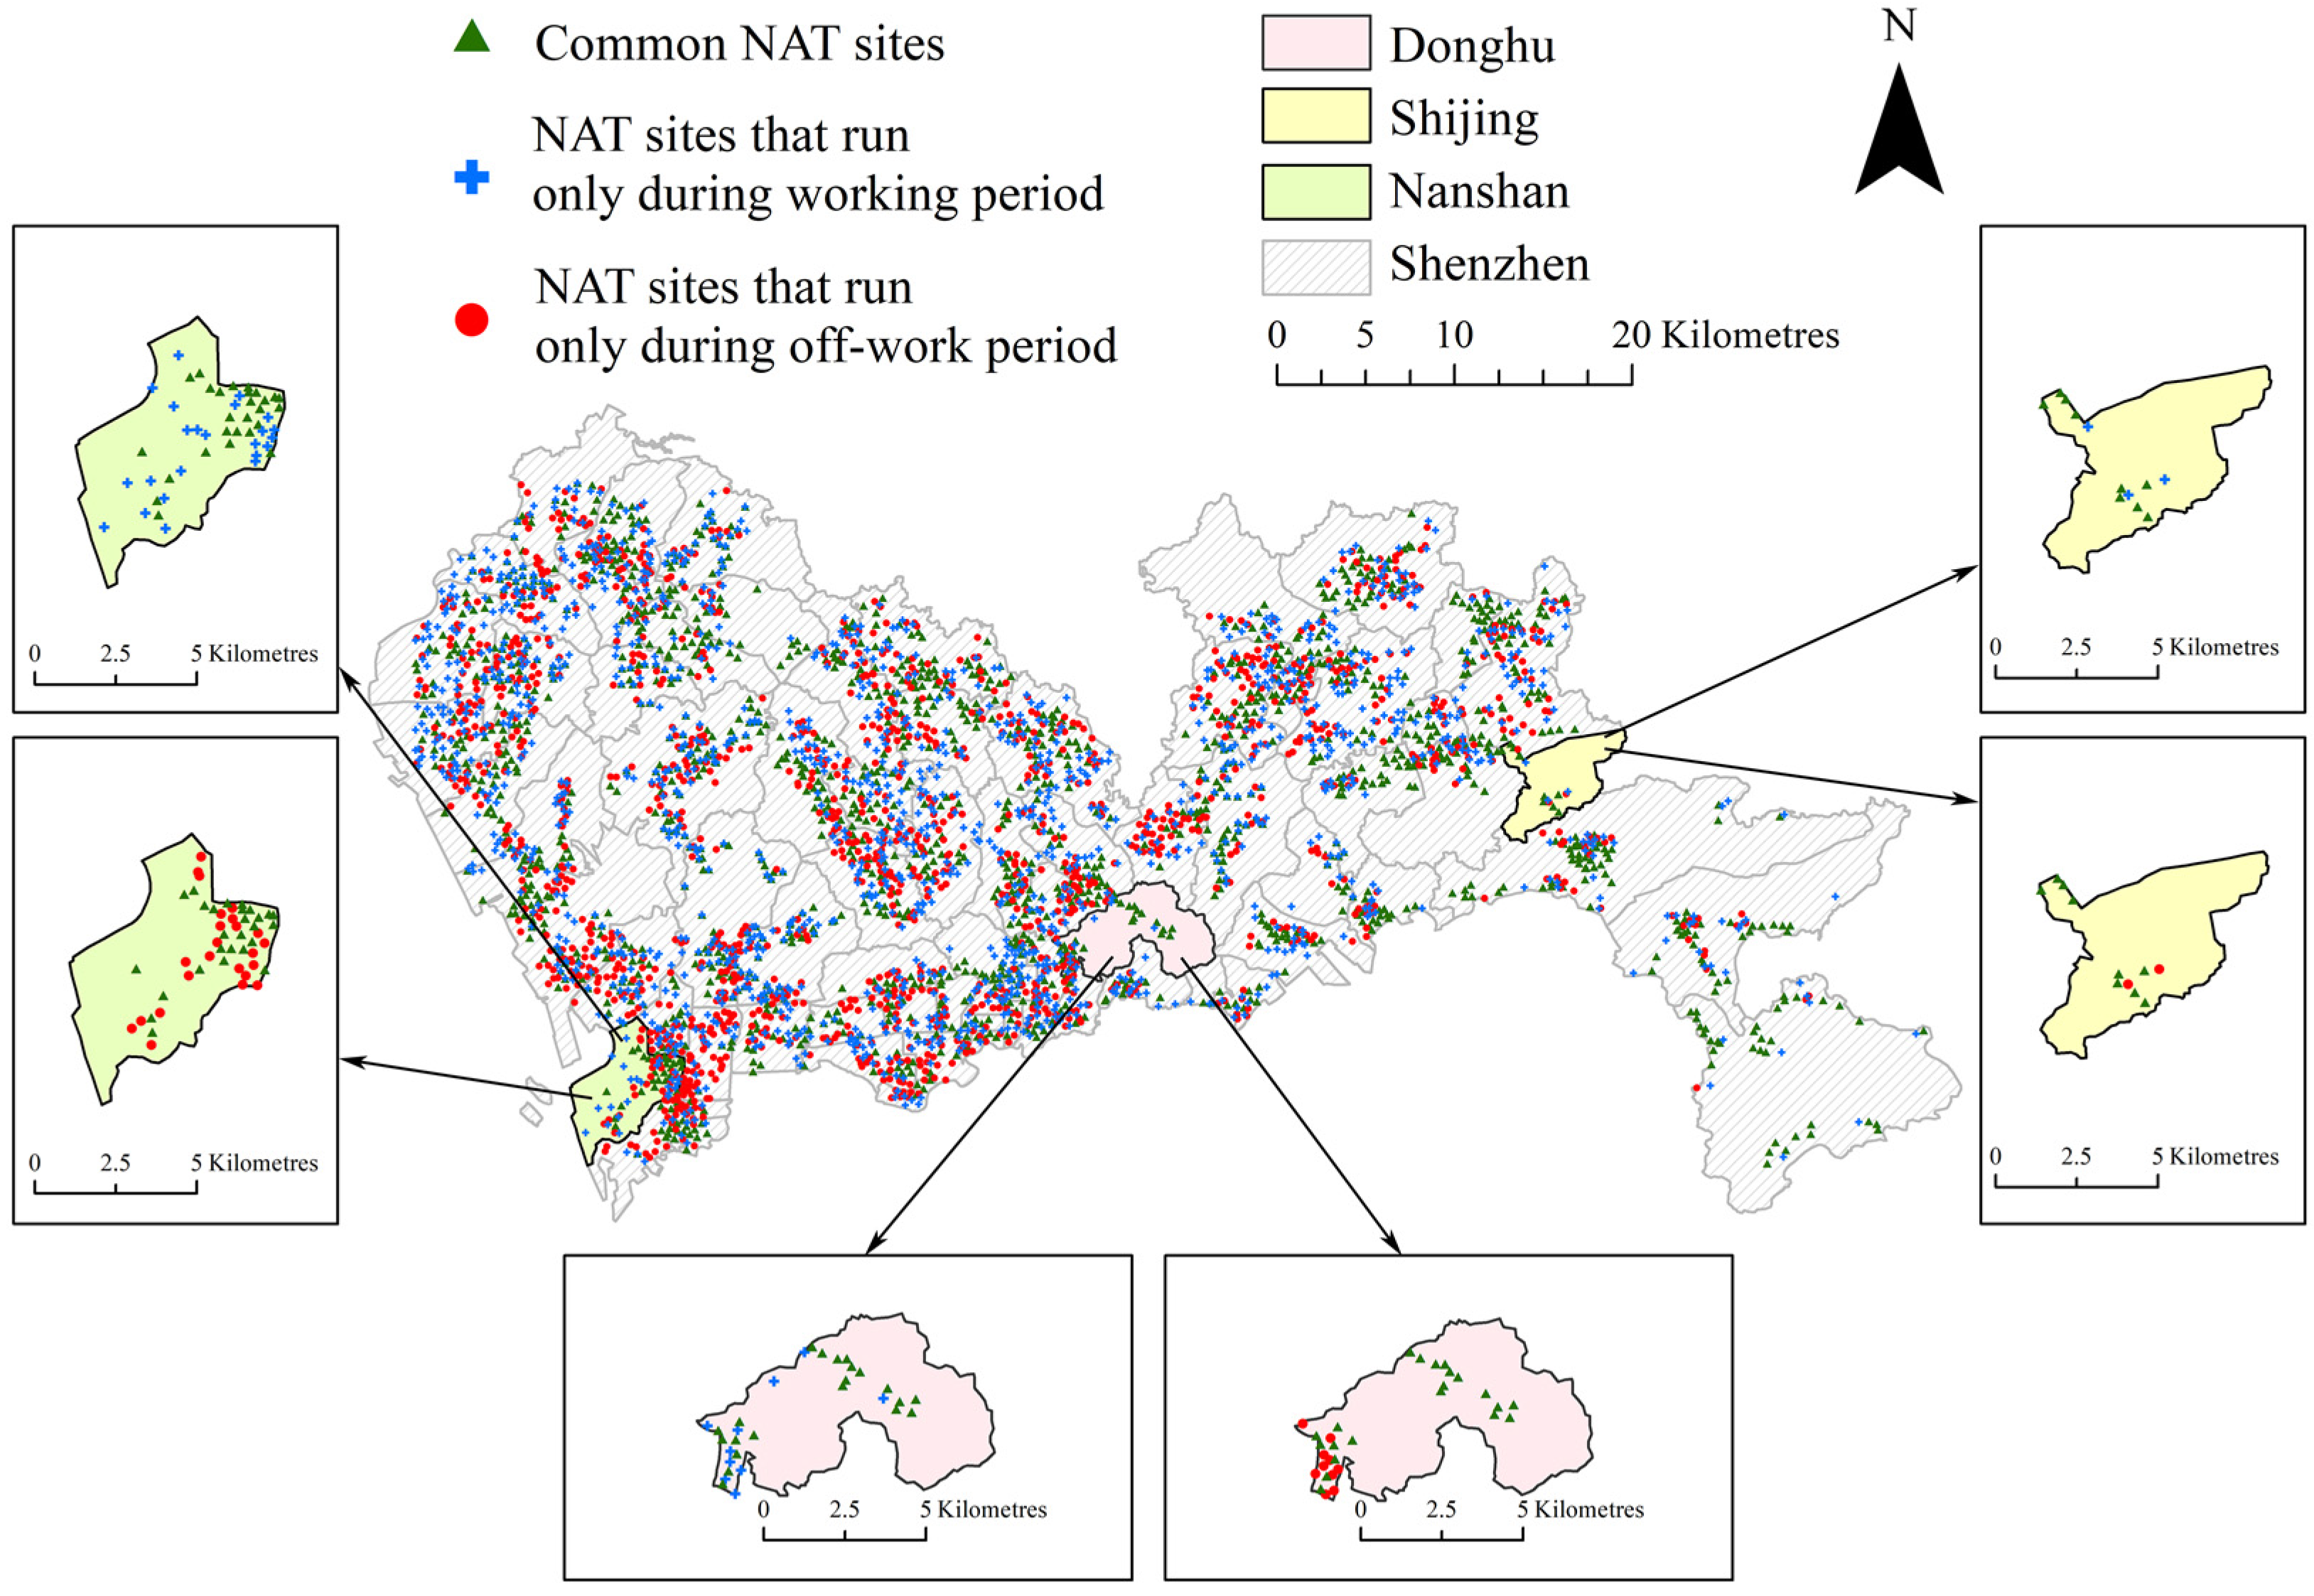
4.2. Comparison of NAT Sites in Two Time Periods
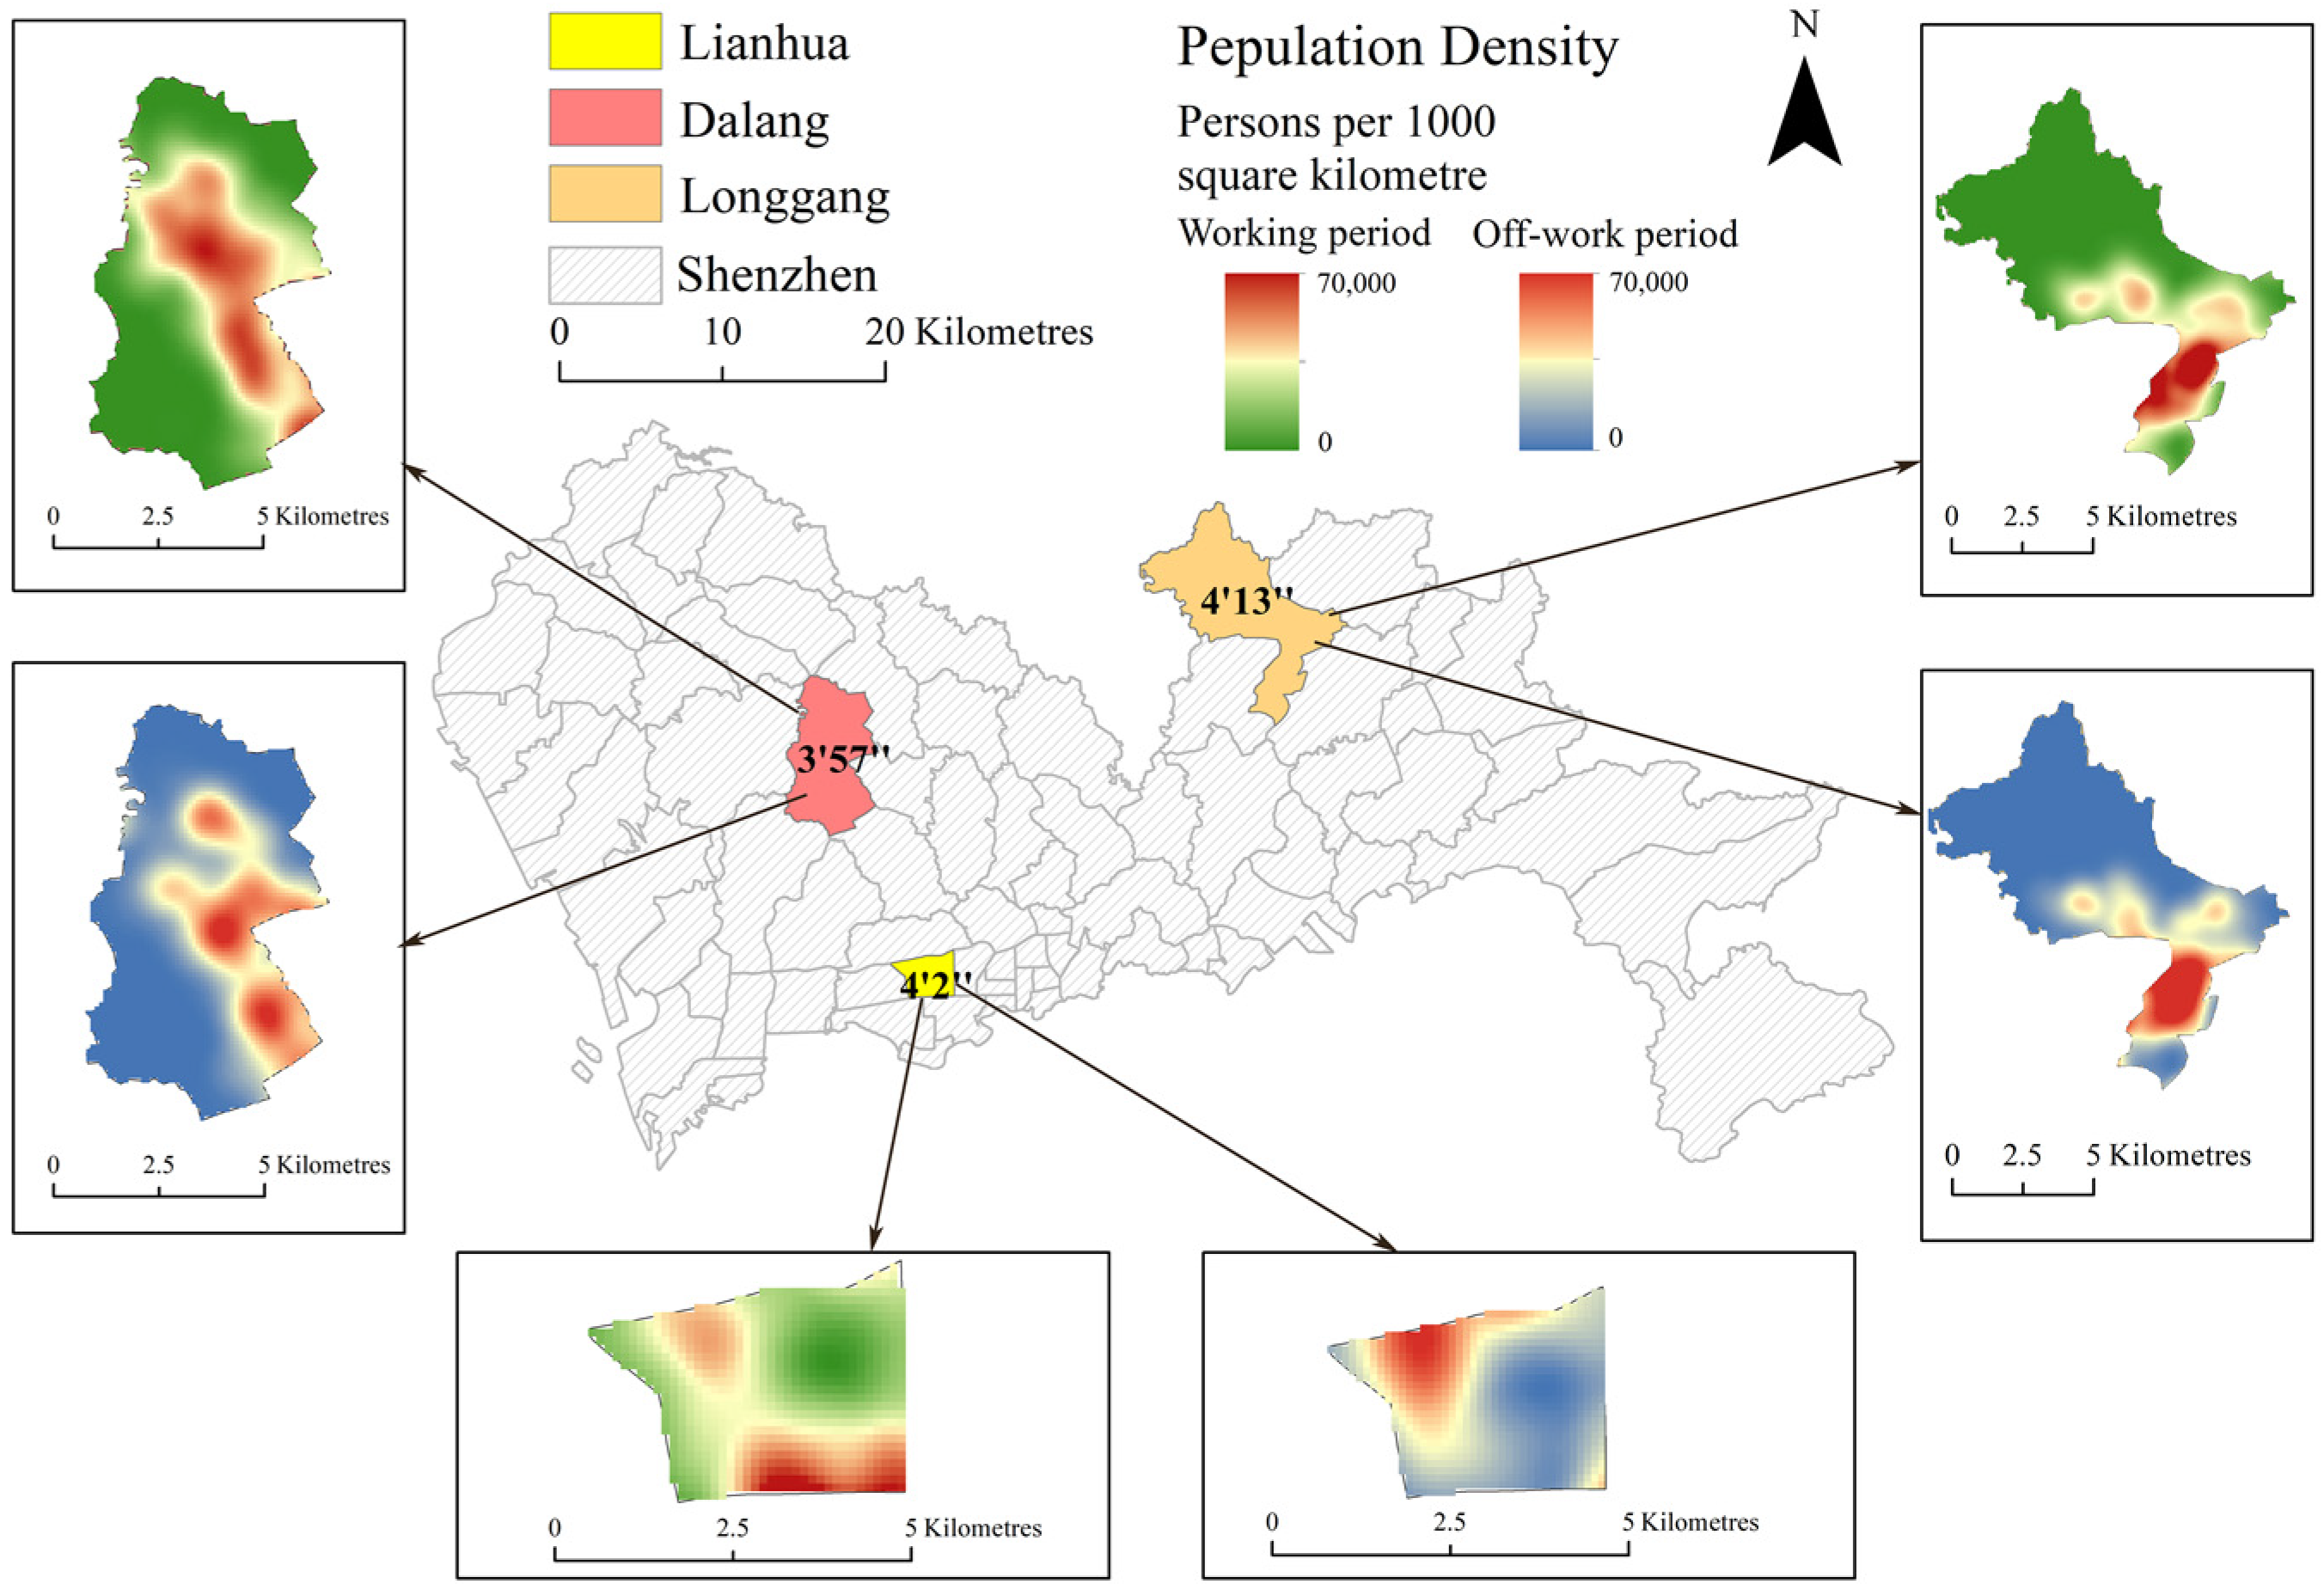
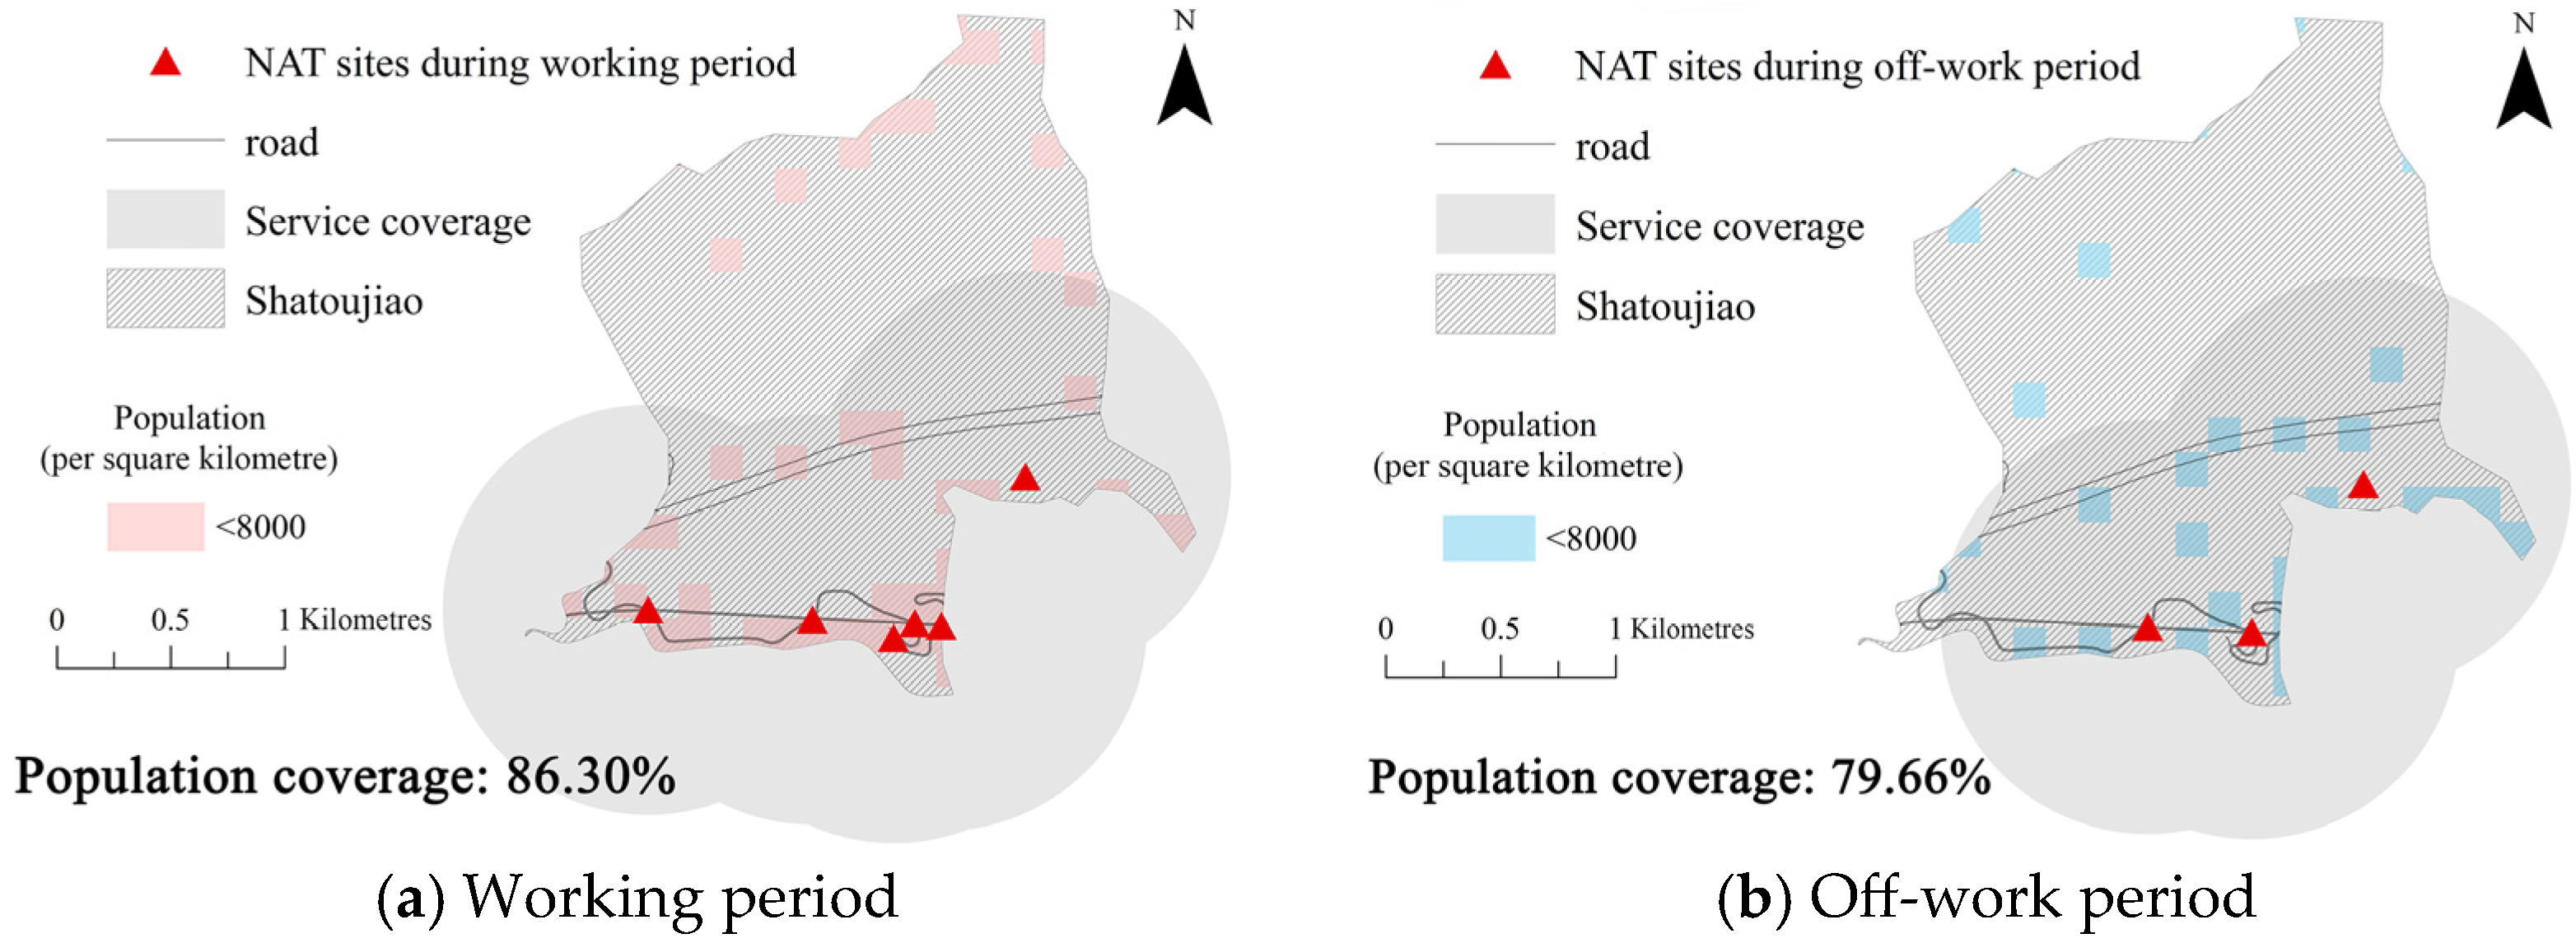
4.3. Performance Analysis in Regions with Varying Population Amount
4.4. Practice with Period Transition and the Relief of Prevention Policy
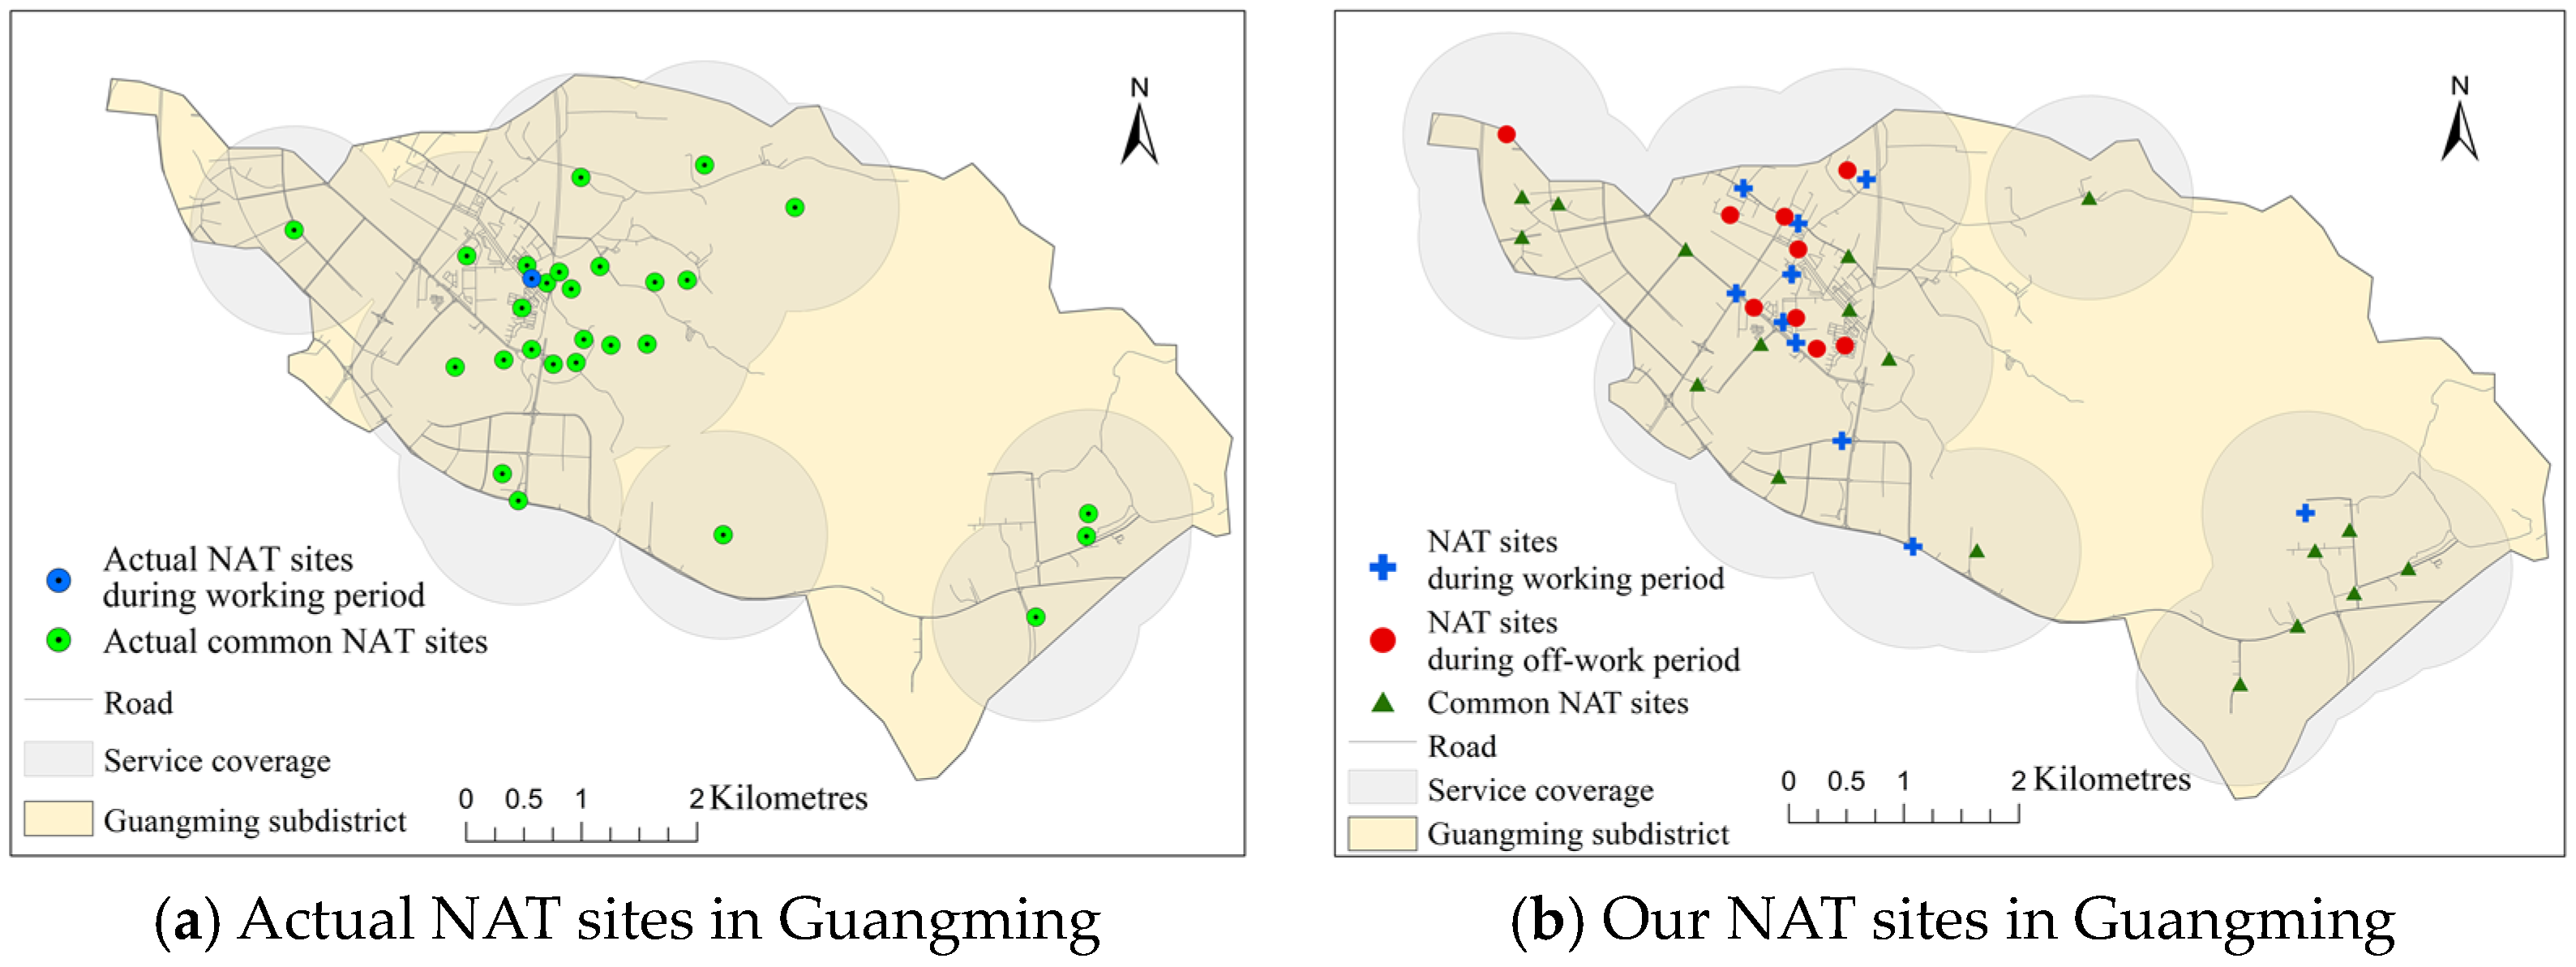
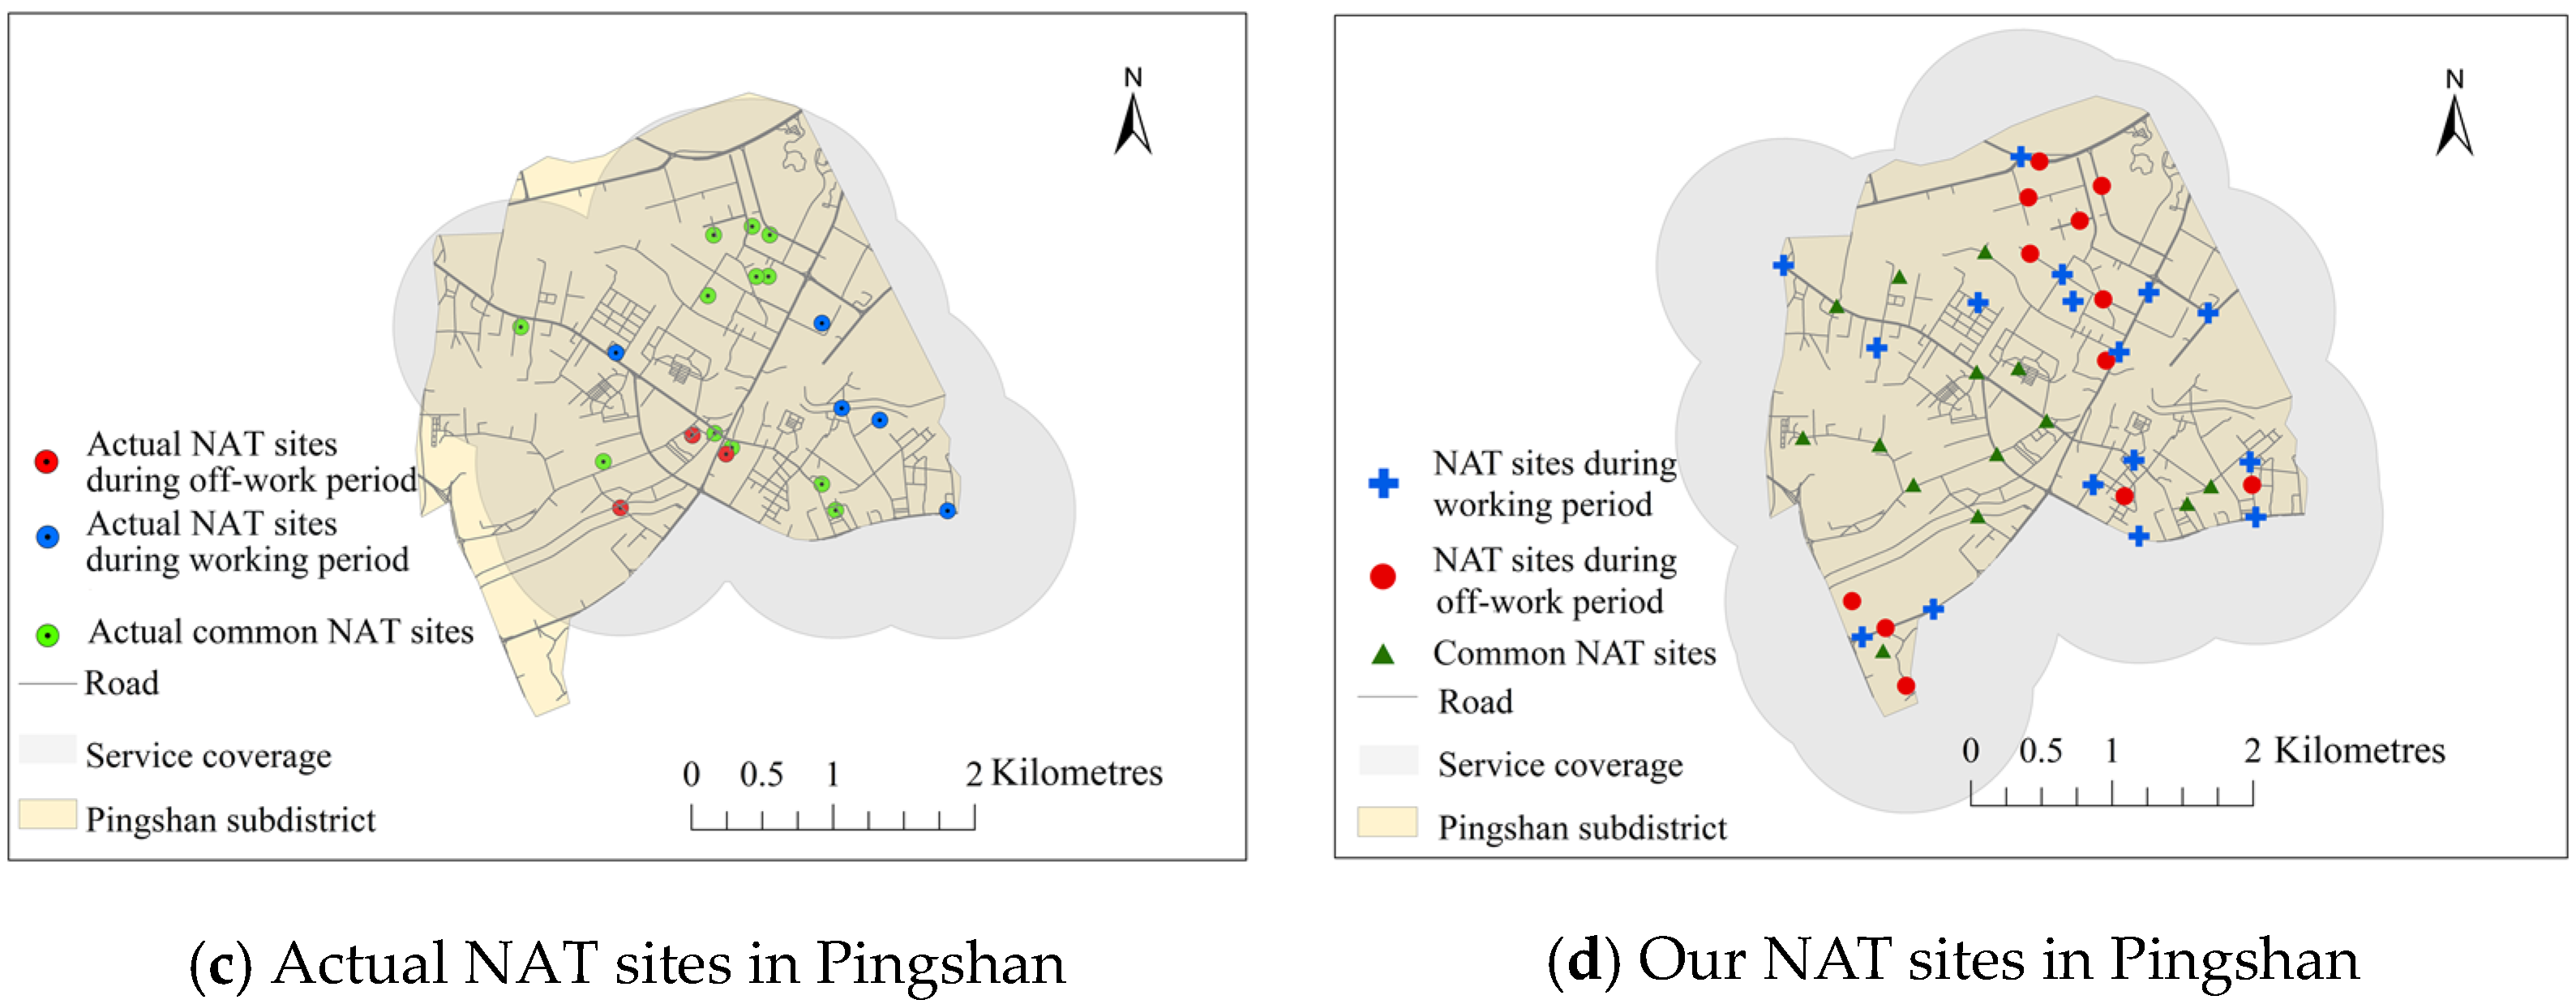
4.5. Comparison with the Actual NAT Sites in Shenzhen
5. Conclusions
Author Contributions
Funding
Data Availability Statement
Conflicts of Interest
Appendix A

| ID | Working Period | Off-work Period | # of Common Sites | ||||
|---|---|---|---|---|---|---|---|
| # of NAT Sites | Avg Time (min) | Population Coverage Rate | # of NAT Sites | Avg Time (min) | Population Coverage Rate | ||
| 1 | 52 | 4.31 | 99.97% | 50 | 4.5 | 98.51% | 18 |
| 2 | 78 | 4.56 | 99.36% | 64 | 4.35 | 99.65% | 27 |
| 3 | 35 | 4.16 | 99.57% | 31 | 3.7 | 99.76% | 25 |
| 4 | 26 | 6.33 | 96.73% | 26 | 6.27 | 99.94% | 12 |
| 5 | 12 | 3.14 | 100.00% | 10 | 5.66 | 100.00% | 3 |
| 6 | 52 | 4.64 | 99.71% | 41 | 4.05 | 99.70% | 26 |
| 7 | 44 | 0.56 | 95.16% | 42 | 1.09 | 98.17% | 28 |
| 8 | 31 | 0.59 | 98.49% | 31 | 1.05 | 99.16% | 21 |
| 9 | 7 | 4.39 | 100.00% | 9 | 3.74 | 100.00% | 2 |
| 10 | 15 | 3.59 | 100.00% | 11 | 1.4 | 100.00% | 7 |
| 11 | 44 | 3.77 | 99.73% | 45 | 3.72 | 99.90% | 31 |
| 12 | 56 | 3.9 | 99.59% | 60 | 3.48 | 99.92% | 24 |
| 13 | 58 | 4.88 | 99.28% | 48 | 4.52 | 99.04% | 19 |
| 14 | 11 | 3.88 | 99.98% | 13 | 3.08 | 100.00% | 4 |
| 15 | 19 | 5.12 | 97.84% | 24 | 4.58 | 100.00% | 7 |
| 16 | 53 | 4.09 | 99.41% | 49 | 3.81 | 99.89% | 29 |
| 17 | 43 | 4.04 | 99.89% | 38 | 3.52 | 99.91% | 24 |
| 18 | 48 | 4.22 | 99.90% | 52 | 3.81 | 99.28% | 30 |
| 19 | 66 | 4.53 | 99.46% | 71 | 3.95 | 99.68% | 40 |
| 20 | 28 | 4.97 | 97.86% | 27 | 4.21 | 99.12% | 18 |
| 21 | 8 | 4.53 | 100.00% | 11 | 3.95 | 100.00% | 5 |
| 22 | 16 | 4.05 | 99.95% | 15 | 4.1 | 99.26% | 7 |
| 23 | 62 | 5.16 | 99.07% | 65 | 4.86 | 99.43% | 35 |
| 24 | 40 | 4.44 | 99.60% | 42 | 4.26 | 98.48% | 8 |
| 25 | 17 | 4.13 | 99.73% | 16 | 3.64 | 99.86% | 8 |
| 26 | 10 | 3.33 | 100.00% | 7 | 4.96 | 99.99% | 4 |
| 27 | 17 | 4.29 | 99.36% | 17 | 4.58 | 99.77% | 6 |
| 28 | 41 | 4.45 | 99.42% | 40 | 3.86 | 98.81% | 22 |
| 29 | 78 | 4.79 | 98.84% | 79 | 4.16 | 98.14% | 40 |
| 30 | 66 | 4.65 | 97.86% | 66 | 3.96 | 98.16% | 46 |
| 31 | 18 | 4.43 | 99.83% | 25 | 3.54 | 100.00% | 7 |
| 32 | 25 | 3.63 | 99.70% | 17 | 4.44 | 99.81% | 10 |
| 33 | 66 | 5.07 | 99.30% | 76 | 4.39 | 99.74% | 32 |
| 34 | 53 | 4.67 | 99.47% | 53 | 5.28 | 98.50% | 27 |
| 35 | 48 | 4.68 | 100.00% | 38 | 5.14 | 99.36% | 20 |
| 36 | 31 | 3.88 | 99.88% | 29 | 3.81 | 99.86% | 25 |
| 37 | 29 | 4.29 | 98.74% | 31 | 3.26 | 99.63% | 17 |
| 38 | 50 | 5.02 | 99.93% | 43 | 4.05 | 99.03% | 17 |
| 39 | 25 | 4.14 | 99.84% | 28 | 3.94 | 99.93% | 12 |
| 40 | 29 | 3.79 | 98.83% | 30 | 3.15 | 99.40% | 19 |
| 41 | 61 | 4.3 | 99.75% | 67 | 4.15 | 99.93% | 26 |
| 42 | 45 | 0.06 | 98.35% | 39 | 0.06 | 98.73% | 36 |
| 43 | 9 | 4.59 | 100.00% | 7 | 5.67 | 100.00% | 5 |
| 44 | 50 | 0.44 | 98.50% | 51 | 0.55 | 98.27% | 27 |
| 45 | 30 | 4.01 | 99.81% | 30 | 4.52 | 99.85% | 11 |
| 46 | 56 | 4.52 | 99.25% | 62 | 3.64 | 99.44% | 27 |
| 47 | 7 | 4.93 | 100.00% | 10 | 3.38 | 100.00% | 5 |
| 48 | 89 | 5.07 | 99.63% | 80 | 4.62 | 99.65% | 36 |
| 49 | 64 | 5.4 | 97.17% | 67 | 4.72 | 98.02% | 33 |
| 50 | 30 | 4.26 | 99.72% | 26 | 4.21 | 100.00% | 14 |
| 51 | 36 | 1.33 | 99.89% | 22 | 2.23 | 98.55% | 21 |
| 52 | 33 | 4.52 | 99.51% | 33 | 4.61 | 98.57% | 16 |
| 53 | 63 | 5.57 | 99.60% | 53 | 5.57 | 98.55% | 23 |
| 54 | 6 | 15.74 | 86.30% | 5 | 35.24 | 79.66% | 3 |
| 55 | 27 | 4.22 | 99.18% | 31 | 3.99 | 99.47% | 11 |
| 56 | 17 | 3.64 | 99.92% | 15 | 3.61 | 99.95% | 12 |
| 57 | 12 | 2.65 | 99.36% | 11 | 2.68 | 99.20% | 9 |
| 58 | 98 | 6.09 | 99.02% | 98 | 4.52 | 99.49% | 56 |
| 59 | 43 | 7.27 | 97.33% | 46 | 6.02 | 96.61% | 23 |
| 60 | 13 | 4.08 | 100.00% | 13 | 3.53 | 100.00% | 5 |
| 61 | 58 | 1.79 | 99.76% | 63 | 2.07 | 99.91% | 35 |
| 62 | 69 | 1.63 | 98.44% | 69 | 1.37 | 99.34% | 36 |
| 63 | 58 | 1.6 | 98.55% | 78 | 1.72 | 99.51% | 30 |
| 64 | 23 | 3.82 | 100.00% | 24 | 4.54 | 100.00% | 10 |
| 65 | 59 | 2.74 | 99.18% | 47 | 4.22 | 96.33% | 20 |
| 66 | 50 | 3.55 | 98.94% | 40 | 4.06 | 98.51% | 27 |
| 67 | 60 | 4.63 | 99.77% | 64 | 4.19 | 99.80% | 31 |
| 68 | 31 | 0.21 | 99.60% | 31 | 0.27 | 99.52% | 19 |
| 69 | 20 | 4.34 | 95.80% | 17 | 7.04 | 95.47% | 11 |
| 70 | 44 | 4.97 | 99.06% | 38 | 4.43 | 98.91% | 16 |
| 71 | 31 | 4.14 | 99.72% | 29 | 3.53 | 99.75% | 18 |
| 72 | 6 | 6.14 | 97.02% | 10 | 4.6 | 100.00% | 2 |
| 73 | 56 | 4.73 | 99.71% | 61 | 4.22 | 99.77% | 44 |
| 74 | 28 | 5.13 | 98.36% | 55 | 2.76 | 100.00% | 4 |
| 75 | 30 | 0.12 | 97.30% | 37 | 0.05 | 98.21% | 11 |
References
- Fonkwo, P.N. Pricing Infectious Disease: The Economic and Health Implications of Infectious Diseases. EMBO Rep. 2008, 9, S13–S17. [Google Scholar] [CrossRef] [PubMed] [Green Version]
- Rana, J.S.; Khan, S.S.; Lloyd-Jones, D.M.; Sidney, S. Changes in Mortality in Top 10 Causes of Death from 2011 to 2018. J. Gen. Intern. Med. 2021, 36, 2517–2518. [Google Scholar] [CrossRef] [PubMed]
- Yin, Y.; Lin, J.; Yuan, S.; Tong, S.; Chen, E.; Zheng, J.; Wang, W. A Booster Shot of Vaccine against SARS-CoV-2 Should Be Rigorously Promoted and Implemented in China. J. Infect. 2022, 86, e49–e50. [Google Scholar] [CrossRef] [PubMed]
- Lu, J.; du Plessis, L.; Liu, Z.; Hill, V.; Kang, M.; Lin, H.; Sun, J.; François, S.; Kraemer, M.U.; Faria, N.R. Genomic Epidemiology of SARS-CoV-2 in Guangdong Province, China. Cell 2020, 181, 997–1003. [Google Scholar] [CrossRef]
- Siegler, A.J.; Sullivan, P.S.; Sanchez, T.; Lopman, B.; Fahimi, M.; Sailey, C.; Frankel, M.; Rothenberg, R.; Kelley, C.F.; Bradley, H. Protocol for a National Probability Survey Using Home Specimen Collection Methods to Assess Prevalence and Incidence of SARS-CoV-2 Infection and Antibody Response. Ann. Epidemiol. 2020, 49, 50–60. [Google Scholar] [CrossRef]
- Li, Z.; Liu, F.; Cui, J.; Peng, Z.; Chang, Z.; Lai, S.; Chen, Q.; Wang, L.; Gao, G.F.; Feng, Z. Comprehensive Large-Scale Nucleic Acid–Testing Strategies Support China’s Sustained Containment of COVID-19. Nat. Med. 2021, 27, 740–742. [Google Scholar] [CrossRef]
- Ali, S.A.; Parvin, F.; Al-Ansari, N.; Pham, Q.B.; Ahmad, A.; Raj, M.S.; Anh, D.T.; Ba, L.H.; Thai, V.N. Sanitary Landfill Site Selection by Integrating AHP and FTOPSIS with GIS: A Case Study of Memari Municipality, India. Environ. Sci. Pollut. Res. 2021, 28, 7528–7550. [Google Scholar] [CrossRef]
- Ajaj, Q.M.; Shareef, M.A.; Jasim, A.T.; Hasan, S.F.; Noori, A.M.; Hassan, N.D. An AHP-Based GIS for a New Hospital Site Selection in the Kirkuk Governorate. In Proceedings of the 2019 2nd International Conference on Electrical, Communication, Computer, Power and Control Engineering (ICECCPCE), Mosul, Iraq, 13–14 February 2019; pp. 176–181. [Google Scholar]
- Hashemkhani Zolfani, S.; Yazdani, M.; Ebadi Torkayesh, A.; Derakhti, A. Application of a Gray-Based Decision Support Framework for Location Selection of a Temporary Hospital during COVID-19 Pandemic. Symmetry 2020, 12, 886. [Google Scholar] [CrossRef]
- Harper, P.R.; Shahani, A.; Gallagher, J.; Bowie, C. Planning Health Services with Explicit Geographical Considerations: A Stochastic Location–Allocation Approach. Omega 2005, 33, 141–152. [Google Scholar] [CrossRef]
- Karatas, M. A Dynamic Multi-Objective Location-Allocation Model for Search and Rescue Assets. Eur. J. Oper. Res. 2021, 288, 620–633. [Google Scholar] [CrossRef]
- Devi, Y.; Patra, S.; Singh, S.P. A Location-Allocation Model for Influenza Pandemic Outbreaks: A Case Study in India. Oper. Manag. Res. 2021, 15, 487–502. [Google Scholar] [CrossRef]
- Liu, M.; Xu, X.; Cao, J.; Zhang, D. Integrated Planning for Public Health Emergencies: A Modified Model for Controlling H1N1 Pandemic. J. Oper. Res. Soc. 2020, 71, 748–761. [Google Scholar] [CrossRef]
- He, L.; Xie, Z. Optimization of Urban Shelter Locations Using Bi-Level Multi-Objective Location-Allocation Model. Int. J. Environ. Res. Public Health 2022, 19, 4401. [Google Scholar] [CrossRef]
- Liu, J.; Li, Y.; Li, Y.; Chen, Z.; Lian, X.; Zhang, Y. Location Optimization of Emergency Medical Facilities for Public Health Emergencies in Megacities Based on Genetic Algorithm. Eng. Constr. Archit. Manag. 2022. [Google Scholar] [CrossRef]
- Wang, W.; Wu, S.; Wang, S.; Zhen, L.; Qu, X. Emergency Facility Location Problems in Logistics: Status and Perspectives. Transp. Res. Part E: Logist. Transp. Rev. 2021, 154, 102465. [Google Scholar] [CrossRef]
- Celik Turkoglu, D.; Erol Genevois, M. A Comparative Survey of Service Facility Location Problems. Ann. Oper. Res. 2020, 292, 399–468. [Google Scholar] [CrossRef]
- Lei, T.L. Integrating GIS and Location Modeling: A Relational Approach. Trans. GIS 2021, 25, 1693–1715. [Google Scholar] [CrossRef]
- Chen, Y.; Tao, R.; Downs, J. Location Optimization of COVID-19 Vaccination Sites: Case in Hillsborough County, Florida. Int. J. Environ. Res. Public Health 2022, 19, 12443. [Google Scholar] [CrossRef]
- Taiwo, O.J. Maximal Covering Location Problem (MCLP) for the Identification of Potential Optimal COVID-19 Testing Facility Sites in Nigeria. Afr. Geogr. Rev. 2021, 40, 395–411. [Google Scholar] [CrossRef]
- Murray, A.T.; Xu, J.; Wang, Z.; Church, R.L. Commercial GIS Location Analytics: Capabilities and Performance. Int. J. Geogr. Inf. Sci. 2019, 33, 1106–1130. [Google Scholar] [CrossRef]
- Peng, J.; Liu, Y.; Ruan, Z.; Yang, H. Study on the Optimal Allocation of Public Service Facilities from the Perspective of Living Circle—A Case Study of Xiangyang High-Tech Zone, China; Research Square: Durham, NC, USA, 2022. [Google Scholar] [CrossRef]
- Gomez, D.; Larsen, K.; Burns, B.J.; Dinh, M.; Hsu, J. Optimizing Access and Configuration of Trauma Centre Care in New South Wales. Injury 2019, 50, 1105–1110. [Google Scholar] [CrossRef] [PubMed]
- Kuldeep; Banu, V.; Uniyal, S.; Nagaraja, R. Space Based Inputs for Health Service Development Planning in Rural Areas Using GIS. Geod. Cartogr. 2017, 43, 28–34. [Google Scholar]
- Han, B.; Hu, M.; Wang, J. Site Selection for Pre-Hospital Emergency Stations Based on the Actual Spatiotemporal Demand: A Case Study of Nanjing City, China. ISPRS Int. J. Geo-Inf. 2020, 9, 559. [Google Scholar] [CrossRef]
- Hengel, B.; Causer, L.; Matthews, S.; Smith, K.; Andrewartha, K.; Badman, S.; Spaeth, B.; Tangey, A.; Cunningham, P.; Saha, A. A Decentralised Point-of-Care Testing Model to Address Inequities in the COVID-19 Response. Lancet Infect. Dis. 2021, 21, e183–e190. [Google Scholar] [CrossRef] [PubMed]
- Zhou, X.; Wang, Z. Location Planning of Energy Station Based on P-Median Model. In Proceedings of the Seventh International Conference on Electromechanical Control Technology and Transportation (ICECTT 2022), Dalian, China, 13–15 May 2022; Volume 12302, pp. 1109–1117. [Google Scholar]
- Mu, W.; Tong, D. On Solving Large P-Median Problems. Environ. Plan. B Urban Anal. City Sci. 2020, 47, 981–996. [Google Scholar] [CrossRef]
- Grekousis, G.; Liu, Y. Where Will the next Emergency Event Occur? Predicting Ambulance Demand in Emergency Medical Services Using Artificial Intelligence. Comput. Environ. Urban Syst. 2019, 76, 110–122. [Google Scholar] [CrossRef]
- Li, Z.; Xie, C.; Peng, P.; Gao, X.; Wan, Q. Multi-Objective Location-Scale Optimization Model and Solution Methods for Large-Scale Emergency Rescue Resources. Environ. Sci. Pollut. Res. 2021, 1–14. [Google Scholar] [CrossRef]
- Fang, Y. Large-scale National Screening for Coronavirus Disease 2019 in China. J. Med. Virol. 2020, 92, 2266–2268. [Google Scholar] [CrossRef]
- Cao, S.; Gan, Y.; Wang, C.; Bachmann, M.; Wei, S.; Gong, J.; Huang, Y.; Wang, T.; Li, L.; Lu, K. Post-Lockdown SARS-CoV-2 Nucleic Acid Screening in Nearly Ten Million Residents of Wuhan, China. Nat. Commun. 2020, 11, 5917. [Google Scholar] [CrossRef]
- Deb, K. Multi-Objective Optimization. In Search Methodologies; Springer: Berlin/Heidelberg, Germany, 2014; pp. 403–449. [Google Scholar]
- Mishra, S.; Sahu, P.K.; Sarkar, A.K.; Mehran, B.; Sharma, S. Geo-Spatial Site Suitability Analysis for Development of Health Care Units in Rural India: Effects on Habitation Accessibility, Facility Utilization and Zonal Equity in Facility Distribution. J. Transp. Geogr. 2019, 78, 135–149. [Google Scholar] [CrossRef]
- Murray, A.T. Contemporary Optimization Application through Geographic Information Systems. Omega 2021, 99, 102176. [Google Scholar] [CrossRef]
- Ramya, S.; Devadas, V. Integration of GIS, AHP and TOPSIS in Evaluating Suitable Locations for Industrial Development: A Case of Tehri Garhwal District, Uttarakhand, India. J. Clean. Prod. 2019, 238, 117872. [Google Scholar] [CrossRef]
- Firozjaei, M.K.; Nematollahi, O.; Mijani, N.; Shorabeh, S.N.; Firozjaei, H.K.; Toomanian, A. An Integrated GIS-Based Ordered Weighted Averaging Analysis for Solar Energy Evaluation in Iran: Current Conditions and Future Planning. Renew. Energy 2019, 136, 1130–1146. [Google Scholar] [CrossRef]
- Yu, G.; Ma, L.; Jin, Y.; Du, W.; Liu, Q.; Zhang, H. A Survey on Knee-Oriented Multi-Objective Evolutionary Optimization. IEEE Trans. Evol. Comput. 2022, 26, 1452–1472. [Google Scholar] [CrossRef]
- Zhang, K.; Shen, C.; He, J.; Yen, G.G. Knee Based Multimodal Multi-Objective Evolutionary Algorithm for Decision Making. Inf. Sci. 2021, 544, 39–55. [Google Scholar] [CrossRef]
- Yu, G.; Jin, Y.; Olhofer, M. Benchmark Problems and Performance Indicators for Search of Knee Points in Multiobjective Optimization. IEEE Trans. Cybern. 2019, 50, 3531–3544. [Google Scholar] [CrossRef]
- Deb, K.; Gupta, S. Understanding Knee Points in Bicriteria Problems and Their Implications as Preferred Solution Principles. Eng. Optim. 2011, 43, 1175–1204. [Google Scholar] [CrossRef]
- Das, I. On Characterizing the “Knee” of the Pareto Curve Based on Normal-Boundary Intersection. Struct. Optim. 1999, 18, 107–115. [Google Scholar] [CrossRef]
- Chiu, W.-Y.; Yen, G.G.; Juan, T.-K. Minimum Manhattan Distance Approach to Multiple Criteria Decision Making in Multiobjective Optimization Problems. IEEE Trans. Evol. Comput. 2016, 20, 972–985. [Google Scholar] [CrossRef] [Green Version]
- Satopaa, V.; Albrecht, J.; Irwin, D.; Raghavan, B. Finding a “Kneedle” in a Haystack: Detecting Knee Points in System Behavior. In Proceedings of the 2011 31st International Conference on Distributed Computing Systems Workshops, Minneapolis, MN, USA, 20–24 June 2011; pp. 166–171. [Google Scholar]
- He, L.; Ishibuchi, H.; Trivedi, A.; Wang, H.; Nan, Y.; Srinivasan, D. A Survey of Normalization Methods in Multiobjective Evolutionary Algorithms. IEEE Trans. Evol. Comput. 2021, 25, 1028–1048. [Google Scholar] [CrossRef]
- He, Z.; Yen, G.G.; Ding, J. Knee-Based Decision Making and Visualization in Many-Objective Optimization. IEEE Trans. Evol. Comput. 2020, 25, 292–306. [Google Scholar] [CrossRef]
- Li, K.; Nie, H.; Gao, H.; Yao, X. Posterior Decision Making Based on Decomposition-Driven Knee Point Identification. IEEE Trans. Evol. Comput. 2021, 26, 1409–1423. [Google Scholar] [CrossRef]
- Branke, J. Consideration of Partial User Preferences in Evolutionary Multiobjective Optimization. Multiobjective Optim. 2008, 157–178. [Google Scholar] [CrossRef]
- Zheng, Z. From the Past to the Future: What We Learn from China’s 2020 Census. China Popul. Dev. Stud. 2021, 5, 101–106. [Google Scholar] [CrossRef]
- ReVelle, C.S.; Williams, J.C.; Boland, J.J. Counterpart Models in Facility Location Science and Reserve Selection Science. Environ. Model. Assess. 2002, 7, 71–80. [Google Scholar] [CrossRef]
- Gao, Q.; Shang, W.-P.; Jing, M.-X. Effect of Nucleic Acid Screening Measures on COVID-19 Transmission in Cities of Different Scales and Assessment of Related Testing Resource Demands—Evidence from China. Int. J. Environ. Res. Public Health 2022, 19, 13343. [Google Scholar] [CrossRef]
- Lyu, Y.; Rong, S.; Sun, F.; Xiang, C.; Li, J. Management of an Emergency Sample Collection Team under the Setting of Whole-Community Severe Acute Respiratory Syndrome Coronavirus 2 Nucleic Acid Testing. Int. Health 2022, 57. [Google Scholar] [CrossRef]
- Daskalakis, D.; McClung, R.P.; Mena, L.; Mermin, J. Centers for Disease Control and Prevention’s Monkeypox Response Team* Monkeypox: Avoiding the Mistakes of Past Infectious Disease Epidemics. Ann. Intern. Med. 2022, 175, 1177–1178. [Google Scholar] [CrossRef]


| ID | Categories | Typical Facilities |
|---|---|---|
| 1 | Scenic spots | Tourist attraction, park square, park, zoo, botanical garden, aquarium, city square, etc. |
| 2 | Shopping mall | Store, supermarket, shopping centre, general mall, etc. |
| 3 | Transportation facility | Airport, railway station, port terminal, passenger station, etc. |
| 4 | Educational and cultural venue | Higher education institutions, secondary schools, elementary schools, museums, etc. |
| 5 | Business house | Residential areas, business office buildings, industrial parks, villas, etc. |
| 6 | Sports and leisure place | Fitness centre, cinema, KTV, tennis court, gymnasium, etc. |
| 7 | Medical institution | Hospital, clinic, health centre, specialised hospital, etc. |
| Plan | Population Coverage (%) | |
|---|---|---|
| Working Period | Off-Work Period | |
| Optimal plan for working period | 99.53 | 98.75 |
| Optimal plan for off-work period | 99.63 | 99.48 |
| Subdistrict Name | Proportion of Remained NAT Sites (%) | Working Period | Off-Work Period | ||
|---|---|---|---|---|---|
| # of NAT Sites | Avg Time (min) | # of NAT Sites | Avg Time (min) | ||
| Dalang | 100 | 52 | 4.64 | 41 | 4.05 |
| 50 | 26 | 6.35 | 21 | 7.11 | |
| 25 | 13 | 9.83 | 10 | 11.56 | |
| 12.5 | 7 | 14.46 | 5 | 17.78 | |
| Lianhua | 100 | 18 | 4.43 | 25 | 3.54 |
| 50 | 9 | 6.72 | 13 | 5.17 | |
| 25 | 5 | 10.11 | 6 | 9.10 | |
| 12.5 | 2 | 17.77 | 3 | 13.05 | |
| Longgang | 100 | 53 | 4.67 | 53 | 5.28 |
| 50 | 27 | 7.63 | 27 | 6.44 | |
| 25 | 13 | 11.49 | 13 | 10.41 | |
| 12.5 | 7 | 16.63 | 7 | 15.80 | |
| Subdistrict | Period | # of NAT site | Population Coverage | Average Time to Access (min) | |||
|---|---|---|---|---|---|---|---|
| Actual | Ours | Actual | Ours | Actual | Ours | ||
| Guangming | Working | 28 | 28 | 81% | 98% | 9.33 | 4.97 |
| Off-work | 27 | 27 | 88% | 99% | 8.44 | 4.21 | |
| Pingshan | Working | 17 | 30 | 76% | 100% | 9.41 | 4.26 |
| Off-work | 15 | 26 | 76% | 100% | 8.37 | 4.21 | |
| Pingshan (After sampling) | Working | 17 | 17 | 76% | 97 ± 1.66% | 9.41 | 5.31 ± 0.68 |
| Off-work | 15 | 15 | 76% | 99 ± 0.12% | 8.37 | 4.37 ± 0.03 | |
Disclaimer/Publisher’s Note: The statements, opinions and data contained in all publications are solely those of the individual author(s) and contributor(s) and not of MDPI and/or the editor(s). MDPI and/or the editor(s) disclaim responsibility for any injury to people or property resulting from any ideas, methods, instructions or products referred to in the content. |
© 2023 by the authors. Licensee MDPI, Basel, Switzerland. This article is an open access article distributed under the terms and conditions of the Creative Commons Attribution (CC BY) license (https://creativecommons.org/licenses/by/4.0/).
Share and Cite
Wang, S.; Sun, Q.; Chen, P.; Qiu, H.; Chen, Y. Location Scheme of Routine Nucleic Acid Testing Sites Based on Location-Allocation Models: A Case Study of Shenzhen City. ISPRS Int. J. Geo-Inf. 2023, 12, 152. https://doi.org/10.3390/ijgi12040152
Wang S, Sun Q, Chen P, Qiu H, Chen Y. Location Scheme of Routine Nucleic Acid Testing Sites Based on Location-Allocation Models: A Case Study of Shenzhen City. ISPRS International Journal of Geo-Information. 2023; 12(4):152. https://doi.org/10.3390/ijgi12040152
Chicago/Turabian StyleWang, Siwaner, Qian Sun, Pengfei Chen, Hui Qiu, and Yang Chen. 2023. "Location Scheme of Routine Nucleic Acid Testing Sites Based on Location-Allocation Models: A Case Study of Shenzhen City" ISPRS International Journal of Geo-Information 12, no. 4: 152. https://doi.org/10.3390/ijgi12040152