

Detecting Urban Commercial Districts by Fusing Points of Interest and Population Heat Data with Region-Growing Algorithms

Abstract
:1. Introduction
2. Related Work
2.1. Concept of Commercial Districts
2.2. Data Used for UCD Detection
2.3. Geographical Units of UCD Detection
2.4. UCD Detection Methods
3. Study Area and Data
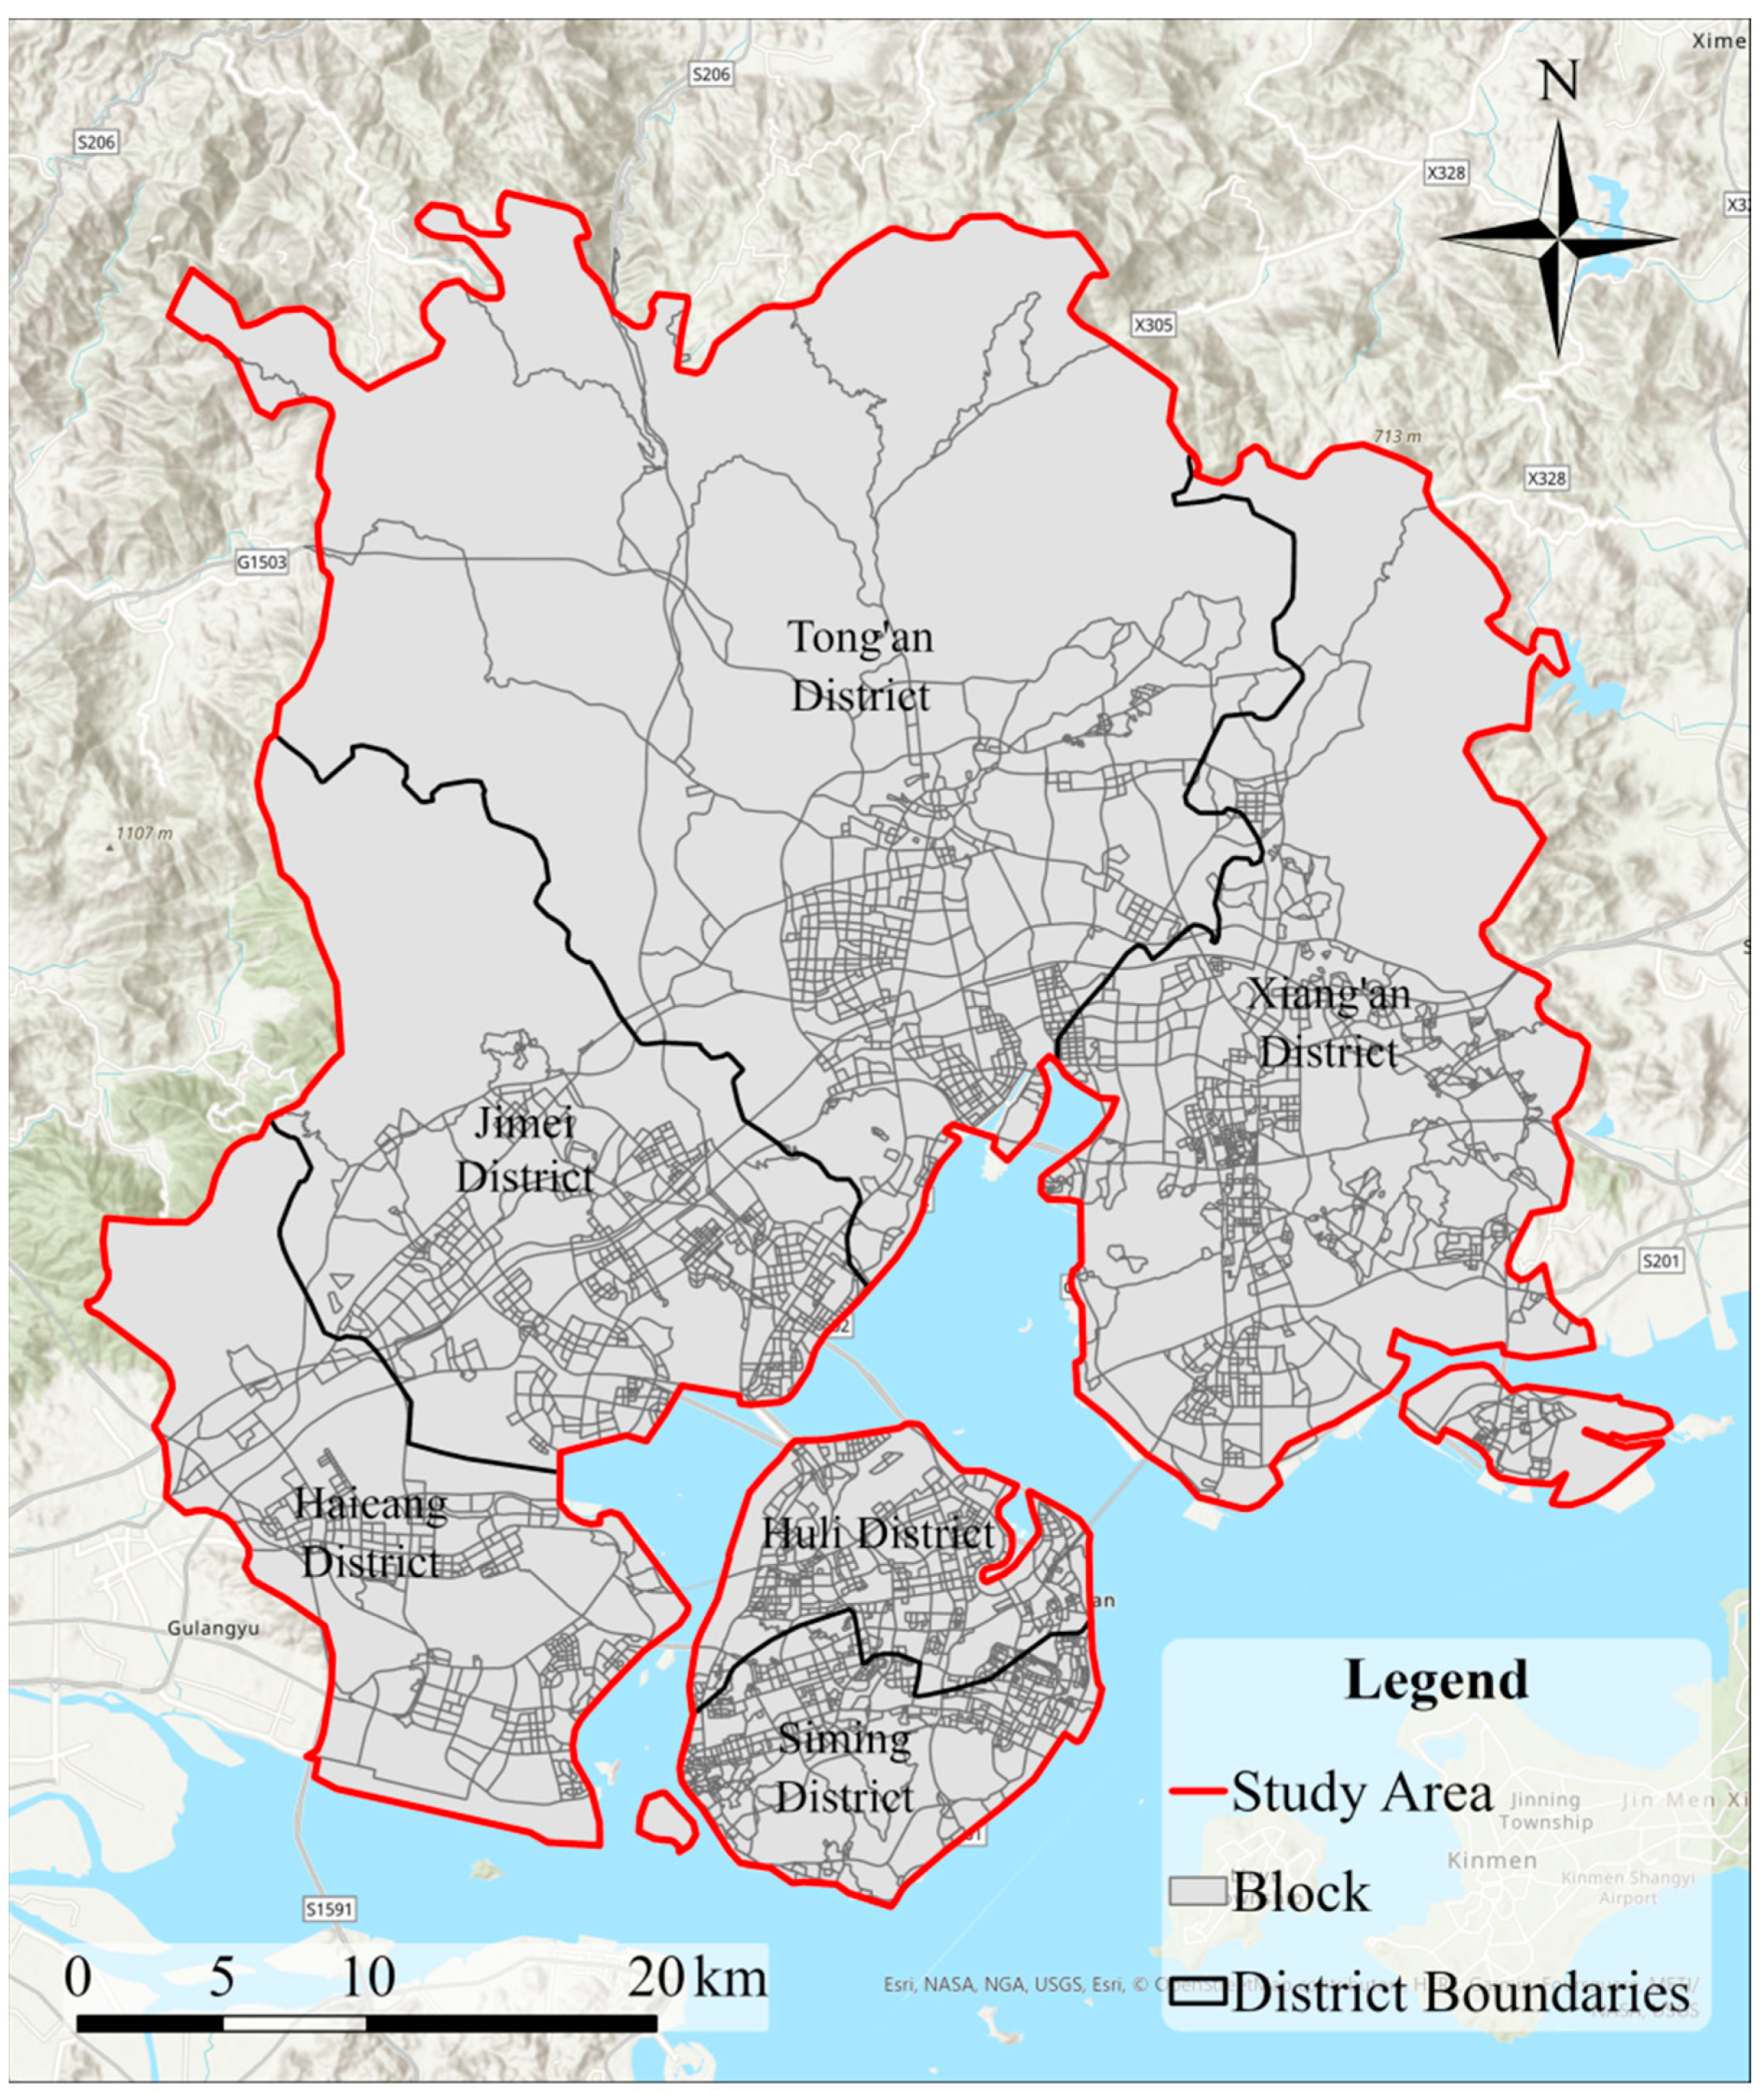
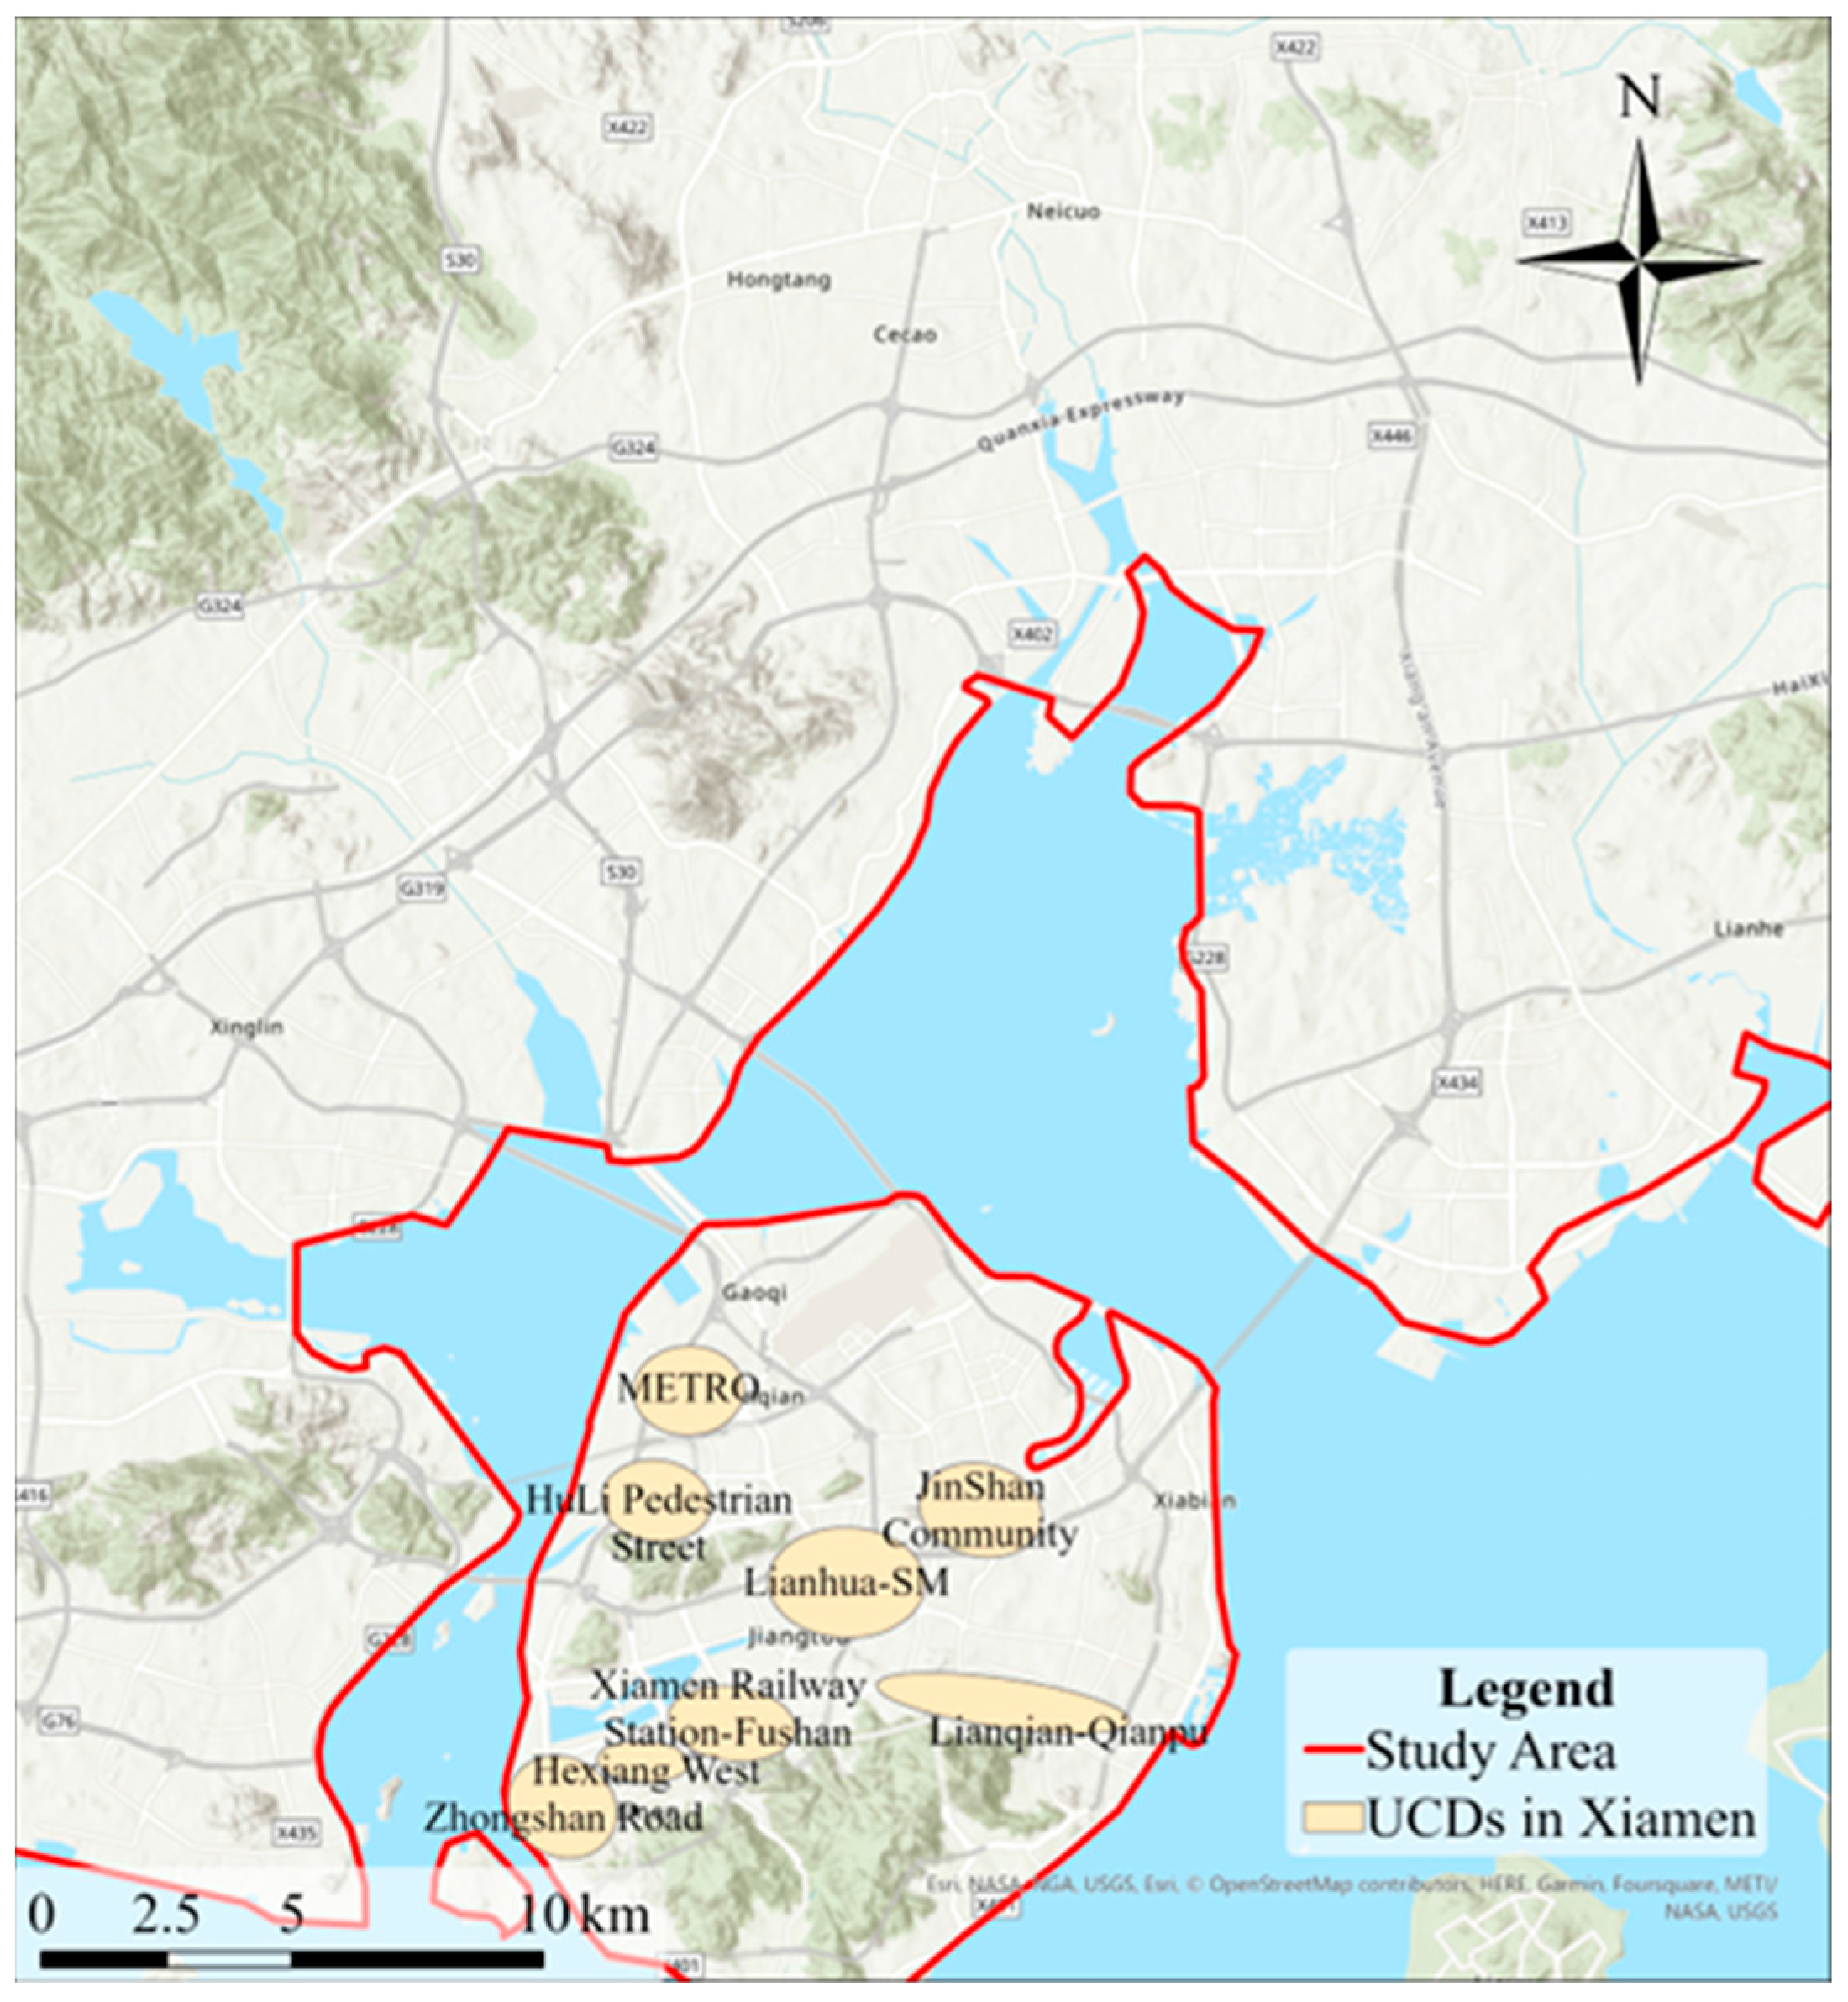
3.1. Study Area Description
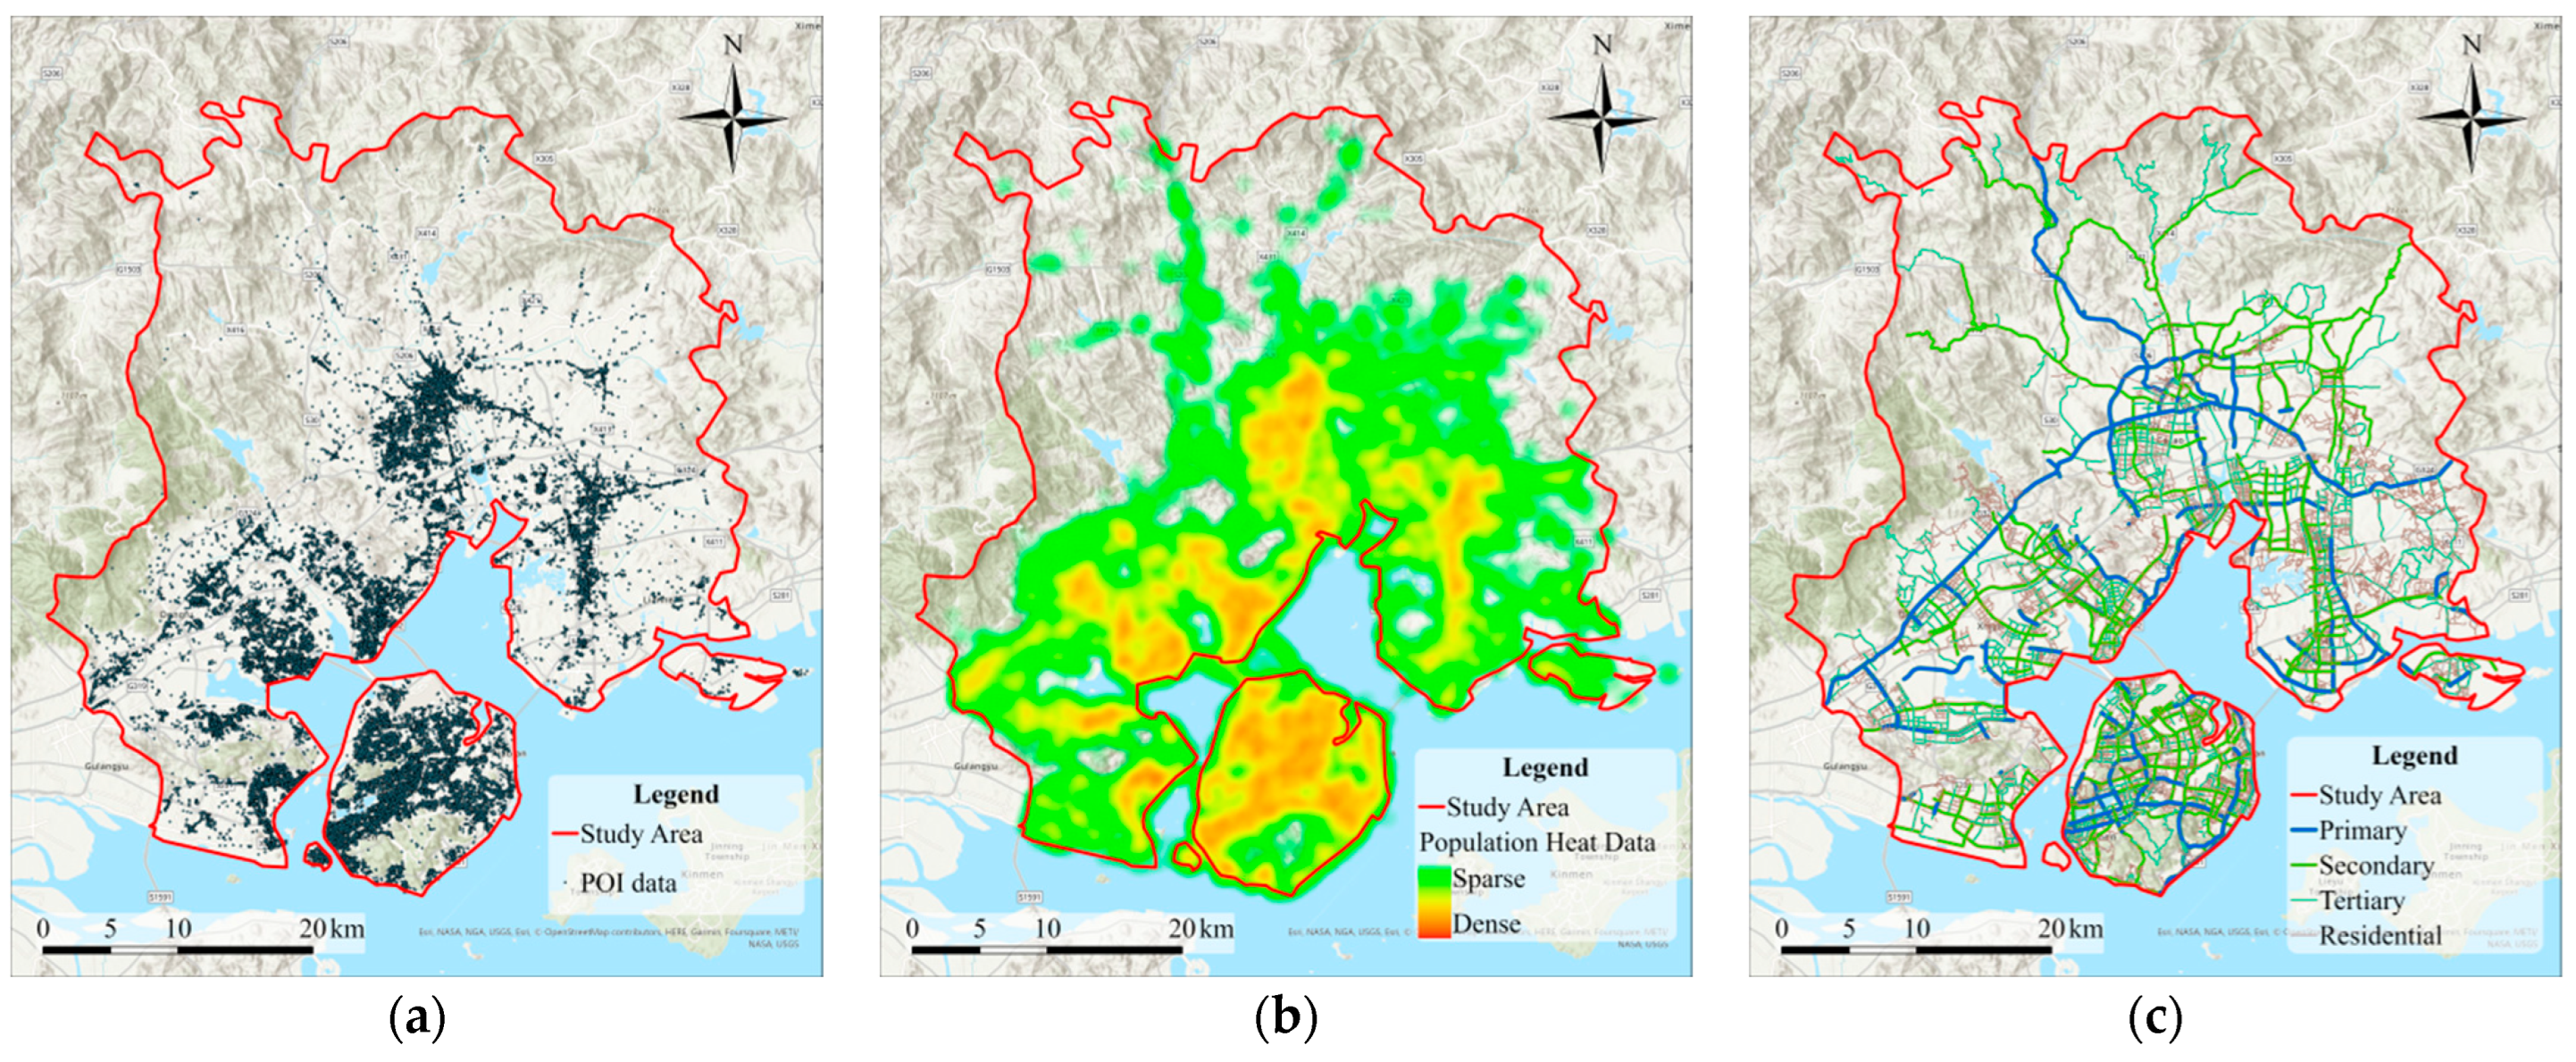
3.2. Research Data
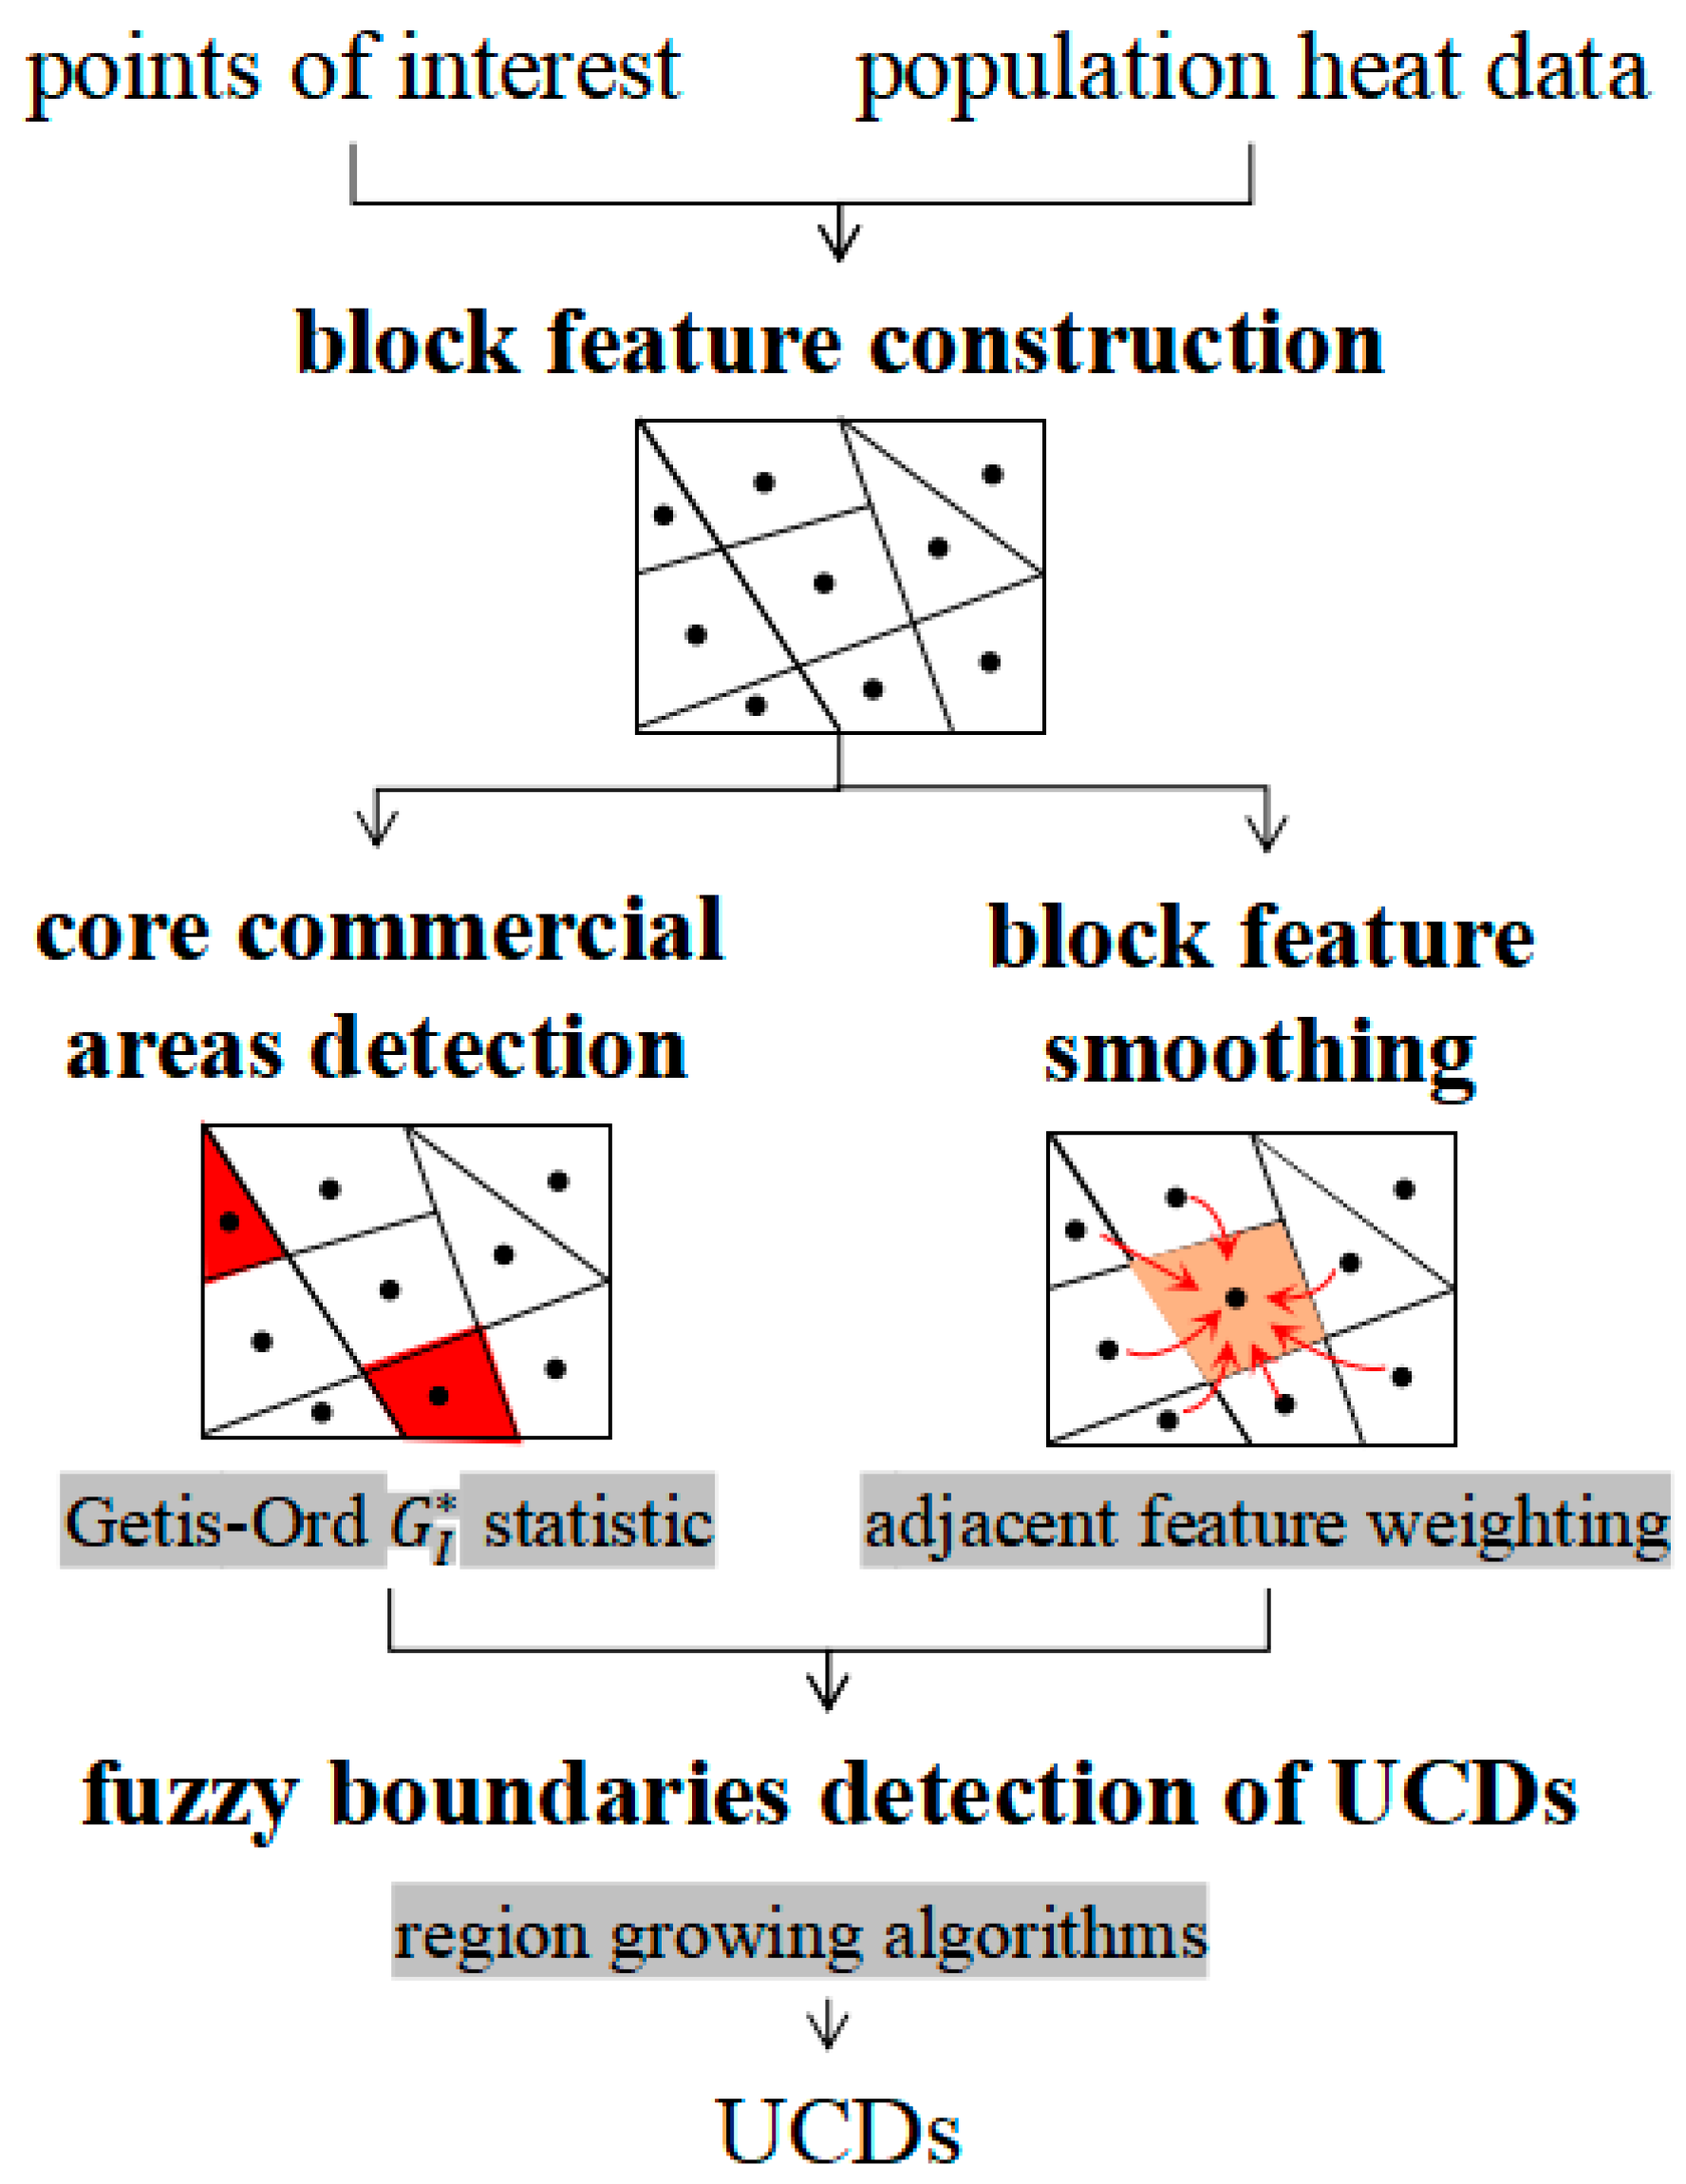
4. Methods
4.1. Detecting Core Commercial Areas
4.2. Block Description Considering Adjacency and Distance Decay
4.3. Fuzzy Boundaries Detection of UCDs Supported by Region-Growing Algorithms
5. Results
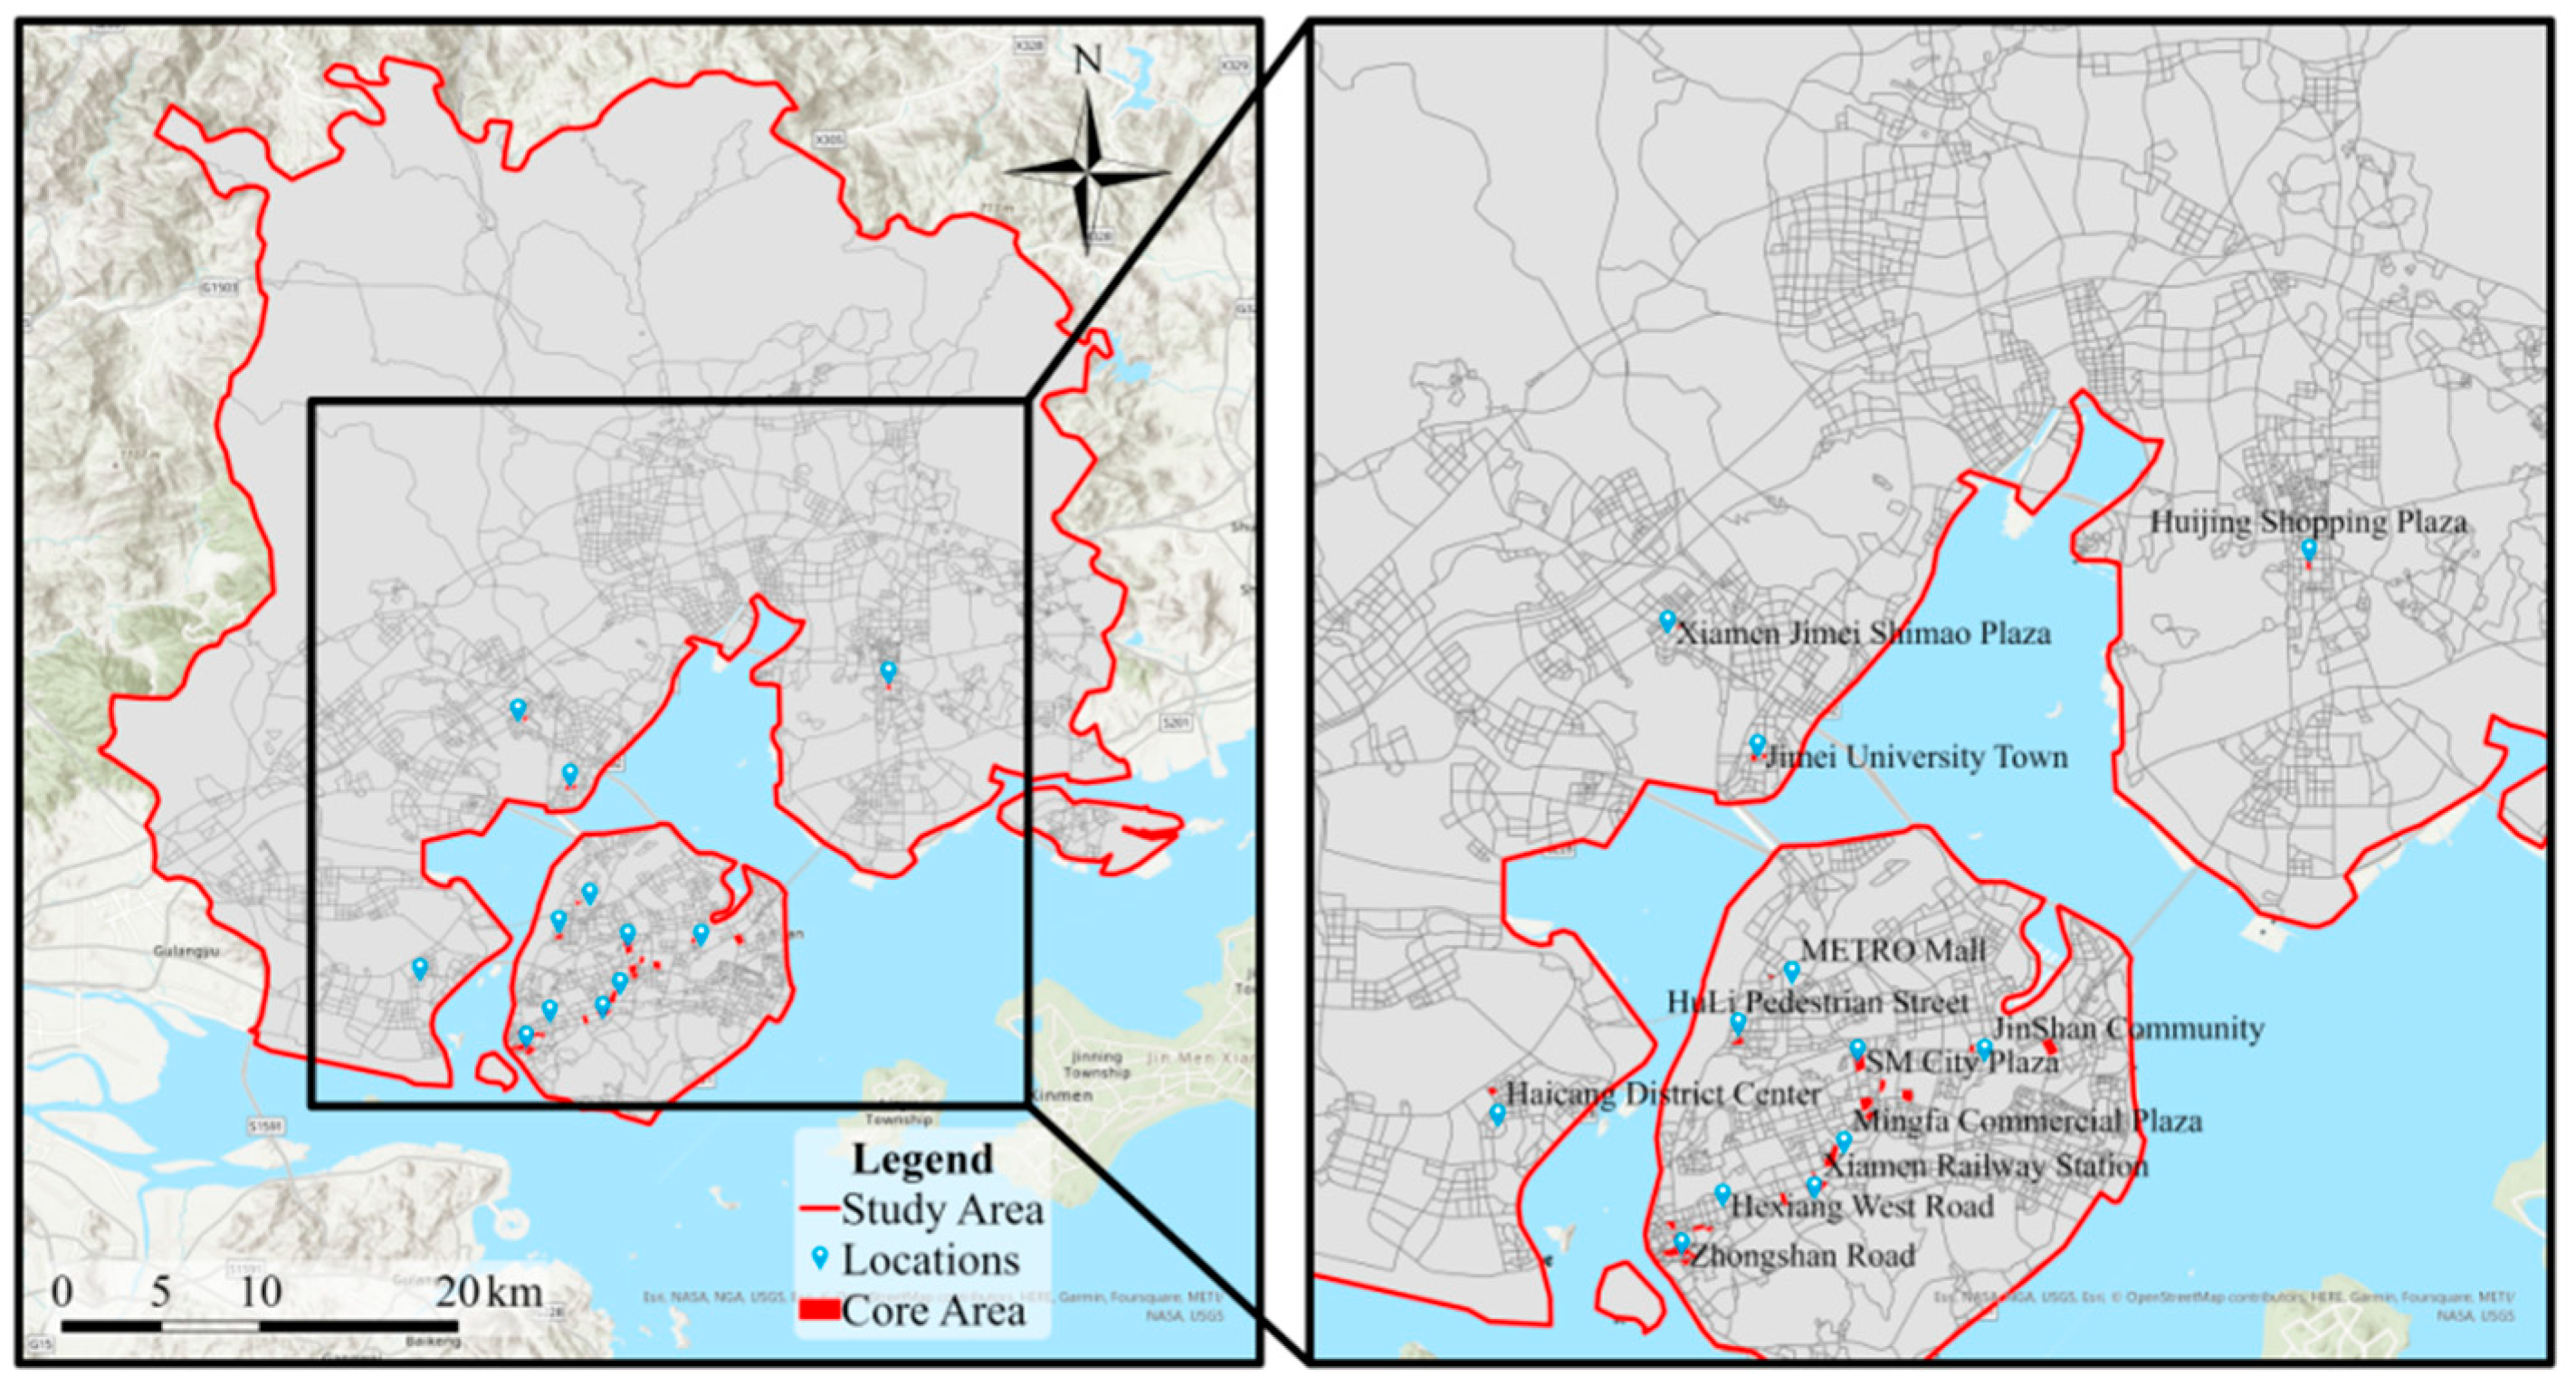
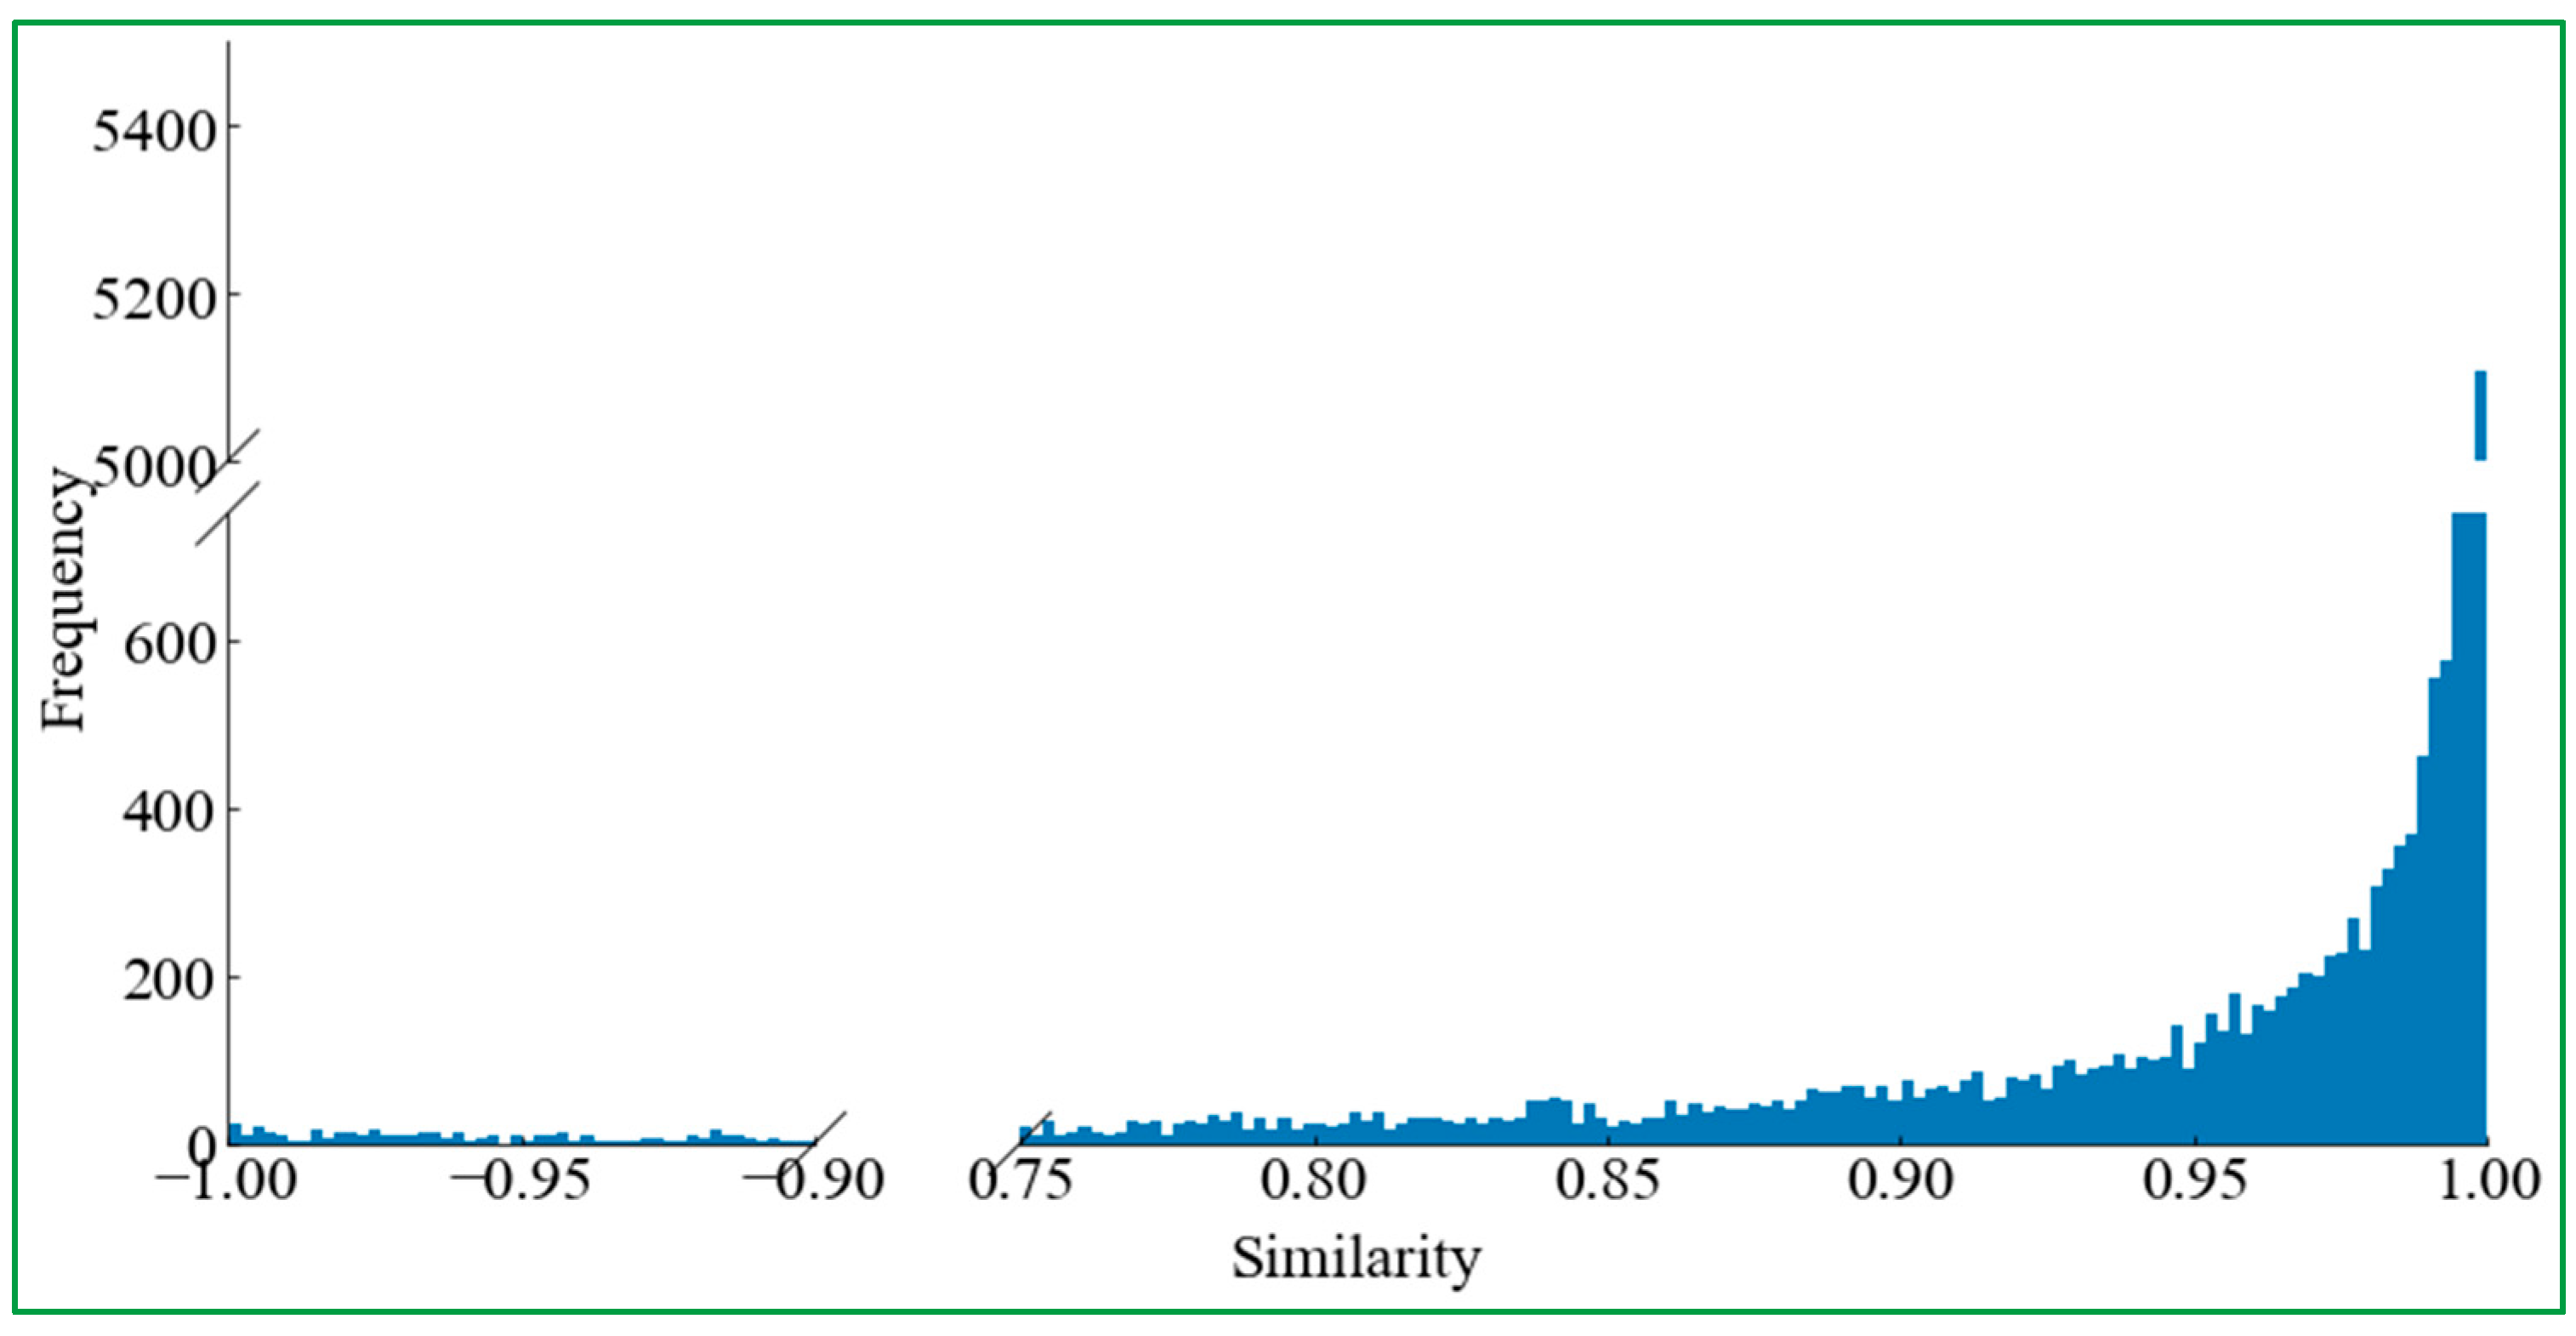
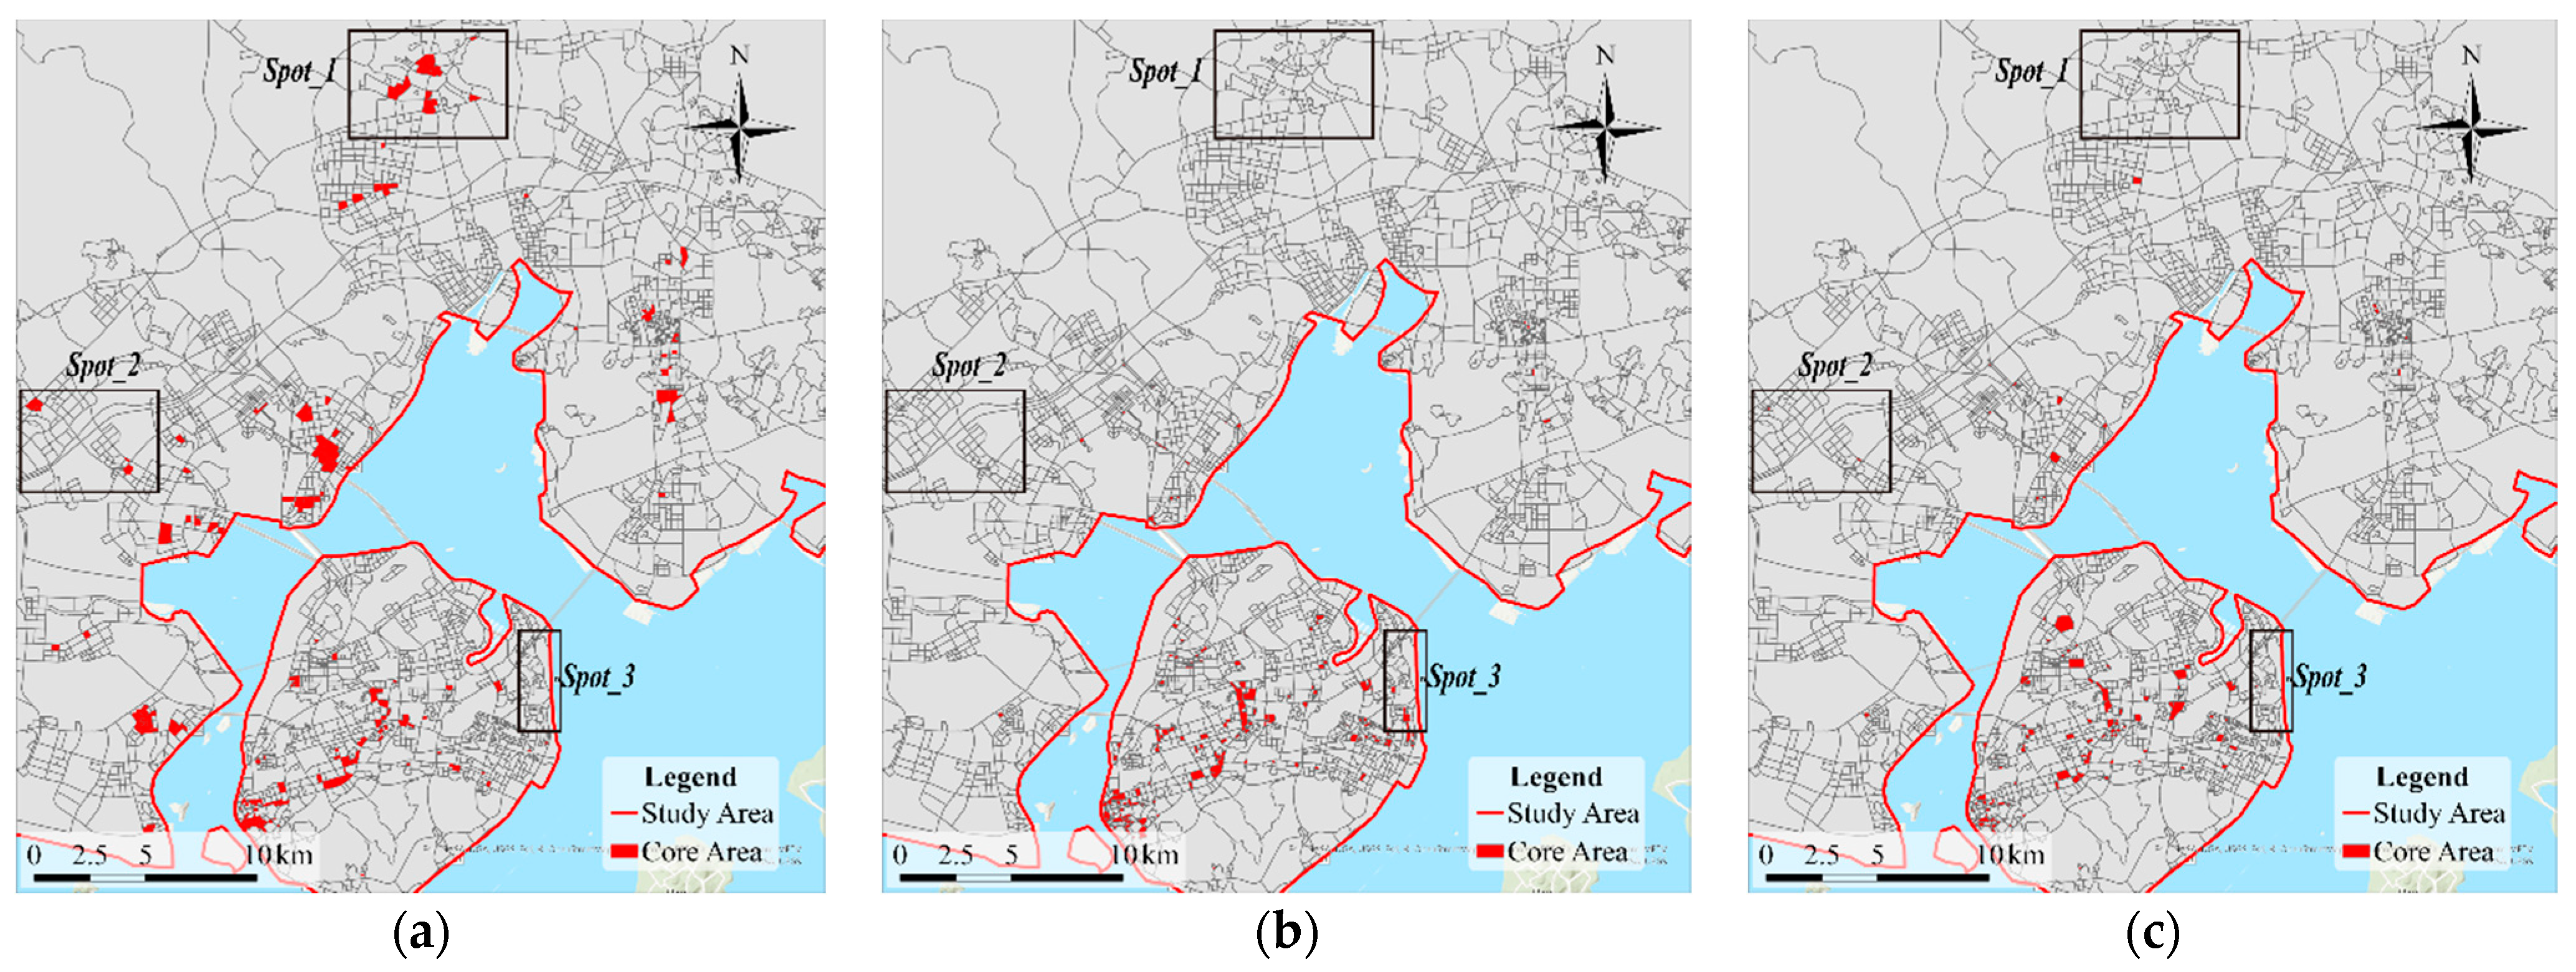
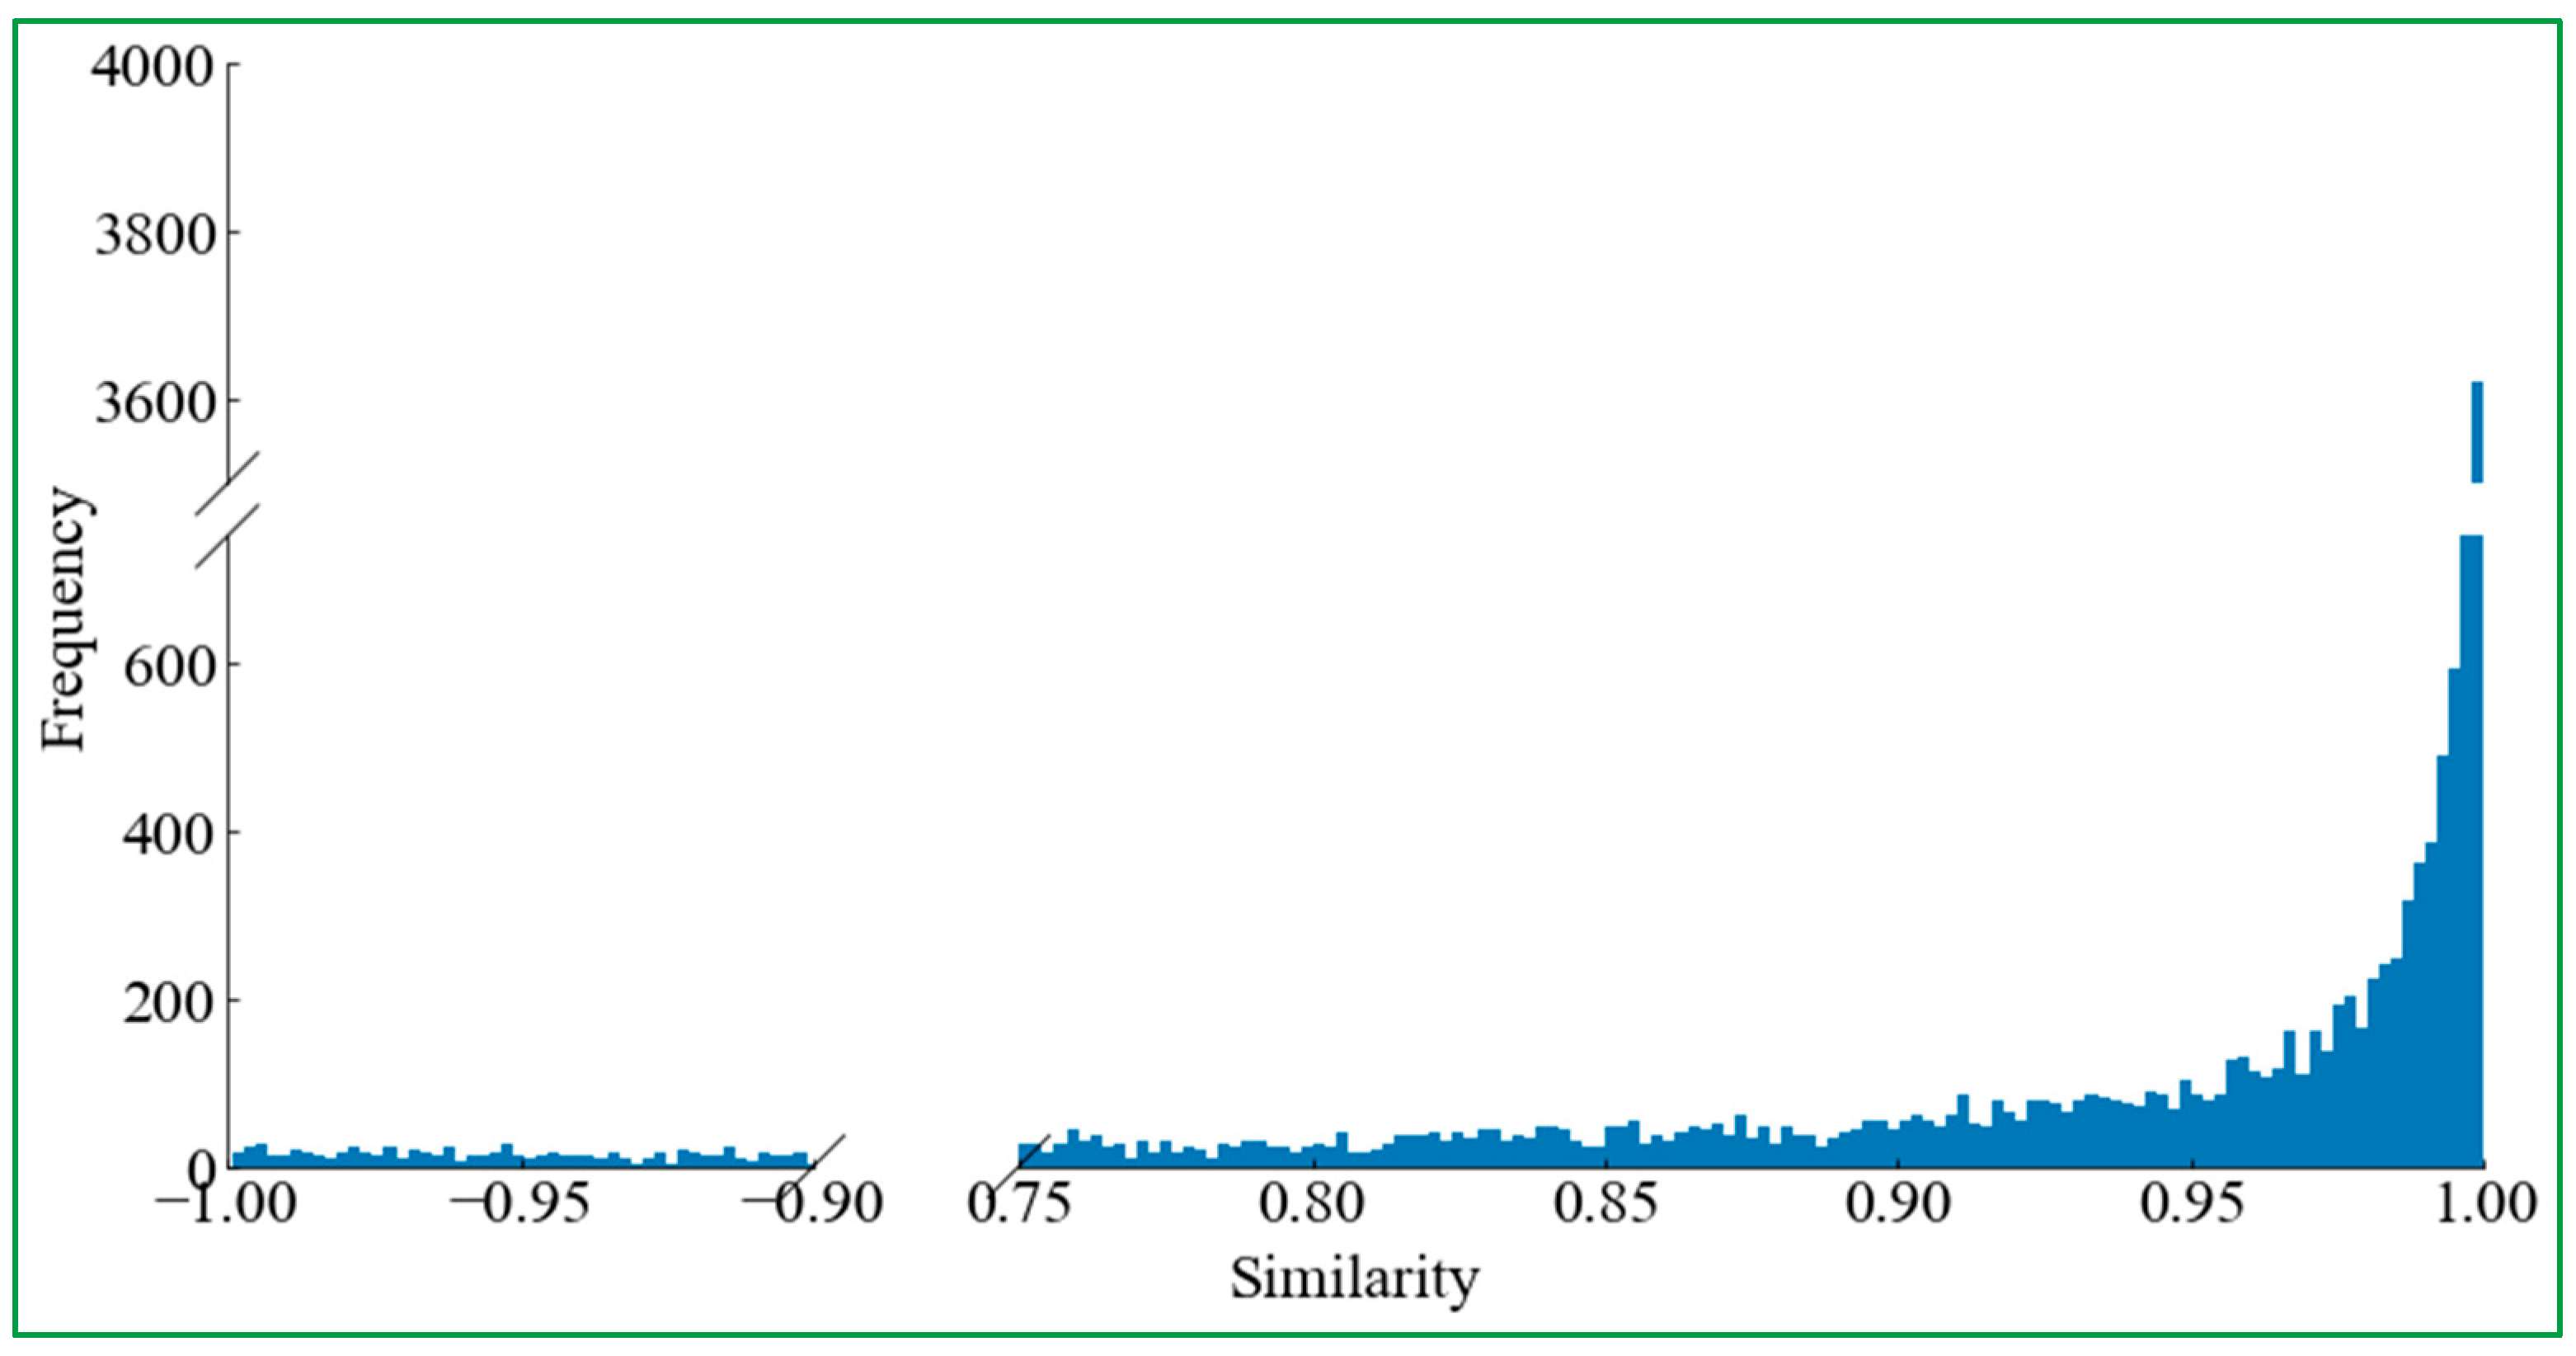
5.1. Core Commercial Areas Identification and Verification
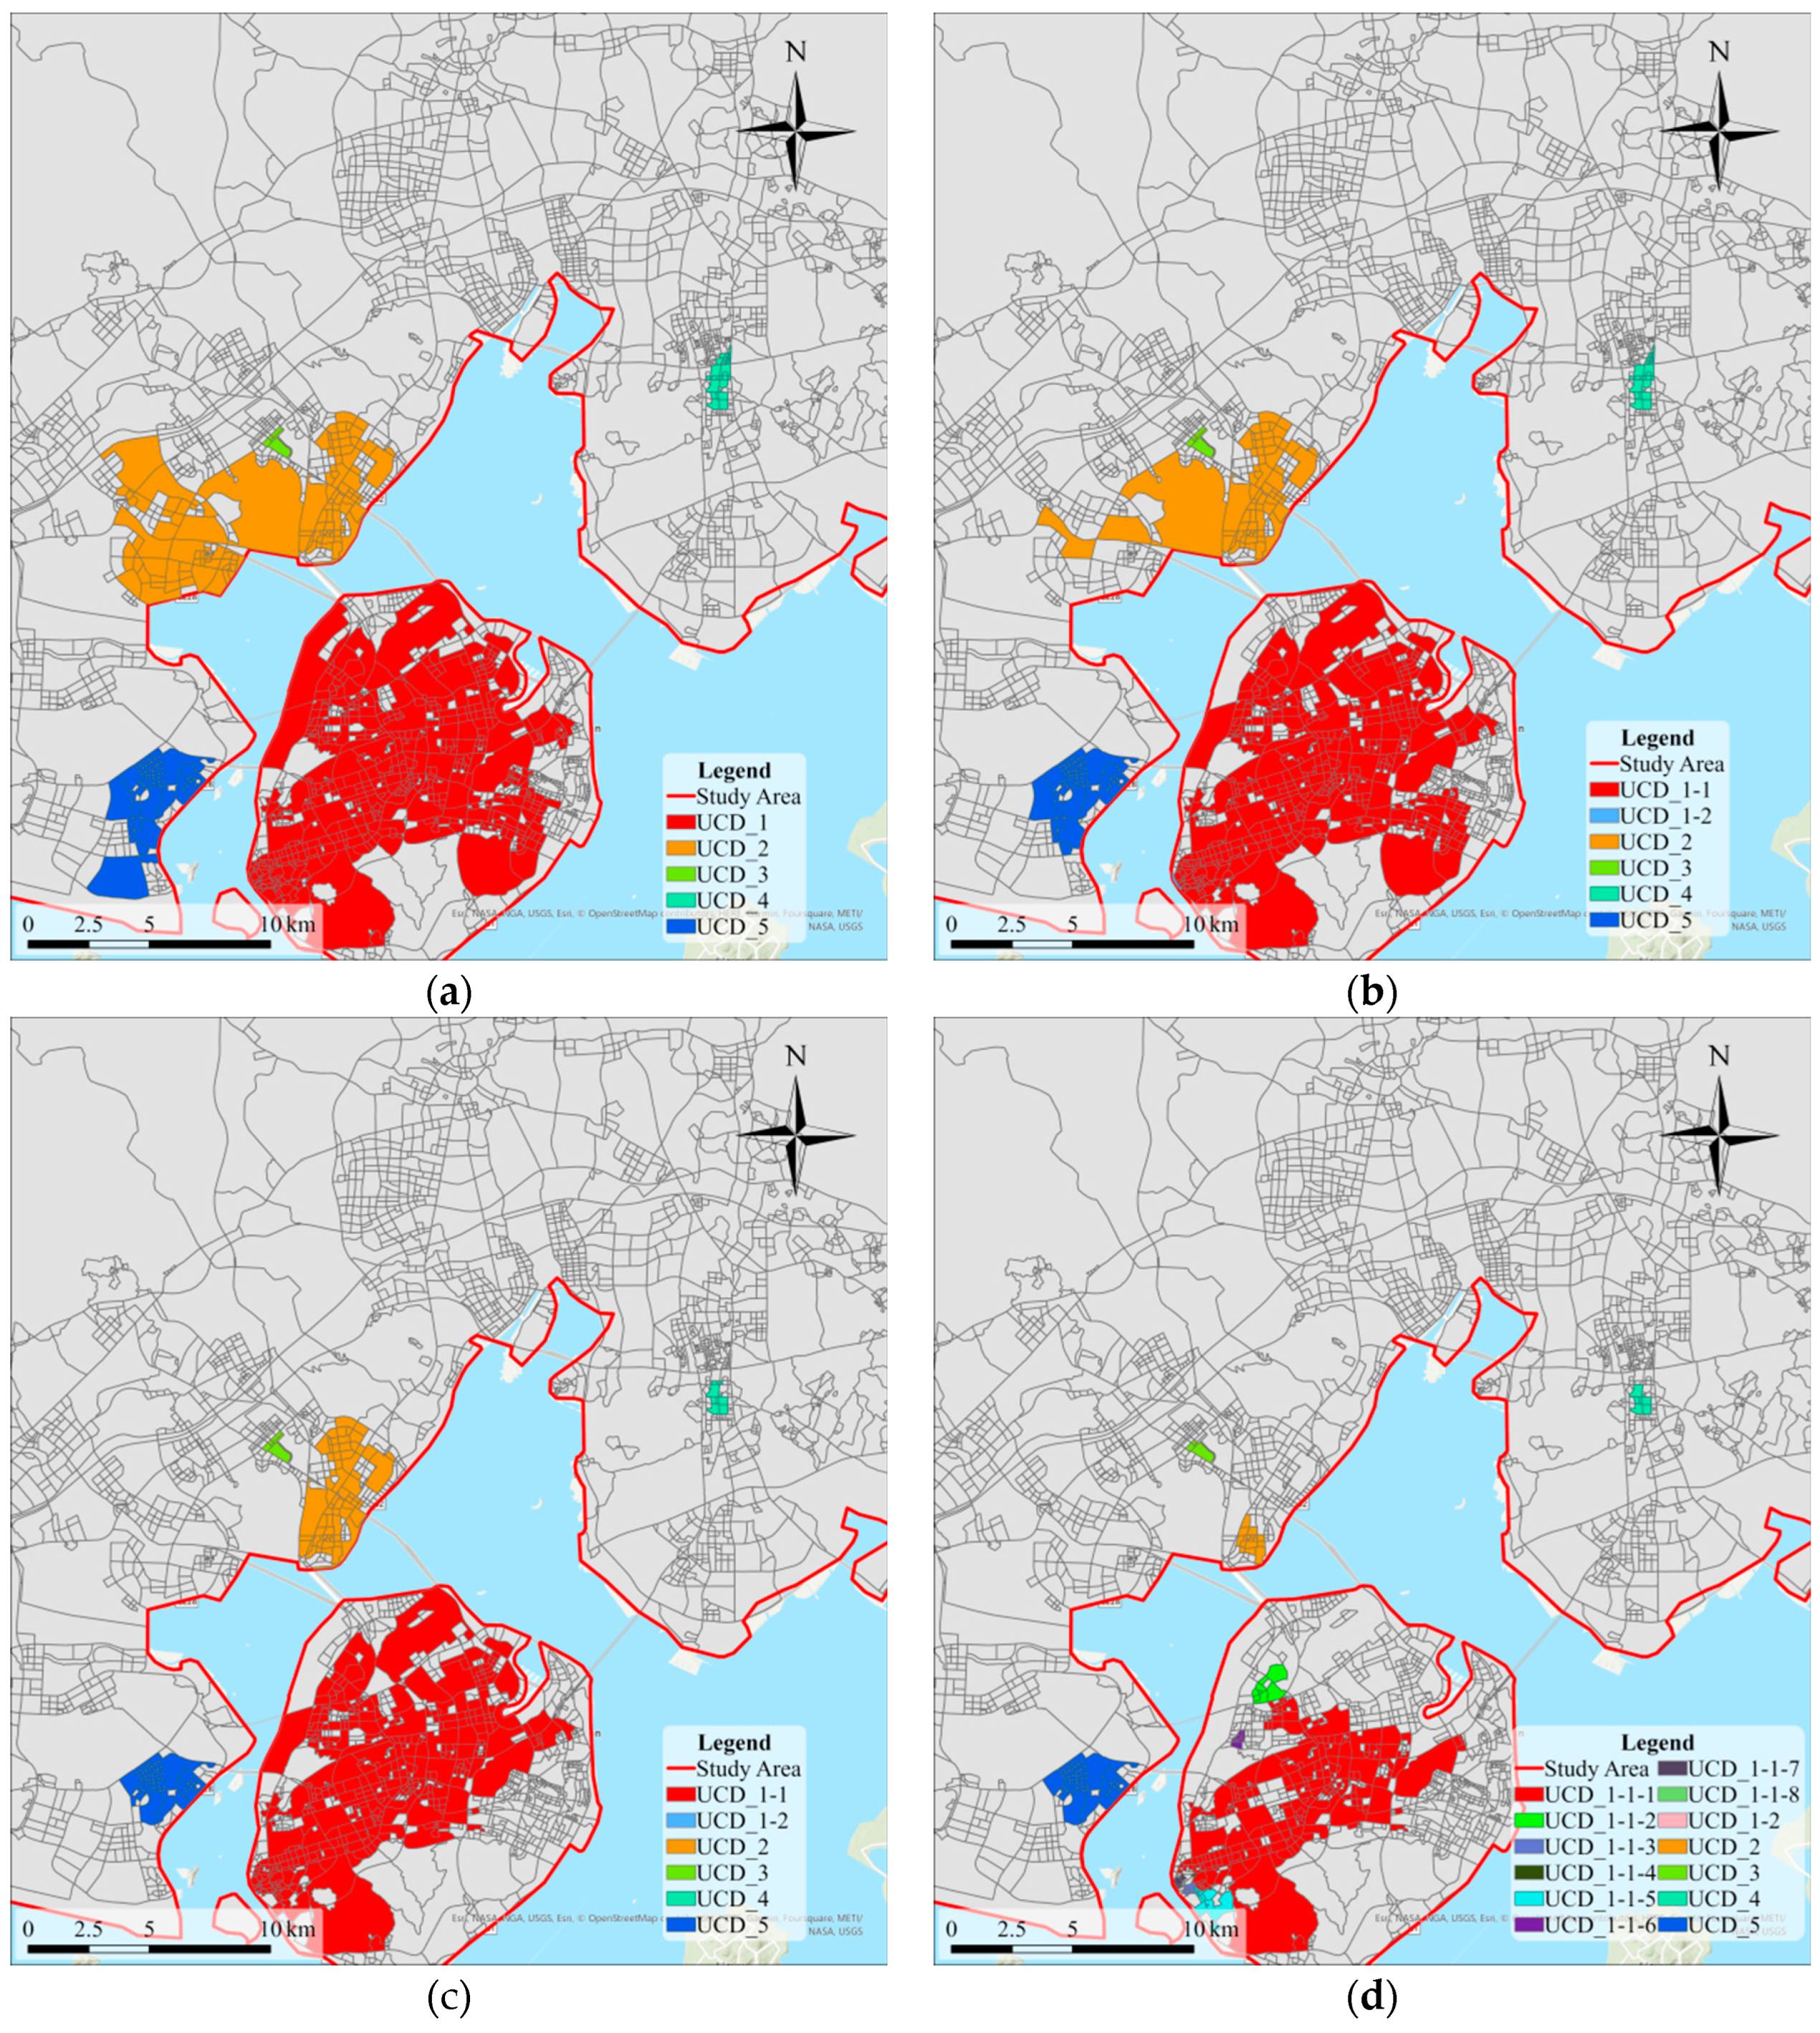
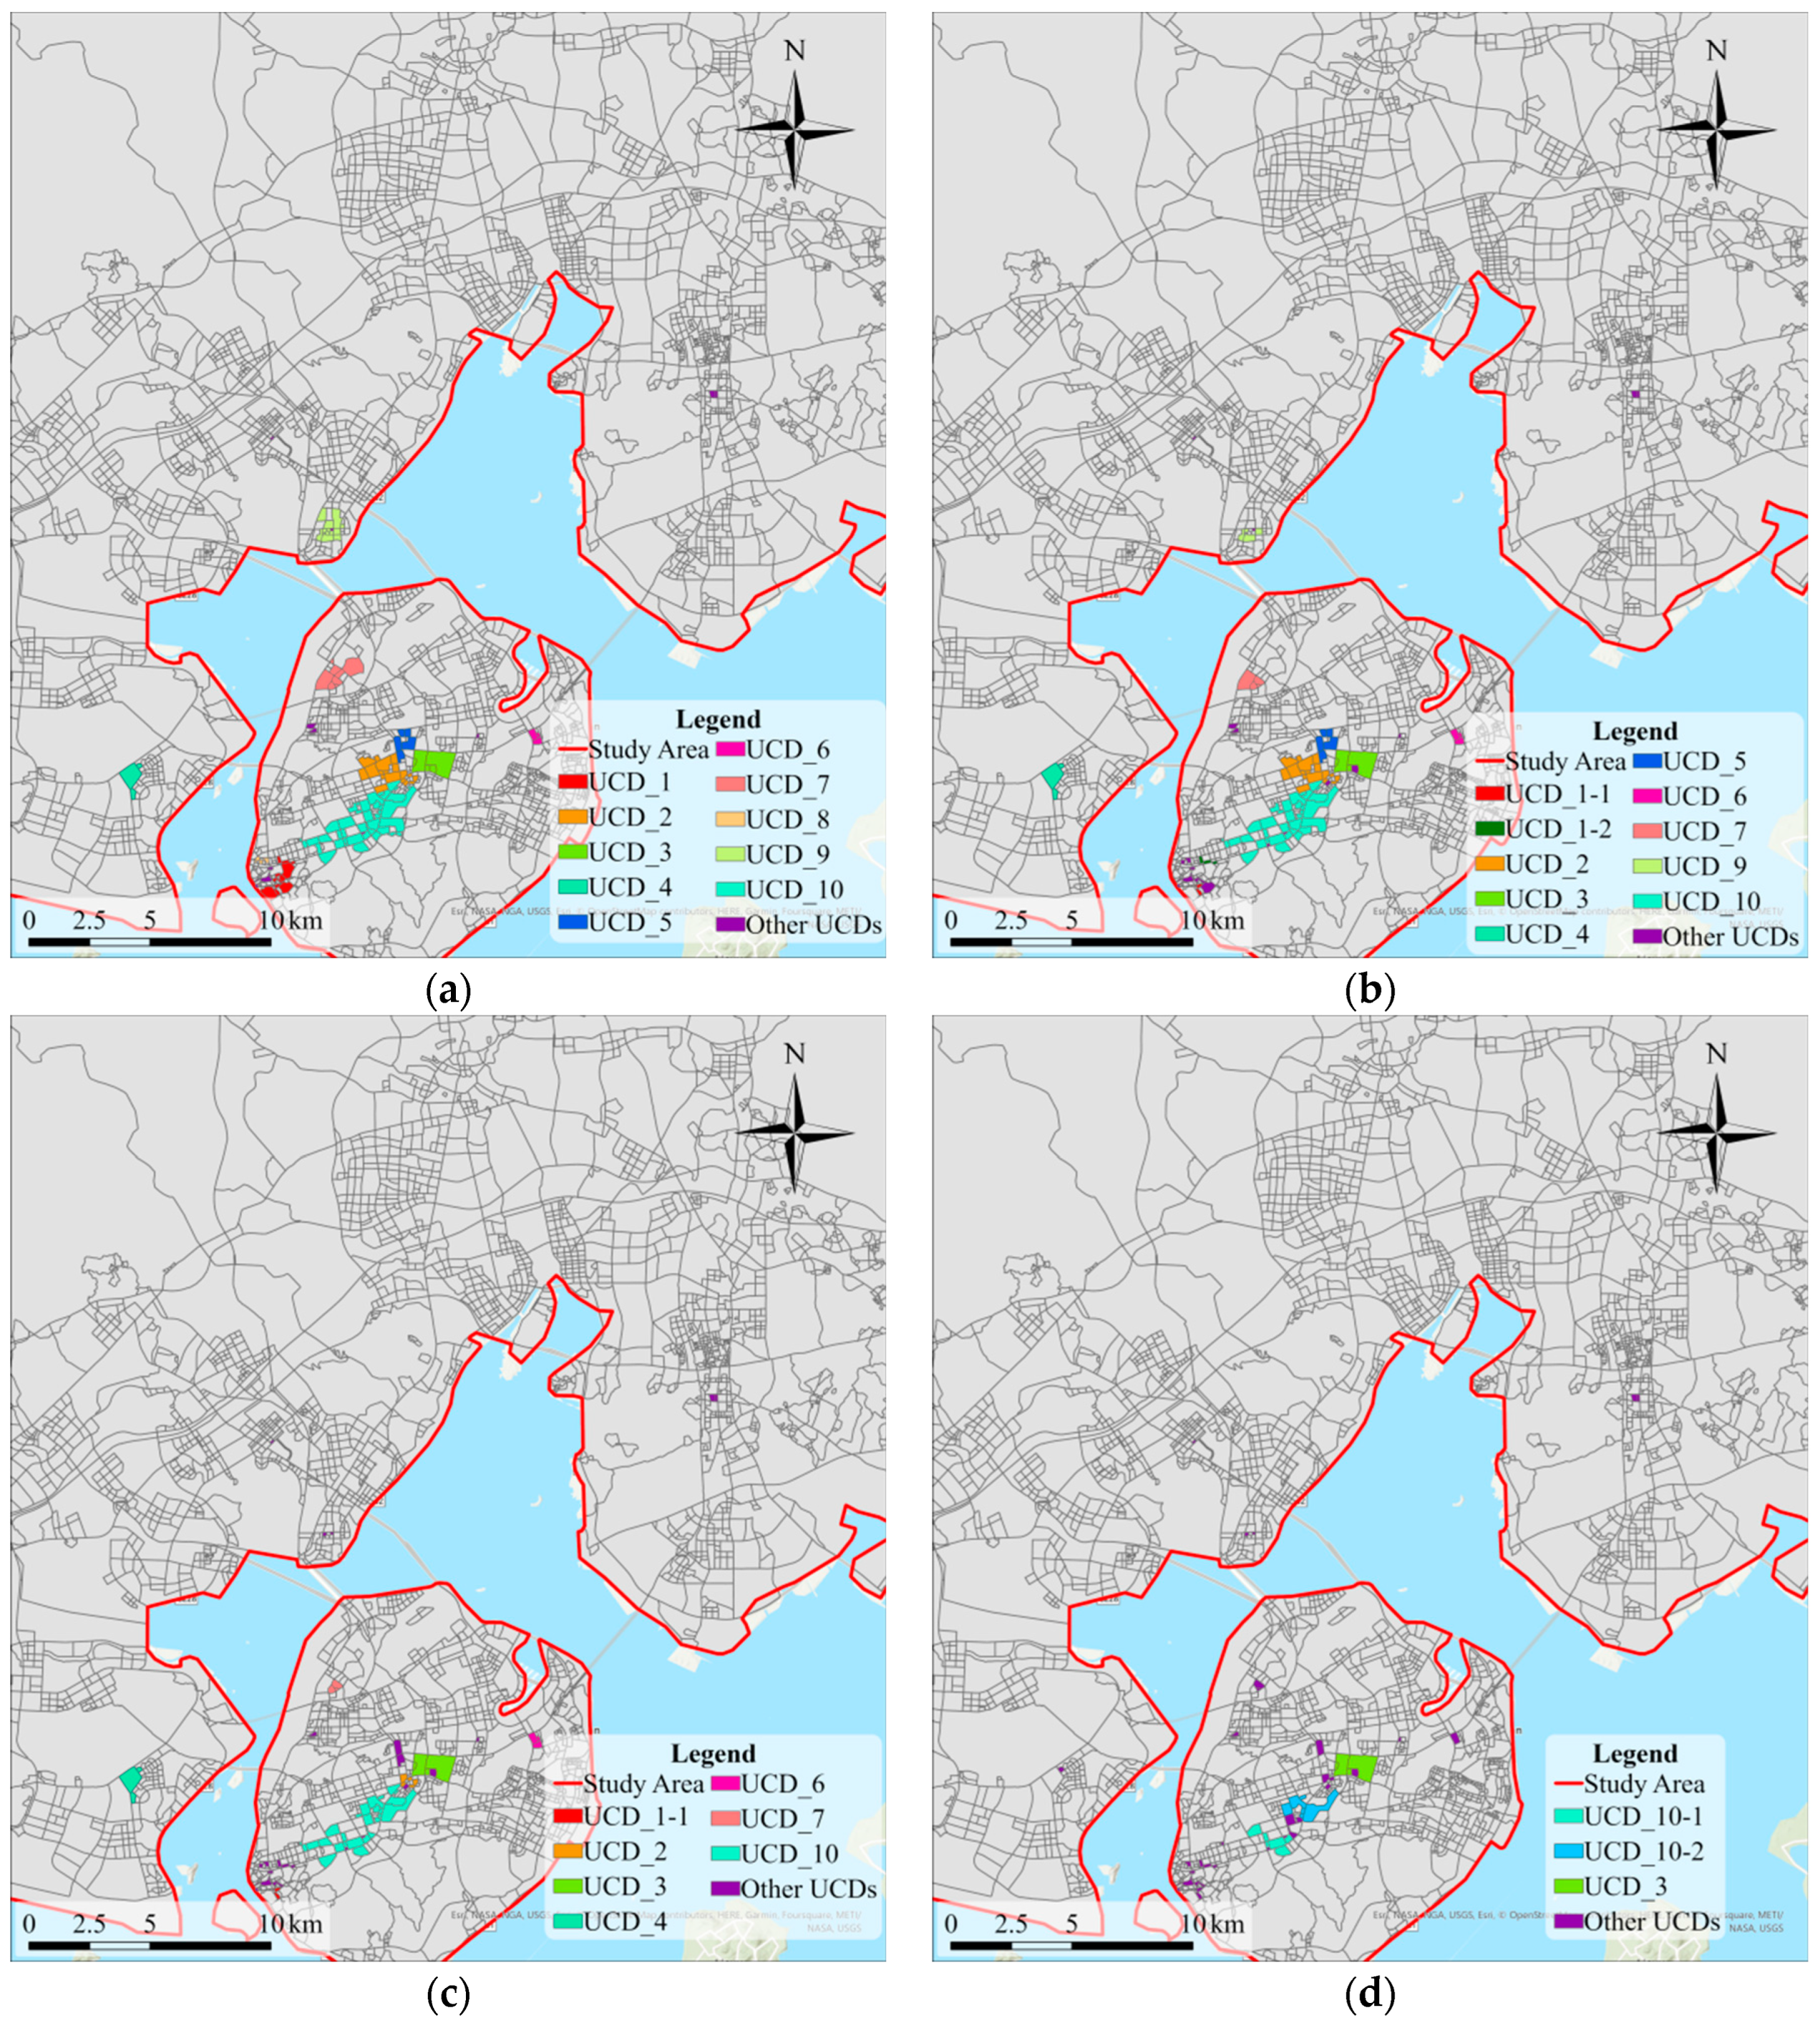
5.2. UCD Boundary Detection Results
5.3. Comparison of UCDs Detection Results between Different Strategies
6. Discussion
7. Conclusions
Author Contributions
Funding
Data Availability Statement
Acknowledgments
Conflicts of Interest
References
- Duan, X.; Hu, Q.; Zhao, P.; Wang, S.; Ai, M. An Approach of Identifying and Extracting Urban Commercial Areas Using the Nighttime Lights Satellite Imagery. Remote Sens. 2020, 12, 1029. [Google Scholar] [CrossRef] [Green Version]
- Wang, F.; Niu, F. Urban Commercial Spatial Structure Optimization in the Metropolitan Area of Beijing: A Microscopic Perspective. Sustainability 2019, 11, 1103. [Google Scholar] [CrossRef] [Green Version]
- Yaguang, S. Development and Characteristics of Central Business District Under the Philosophy of Health. Procedia Eng. 2011, 21, 258–266. [Google Scholar] [CrossRef]
- Huang, D.; Liu, Z.; Zhao, X.; Zhao, P. Emerging Polycentric Megacity in China: An Examination of Employment Subcenters and Their Influence on Population Distribution in Beijing. Cities 2017, 69, 36–45. [Google Scholar] [CrossRef]
- Alperovich, G. Density Gradients and the Identification of the Central Business District. Urban Stud. 1982, 19, 313–320. [Google Scholar] [CrossRef]
- Şikoğlu, E.; Kaya, H.S.; Arslan, H. Identification of Central Business District (CBD) Boundaries by Space Syntax Analysis and the Case of Elazığ (Turkey). J. Fac. Archit. 2020, 17, 115–125. [Google Scholar] [CrossRef]
- Yu, W.; Ai, T.; Shao, S. The Analysis and Delimitation of Central Business District Using Network Kernel Density Estimation. J. Transp. Geogr. 2015, 45, 32–47. [Google Scholar] [CrossRef]
- Lüscher, P.; Weibel, R. Exploiting Empirical Knowledge for Automatic Delineation of City Centres from Large-Scale Topographic Databases. Comput. Environ. Urban Syst. 2013, 37, 18–34. [Google Scholar] [CrossRef] [Green Version]
- Lu, C.; Wang, H.; Liu, L. Retail District Range Compare Model Construction and Shanghai Districts Demonstration. Econ. Geogr. 2015, 11, 133–137. (In Chinese) [Google Scholar]
- Ponce-Lopez, R.; Ferreira, J., Jr. Identifying and Characterizing Popular Non-work Destinations by Clustering Cellphone and Point-of-Interest Data. Cities 2021, 113, 103158. [Google Scholar] [CrossRef]
- Wang, S.; Liu, Y.; Chen, Z.; Shi, L.; Zhang, J. Representing Multiple Urban Places’ Footprints. Available online: Dianping.com Data. Acta Geod. Cartogr. Sin. 2018, 47, 1105–1113. (In Chinese) [Google Scholar]
- Liu, L.; Liu, Z. The Recognition of CAZ in Shanghai Based on Evaluated POI. In Big Data Support of Urban Planning and Management; Springer: Cham, Switzerland, 2018; pp. 99–112. [Google Scholar] [CrossRef]
- Tan, R.; Zhang, Y. Road Network-Based Region of Interest Mining and Social Relationship Recommendation. Soft Comput. 2019, 23, 9299–9313. [Google Scholar] [CrossRef]
- Liu, X.; Long, Y. Automated Identification and Characterization of Parcels with OpenStreetMap and Points of Interest. Environ. Plann. B Plann. Des. 2016, 43, 341–360. [Google Scholar] [CrossRef]
- Burgess, E. The Growth of the City: An Introduction to a Research Project. In The Trend of Population; Routledge: England, UK, 1925; pp. 85–97. [Google Scholar]
- Proudfoot, M.J. Intra-City Business Census Statistics for Philadelphia, Pennsylvania; United States Department of Commerce, Bureau of the Census: Suitland, MD, USA, 1937. [Google Scholar]
- Chen, W. Investigation on CBD Development of Chinese Cities. City Plan. Rev. 2003, 12, 18. (In Chinese) [Google Scholar]
- Lamb, R.F. The Morphology and Vitality of Business Districts in Upstate New York Villages. Prof. Geogr. 1985, 37, 162–172. [Google Scholar] [CrossRef]
- Ye, Q.; Tan, Y.; Zhao, X.; Luo, L.; Chen, N.; Xiang, H. Assessment of Implementation Effect of Commercial Network Planning Based on GIS:A Case Study of Changsha. Geogr. Res. 2013, 32, 317–325. (In Chinese) [Google Scholar]
- Zhang, X.; Zhang, X.; Zhong, E.; Wang, S.; Zhang, J. Study on the Spatial Structure and Driving Force of Urban Areas in Beijing Based on Building Space Structure. Geogr. Res. 2013, 32, 2055–2065. (In Chinese) [Google Scholar]
- Murphy, R.E.; Vance, J.E. Delimiting the CBD. Econ. Geogr. 1954, 30, 189. [Google Scholar] [CrossRef]
- Carol, H. The Hierarchy of Central Functions Within the City. Ann. Assoc. Am. Geogr. 1960, 50, 419–438. [Google Scholar] [CrossRef]
- Chen, W.; Liu, L.; Liang, Y. Retail Center Recognition and Spatial Aggregating Feature Analysis of Retail Formats in Guangzhou Based on POI Data. Geogr. Res. 2016, 35, 703–716. (In Chinese) [Google Scholar]
- Zhou, S.; Hao, X.; Liu, L. Validation of Spatial Decay Law Caused by Urban Commercial Center’s Mutual Attraction in Polycentric City: Spatiotemporal Data Mining of Floating Cars’ GPS Data in Shenzhen. Acta Geogr. Sin. 2014, 69, 1810–1820. (In Chinese) [Google Scholar]
- Yu, B.; Wang, Z.; Mu, H.; Sun, L.; Hu, F. Identification of Urban Functional Regions Based on Floating Car Track Data and POI Data. Sustainability 2019, 11, 6541. [Google Scholar] [CrossRef] [Green Version]
- He, W.; Li, Z.; Jing, D. Evaluation of Health Level of Land-use Ecosystem Based on GIS Grid Model. Nat. Environ. Pollut. Technol. 2020, 19, 1475–1482. [Google Scholar] [CrossRef]
- Hu, Y.; Han, Y. Identification of urban functional areas based on POI data: A case study of the Guangzhou economic and technological development zone. Sustainability 2019, 11, 1385. [Google Scholar] [CrossRef] [Green Version]
- Luo, S.; Liu, Y.; Du, M.; Gao, S.; Wang, P.; Liu, X. The Influence of Spatial Grid Division on the Layout Analysis of Urban Functional Areas. ISPRS Int. J. Geo-Inf. 2021, 10, 189. [Google Scholar] [CrossRef]
- Musiaka, Ł.; Nalej, M. Application of GIS Tools in the Measurement Analysis of Urban Spatial Layouts Using the Square Grid Method. ISPRS Int. J. Geo-Inf. 2021, 10, 558. [Google Scholar] [CrossRef]
- Liu, J.; Zhang, Z.; Yang, C.; Xu, S.; Chen, C.; Qiu, A.; Zhang, F. Personalized city region of interests recommendation method based on city block and check-in data. Acta Geod. Cartogr. Sin. 2022, 51, 1797–1806. (In Chinese) [Google Scholar] [CrossRef]
- Fang, W.; Xiaolu, G.; Zening, X. Identification and classification of urban commercial districts at block scale. Geogr. Res. 2015, 34, 1125–1134. (In Chinese) [Google Scholar] [CrossRef]
- Hollenstein, L.; Purves, R. Exploring Place Through User-Generated Content: Using Flickr Tags to Describe City Cores. J. Spat. Inf. Sci. 2010, 1, 21–48. [Google Scholar]
- Hu, Q.; Wang, M.; Li, Q. Urban Hotspot and Commercial Area Exploration with Check-In Data. Acta Geod. Cartogr. Sin. 2014, 43, 314–321. (In Chinese) [Google Scholar] [CrossRef]
- Zhao, Y.; Zhou, Z.; Wang, X.; Liu, T.; Liu, Y.; Yang, Z. CellTradeMap: Delineating Trade Areas for Urban Commercial Districts with Cellular Networks. In Proceedings of the IEEE INFOCOM 2019—IEEE Conference on Computer Communications, Paris, France, 29 April–2 May 2019; Volume 2019, pp. 937–945. [Google Scholar] [CrossRef] [Green Version]
- Young, W.J. Distance Decay Values and Shopping Center Size. Prof. Geogr. 1975, 27, 304–309. [Google Scholar] [CrossRef]
- Zhang, Y. Analyses of the Evolution and Causes of Urban Commercial Space Development in Xiamen. Knowl. Econ. 2014, 6, 132–133. (In Chinese) [Google Scholar]
- Li, T.; Han, P. Land Use/Cover Change Detection and Analysis with Remote Sensing in Xiamen City. Sci. Geogr. Sin. 2001, 21, 537–543. (In Chinese) [Google Scholar]
- Oikonomou, M. The Urban Block as a Potential for Sustainable Urban Design. WIT Trans. Ecol. Environ. 2015, 194, 69–77. [Google Scholar] [CrossRef] [Green Version]
- Wang, Y.; Gu, Y.; Dou, M.; Qiao, M. Using Spatial Semantics and Interactions to Identify Urban Functional Regions. ISPRS Int. J. Geo-Inf. 2018, 7, 130. [Google Scholar] [CrossRef] [Green Version]
- Zhang, X.; Li, W.; Zhang, F.; Liu, R.; Du, Z. Identifying Urban Functional Zones Using Public Bicycle Rental Records and Point-of-Interest Data. ISPRS Int. J. Geo-Inf. 2018, 7, 459. [Google Scholar] [CrossRef] [Green Version]
- Yang, J.; Zhu, J.; Sun, Y.; Zhao, J. Delimitating Urban Commercial Central Districts by Combining Kernel Density Estimation and Road Intersections: A Case Study in Nanjing City, China. ISPRS Int. J. Geo-Inf. 2019, 8, 93. [Google Scholar] [CrossRef] [Green Version]
- Zhang, Z.; Xiao, Y.; Luo, X.; Zhou, M. Urban Human Activity Density Spatiotemporal Variations and the Relationship with Geographical Factors: An Exploratory Baidu Heatmaps-Based Analysis of Wuhan, China. Growth Chang. 2020, 51, 505–529. [Google Scholar] [CrossRef]
- Wu, Z.; Ye, Z. Research on Urban Spatial Structure Based on Baidu Heat Map: A Case Study on the Central City of Shanghai. City Plan. Rev. 2016, 4, 33–40. (In Chinese) [Google Scholar]
- Xu, H.; Croot, P.; Zhang, C. Discovering Hidden Spatial Patterns and Their Associations with Controlling Factors for Potentially Toxic Elements in Topsoil Using Hot Spot Analysis and K-Means Clustering Analysis. Environ. Int. 2021, 151, 106456. [Google Scholar] [CrossRef]
- Tobler, W.R. A Computer Movie Simulating Urban Growth in the Detroit Region. Econ. Geogr. 1970, 46 (Suppl. 1), 234–240. [Google Scholar] [CrossRef]
- Revol-Muller, C.; Peyrin, F.; Carrillon, Y.; Odet, C. Automated 3D Region Growing Algorithm Based on an Assessment Function. Pattern Recognit. Lett. 2002, 23, 137–150. [Google Scholar] [CrossRef]
- Sato, M.; Lakare, S.; Wan, M.; Kaufman, A.; Nakajima, M. A Gradient Magnitude Based Region Growing Algorithm for Accurate Segmentation. In Proceedings of the International Conference on Image Processing, Vancouver, BC, Canada, 10–13 September 2000; Volume 2000, pp. 448–451. [Google Scholar]
- Sarwar, B.; Karypis, G.; Konstan, J.; Reidl, J. Item-Based Collaborative Filtering Recommendation Algorithms. In Proceedings of the 10th International Conference on World Wide Web, Hong Kong, China, 1–5 May 2001; pp. 285–295. [Google Scholar] [CrossRef] [Green Version]
- Xiamen Bureau of Statistics. National Economic and Social Development Statistical Bulletin of Xiamen in 2020. Available online: http://tjj.xm.gov.cn/tjzl/ndgb/202103/t20210319_2625973.htm (accessed on 5 January 2022).
- Xiamen Daily News. City’s Level to Be Upgraded Again and Cross-Island Development to Be Accelerated Again. Available online: http://dpc.xm.gov.cn/zl/ggzl/202102/t20210226_2521014.htm (accessed on 5 January 2022).
- Ke, Z. A Brief analysis of the construction of urban commercial space—A case study of Zhongshan Road and Mingfa Commercial Plaza in Xiamen. Market Mod. Mag. 2010, 15, 68. (In Chinese) [Google Scholar] [CrossRef]
- Chen, Y.; Chen, J. The Study of the Internal Structure and the Formation Mechanism in the City-level Commercial Center ——A Case of Zhongshan District. World Reg. Stud. 2008, 27, 104–114. (In Chinese) [Google Scholar]
- Li, W.; Huang, Z. Commercial space structure and format evolution of Xiamen based on POI. Mod. Urban Res. 2018, 4, 56–65. (In Chinese) [Google Scholar] [CrossRef]
- Xin Jing Xiang. Xin Jingxiang Xiamen Business District Analysis and Xianglu Flower City Commercial Pricing Report. Available online: http://jz.720ku.net/shangyeyunying/112981.html (accessed on 10 February 2022).
- Chen, Y. SWOT Analysis of Xiamen Traditional Commercial Center District. China Bus. (Jingji Lilun Yanjiu) 2008, 12, 3–5. [Google Scholar]
- Huang, Y.; Xu, J.; Gao, Q. Hotspot analysis and vitality assessment of commercial facilities under multi-source data—Xiamen Island as an example. In Proceedings of the 2020 China Urban Planning Conference, Chengdu, China, 25–30 September 2021. [Google Scholar]
- Blazy, R.; Łabuz, R. Spatial distribution and land development parameters of shopping centers based on GIS analysis: A case study on Kraków, Poland. Sustainability 2022, 14, 7539. [Google Scholar] [CrossRef]
- Hu, X.; Yang, H.; Zhang, Y. Research on the Spatial Arrangement of Retail Business in the Central City of China’s Megacity—A Case Study of Nanjing. In IOP Conference Series: Earth and Environmental Science; IOP Publishing: Bristol, UK, 2018; Volume 153, p. 032026. [Google Scholar]
- Zhang, Y. Study on the Urban Commercial Space Development and Planning under the Background of Rapid Urbanization-Taking Xiamen City for Example. Master’s Thesis, Jimei University, Xiamen, China, 2014. (In Chinese). [Google Scholar]
- Hollenstein, L. Capturing Vernacular Geography from Georeferenced Tags. Master’s Thesis, Geographisches Institut der Universität Zürich, Zürich, Switzerland, 2008. [Google Scholar]
- Shi, P.; Xiao, Y.; Zhan, Q. A study on spatial and temporal aggregation patterns of urban population in Wuhan City based on Baidu heat map and POI data. Int. Rev. Spat. Plan. Sustain. Devel. 2020, 8, 101–121. [Google Scholar] [CrossRef] [PubMed]


Disclaimer/Publisher’s Note: The statements, opinions and data contained in all publications are solely those of the individual author(s) and contributor(s) and not of MDPI and/or the editor(s). MDPI and/or the editor(s) disclaim responsibility for any injury to people or property resulting from any ideas, methods, instructions or products referred to in the content. |
© 2023 by the authors. Licensee MDPI, Basel, Switzerland. This article is an open access article distributed under the terms and conditions of the Creative Commons Attribution (CC BY) license (https://creativecommons.org/licenses/by/4.0/).
Share and Cite
Zhao, B.; He, X.; Liu, B.; Tang, J.; Deng, M.; Liu, H. Detecting Urban Commercial Districts by Fusing Points of Interest and Population Heat Data with Region-Growing Algorithms. ISPRS Int. J. Geo-Inf. 2023, 12, 96. https://doi.org/10.3390/ijgi12030096
Zhao B, He X, Liu B, Tang J, Deng M, Liu H. Detecting Urban Commercial Districts by Fusing Points of Interest and Population Heat Data with Region-Growing Algorithms. ISPRS International Journal of Geo-Information. 2023; 12(3):96. https://doi.org/10.3390/ijgi12030096
Chicago/Turabian StyleZhao, Bingbing, Xiao He, Baoju Liu, Jianbo Tang, Min Deng, and Huimin Liu. 2023. "Detecting Urban Commercial Districts by Fusing Points of Interest and Population Heat Data with Region-Growing Algorithms" ISPRS International Journal of Geo-Information 12, no. 3: 96. https://doi.org/10.3390/ijgi12030096