1. Introduction
The contribution of the editorial project of
Historic Towns Atlases, which has been running since 1968 under the auspices of the International Commission for the History of Towns, to contemporary urban history research can be considered on two levels. Some 580 atlases, published over the past 50 years in 20 European countries, comprise an extraordinarily rich source base for comparative urban research. On the other hand, with the implementation of the project, an interdisciplinary discussion has developed on the methodology of editing atlases, the importance of which transcends the historical sciences [
1].
At the end of the 1960s, during the preparation of the atlas concept, the main subject of discussion was the principles for editing the core maps for these atlases, which contain the oldest cadastral or other land survey maps at a scale of 1:2500. According to Heinz Stoob’s proposal, map editing should consist merely of the redrawing and rescaling of the original large-scale maps. The publishers’ right to interfere would only extend to the application of contour lines and descriptions [
2].
English and French historians, on the other hand, have stated that the core maps of atlases should rather be reconstructions based on various cartographic sources [
3]. An overview of published atlases has revealed that although most publishers of atlases in individual countries have tried to treat the core map as an edition of the original source, the forms of editions have varied substantially, making comparative studies more difficult [
4].
Given the editorial experience acquired to date, notwithstanding the difficulties in applying a common standard for core map editing, a question arises as to whether the editing of a cadastral map, according to the concept of H. Stoob, enables the content of the cartographic source to be made completely available. It is beyond doubt that the redrawing of original cadastral map sheets to a scale of 1:250, 1:500, 1:1000, or 1:2500, and their subsequent rescaling, generates some cartometric distortion. This impoverishes the primary content of the original source. Moreover, the editing of a core map in the traditional fashion generally excludes a part of the content of the original map (i.e., its numbering system, descriptions, and applied changes), which is fundamentally incompatible with the principles of critically editing a written source. This has compelled publishers to make the full content of sources and information concerning their external form available to users [
5,
6].
A critical approach to the effects of using the redrawing method for editing historical large-scale maps resulted in a call being raised by the publishers of town atlases at the beginning of this millennium for the use of digital technologies. In line with the discussion to date, the use of GIS technology to edit the core maps of atlases is indispensable. On the one hand, this technology ensures that the full content of the original large-scale map sheets is made available to users. In addition, GIS can contribute to the versatility of atlases by facilitating the exchange, management, and analysis of cartographic and historical data [
7]. These data are collected in the form of a geospatial database, where each geometric object (point, line, or polygon) is assigned a series of quantitative (numerical data) and/or qualitative information (textual data).
Trailblazing attempts to use GIS technology to prepare cartographic source editions have been made on the basis of town atlases published by Irish and German teams. Operating under the auspices of the Royal Irish Academy, the publishers of the
Irish Historic Towns Atlas have prepared digital atlases of Derry–Londonderry [
8], Galway [
9], and Dungarvan [
10].
The interactive maps developed as part of these projects include layers of historic maps from Ordnance Survey Ireland, which were published as the core maps of the Irish town atlases, in addition to historical and topographical information (relating to streets, buildings, and city walls/gates).
For nearly 10 years, German historians and cartographers have been developing interactive atlases based on those published in the
Deutscher Historischer Städteatlas series, presenting comparative plans of urban layouts and the development of settlements from the towns’ beginnings to the 20th century [
11]. The interactive atlases for the individual maps vary in terms of their contents and volume. The largest number of maps containing historical and topographical information were prepared for Braunschweig [
11], Dortmund [
12], and Mühlhausen [
13]. In contrast, only single interactive maps were produced for the towns of Schwerin, Herrnhut, and Quedlinburg [
14,
15,
16].
The aforementioned examples of the practical use of GIS technology to create interactive maps were primarily aimed at the presentation of historical and topographical data. Naturally, they made use of the base map of the atlas as well. Unfortunately, the practices adopted in the work on the interactive atlases of Irish and German towns have not yet been applied in discussions regarding the development of common principles and standards for editing interactive atlases or the use of GIS technology to create historical and cartographic databases. The data collected in such a database would enable the editing of large-scale core maps in the
Historic Towns Atlases of towns. In line with the previously raised proposal, an adequate way to create such principles and standards is through experimental work, in which certain patterns of GIS use can be verified [
4].
The purpose of this article, therefore, is to introduce the potential of this experimental work into the debate among historians and cartographers. The findings presented are intended to become the starting point for a wider discussion among publishers of historic town atlases and of other historical cartographic sources, aimed at developing a common procedure and principles for using GIS to edit large-scale maps. What this article presents is the concept of the construction of the georeferential spatial database of topographic–historical objects (GSDoT-HO) with the use of the Geographic Information System, based on an edition of a source map, namely the cadastral map of Toruń from 1910–1915. This presentation of the concept consists of the introduction of the stages of creating the database, its exemplary structure, and proposals for good practice. This latter contribution of the article is the result of the authors’ experience gained whilst undertaking research regarding the Historical Atlases of Polish Towns using GIS technology, beginning with the atlas of Świecie, as well as the atlases of Chojnice, Ostróda, Mrągowo, Koronowo, and Włocławek, Fordon, and culminating in the second edition of the Atlas of Toruń [
17,
18,
19,
20,
21,
22,
23,
24].
2. Main Stages of the Development of GSDoT-HO
Regarding the development of a georeferential spatial database of topographic–historical objects, it is important to highlight the use of a new approach known as the Historical GIS (HGIS), which employs geographic information systems in historical and cartographical projects. The HGIS, as an interdisciplinary research trend, draws on the expertise of such disciplines and methods, such as cartography, geodesy, remote sensing, and geography, making it possible to combine the content of historical maps (which have previously been appropriately fitted into a coordinate system) with attribute data on these maps in the form of tabular databases. The HGIS is now a widely used approach in thematically diverse research [
25,
26,
27,
28,
29,
30,
31,
32]. It should also be stated that, among the issues related to the application of the HGIS, the georeferencing of historical maps [
33,
34,
35,
36,
37] has an important place. The preparation of the GSDoT-HO for subsequent temporal and spatial analyses, as well as the visualization of the results that are discussed in this article, fall within this interdisciplinary approach.
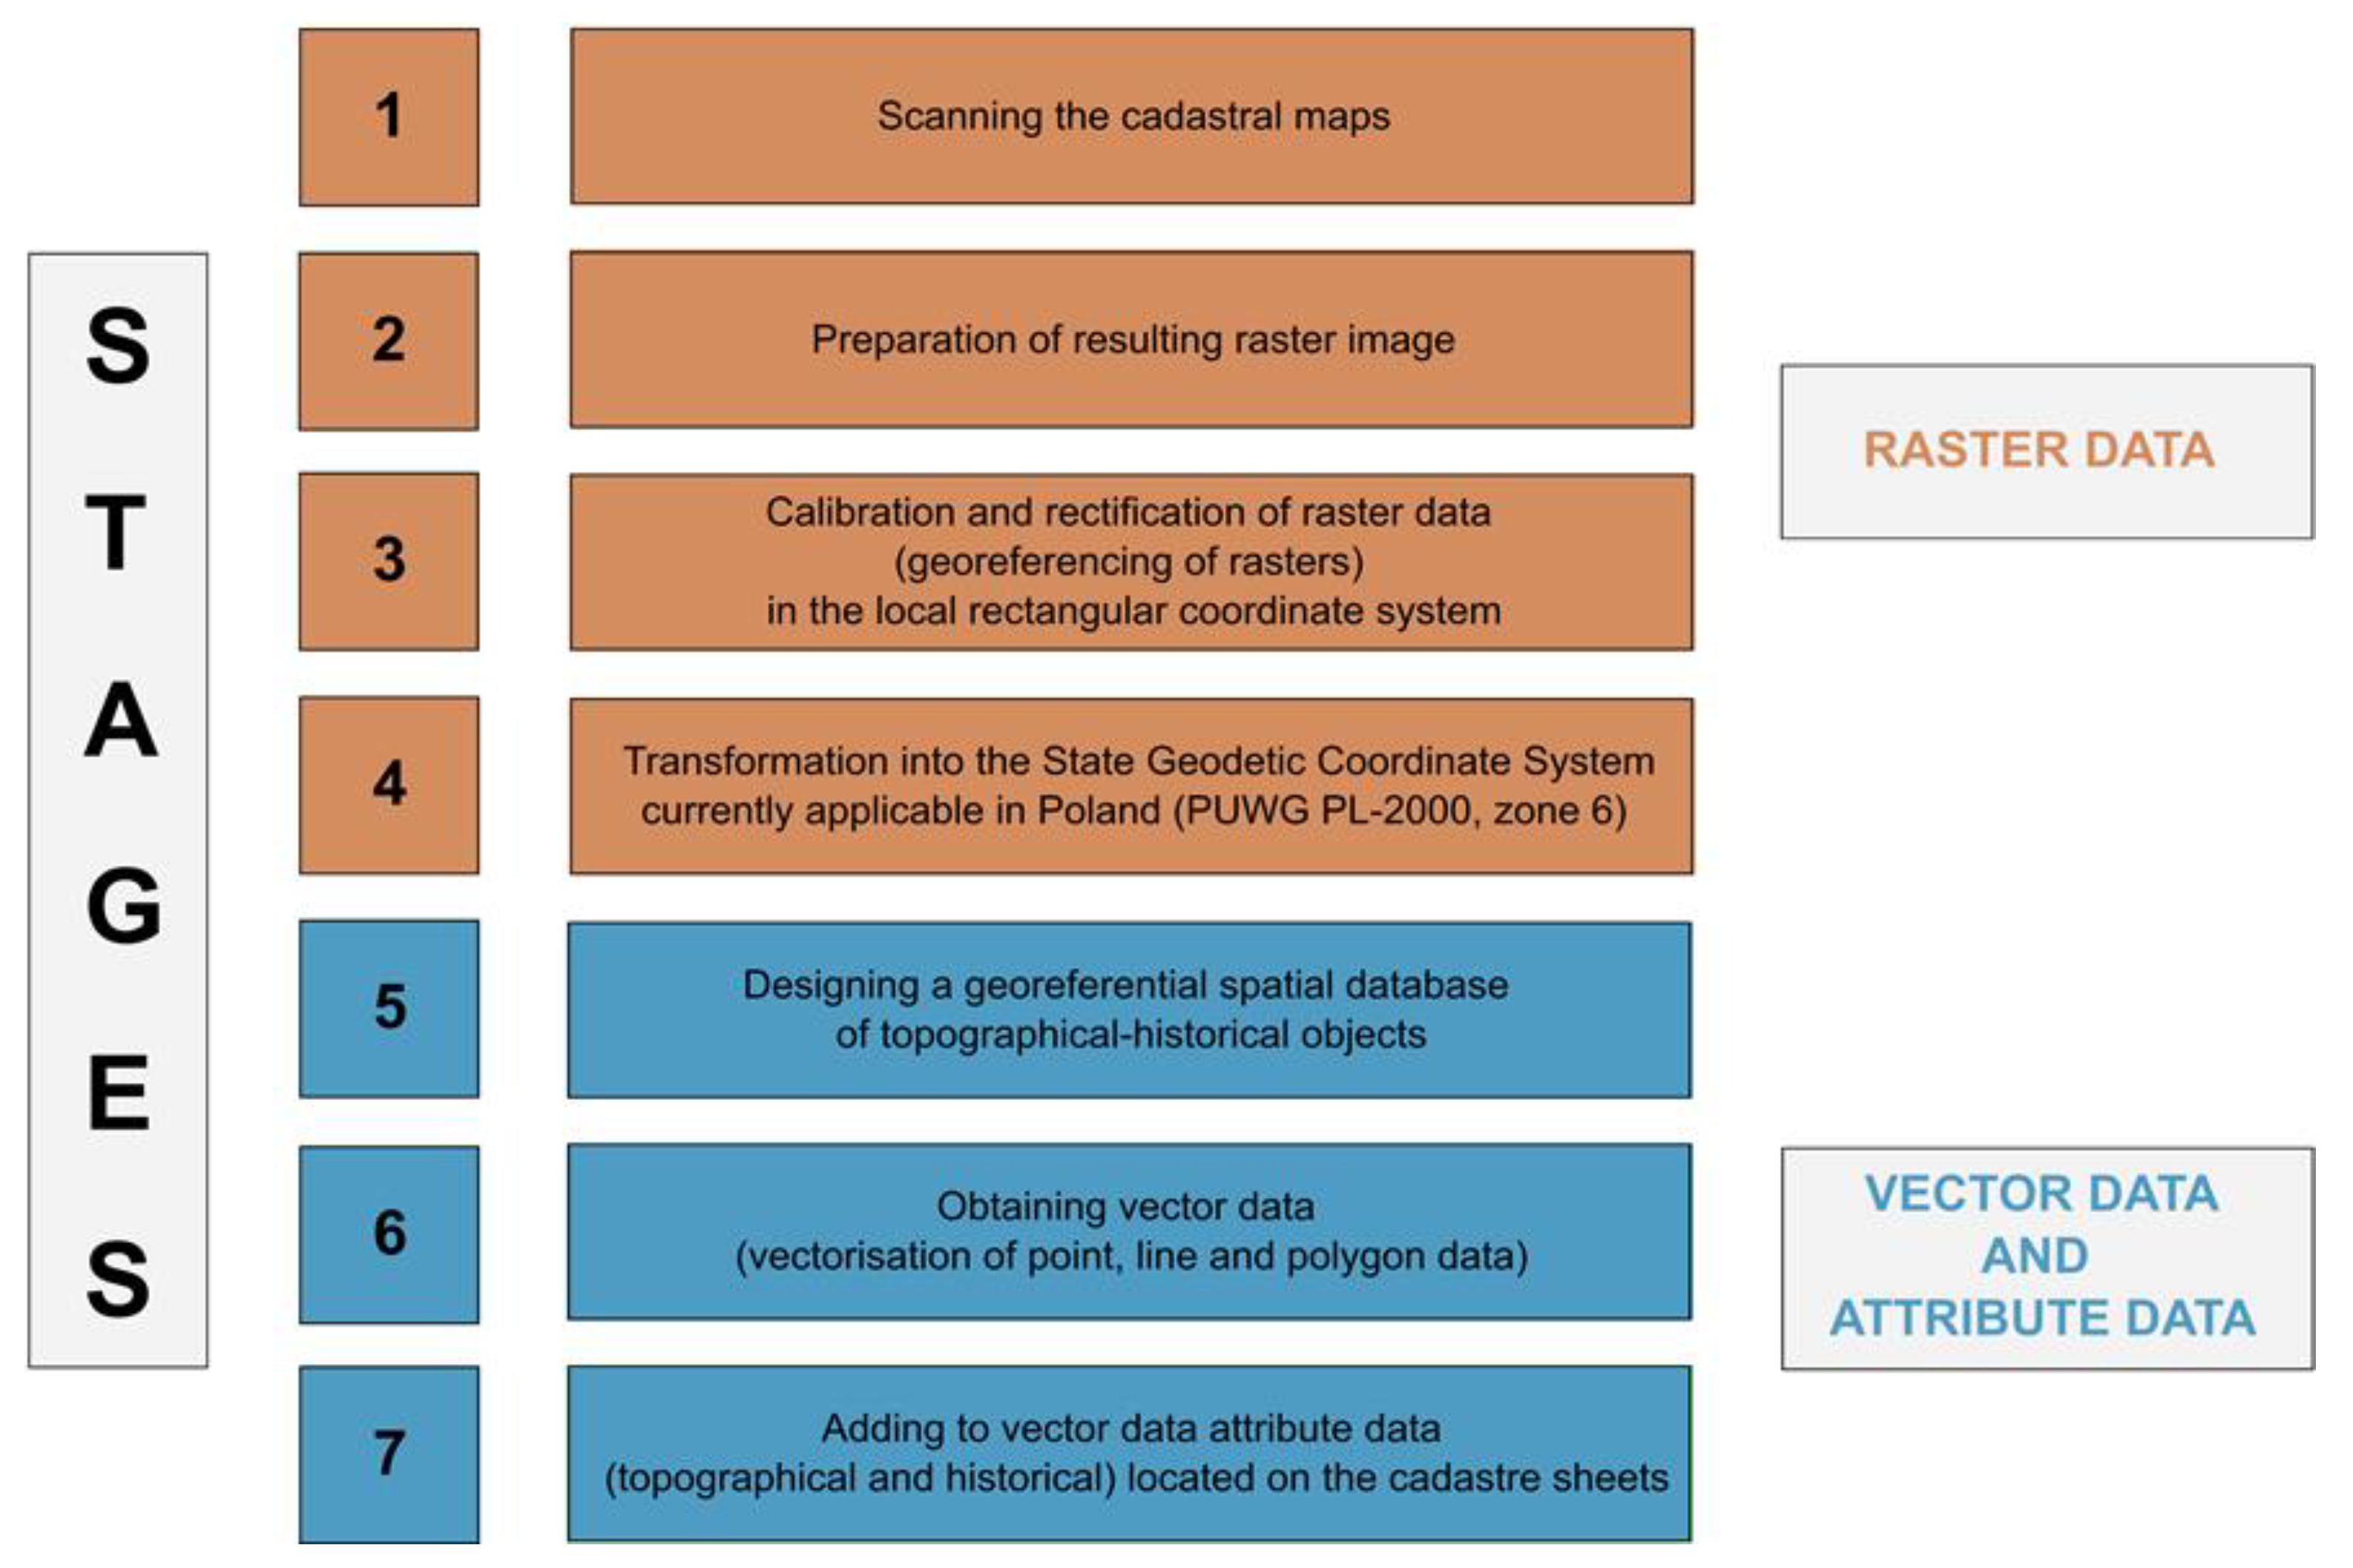
For the preparation of the GSDoT-HO, several appropriate activities were completed, constituting the various stages of the preparatory process (
Figure 1). Steps in the procedure of creating a georeferential database were developed by consulting prior experience from preparing the atlases of Toruń and other Prussian towns. The individual steps in the development of the GSDoT-HO are discussed in detail in the following sections of the article.
3. The Cadastral Map as the Basis for the GSDoT-HO Project
Offices responsible for the production of cadastral maps in the provinces of West and East Prussia (West- und Ostpreußen) were established by an act of 1861, but land surveying and drafting work aiming at the creation of cadastral maps in most large and medium-sized Prussian cities were not undertaken until the 1880s [
38]. The first land surveying and cartographic work for the Toruń district carried out by the Cadastral Office took place between 1882 and 1887 and covered an area of 910 hectares in the village of Mokre (German: Mocker), which was incorporated into the city of Toruń in 1906.
The cadastral map of the city of Toruń was one of the latest land surveying and cartographic projects to be completed in West Prussia. It was not until January 1910 that a schedule of land surveying works was approved. They were carried out concurrently by five teams of surveyors, whose work commenced in the eastern and northern suburbs of the city. From September 1911 to August 1913, land surveys covered the city centre within the medieval defensive walls (area of 52 ha). In 1913, land surveys continued in the northern and western suburbs. In total, an area of approximately 1880 ha was surveyed. The drafting lasted from the autumn of 1910 to July 1915 [
39].
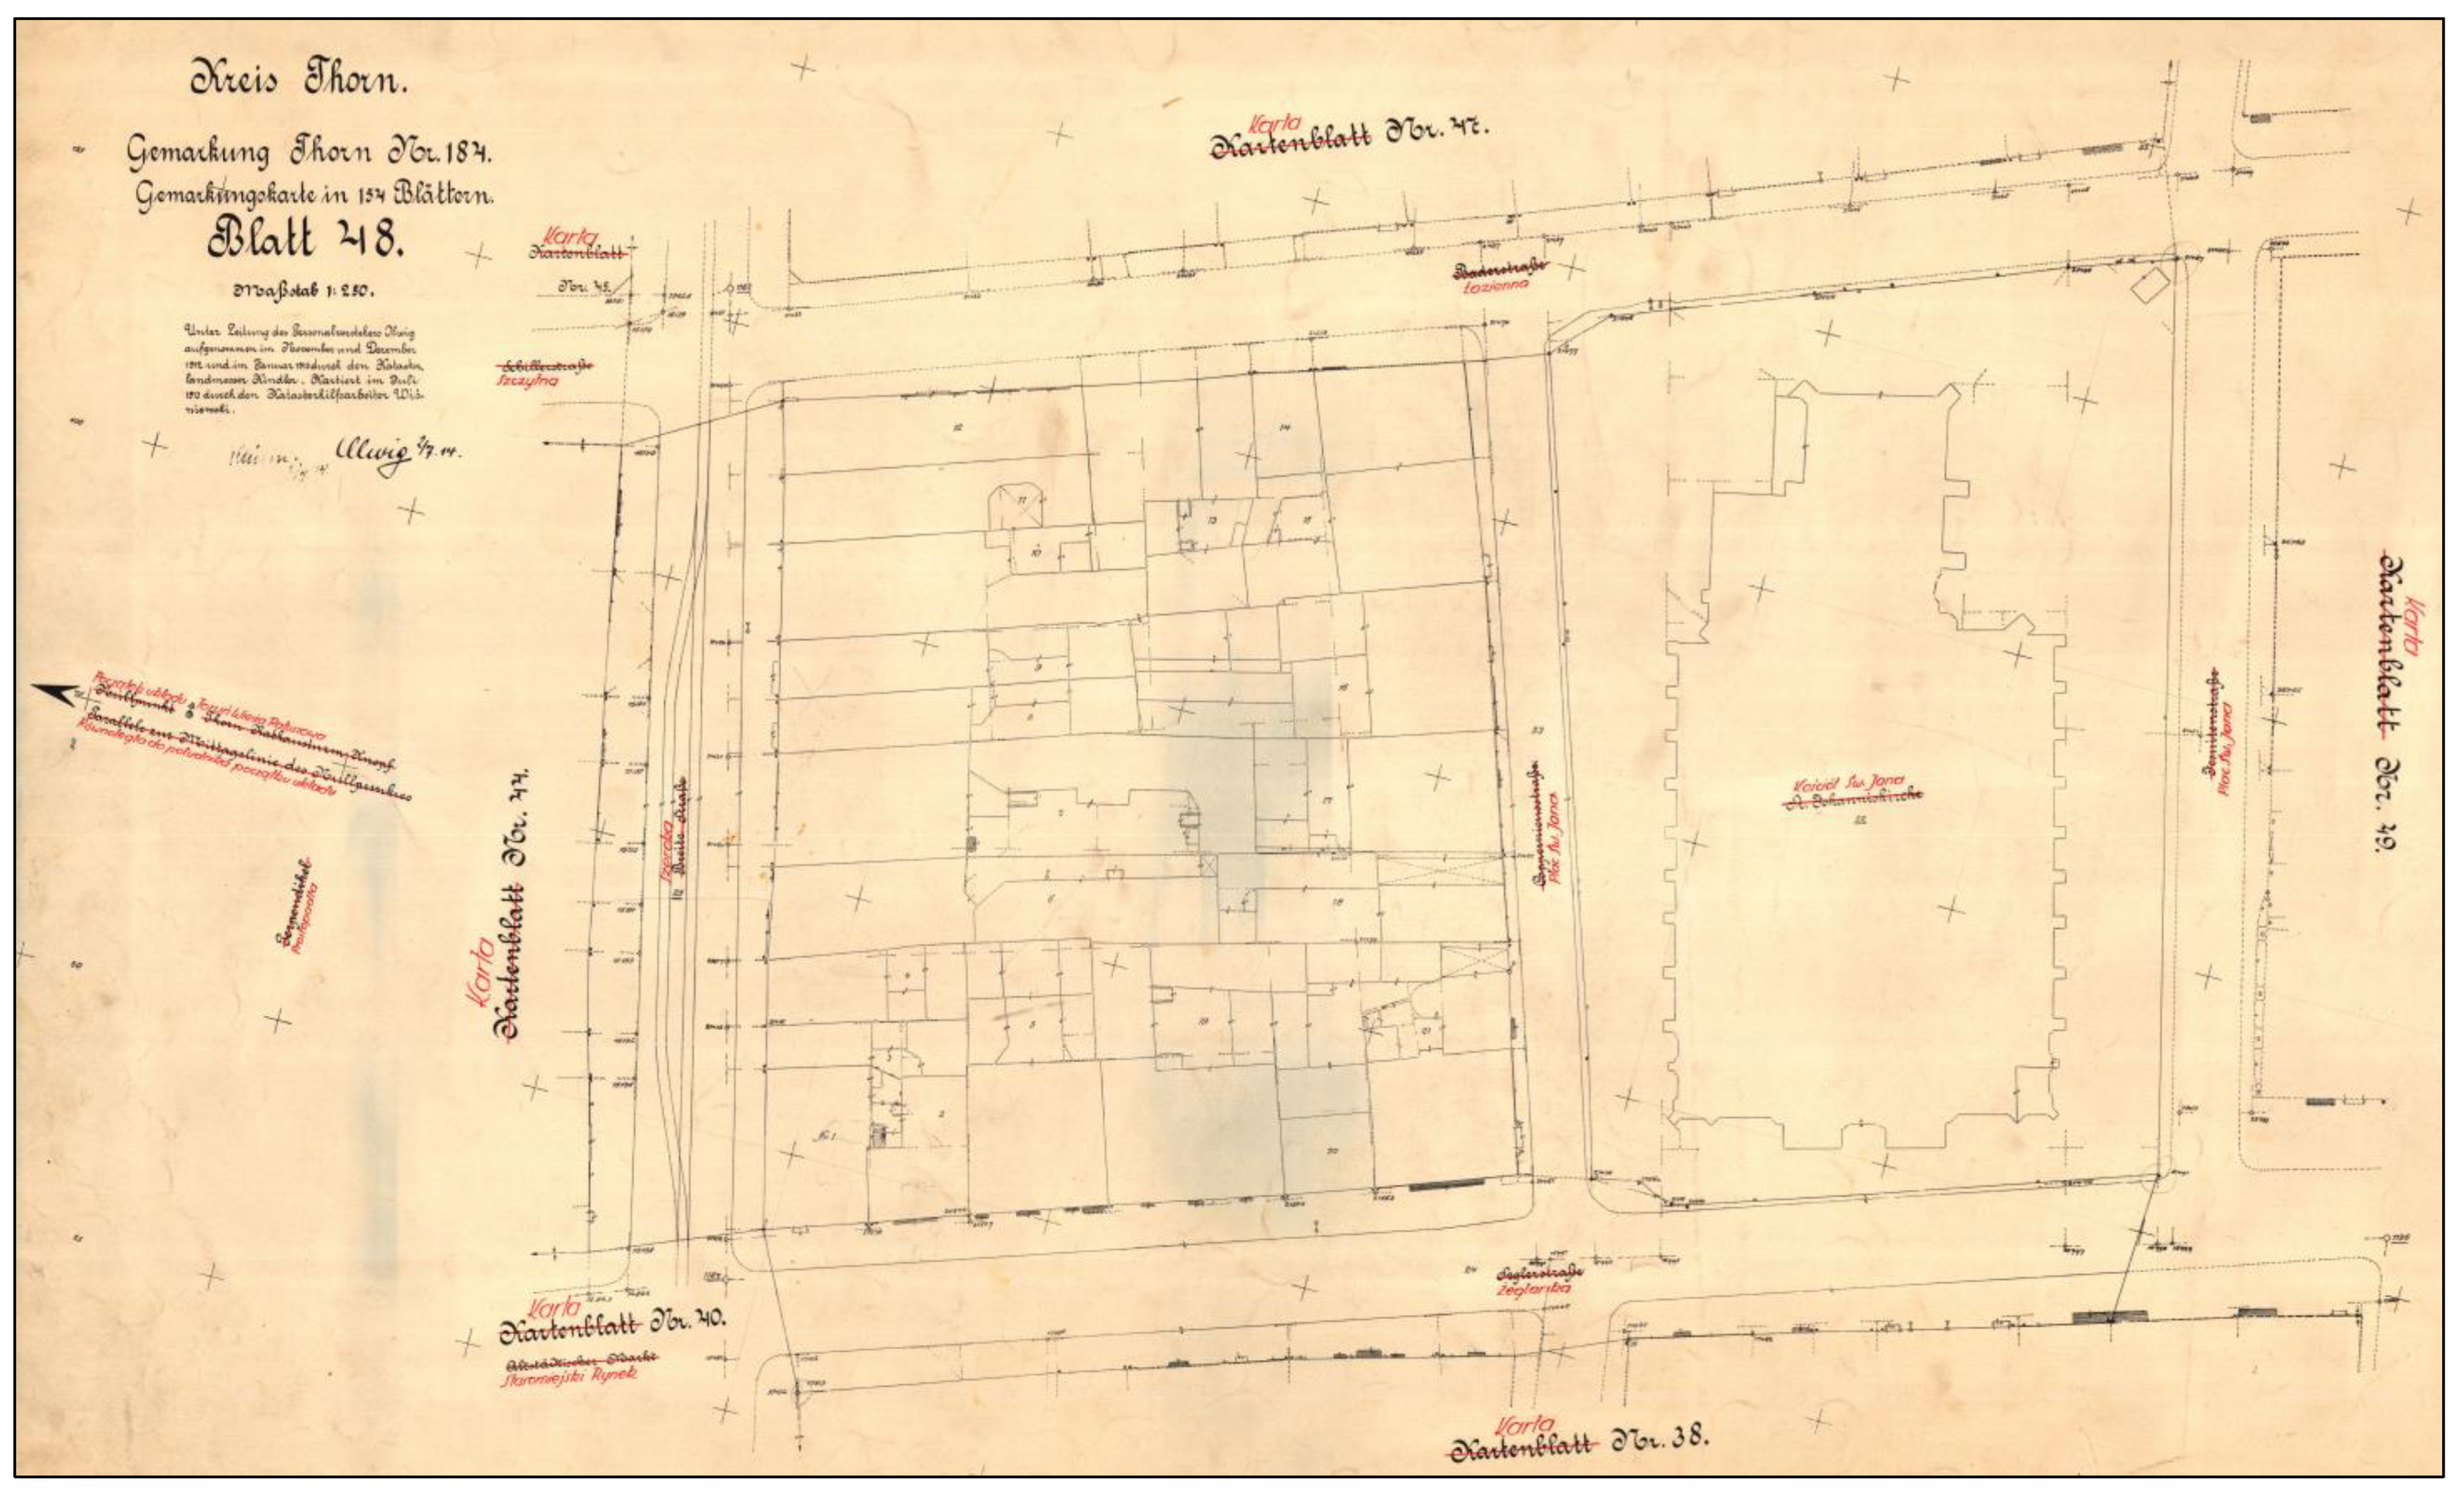
The efforts outlined above resulted in the production of 154 cadastral map sheets at varying scales. A scale of 1:250 was applied to areas within the medieval walls (
Figure 2). The maps for the suburbs were made at a scale of 1:500, whereas the sheets covering the sparsely settled areas along the Vistula were prepared using scales of 1:1000 and 1:2000. The cadastral map of Toruń continued to be used by the municipal offices until the late 1970s. Two well-preserved copies of the map are currently deposited in the State Archives in Toruń [
40]. Apart from 154 sheets of the map of Toruń, another 24 sheets of the cadastral map of the village of Mokre were used to prepare the cartometric image of the cadastral map.
4. Preparation of the General Image of the Cadastral Map
In order to produce a raster image for calibration and rectification, the cadastral maps of Toruń were scanned (at a scale of 1:250 for the Old Town area, at a scale of 1:500 for the suburbs and at scales of 1:1000 and 1:2000 for other areas). Once this was completed, the resulting raster image had to be properly prepared for further work. This preparation involved the graphical correction and “cleaning” of the raster, as well as the cropping of the image to the internal frame or map content. This was followed by calibration.
The calibration of the acquired raster data in the local rectangular coordinate system was an important stage from the point of view of geometric accuracy of the whole development of the GSDoT-HO of the cadastral map of Toruń. The calibration process consisted of assigning appropriate coordinates to the selected points on the raster, which allowed the selected transformation algorithm to scale, rotate, and stretch the map image in space so as to obtain its cartometric form while eliminating possible distortions of the paper sheet.
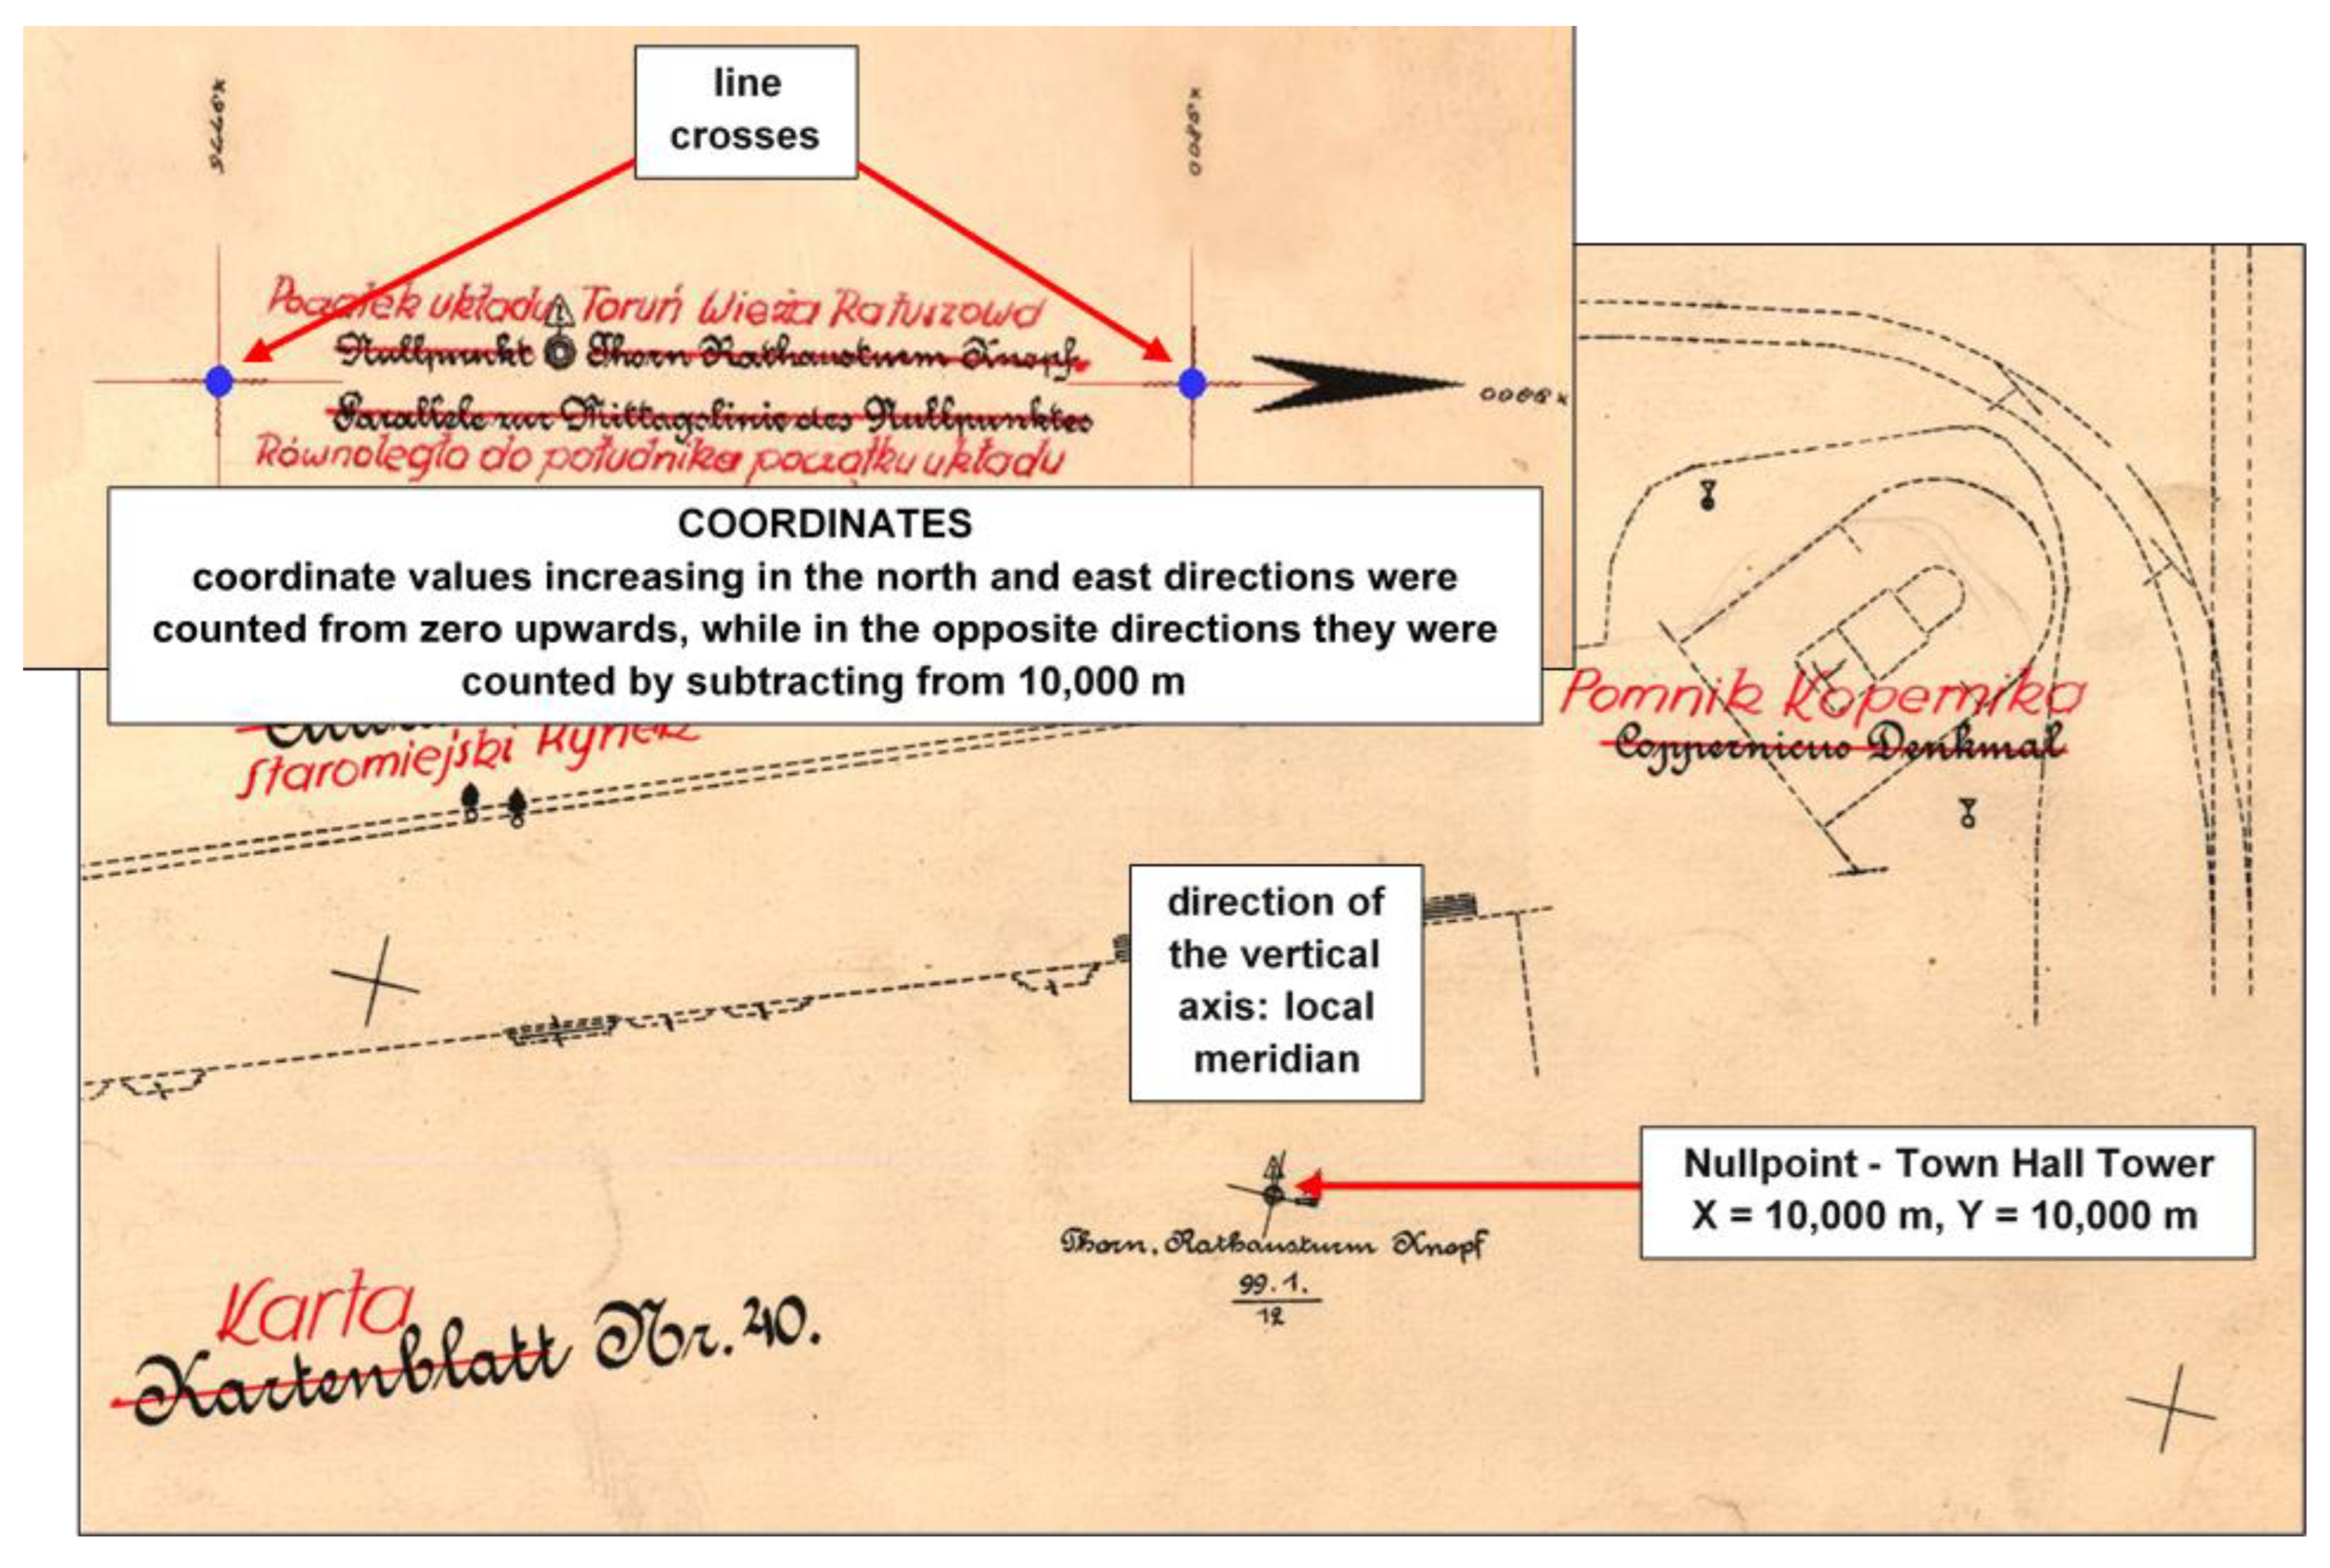
The Toruń cadastre was created from detailed land surveys based on the geodetic control network in the local rectangular coordinate system—Toruń Town Hall Tower (Thorn Rathausturm Knopf). This is an example of the former cadastral system, in which the individual sheets of the cadastral map (due to the small area) were plotted by treating the area covered by the map as a plane. In this system, the direction of the vertical axis was applied to the local meridian passing through the starting point (Nullpoint), in this case, the Town Hall Tower, which was assigned coordinates X = 10,000 m and Y = 10,000 m (
Figure 3). The representation of the layout hereby designed on the cadastre consists of line crosses with descriptions, reflecting the course of the rectangular grid every 25 m, 50 m, 100 m, or 200 m, at scales of 1:250, 1:500, 1:1000, and 1:2000, respectively. For the sake of simplicity, the coordinate values increasing in the north and east directions were counted from zero upwards, while in the opposite directions, they were counted by subtracting from 10,000 m. This procedure made it possible to use the line crosses as reference (control) points in the calibration and rectification process of the individual sheets of the cadastral map (
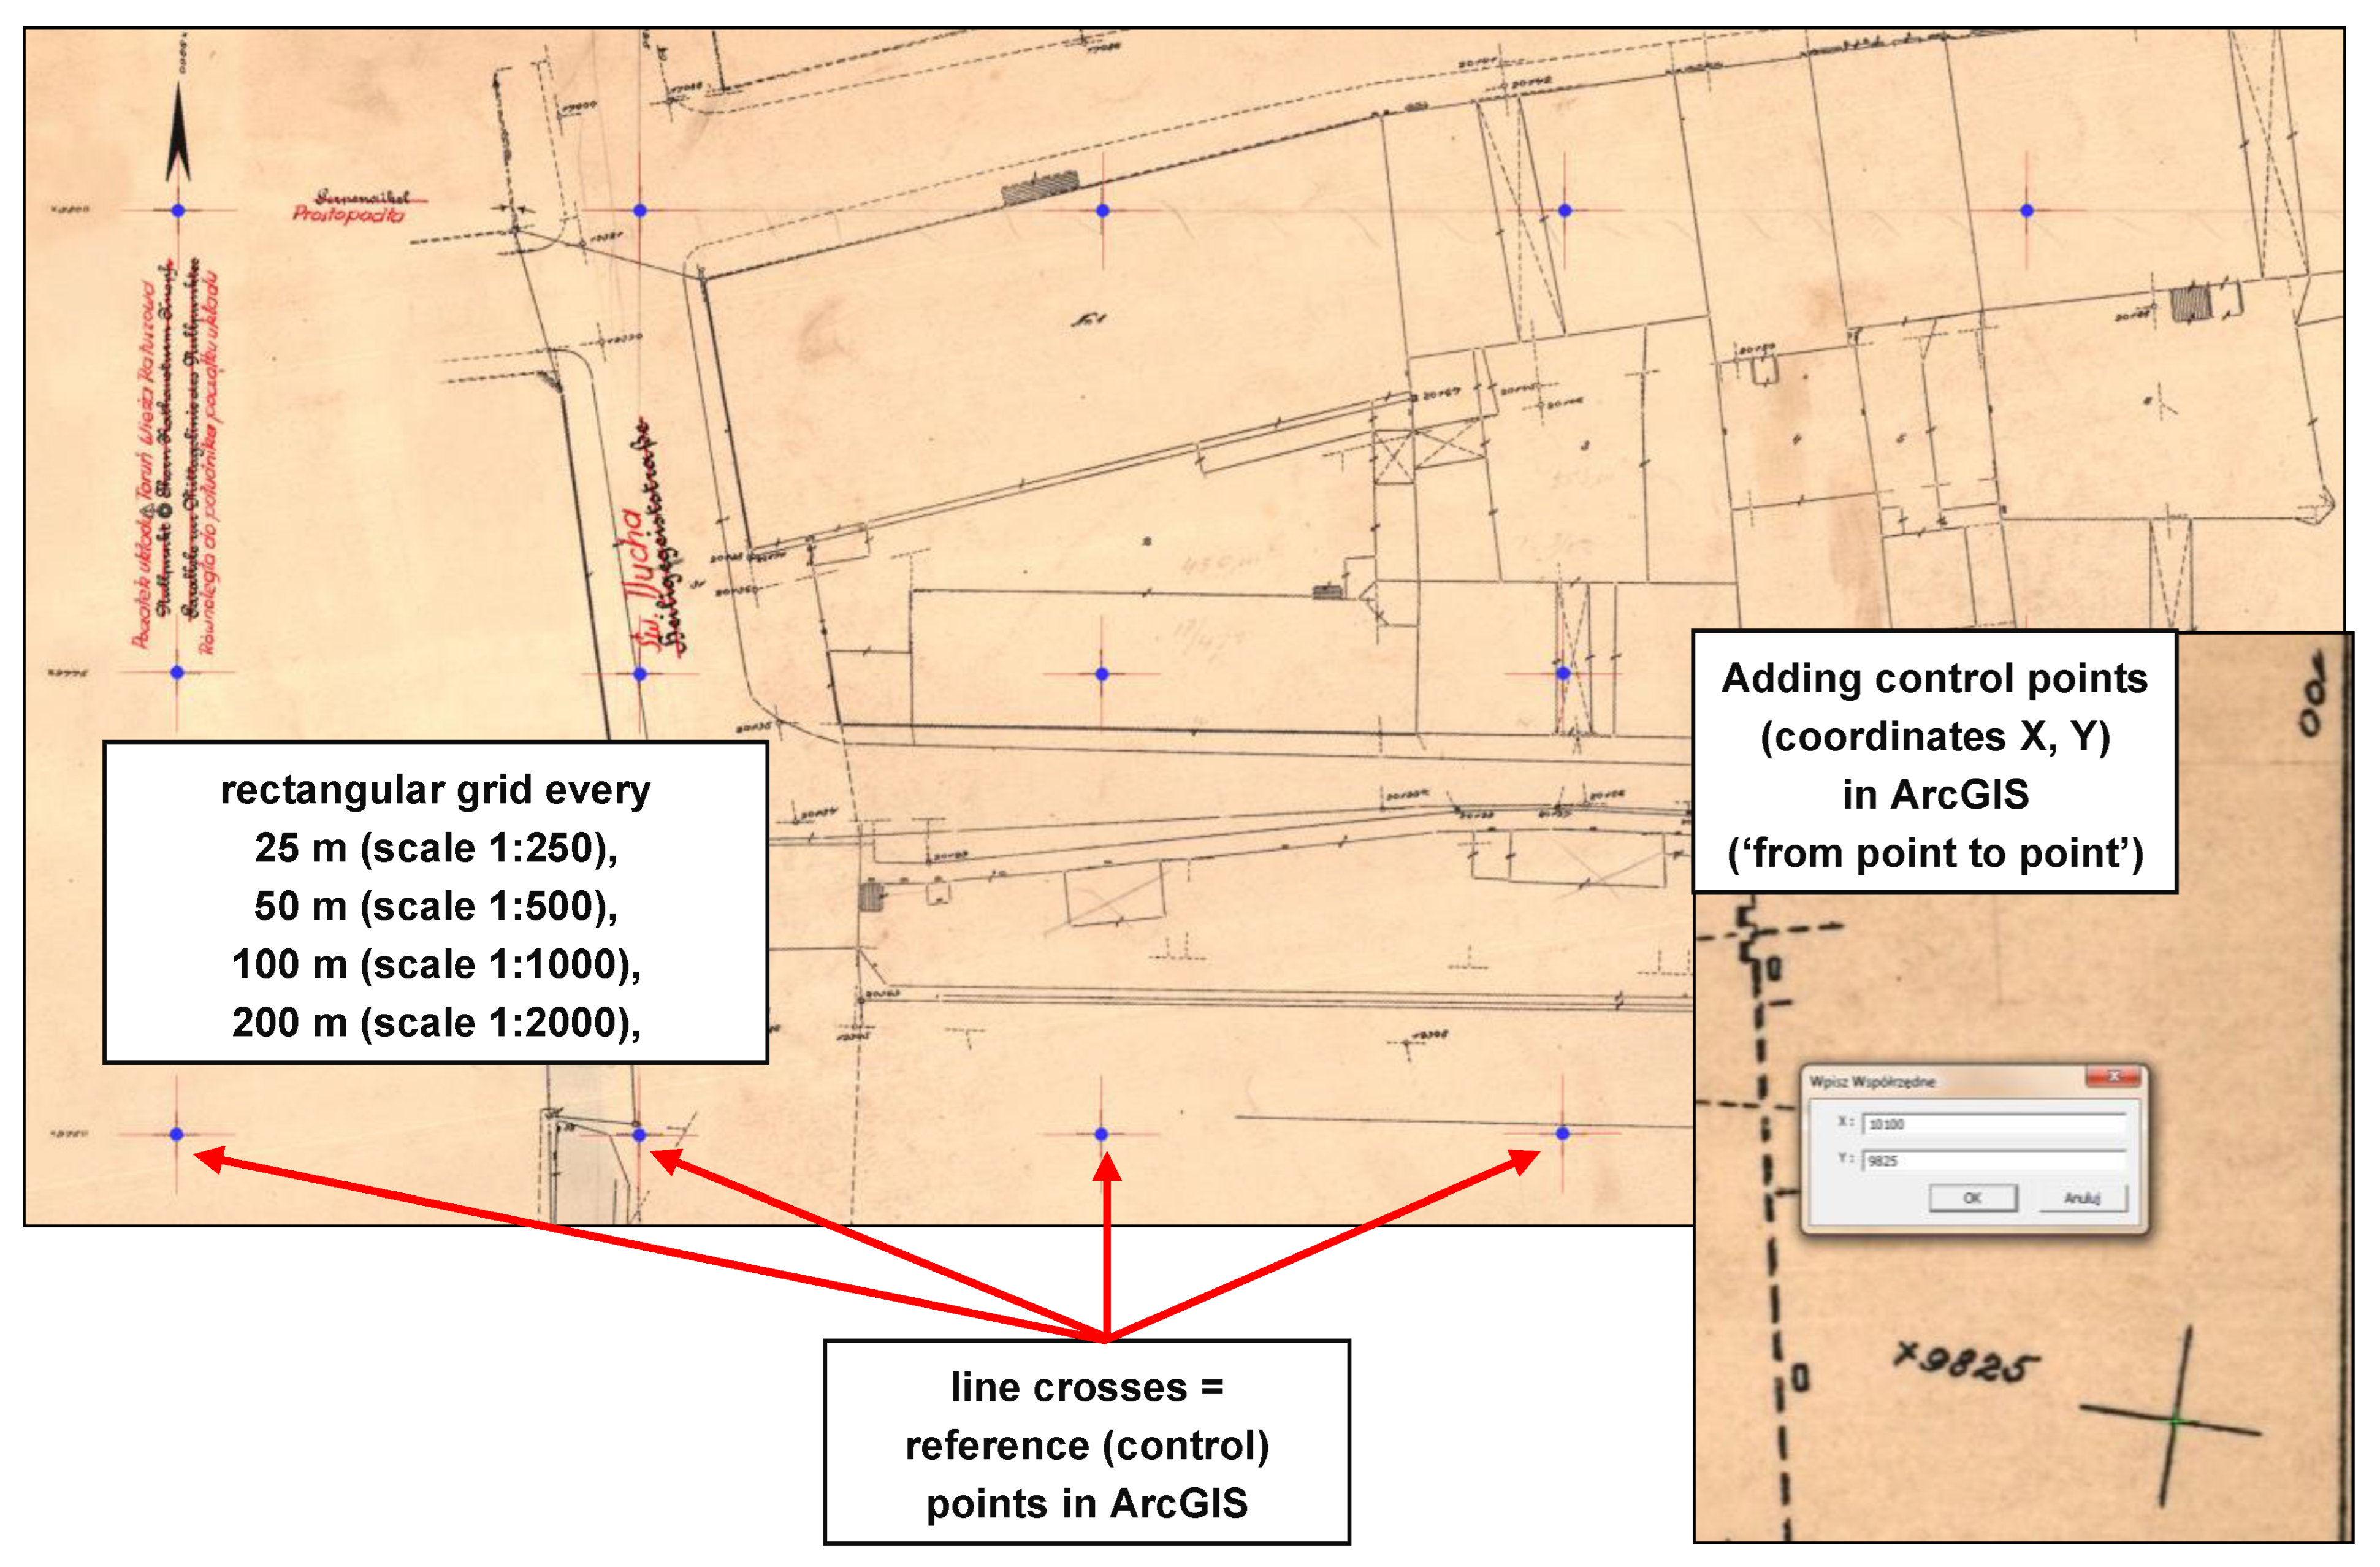
Figure 4). This has a considerable advantage when dealing with archival cartographic material that does not have a rectangular grid image and/or is not based on a geodetic control network, as it significantly simplifies the map calibration process, making it more accurate.
In this project, the georeferencing of the cadastral maps was performed in the ESRI environment (ArcGIS Desktop software), specifically using the GRS-80 ellipsoid (Geodetic Reference System ‘80) from the PUWG PL-2000 system. This is also the basis for the National Geodetic Coordinate Systems currently applicable in Poland. Each time, the calculations were based on an affine transformation, using all of the relevant control points on a given sheet and obtaining the root mean square error (RMSE) of a satisfactory value of a few centimetres (at a scale of 1:250). Ultimately, the process of calibration of the separate raster sheets yielded a uniform and comprehensive image of the cadastral map of Toruń.
The resulting uniform and comprehensive image of the cadastre of Toruń needed to be properly prepared for the vectorisation stage. This required a transformation of the cadastre image from the local rectangular system—Toruń Town Hall Tower (Thorn Rathausturm Knopf)—into the State Geodetic Coordinate System currently applicable in Poland (PUWG PL-2000, zone 6). The PUWG PL-2000 is one of the elements of the state spatial reference system in Poland employed in land surveying to produce maps at scales of 1:10,000 and larger and is based on the Gauss–Krüger projection, the GRS-80 ellipsoid and the division of Poland into four three-degree zones [
41].
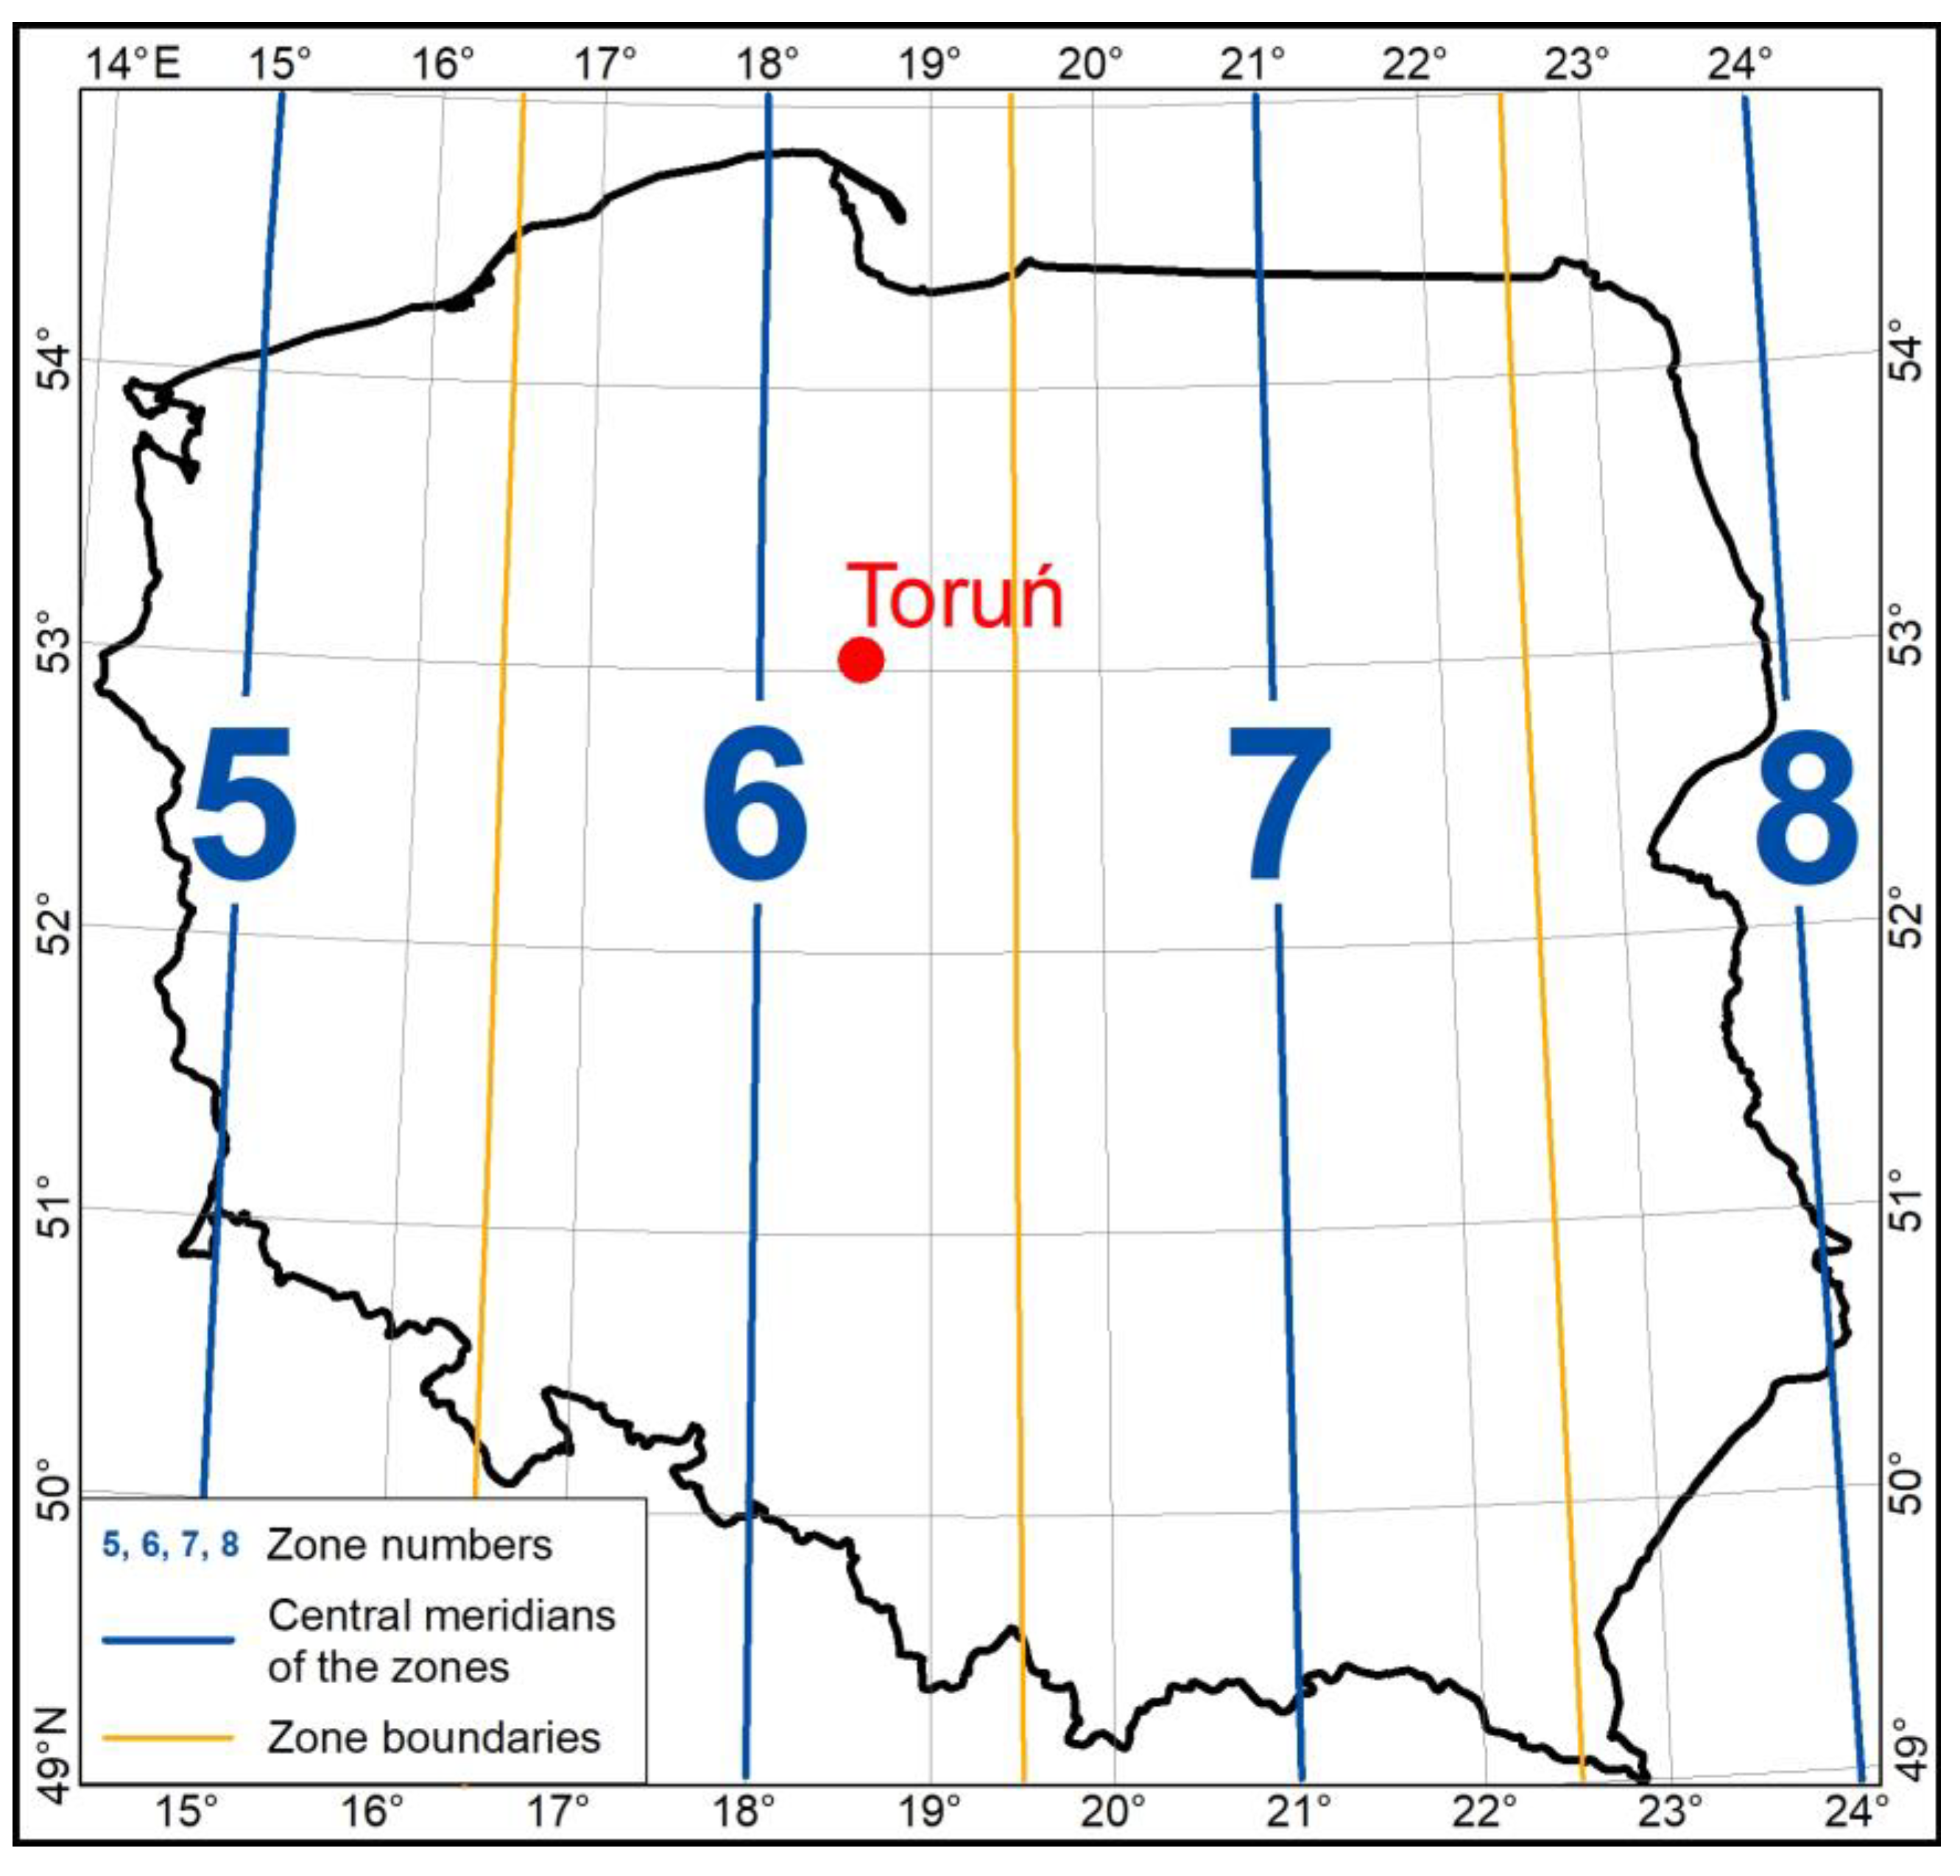
Figure 5 shows the zoning of Poland in the PUWG PL-2000, together with the location of Toruń within these zones.
The transformation of the cadastral map between the above-mentioned systems involved moving the sheets to the appropriate place in the space of the PUWG PL-2000 system. This was carried out on the basis of an analogical dependence, describing the relationship of the position of the starting point—Nullpunkt (Town Hall Tower)—located on the cadastral map, to the corresponding point of the current PUWG PL-2000 geodetic control network. This was assigned the number 355301400, and the coordinates 53°00′37.48′′ N, 18°36′16.83′′ E (X = 5,875,497.641 m and Y = 6,540,583.196 m). In the present case, the transformation process did not need to account for the twisting and rescaling of the coordinate system.
5. Data Vectorisation
The next stage of the work encompassed the vectorisation of the point, line, and polygon (surface) data, which was carried out by a team consisting of several people working in accordance with the guidelines described below so that the vector data obtained after the consolidation formed the geometrically homogeneous spatial database.
It was of paramount importance that topological errors were avoided during the vectorisation process in order to maintain the correctness and high quality of the vector data geometry. In particular, it concerned layers with plots, buildings, pavements, or streets, where all successively introduced new objects, based on an existing line or vertex, had to be accurately “connected” with them. Meeting this condition required the careful use of “snapping tools”.
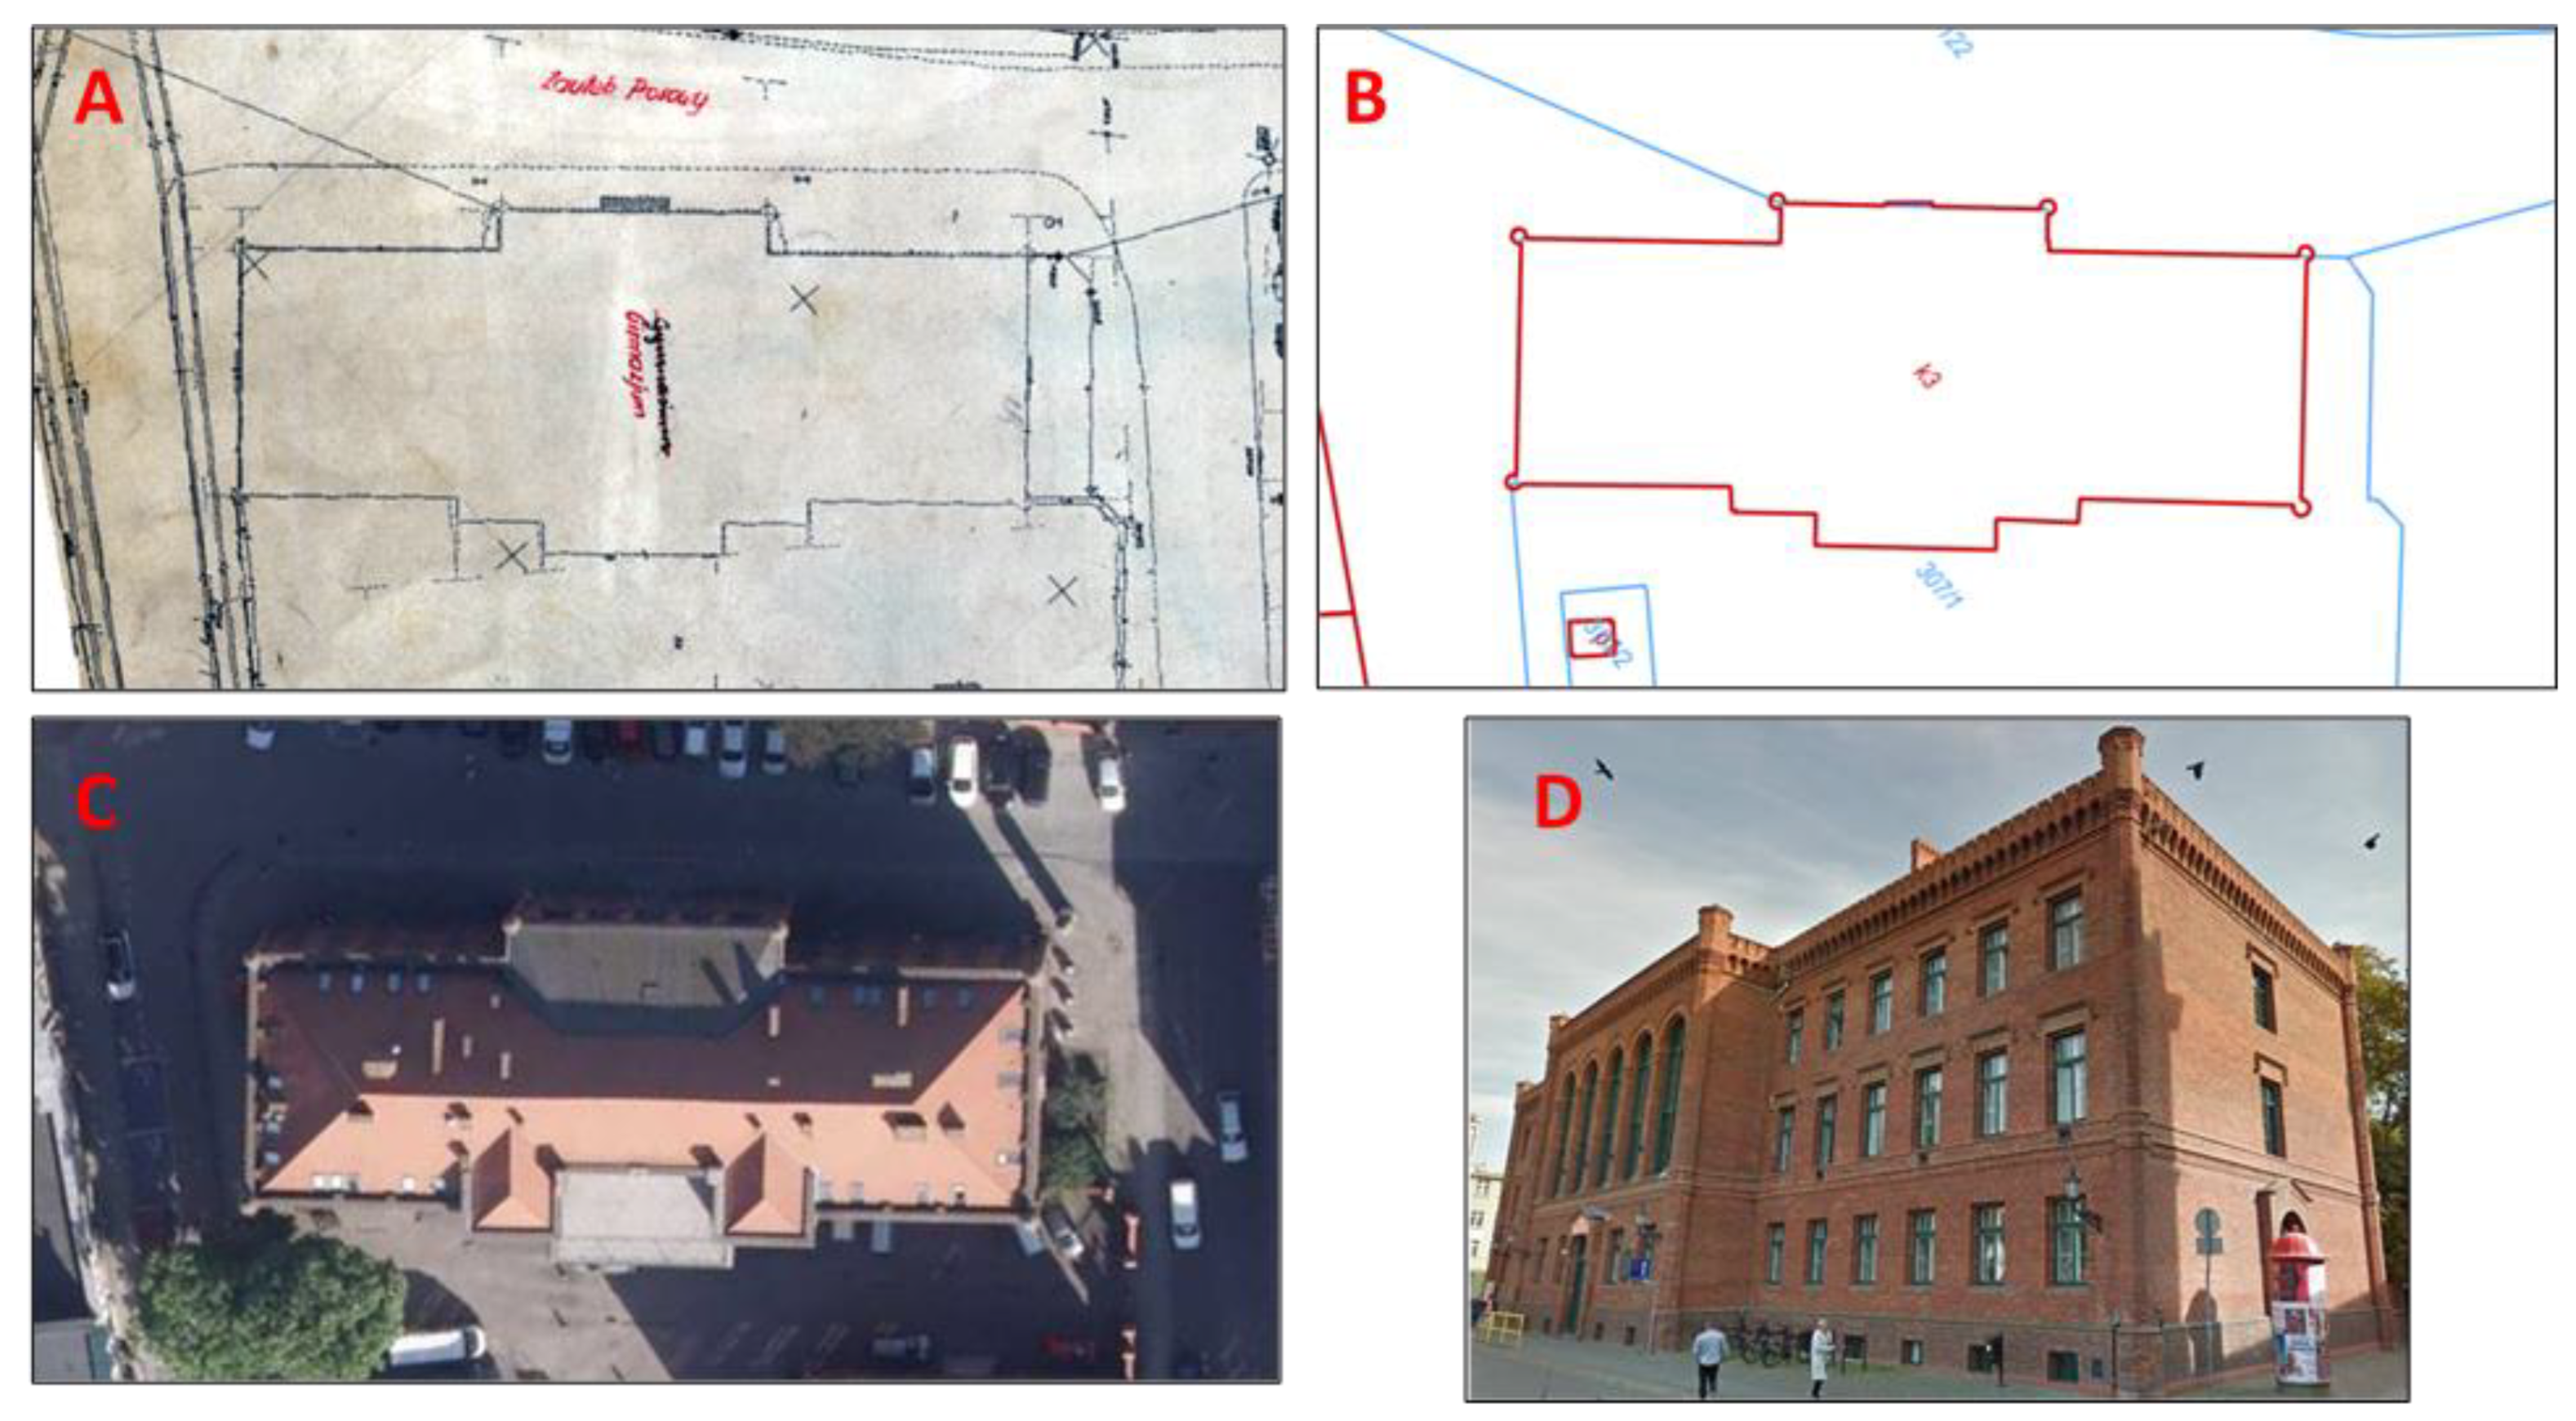
Another crucial issue was the correct interpretation of the contents of the cadastral map. Any doubts concerning the drawing of the cadastre, as well as the location and course of the objects on it, had to be verified with the available cartographic and remote sensing materials, alongside all sorts of data provided by the national geoportal (national spatial databases, topographic maps, aerial photographs), the geoportal of the city of Toruń (high-resolution orthophoto maps), or Google Maps services—Google Street View (
Figure 6). If there had been any further ambiguities, they would have been discussed and clarified within the vectoring team, eventually adopting a unified approach to a given issue.
5.1. Geometry Types for Vectorised Information Layers
5.1.1. Plots—Geometry Type: Polygon
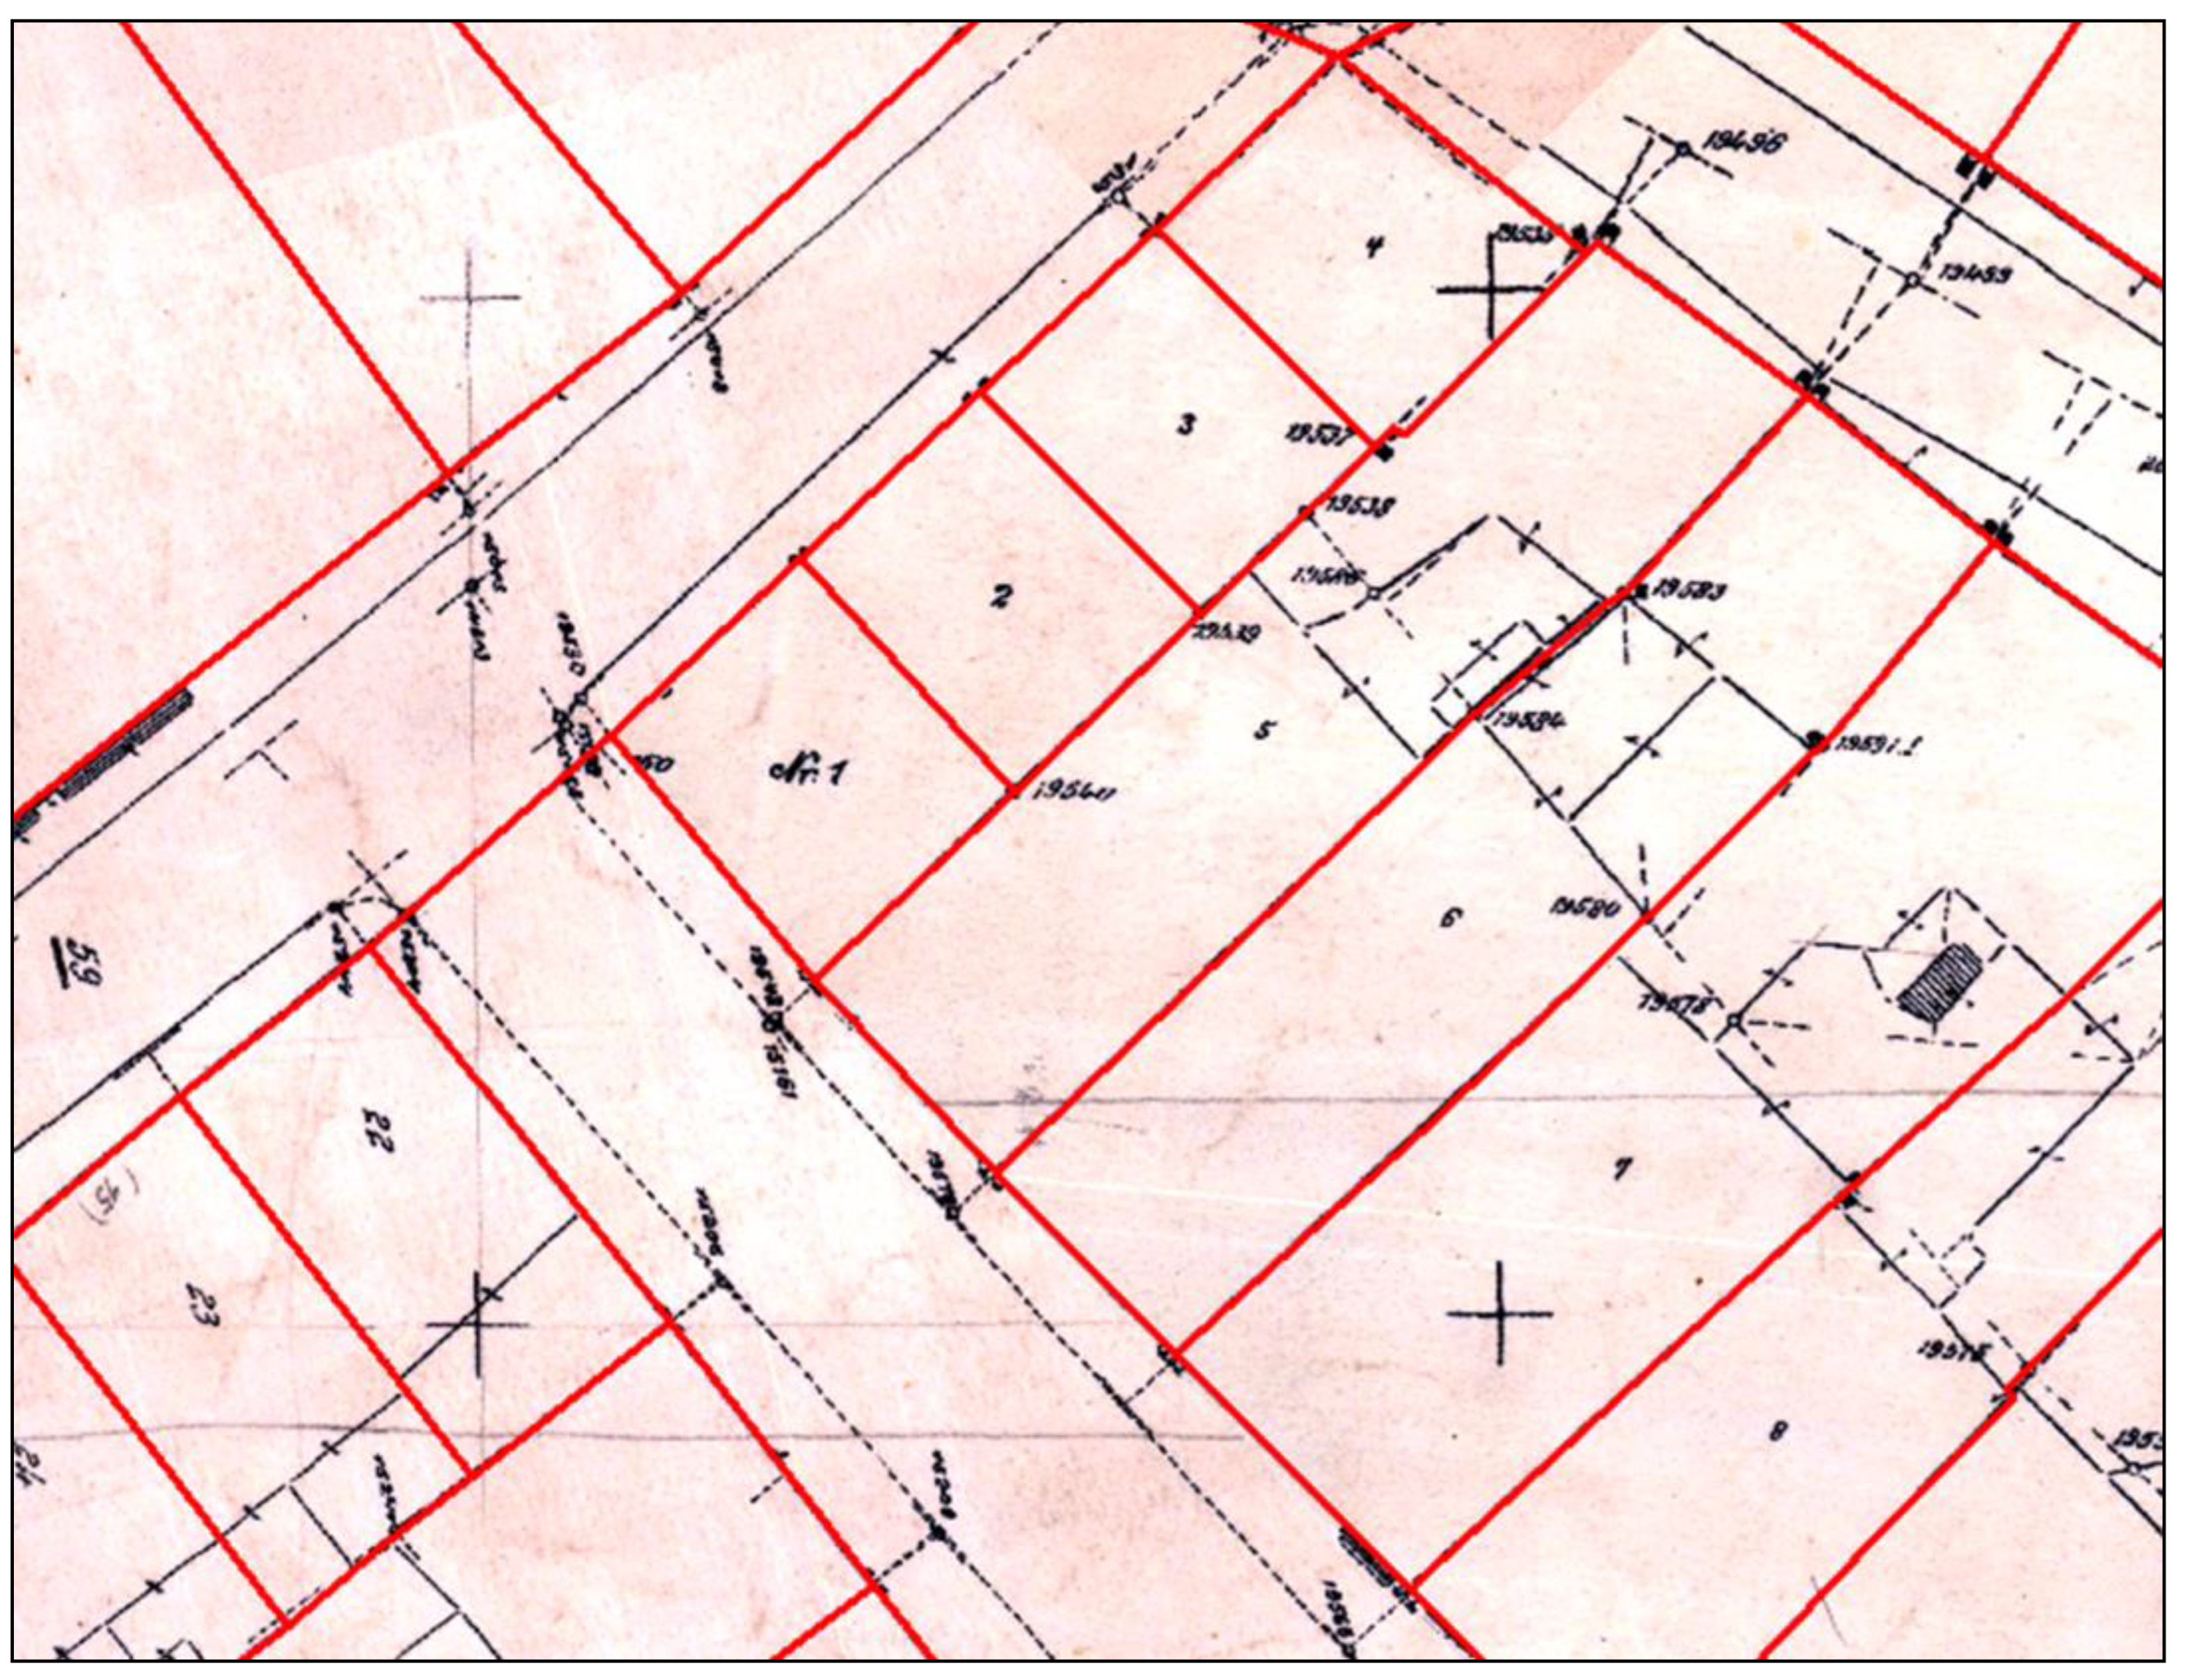
Due to their distinct character owing to their continuous presence on the map (they filled the entire sheet of the cadastral map), the plots were the first and basic vectorised information layer (
Figure 7). The other linear and polygon layers (e.g., buildings, tram lines, or waters) that delineated against the plots formed a group of spatial data and featured discretely on the cadastral map.
Plot boundaries usually ran along straight lines joined at the corners, retaining their geometric character derived from the established land division in a given area. In the case of proximity to natural objects (e.g., rivers and lakes), plot boundaries could also take the shape of curved lines running along these objects.
5.1.2. Built-Up Area—Geometry Type: Polygon
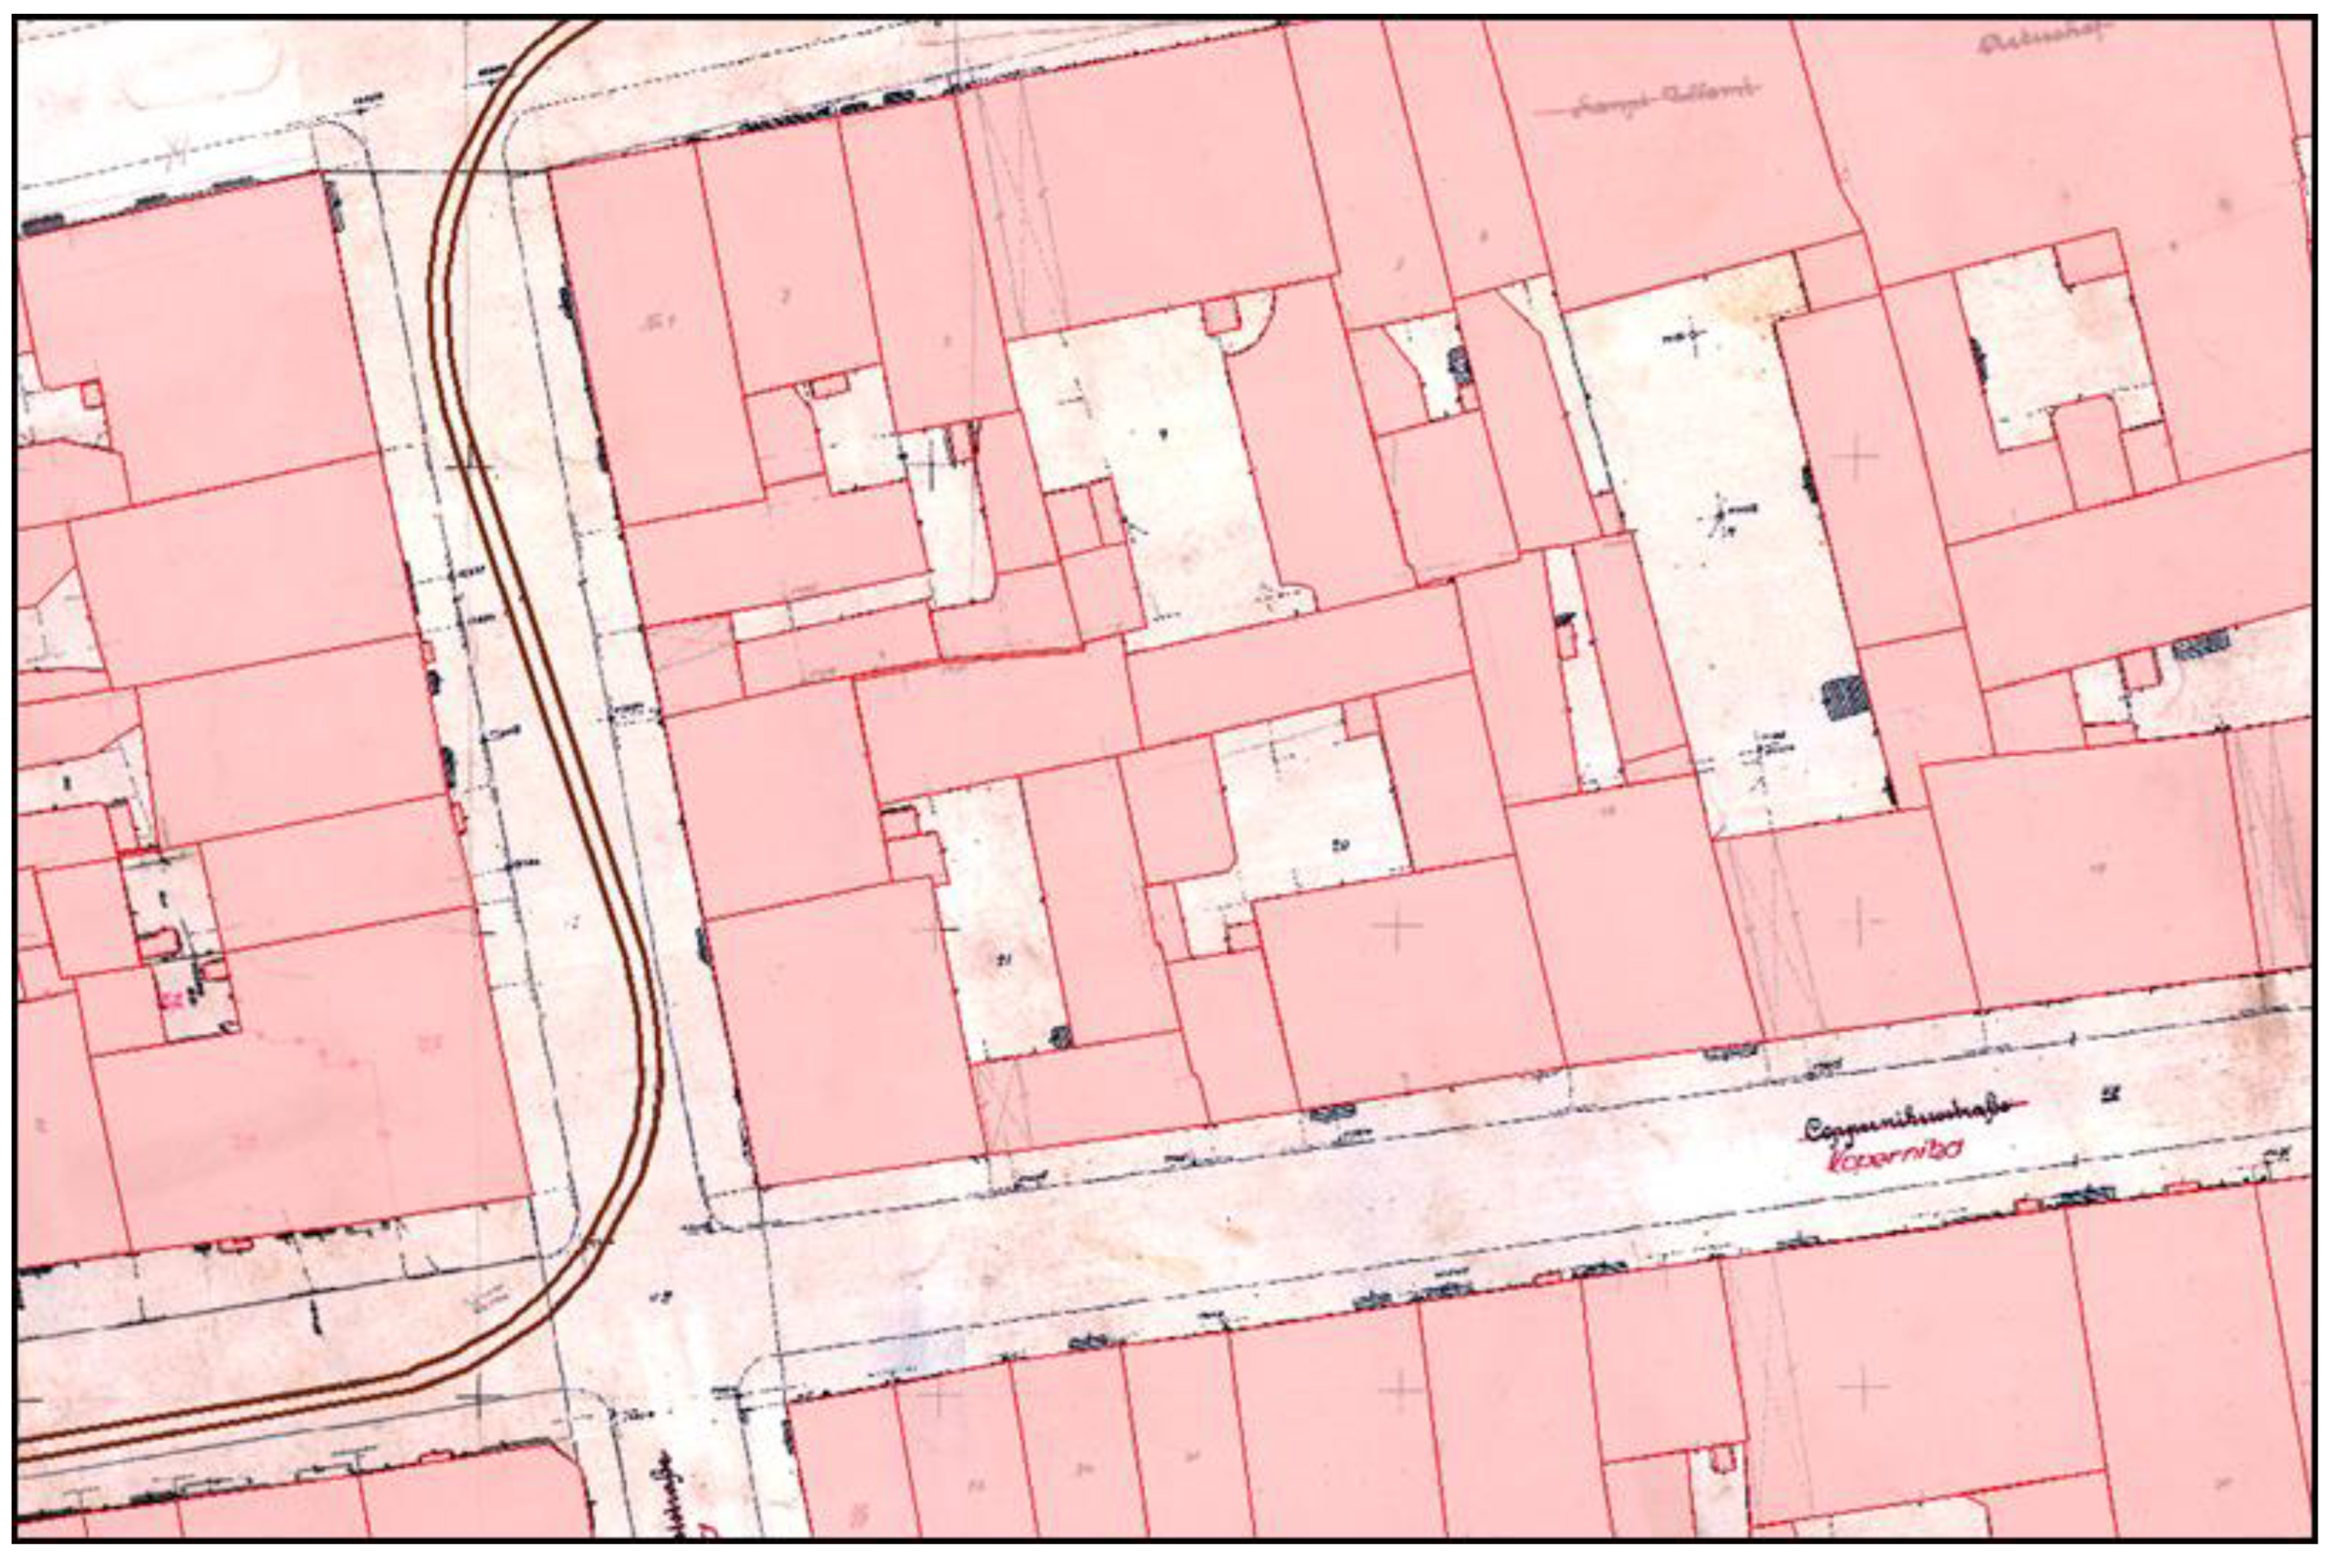
Another essential layer was the broadly defined built-up area (
Figure 8), which consisted of buildings as well as gates, walls, and other structures. All objects comprising the built-up area were vectorised as surfaces. Particular attention was paid to maintaining the correct geometry, including the angles for rectangular buildings, through the use of appropriate tools (e.g., the “rectangle” tool).
5.1.3. Streets—Geometry Type: Polygon
In order to build a database for the street network, a very important element in the city’s communication system, all the streets delineated on the cadastral map were vectorised. Ultimately, they should form a joint geometric object of a surface character. In the urban space depicted on the cadastral maps, they were most often bounded by pavements (
Figure 8) and occasionally by the walls of buildings.
5.1.4. Pavements—Geometry Type: Polygon
Pavements represent an additional information layer related to and complementary to streets. Pavements, analogous to streets, were defined as objects of surface geometry that typically bordered the streets and the walls of buildings (
Figure 8).
5.1.5. Waters—Geometry Type: Polygon
Included in the water layer was standing water in the form of lakes and artificial reservoirs and flowing water, such as rivers (
Figure 9), streams, canals, and other waterways. Taking into account the scales at which the sheets of the cadastral map of Toruń were developed (large-scale maps) and the accuracy, all waterways, including linear hydrographic objects (i.e., natural and artificial watercourses), were vectorised as surfaces. At the same time, it was very important to pay attention to the actual nature of the boundaries for each object. The boundaries characteristic of natural objects were delineated with the use of curvature, whereas waters with geometric shapes, usually of anthropogenic origin, were drawn with the use of straight lines.
5.1.6. Railway Lines—Geometry Type: Line
All railway lines, irrespective of their gauge, were vectorised as lines.
5.1.7. Tram Lines—Geometry Type: Line
Tram lines were defined by a double line (
Figure 8).
5.1.8. Inscriptions—Geometry Type: Line
Inscriptions relating to street names and market squares/places, where it was essential to maintain their correct direction and position, were introduced into the database by means of linear geometry. This ultimately eased their appropriate positioning on the map to a considerable degree. The team incorporated both the original German inscriptions in black and those applied by the Polish administration in red (
Figure 10). This layer did not take into account names placed horizontally on the cadastral map, describing plots of land, waters, or buildings (e.g., churches, public buildings), which were a separate group of inscriptions, defined and assigned in the database directly to the specific information layers mentioned above.
6. Georeferential Spatial Database of Topographic–Historical Objects
The next stage in the project concerned the development of a draft structure for the database of topographic–historical objects in the State Geodetic Coordinate System 2000 (PUWG PL-2000, zone 6). The GSDoT-HO idea takes into account its structure, including the sequence and division into individual information layers and the type of raster and vector data (e.g., point, line, polygon, and inscription). The structure also encompasses the functionality and information scope of the individual layers, together with the content of the main cadastral layers, along with the content of their attribute tables and coding (
Table 1,
Table 2 and
Table 3 and
Figure 11 and
Figure 12).
7. Summary and Conclusions
The concept presented here of the georeferential spatial database of topographic–historical objects represents a follow-up to the ongoing Europe-wide discussion on the methodology of employing GIS technology for editing large-scale cadastral maps within the framework of the Historic Towns Atlases project. On the one hand, this concept should be seen as a proposal for the structure of the database, while on the other hand, it can also be seen as an example of good practice in the application of Geographic Information Systems in historical and cartographic projects. Until now, attempts to use GIS technology to edit historic town atlases have been primarily directed towards the development of specific interactive maps. However, the concept presented here opens up a new level of discussion, shifting the focus to georeferential databases. This discussion allows for the editing of cadastral maps and maps presenting historical data. The article also puts forward solutions to the various problems that can be encountered in projects such as this. These solutions address the following six questions:
- -
How should map sheets prepared in the older cadastral system be calibrated and registered?
- -
How should doubts related to the content (drawing) of the cadastre and the objects in it be resolved?
- -
What types of geometry should be chosen in the vectorisation process for individual information layers?
- -
How should topological errors be avoided and the correct geometry of the vector data be maintained?
- -
What are the most important issues (e.g., concerning the nature of the geometry) to pay attention to during the vectorisation of individual information layers?
- -
How should the processing and handling of raster and vector data be sequenced?
In the course of work on the construction of a georeferential spatial database of topographic–historical objects based on the example of the cadastral map of Toruń, seven information layers with linear or polygon geometry were created. The most important layers included the plots and buildings, which contained approximately 5800 and 10,800 vectorised polygon objects, respectively, for the then-area of the city of Toruń. In the entire process, the greatest problems were related to the development of the database project, the process of vectorisation of the content of the cadastral maps, in addition to the calibration and rectification of raster data in the currently valid State Geodetic Coordinate System (PUWG PL-2000, zone 6).
It should be emphasised that this article presents only the basic (general) structure of the georeferential spatial database of topographic–historical objects, which can become the basis for importing socio-topographical data in subsequent stages of work. The vector data constituting the database of topographic–historical objects may, therefore, be enriched with attribute data. An example of such data could be information on the social position, religion, or occupation of the inhabitants, the function of the objects, address data, the nomenclature, the condition of the real estate, the use/cover of the terrain, the elevation of the terrain such as contour lines and elevation points, as well as information describing the city’s street/road network.
The application of the proposed approach to the construction of the georeferential spatial database of topographic–historical objects, devised on the example of the experience of editing the cadastral map of Toruń, would allow for the unification of the database production. The project presented in this paper can be applied to future editorial work on large-scale historical maps. It was also designed for the needs of the publishers of the
Historic Towns Atlases from 19 European countries, who are offered a new tool to finally meet the recurring requirement of standardising the principles of constructing the core map in town atlases [
4,
7]. As such, it would also facilitate effective urban comparative research within the
Historic Towns Atlases editing project. An opportunity to verify the aforementioned assumptions related to the development of interactive maps is provided by a joint project implemented since 2022 by the Polish and German editors of
Historic Towns Atlases. The project, under the title
Historical survey maps and the comparative study of the functionality and morphology of urban space. Standardization–Digital processing–Research seeks to digitally edit maps of three Polish and three German towns according to common standards and to analyse the urban spaces on the basis of cartographic geodata. It was beyond the scope of this study to consider the principles of map development and cartographic editing on the basis of databases. However, we believe that this article shall inspire discussion on this important topic among editors of large-scale historical maps.
Author Contributions
Conceptualization, Radosław Golba, Agnieszka Pilarska and Roman Czaja; methodology, Radosław Golba; software, Radosław Golba and Agnieszka Pilarska; validation, Radosław Golba; formal analysis, Radosław Golba and Agnieszka Pilarska; investigation, Radosław Golba, Agnieszka Pilarska and Roman Czaja; resources, Radosław Golba and Roman Czaja; data curation, Radosław Golba, Agnieszka Pilarska and Roman Czaja; writing—original draft preparation, Radosław Golba, Agnieszka Pilarska and Roman Czaja; writing—review and editing, Radosław Golba, Agnieszka Pilarska and Roman Czaja; visualization, Radosław Golba and Agnieszka Pilarska; supervision, Radosław Golba and Roman Czaja; project administration, Radosław Golba and Roman Czaja; funding acquisition, Roman Czaja. All authors have read and agreed to the published version of the manuscript.
Funding
This research was funded by the National Science Centre, Poland, grant number 2014/15/BHS3/02458, “Historical Atlas of Polish Towns: Toruń, volume 2”.
Data Availability Statement
The data presented in this study are available upon request from the corresponding authors and on the official website of the project: “Historical Atlas of Polish Towns” at
http://atlasmiast.umk.pl/atlasy/torun-ii/ (accessed on 5 December 2022).
Acknowledgments
We would like to thank Anna Maleszka and Gregory Leighton for their help with preparing the English text. We thank the editors and the anonymous reviewers for their insightful comments and suggestions.
Conflicts of Interest
The authors declare no conflict of interest.
References
- Simms, A. The European Historic Towns Atlas Project. In Lords and Towns in Medieval Europe. The European Historic Towns Atlas Project, 1st ed.; Simms, A., Clarke, H.B., Eds.; Ashgate: Farnham, UK, 2015; pp. 13–32. ISBN 978-0-367-88801-5. [Google Scholar]
- Stracke, D.; Tippach, T. Der Deutsche Historische Städteatlas. Zur konzeptionellen Weiterentwicklung eines nationalen Städteatlasses. In Städteatlanten. Vier Jahrzehnte Atlasarbeit in Europa; Ehbrecht, W., Ed.; Böhlau: Köln/Weimar, Germany; Wien, Austria, 2013; pp. 57–59. ISBN 978-3-412-20631-4. [Google Scholar]
- Clarke, H.B. Construction and deconstruction. Components of an historic towns atlases methodology. In Städteatlanten. Vier Jahrzehnte Atlasarbeit in Europa, 1st ed.; Ehbrecht, W., Ed.; Böhlau: Köln/Weimar, Germany; Wien, Austria, 2013; pp. 32–34. ISBN 978-3-412-20631-4. [Google Scholar]
- Stracke, D. The Digital Media Revolution—Historic Towns Atlases (HTAs). In Towns as Living Spaces in (East) Central Europe: Static and Dynamic Aspects of Late Medieval Urban Communities, 1st ed.; Gruber, E., Majorossy, J., Eds.; East Central and Eastern Europe in the Middle Ages, 450–1450; Brill: Leiden, The Netherlands, 2023; in press. [Google Scholar]
- Thumser, M. Verfahrensweisen bei der Edition deutschsprachiger Geschichtsquellen (13.–16. Jahrhundert). In Edition Deutschsprachiger Quellen aus dem Ostseeraum (14.–16. Jahrhundert), 1st ed.; Thumser, M., Tandecki, J., Heckmann, D., Eds.; Nicolaus Copernicus University Press: Toruń, Poland, 2011; pp. 13–34. ISBN 83-2311325-4. [Google Scholar]
- Ehbrecht, W. Atlasarbeit auf dem Weg. Eine Einführung: Bilanz und Perspektiven. In Städteatlanten. Vier Jahrzehnte Atlasarbeit in Europa, 1st ed.; Ehbrecht, W., Ed.; Böhlau: Köln/Weimar, Germany; Wien, Austria, 2013; pp. VII–XLIII. ISBN 978-3-412-20631-4. [Google Scholar]
- Chodějovská, E.; Gearty, S.; Stracke, D. The “Digital Turn” of the European Historic Towns Atlas: Comparing solutions for digital atlas production and online presentation. Città Stor. 2015, X/1, 116–118. [Google Scholar] [CrossRef]
- Avril, T. Irish Historic Towns Atlas (IHTA). Derry~Londonderry, 1st ed.; Digital Atlas of Derry-Londonderry; Royal Irish Academy: Dublin, Ireland, 2005; p. 15. Available online: https://queensub.maps.arcgis.com/apps/webappviewer/index.html?id=8b1de78ec1364b80a33e110742416c07 (accessed on 5 October 2022).
- Prunty, J.; Walsh, P. Irish Historic Towns Atlas (IHTA). Galway/Gaillimh, 1st ed.; Digital Atlas of Galway; Royal Irish Academy: Dublin, Ireland, 2016; p. 28. Available online: https://ihta.maps.arcgis.com/apps/webappviewer/index.html?id=2f189531123d4c8797a63379b5938aa9 (accessed on 5 December 2022).
- Martin, J. Irish Historic Towns Atlas (IHTA). Dungarvan/Dún Garbhán, 1st ed.; Digital Atlas of Dungarvan/Dún Garbhán; Royal Irish Academy: Dublin, Ireland, 2020; p. 30. Available online: https://ihta.maps.arcgis.com/apps/webappviewer/index.html?id=63a47a36843d4cebb2f2ff55f89634c6 (accessed on 5 December 2022).
- Meibeyer, W.; Steinführer, H.; Stracke, D. Deutscher Historischer Städteatlas. Braunschweig, 1st ed.; Digital Atlas of Braunschweig; Ardey Verlag: Münster, Germany, 2013; p. 4. Available online: http://www.staedtegeschichte.de/Stadtkarten/braunschweig (accessed on 5 December 2022).
- Mühlhofer, S.; Schilp, T.; Stracke, D. Deutscher Historischer Städteatlas. Dortmund, 1st ed.; Digital Atlas of Dortmund; Ardey Verlag: Münster, Germany, 2018; p. 5. Available online: https://www.uni-muenster.de/Staedtegeschichte/portal/Stadtkarten/Dortmund.html (accessed on 5 December 2022).
- Schloms, A.; Stracke, D.; Wittmann, H. Deutscher Historischer Städteatlas. Mühlhausen/Th., 1st ed.; Digital Atlas of Mühlhausen; Ardey Verlag: Münster, Germany, 2020; p. 6. Available online: https://www.uni-muenster.de/Staedtegeschichte/portal/Stadtkarten/muehlhausen/Muehlhausen.html (accessed on 5 December 2022).
- Schwerin. Available online: https://www.uni-muenster.de/Staedtegeschichte/portal/Stadtkarten/schwerin/index.html (accessed on 5 December 2022).
- Herrnhut. Available online: https://www.uni-muenster.de/Staedtegeschichte/portal/Stadtkarten/herrnhut/Herrnhut.html (accessed on 5 December 2022).
- Quedlinburg. Available online: https://www.uni-muenster.de/Staedtegeschichte/portal/Stadtkarten/quedlinburg/index.html (accessed on 5 December 2022).
- Czaja, R.; Golba, R.; Kozieł, Z.; Pilarska, A.; Chwiałkowski, D.; Noryśkiewicz, A. Atlas Historyczny Miast Polskich. Prusy Królewskie i Warmia. Świecie, 1st ed.; Nicolaus Copernicus University Press: Toruń, Poland, 2012; Volume I/6, ISBN 978-83-231-3036-9. [Google Scholar]
- Czaja, R.; Golba, R.; Kozieł, Z.; Lewandowska, I. The Historical Atlas of Polish Towns. Royal Prussia and Ermland. Chojnice, 1st ed.; Nicolaus Copernicus University Press: Toruń, Poland, 2013; Volume I/7, ISBN 978-83-231-3298-1. [Google Scholar]
- Sieradzan, W.; Golba, R.; Kozieł, Z.; Pilarska, A. The Historical Atlas of Polish Towns. Masuria. Ostróda, 1st ed.; Nicolaus Copernicus University Press: Toruń, Poland, 2014; Volume III/2, ISBN 978-83-231-3371-1. [Google Scholar]
- Gancewski, J.; Czaja, R.; Chwiałkowski, D.; Golba, R.; Kozieł, Z.; Noryśkiewicz, A.; Pilarska, A. The Historical Atlas of Polish Towns. Masuria. Mrągowo, 1st ed.; Nicolaus Copernicus University Press: Toruń, Poland, 2016; Volume III/3, ISBN 978-83-231-3372-8. [Google Scholar]
- Okoń, E.; Czaja, R.; Golba, R.; Kozieł, Z.; Pilarska, A. The Historical Atlas of Polish Towns. Kujavia. Koronowo, 1st ed.; Nicolaus Copernicus University Press: Toruń, Poland, 2016; Volume II/2, ISBN 978-83-231-3493-0. [Google Scholar]
- Czaja, R.; Marynowska, A.; Wąsik, T.; Golba, R.; Kozieł, Z.; Pilarska, A. The Historical Atlas of Polish Towns. Kujavia. Włocławek, 1st ed.; Nicolaus Copernicus University Press: Toruń, Poland, 2016; Volume II/4, ISBN 978-83-231-3551-7. [Google Scholar]
- Okoń, E.; Golba, R.; Czaja, R.; Kozieł, Z.; Pilarska, A. The Historical Atlas of Polish Towns. Kujavia. Fordon, 2nd ed.; Nicolaus Copernicus University Press: Toruń, Poland, 2021; Volume II/3, ISBN 978-83-231-4743-5. [Google Scholar]
- Czaja, R.; Golba, R.; Kardasz, C.; Kłaczkow, J.; Kozieł, Z.; Mikulski, K.; Pilarska, A.; Zielińska, A. The Historical Atlas of Polish Towns. Royal Prussia and Ermland. Toruń, 2nd ed.; TNT: Toruń, Poland, 2019; Volume I/8, ISBN 978-83-65127-49-5. [Google Scholar]
- Mou, Z. Using cadastral maps in historical GIS research: The French Concession in Shanghai (1931–1941). Ann. GIS 2012, 18, 147–156. [Google Scholar] [CrossRef]
- Ferreira-Lopes, P.; Pinto-Puerto, F. GIS and graph models for social, temporal and spatial digital analysis in heritage: The case-study of ancient Kingdom of Seville Late Gothic production. Digit. Appl. Archaeol. Cult. Herit. 2018, 9, e00074. [Google Scholar] [CrossRef]
- Cillis, G.; Statuto, D.; Picuno, P. Historical GIS as a Tool for Monitoring, Preserving and Planning Forest Landscape: A Case Study in a Mediterranean Region. Land 2021, 10, 851. [Google Scholar] [CrossRef]
- Deka, J.R.; Bordoloi, M.K.; Sarma, P.K. Historical ponds of Darrang district: Identification and mapping, their ecological relevance for management planning. Int. J. Geoheritage Park. 2021, 9, 496–508. [Google Scholar] [CrossRef]
- Dhanaraj, K.; Angadi, D.P. A GIS based interpretation of the historical evolution of urban settlements in Mangalore City, India. Spat. Inf. Res. 2021, 29, 615–629. [Google Scholar] [CrossRef]
- Zohar, M.; Ben-Bassat, Y. Analyzing routes in Ottoman Greater Syria using historical GIS: The 1849 Saida map. Trans. GIS 2021, 25, 2612–2640. [Google Scholar] [CrossRef]
- Giordano, A.; Cole, T.; Le Noc, M. Spatial social networks for the humanities: A visualization and analytical model. Trans. GIS 2022, 26, 1683–1702. [Google Scholar] [CrossRef]
- Härkönen, A. A novel aggregation strategy for producing population density surfaces using poll tax data: The case of Vyborg in 1880. Int. J. Geogr. Inf. Sci. 2022, 36, 2427–2445. [Google Scholar] [CrossRef]
- Timár, G.; Biszak, S. Digitizing and georeferencing of the historical cadastral maps (1856–60) of Hungary. In Proceedings of the 5th International Workshop on Digital Approaches in Cartographic Heritage, Vienna, Austria, 22–24 February 2010; Livieratos, E., Gartner, G., Eds.; pp. 559–564. Available online: https://static-cdn.arcanum.com/media/mapire/pub/cadastral_timar_biszak.pdf (accessed on 5 December 2022).
- Baiocchi, V.; Lelo, K. Accuracy of 1908 high to medium scale cartography of Rome and its surroundings and related georeferencing problems. Acta Geod. Geophys. Hung. 2010, 45, 97–104. [Google Scholar] [CrossRef]
- Gullu, M.; Narin, O.G. Georeferencing of the Nile River in Piri Reis 1521 map, Using Artificial Neural Network Method. Acta Geod. Geophys. 2019, 54, 387–401. [Google Scholar] [CrossRef]
- Janata, T.; Cajthaml, J. Georeferencing of Multi-Sheet Maps Based on Least Squares with Constraints—First Military Mapping Survey Maps in the Area of Czechia. Appl. Sci. 2021, 11, 299. [Google Scholar] [CrossRef]
- Luft, J.; Schiewe, J. Automatic content-based georeferencing of historical topographic maps. Trans. GIS 2021, 25, 2888–2906. [Google Scholar] [CrossRef]
- Czaja, R. Zu editorischen Problemen der Katasterkarte im “Historischen Atlas polnischer Städte”. In Städteatlanten. Vier Jahrzehnte Atlasarbeit in Europa, 1st ed.; Ehbrecht, W., Ed.; Böhlau: Köln/Weimar, Germany; Wien, Austria, 2013; p. 143. ISBN 978-3-412-20631-4. [Google Scholar]
- Czaja, R.; Golba, R. Introduction. In The Historical Atlas of Polish Towns. Royal Prussia and Ermland. Toruń, 2nd ed.; Czaja, R., Golba, R., Kardasz, C., Kłaczkow, J., Kozieł, Z., Mikulski, K., Pilarska, A., Zielińska, A., Eds.; TNT: Toruń, Poland, 2019; Volume I/8, pp. 12–13. ISBN 978-83-65127-49-5. [Google Scholar]
- Czaja, R.; Golba, R. Städteatlanten und GIS: Die Edition der Katasterkarte der Stadt Thorn. In Die Geschichte im Bild: Editionswissenschaftliches Kolloquium 2015, 1st ed.; Flachenecker, H., Kopiński, K., Tandecki, J., Eds.; TNT: Toruń, Poland, 2016; Volume 8, pp. 57–59. ISBN 978-83-65127-09-9. [Google Scholar]
- Jagielski, A. Rysunki Geodezyjne z Elementami Topografii i Kartografii, 2nd ed.; GEODPIS: Cracow, Poland, 2017; pp. 236–237. ISBN 978-83-936926-6-8. [Google Scholar]
Figure 1.
Stages of development of the georeferential spatial database of topographic–historical objects (GSDoT-HO).
Figure 1.
Stages of development of the georeferential spatial database of topographic–historical objects (GSDoT-HO).
Figure 2.
Sample sheet of the cadastral map of Toruń at a scale of 1:250. Source: Gemarkungskarte der Stadt Thorn, Blatt 48, State Archives in Toruń.
Figure 2.
Sample sheet of the cadastral map of Toruń at a scale of 1:250. Source: Gemarkungskarte der Stadt Thorn, Blatt 48, State Archives in Toruń.
Figure 3.
Local rectangular system—Toruń Town Hall Tower (Thorn Rathausturm Knopf) with the starting point (Nullpunkt). Source: Gemarkungskarte der Stadt Thorn, Blatt 40, State Archives in Toruń.
Figure 3.
Local rectangular system—Toruń Town Hall Tower (Thorn Rathausturm Knopf) with the starting point (Nullpunkt). Source: Gemarkungskarte der Stadt Thorn, Blatt 40, State Archives in Toruń.
Figure 4.
Line crosses as reference (control) points used in the calibration and rectification process of the cadastre sheets. Source: Gemarkungskarte der Stadt Thorn, Blatt 37, State Archives in Toruń.
Figure 4.
Line crosses as reference (control) points used in the calibration and rectification process of the cadastre sheets. Source: Gemarkungskarte der Stadt Thorn, Blatt 37, State Archives in Toruń.
Figure 5.
The State Geodetic Coordinate System 2000 (PUWG PL-2000) currently applicable in Poland. Source: own work made with Natural Earth. Free vector and raster map data @ naturalearthdata.com.
Figure 5.
The State Geodetic Coordinate System 2000 (PUWG PL-2000) currently applicable in Poland. Source: own work made with Natural Earth. Free vector and raster map data @ naturalearthdata.com.
Figure 6.
A comparison of the image of a building, as seen on (A) the cadastral map, (B) Registry of lands and buildings, (C) orthophoto map and (D) on Google Street View. Source: own work based on GUGiK (Head Office of Geodesy and Cartography) data (national geoportal), Google Street View service and Gemarkungskarte der Stadt Thorn, Blatt 46, State Archives in Toruń.
Figure 7.
A fragment of the cadastral map of Toruń showing vectorised plot boundaries (red). Source: own work based on Gemarkungskarte der Stadt Thorn, Blätter 43, 44, 45, State Archives in Toruń.
Figure 7.
A fragment of the cadastral map of Toruń showing vectorised plot boundaries (red). Source: own work based on Gemarkungskarte der Stadt Thorn, Blätter 43, 44, 45, State Archives in Toruń.
Figure 8.
A fragment of the cadastral map of Toruń showing the vectorised buildings (red), the tram line (brown), and Kopernika Street with marked pavements. Source: own work based on Gemarkungskarte der Stadt Thorn, Blätter 38, 39, State Archives in Toruń.
Figure 8.
A fragment of the cadastral map of Toruń showing the vectorised buildings (red), the tram line (brown), and Kopernika Street with marked pavements. Source: own work based on Gemarkungskarte der Stadt Thorn, Blätter 38, 39, State Archives in Toruń.
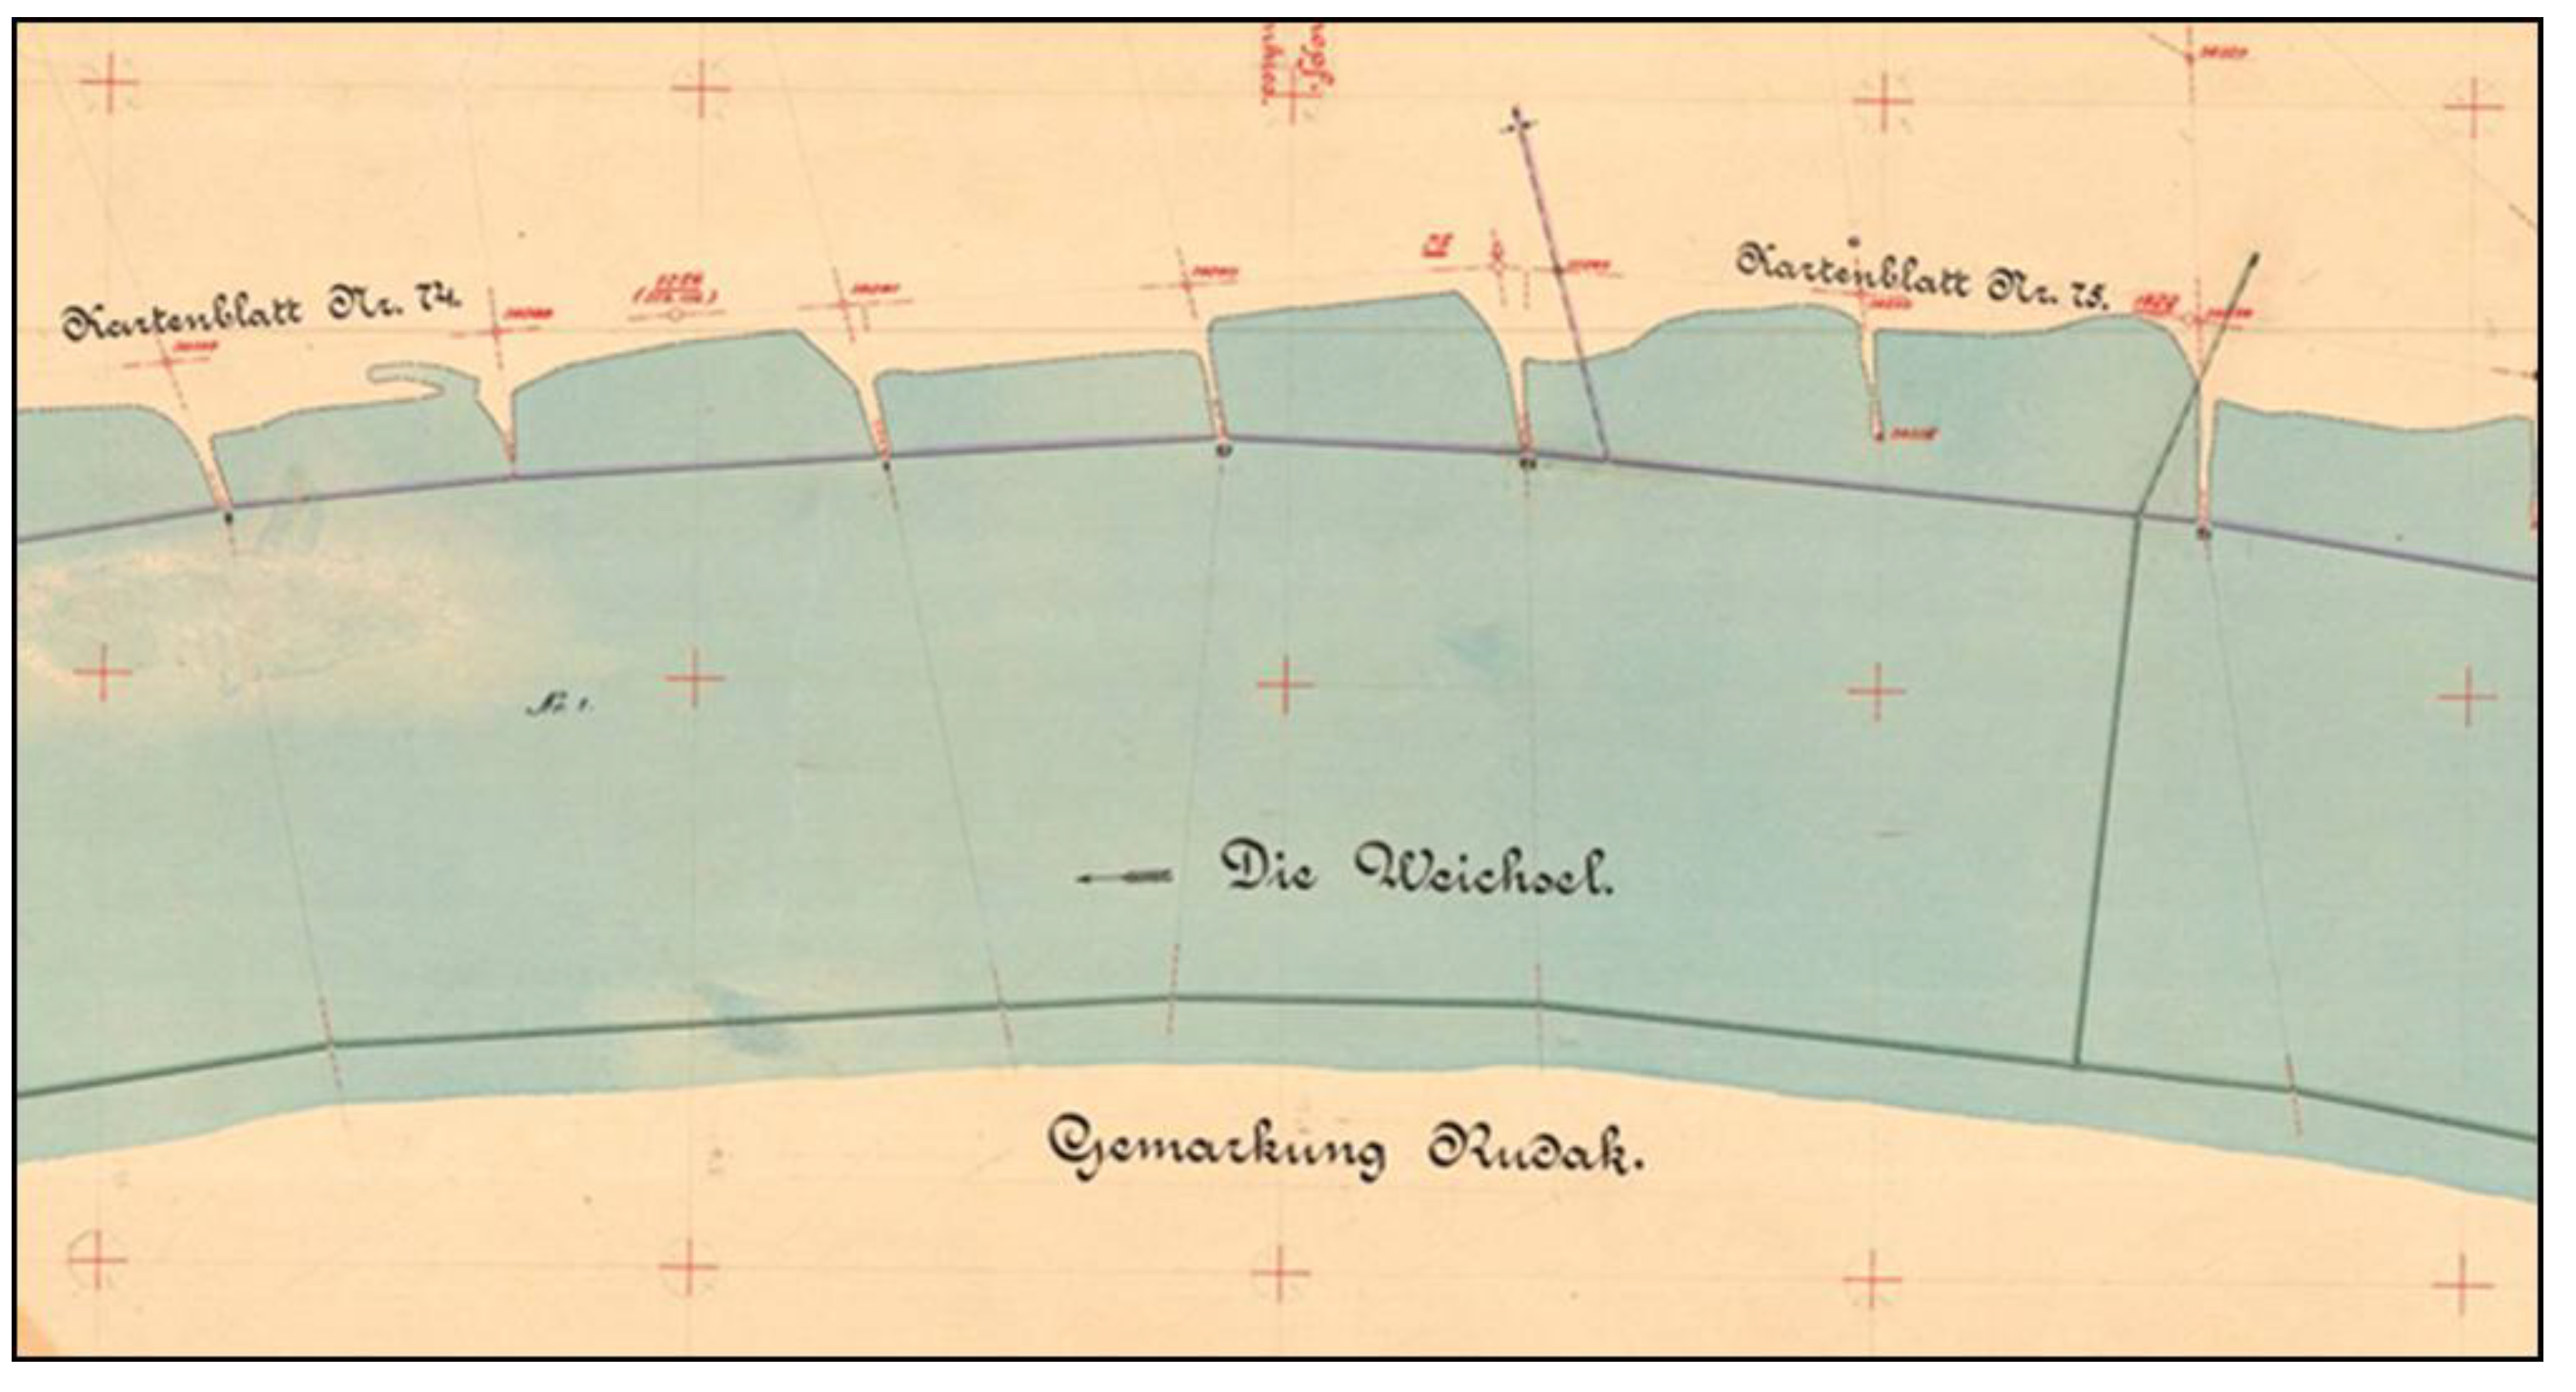
Figure 9.
A fragment of the cadastral map of Toruń showing the northern bank of the Vistula River (German: Die Weichsel). Source: Gemarkungskarte der Stadt Thorn, Blatt 154, State Archives in Toruń.
Figure 9.
A fragment of the cadastral map of Toruń showing the northern bank of the Vistula River (German: Die Weichsel). Source: Gemarkungskarte der Stadt Thorn, Blatt 154, State Archives in Toruń.
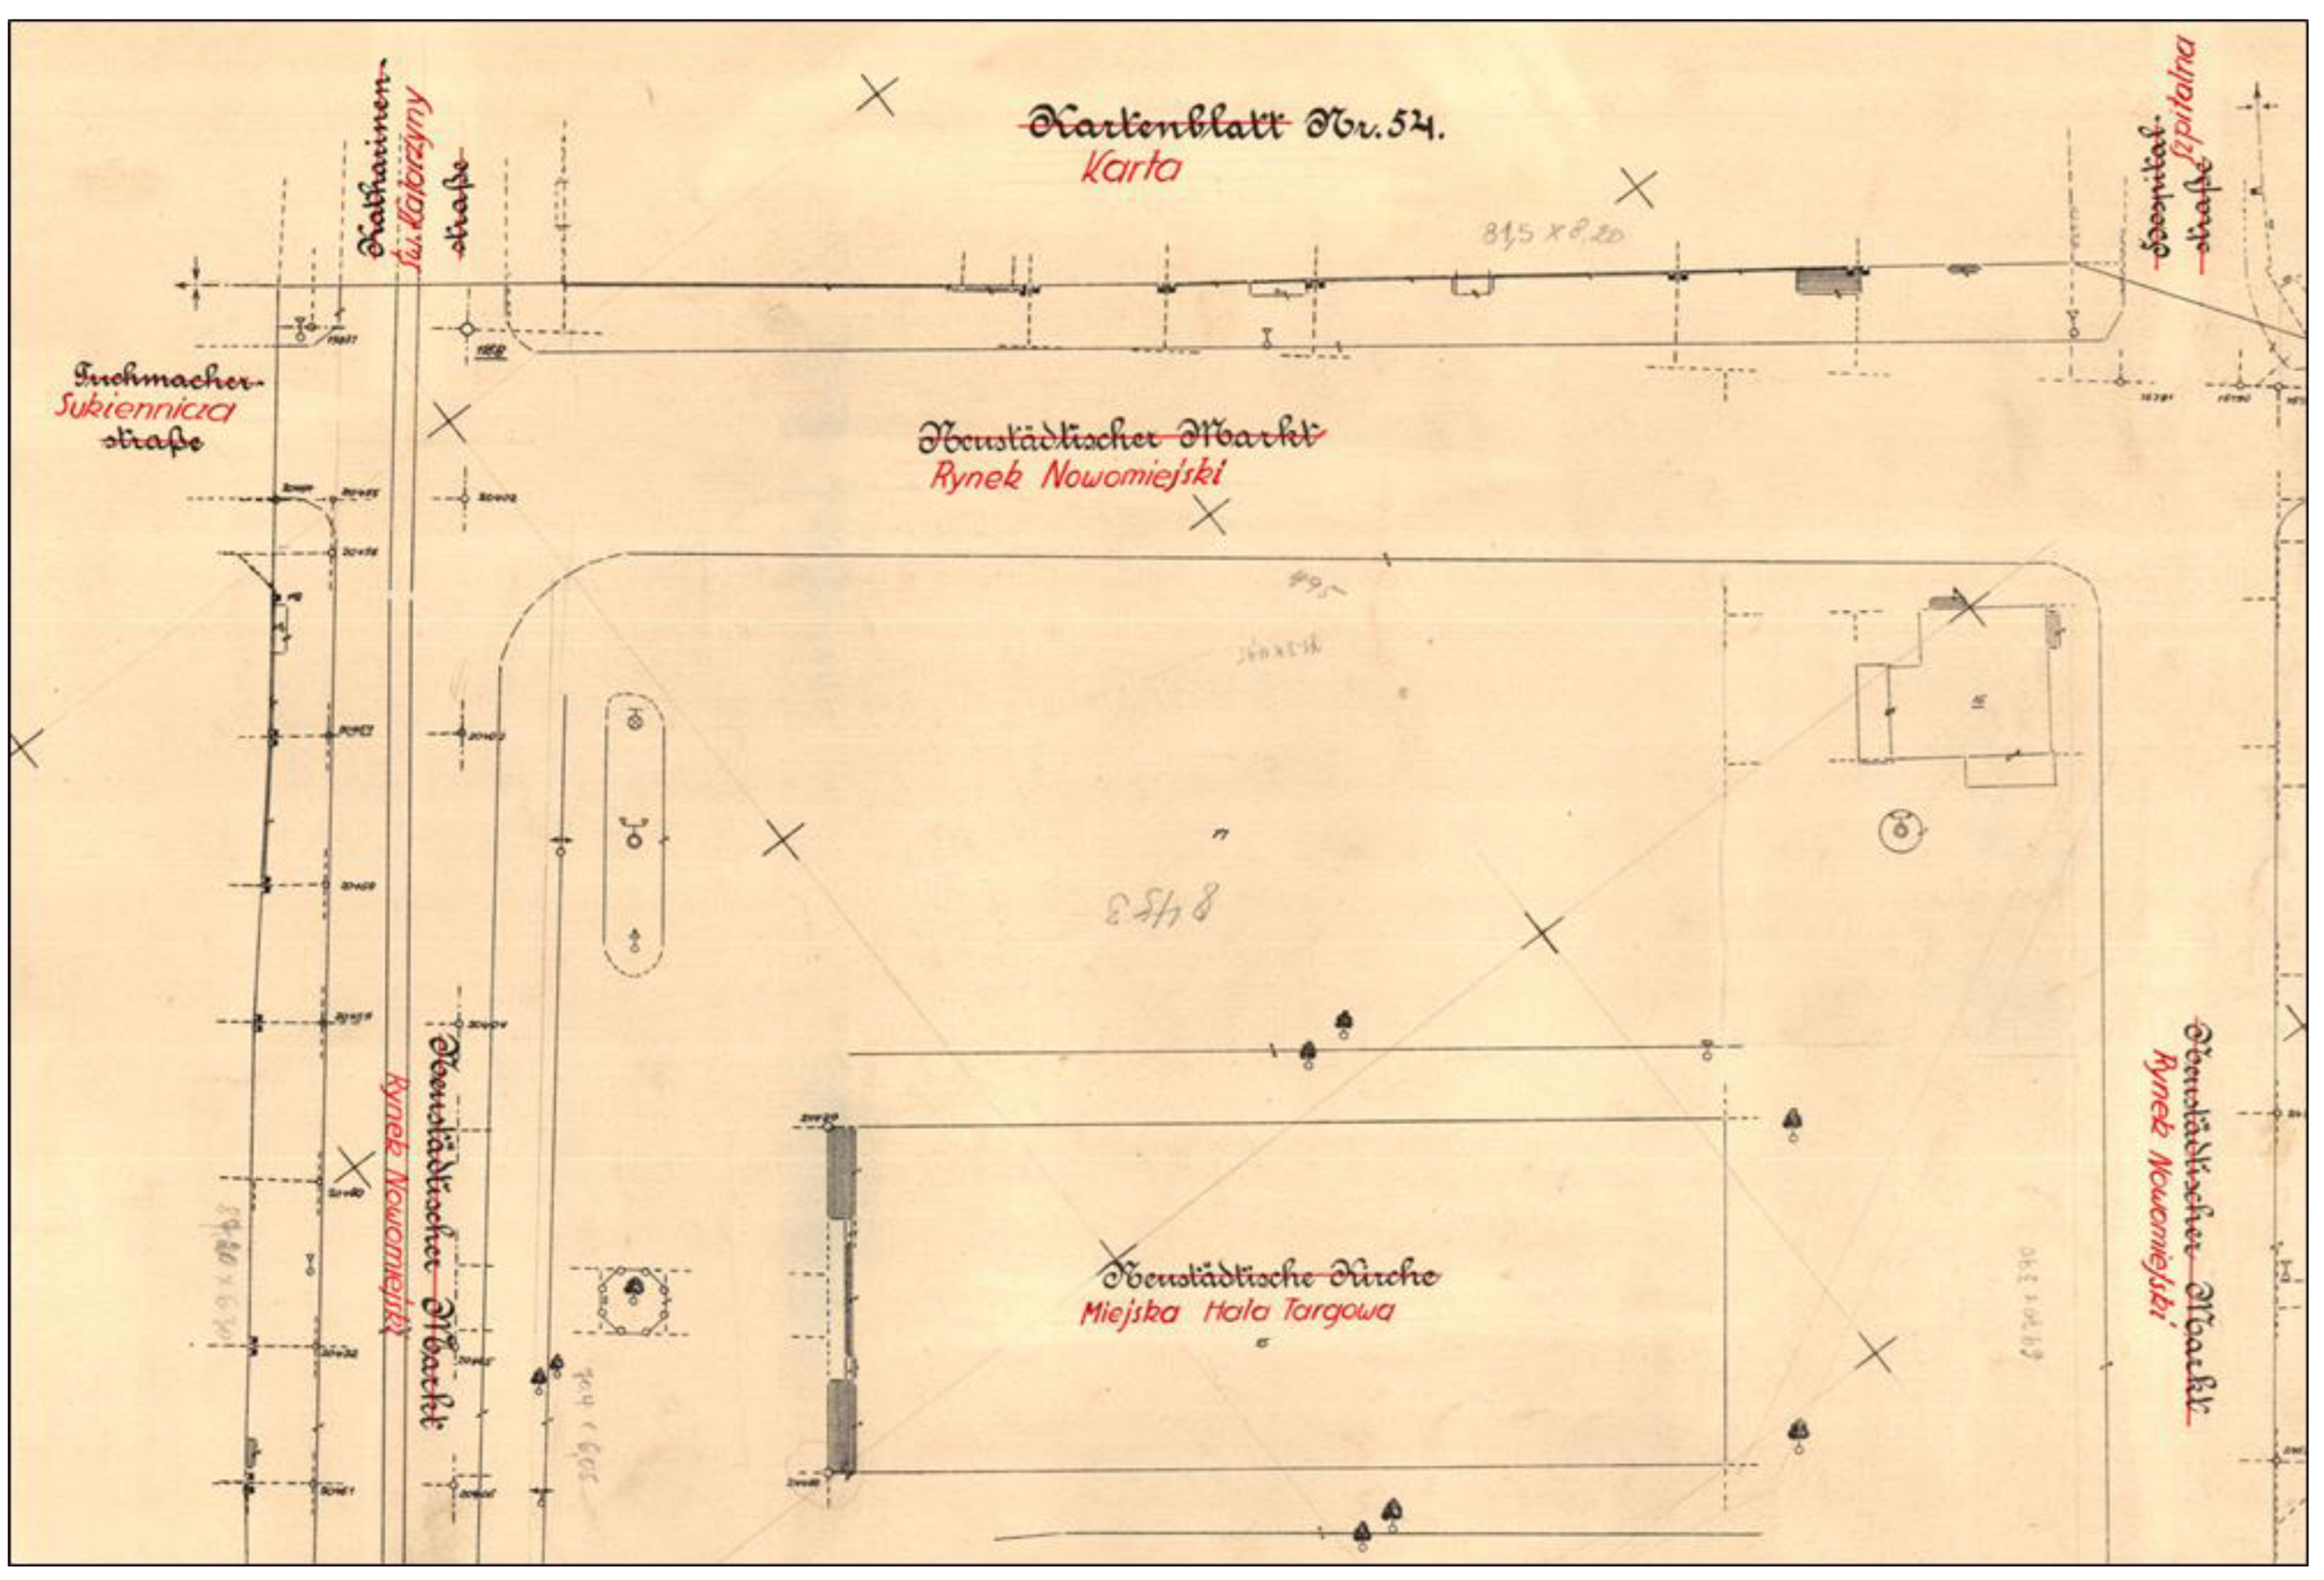
Figure 10.
A fragment of the cadastral map of Toruń showing the northern part of Nowomiejski Square and the German (black) and Polish (red) street names. Source: Gemarkungskarte der Stadt Thorn, Blatt 53, State Archives in Toruń.
Figure 10.
A fragment of the cadastral map of Toruń showing the northern part of Nowomiejski Square and the German (black) and Polish (red) street names. Source: Gemarkungskarte der Stadt Thorn, Blatt 53, State Archives in Toruń.
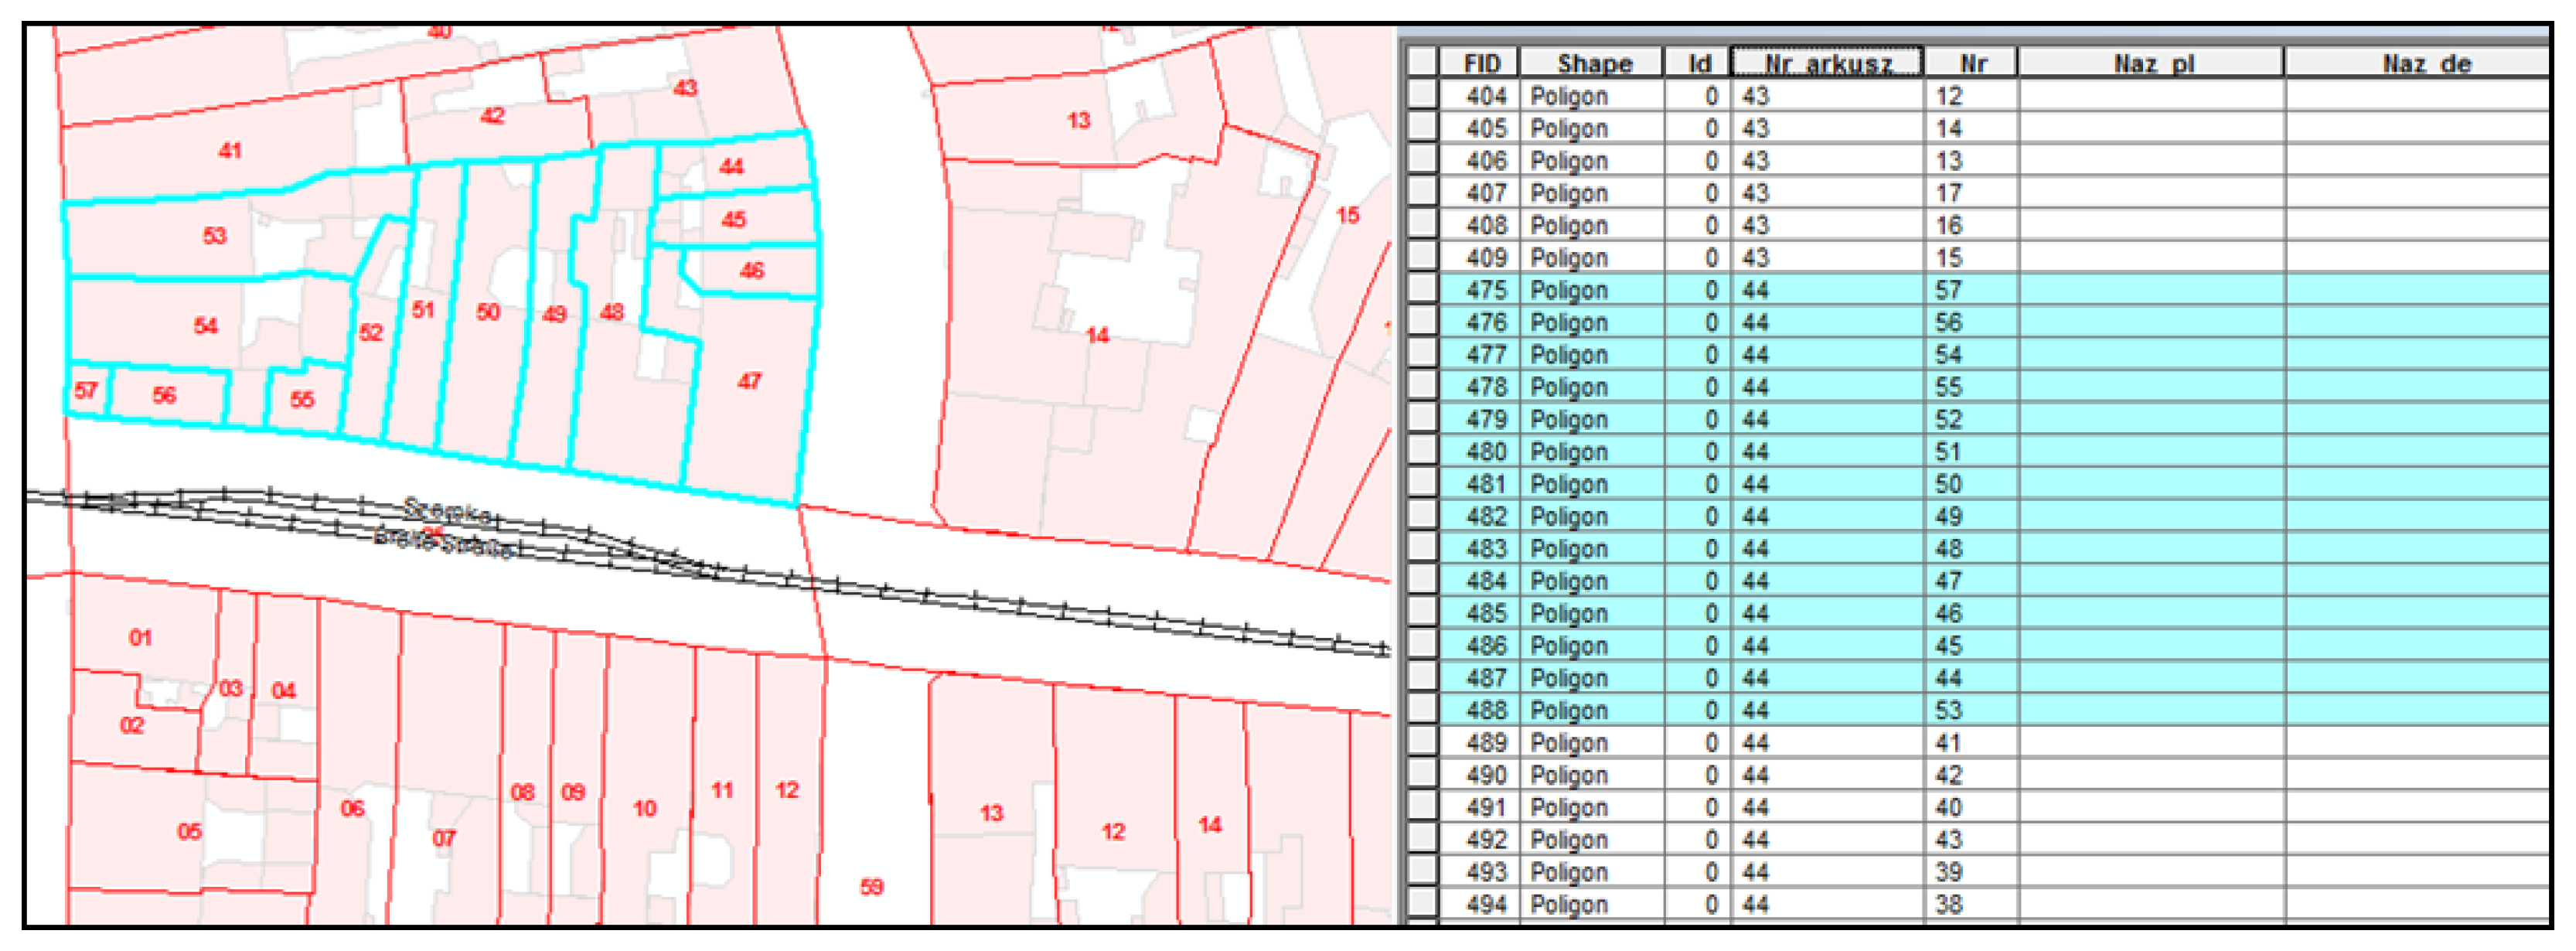
Figure 11.
Attribute table structure with highlighted rows and corresponding vector data using the example of the “plots” information layer.
Figure 11.
Attribute table structure with highlighted rows and corresponding vector data using the example of the “plots” information layer.
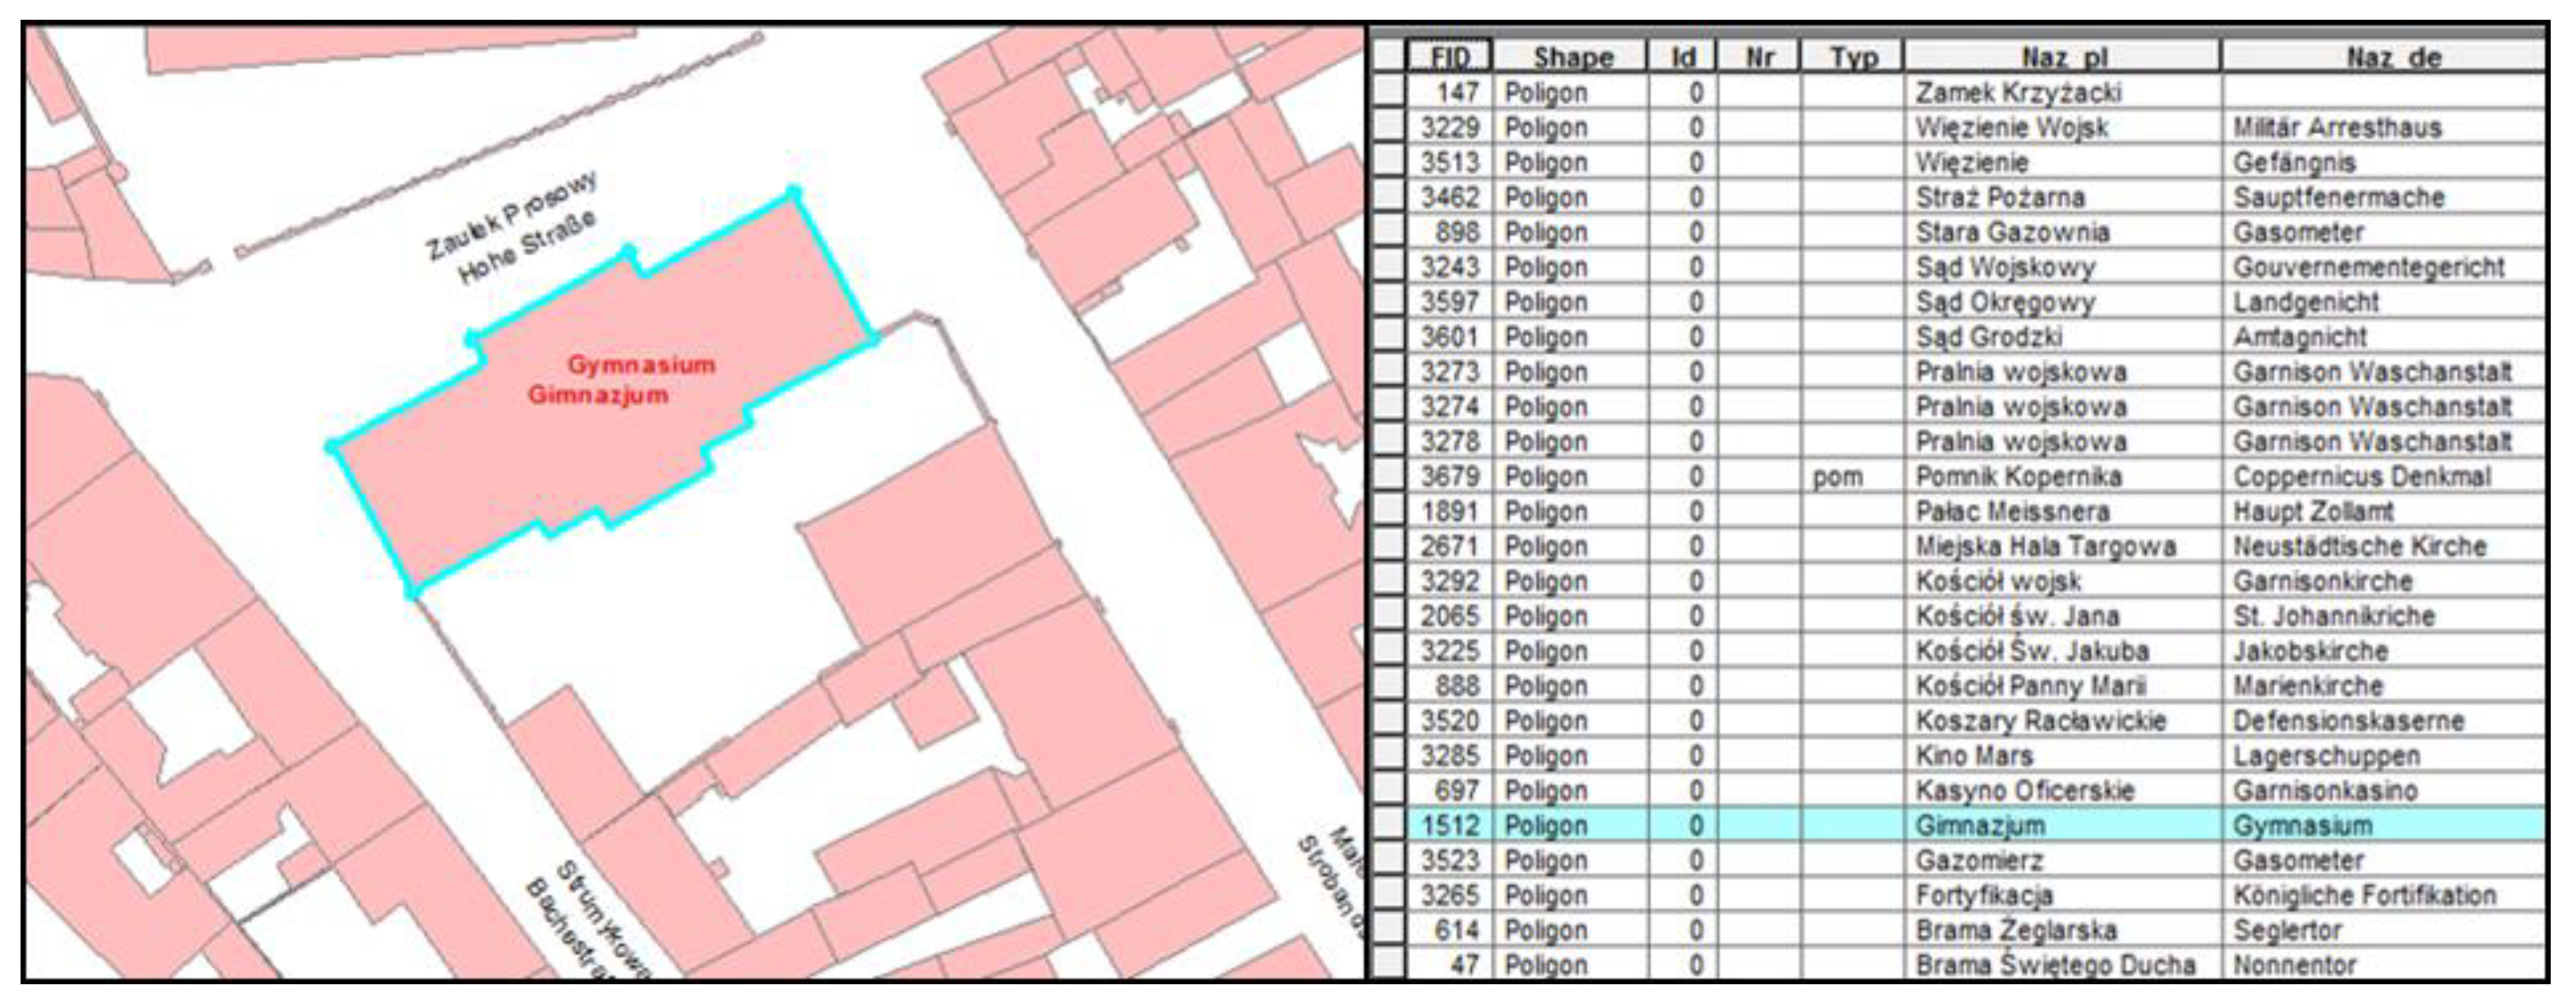
Figure 12.
The structure of the attribute table with the highlighted row and the corresponding building of the secondary school on the example of the “built-up area” information layer.
Figure 12.
The structure of the attribute table with the highlighted row and the corresponding building of the secondary school on the example of the “built-up area” information layer.
Table 1.
An example of the structure and information scope for the “plots” layer.
Table 1.
An example of the structure and information scope for the “plots” layer.
| Column Heading | Sheet_No | No | Pl_Name | Ger_Name |
|---|
| Heading description | Sheet number | Plot number | Polish name | German name |
Type of field
(number of characters) | Numeric (3) | Textual (10) | Textual (30) | Textual (30) |
| Completion | complete with
the specific number
of the sheet | complete with
a specific number or fraction of number (using
a slash) | fill in the name
if it is on the cadastral map | fill in the name
if it is on the cadastral map |
Table 2.
An example of the structure and scope of information for the “build-up area” layer including coding.
Table 2.
An example of the structure and scope of information for the “build-up area” layer including coding.
| Column Heading | No | Type | Pl_Name | Ger_Name |
|---|
| Heading description | Number of object (building) | Type of object | Polish name
of a building/building’s
function | German name
of a building/building’s
function |
Type of field
(number of characters) | Numeric (10) | Textual (5) | Textual (30) | Textual (30) |
| Completion | complete with
a specific number if given to
a building (not to be confused with the plot number) | each object
is described
by code * | fill in the name
if it is on the cadastral map | fill in the name
if it is on the cadastral map |
Table 3.
An example of the structure and information scope for the “waters” layer including coding.
Table 3.
An example of the structure and information scope for the “waters” layer including coding.
| Column Heading | Type | Pl_Name | Ger_Name |
|---|
| Heading description | Type of object | Polish name | German name |
Type of field
(number of characters) | Textual (5) | Textual (30) | Textual (30) |
| Completion | each object
is described
by code * | fill in the name
if it is on the
cadastral map | fill in the name
if it is on the
cadastral map |
| Disclaimer/Publisher’s Note: The statements, opinions and data contained in all publications are solely those of the individual author(s) and contributor(s) and not of MDPI and/or the editor(s). MDPI and/or the editor(s) disclaim responsibility for any injury to people or property resulting from any ideas, methods, instructions or products referred to in the content. |
© 2023 by the authors. Licensee MDPI, Basel, Switzerland. This article is an open access article distributed under the terms and conditions of the Creative Commons Attribution (CC BY) license (https://creativecommons.org/licenses/by/4.0/).


