1. Introduction
The emergence and rapid spread of coronavirus disease 2019 (COVID-19) seriously affected not only individuals’ daily lives, work, and social interactions, but also the global economy [
1], politics [
2], and the environment [
3]. Human activities are an important driving factor in the spread of the virus because the virus can be easily transmitted from person to person. Different measures were taken to control the spread of the virus, for example, individuals took self-protection actions by reducing their travels and maintaining social distance and self-isolation, and governments enacted lockdown policies and travel restrictions. All of these measures inevitably affect people’s mobility.
People’s travel activities constitute an important part of the mobility flow in the city. Bike riding is promoted as a low-carbon, environmentally friendly, and healthy travel mode [
4]. As a result, more and more people choose to ride for both commuting and leisure activities. In the era of sharing economy, bike-sharing became a convenient transport means in cities [
5]. Many electric-based bike-sharing systems appeared and were promoted, further promoting environmental protection and convenient transportation [
6]. With the development of information communication technologies, bike-sharing data are increasingly collected, often with spatial and temporal properties reflecting the usage of bikes. This rich amount of data provides a new perspective for studying urban human mobility and received considerable attention in recent years [
7,
8]. In this context, employing bike-sharing data to explore human mobility and spatial interactions in cities is beneficial for understanding the urban dynamics during the pandemic [
9,
10]. Many researchers explored the impact of the COVID-19 pandemic on bike-sharing in different places worldwide, such as in North America [
11], Asia [
12,
13], and Europe [
14].
Bike-sharing riding data are a typical kind of origin-destination (OD) data that represent movement through geographic space from starting locations to ending locations. OD data clustering is an effective way to discover spatial distribution patterns [
15,
16] and to extract the main features and structure flow data [
17]. People’s activities in the city are not evenly distributed in time and space due to reasons such as the differences in spatial planning, such as functional zoning and land use types, as well as different human daily routines, such as varying commuting and leisure time. This also leads to imbalance problems in bike-sharing systems, such as the shortage of bikes at the borrowing stations and the shortage of docks at the returning stations, which need bike rebalancing management [
18,
19]. The exploration of the spatiotemporal patterns of bike riding flows and their influence on bike management during the pandemic will facilitate a deeper understanding of the influence of the pandemic on human behavior, and provide support for travel planning, bike-sharing operations, and urban management. However, research on this aspect at present is still insufficient. Based on the comparative analysis of the bike-sharing data between the pre-pandemic period and the pandemic period, this study attempts to answer the following questions:
- (1)
Which changes took place in the spatiotemporal patterns of main riding flows of bike-sharing during the pandemic?
- (2)
How do these changes in the main riding flows influence the bike rebalancing management?
To answer the above questions, this paper proposes a framework combining methods of geospatial network analysis, OD clustering, and rebalancing data analysis. Network analysis is carried out by selecting flow and aggregation-related indicators to help understand the overall situation of the bike-sharing network. Based on the constructed network, different forms of large flow edges are analyzed. In particular, OD clustering is carried out on network edges combined with multiple constraints, such as edge flow, edge amount, distance, and angle, which aims to extract large flow edge groups and analyze their spatiotemporal distribution characteristics. In addition, the rebalancing data are extracted by continuity detection and analyzed together with riding data. We demonstrate the effectiveness of our framework using test data collected from Citi Bike in New York City. We carry out a comparative analysis of the main riding flow characteristics of bike-sharing between the pre-pandemic period and the pandemic period. Furthermore, we extract and analyze the rebalancing data to investigate the impact of the pandemic on bike dispatch management. Different from previous studies, we analyzed both riding data and rebalancing data and explored the relationship between them. This more comprehensive perspective helps provide references for different stakeholders, such as citizens, governments, and bike-sharing companies. The remainder of this paper is organized as follows:
Section 2 reports related research works.
Section 3 presents the study area and data.
Section 4 details the main methods adopted in this study. Experiment and analysis based on Citi Bike data are introduced in
Section 5.
Section 6 analyzes and discusses the results, limitations, and future works.
Section 7 concludes this study.
2. Related Work
During a pandemic, emergency policies and citizen self-protection measures typically have a negative impact on mobility. The research on human mobility patterns and pandemic prediction based on movement data received a lot of attention in the context of COVID-19 [
20,
21]. Researchers collect movement data and study mobility patterns during the COVID-19 pandemic in a variety of ways. For instance, the traditional approach is to conduct questionnaires. König and Dreßler used telephone interviews, household surveys, and other mixed methods to study the impact of pandemics on rural mobility [
22]. In addition, in combination with geographic information system (GIS) technology, a map-based online survey was applied to study the impact of the pandemic on mobility [
23]. Traditional spatial data, such as remote sensing images, also play an important role in the study of mobility during the pandemic [
24,
25]. Various location-based multi-source data provide rich information for pandemic research [
26,
27].
Bike-sharing data are a typical kind of location-related data, which can be used to study human mobility during the pandemic [
11,
28,
29]. Bike-sharing systems existed for nearly 50 years. In the past 10 years, their popularity increased dramatically worldwide [
30]. Shared bikes are usually equipped with technologies such as Global Positioning System (GPS) to facilitate the system to locate their parking places [
31]. Therefore, bike-sharing systems accumulate a large amount of riding data that can objectively reflect urban riding during the pandemic.
Many studies confirmed that the spread of COVID-19 and lockdown policies reduced the use of bike-sharing. For instance, the mobility of shared bikes in Beijing during the pandemic dropped by 60% compared with the same period in 2019 [
32]. Hu et al. studied the data of bike-sharing in Chicago and found the proportion of commuting trips was significantly lower [
9].
Researchers also found that bike-sharing riding patterns showed some new characteristics during the pandemic period. Xin et al. used a multi-scale spatial complex network to study Citi Bike data in New York and found that the aggregation of bike-sharing riding in cities decreased significantly during the pandemic period [
11]. Combined with descriptive statistics methods, Teixeira and Lopes found that bike-sharing systems are resilient during a pandemic and there is a possible mode transfer of people’s travel from public transportation, such as subways, to bike-sharing systems [
33]. The study of the mobility of public transportation during the pandemic indicates that bikes have the smallest decline in the demand for public transportation in Budapest [
34]. Compared with other public transportation modes, bikes are not enclosed and can avoid close contact between users, therefore, people are relatively more willing to use bikes during the pandemic [
14]. Padmanabhan et al. conducted correlation analysis on COVID-19 cases and various bike-sharing-related variables with data from three cities and found that although bike trips decreased, the average travel time increased [
35]. In addition, for safety and health reasons, biking gained new attention and became a popular leisure sport during the pandemic [
36]. Based on their research findings, Jobe and Griffin called for continued bike-sharing services during the pandemic and suggested that bike-sharing operators should expand communication efforts about policies and actions to support community health [
37]. Büchel et al. provided recommendations to utilize the window of opportunity for policy measures to permanently increase bike usage in response to the COVID-19 pandemic [
38]. In order to facilitate citizens’ healthy travel during the pandemic period, the number of bikes in European cities increased in a short term by adding temporary bike infrastructure [
39].
In addition to riding, the operation of bike-sharing companies during the pandemic also deserves attention. The most typical operation is bike rebalance, which moves bikes from the stations with too many bikes to stations with too few bikes so that all stations will have enough bikes for pickup and enough docks for drop-off [
18]. In terms of operation type, rebalance can be divided into static rebalance and dynamic rebalance. Static rebalance is usually carried out at night when the riding demand is low or the system is closed. Wang and Szeto used a mixed integer linear program model to rebalance both good and broken bikes in a bike-sharing network with the minimum total CO
2 emissions [
40]. A different number of transfer vehicles are involved in the rebalancing operation. Cruz et al. proposed a hybrid iterated local search algorithm that was specially designed to solve a single-vehicle static bike rebalancing problem [
41]. Ho and Szeto proposed a hybrid large neighborhood search for solving the multi-vehicle rebalance problem [
42]. Dynamic rebalance is mainly carried out during the daytime and takes real-time bike usage into account. Compared with static rebalance, dynamic rebalance considers more complex factors. For dock-based bike-sharing, Ghosh et al. proposed an optimization formulation to support bike repositioning and vehicle routing considering the routes for vehicles and the future expected demand of the system [
43]. For dockless bike-sharing, Caggiani et al. combined spatiotemporal clusterization and nonlinear autoregressive neural networks to construct a decision support system to promote rebalance operation [
44]. However, all the above studies focus on the design of the rebalance scheme. Because the rebalancing data are not generally disclosed, there are few studies on the analysis of the rebalancing data, especially on the impact of the pandemic on the rebalancing operation.
In summary, most previous studies focus on exploring riding behavior patterns and designing rebalance schemes. There is a lack of attention to the analysis of the rebalancing data. The impact of the pandemic on bike riding together with bike rebalance is not fully studied. Furthermore, the combination of different methods is limited, which affects the comprehensive analysis and representation of the results. In this study, we propose a framework consisting of geospatial network analysis and origin-destination clustering for the exploration of bike-sharing riding behaviors and the rebalancing patterns.
3. Study Area and Data
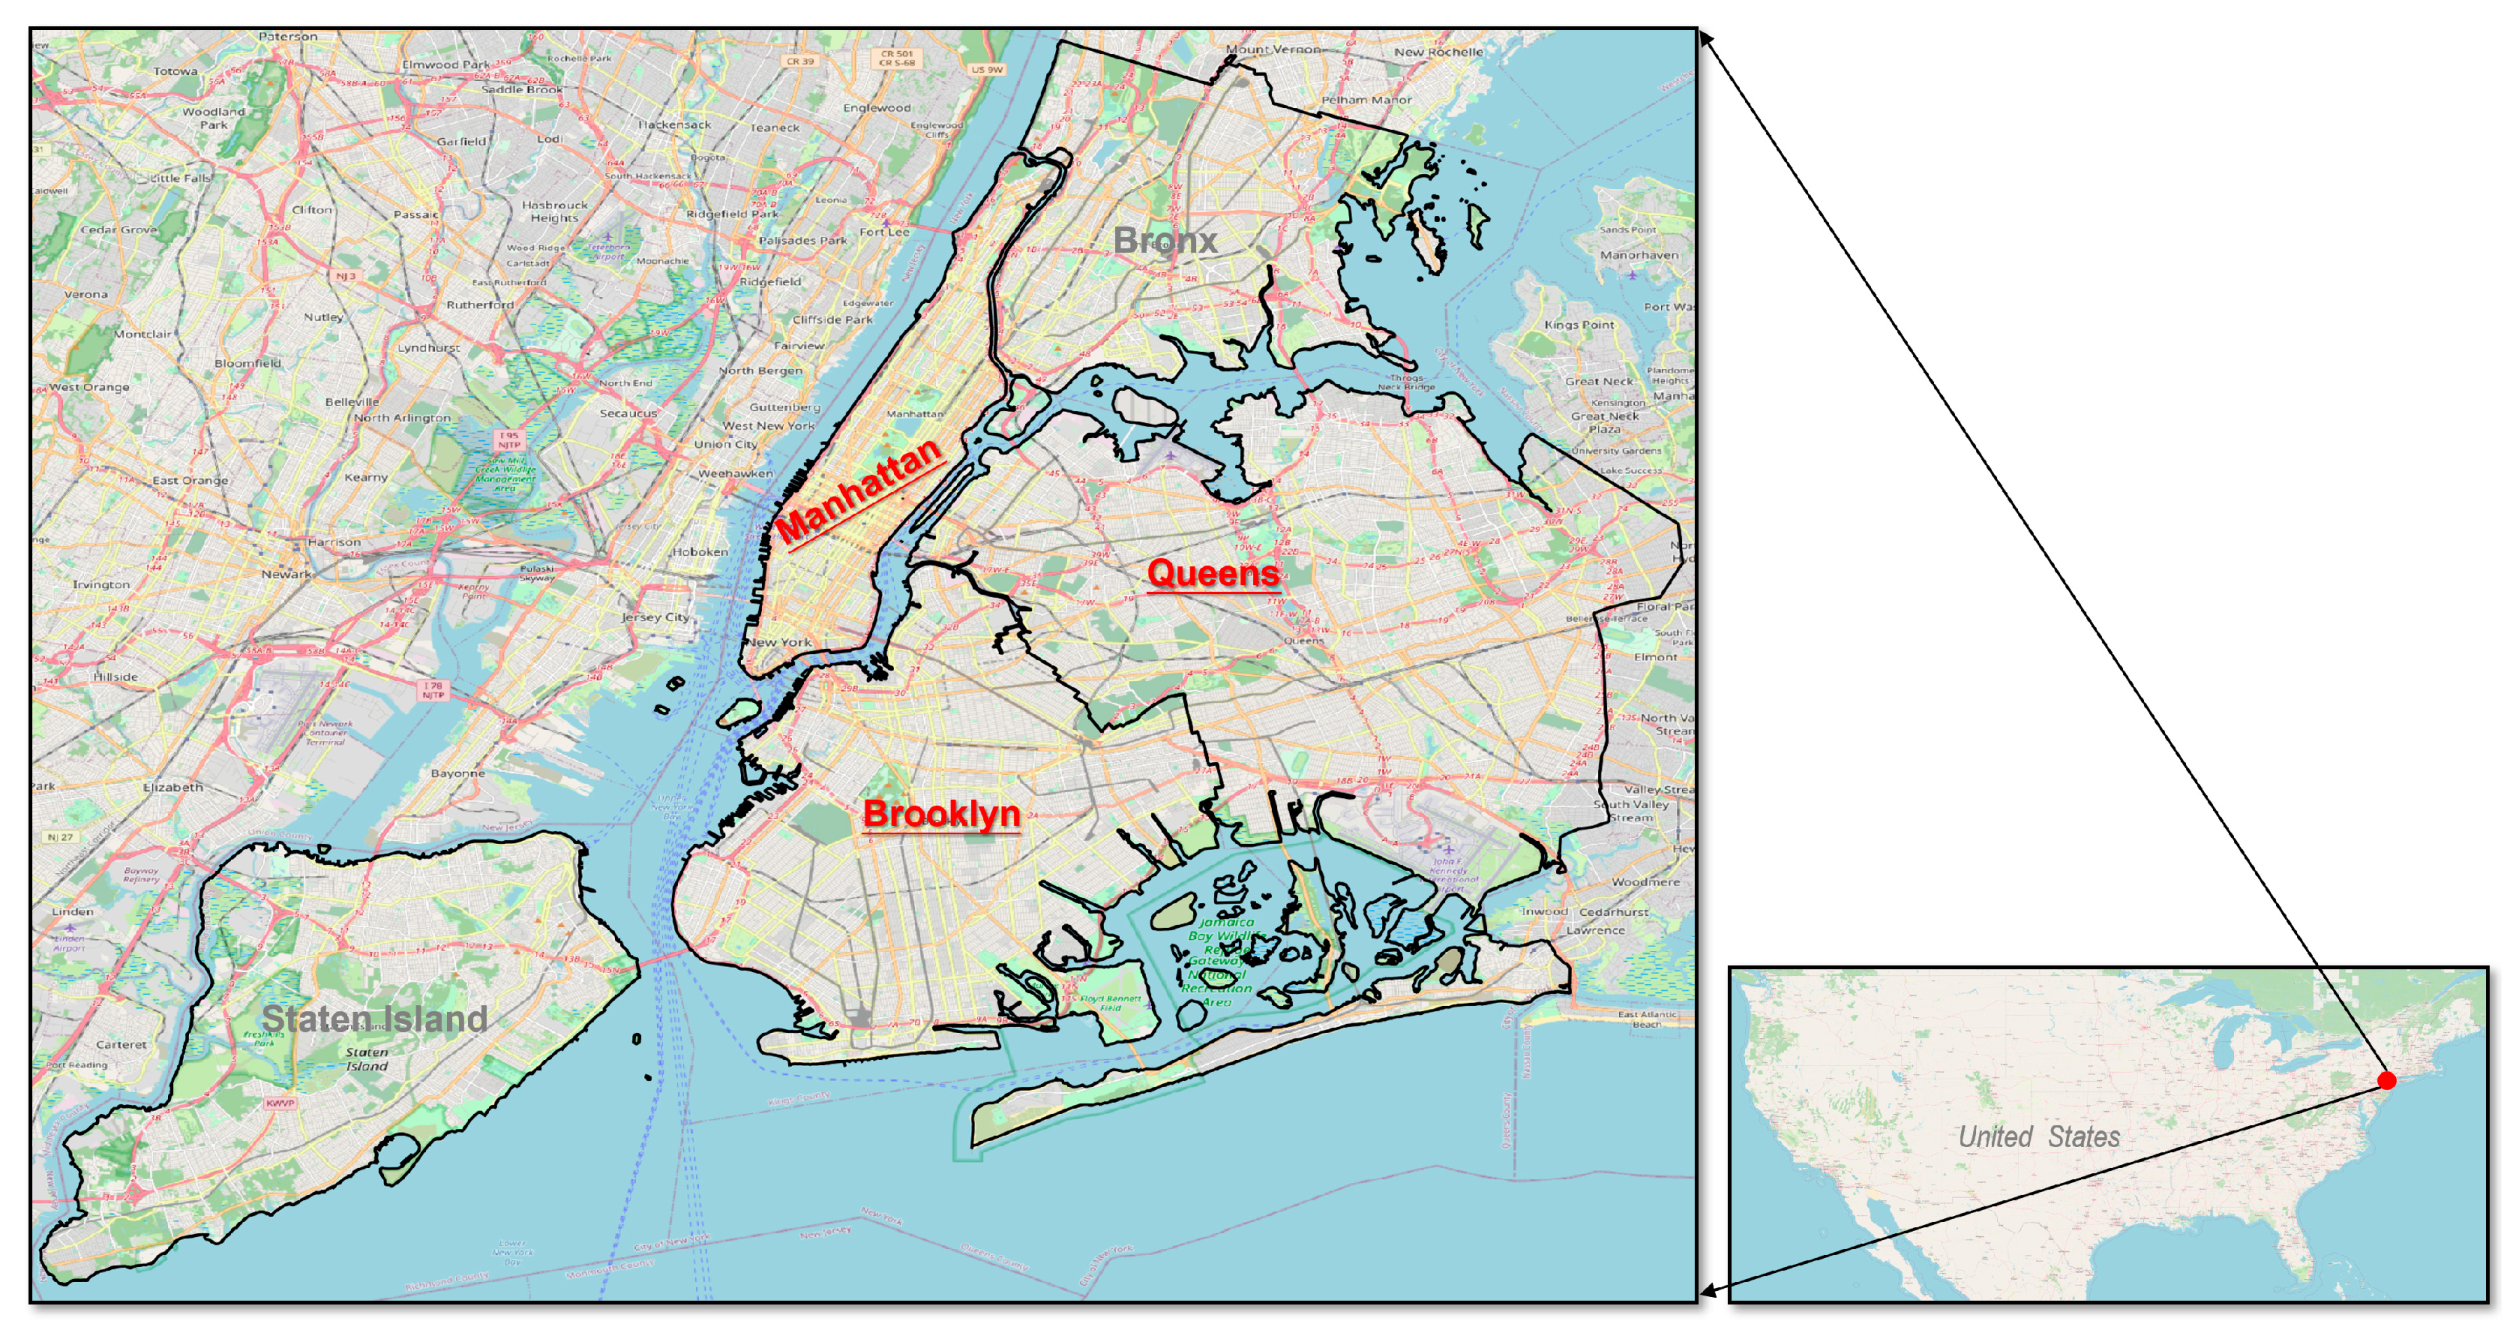
The study area of New York City in this paper is shown in
Figure 1. New York City is located on the Atlantic coast of the United States. It has five districts, including Manhattan, Queens, Brooklyn, Bronx, and Staten Island, with a total area of 1214.4 square kilometers. The population of New York City is more than 8 million, making it the largest and most populous city in the United States. This world-class city directly affects the global economy, finance, and politics. The headquarters of many international organizations, multinational companies, and banks in the world, including the United Nations headquarters, are located in New York.
New York was seriously impacted during the pandemic. On 1 March 2020, New York State announced the first confirmed case of COVID-19. On 7 March, it declared a statewide emergency. On 19 March, it issued an order of “Stay at Home”, stipulating that people should not go out as far as possible except for purchasing necessary supplies, seeking medical treatment, and doing necessary work.
The data in this study are collected from Citi Bike (
https://www.citibikenyc.com/ (accessed on 6 January 2023)), a New York City public bike system, which was officially put into operation on 27 May 2013, and is the largest public bike system in the United States. It is open for use 24 h/day, 7 days/week, 365 days/year. Citi Bike is a bike-sharing system with docks. Users pick up their bikes from the start station and return them to the end station after riding. In the initial stage (2013), 6000 bikes at hundreds of stations were put into operation throughout Manhattan and Brooklyn. It announced that would double the size of the network from 6000 to 12,000 bikes just one year later. In 2016, Citi Bike gained its 100,000th annual membership. At present, Citi Bike riders take more than 100 million trips, and the main distribution of Citi Bike stations covers Manhattan, Brooklyn, and Queens, which also constitutes the study area of this study. Citi Bike releases its riding data in CSV format by month, which can be traced back to July 2013. Riding data are typical OD data, which records the spatial coordinates and attributes of the start station and the end station. At the same time, the riding information is also recorded. The attribute information and sample attribute values of the data are shown in
Table 1.
4. Methodology
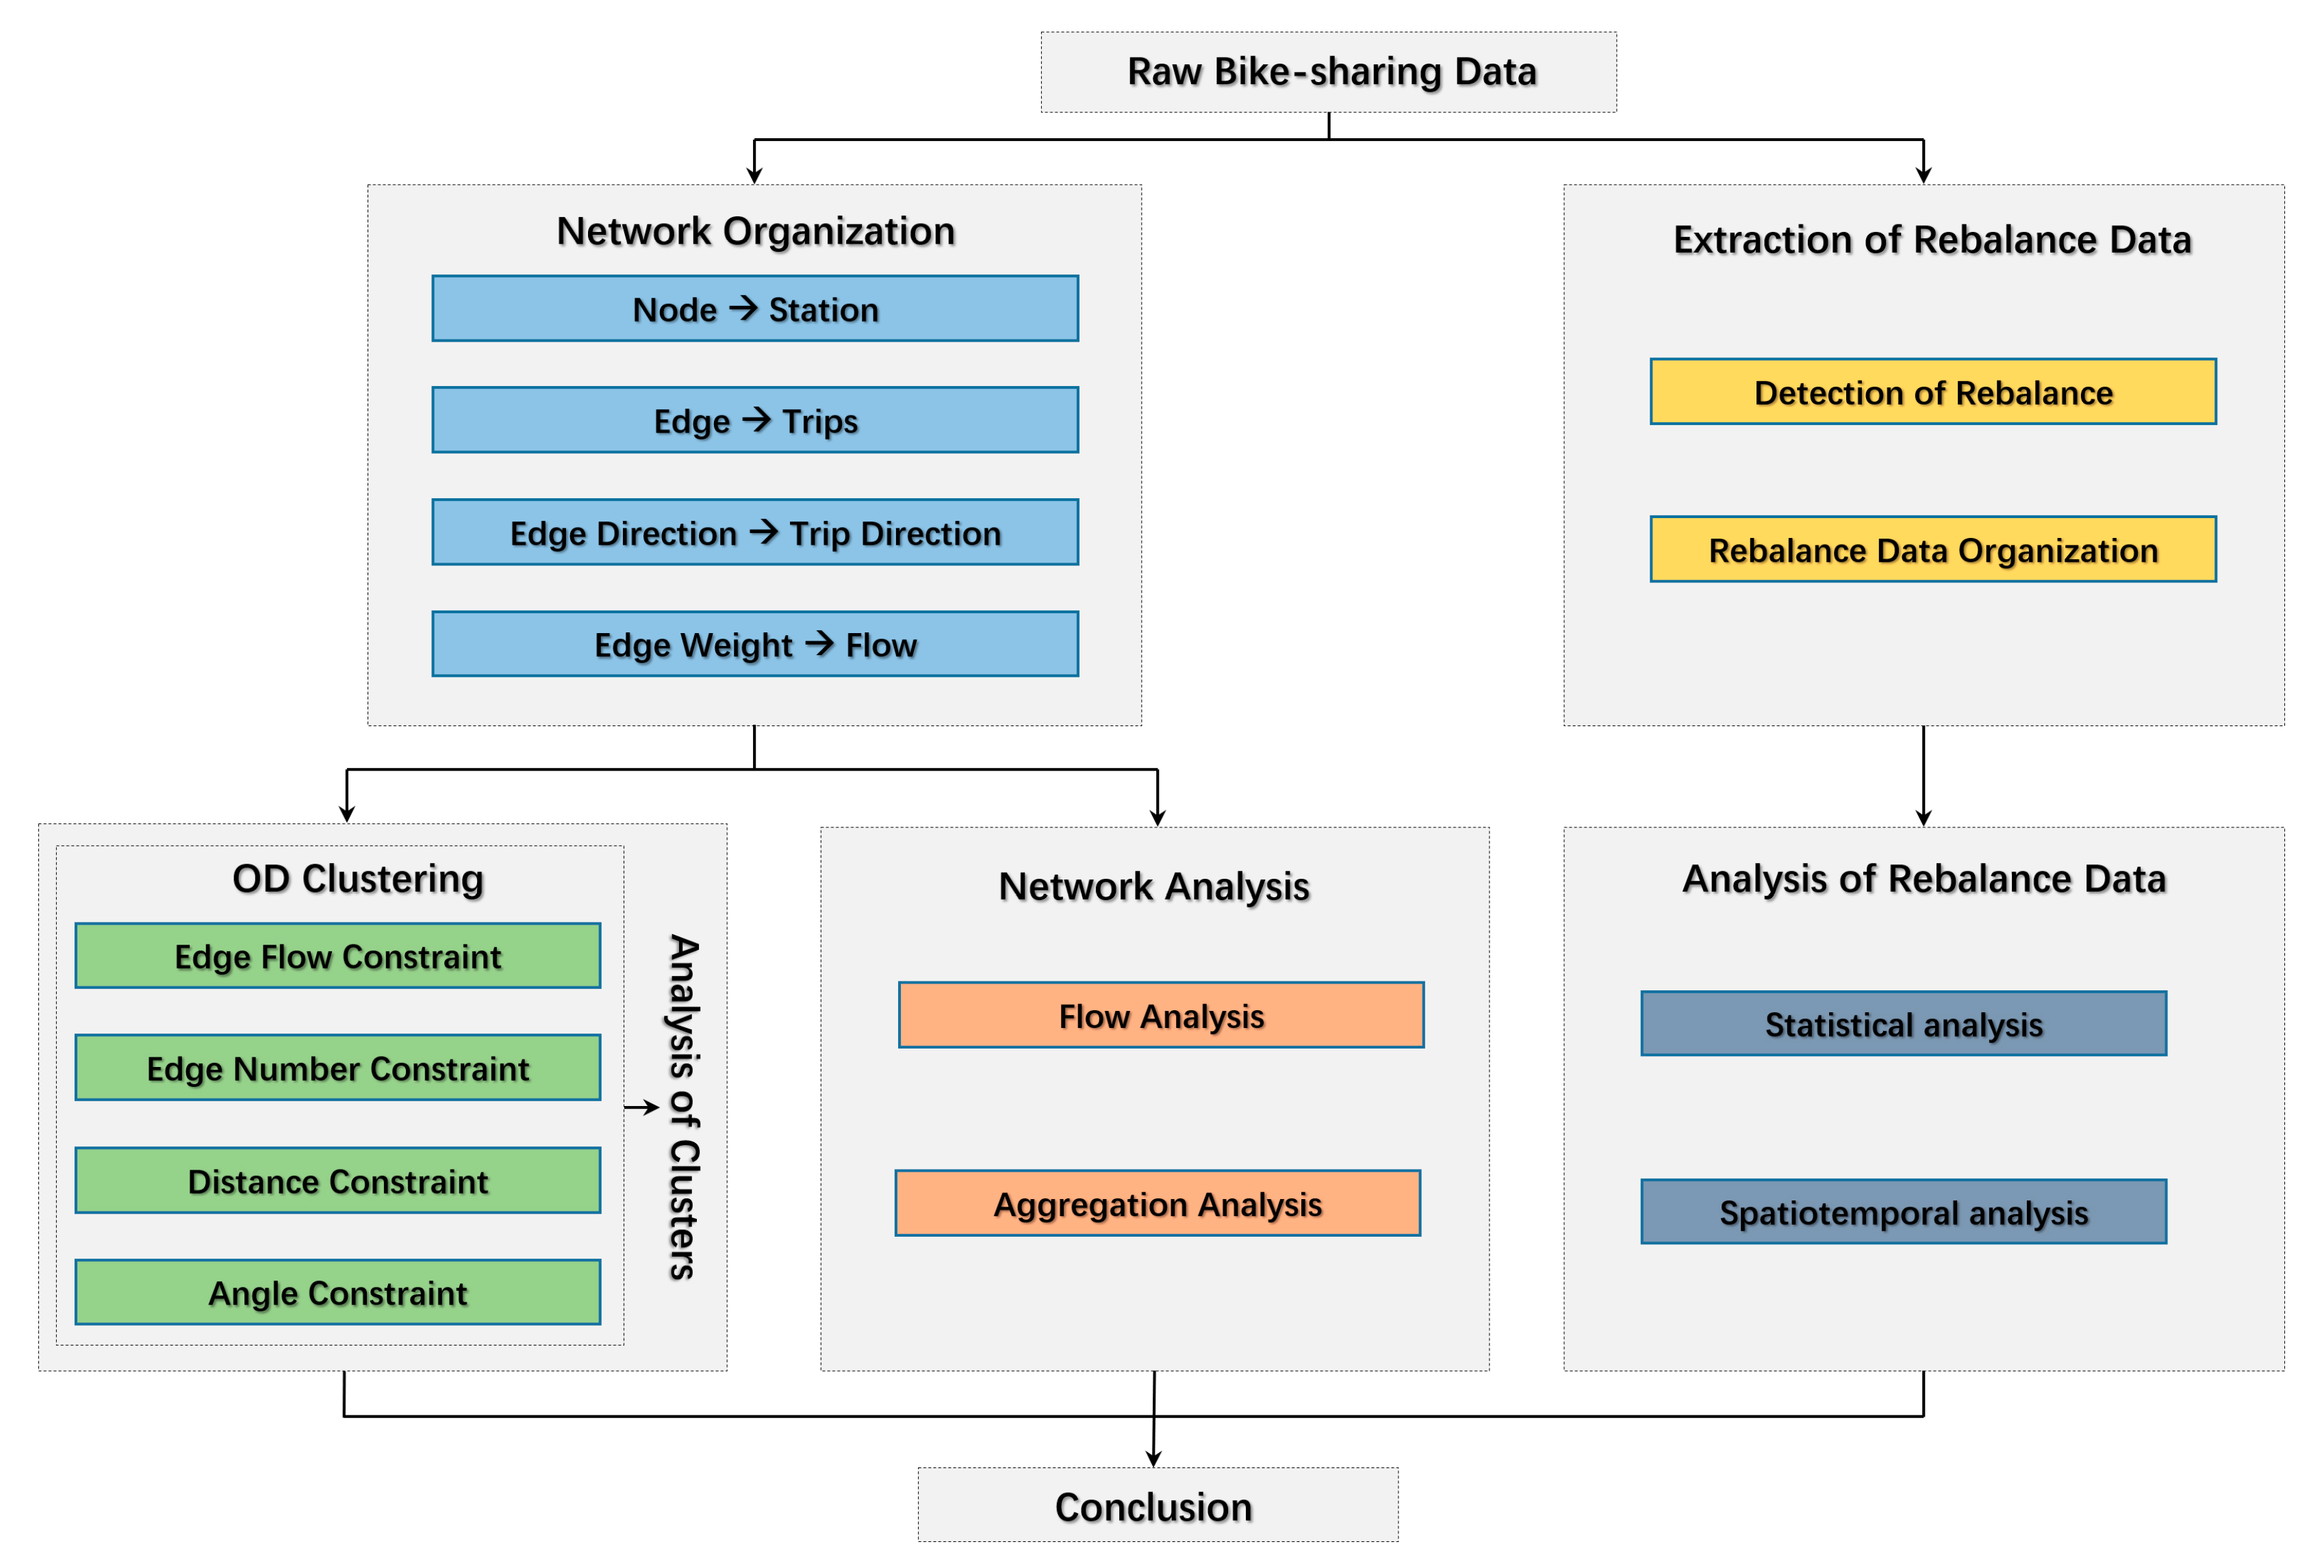
Our method framework is shown in
Figure 2. For the trip data, we first organize it into a network form with nodes representing bike-sharing stations and edges representing riding trips. Other ride statistics are also mapped to network attribute values. Based on the above network, the overall network analysis and the OD cluster analysis are carried out. For the bike rebalancing data, we extract it through detection and organization to obtain the result in the form of OD data. Then statistical analysis and spatiotemporal analysis are carried out on the above rebalancing data.
4.1. Network Organization and Analysis of Bike-Sharing Data
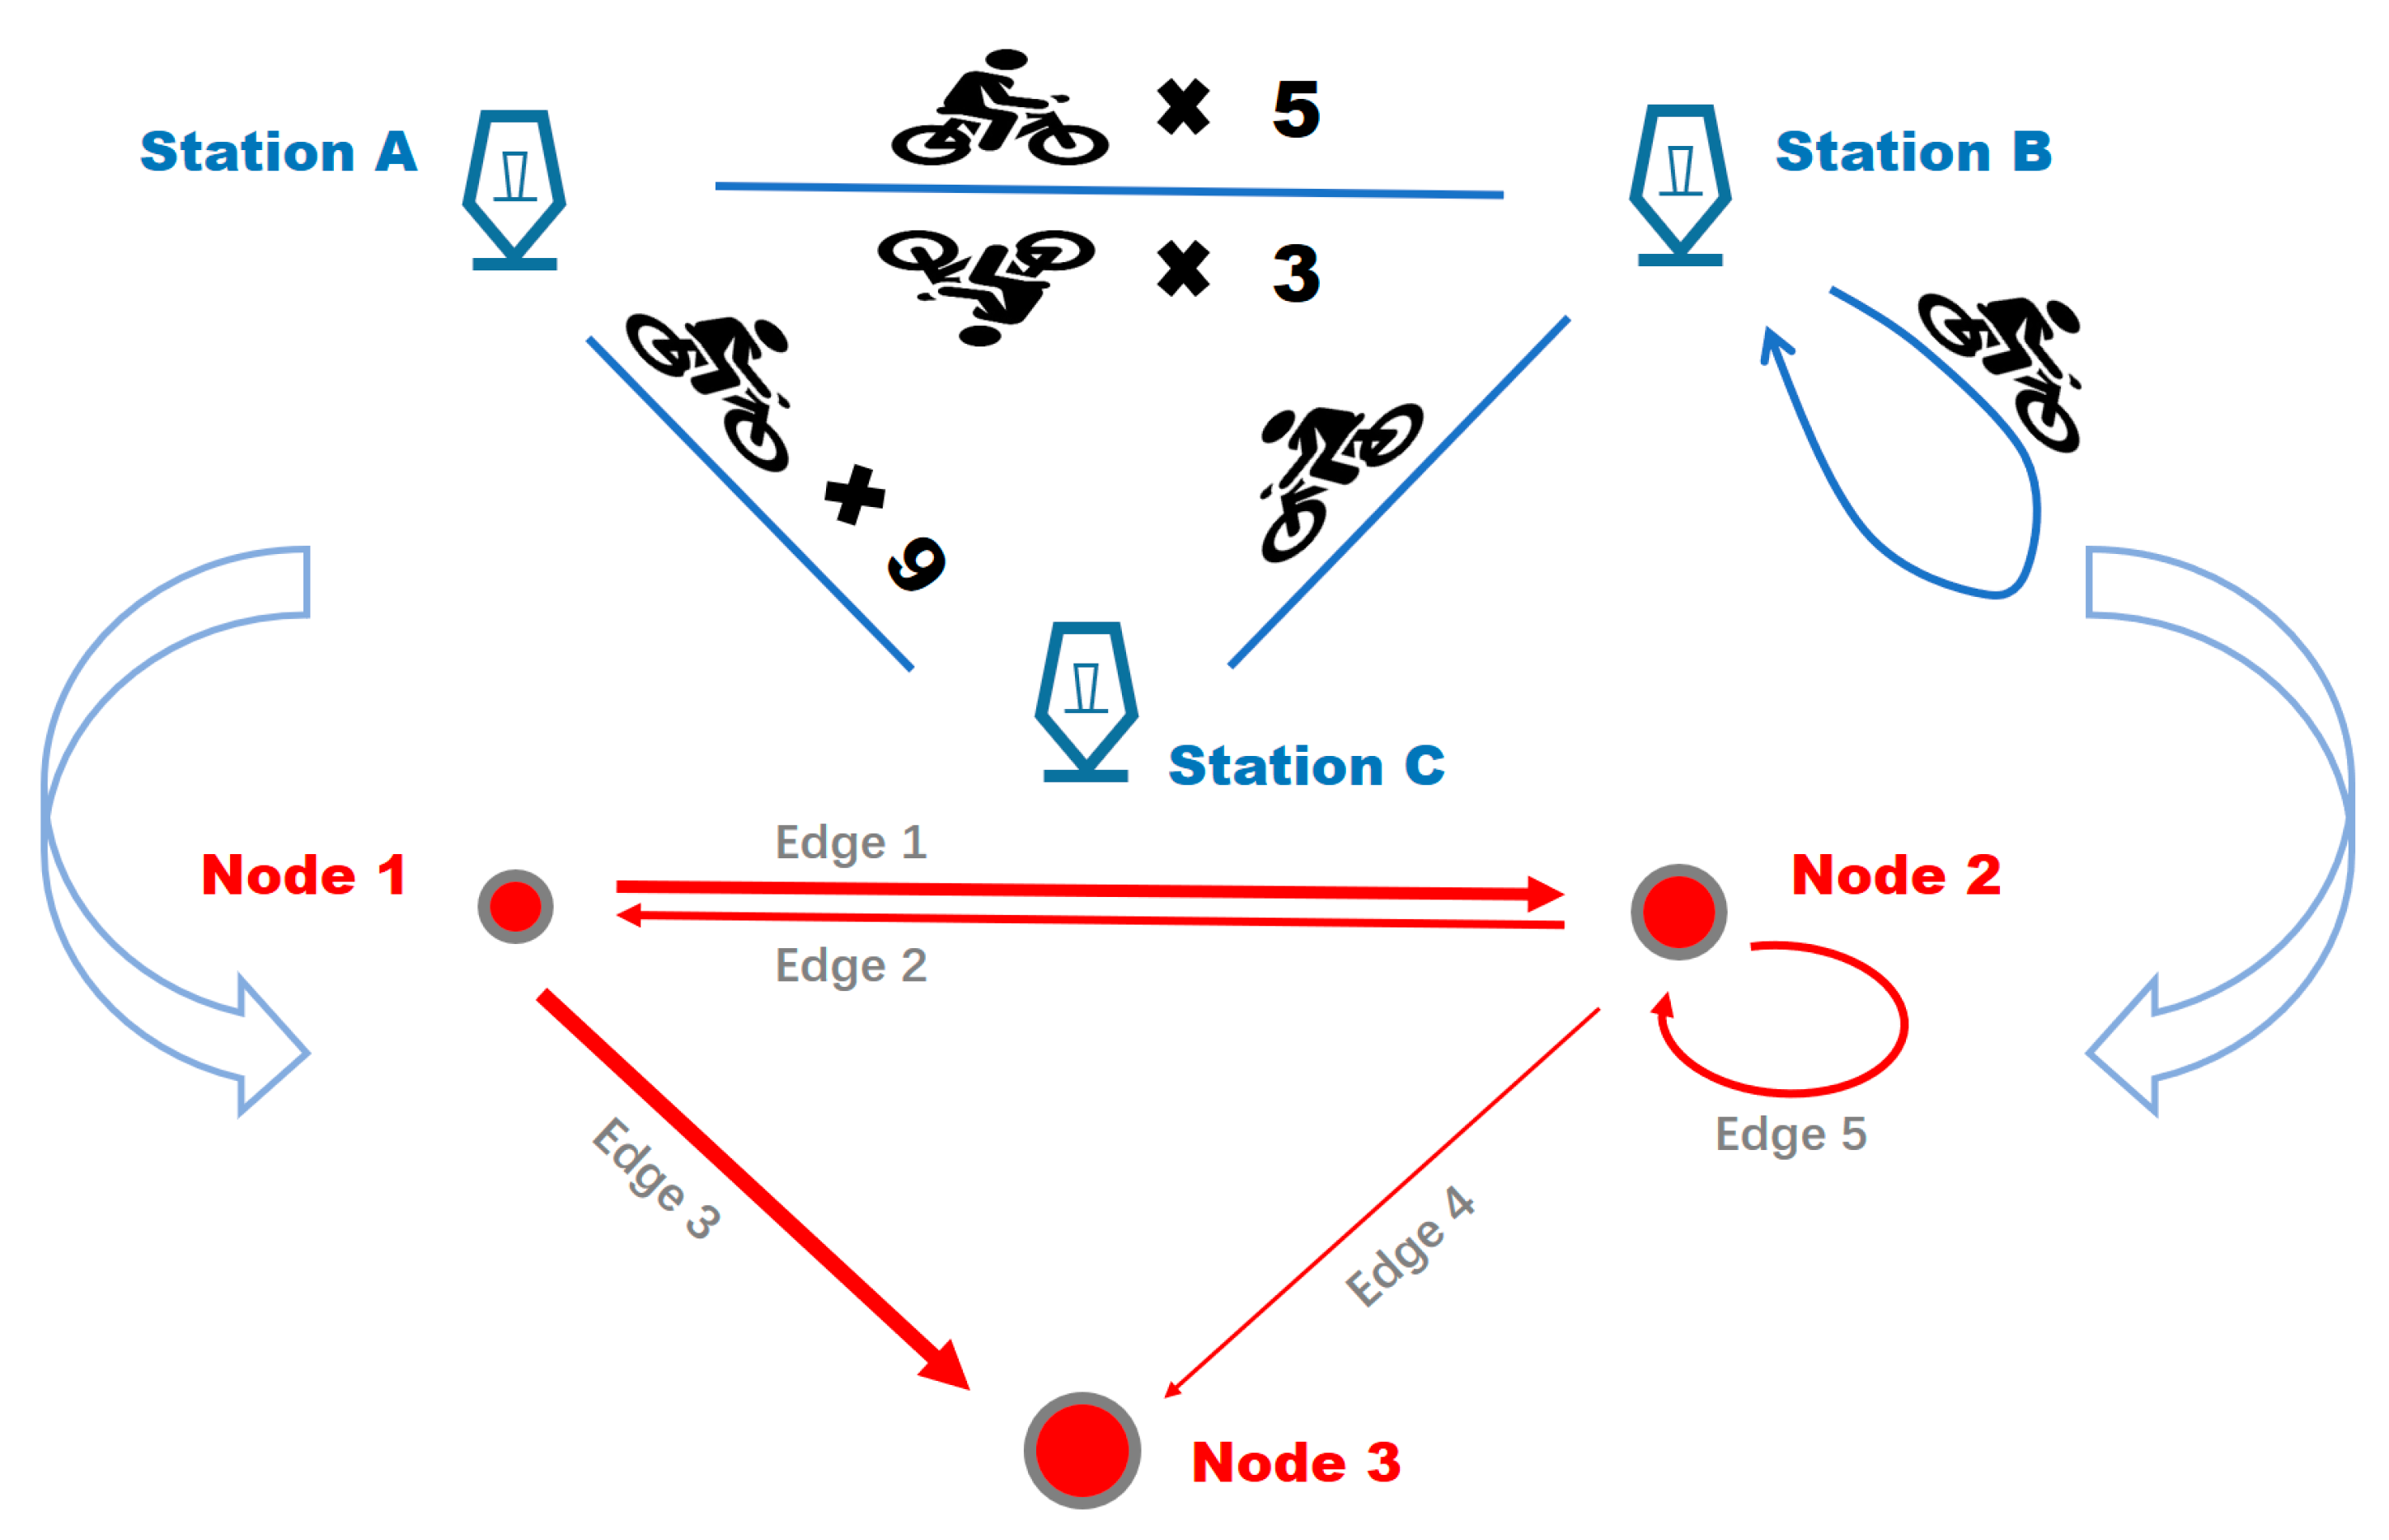
From the raw data, we first extract the stations and riding connections between stations, as illustrated in the upper part of
Figure 3. We distinguish two types of flows, i.e., station self-loop flows and inter-station flows. Station self-loop flow refers to the total number of bikes borrowed from a station and returned to the same station. Inter-station flow is the flow between two stations. This information can be structured into a network as depicted in the lower part of
Figure 3, in which nodes represent stations, and directed edges represent the node inflow (i.e., the number of incoming bikes) and outflow (i.e., the number of outcoming bikes), respectively. The total flow of the station (the sum of incoming and outcoming bikes) is the total flow of the node. The higher the total flow of the station, the larger the size of the node. The edge direction is the direction of the riding flows between stations, and the width of the edge is proportional to the amount of flow. If there is a riding that starts and ends for the same station, there is a loop on the corresponding node. For instance, node 3 corresponding to station C has the highest number of flows. Node 1 and node 2 belong to a two-way connection, and each of them belongs to a one-way connection with node 3. Obviously, edge 3 between node 1 and node 3 has a larger flow than other edges. Edge 5 is a loop connecting the same node 2.
The above bike-sharing network provides a basic structure for subsequent data analysis. Using network analysis methods, a series of relevant indicators on the bike-sharing network can be identified and their analysis can be carried out to investigate the network characteristics from different perspectives.
The statistical analysis of the network in this study is dedicated to understanding the main characteristics of bike flow. Statistical indicators, such as node average flow and edge average flow of the whole network, can reflect general flow characteristics. By extracting and spatially visualizing edges with a large volume of flow in the bike-sharing network, we may analyze the spatial distribution characteristics of the main flow more intuitively. In particular, this study also focuses on extracting ridings at the same borrowing and return station, which often corresponds to leisure trips [
45]. A particular interest of this study is to investigate how the pandemic affects leisure riding, and what changes take place in the spatial distribution of the main flow of leisure riding.
Formula (1) is introduced to calculate the variation coefficient of the flow, which reflects the dispersion degree of flow distribution in the bike-sharing network, and is not influenced by measurement scale and dimension;
x is the flow value,
σ and
μ represent the standard deviation and the average value of the data. The average value is expressed in Formula (2), where
xi represents the flow of node
i (or the flow of edge
i), n is the number of nodes (or edges), and d is the number of days in the experimental data. For the bike-sharing network, the higher the
CV(
x), the stronger the heterogeneity of the flow distribution, which means the flow distribution is more unbalanced.
To further study the structure of the bike-sharing network and the impact of the pandemic on it, the aggregation indicators of the network are introduced, which may reflect the change in the aggregation degree of the bike-sharing network. In this study, the average aggregation coefficient and the global aggregation coefficient are used to investigate the network aggregation locally and globally, respectively.
The average aggregation coefficient is based on the local aggregation coefficient, which is calculated to measure the aggregation degree around each node. The local aggregation coefficient of a node is the ratio between the number of edges between its connected nodes and the number of possible edges between them. For node
i, its local aggregation coefficient
ci is calculated according to Formula (3). If and only if there is a connection between node
i and
j,
aij = 1, otherwise
aij = 0, and
ki represents the degree of node
i,
. By taking the average of the local aggregation coefficients of all nodes, we obtain the average aggregation coefficient of the network. In the bike-sharing network, a high average aggregation coefficient indicates that the stations are well connected with their surrounding stations and there is good local aggregation between these stations.
The definition of the global aggregation coefficient is based on the so-called node triples in the network. If three nodes are connected in pairs, they form a closed triple. If there are only two connecting edges between three nodes, they are called open triples. By counting the number of different types of triples in the network, the global aggregation coefficient is obtained as shown in Formula (4), where
GC is the number of closed triples in the network and
Go is the number of open triples. A bike-sharing network with a high global aggregation coefficient indicates a good network aggregation and a relatively saturated interconnection between stations.
4.2. OD Clustering of Bike-Sharing Data
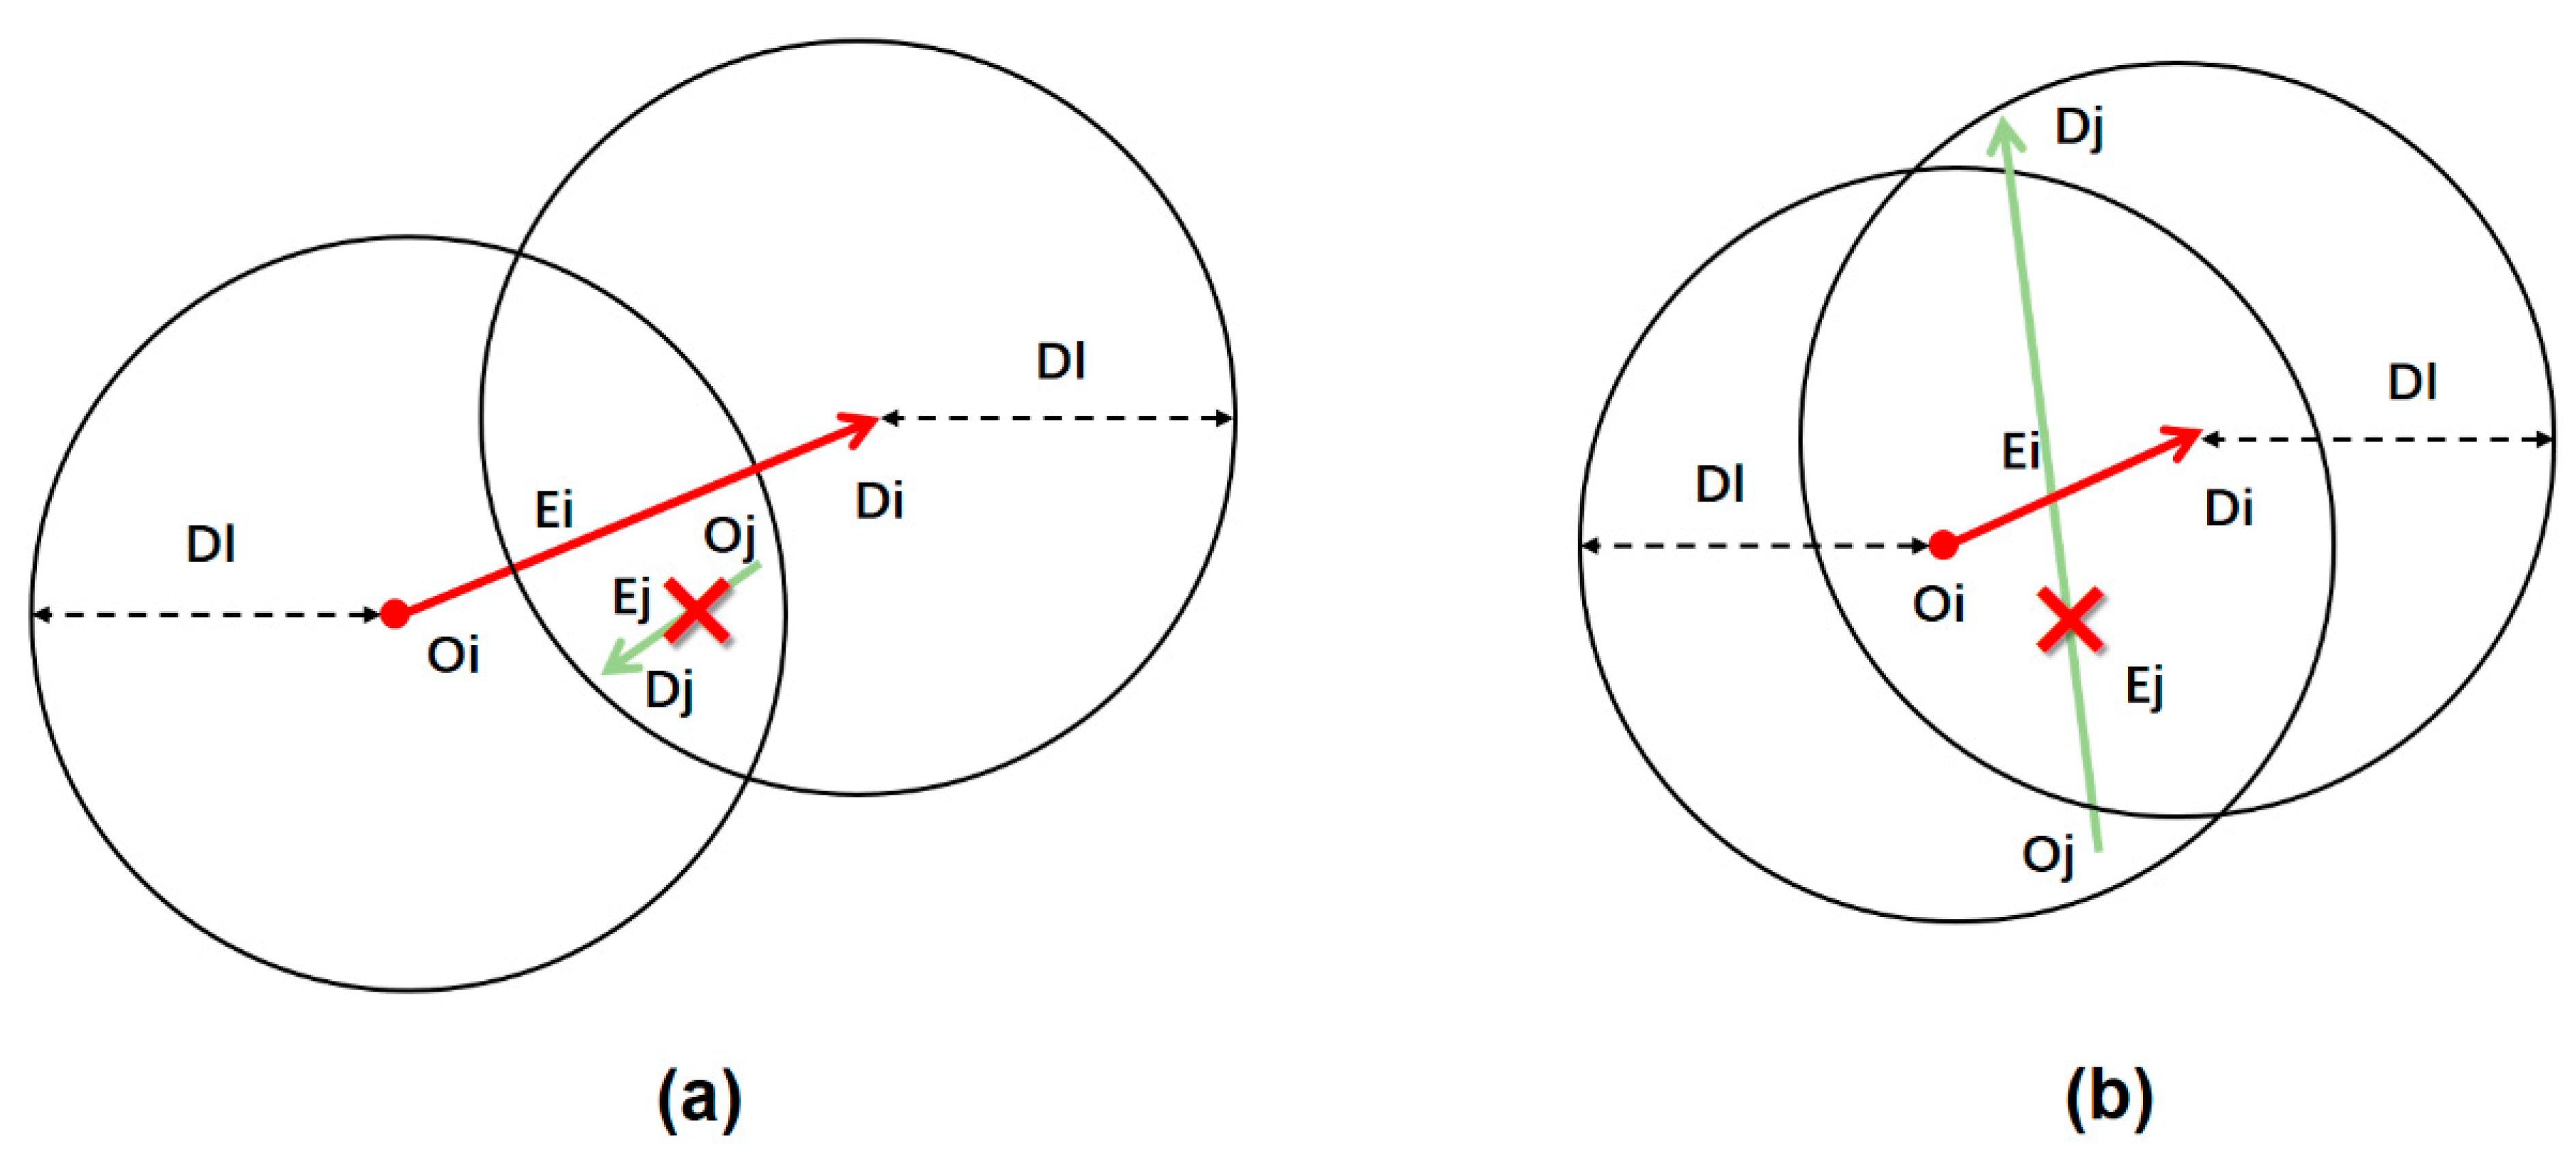
Based on the constructed bike-sharing network above, we can summarize its basic flow statistics. A common way to extract the main riding flows is by directly filtering out the number of flows above a given threshold from the constructed bike-sharing network. However, this approach may ignore large groups of flows where individual edges may not have large flows, but they spatially and directionally close and together form a large flow connecting different regions. These groups can be a good description of the distribution of main flows with similar spatial patterns. To extract these edge groups of large flows, we apply an OD clustering method that considers multiple spatial factors and edge flow on the bike-sharing network. Unlike the idea of clustering by the location of starting points or end points, respectively, the OD clustering in this study considers the locations of both start points and end points. The general process is described below.
For any two edges
Ei and
Ej in the network, their spatial similarity is calculated as follows: <
Oi,
Di> and <
Oj,
Dj> are the OD pairs of
Ei and
Ej, respectively.
Fi and
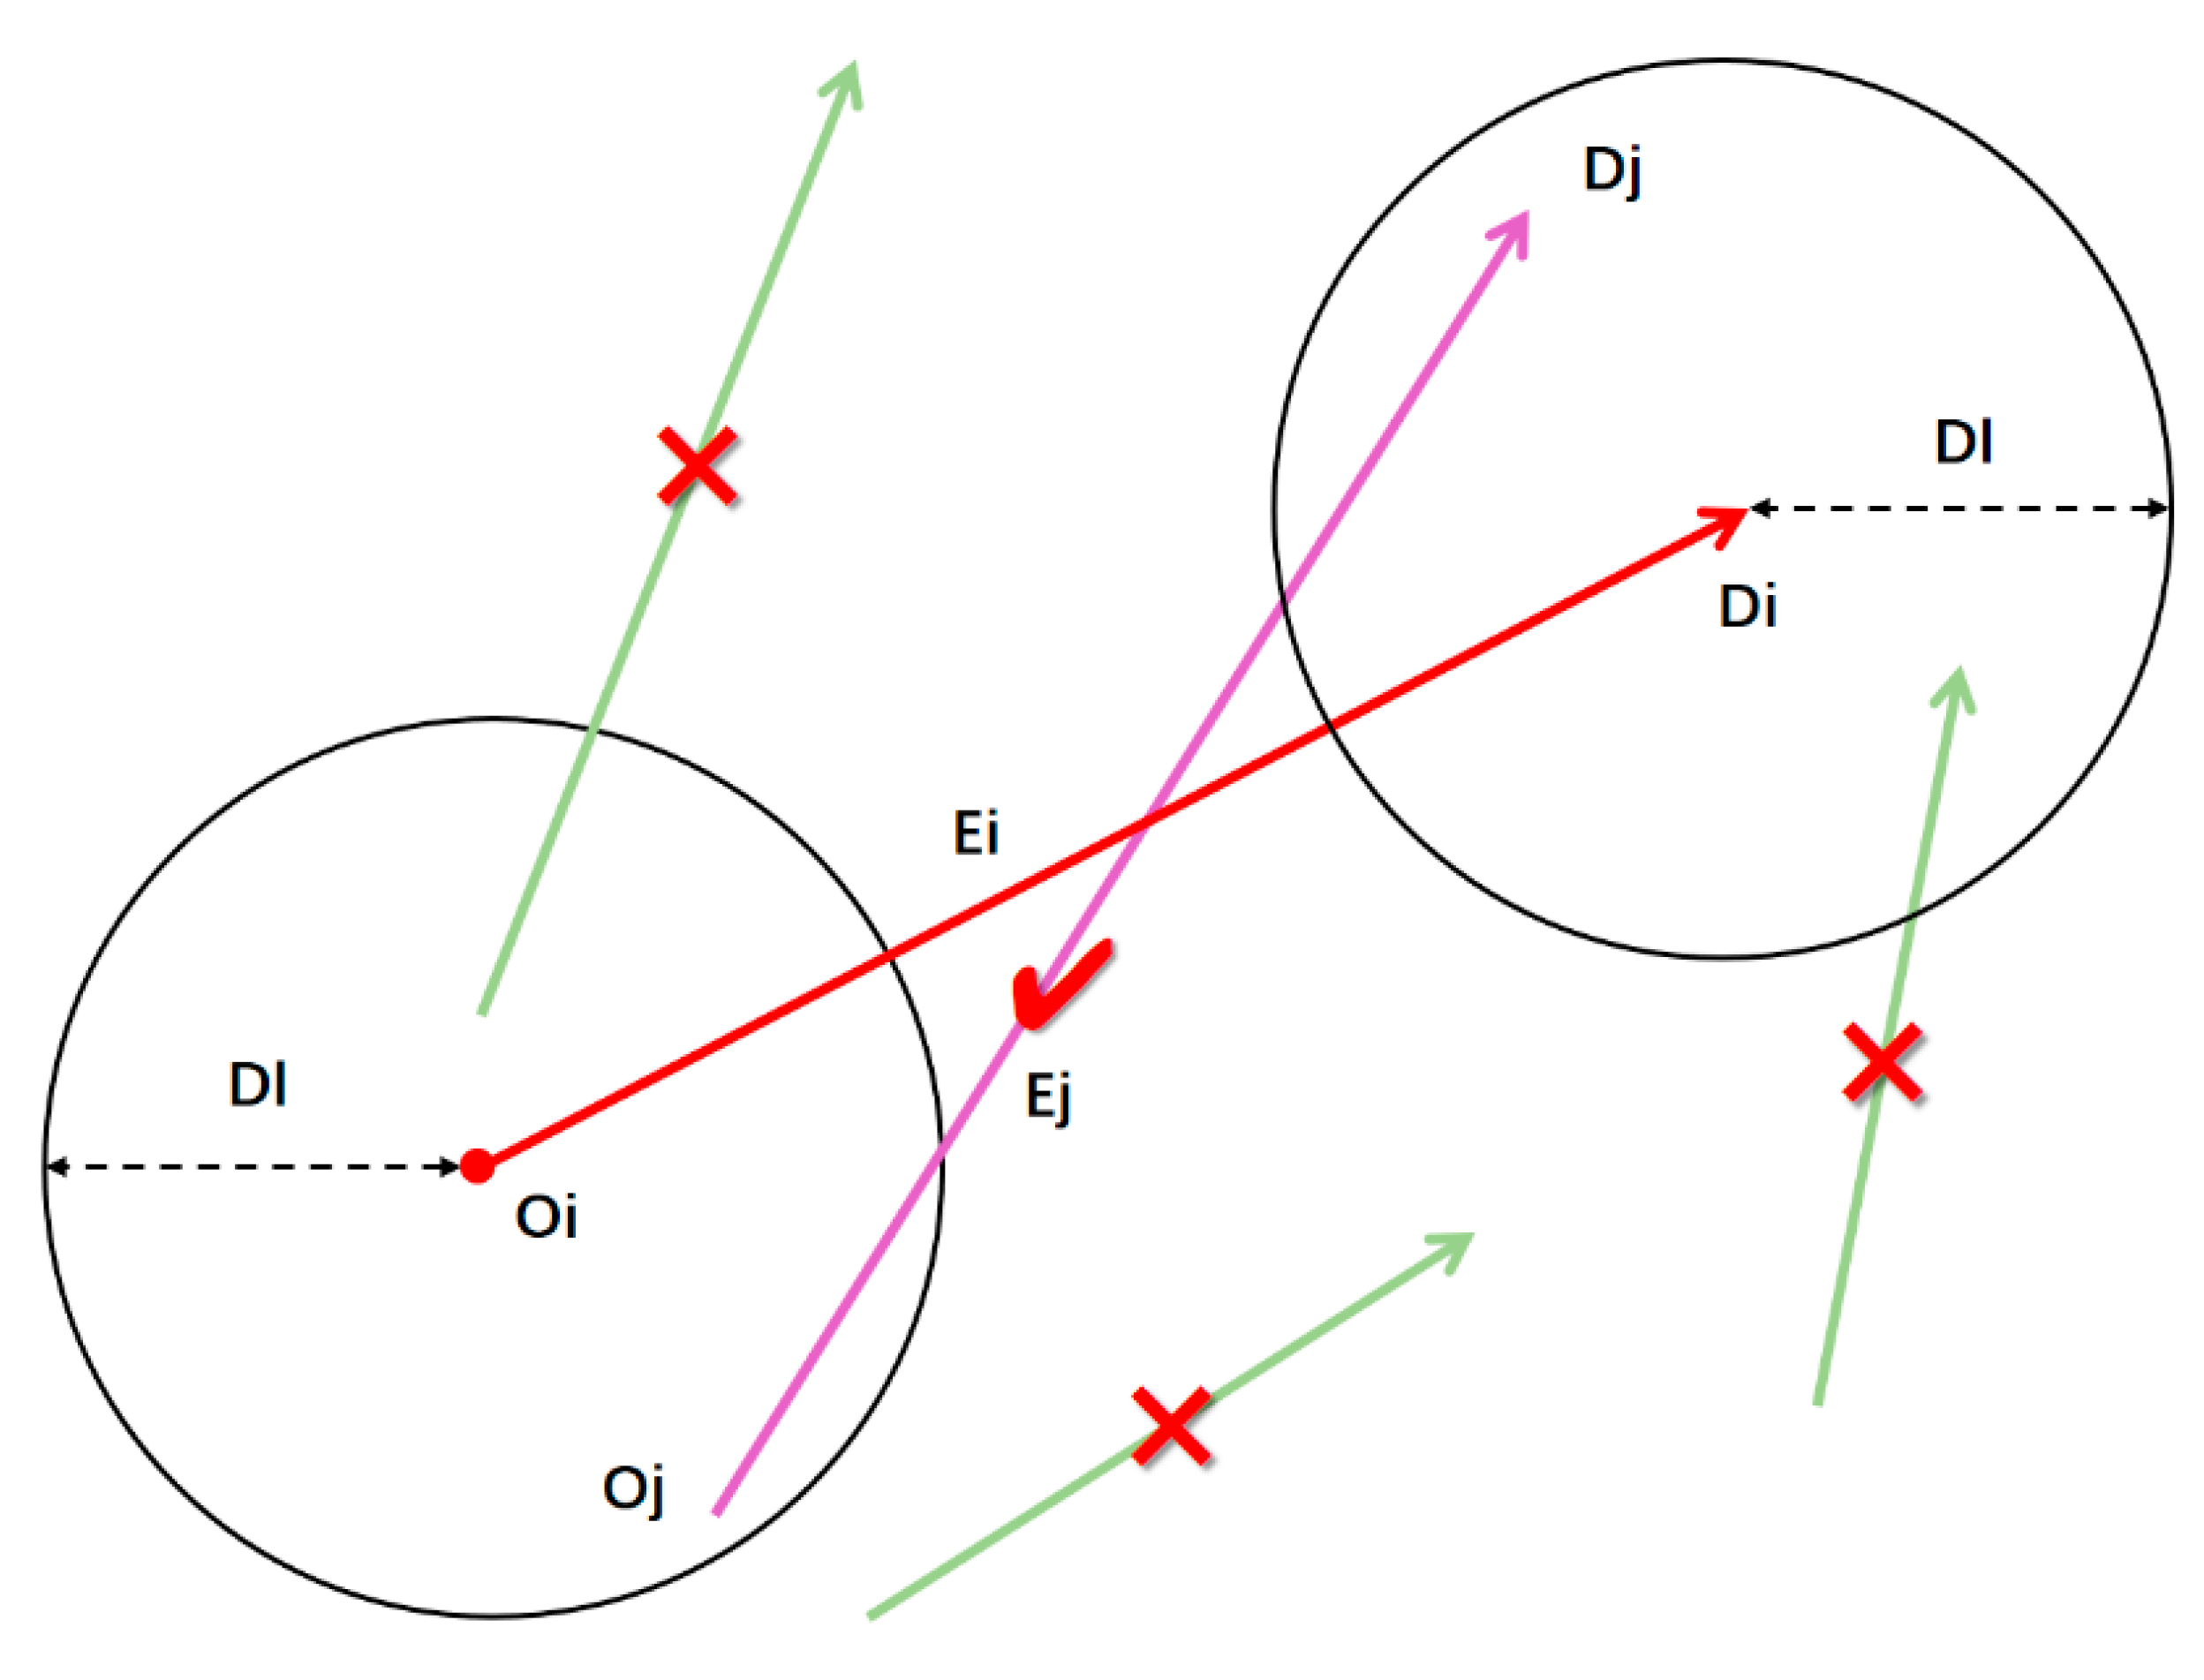
Fj are the riding flows on the two edges. We impose the distance constraint of OD data as shown in
Figure 4. Taking
Oi and
Di as the center points, and
Dl as the search radius, the two circles show the neighborhood of
Oi and
Di. For any other edge in the network, if its origin and destination fall in the neighborhood of
Oi and
Di, respectively, this edge meets the distance constraint conditions. From
Figure 4, we can see that the purple line
Ej fulfills this requirement, while the two green arrow lines are filtered out. The distance threshold is expressed in Formula (5), where
dist() is the distance calculation function to calculate the distance between the start points and the end points of the two edges.
However, using the distance constraint alone may not guarantee the spatial similarity of the two edges. As demonstrated in
Figure 5,
Ei or
Ej are rather short and reveal large directional differences, even if
Oj and
Dj satisfy the distance constraint. Therefore, the angle constraint is introduced as shown in Formula (6) to assure the edges with smaller angles and consistent direction. The function of the angle threshold is expressed in Formula (6), in which
Angle() is the angle calculation function and
Al is the angle threshold.
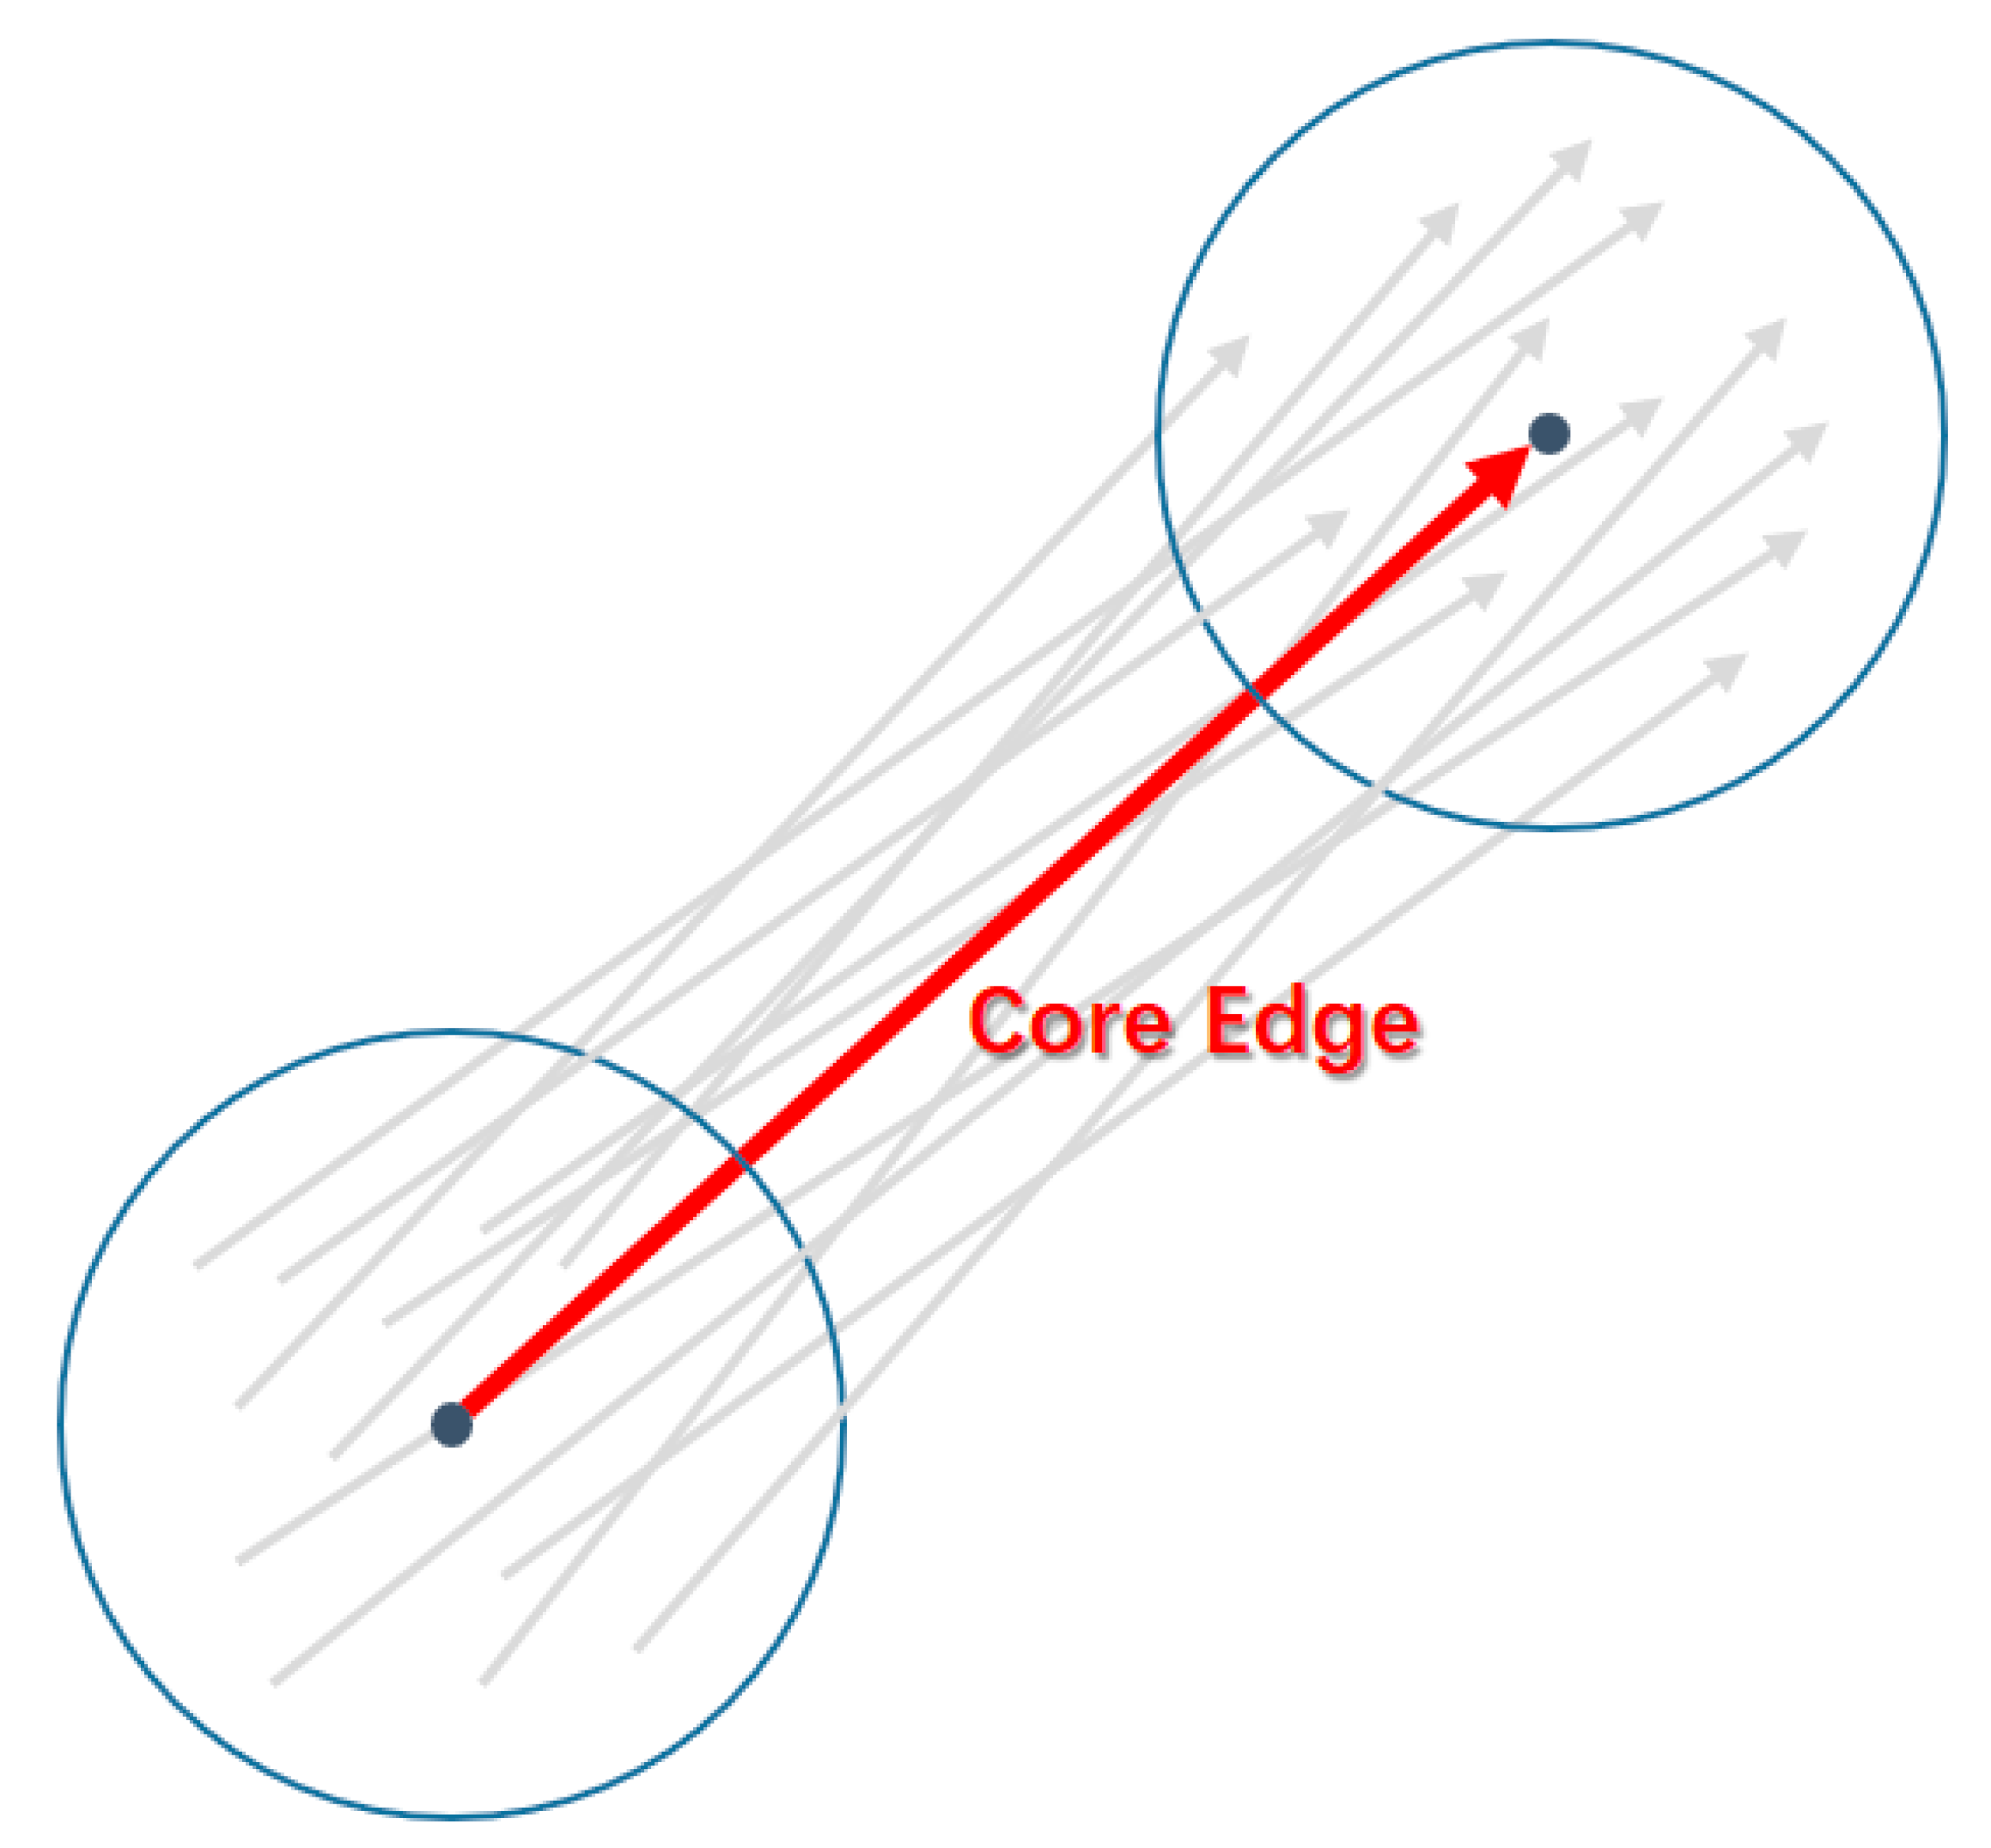
In cluster extraction, this study sets threshold constraints on both edge flow and the number of edges in the cluster. To take into account the edge flow in clustering, we use the threshold ft for edge flow to filter large flow edges in cluster extraction. Through threshold ft, only edges with a flow greater than ft can participate in clustering. In addition, the threshold for the number of edges in clustering is set to et to extract large flow edge groups. That means only clusters with more than et edges can be extracted as the final results. The clustering process runs as follows:
- (1)
For an unprocessed edge Ei in the bike-sharing network, if its flow is greater than ft, execute step (2). Otherwise, mark it as processed and repeat step (1);
- (2)
Calculate the distance and angle between Ei and the edge around it in {E1, E2, E3……En} with edge flow greater than ft. Select edges that satisfy the distance constraint in Formula (5) and the angle constraint in Formula (6) to form a group;
- (3)
If the number of edges in the group in (2) is larger than et, it is identified as a cluster and go to step (4). Otherwise, mark Ei as processed and go to step (1);
- (4)
The total flow of all edges in the cluster is calculated and recorded to edge Ei, which is marked as the core edge. All edges in the cluster are marked as processed. Go to step (1).
Figure 6 shows an example of a large flow edge cluster and its core edge. Finally, all the large flow edge clusters and their core edges are extracted.
4.3. Extraction and Analysis of Rebalancing Data
The uneven spatial distribution of riding behavior leads to the imbalance of supply and demand of bikes and docks. This may make it difficult for users to find bikes or empty docks at the target station. Sometimes, bike-sharing companies may take corresponding measures to encourage users to borrow bikes from bike-rich stations near their starting points and return them at dock-rich stations near their destinations, which may facilitate a state of the self-balance system without external help [
46]. However, at present, it is difficult to avoid the imbalance between the supply and demand of bikes and docks only relying on the self-balancing mechanism. Therefore, the rebalance operation is needed to solve the above problem. Good rebalance can meet the needs of bike use and return, ensure the stable operation of the bike-sharing system, and improve user satisfaction [
44]. Meanwhile, the analysis of the collected rebalancing data can provide a new perspective for understanding the operation of bike-sharing systems.
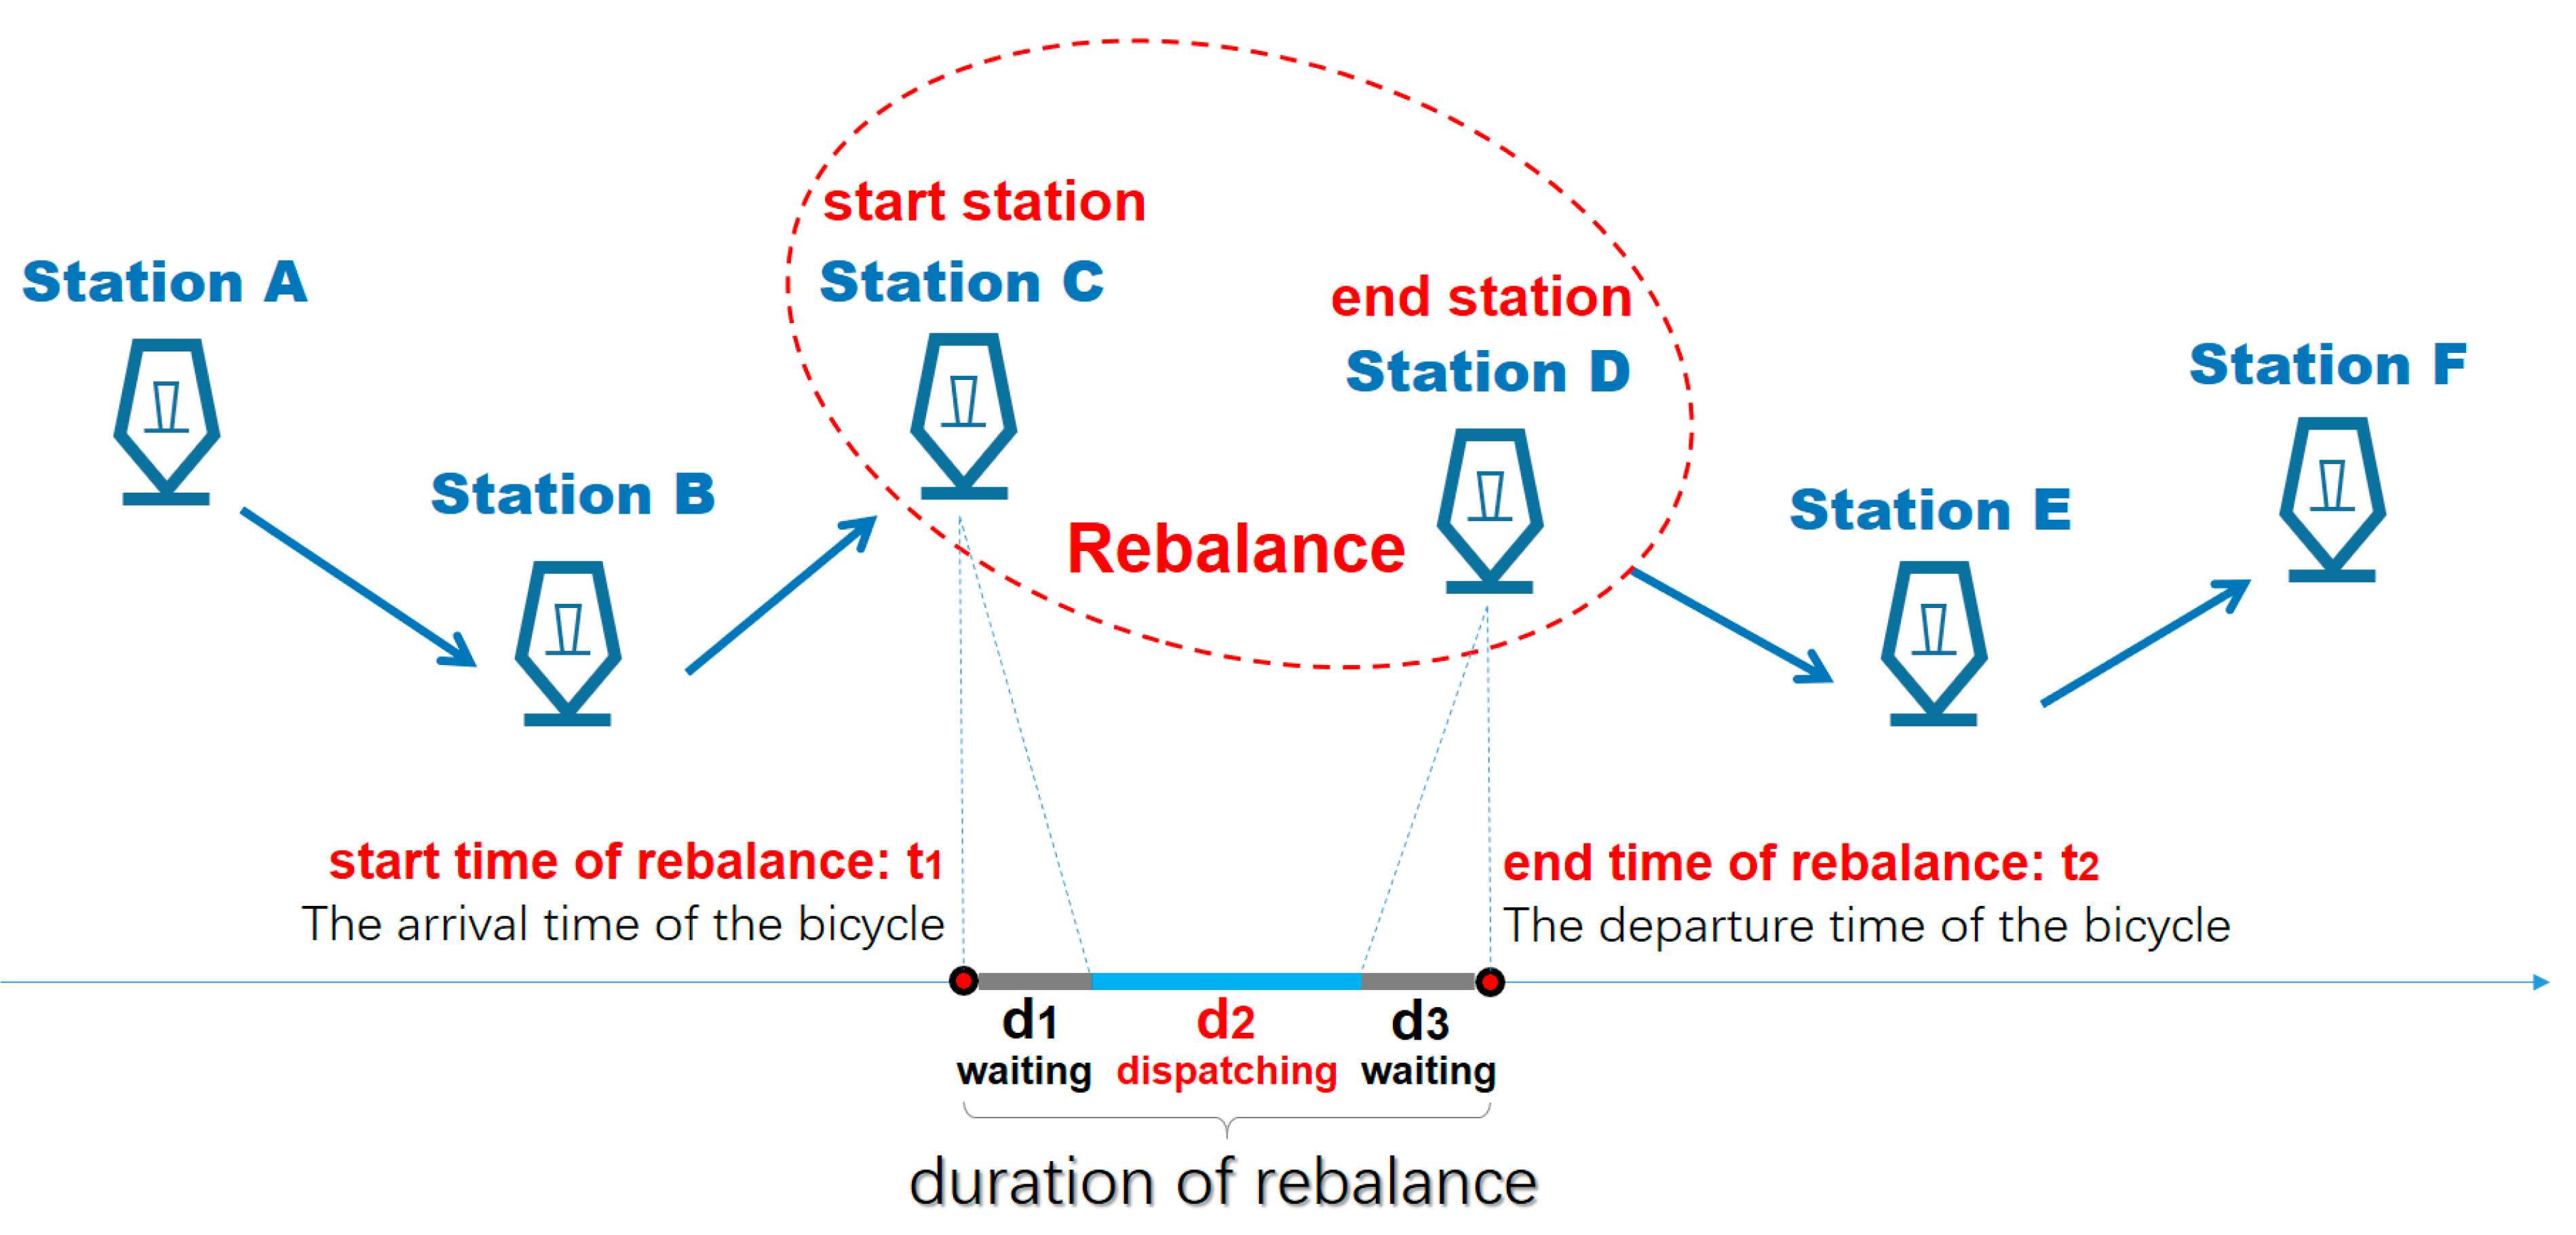
Normally, riding data does not explicitly contain the rebalancing data, but we may derive the information using the following method: First, the riding data are grouped by the bike ID, and data with the same ID are sorted by their timestamps. As shown in
Figure 7, for a bike with the corresponding ID, if there is no interruption, its spatial movement trajectory of different stations should be continuous, that is, the start station of the current data record should be consistent with the end station of the previous data record. If the spatial moving trajectory of a bike is interrupted, it can be inferred that a rebalancing operation took place at the interruption (red circle in
Figure 7). The direction of the rebalancing is from the station before the interruption to the station after the interruption (station C to station D in
Figure 7).
Therefore, the rebalancing data can be extracted from the riding data by detecting the interrupted segments of the riding trajectories. The rebalancing data are also typical OD data, which can be organized as the same data structure as the riding data. As shown in
Figure 7, the start station of rebalancing is the station before the trajectory interruption (Station C), and the end station of rebalancing is the station after the trajectory interruption (Station D). The start time of rebalancing is the time when the bike returns to the station before the trajectory interruption (t1), and the end time of rebalancing is the time when the bike leaves the station after the trajectory interruption (t2).
The duration of rebalancing is the difference between the end time and the start time, which includes three components, i.e., the waiting time of the bike at the start station of rebalancing (
d1), the real rebalancing time by the company (
d2), and the waiting time of the bike at the end station of rebalancing (
d3). As shown in
Figure 7, the duration of rebalancing is the total sum of
d1,
d2, and
d3. Since the bike-rebalancing time (
d2) spent on transporting bikes is normally short, a longer rebalancing time indicates that the bike was potentially standing in the station for a long time before rebalancing, or/and the bike was potentially waiting at the station for a long time after rebalancing. Therefore, a long rebalancing duration has a poor description of the time distribution of rebalancing behavior. A short rebalancing duration indicates that the rebalancing operation happens immediately after the bike returns to the station and the bike is used immediately after the rebalancing, which reflects timely dispatching. In case of a short duration of rebalancing, both the start time and the end time of rebalancing can approximately describe the occurrence time of the rebalancing operation.
Note that the absolute number of the rebalancing operations cannot be directly used to describe the rebalancing efficiency, because generally, in a bike-sharing system, the larger the riding volume is, the larger the rebalance volume will be. Hence, we introduce the rebalancing ratio
RR in Formula (7) as the ratio between the number of rebalancing operations
RA and the total number of ridings
TA. Furthermore, spatiotemporal analysis can be carried out based on the derived rebalancing data.
6. Discussion
6.1. Study Results and Their Significance
This study explores the spatiotemporal variations of riding and rebalance of shared bikes before and during the pandemic for a better understanding of the impact of the pandemic on bike-sharing. The main findings are as follows:
- (1)
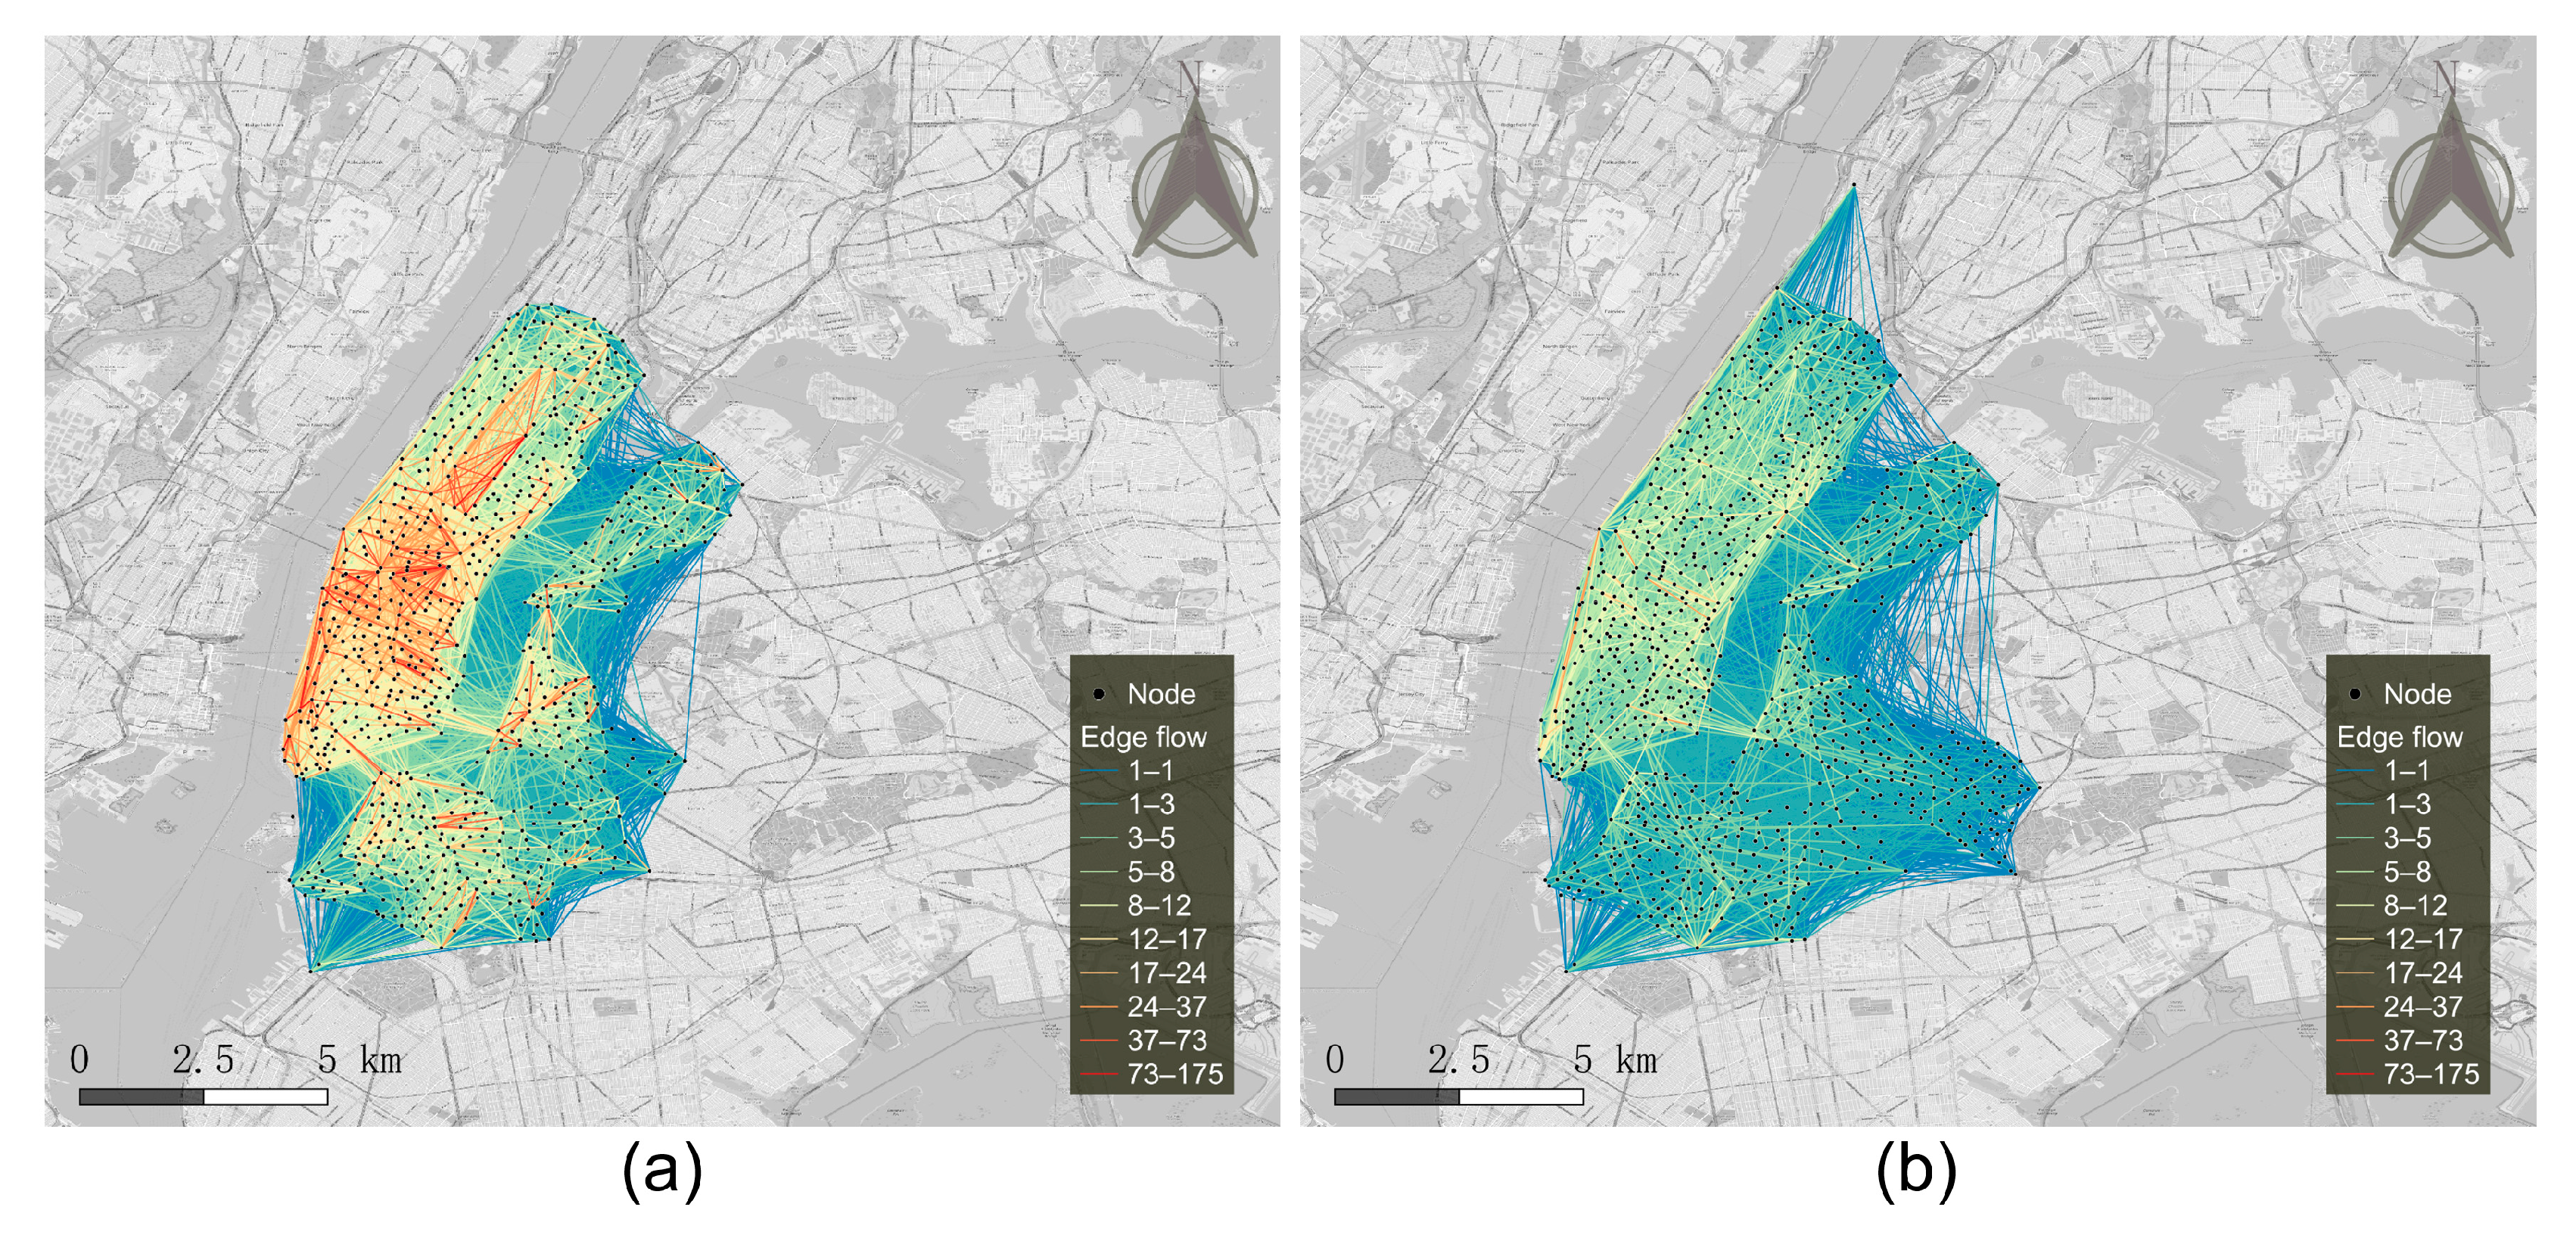
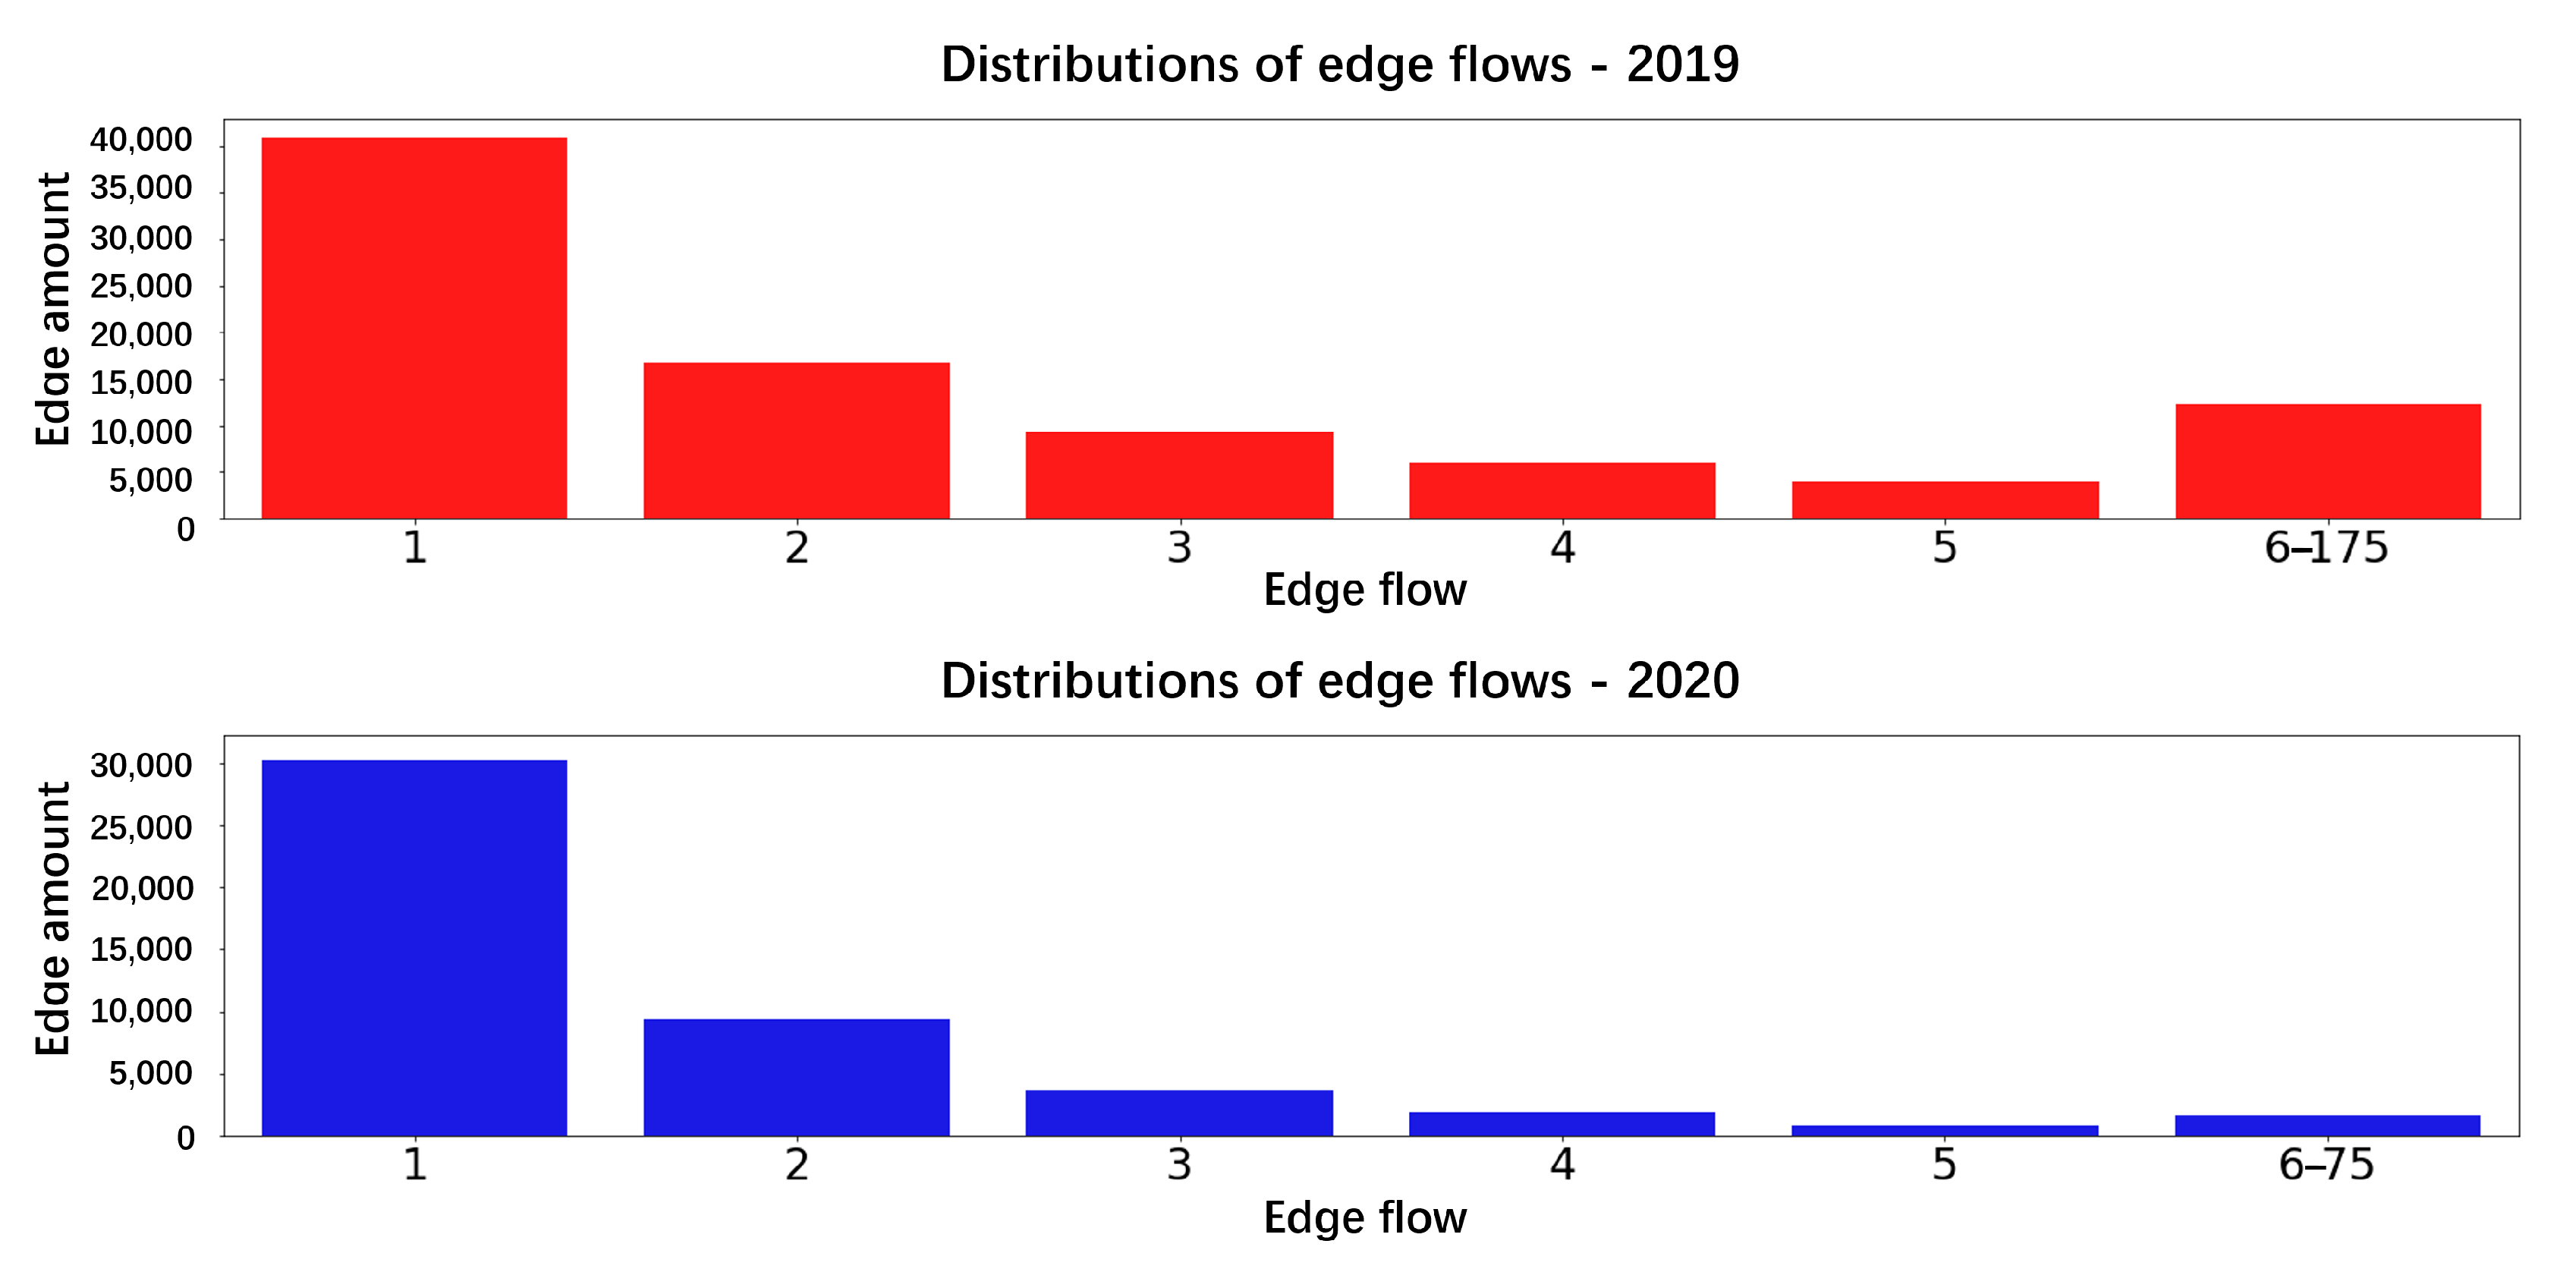
The riding flows and their distribution during the pandemic changed significantly. On the one hand, there was a substantial reduction in network flow. On the other hand, compared with aggregated distributions in pre-pandemic times, the network flow was more evenly distributed and the aggregation of network connections was reduced in the early stage of the pandemic.
- (2)
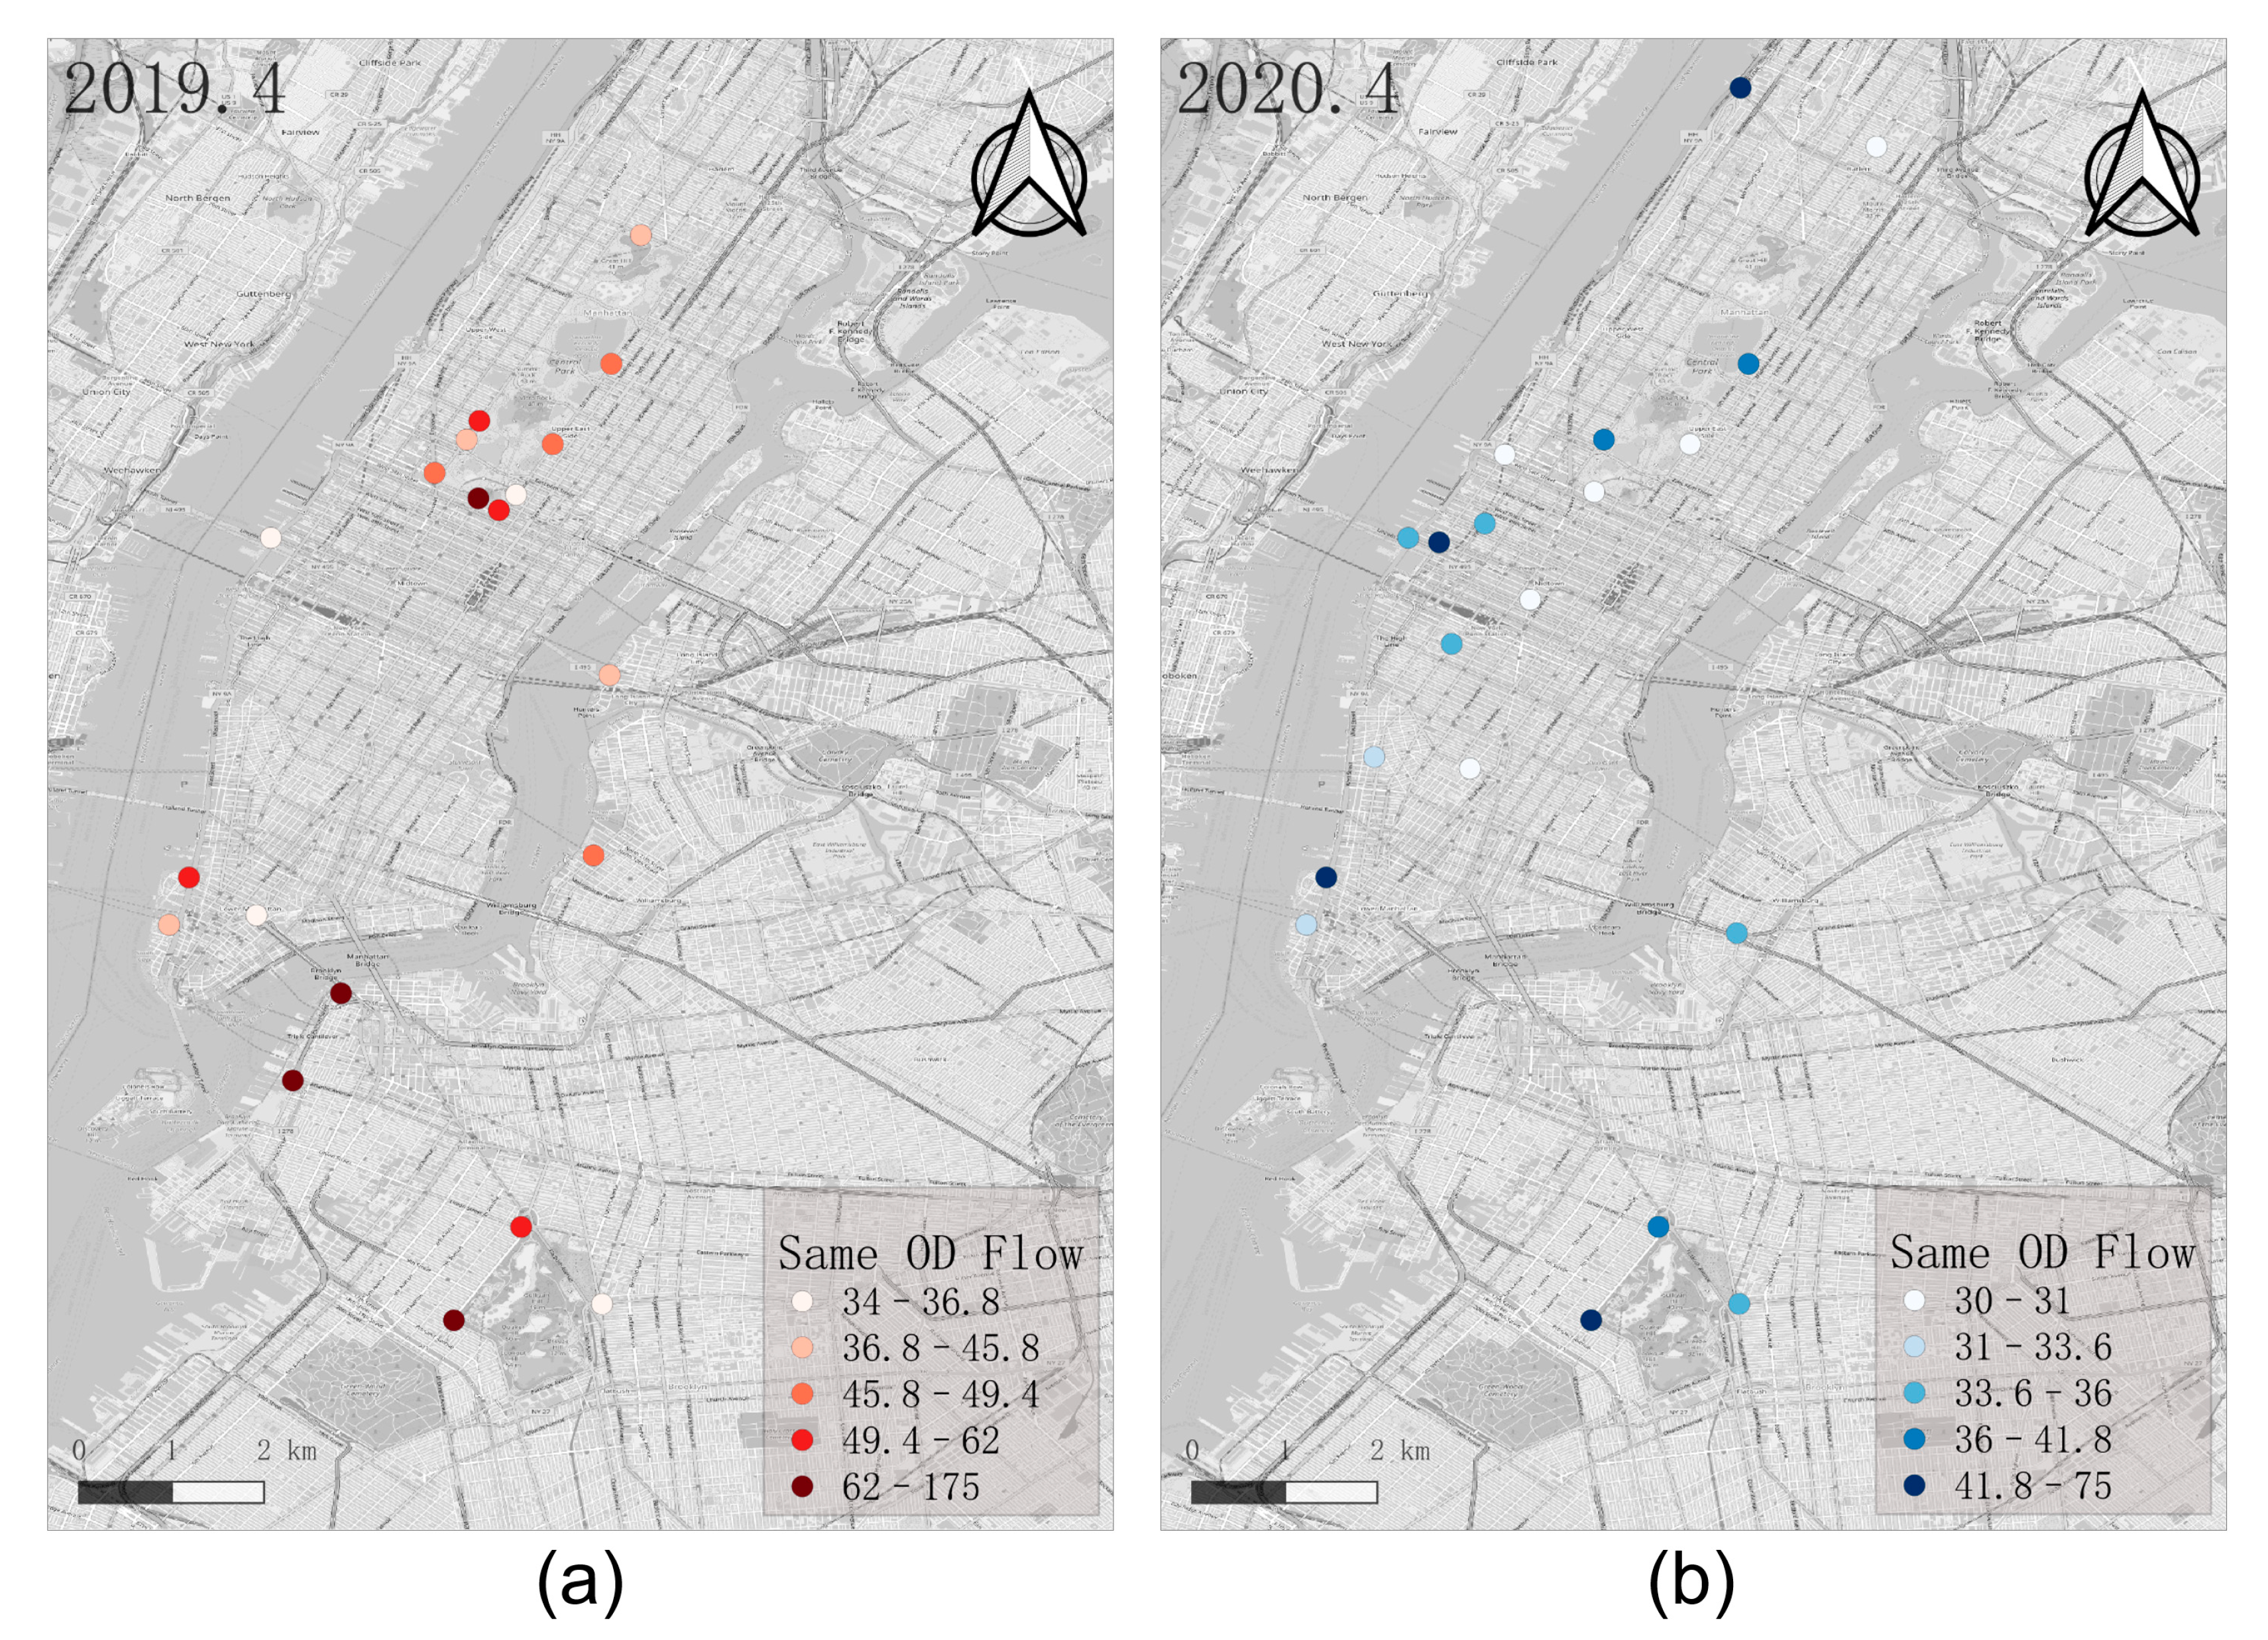
The proportion of high flow associated with self-loops at the stations increased significantly during the pandemic. In the pre-pandemic period, these stations were mostly concentrated in urban gathering places, such as Central Park. During the pandemic period, these stations were mostly scattered along the riverbanks. The distribution of large flow inter-station edges during the pandemic narrowed from the entire study area to Manhattan, and moved from the central area to the edge area.
- (3)
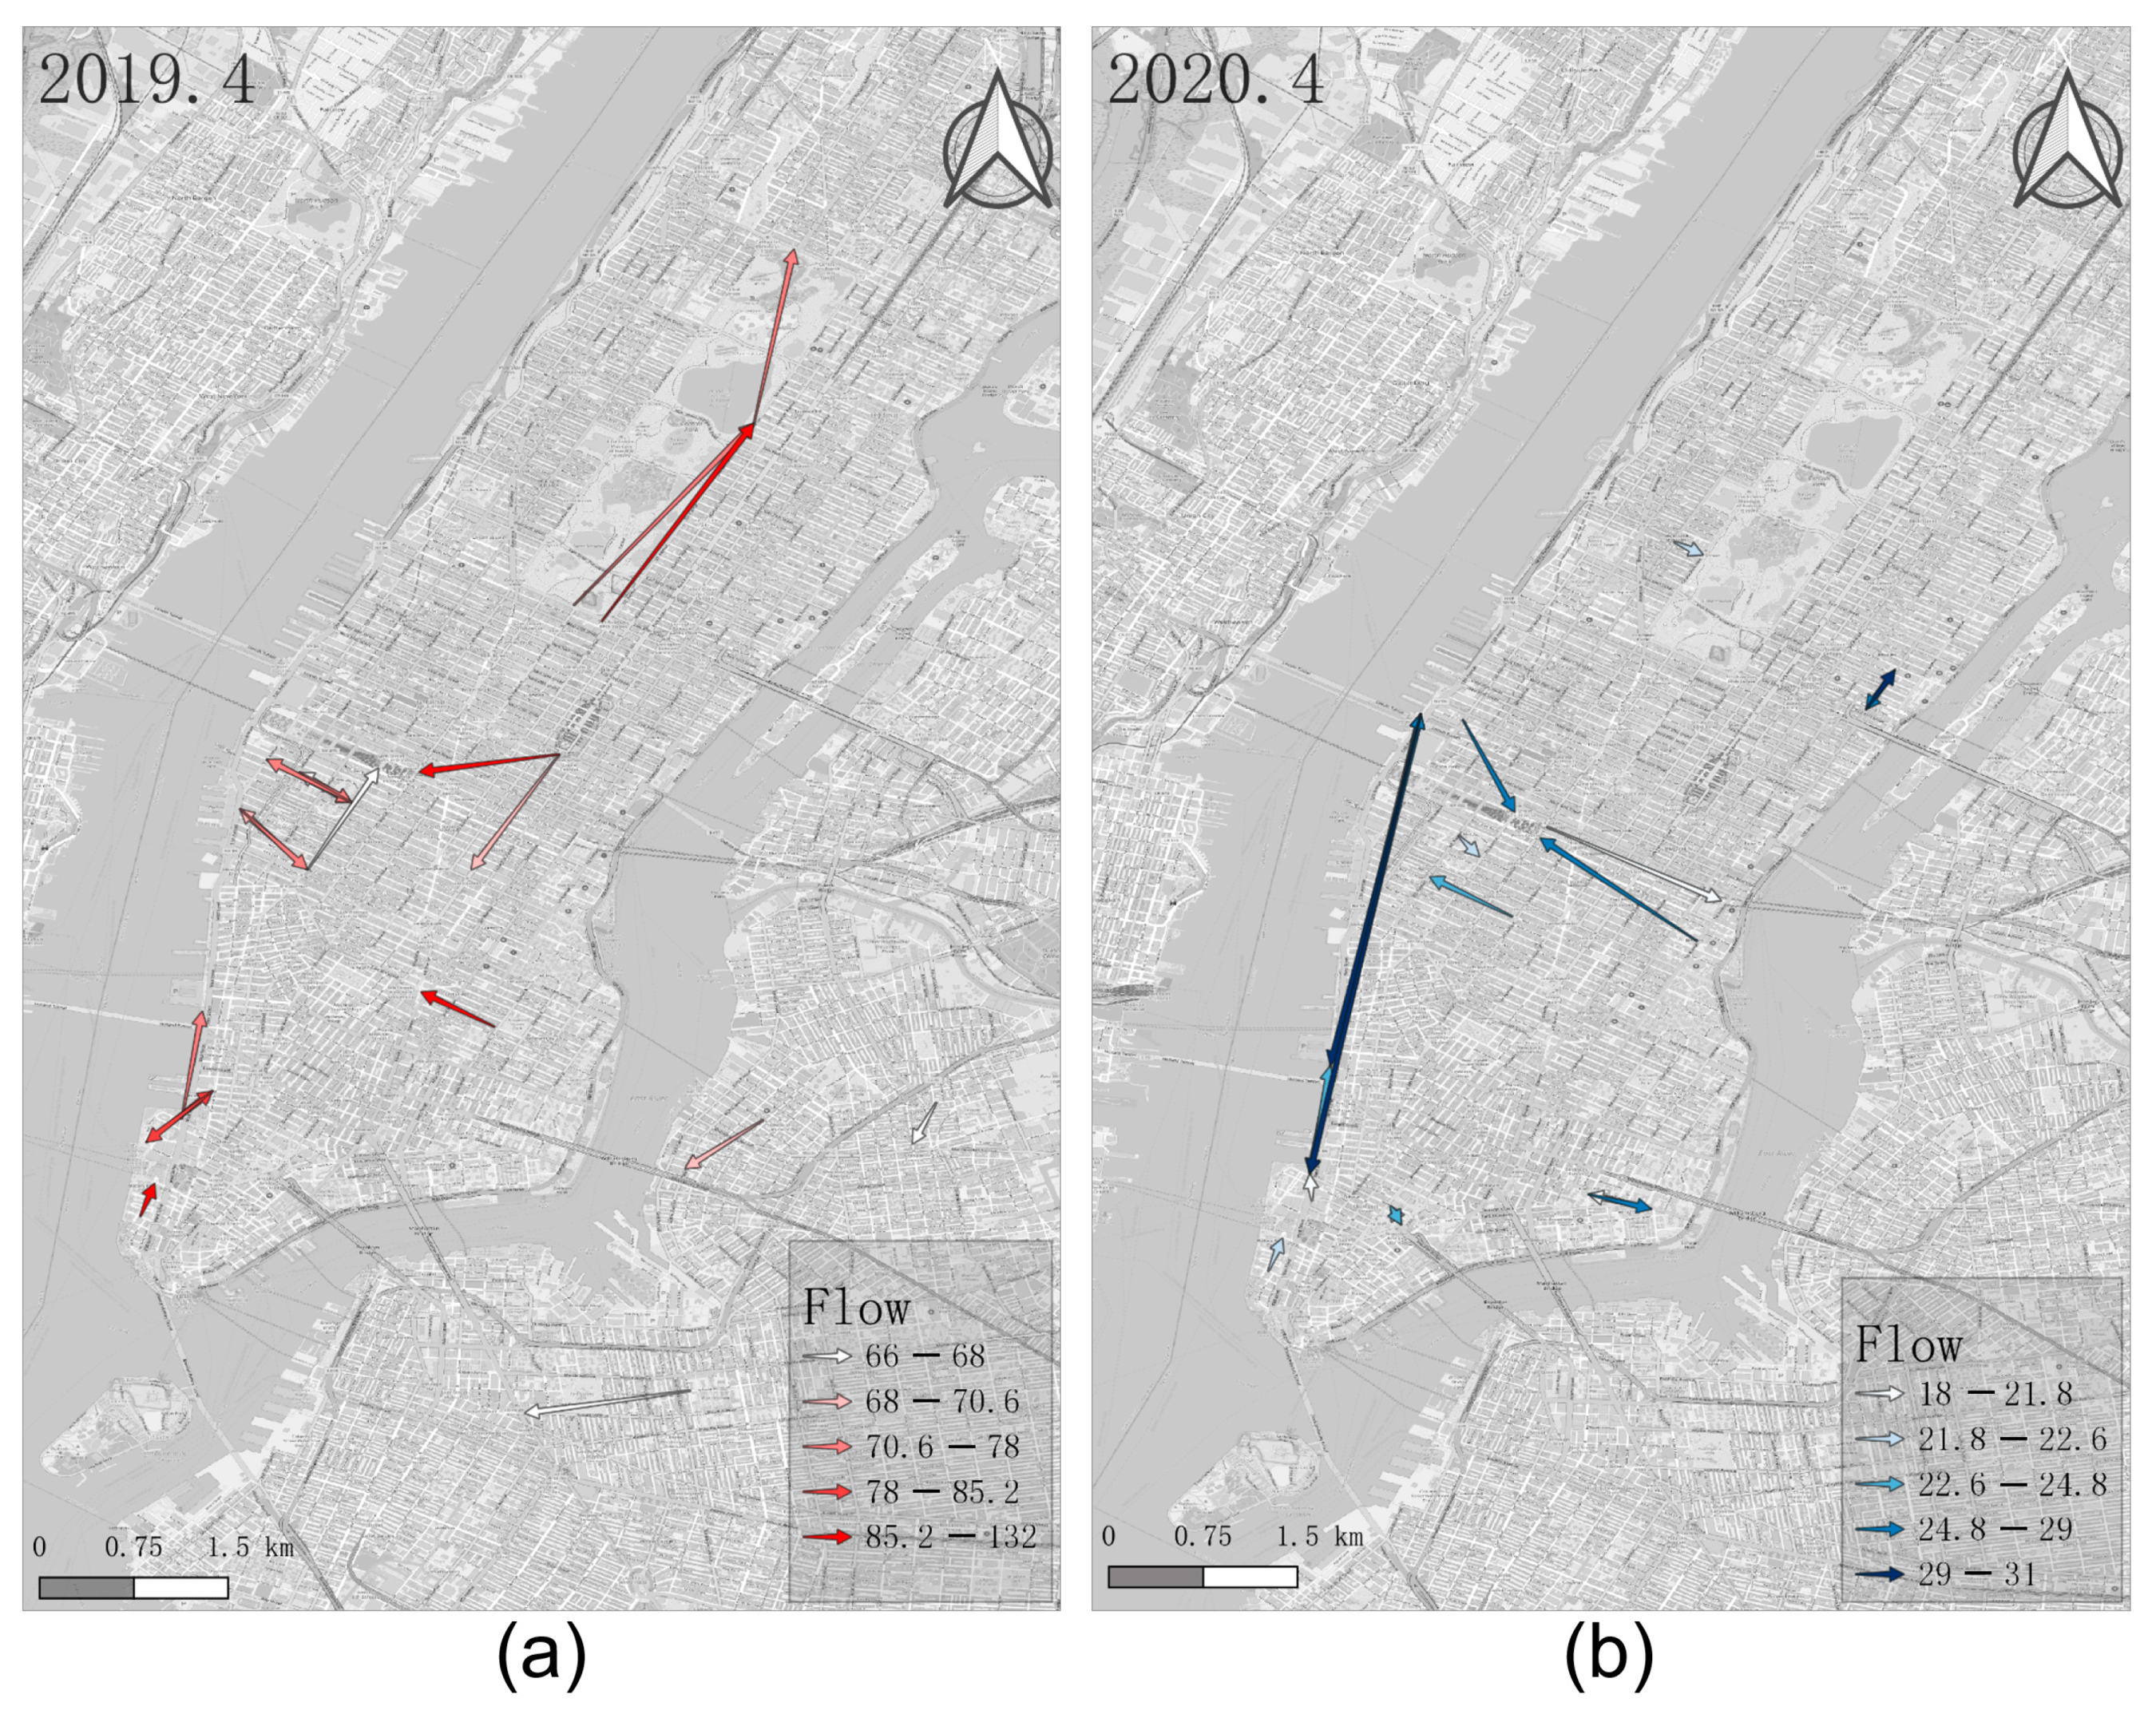
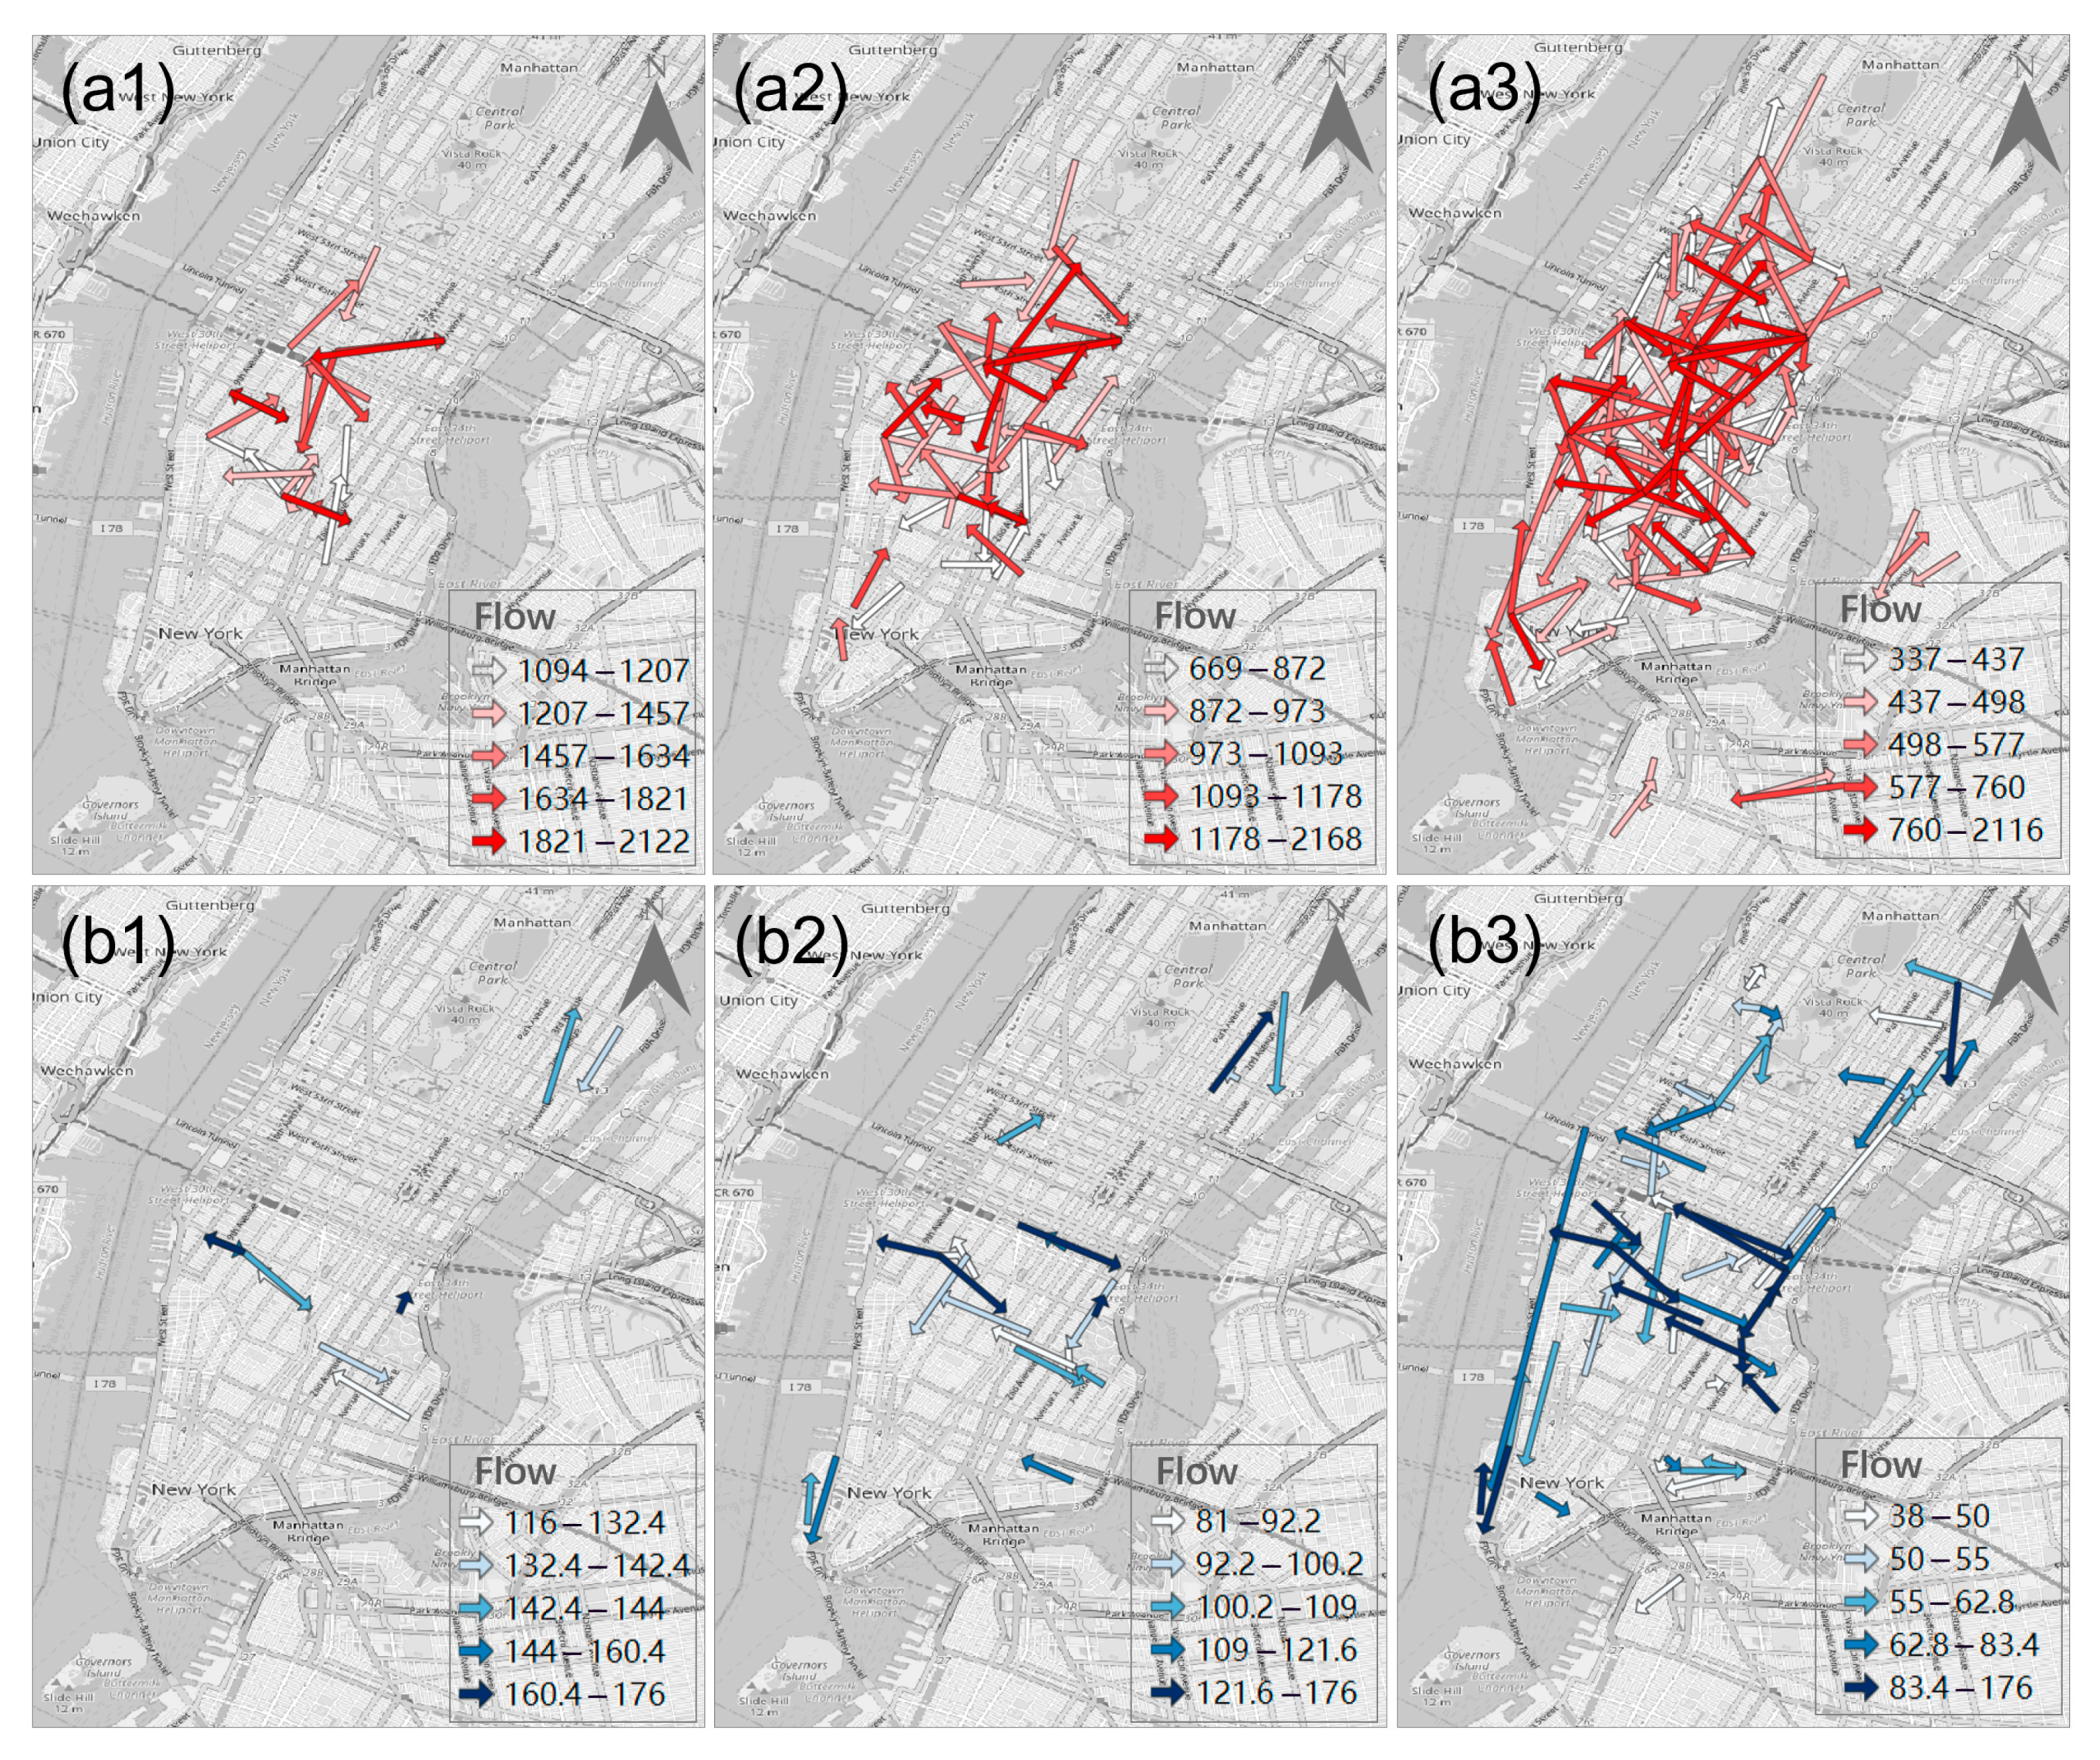
In terms of large flow edge clusters, their spatial distribution changed significantly during the pandemic. Large flow edge clusters were more concentrated in prosperous areas in pre-pandemic times. However, during the pandemic period, the distribution of these clusters was more scattered and presented the characteristics of decentralization.
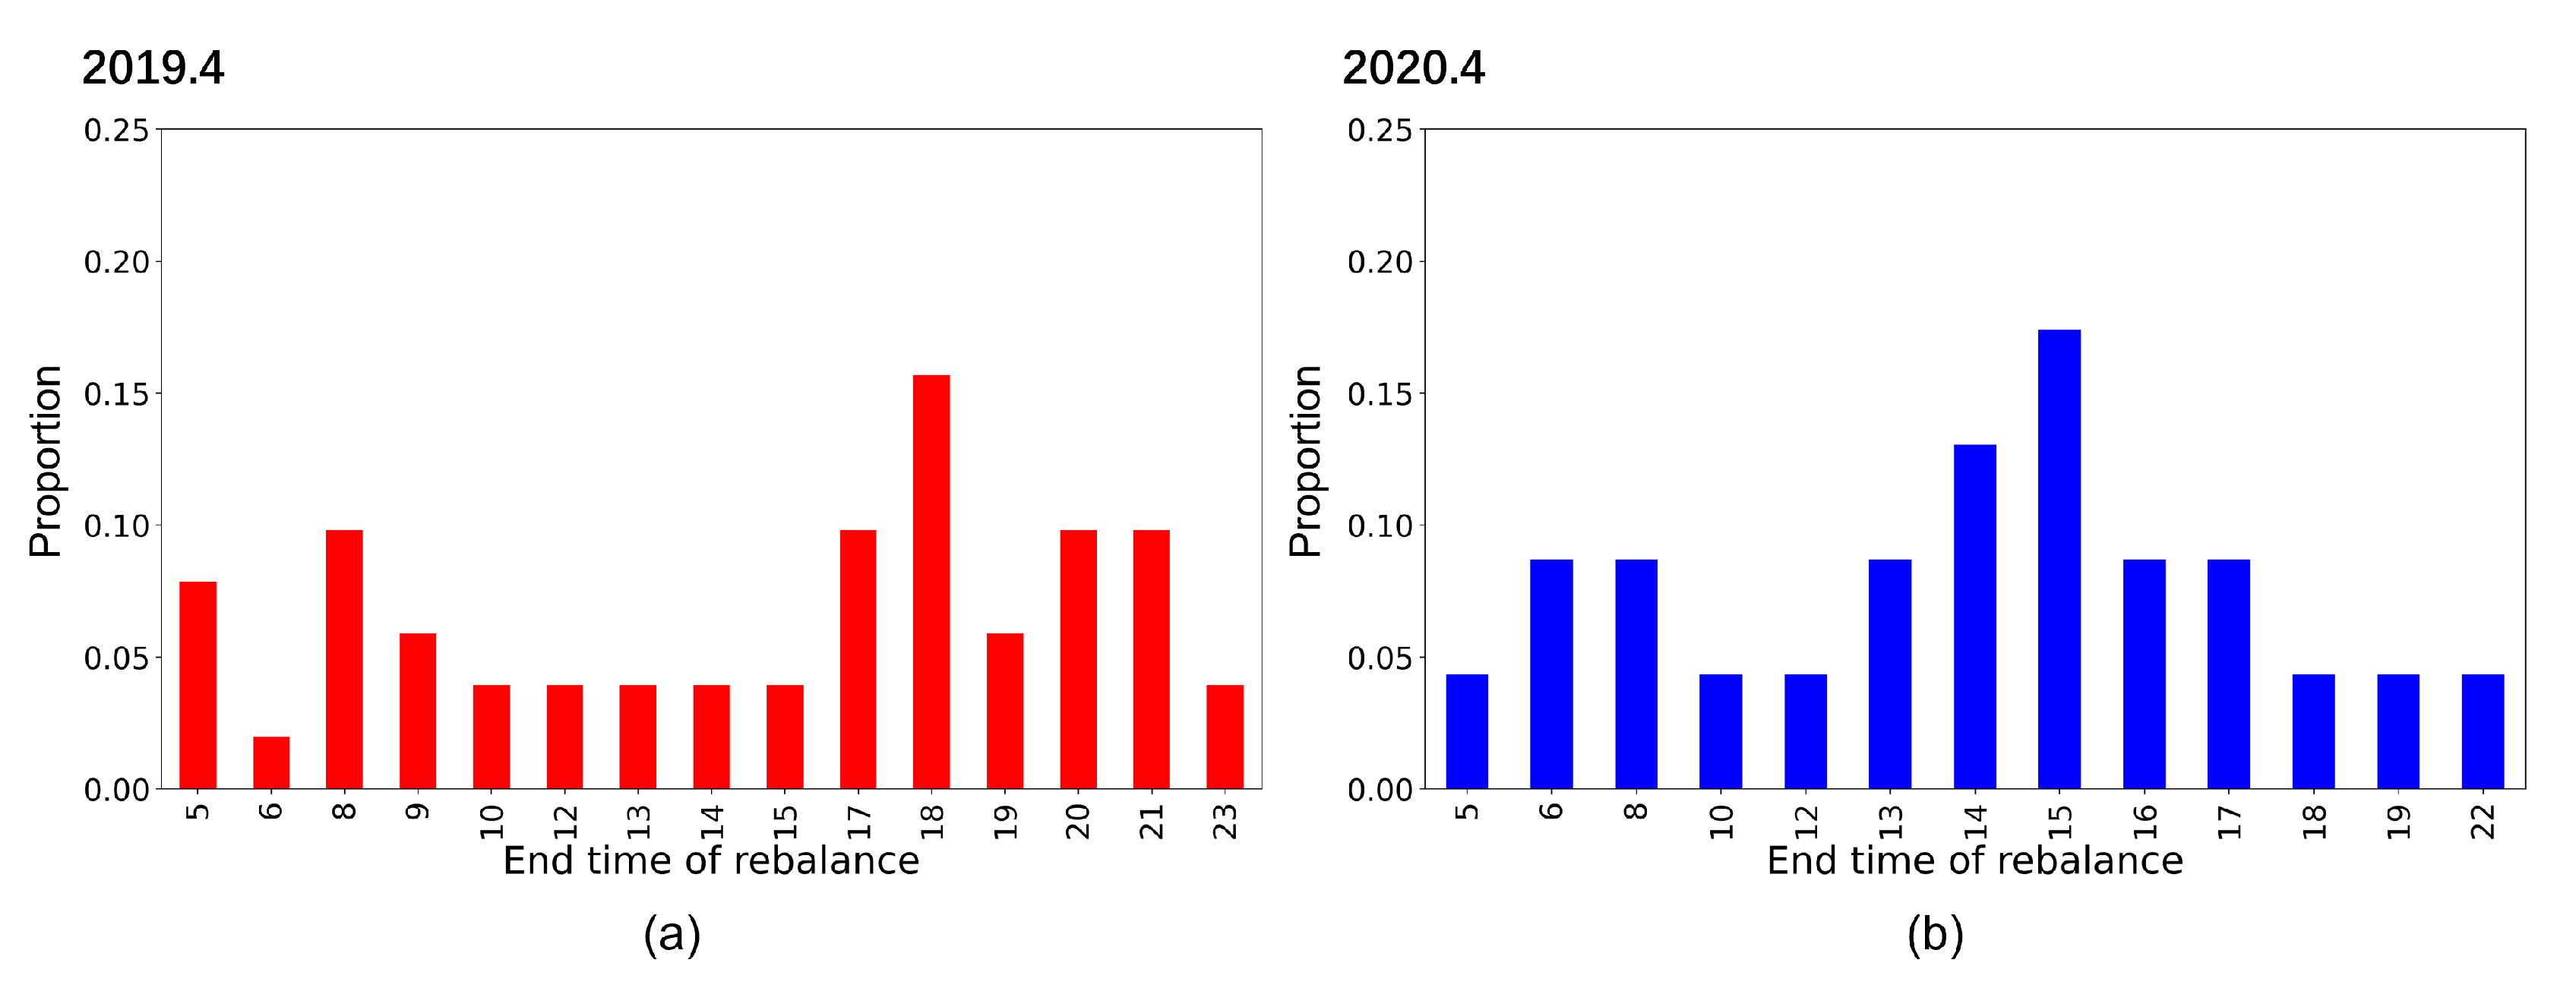
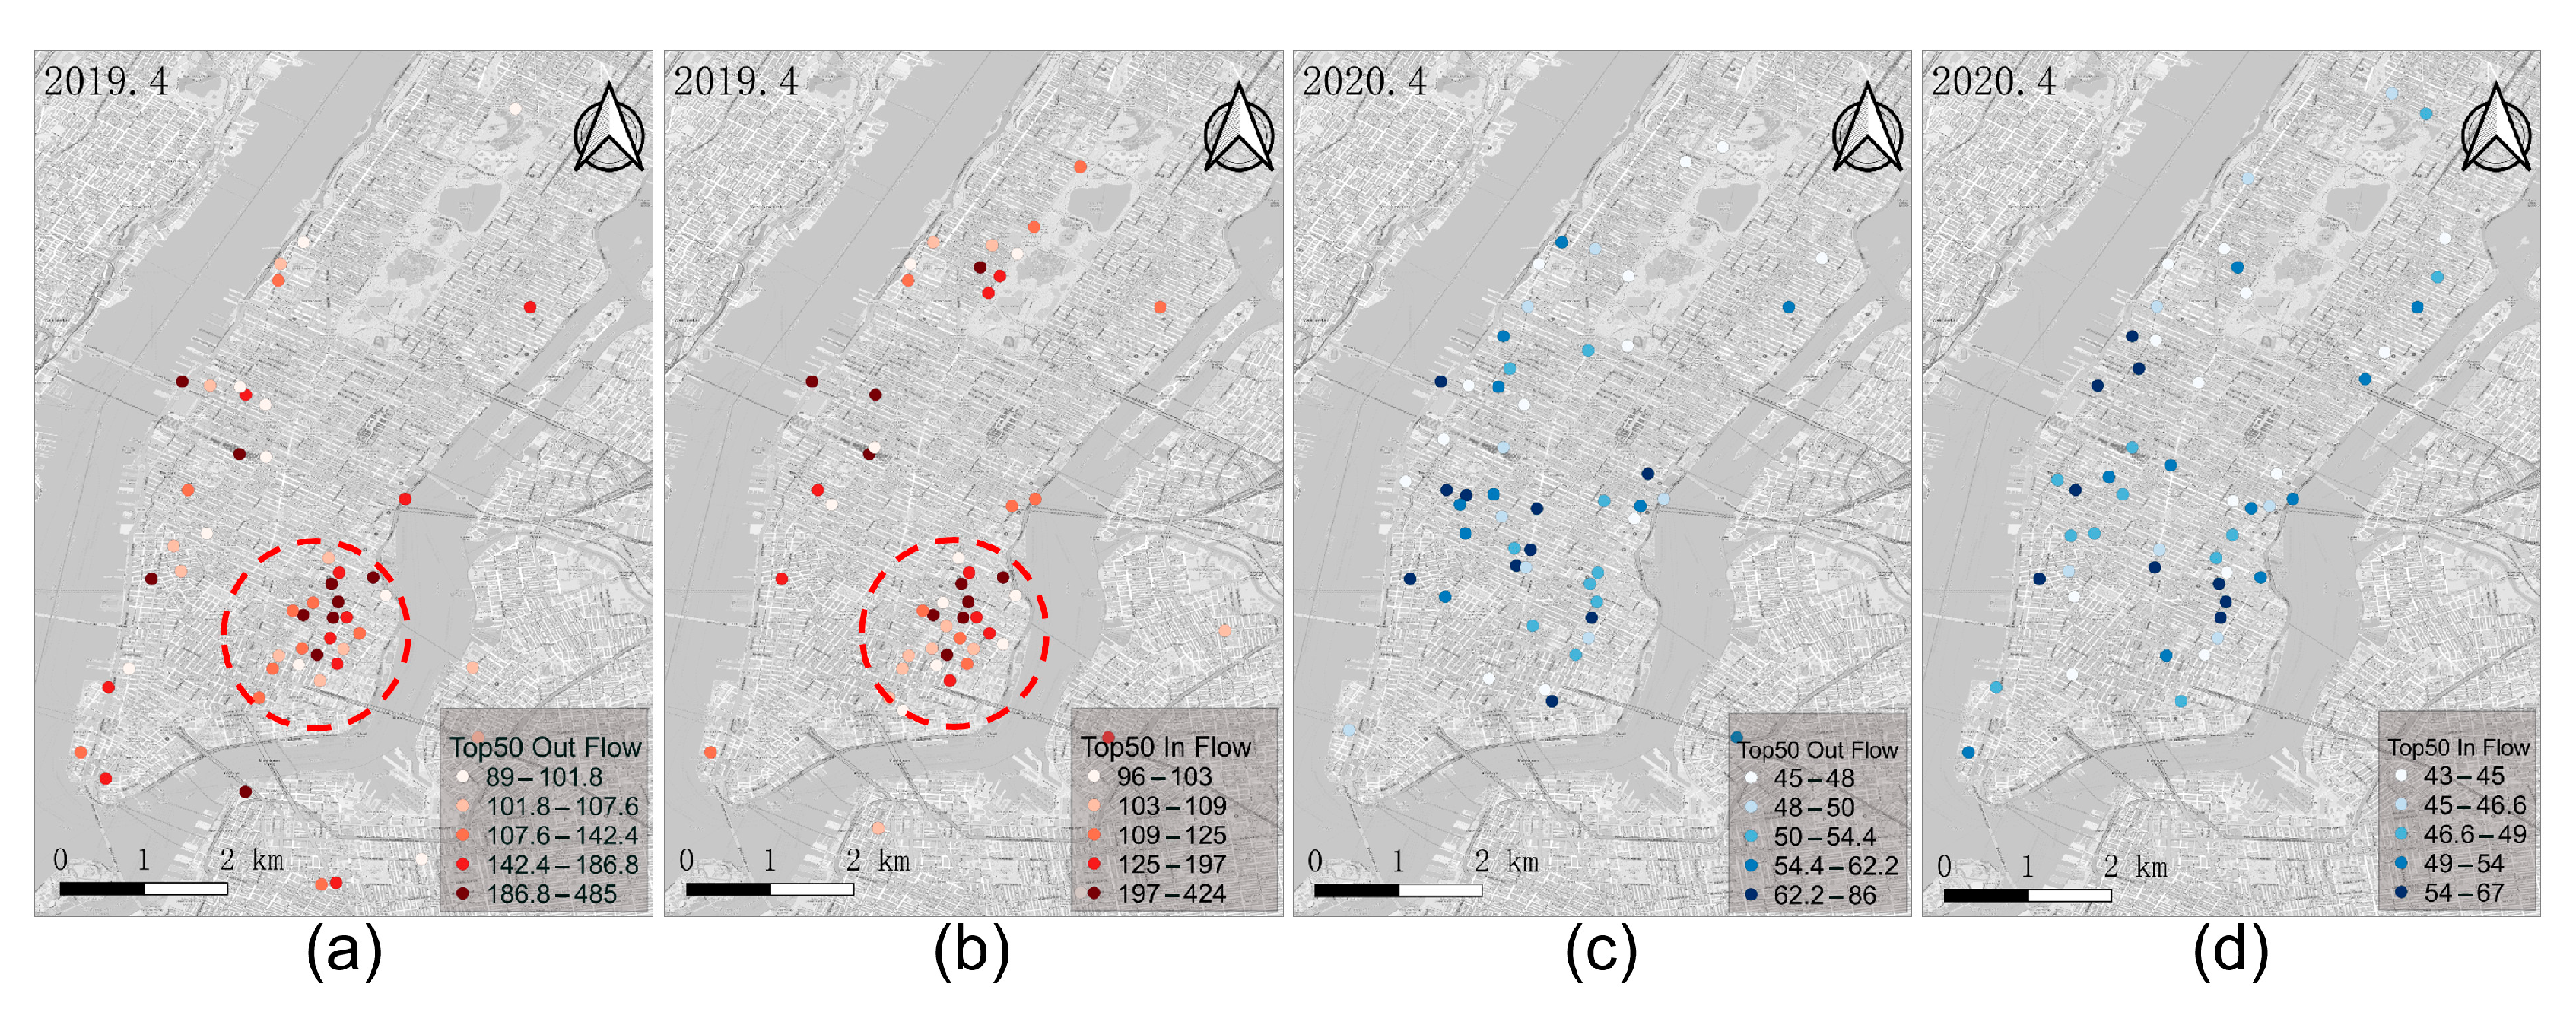
- (4)
In terms of rebalancing, the peak of timely rebalancing shifted from two commuting peaks in the pre-pandemic period to one peak in the afternoon during the early stage of the pandemic. The number of rebalancing operations in the early stage of the pandemic decreased significantly, but the ratio between the number of rebalancing and the total number of ridings increased significantly. By analyzing stations with the highest number of rebalancing, we found that such stations showed a certain spatial aggregation during the pre-pandemic period, while the spatial distribution was more dispersed during the pandemic.
Our research results could provide reference and assistance in decision making for different user groups during the pandemic, such as travel planning for citizens, operation scheme optimization for bike-sharing companies, and overall management of the government. For citizens, reduced trip flow and more dispersed riding distribution are beneficial for infection prevention and control during a pandemic. Riding activities take place in open spaces at a relatively safe distance, and their leisure function also provides a relatively healthy form of exercise for isolated living. Riding to medical treatment can also avoid, to some extent, close contact and virus transmission in the enclosed spaces of public transport. For bike-sharing companies, the more even riding flow distribution does not result in a good self-balancing system, with rebalancing demand becoming more dispersed and rebalancing rates increasing significantly. These problems challenge the company’s operations. Current rebalancing routes and strategies should be reconsidered to ensure that they can meet the special needs of this period. For the government, the spatiotemporal changes in main riding flows could provide a reference for policy-making during the pandemic, such as residents’ travel guidance and municipal service planning. Timely bike flow information disclosure could help residents avoid riding aggregation and reduce infection. In addition, the disinfection work should be further strengthened at the stations connected with the main flow.
Riding, which integrates commuting, leisure, and medical treatment during special periods, has great potential for application and may also provide useful assistance to urban recovery in the later stages of a pandemic. Considering that life in many places, including New York, is gradually returning to normal, our results can be used for reference in the following aspects: First, avoiding gathering riding is still an effective way to reduce infection and for self-protection when COVID-19 is not completely disappeared. Second, the leisure function of bikes provided an important mode of entertainment for people’s lives during the pandemic, which is worth continuing and promoting in the post-pandemic era. Last but not least, shared bike riding undertook many new tasks during the pandemic, the development and maintenance of people’s riding habits will be conducive to carbon emission reduction and environmental protection, and beneficial to sustainable life.
6.2. Limitations and Future Work
There are still some limitations in the current research, which need further studies. For instance, our research only focuses on the bike-sharing system, and especially the spatiotemporal variation characteristics of the main flows of bike-sharing. In the future, multiple transportation modes, such as subways, buses, and taxi cabs can be integrated to provide a more comprehensive understanding of people’s mobility behavior during the pandemic. In addition to pure mobility data, other types of data, such as pandemic data, land use data, and demographic data could be integrated to achieve more in-depth analysis. As a global pandemic, COVID-19 affected people’s lives around the world. The comparative study of mobility in different cities around the world supported by multi-source data can provide the differences in human activities affected by the pandemic in different places, policies, and cultural backgrounds, which is beneficial to understanding the global impact of the pandemic. This is also our future research direction.


