
A GIS-Based Multi-Criterion Decision-Making Method to Select City Fire Brigade: A Case Study of Wuhan, China


1
School of Environment Science and Spatial Informatics, China University of Mining and Technology, Xuzhou 221116, China
2
Key Laboratory of Water Cycle and Related Land Surface Processes, Institute of Geographic Sciences and Natural Resources Research (IGSNRR), Chinese Academy of Sciences (CAS), Beijing 100101, China
3
University of Chinese Academy of Sciences, Beijing 100049, China
4
School of Geomatics, Liaoning Technical University, Fuxin 123000, China
*
Author to whom correspondence should be addressed.
†
These authors contributed equally to this work.
ISPRS Int. J. Geo-Inf. 2021, 10(11), 777; https://doi.org/10.3390/ijgi10110777
Submission received: 22 September 2021
/
Revised: 4 November 2021
/
Accepted: 12 November 2021
/
Published: 15 November 2021
Abstract
:Rapid urban expansion has brought new challenges to firefighting, with the speed of firefighting rescue being crucial for the safety of property and life. Thus, fire prevention and rescuing people in distress have become more challenging for city managers and emergency responders. Unfortunately, existing research does not consider the negative effects of the current spatial distribution of fire-risk areas, land cover, location, and traffic congestion. To address these shortcomings, we use multiple methods (including geographic information system, multi-criterion decision-making, and location–allocation (L-A)) and multi-source geospatial data (including land cover, point-of-interest, drive time, and statistical yearbooks) to identify suitable areas for fire brigades. We propose a method for identifying potential fire-risk areas and to select suitable fire brigade zones. In this method, we first remove exclusion criteria to identify spatially undeveloped zones and use kernel density methods to evaluate the various fire-risk zones. Next, we use analytic hierarchy processes (AHPs) to comprehensively evaluate the undeveloped areas according to the location, orography, and potential fire-risk zones. In addition, based on the multi-time traffic situation, the average traffic speed during rush hour of each road is calculated, a traffic network model is established, and the travel time is calculated. Finally, the L-A model and network analysis are used to map the spatial coverage of the fire brigades, which is optimized by combining various objectives, such as the coverage rate of high-fire-risk zones, the coverage rate of building construction, and the maintenance of a sub-five-minute drive time between the proposed fire brigade and the demand point. The result shows that the top 50% of fire-risk zones in the central part of Wuhan are mainly concentrated to the west of the Yangtze River. Good overall rescue coverage is obtained with existing fire brigades, but the fire brigades in the north, south, southwest, and eastern areas of the study area lack rescue capabilities. The optimized results show that, to cover the high-fire-risk zones and building constructions, nine fire brigades should be added to increase the service coverage rate from 93.28% to 99.01%. The proposed method combines the viewpoint of big data, which provides new ideas and technical methods for the fire brigade site-selection model.
1. Introduction
In this era of rapid economic development in China, the expansion of cities and the increasing building density have increased demand for public services [1]. In recent years, urban development has decelerated, so more urban resources have been dedicated to improving the quality of public services within cities [2]. The fire-protection rescue service is a key service to ensure urban safety and strongly affects the personal and property safety of residents [3].
Judging from the classification of the fire brigade’s outings in 2020, a total of 395,000 instances of population rescues were undertaken, and 251,000 instances of fires were extinguished [4]. Population rescues include helping people in distress, eliminating danger, and handling traffic accidents. The above data show that the number of population rescues exceeds the number of fires, so a quick response is needed to resolve problems in time and increase the population’s sense of security. Fires are one of the most serious disasters known, which seriously threaten public security and social development [5,6]. From 2007 to 2020, about 314 million fires occurred in China, causing property losses of CNY 36.8 billion and 20,439 deaths [4]. Notable examples include the explosion in Tianjin Binhai New Area in 2015 and the fire in Changchun, Jilin in 2021. These fire incidents seriously affected economic activity and reveal the complexity and difficulty of fire rescue [7]. Given this context, the rational location of fire brigades is of vital importance because it can reduce losses by shortening the emergency response time. Therefore, to improve urban fire-rescue services and thereby alleviate the seriousness of rescue events, it is crucial to study the spatial site selection of urban fire brigades.
The functioning of urban areas is becoming increasingly diverse, with frequent changes in building functions and the influx of large non-local populations, resulting in excessive population density. A typical result is the emergence of zones with “all-in-one” functions, such as production, accommodation, and factories. At the same time, the complex distribution of urban functional zones such as industrial parks, residential areas, hospitals, and schools also produces differentiated and population rescue that produce different rescue requirements for fire brigades. In addition, the overall fire risk is the integration of the fire risks of all the different functional zones.
When considering the accumulation of urban fire risks and population rescue, one quickly finds a variety of new rescue problems. Concomitantly, the unique characteristics of high-rises, underground constructions, and large-scale buildings in today’s megacities have greatly increased the difficulty of fire rescue [8]. In this context, the uncertainty and uncontrollable factors involved with fires have increased significantly, making fire prevention and control more complex [9].
The location and layout of traditional fire brigades are divided mainly according to the nature of the land, as determined by city planners, with fire brigades at the center and the five-minute-travel-time distance serving as the radius. However, within the area of responsibility of a fire brigade, researchers tend to ignore factors that may affect fire risks, such as land cover, road width, building density, vehicle speed, and the potential for fire events and population rescue. In addition, the insufficient number of fire brigades in existing cities means that fire-rescue services lag behind actual needs [10]. This state of affairs may significantly hinder fire-rescue services, and new ideas are urgently needed to resolve this problem by providing a scientifically sound method to position urban fire brigades.
The literature records a long history of research into the site selection of public facilities. In 1909, Weber introduced the “Weber Problem” to discuss the location of warehouses and launched theoretical research into location selection. To minimize the economic loss caused by fire and the cost to the fire brigade of their rescue services, Hogg [11] argued in 1968 that the most important decision faced by firefighters was how many fire brigades to have and where to build them. In 1975, Helly [12] argued that the most important attribute of fire brigade location should be that it minimizes emergency response time, which served as the basis of the fire brigade location model. This factor was used as the basis for the fire brigade site-selection model developed by Plan and Hendrick [13], who used response time as the coverage criterion and applied the theory of site selection set coverage (LSCP) to the site-selection problem. In 1985, Reilly and Mirchandani [14] located P stations from M candidate stations to maximize certain functions of the travel time of the first- and second-arriving fire units under several constraints. Habibi et al. [15], Erden et al. [16], and Chaudhary et al. [17] used an analytic hierarch process (AHP) and geographic information systems (GISs) to select sites and analyze the optimization in various urban areas. Chen et al. [18] proposed a simple way to optimize the location of fire brigades. This method minimizes the average driving distance for fire trucks, which is calculated by abstracting the fire brigade coverage area as a “node”. Murray et al. [19] formed the maximum coverage location problem (MCLP) to study the site selection of fire brigades in California, USA, and proposed a system planning strategy for fire protection. Owen et al. [20] divided the location problem into a median problem (p-median), a center problem (p-center), a location set covering problem (LSCP), an MCLP, and a maximal capacity covering location problem. Badri et al. [21] considered multiple goals, which include travel time and travel distance from facilities to demand points. This model also considered the technical policies and standards. After extensive direct interaction with decision-makers, the model and experiments were designed to improve our understanding of the positioning of fire brigades.
The analysis of Chevalier et al. [22] involved multiscale GISs, which included a comprehensive representation of physical, human, and economic realities, risk-modeling methods, and an appropriate optimal location and allocation model (considering queuing and staffing issues). Cath [23] chose to evaluate the fire brigade and rescue vehicles and analyzed the logical relationship with these elements in determining the location of the fire brigade. Yang et al. [24] combined fuzzy multi-objective programming and a genetic algorithm to determine the location of fire brigades, whereas Schreuder et al. [25], Kanoun et al. [26], and Liu et al. [27] selected the location of fire brigades according to the actual situation in different regions. Other groups have approached this problem with methods such as the particle swarm algorithm [28] and the ant colony algorithm [27].
This review of previous research shows that location–allocation (L-A) models (e.g., LSCP, MCLP, p-center, and p-median) and GIS technology have been widely used to position fire brigades. However, the existing research is problematic: First, the current urban construction is rarely considered in the site-selection and space-optimization analysis of fire brigades. Second, the lack of detailed building structure information means that existing methods usually simulate fire events occurring on simplified plots or blocks without distinguishing between the functional heterogeneity of different buildings and the differences within the buildings. Third, detailed information on the transport network is rarely considered in site selection and spatial optimization.
The development of computer science and the Internet has led to numerous geospatial data [29,30,31,32,33,34], which are available in the form of point-of-interest (POI) data, Baidu Maps, and other data formats. POI data are point data of real geographical entities and include attribute information such as longitude and latitude, address, and name. POI data are very important for city managers and emergency responders to make strategic and operational decisions [30,35]. POI data have the advantage of fast update speed, detailed content, a large amount of data, wide coverage, and low acquisition cost. Therefore, this study uses POI data to assess urban fire risk and thereby address the problem mentioned above of a lack of detailed information on building construction. Finally, Baidu Maps are used to obtain traffic network data to address the third problem mentioned above regarding the transport network.
In this context, a method combining GISs with multi-criterion decision-making (MCDM) is proposed to identify the most suitable zones for fire brigades. This research aims to solve the limitations of the existing L-A model by integrating three sets of information obtained from emerging geospatial datasets: (i) land-cover data, (ii) potential fire risk levels from POI data, and (iii) average traffic data from Baidu Maps that are accurate to the road scale.
2. Materials and Methods
2.1. The Case Study
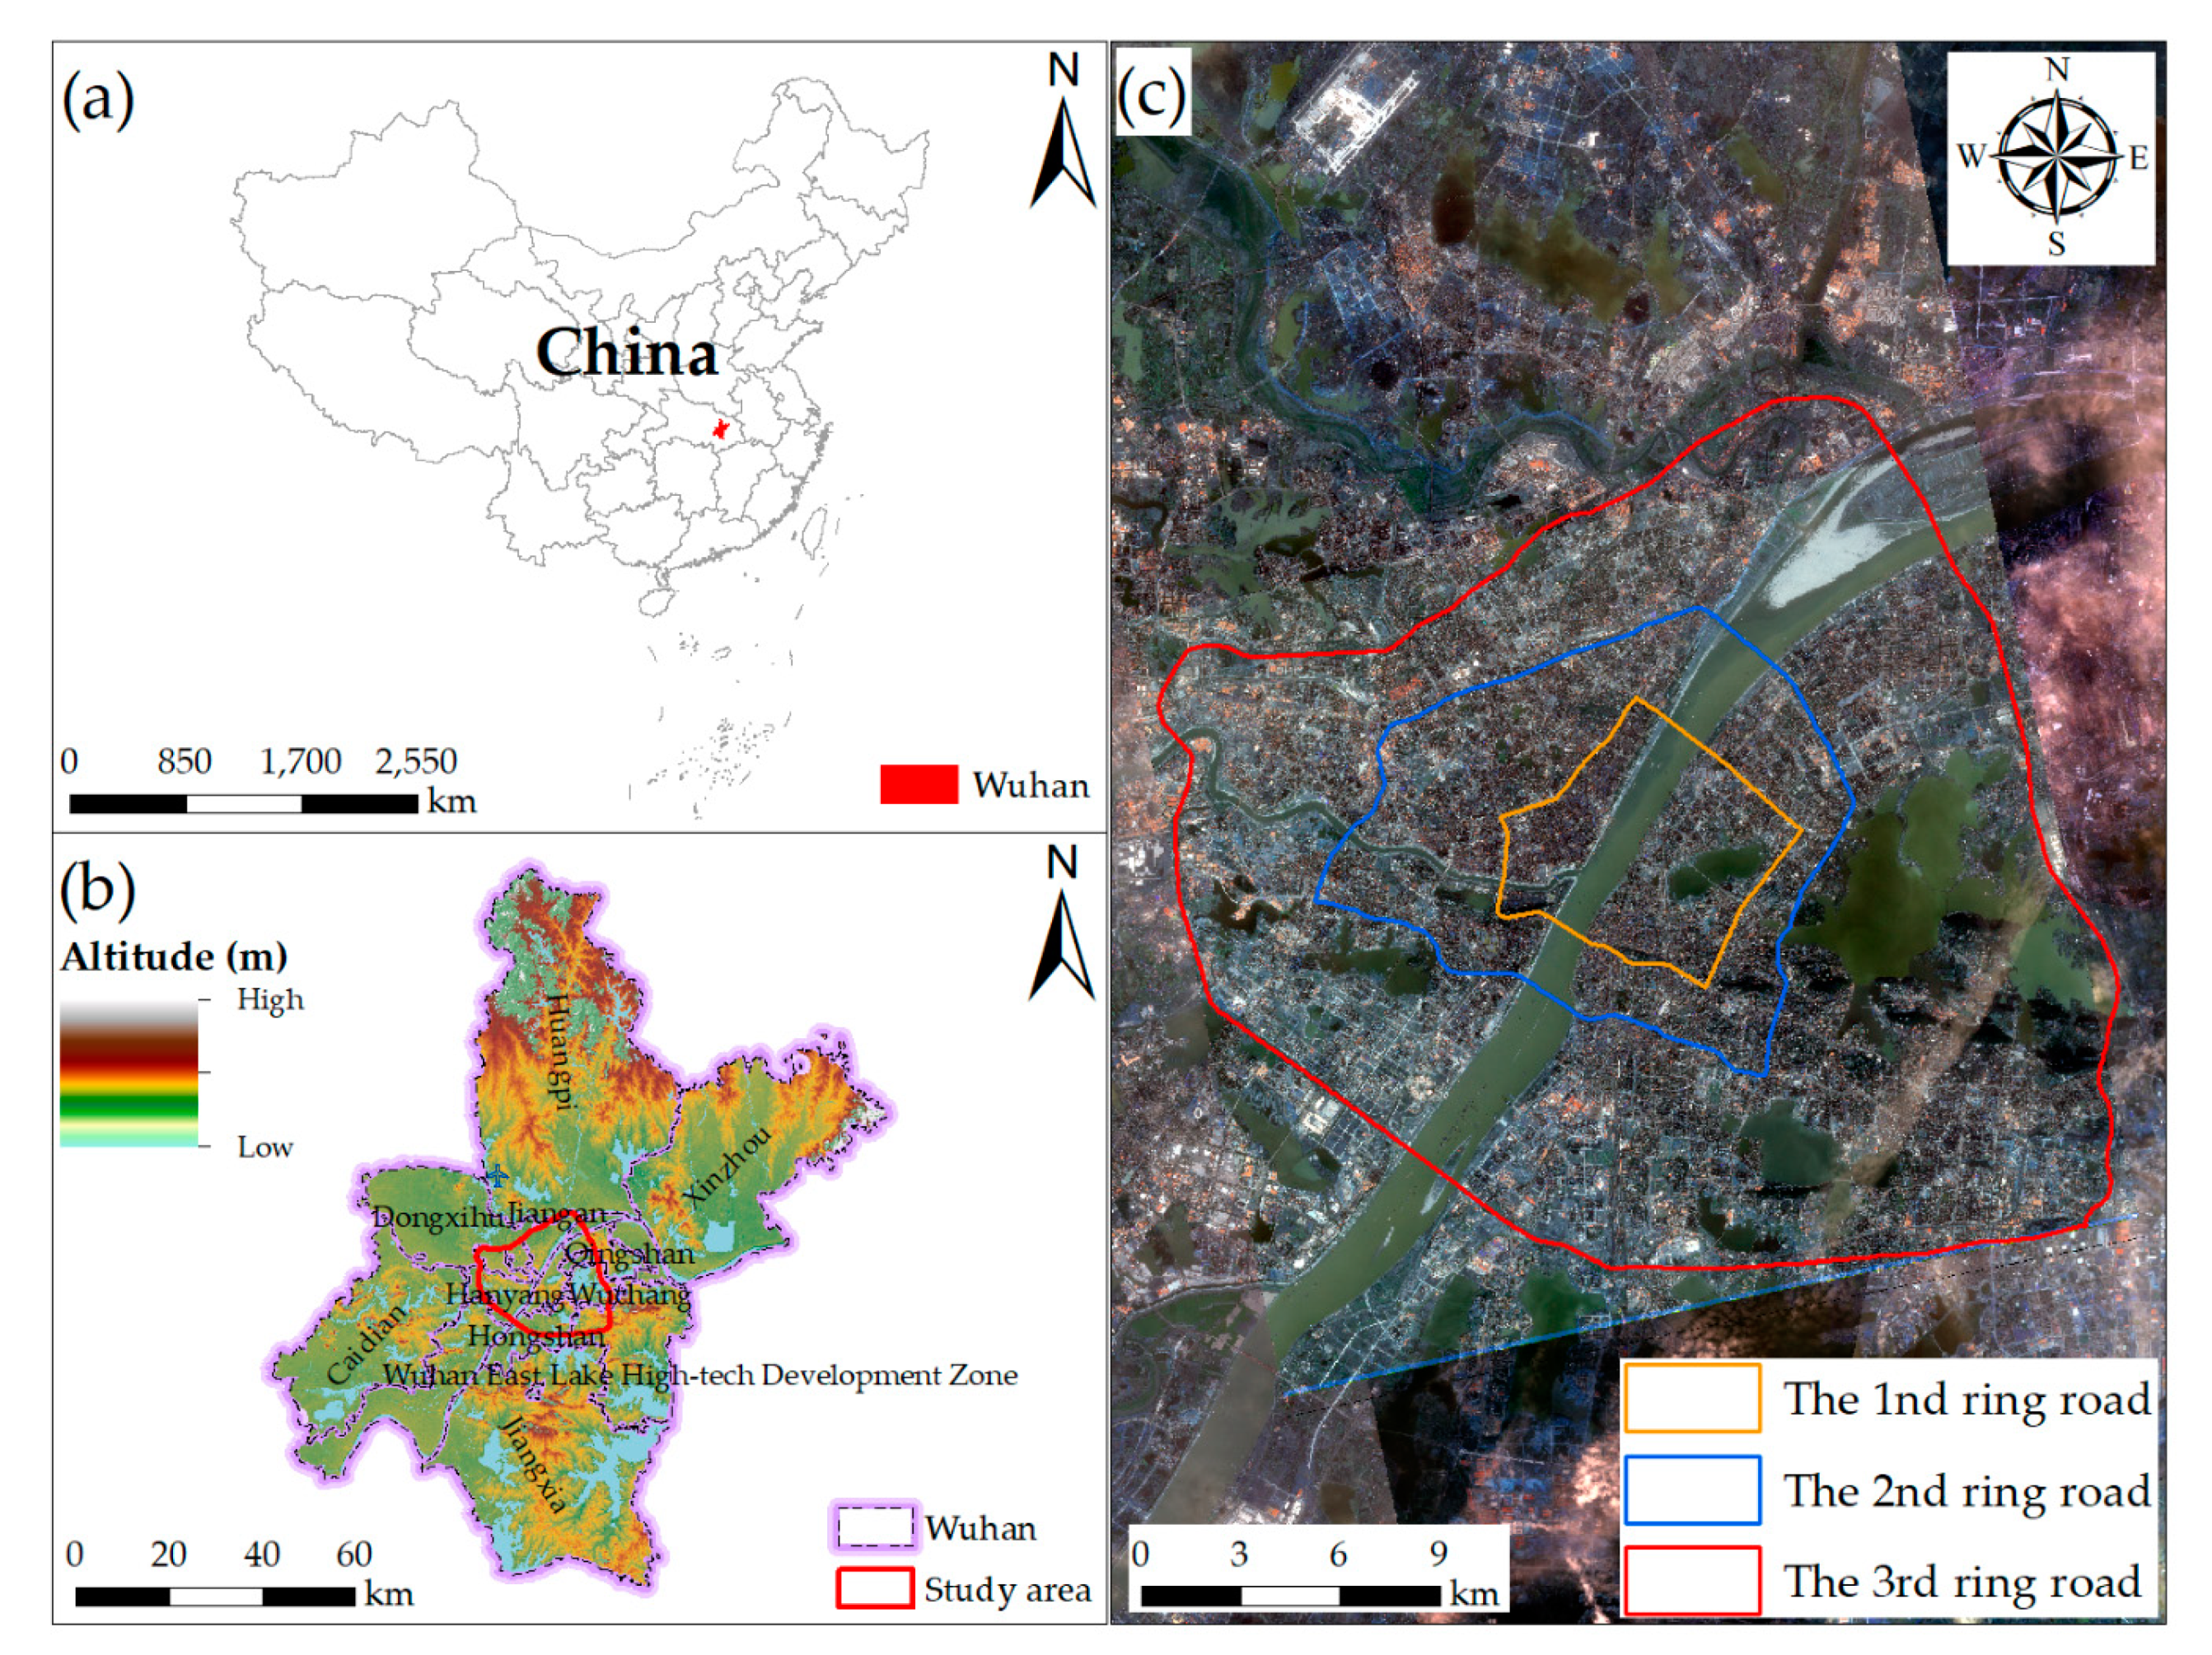
Wuhan is the central city of Hubei Province, China (Figure 1) and the core city of the Yangtze River Economic Belt. It is the strategic fulcrum for the rise of central China and a pilot area for comprehensive innovation and reform. According to the 2020 Wuhan Statistical Yearbook [36], Wuhan has 13 districts covering a total area of 8569.15 km2, a permanent population of 12.32 million, and a GDP that will reach CNY 1.56 trillion (USD 242 billion). As one of the hottest cities in China, Wuhan’s maximum temperature is 37 °C–39 °C, and its minimum temperature is 29 °C–30 °C. Being a typical global mega-urban center, Wuhan has the associated fire problems. Considering the availability of data, we choose as the study area the central urban area of Wuhan (i.e., the area within the third ring road of Wuhan, China) (Figure 1c), which is the political center and the center of foreign exchange countries. It has an important social status and includes all functional core areas. To adapt to the rapid population growth in Wuhan, the appearance of the study area has changed in recent decades. The city is now characterized by its large population, developed economy, and dense construction, and new communities and regions have appeared. These phenomena have contributed to an increase in fire events. Thus, the selection of Wuhan central city as the study area for fire brigade location has important social significance and should serve well for demonstrating the proposed method.
2.2. Methodology
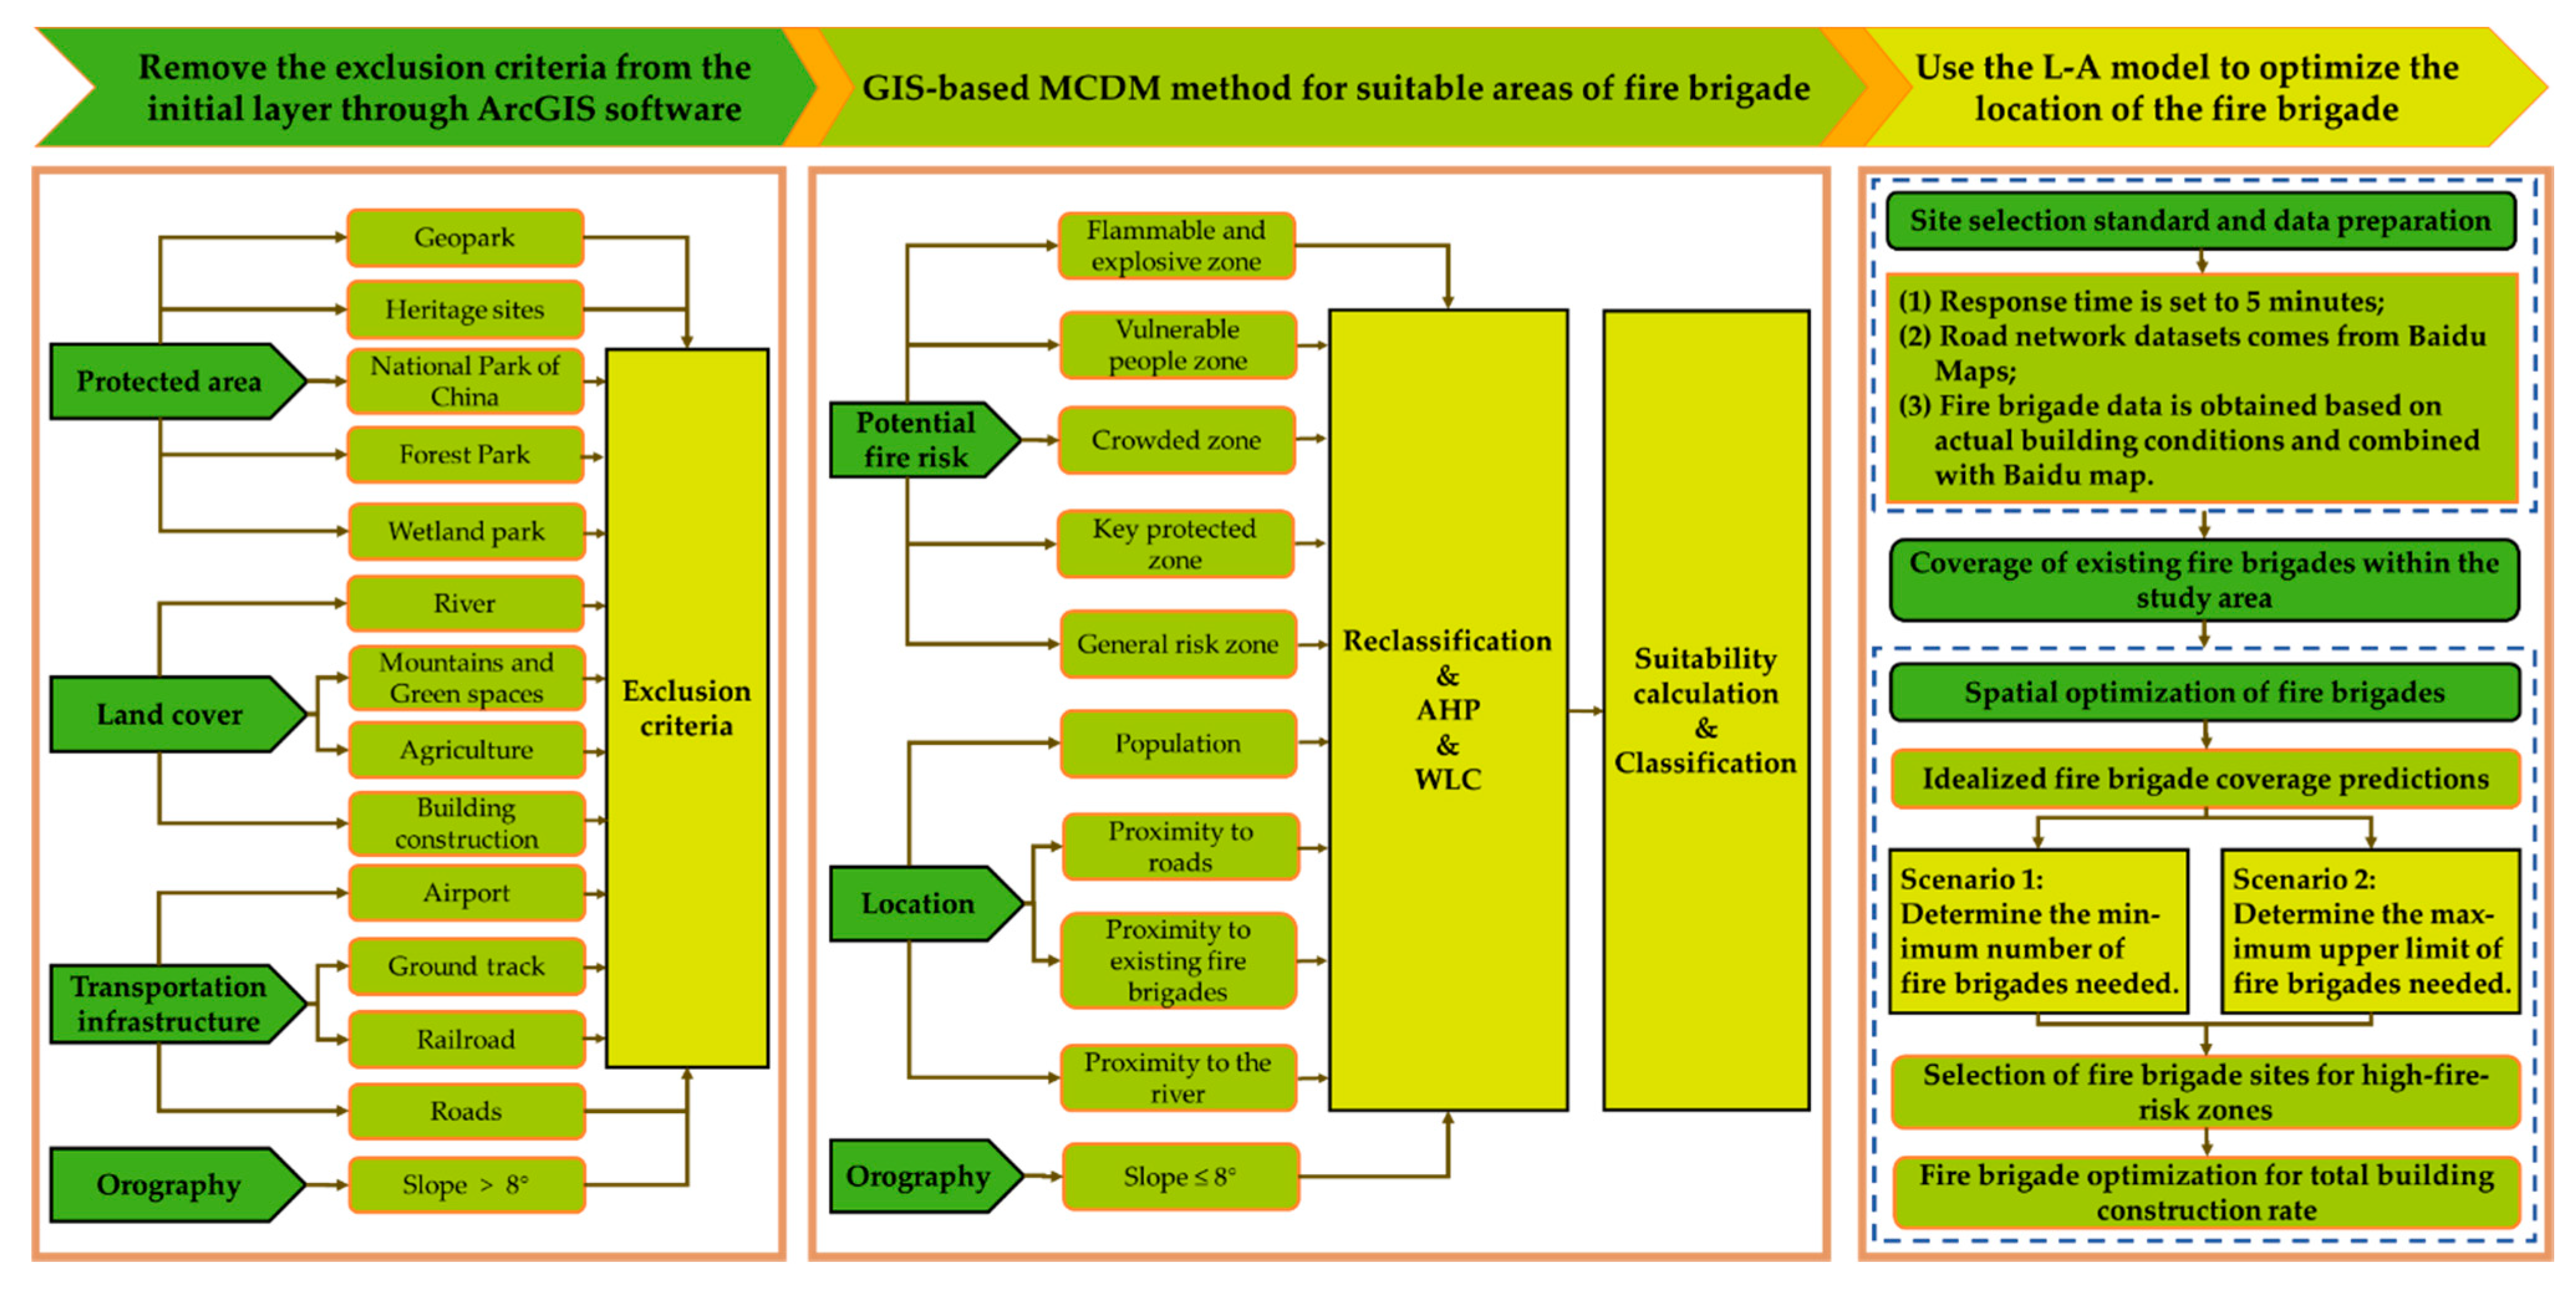
In this research, MCDM and GIS are combined to evaluate the most suitable locations to construct fire brigades. Figure 2 shows the framework of the proposed method. The method consists of five main steps: First, we use various high-resolution GIS databases to remove unsuitable layers from the initial layers according to the exclusion criteria. Second, in view of the differences in the types of fire risks, the POI data are divided into five types of standard fire risks. Third, three evaluation standards (including six sub-standards) are proposed for suitable zones for constructing fire brigades. Fourth, we combine AHP and GIS to determine the most suitable areas for fire brigades and produce a map showing the distribution of the suitable and unsuitable areas for fire brigades. Finally, we use the L-A model to analyze the rescue capability of existing fire brigades and determine whether it meets the city’s fire safety goals based on the site selection.
2.2.1. Exclusion Criteria
Areas that are not suitable for fire brigade construction due to terrain and legal factors need to be removed from the initial map layer by using ArcGIS software. By analyzing the actual geographic coverage in the study area, the following exclusion factors are deemed desirable: EC1 (protected area), EC2 (land cover), EC3 (transportation infrastructure), and EC4 (orography).
(EC1) Protected area. According to the definition of the International Union for Conservation of Nature, a protected area is a geographical space that is recognized, dedicated, and managed by law or other effective means to achieve the long-term protection of nature. It produces relevant ecosystem services and has cultural value [37]. For example, the wetland reserve, known as the “Kidneys of the Earth”, plays an important role in species protection and environmental regulation. The total area of the Wuhan East Lake National Wetland Park is about 10.2 km2, of which the water area is 6.5 km2. Human activities have led to the destruction of wetlands, and many endemic species are on the verge of extinction. The area of wetland bird habitat is decreasing year by year, which is not conducive to the habitat or the reproduction of birds. Therefore, the government has strengthened the protection of wetlands and prohibited the destruction of wetlands. The data on the protected area are obtained by interpreting remote sensing images.
(EC2) Land cover. Considering that significant surface area is required for the construction of fire brigades, we analyze the land that can be used for the construction of fire brigades based on the existing surface coverage distribution. Given the strict environmental and ecological regulations, fire brigades cannot be constructed on lands containing forests, farmland, buildings, or rivers. The rapid collection of varying data is at the core of the global land cover data update. The rise of Volunteer Geographic Information (VGI) provides a new way to solve this problem. In the current VGI project, OpenStreetMap (OSM) has the advantages of rich data and strong reality and can be used as a source of reference information for global land cover data updates. However, OSM data do not directly correspond to the incremental data of land cover. Therefore, the present work is based on the 2020 Wuhan geographic monitoring data and Google image data to verify topological relationship errors and editing errors and implement the modifications to obtain the land cover data.
(EC3) Transportation infrastructure. Affected by the feasibility area, the existing airport area, highway area, and railway area are also selected as exclusion factors for traffic safety. This study collected road and railway network data from the OSM database.
(EC4) Orography. Considering the time and money spent by fire brigades for training, construction, and fire rescue, flat terrain is more desirable for the construction of fire brigades than steep slopes. In the literature, the ground slope for a fire brigade should not exceed 8° [38]. Thus, we apply a conservative threshold of 8° for building a fire brigade. Information on slope and elevation comes from the NASA Space Shuttle Terrain Mission digital elevation model and has a resolution of 30 m.
2.2.2. Fire-Risk Zone
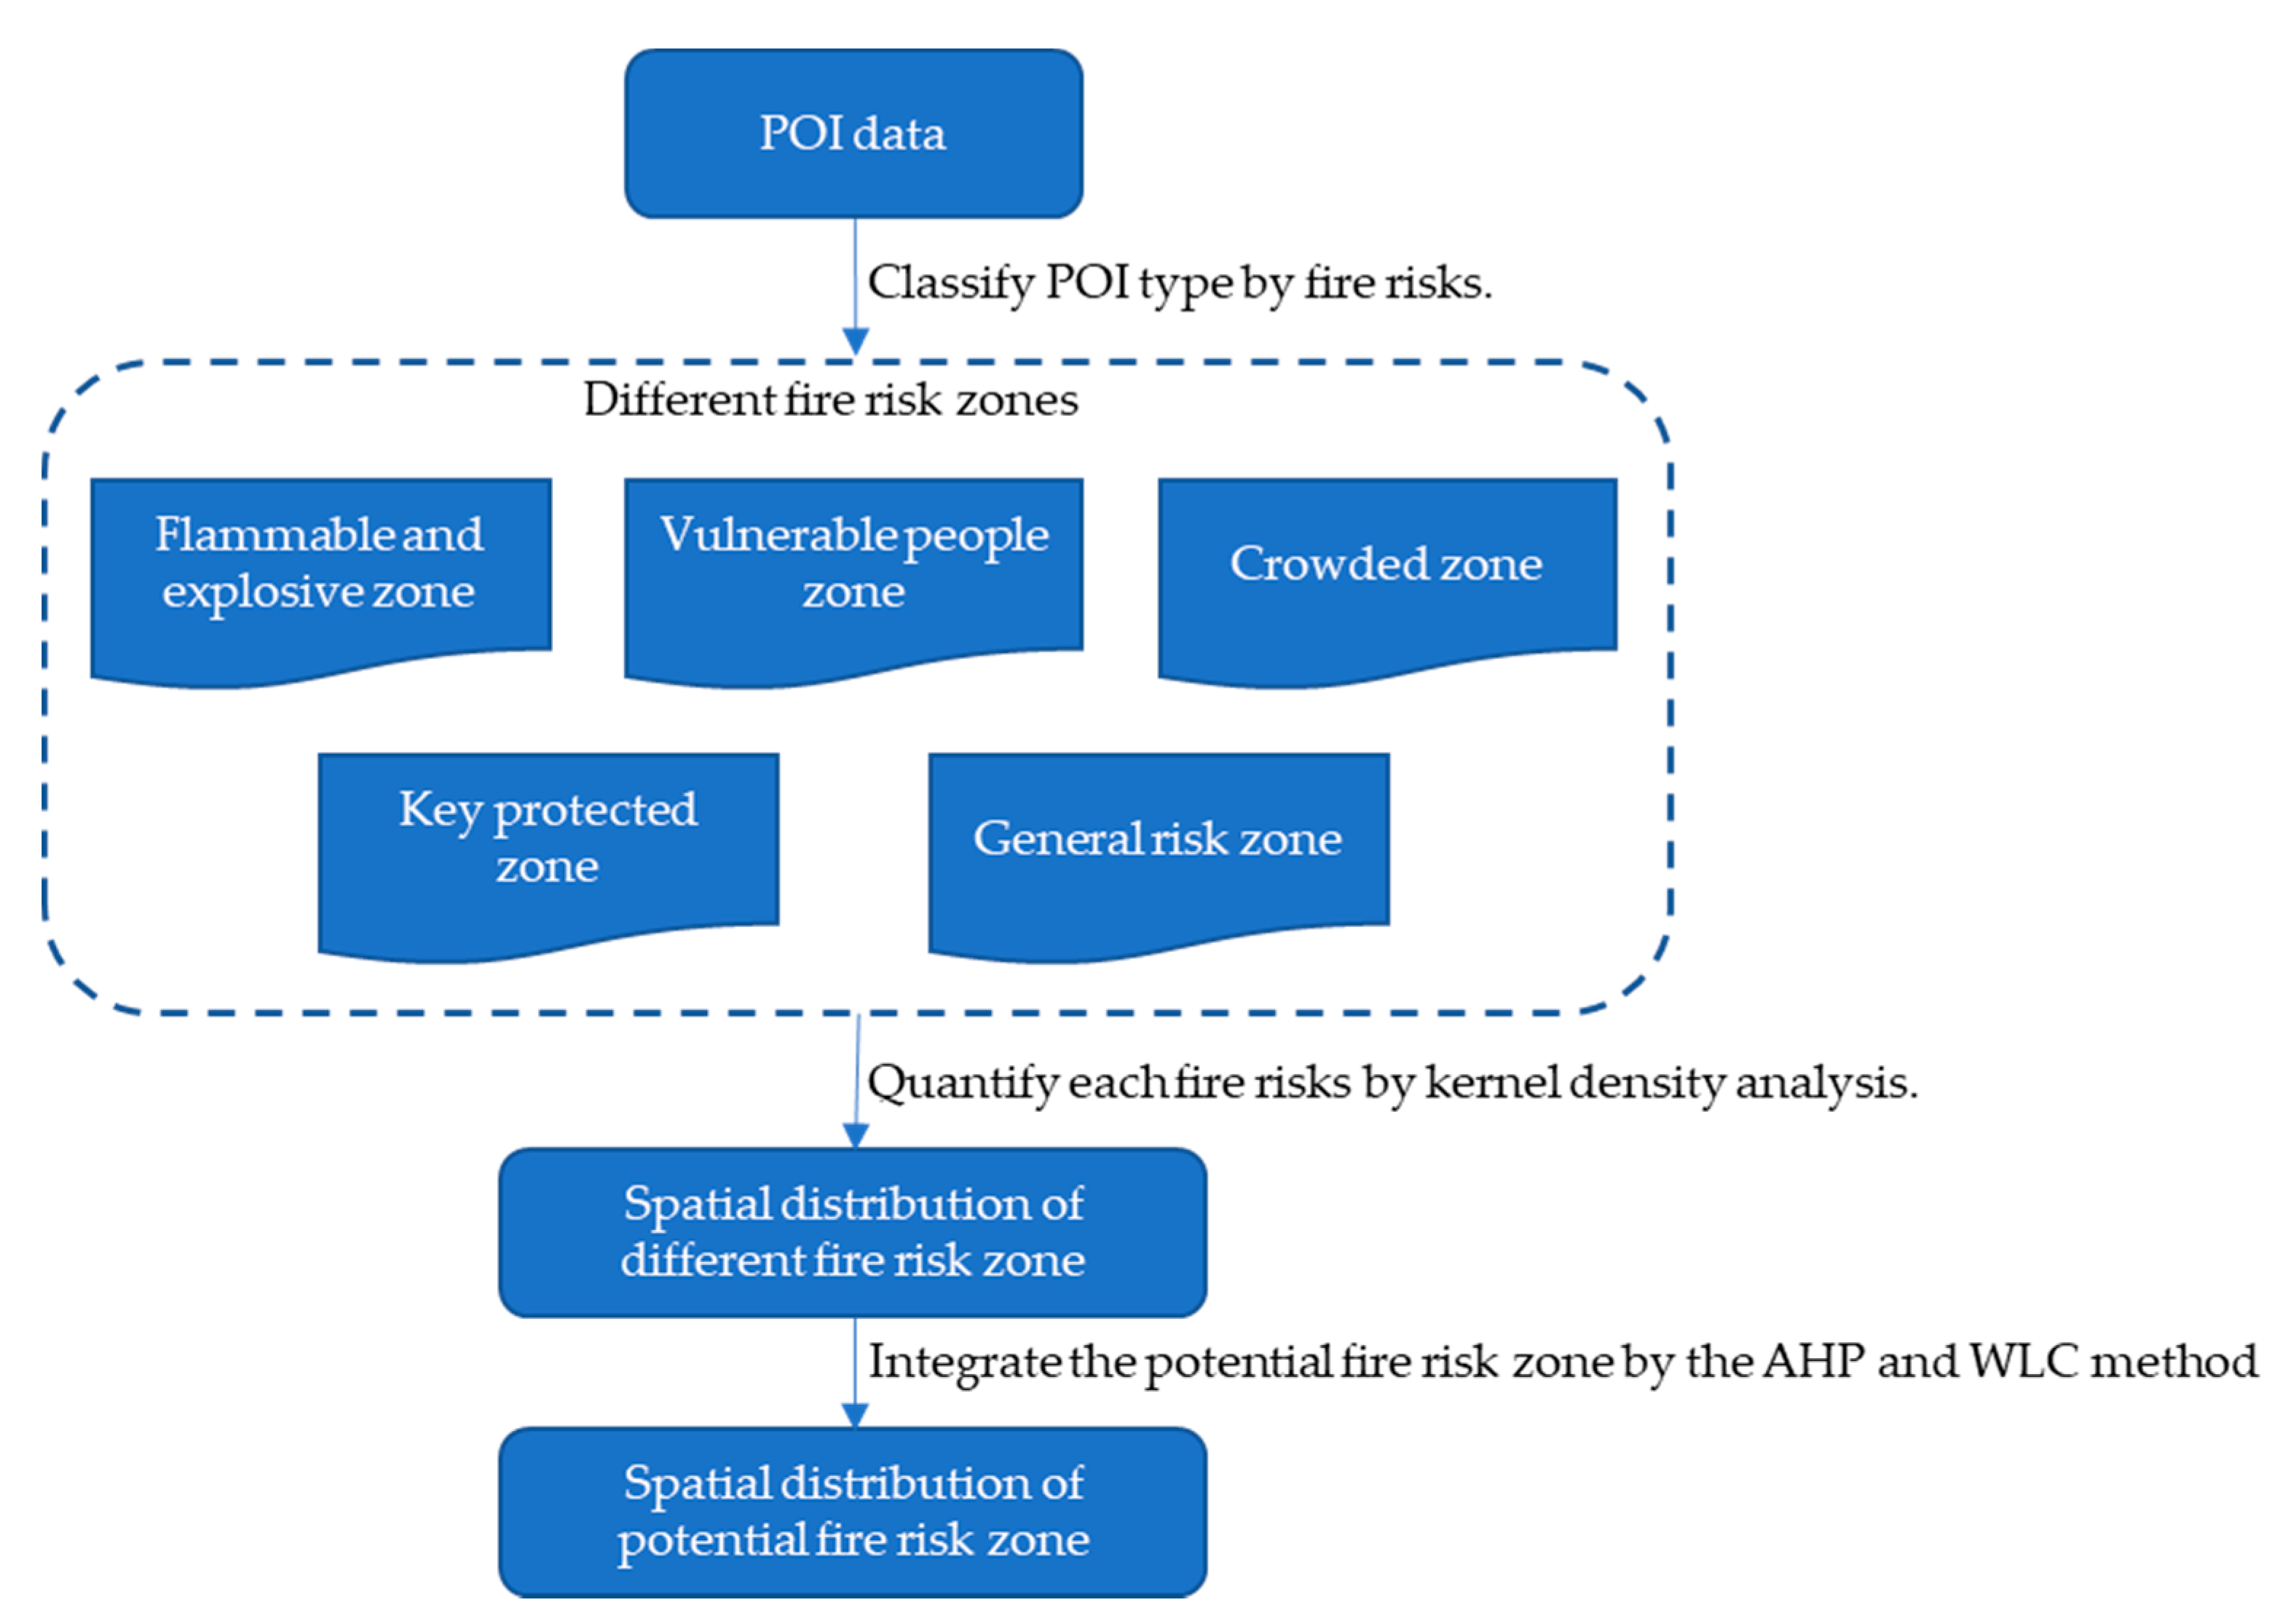
First, the POI data of different spatial areas are divided into five fire-risk zones as a function of building types. Next, we apply a nuclear density analysis to quantify the spatial distribution of the different fire-risk areas. Finally, the weight of the fire-risk areas is determined through the AHP, following which they are integrated using the weighted linear combination (WLC) method to obtain the total potential fire-risk zone. Figure 3 shows the framework of the method.
- (1)
- Classifying point-of-interest type by fire risk
Fire-risk analysis is the basis of special fire planning, which helps to understand the fire-risk status of the city. However, China’s urban fire-risk assessment method is still in its infancy, so the basic data required are insufficient. Therefore, to determine the location of the fire-risk zone, we must first select the best units for spatial analysis. For traditional spatial analysis units, the recognition of building types is not sufficiently accurate, so urban building plots are often used as the analysis unit. With this approach, multiple functional facilities may occupy a given building, such as supermarkets, factories, and residencies [3]. To solve this problem, we use POI data as the fire spatial analysis unit.
Existing research mainly considers the possibility of fire risks faced by the target object, the fire response conditions, the vulnerability of the target object, the severity of the consequences, and the impact on the economy and society [39]. The present work considers the functions served by the different types of spaces in combination with the “Code of City Fire Protection Planning” (GB51080-2015) and other existing research results. For different types of POIs (e.g., attribute functions and social activities), the POI data type is divided into five fire-risk zones according to the fire intensity, damage degree, number of casualties, and disaster resistance safety of the refuge; see Table 1.
As shown in Table 1, the first fire-risk zone is the “Flammable and explosive zone”, which refers to places with greater fire hazards such as chemical plants and gas stations, where secondary fires and explosions often occur. The second fire-risk zone is the “Vulnerable-people zone”, which refers to places where more vulnerable populations generally congregate, such as elementary schools and hospitals. If a fire occurs in such a zone, it may cause serious physical and mental injury to these populations. The third fire-risk zone is the “Crowded zone”, which refers to important transportation hubs and commercial centers, where it is easy to form the so-called “floating population”, which refers to the flow of people through a given geographic space. The characteristics of large flows of people lead to trampling and other casualties in the event of fire. The fourth fire-risk zone is the “Key protection zone”, which refers to highly protected areas such as government and historical buildings that may be irreplaceable or severely damage normal societal functioning in the event of a fire. Finally, the “General risk zone” refers to places that do not belong to the first four types of fire-risk zones, such as residential buildings and office buildings.
After classification, a kernel density analysis is applied to determine the spatial hot-spot distribution of each fire-risk zone and to quantify each fire risk, which is used to display the influence of the neighboring grid POI on the current grid elements and the distance attenuation effect. This method can analyze the spatial hotspot distribution map of each fire-risk area and numerically quantify each fire risk. The kernel density analysis method is a common method for analyzing the distribution of points and identifying hot spots [40,41]. The kernel density analysis tool calculates the value per unit area according to the elements (point or polyline elements) to fit each element to a smooth cone-shaped surface. The surface value is the highest at the location of the element; this value gradually decreases as the distance from the element increases, and the value is zero, where the distance from the element equals the default search radius. The default search radius (also known as the bandwidth) is calculated based on the space settings and the number of input elements. This method can be used to correct the spatial outliers caused by other input points that are very far so that the search radius is not too large [42].
- (2)
- Integrate fire-risk zone through Analytic Hierarchy Process and weighted linear combination models.
- Analytic Hierarchy Process
Choosing the most suitable evaluation system is a complicated problem that requires selecting different evaluation indicators, scientifically analyzing their weight, and deriving the most suitable solution. To address this problem, researchers often use the MCDM method [43,44,45,46]. MCDM is a widely used technology in the research community and allows researchers to choose the best option based on numerous criteria [47].
Of the numerous MCDM methods available, the AHP, developed by Saaty in 1977 [44], is the most used method to solve complex decisions involving many different criteria and is a popular tool for multi-standard decision-making [44,45]. The AHP is a mathematical and psychological research technique based on a series of pairwise comparisons to determine a standard weighting [48]. In addition, the AHP ensures consistent decision-making and reduces deviations in the decision-making analyses. Therefore, the AHP method is used to determine the weight of evaluation criteria for searching for fire brigade sites. At the beginning of each AHP, goals, alternatives, and standards must be defined, following which a pairwise comparison matrix M is generated.
Assuming that there are N criteria to determine the number of comparisons, the specific steps for applying AHP technology are as follows [49]:
A pairwise comparison matrix A (n × n) is established according to the expert’s judgment, where the element aij represents the intensity of importance of the standard i to standard j. Therefore, aji is the reciprocal of aij, representing the relative importance of standard j to standard i. The numerical scale 1–9 serves to measure the relative importance of pairwise comparisons, as shown in Table 2 [49], where “1” means equal importance of one standard relative to the other, and “9” means extreme importance of one standard relative to the other. Please refer to Ref. [49] for a more detailed explanation of the score.
To ensure the consistency of the calculated weights, pairwise comparisons need to be verified by the consistency ratio (CR). The formula is derived as follows:
- i.
- Calculate the maximum eigenvalue λmax of each comparison matrix.
- ii.
- Calculate the consistency index (CI) value by usingwhere λmax is the maximum eigenvalue of each comparison matrix, and n is the number of criteria or order matrix A.
- iii.
- Use Table 3 and the number n of standards used to obtain the random consistency index (RI) and then determine the CR by calculating the ratio of the CI to the RI:
The CR reflects the correctness of the program. When CR ≤ 01, the level of consistency is acceptable. If CR ≥ 0.1, the AHP may provide significant results [50]. RI represents the average deviation of randomly generated matrices of different sizes. After excluding restricted areas, the selected criteria serve to calculate and classify suitable sites. The CR for all comparisons is less than 0.1, which means that the results are satisfactory.
- 2.
- Weighted linear combination
In the ArcGIS software environment, WLC is a weighted overlay tool that generates raster layers [48]. A weighted superposition is a simple analysis method that combines superpositions, and that belongs to the field of binary statistical analysis, which uses binary statistics to analyze the significance of factors [51,52,53]. This technology has been widely used in research in other scientific fields and has proven to be a reliable tool for weight-overlap addition [54]. The equation for a WLC is:
where FSi is the evaluation index of zone i, Wj is the weight of criterion j obtained through the AHP, xij is the standard value of area i under standard j, and n is the total number of criteria [55].
To generate candidate fire brigades, the final suitability is divided into three categories: most suitable zones (FS > 5), suitable zones (FS ≤ 5), and unsuitable zones including exclusion zones (FS = 0) [56].
2.2.3. Evaluation Criteria
- (1)
- Fire-risk zone. A fire-risk zone reflects the degree of fire hazard in a certain area. When a fire occurs in a high-fire-risk zone, it may easily cause serious economic loss and casualties. Therefore, fire brigades must protect such zones so that, in the event of a sudden fire, firefighters can react optimally and save lives and property that would otherwise be lost in the fire.
- (2)
- Location. We now discuss spatial variables related to location. (i) Population. According to 2020 fire statistics, resident casualties account for 80.2% of the total casualties. Given the value of human life, the weighting for these data should be significant. Therefore, population is an important evaluation criterion for selecting sites for urban fire brigades. To optimize the rescue function of fire brigades, they should be built in densely populated areas. (ii) Proximity to roads. Being close to roads facilitates the entry and exit of fire trucks into fire zones, thereby reducing the reaction time for firefighting and rescue and the associated cost of firefighting. Therefore, the closer a fire brigade is to the road network, the better it is for fire rescue. (iii) Proximity to existing fire brigades. Gay and Siegel [57] and Johnston [58] argued that the criteria for evaluating fire brigades should include the distance between these brigades, which determines the location and number of fire brigades in a community. Therefore, the distance between existing fire brigades is retained as an evaluation criterion. (iv) Proximity to a river. Given that fire brigades must ensure adequate water supply for fire trucks, fluvial water resources can be vital for firefighting and for vehicle maintenance. Therefore, fire brigades should be positioned close to a river.
- (3)
- Orography. The terrain strongly affects the displacement of fire trucks and the concomitant time and costs for training and rescue. This is an important factor in choosing the location of fire brigades. The slope of the area near the fire brigade determines the acceptability of the site. Flat areas are more conducive to the construction of fire brigades than sloped areas.
2.2.4. Average Road Network Datasets
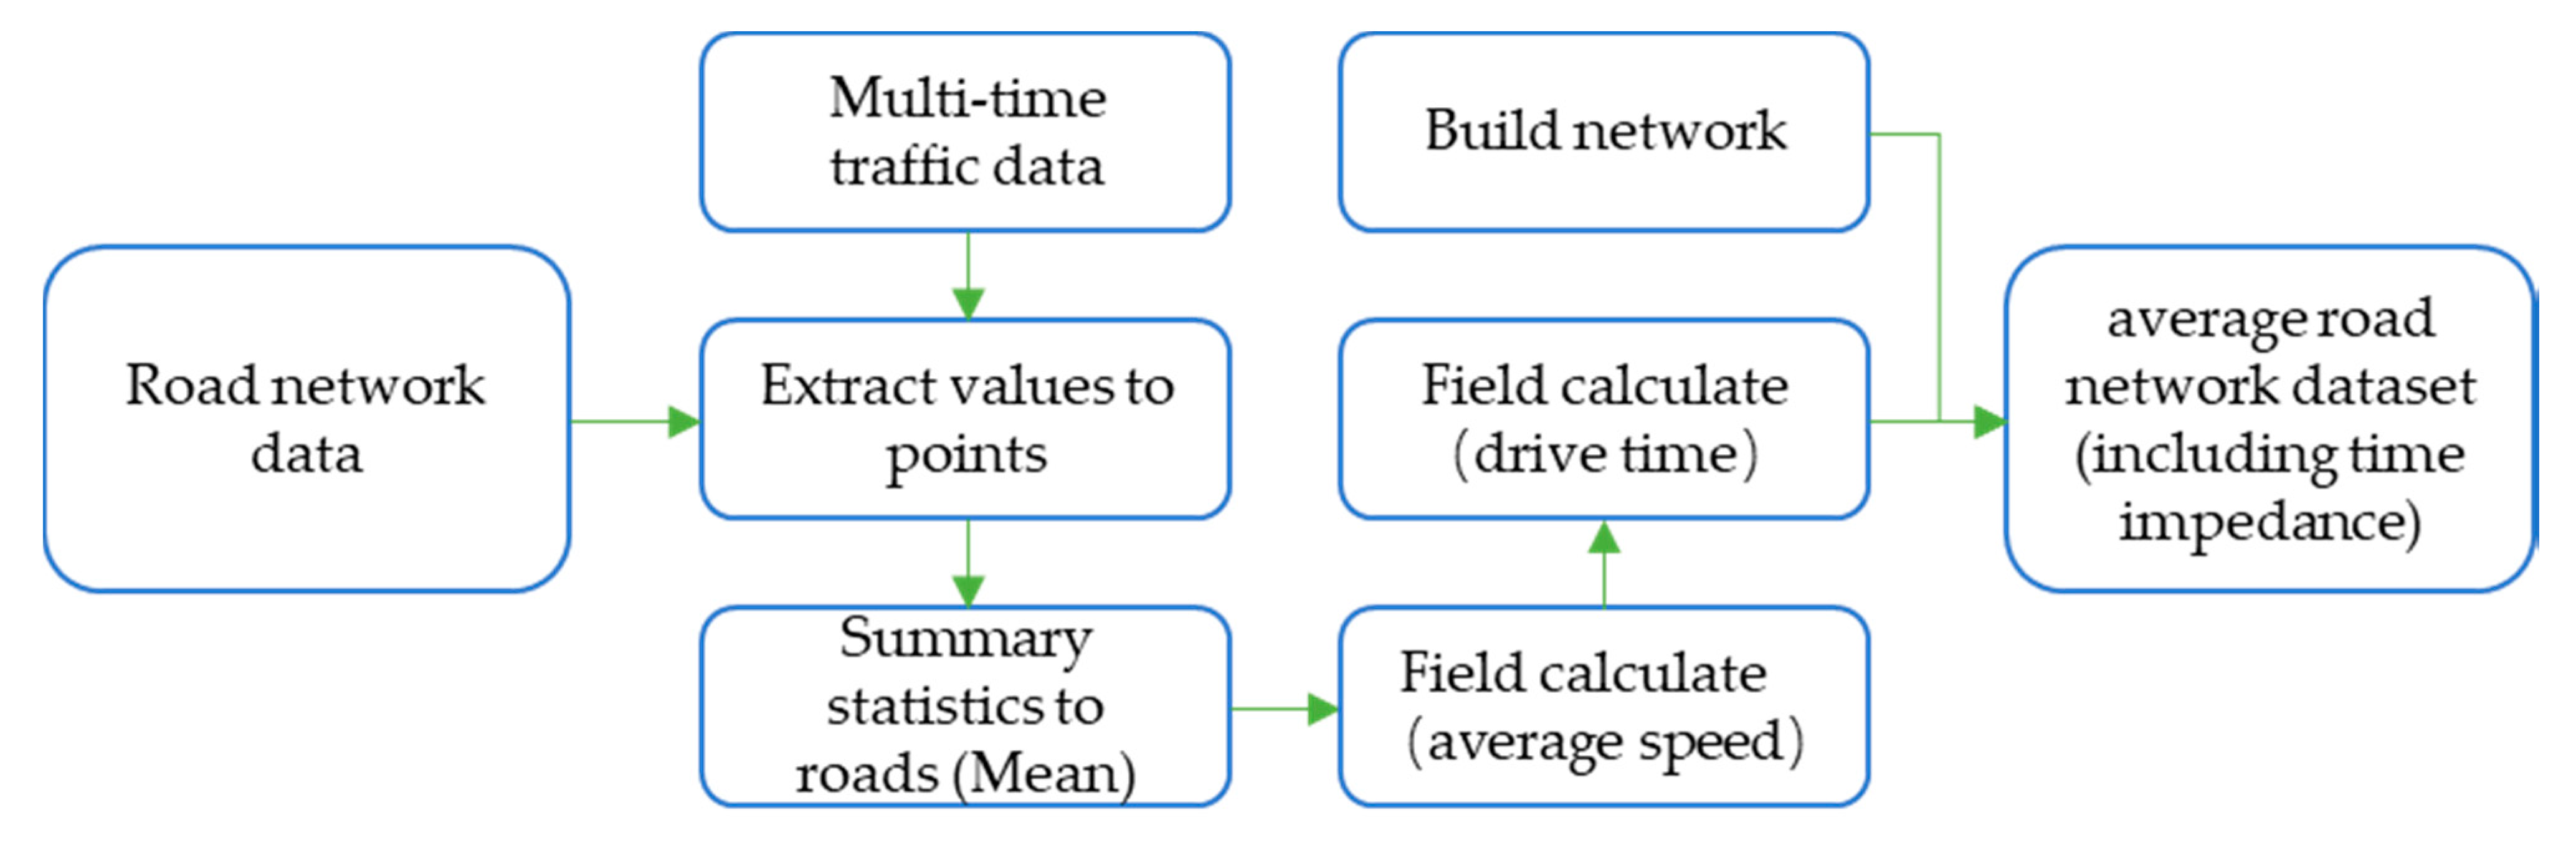
This section mainly discusses how to get the average traffic data of the road network from Baidu Map to the layer. We first collect multi-period traffic network speed data and then analyze the time periods when the average driving speed decreases sharply on weekdays and on weekends. The fire brigade location is selected based on the time interval when the driving speed drops sharply so that the fire brigade can more quickly reach the area that needs rescue during times of non-congestion. We then apply a statistical analysis to calculate the average speed for each road segment. Finally, the road network information is converted from average speed to time spent traveling each road segment, which is obtained by dividing the length of each road segment by the average driving speed.
In the process, the following two aspects need to be considered simultaneously: First, the traffic data provided by Baidu Maps do not include non-congested road sections, so road sections without traffic speed information must be replaced with the average driving speed of other road sections during non-congested periods. Second, fire trucks have priority on the road and are less affected by the rules of the road, such as turning and traffic lights. Therefore, appropriate settings must be used for the corresponding road network parameters, including travel time as a function of road impedance. Figure 4 shows the overall process of generating an average-speed road network.
2.2.5. Site Selection Standard and Model
After quantitatively determining various fire-risk zones, suitable zones for fire brigades, and average speeds, the L-A model is applied to analyze the coverage of existing fire brigades in the city. In this context, some spatial optimization goals related to standards and relevant local laws are considered, including coverage of high-fire-risk zones, coverage of important fire-risk zones, coverage of total building constructions, and coverage of individual fire brigades.
- (1)
- Standard for rescue time and construction area of fire brigades. According to China’s “Code for the Planning of Urban Fire Control” (2015) and “Urban Fire Station Construction Standards” (2017), a fire brigade should be able to reach the edge of its jurisdiction within five minutes after receiving an alarm call. Thus, the coverage area of an ordinary fire brigade should not be greater than 7 km2. Special fire brigades with firefighting and rescue tasks have the same jurisdiction regulations as ordinary fire brigades.
- (2)
- Location allocation. The L-A model provides an effective method for selecting sites for public facilities [59,60,61,62] and has been successfully applied to the site selection of emergency facilities [62], such as the selection of a school site [60], a hospital site [61], and fire brigade site [19]. The scientific positioning of public service facilities can make supermarkets convenient for residents to shop, and supermarkets will also be profitable. Appropriate locations enable service facilities such as police stations and fire brigades to provide better services and make schools easier for students to access.
This article therefore uses two algorithms in the L-A model: the maximum coverage location problem (MCLP) and the minimize facilities coverage problem (LSCP). The goal of the MCLP is to maximize the number of demand points within the maximum service radius of the facility under the condition of selecting the spatial distribution of a given number of facilities from all candidate facilities. The goal of the LSCP is to maximize the number of facility demand points within the maximum service radius of the facility under the condition of selecting the fewest facilities among all service facilities. Table 4 presents the mathematical expressions of the two algorithms. The L-A parameters are explained in the literature [12,13,17].
3. Results
3.1. Spatial Distribution of Exclusion Criteria
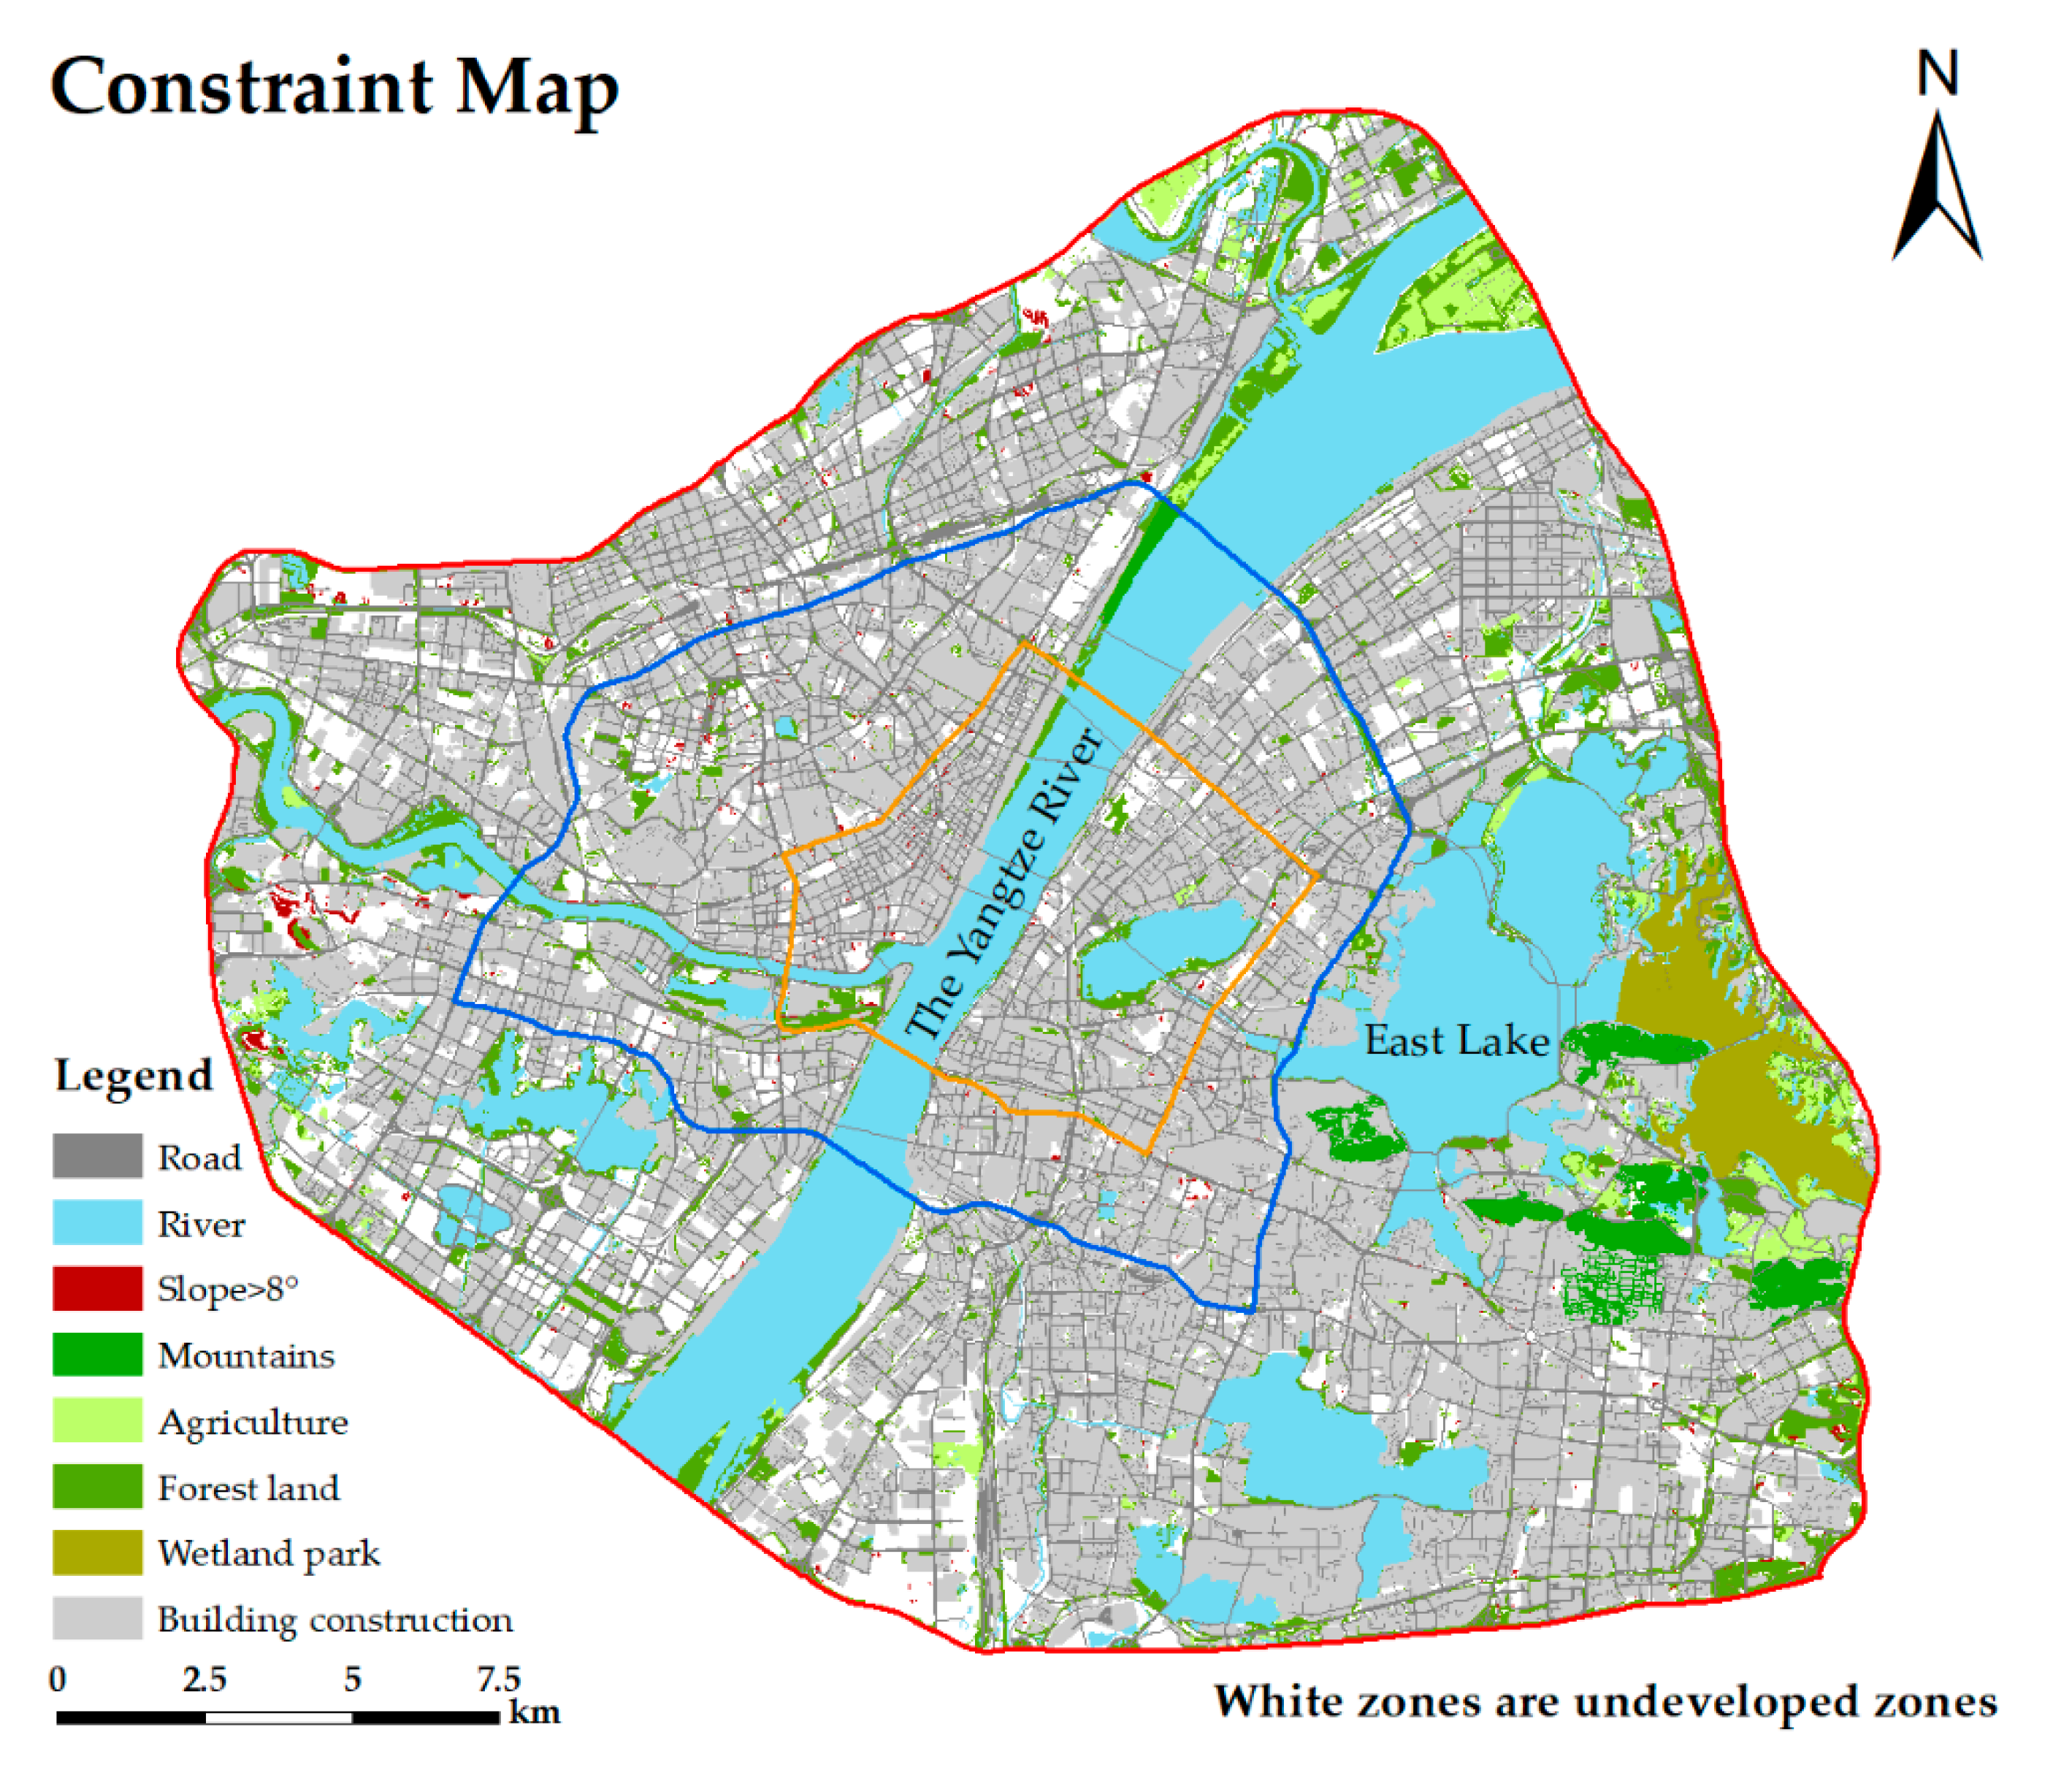
According to Section 2.2.1, Figure 5 shows the spatial distribution of each exclusion criterion, and Table 5 shows the area. Among all the exclusion criteria, the building construction area in the study area is the largest and is mainly concentrated within the second ring road of the city. The area of construction around the third ring road gradually decreases, and the total construction area of the research area is 176.36 km2. The second-largest area is the water source area because Wuhan is in the Yangtze River Basin. East of the central city is East Lake, with abundant water resources, with a total coverage area of 125.74 km2. The white area is the unused free area, which is suitable for building fire brigades with an area of 67.32 km2. Finally, we remove the restricted area from the initial layer with an area of 566.5 km2.
3.2. The Spatial Distribution of Fire-Risk Zones
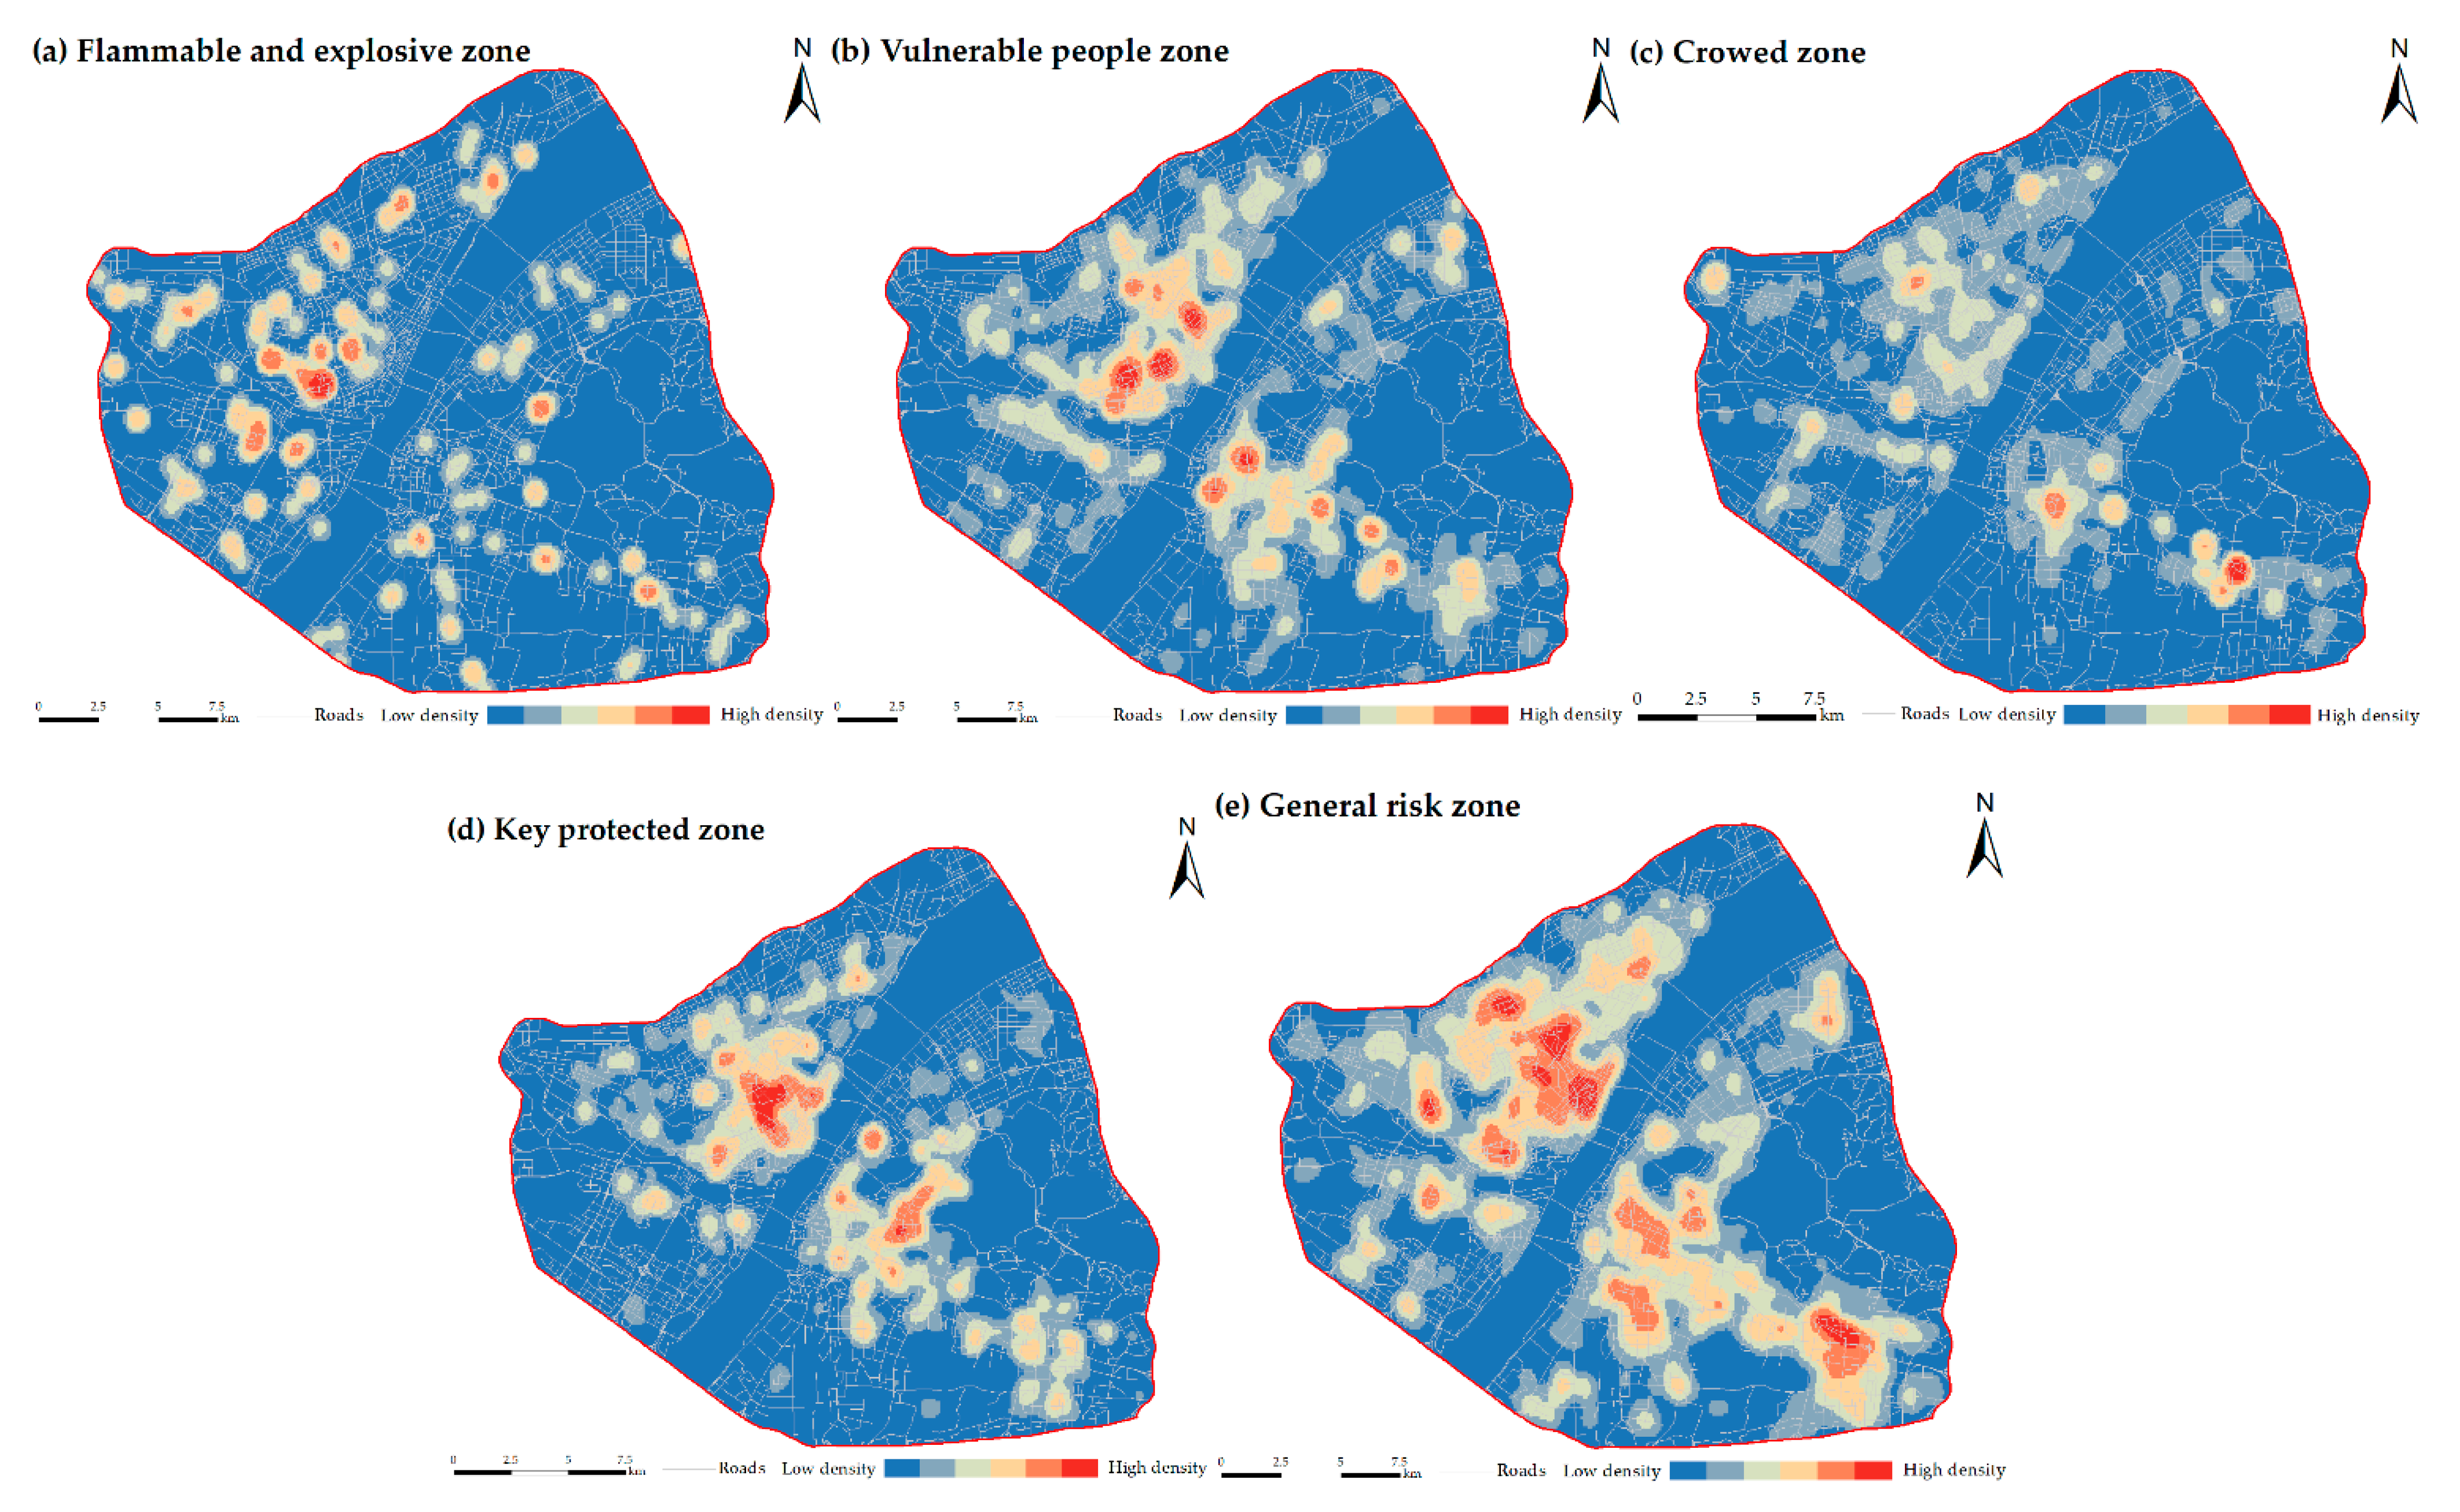
According to Section 2.2.2, we first classify the POI data, divide the results into five types of fire-risk zones, and then use the kernel density analysis method to obtain the spatial agglomeration distribution map of each fire risk. The final distribution of fire-risk hot spots is shown in Figure 6. The result is that the “Vulnerable people zone” and “Key protected zone” are mainly distributed in the first ring of the city, the “Flammable and explosive areas” and “General risk zone” are mainly distributed within the city center, and the “Crowded zone” is mainly distributed in congested zones, such as Wuchang station and Wuhan Hongji locomotive passenger station and other areas.
After calculating the kernel density analysis of each fire-risk zone, the AHP and WLC methods are used to obtain the total fire-risk area. The weights are determined based on the analysis of fire statistics in China for five consecutive years. The largest number of fires are mainly distributed in the “General risk zone”, followed by the “Flammable and explosive zone”, then the “Crowded zone”, and finally the “Vulnerable people zone”, whereas the “Key protected zone” has the least number of fires. Therefore, the final decision matrix is shown in Table 6. The comparison shows that the final CR is less than 0.10, indicating that the paired comparison matrix passes the consistency test. Each fire-risk area is divided into nine grades at equal intervals. Table 7 shows the corresponding score of the evaluation criteria.
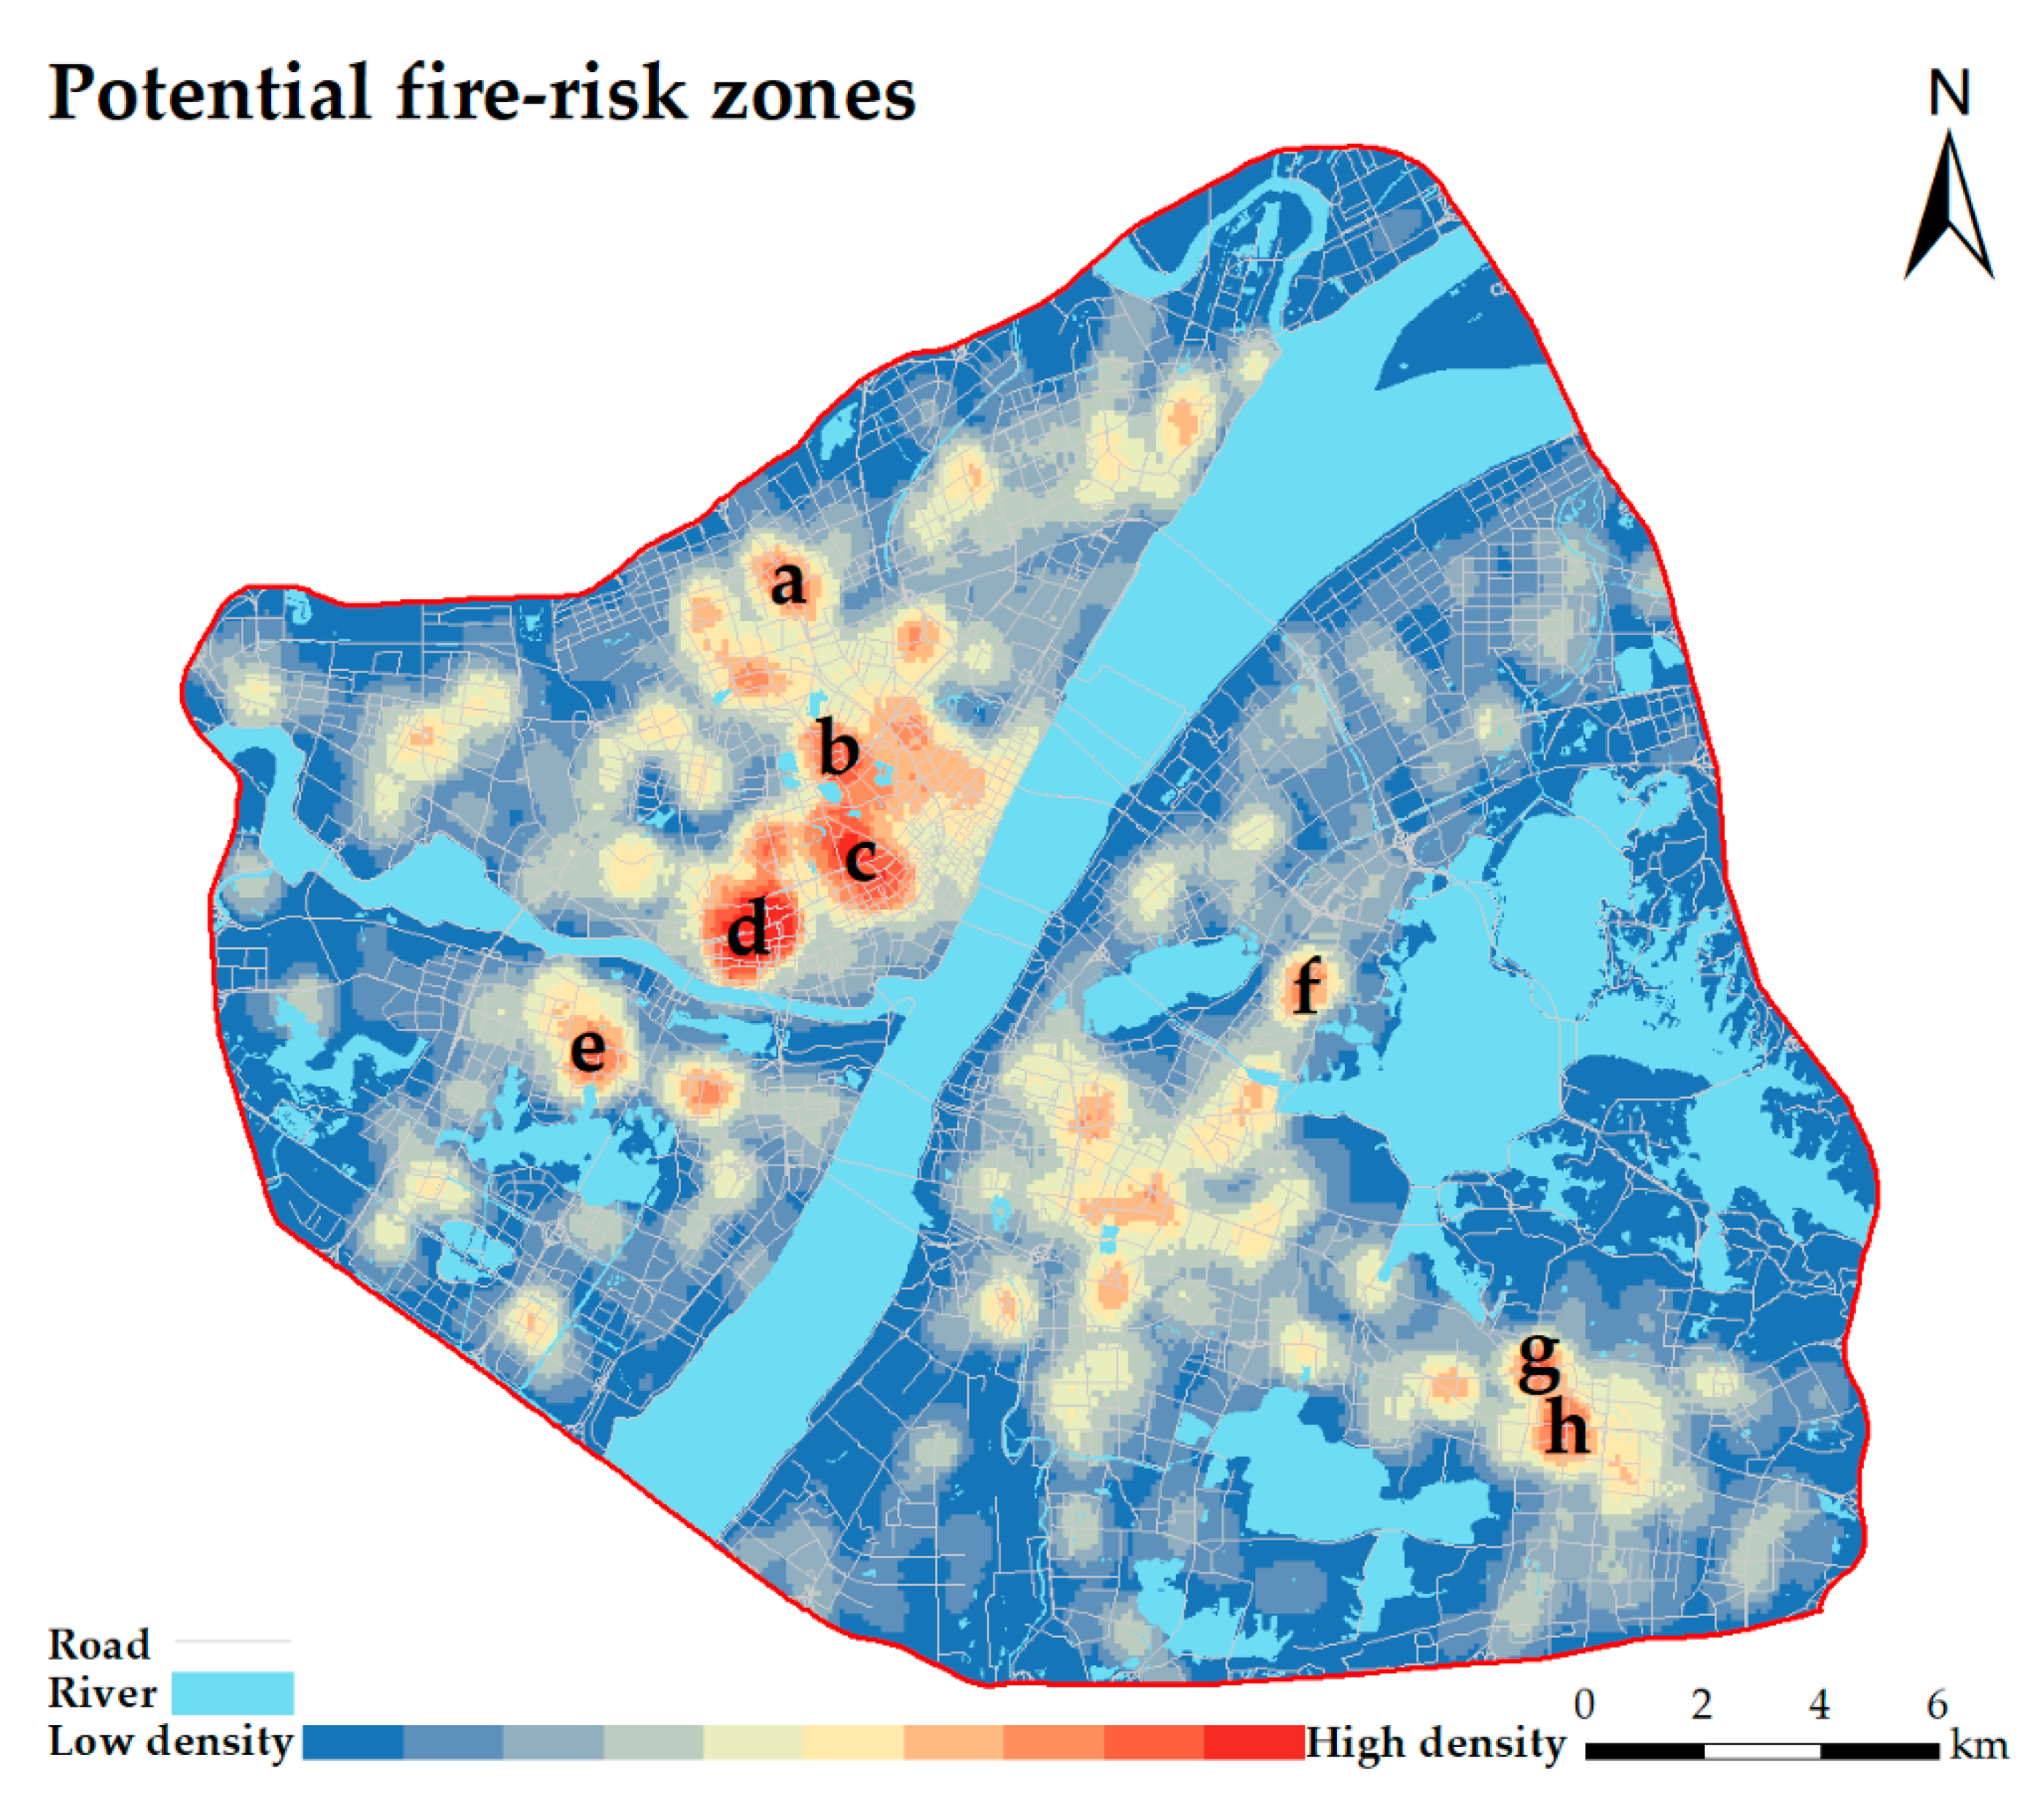
Figure 7 shows the spatial distribution of the fire-risk results, and Table 8 presents the area proportion of the fire-risk zones, enabling us to evaluate the fire risk from high to low. In this case, the high-fire-risk zone refers to events with high fire risk or high severity, and the low-fire-risk zone refers to events with relatively small fire risk or relatively low loss. These data show that the top 10% of fire-risk areas are mainly concentrated to the west of the Yangtze River. The Hankou railway station is in zone a, which also contains many shopping malls and hospitals. Zones b–d contain numerous residential and shopping malls. Hanyang railway station is in zone e and is surrounded by many homes. Wuhan Hanyang hospital is also in zone e. Zones g and h contain many schools and shopping malls, and zone f contains many important places such as hospitals and museums.
Finally, in follow-up work, the fire-risk area can be used as the site-selection target of the fire brigade and one of the evaluation criteria for constructing a suitable area for the fire brigade.
3.3. Spatial Distribution of Evaluation Criteria
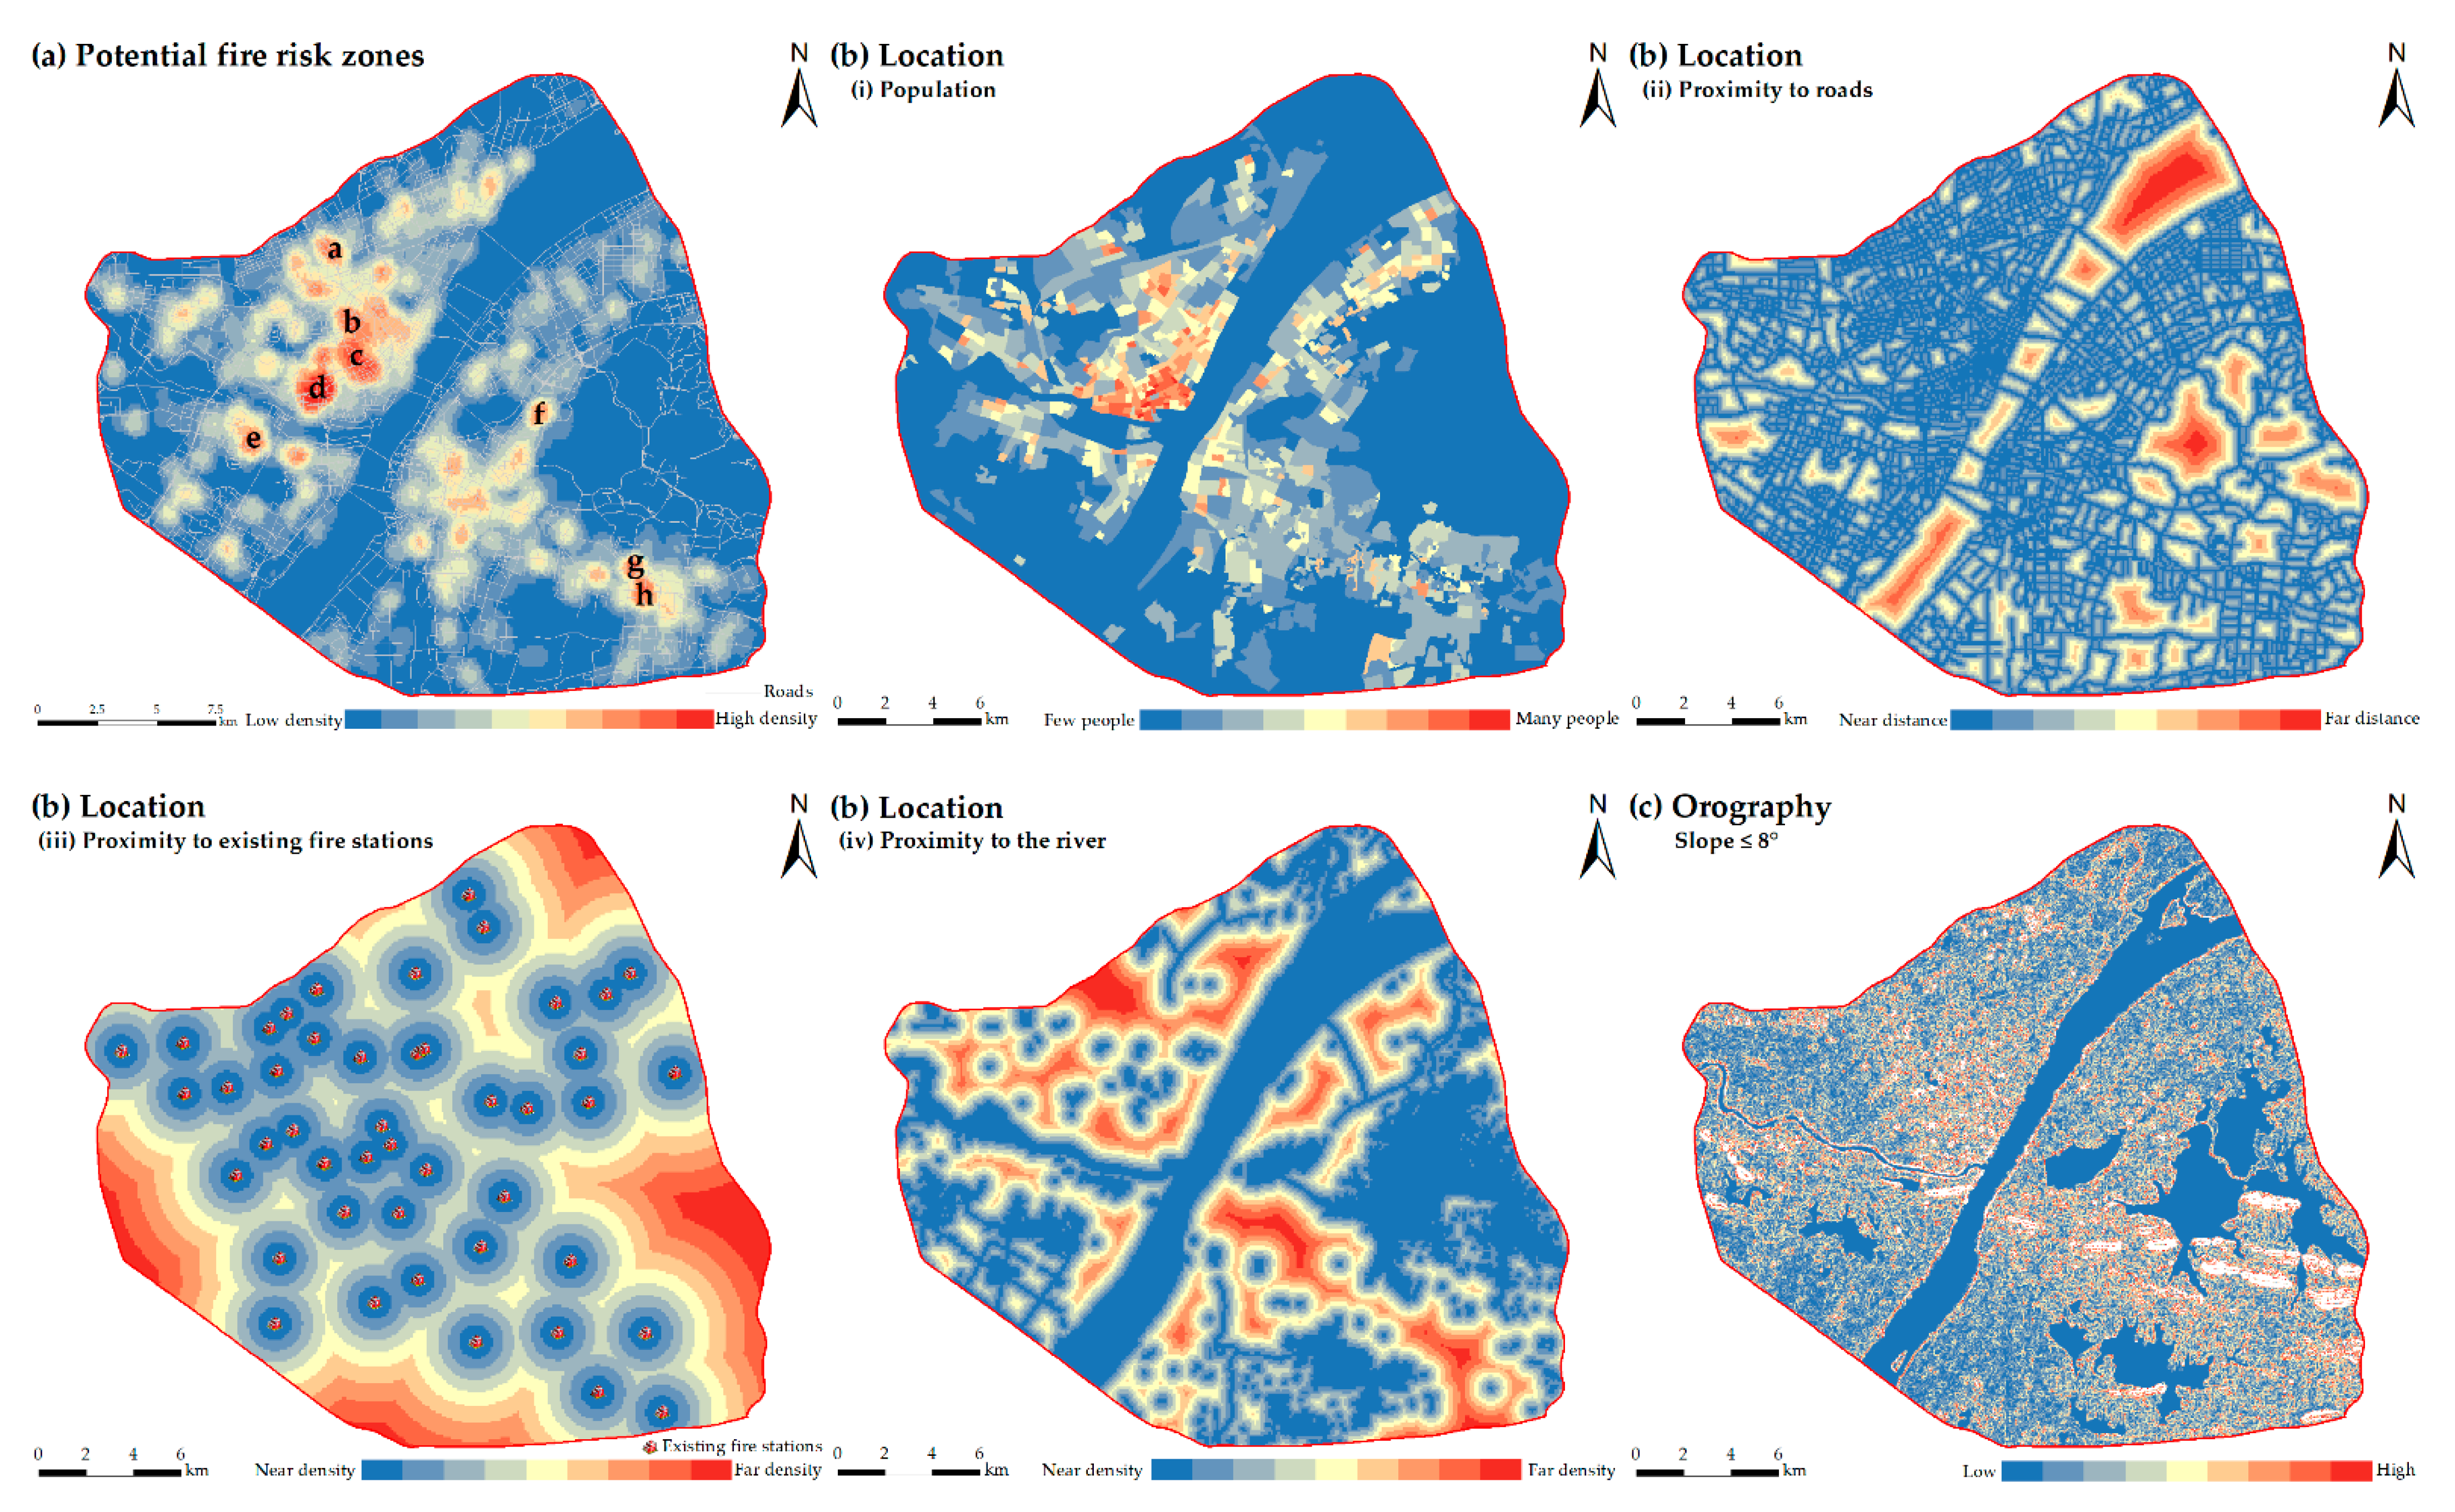
According to the content of Section 2.2.3, the evaluation criteria are divided into three criteria and six sub-criteria. Figure 8 shows the spatial distribution of various evaluation criteria. (a) The population data from Baidu heat map data are combined with the population data (population data are from the Wuhan Statistical Yearbook) to calculate the population in the study area by using the grid vector data in geospatial space. The details of the data are as follows: From 0:00 to 24:00 on workdays (4 August 2021, Wednesday; 5 August 2021, Thursday) and weekends (7 August 2021, Saturday), data are collected from Baidu heat map. The collection frequency is once per hour, and a total of 72 data points are collected. The demographic data come from geographic and national conditions (the permanent resident population of Wuhan is 10.081 million). Figure 8bi shows that the population is mainly concentrated north of the Yangtze River and diminishes as you move away from the central city. (b) Wuhan is a central city with a dense road network, as shown in Figure 8bii. (c) The existing fire brigades in the central city of Wuhan are evenly distributed, but fire brigade rescue services lack in the edge area of the third ring road. To ensure the accuracy of the data for existing fire brigades, multi-source data such as Gaode, Baidu, and Tencent maps are used for mutual verification. After data deduplication, merging, and elimination, a total of 47 fire brigades data points are obtained, as shown in Figure 8biii. (d) Wuhan is in the Yangtze River Basin, and the East Lake is on the right, as shown in Figure 8biv. Wuhan has sufficient water sources, which facilitates the construction of fire brigades. (e) Wuhan is at a low altitude, with 84.85% being below 50 m. There are only a few mountains to the north of the Huangpi district and to the east of the Xinzhou district, accounting for only 0.13% of the city’s total area. The terrain of the study area fluctuates little, as shown in Figure 8c.
After completing the AHP method and before executing the WLC process, we must reclassify various evaluation standards, which are divided into nine levels by using the natural discontinuity method (as shown in Table 9), which is based on natural groupings inherent in the data. Recognizing the classification interval allows the most appropriate grouping of similar values and maximizes the differences between each class. The features are divided into multiple classes and their boundaries are set where the difference in data is relatively large. Classification by natural breaks can very well “gather things together” so that the differences between categories are obvious, making the differences within each category very small so that a clear break appears between each category.
After calculating the kernel density analysis of each factor, the AHP and WLC methods are used to obtain the most suitable fire brigade construction areas. The weight is determined based on a statistical analysis of national fire rescues in 2020. Judging from the rescue situation of the fire brigades, the number of population rescues over the whole year reached 395,000 (including handling traffic accidents and helping people), and the number of firefighting events reached 251,000. These data show that the fire brigade mainly serves people rather than saving property. The number of social rescues is approximately twice that of firefighting. The service of the fire brigade services is mainly to serve the people and help the people solve problems because the location includes population, so the location weight is slightly higher than the fire-risk zone. The orography weight is lower than the location and fire-risk zone because a degree of less than 8° has little impact on the construction of a fire brigade. Therefore, the population in the location is the main factor. The second major factor is the fire-risk zone. The final decision matrix of factors is shown in Table 10. The comparison shows that the final CR is less than 0.10, which indicates that the paired comparison matrix has passed the consistency test.
As explained in Section 2.2.3, the final decision matrix of the evaluation criterion is shown in Table 11. The comparison shows that the final CR is less than 0.10, indicating that the paired comparison matrix passes the consistency test.
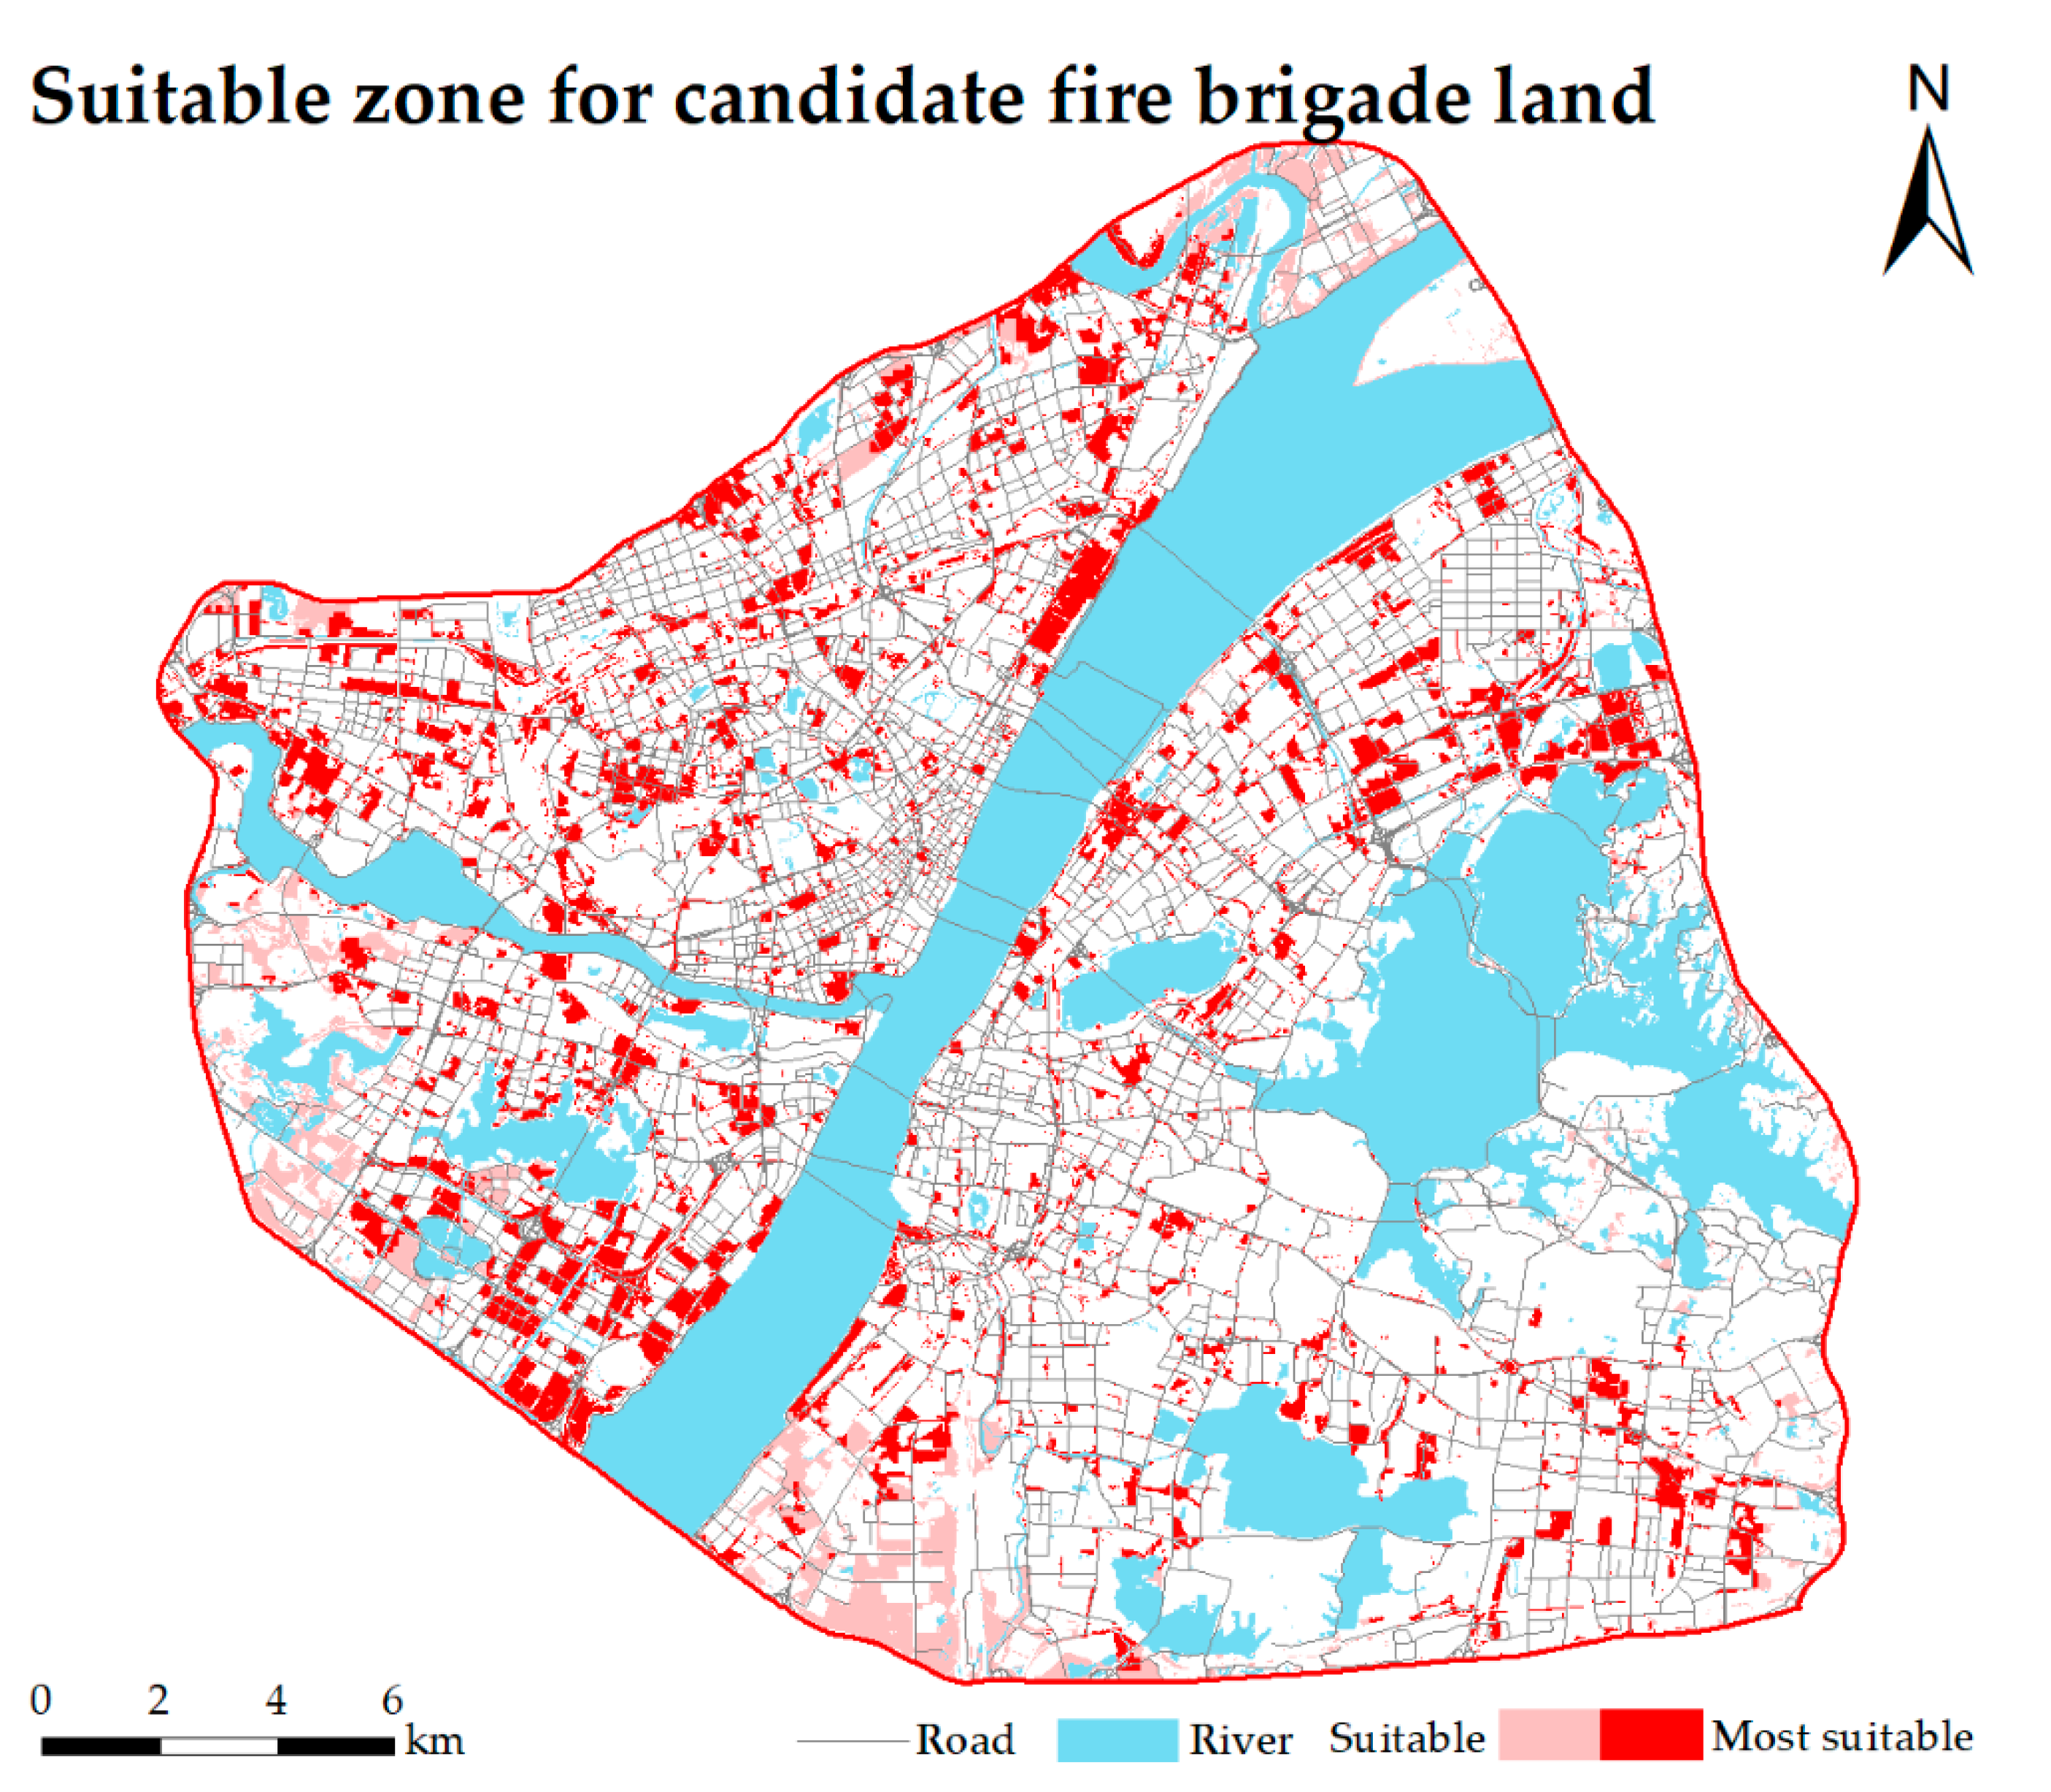
The WLC method is used for weight overlay to obtain the total evaluation area for possible fire brigade construction. The most suitable areas, suitable areas, and unsuitable areas for fire brigade sites are shown in Figure 9, and the area and proportion are shown in Table 12. Suitable areas for the fire brigades in the study area cover 67.31 km2, and the proportion of suitable areas is 12.84%. Candidate fire brigades should be built in the most suitable areas first, before considering building in suitable areas.
3.4. Coverage of Existing Fire Brigades
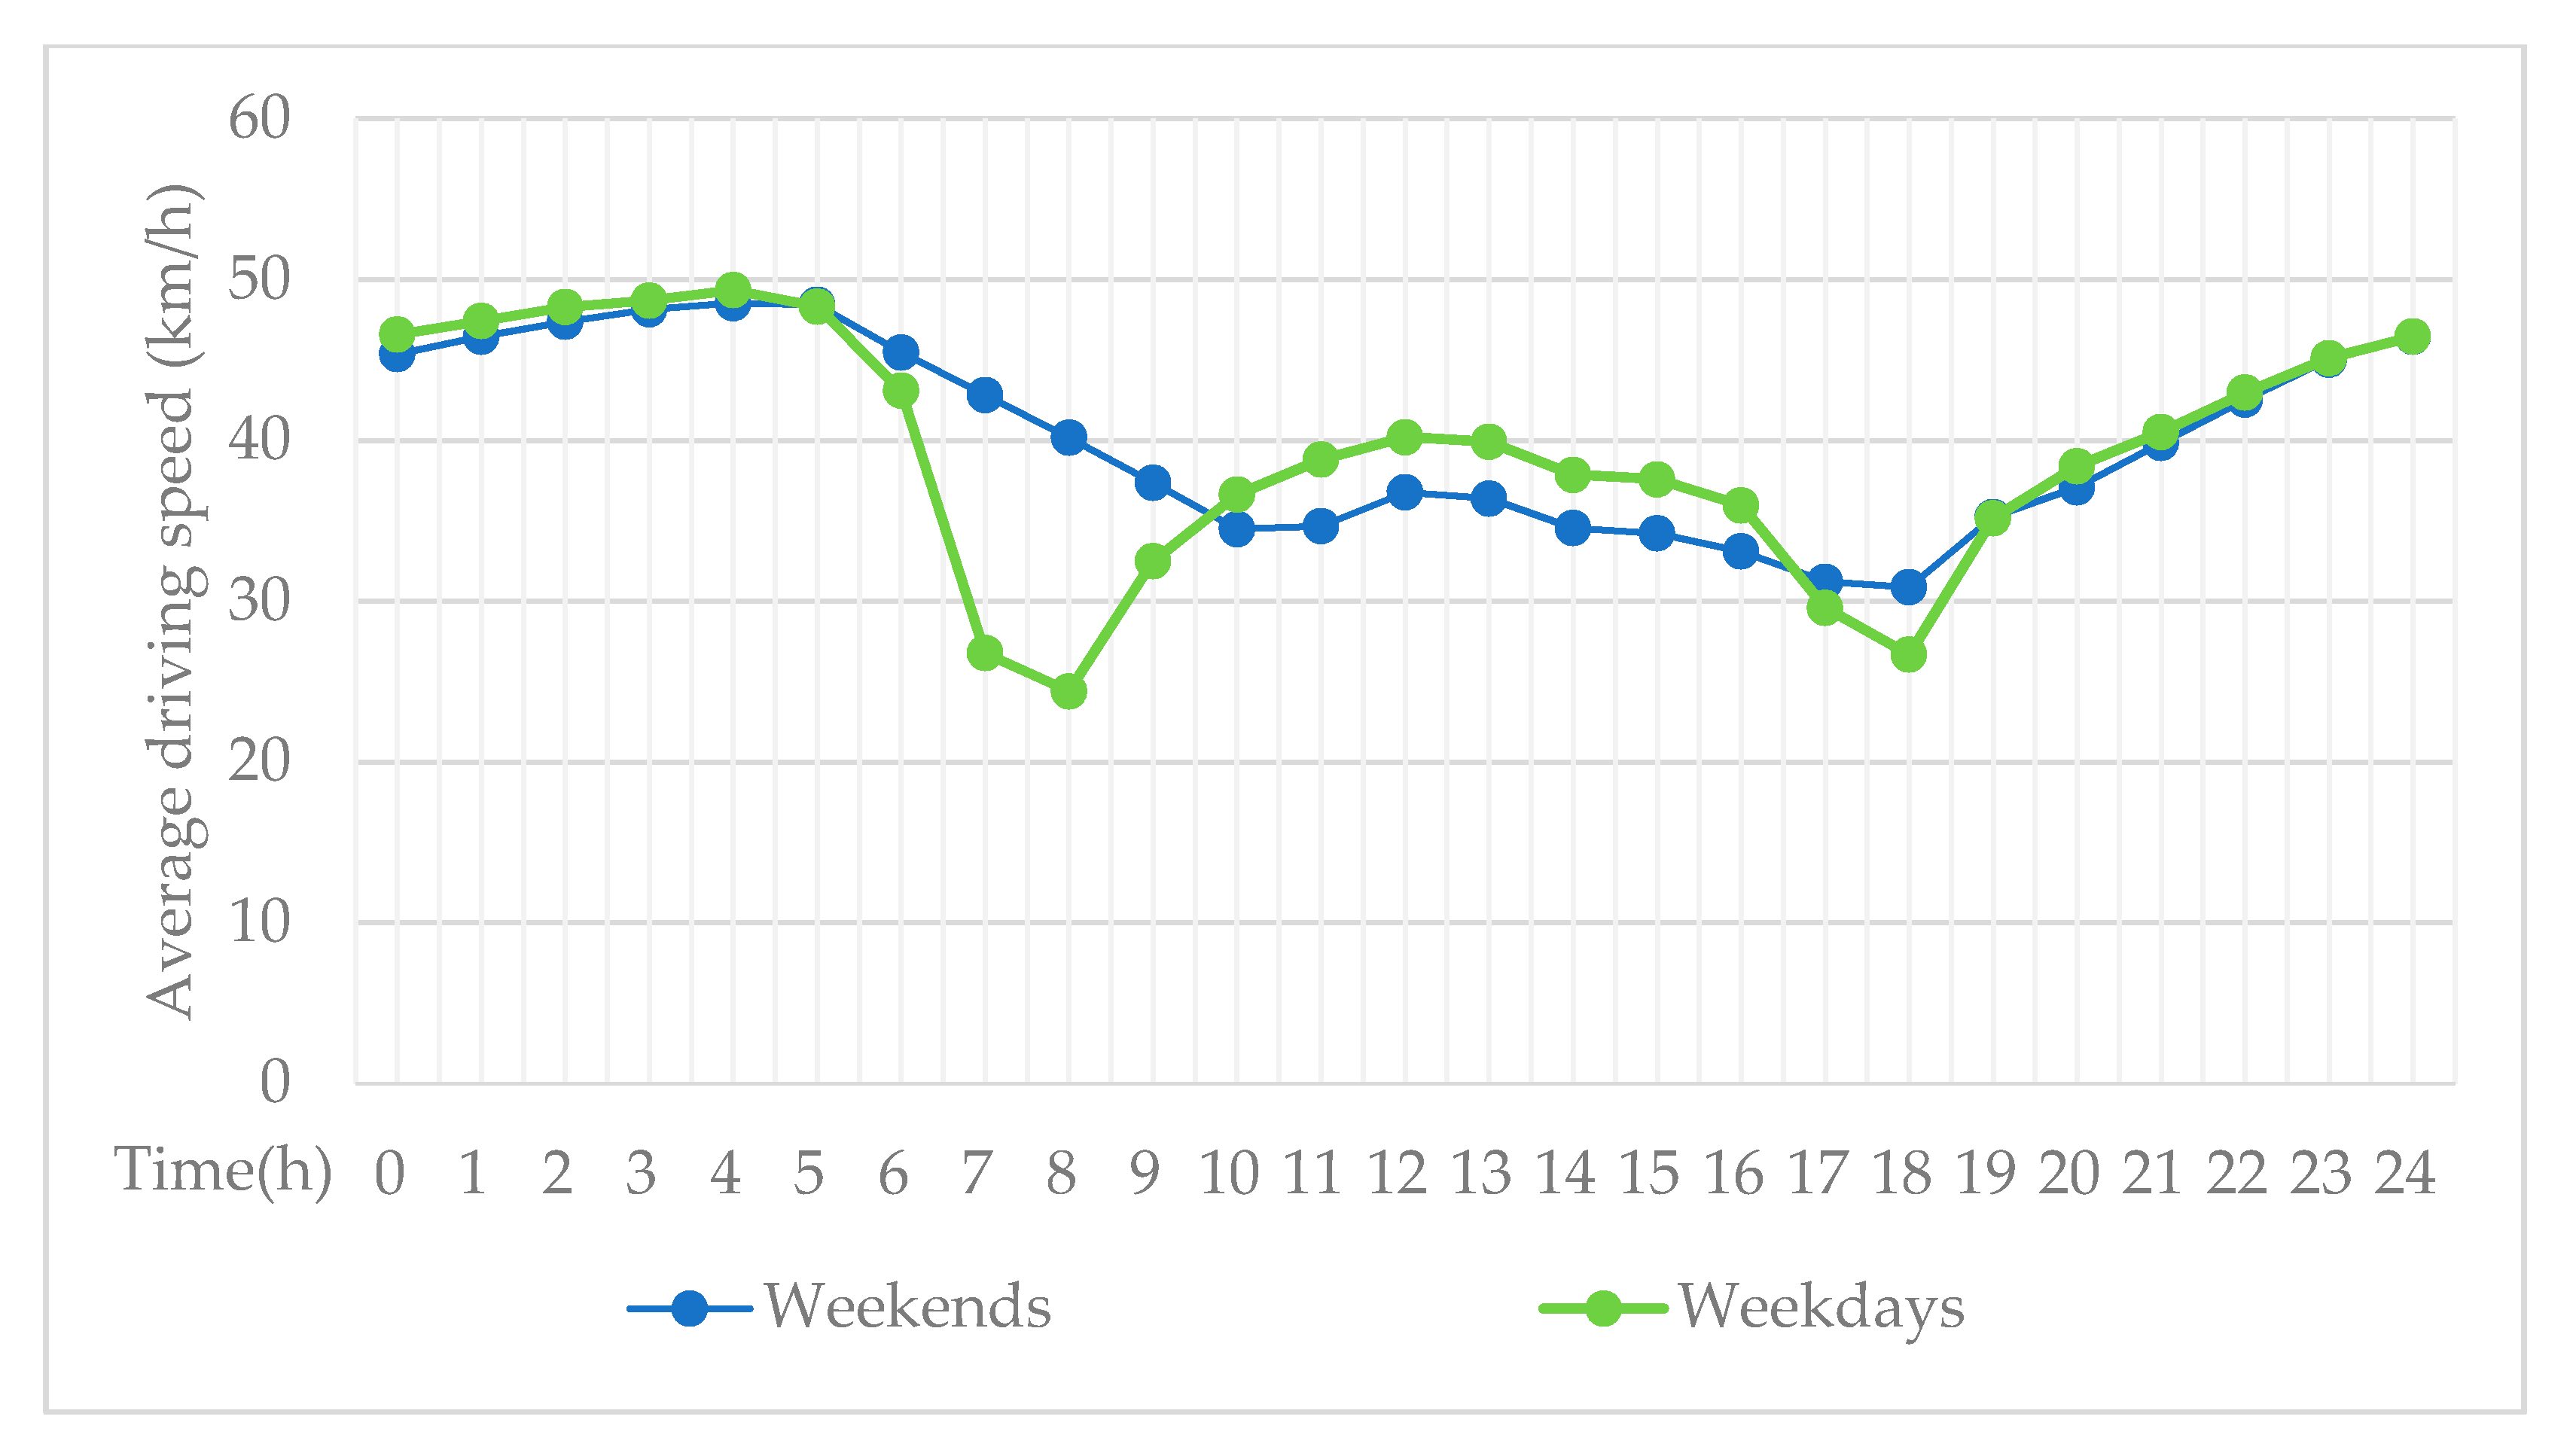
Time-period analysis shows that the average driving speed in Wuhan during weekdays decreases significantly during the morning rush hour (i.e., between 07:00 and 09:00) and the evening rush hour (i.e., between 17:00 and 19:00). On weekends, the average driving speed in Wuhan City significantly decreases during the morning peak (i.e., between 09:00 and 11:00) and evening peak (i.e., between 17:00 and 19:00), as shown in Figure 10. Similarly, the average driving speed at the same time on weekends is mostly slightly higher than that on weekdays. Therefore, the average driving speed of all roads at six time points on weekdays and weekends in the study area is calculated. Applying the above method gives the average speed on various roads, which is shown in Figure 11. The results show that the Yangtze River is the rescue barrier, hindering firefighting rescue on both sides of the river. Wuluo Road, the Second Ring Road, and Xudong Street are express roads, and Sanyang Road, Qinyuan Road, and the Wuhan Yangtze River tunnel are the main roads. The Wuhan Bridge is thus a fast track line that allows faster access to the scene through the river, not through small narrow roads.
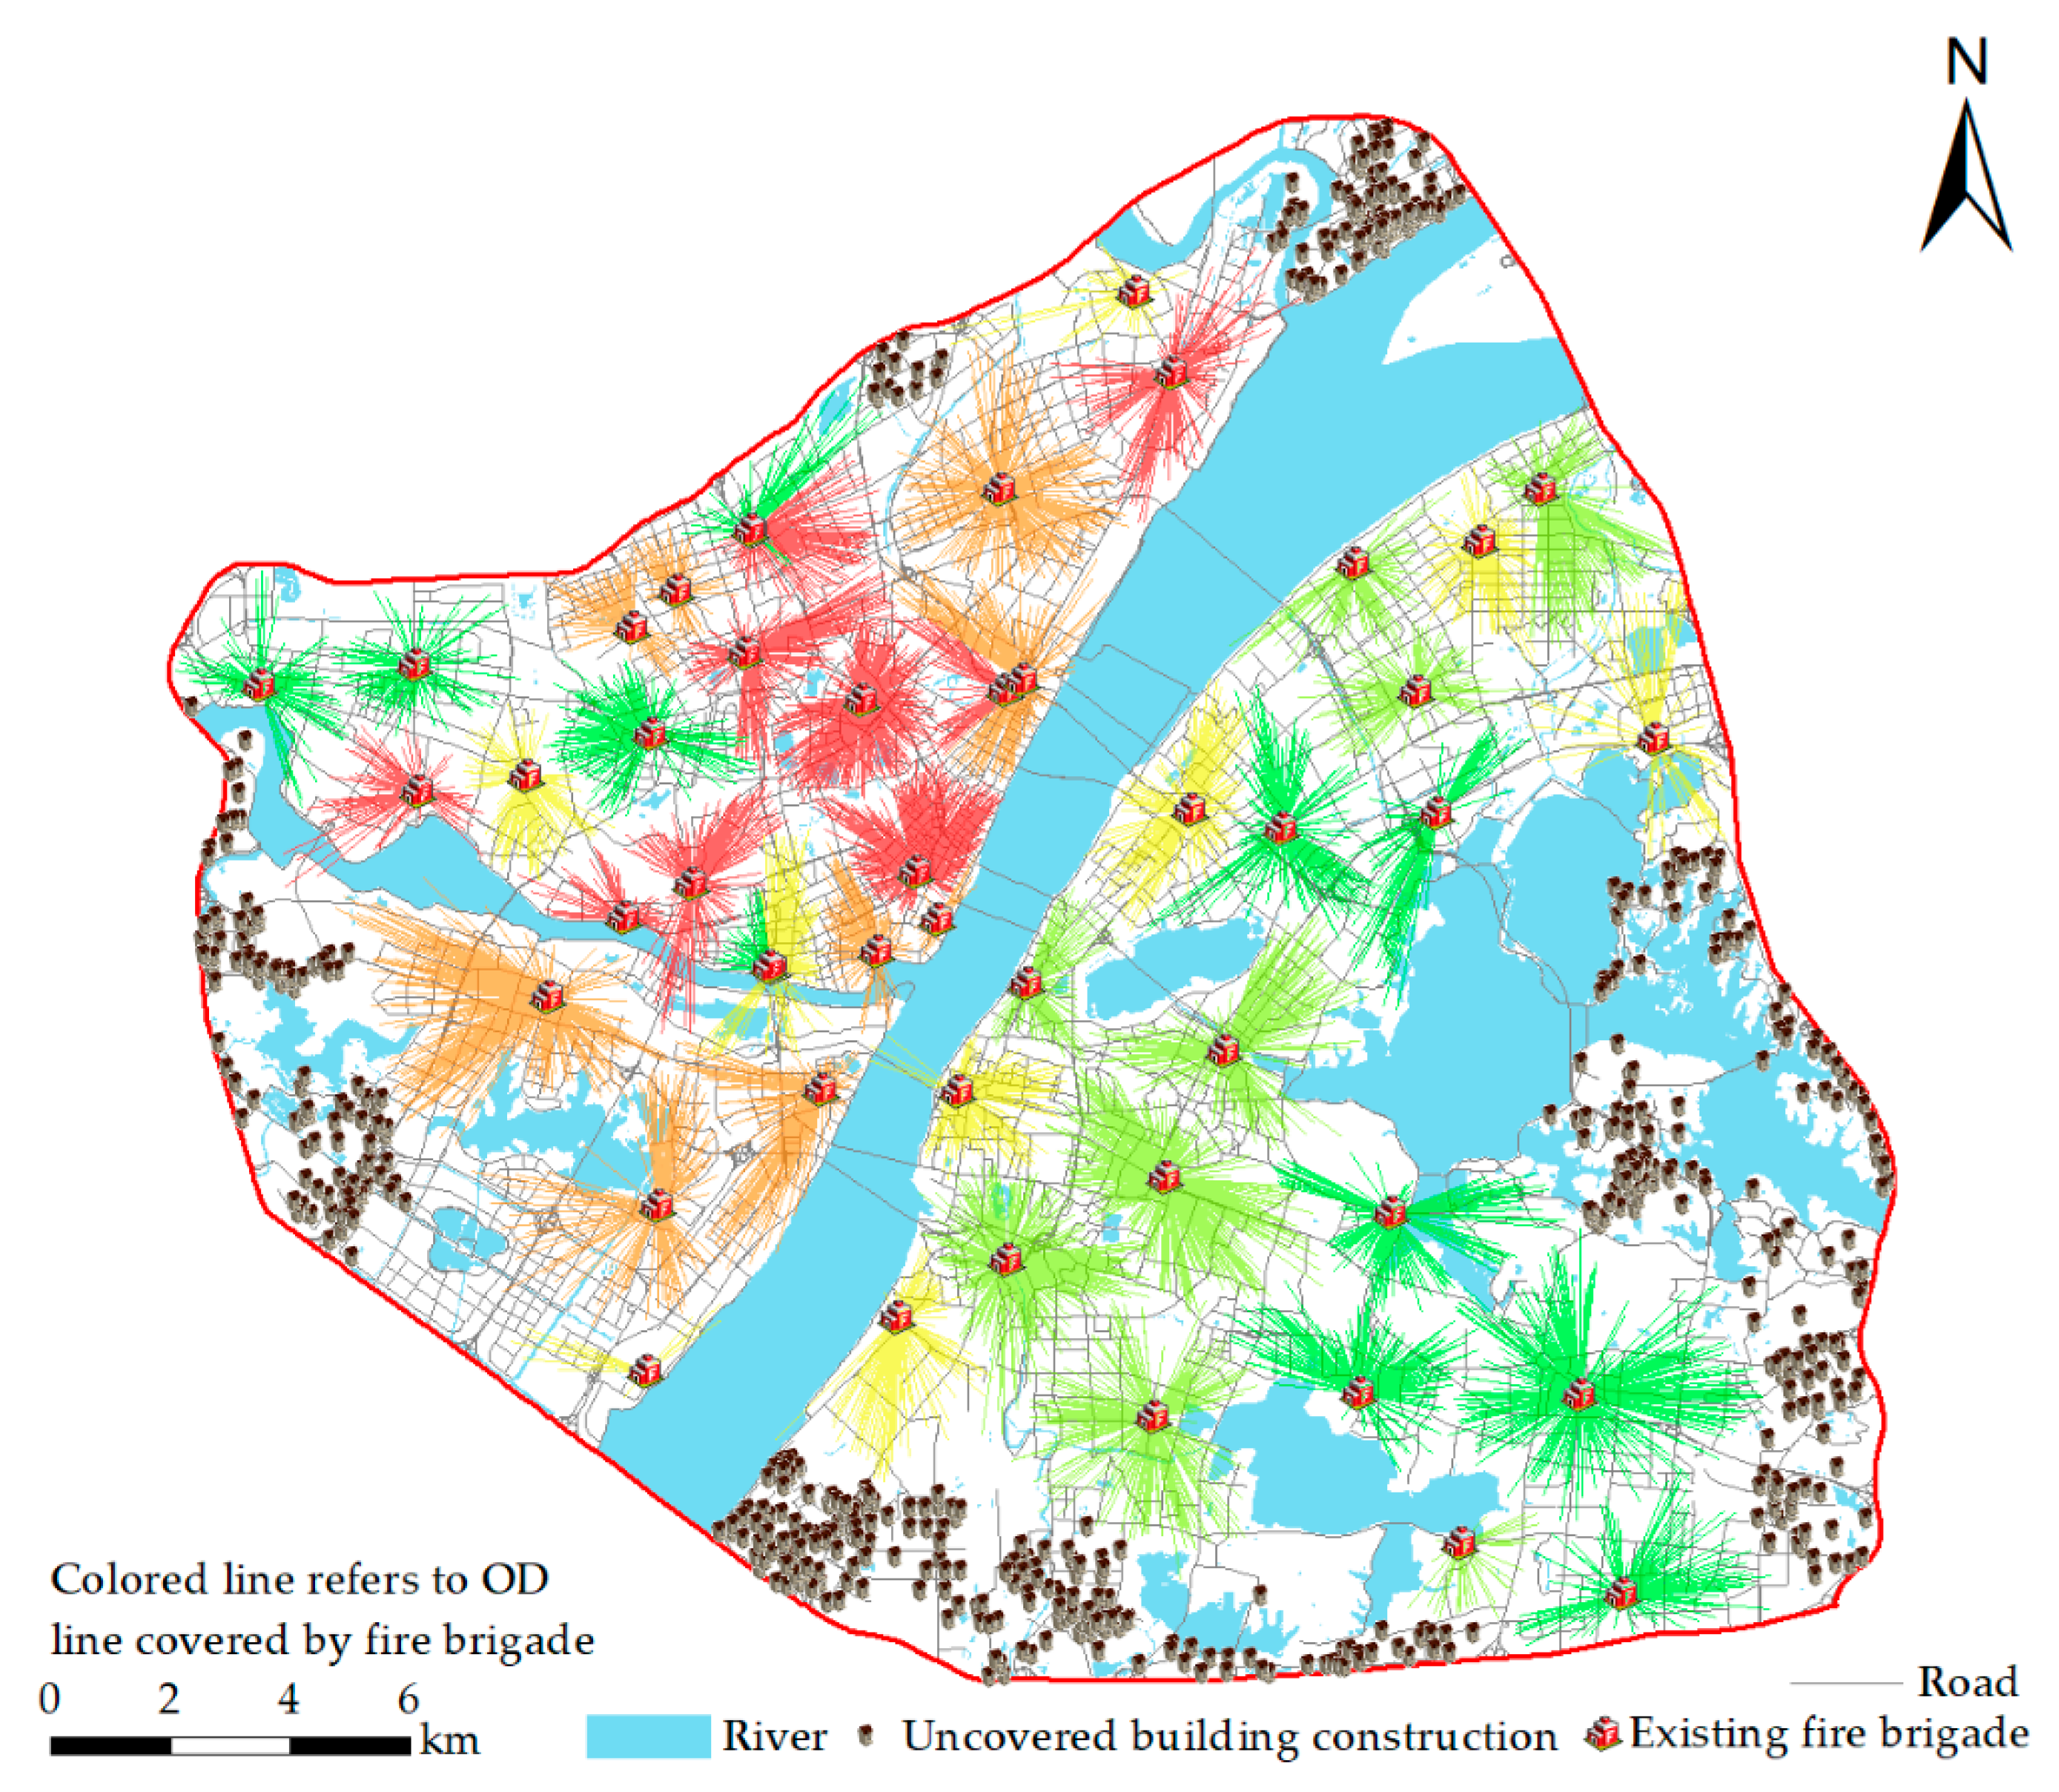
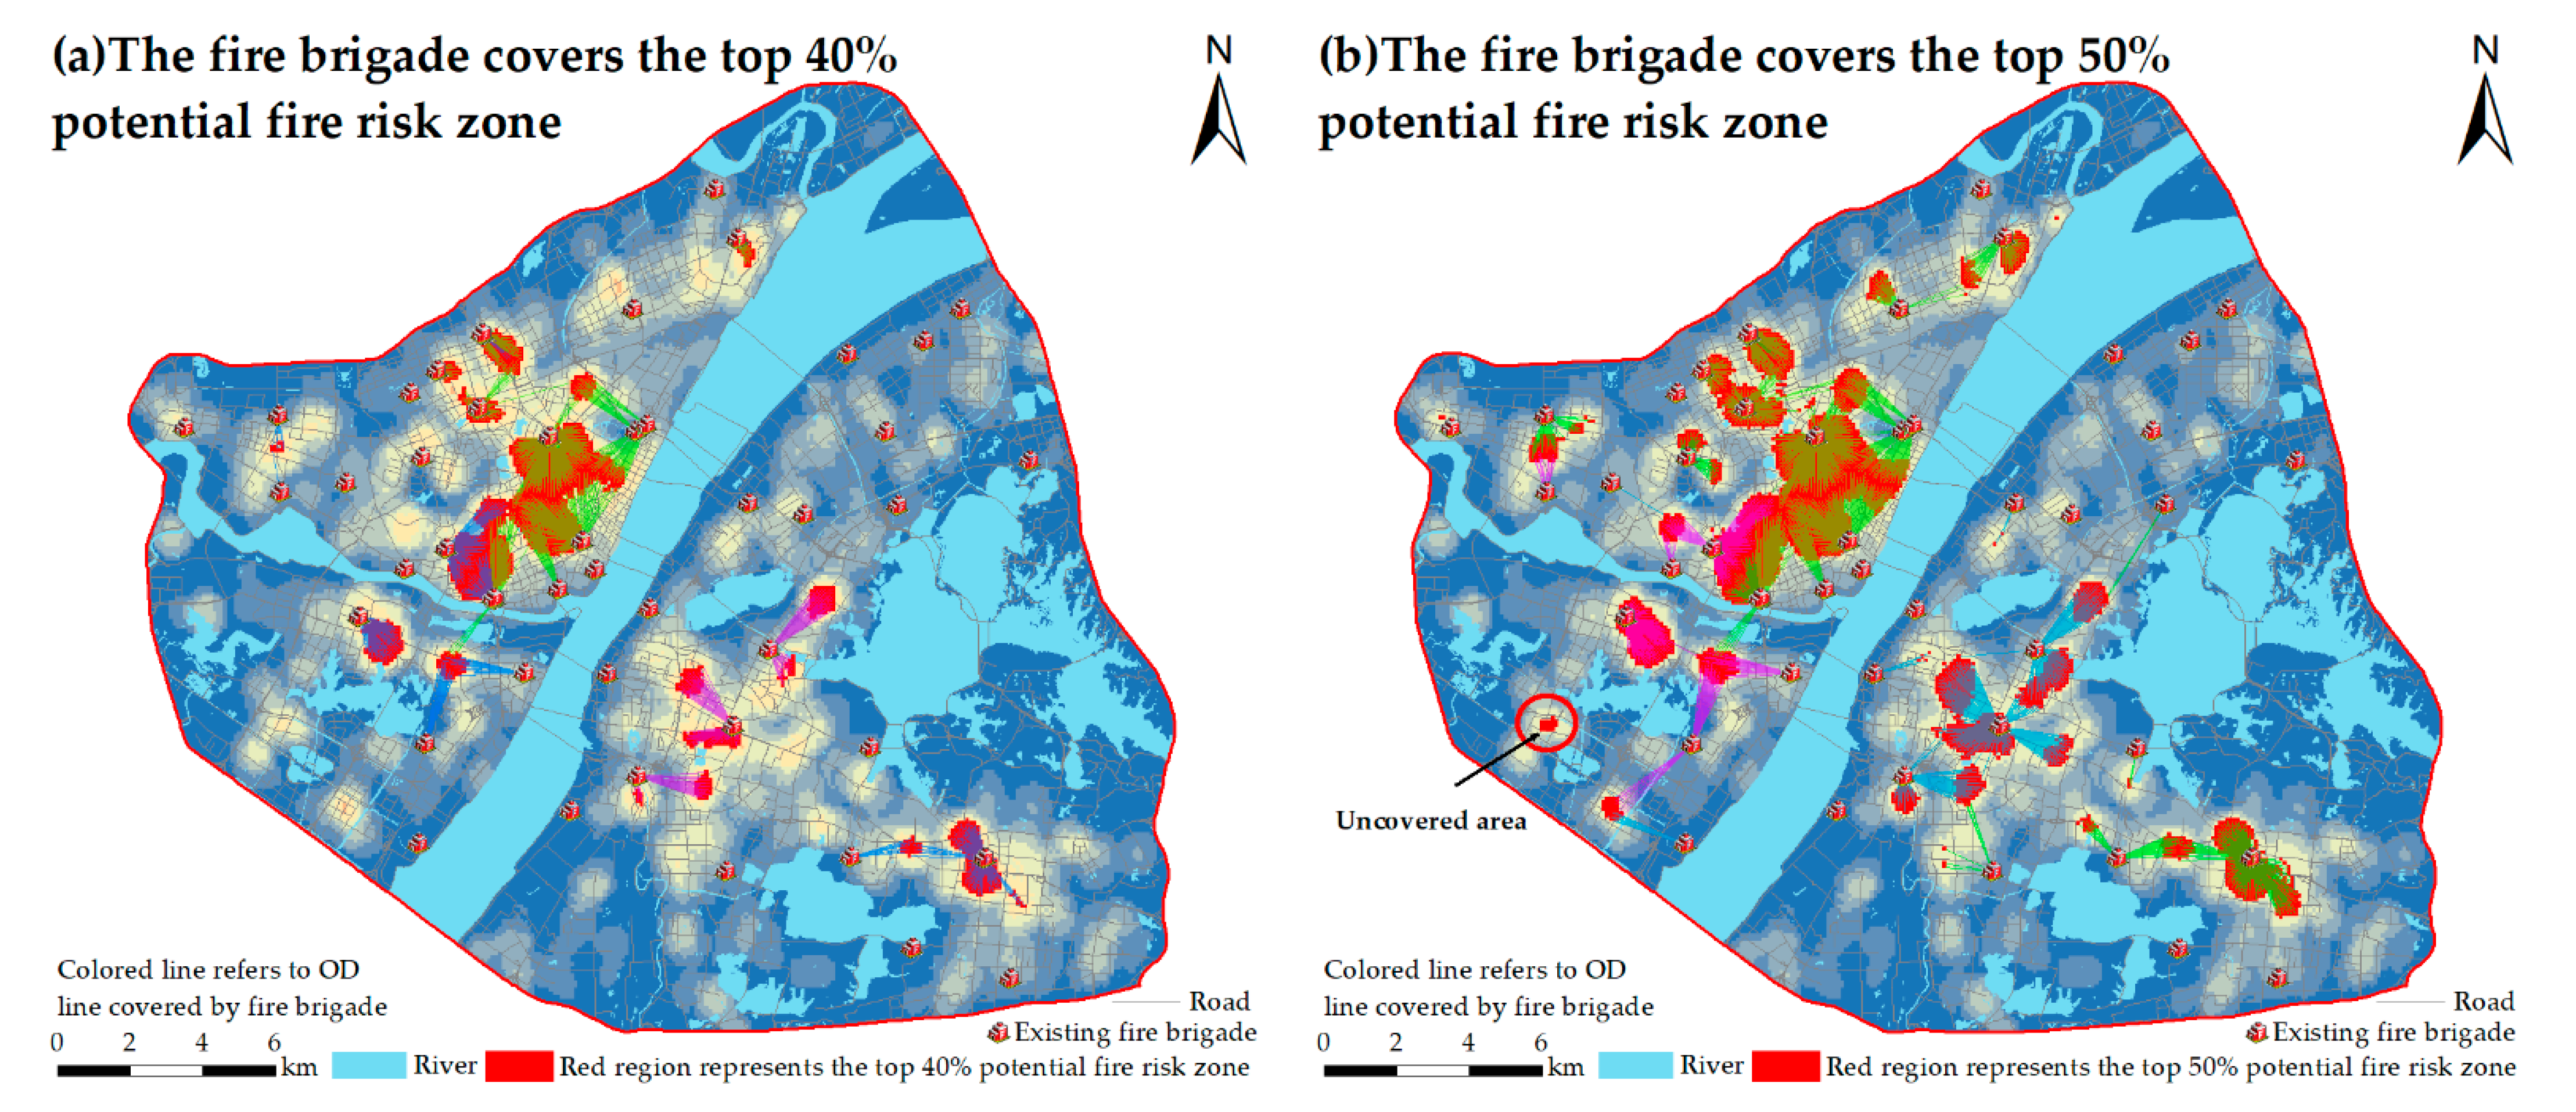
The MCLP method was used to analyze the coverage of the 47 existing fire brigades and set the response time to five minutes (see Figure 12). From the analysis of the overall coverage of urban buildings, of the 9981 buildings, existing fire brigades cover 9310 buildings, which gives a coverage rate of 93.28%. An analysis of the spatial distribution of uncovered buildings indicates that fire brigade rescue services are lacking in the north, south, southwest, and east areas. An analysis of the coverage of fire-risk areas indicates that the existing fire brigades cover 100% of the top 30% of fire-risk areas, and 98.3% of the top 50% of fire-risk areas, as shown in Figure 13. This spatial analysis shows that the existing fire brigades are evenly distributed but that there is a lack of fire brigades in the north, and there are fewer fire brigades in the edge areas. Some important risk areas, especially the top 50% of fire-risk areas, cannot achieve 100% full coverage within a response time of five minutes. Therefore, new fire brigades must be added in these fire-blind areas.
3.5. Spatial Optimization of Fire Brigades
- (1)
- Idealized fire brigade coverage predictions
In this section, two methods are used to solve the minimum facilities coverage problem, which allows us to optimize the spatial distribution and number of fire brigades. The problem involves several scenarios: In scenario 1, we select the candidate points of fire brigades for simulation without considering existing fire brigades to determine the minimum number of fire brigades needed. In scenario 2, we consider the existing fire brigade functions, and the candidate fire brigades are simulated for areas that do not satisfy the demand, and the maximum upper limit of new fire brigades is determined under the condition of existing fire brigades. Finally, in scenario 1, 36 fire brigades are simulated through five interactions and, in scenario 2, 63 fire brigades are simulated through three interactions (see Figure 14).
The 47 existing fire brigades are between the minimum and maximum number of fire brigades estimated in the above experiment. Although this number is reasonable, the spatial distribution shows that some fire brigades in the middle of the study area are densely distributed. The idealized model is established without considering the factors such as fire brigade area, human, and material resources. In practice, these factors should be considered together with the fire-risk and land-use differences over the whole study area. Therefore, we now consider the current situation of fire brigade coverage by existing fire brigades of fire-risk zones and building constructions within a response time of five minutes, and the fire brigade shall be built as dictated by local conditions. The following analysis determines which existing fire brigades to retain and where to add new fire brigades.
- (2)
- Selection of fire brigade sites for high-fire-risk zones
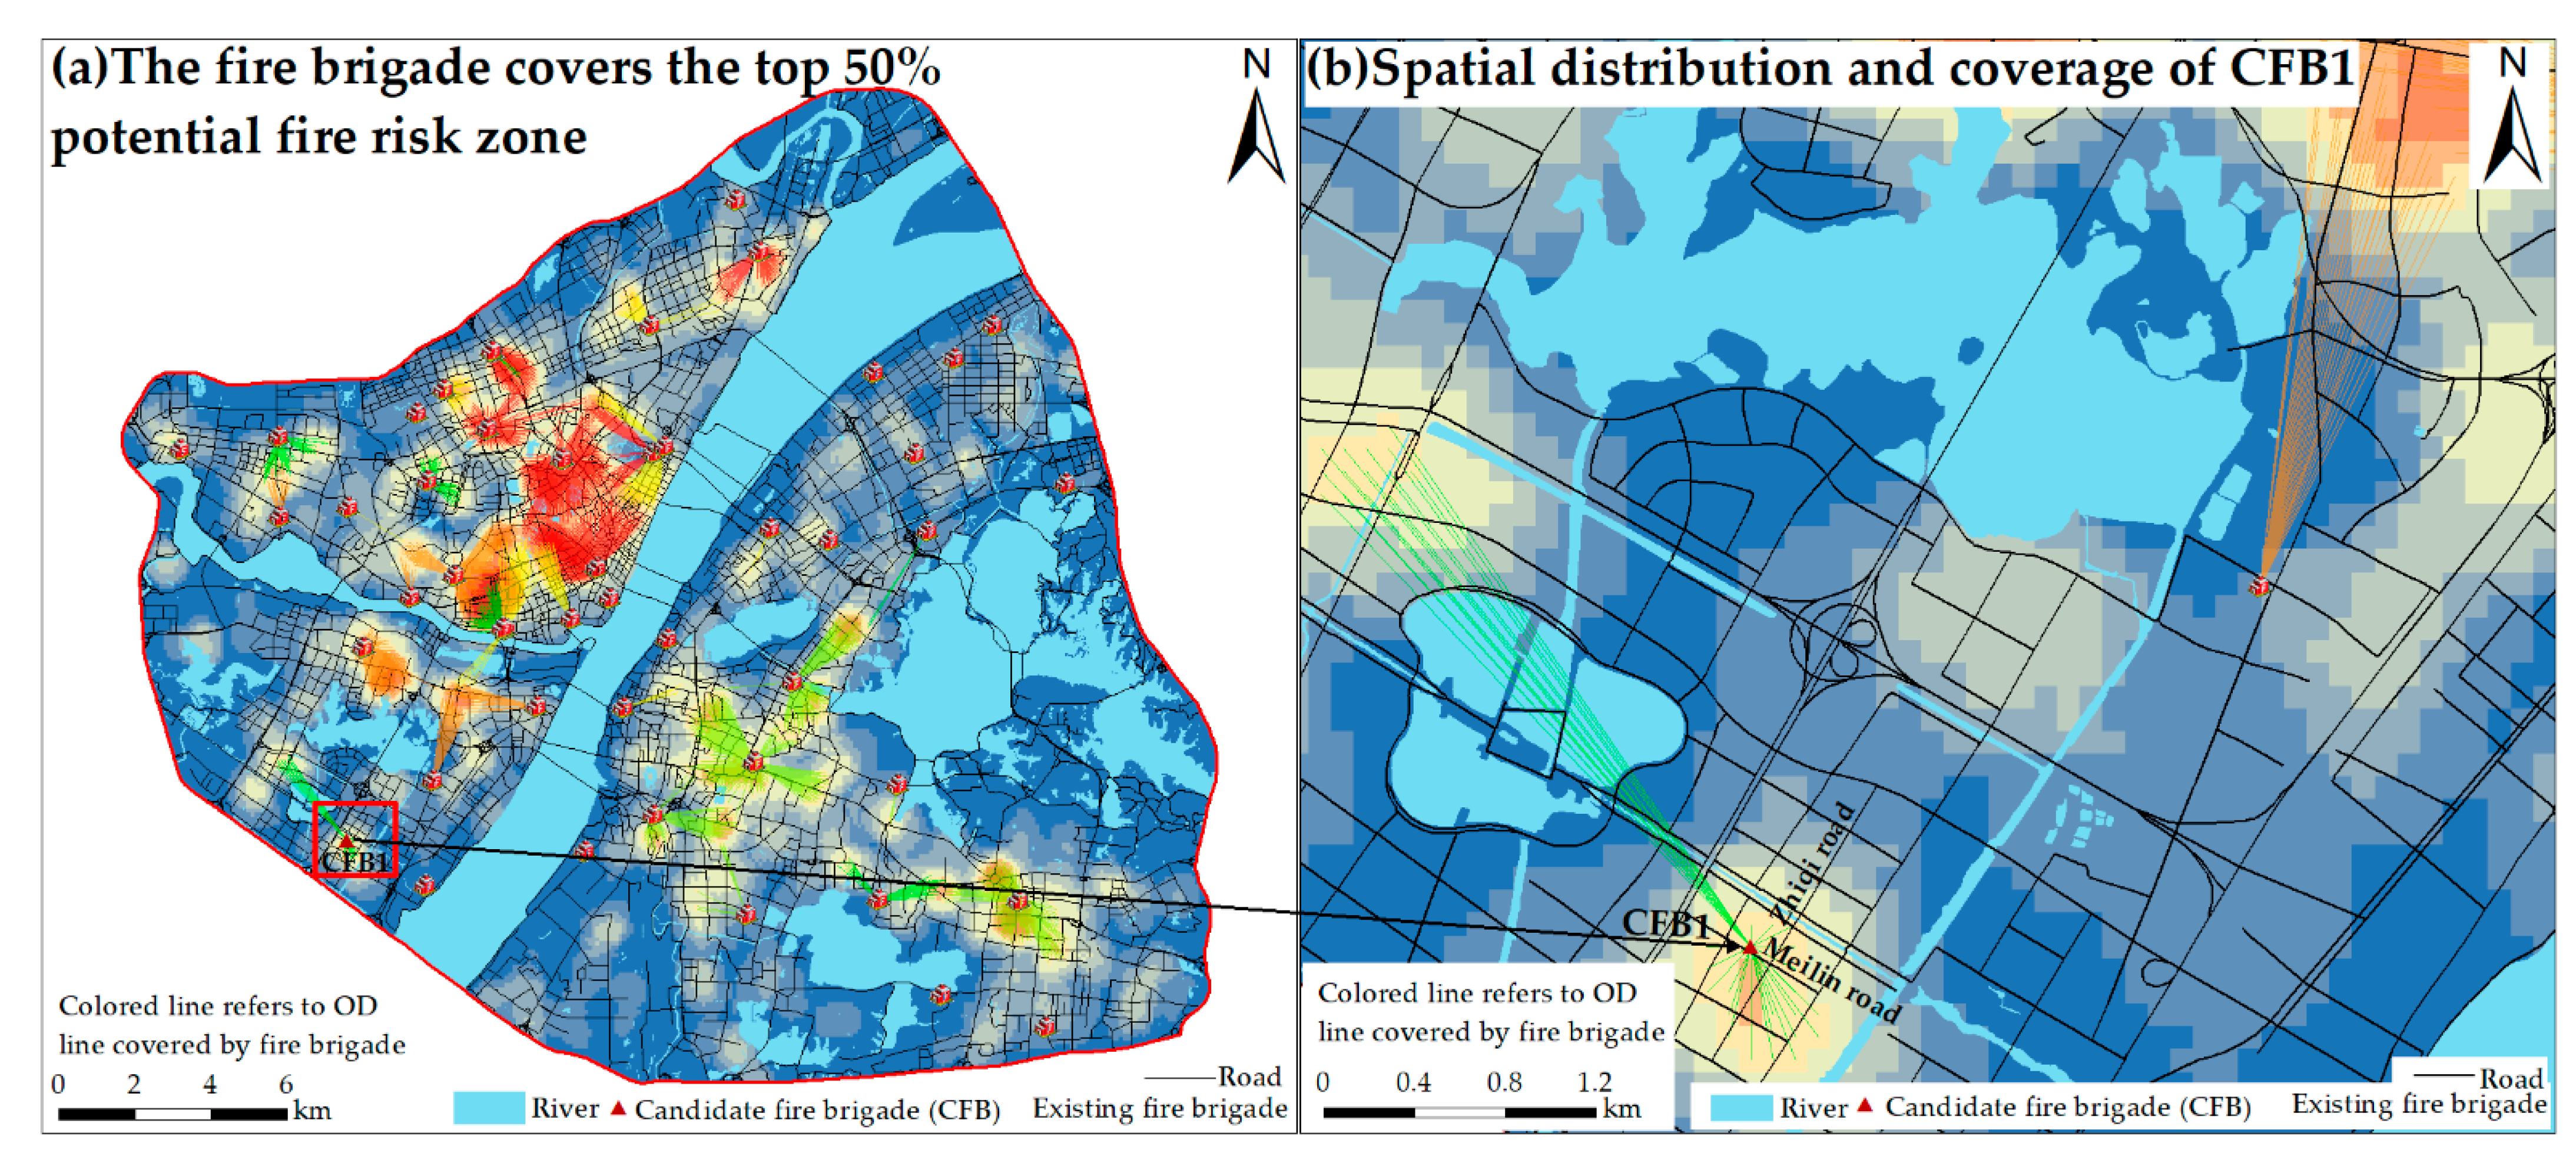
High-fire-risk zones refer to the top 50% of fire-risk areas. We set specific optimization indicators to increase the coverage of the top 50% of high-fire-risk areas to over 99%. Based on the 47 existing fire brigades, the MCLP model is used for the simulation. The results show that a new fire brigade should be added near the intersection of Zhiqi and Meilin roads to increase the coverage of high-fire-risk zones from 98.3% to 99.08% (as shown in Figure 15), which satisfies the specific optimization indexes.
- (3)
- Fire brigade optimization for total building construction rate
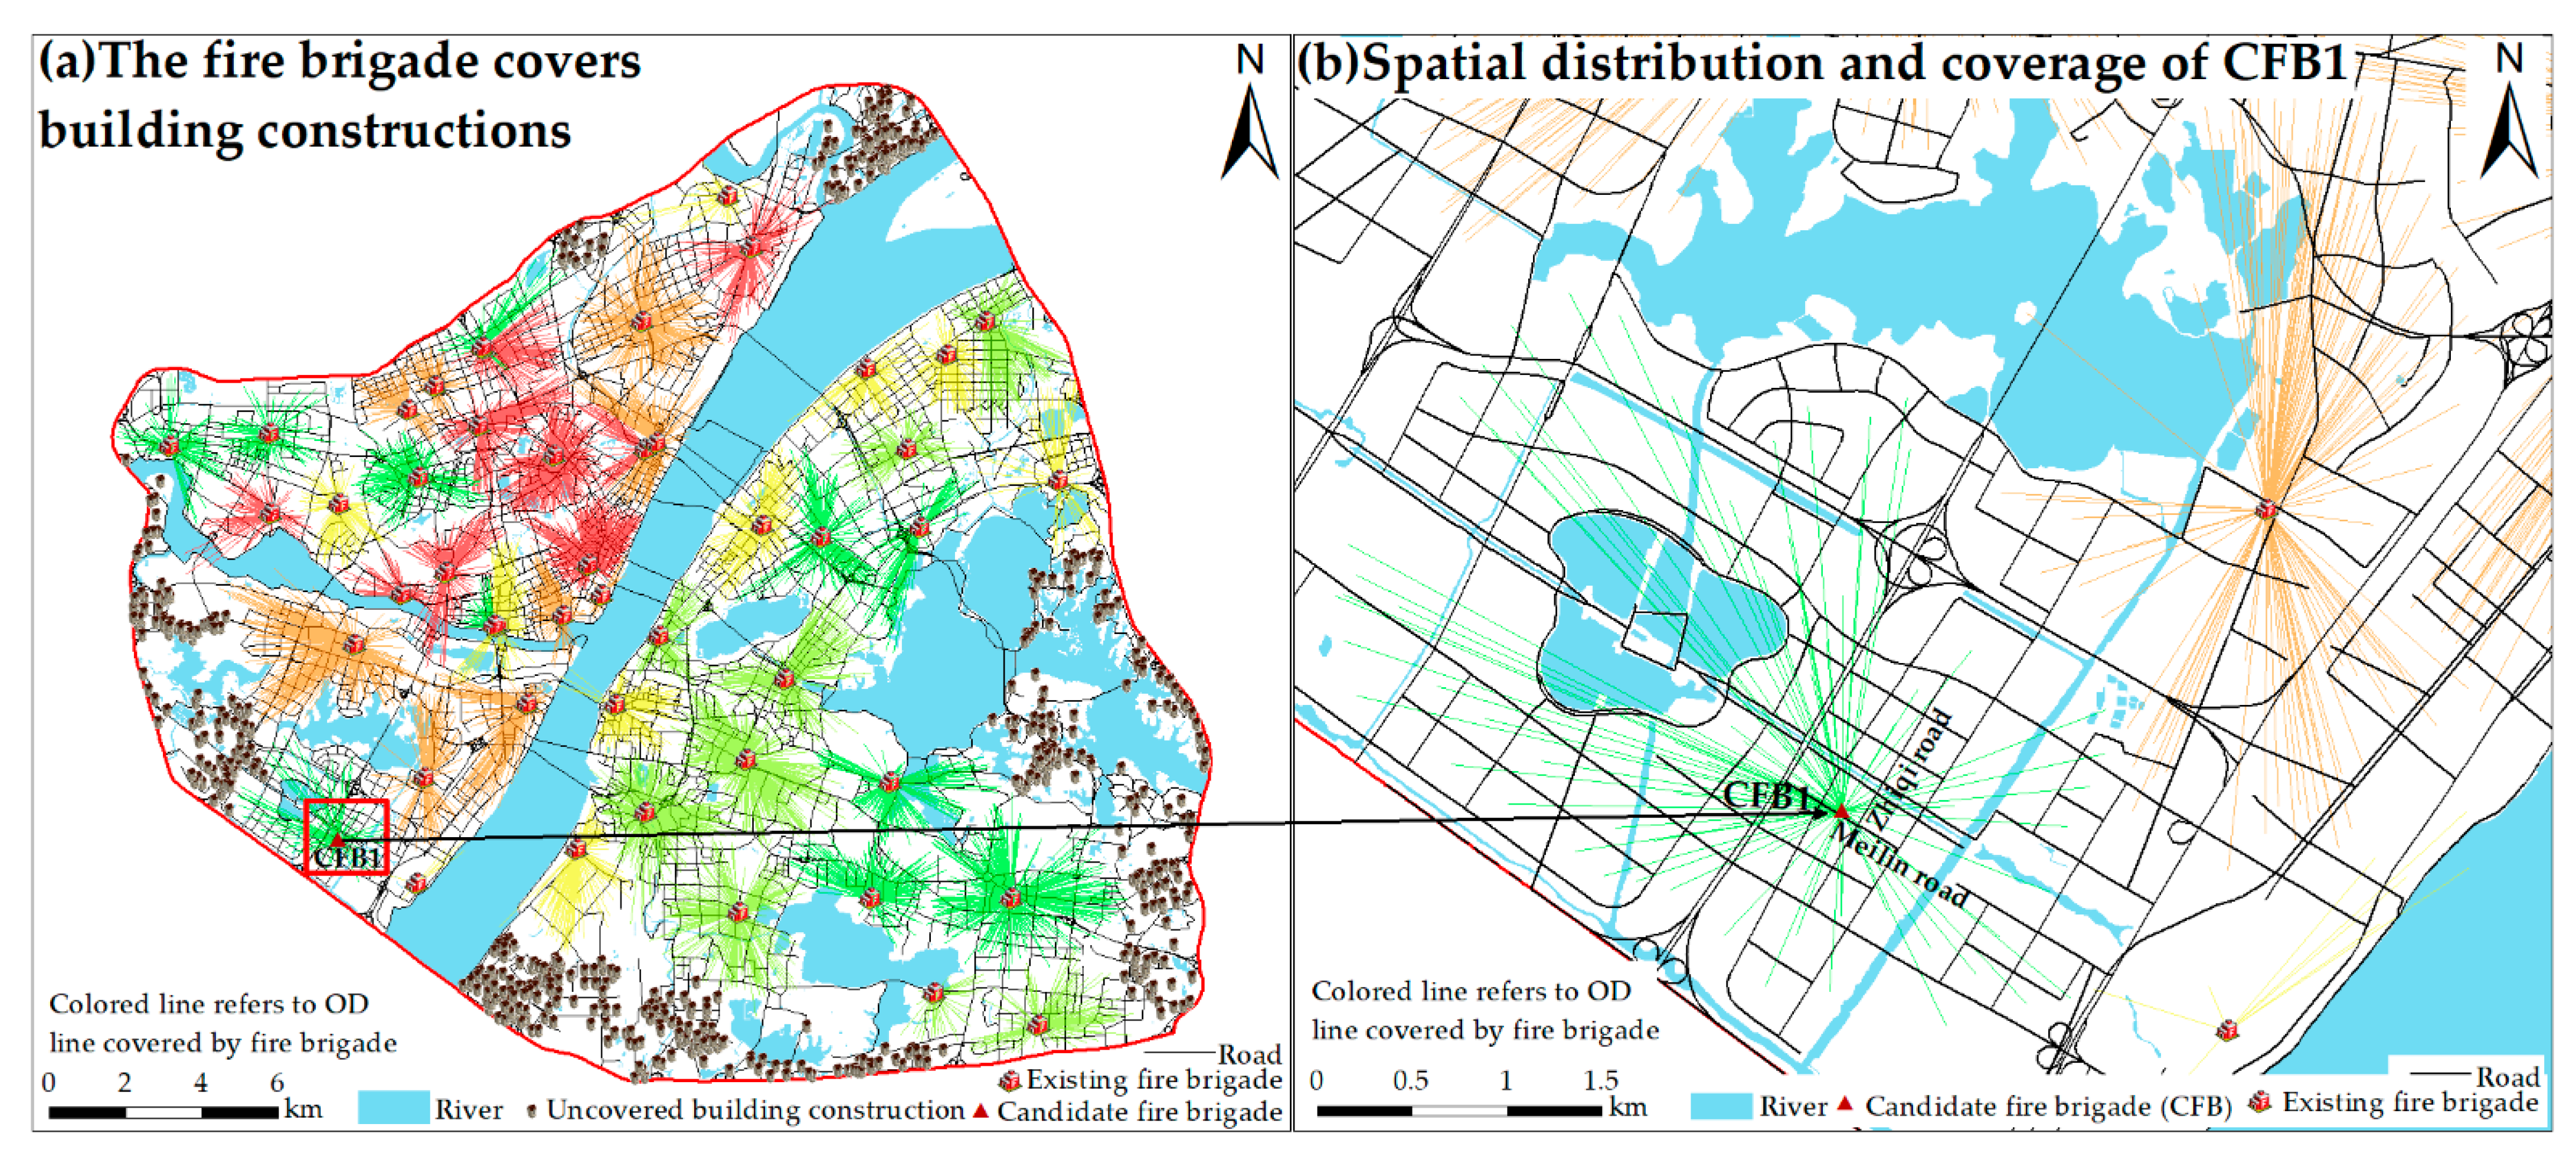
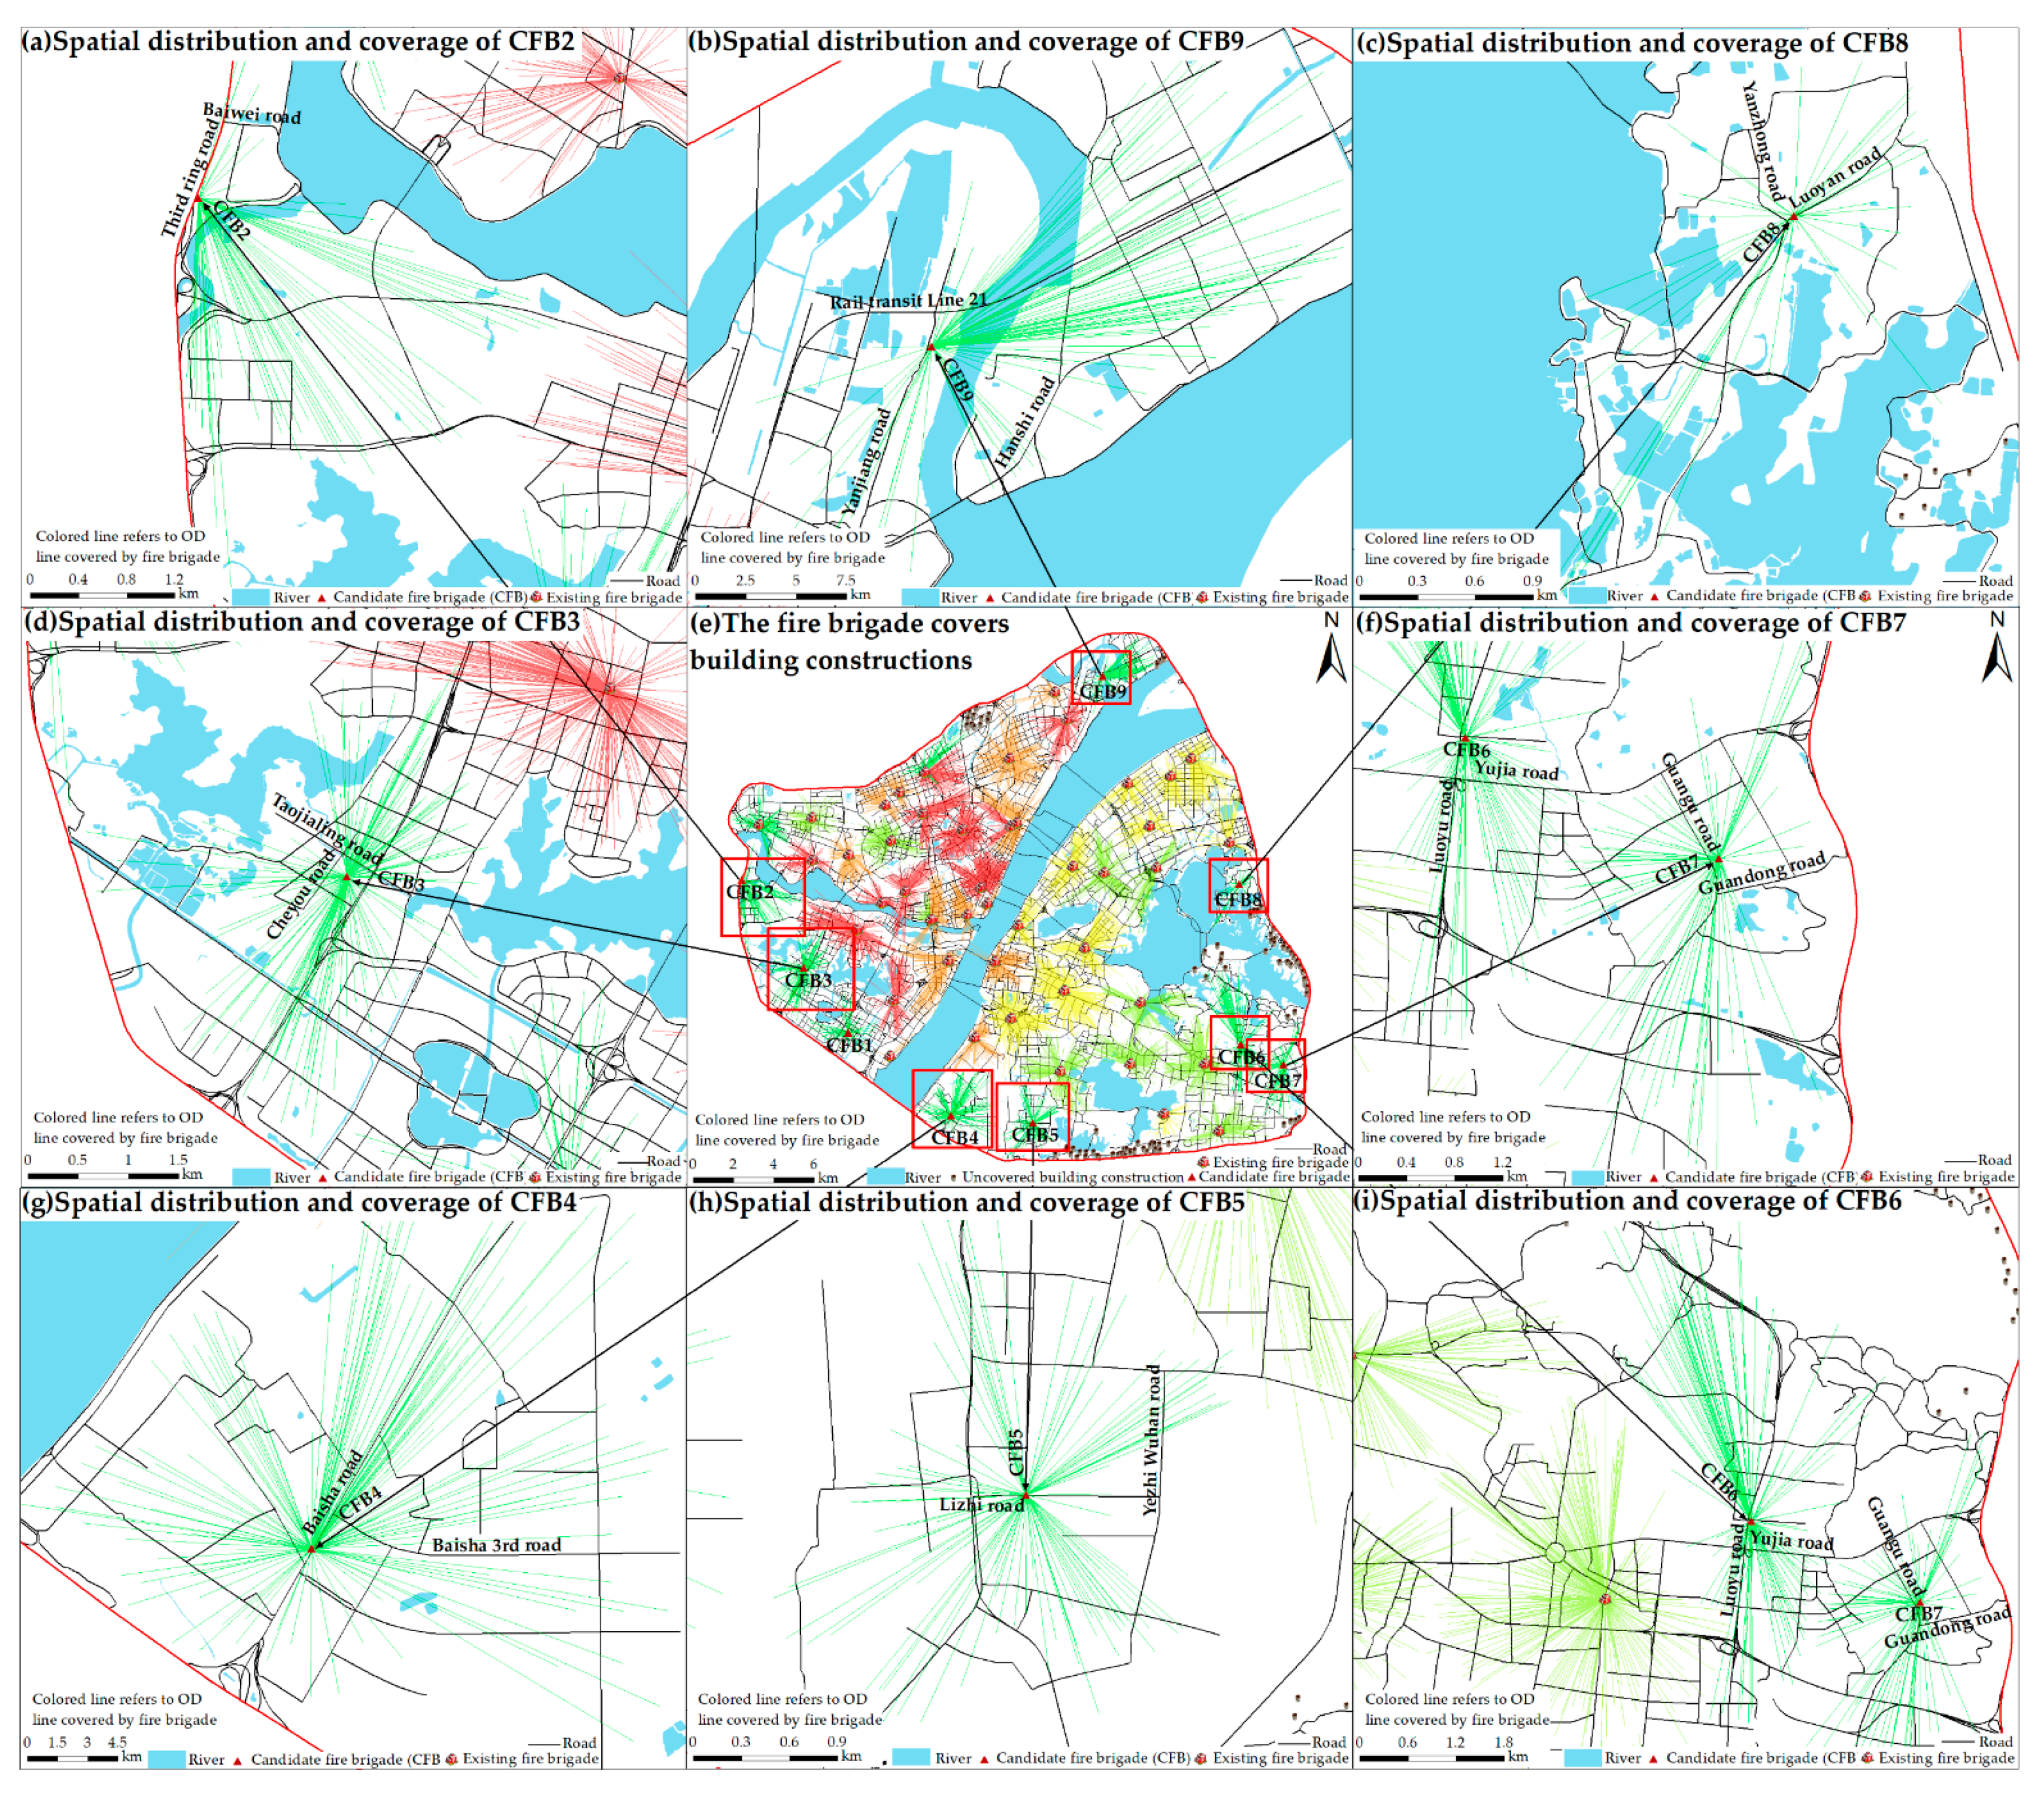
The purpose is to improve the coverage of all buildings in the study area. This is carried out based on experiment (2) above (selection of fire brigade sites for high-fire-risk zones). According to the actual situation of the study area, the specific optimization index is to increase the total building constructions coverage to more than 99%. When a new fire brigade is added, the coverage of buildings in the study area reaches 93.73% (as shown in Figure 16). Combined with the actual situation of the study, the goal is to increase the overall coverage of buildings to more than 99%. The simulation based on the MCLP model shows that the total coverage rate increases to 99.01%, covering a total of 9882 buildings (as shown in Figure 17), when a new fire brigade is set near the intersection of Cheyou road and Taojialing road, third ring road and Baiwei road, Baisha road and Baisha 3rd road, Lizhi road and Yezhi Wuhan road, Guandong road and Guangu road, Yujia road and Luoyu road, Luoyan road and Yanzhong road, and Yanjiang road and Rail transit line 21. This totals eight new fire brigades and ensures the coverage of most demands.
We establish an evaluation system for suitable areas for fire brigades with respect to fire-risk zones and use GIS methods to analyze and locate the existing fire brigades and candidate fire brigades under multiple scenarios (such as the coverage of the top 50% of fire-risk zones and buildings) using the MCLP and LSCP models. Finally, the optimized results for fire brigades in the study area are obtained. On top of the 47 fire existing fire brigades, nine fire brigades need to be added, making a total of 56 fire brigades, which is within the given range.
4. Discussion
As China experiences rapid industrialization and urbanization, urban safety has become an important problem that concerns many people, so a reasoned placement of urban fire brigades is very important. In cities, land-use, building functions, and risk status often vary, so there may be a lack of assessment of the risk profile, making fire brigade placement irrational. For city managers and emergency responders, the challenge of prevention can be daunting. As one of the biggest cities in China, Wuhan has the same urban security problems that most cities face. Therefore, Wuhan is a good representative region for use as a research area in this article. Due to the constraints imposed by the existing buildings in the city, areas that are not suitable for building fire brigades are excluded. In addition, considering the POI has high timeliness and wide coverage in terms of geographic location, we demonstrate herein the potential and value of POI in urban fire-risk assessment. At the same time, with the development of Internet technology, the spatiotemporal road network data cover most cities. Therefore, the framework of this work can be transferred to other types of cities.
However, cities are giant, complex, and dynamic systems, which means some problems remain unsolved. First, POI data are abstract points without building area, building volume, and building shape, so they cannot reflect the size of the building, which may affect the estimation accuracy of firefighting areas. Second, the same type of POI data may indicate a different fire intensity. For example, different materials processed inside a chemical plant may cause a different fire risk. Such detailed information is difficult to obtain. Third, the methods and frameworks proposed in this article are implemented in different fields of interest, and the impact of different facility locations may need to consider different factors and local characteristics. For example, PV and CSP site selection needs to combine the effects of light intensity and light time [56]. Finally, a comprehensive site selection of the fire brigade needs to be conducted based on historical fire data. We believe that with the development of information and communication technology, the emergence of new data will further aid in solving these problems.
5. Conclusions
This paper presents the results of an evaluation of the suitability of sites for fire brigades in Wuhan, China. According to the city fire-risk assessment method and the existing specifications, the POI data are divided into different fire-risk zones, which are standardized and weighted with the help of an AHP model, and the distribution of fire-risk zones is identified through overlay. The position of new fire brigades is optimized based on the existing fire brigades and upon considering their impact on the top 50% high-fire-risk zones and the overall building construction areas, with the overall goal being to improve service efficiency and shorten attendance time. The results lead to the following conclusions:
- (1)
- An analysis reveals a good overall building coverage offered by the existing 47 fire brigades in the study area. These fire brigades cover 9310 buildings, for a coverage rate of 93.28%. An analysis of the coverage zones indicates a lack of fire brigade rescue services in the north, south, southwest, and east of the study area. An analysis of the coverage of fire-risk zones shows that the existing fire brigades cover 100% of the top 10% fire-risk areas, 100% of the top 30% fire-risk areas, and 98.3% of the top 50% fire-risk areas.
- (2)
- To attain the goal of improving the overall coverage of the top 50% high-fire-risk areas and buildings, we selected optimal fire brigade sites. Nine new fire brigades are proposed, which would increase the overall coverage to 99.01% for buildings and 99.08% for the top 50% high-fire-risk areas, thereby ensuring that most demand points are covered.
Author Contributions
Conceptualization, Yuncheng Jiang and Zhigang Yan; methodology, Yuncheng Jiang and Zhigang Yan; software, Zhigang Yan and Aifeng Lv; validation, Aifeng Lv, Zhigang Yan, and Zhen Yang; formal analysis, Yuncheng Jiang; investigation, Zhigang Yan; resources, Yuncheng Jiang; data curation, Yuncheng Jiang; writing—original draft preparation, Yuncheng Jiang; writing—review and editing, Yuncheng Jiang, Zhigang Yan, and Aifeng Lv; visualization, Yuncheng Jiang; supervision, Zhigang Yan and Aifeng Lv; project administration, Zhigang Yan; funding acquisition, Zhigang Yan and Aifeng Lv. All authors have read and agreed to the published version of the manuscript.
Funding
This research was funded in part by the National Natural Science Foundation of China [No. 41971370], and in part by the National Key Research and Development Program of China [No. 2017YFC1502903].
Institutional Review Board Statement
Not applicable.
Informed Consent Statement
Not applicable.
Data Availability Statement
The data used in this study are available from the corresponding author upon reasonable request.
Acknowledgments
The authors would like to thank the anonymous reviewers for their helpful and valuable comments and suggestions.
Conflicts of Interest
The authors declare no conflict of interest.
References
- Dong, X.M.; Li, Y.; Pan, Y.L.; Huang, Y.J.; Cheng, X.D. Study on urban fire station planning based on fire risk assessment and GIS technology. Procedia Eng. 2018, 211, 124–130. [Google Scholar] [CrossRef]
- Xu, D.S.; Zeng, J.X. Evaluation of China’s urbanization quality and analysis of its spatial pattern transformation based on the modern life index. Acta Geogr. Sin. 2016, 71, 194–204. [Google Scholar]
- Wang, W.; Xu, Z.; Sun, D.; Lan, T. Spatial optimization of mega-city fire stations based on multi-source geospatial data: A case study in Beijing. ISPRS Int. J. Geo-Inf. 2021, 10, 282. [Google Scholar] [CrossRef]
- China Fire Yearbook Editorial Board. 2020. Available online: http://www.china-fire.com/ (accessed on 6 October 2021).
- Ceyhan, E.; Kıvanç, E.; Şebnem, D. Exploratory and inferential methods for spatio-temporal analysis of residential fire clustering in urban areas. Fire Saf. J. 2013, 58, 226–239. [Google Scholar] [CrossRef] [Green Version]
- Kiran, K.C.; Jonathan, C. Modelling residential fire incident response times: A spatial analytic approach. Appl. Geogr. 2017, 84, 64–74. [Google Scholar] [CrossRef]
- Xia, Z.; Li, H.; Chen, Y. An integrated spatial clustering analysis method for identifying urban fire risk locations in a network-constrained environment: A case study in nanjing, china. ISPRS Int. J. Geo-Inf. 2017, 6, 370. [Google Scholar] [CrossRef]
- Zhou, L.; Dang, X.; Sun, Q.; Wang, S. Multi-scenario simulation of urban land change in Shanghai by random forest and CA-Markov model. Sustain. Cities Soc. 2020, 55, 102045. [Google Scholar] [CrossRef]
- Wuschke, K.; Clare, J.; Garis, L. Temporal and geographic clustering of residential structure fires: A theoretical platform for targeted fire prevention. Fire Saf. J. 2013, 62, 3–12. [Google Scholar] [CrossRef]
- Hong, C. Study on optimization of the spatial distribution of city fire station in Lu’an city. Fire Sci. Technol. 2009, 5, 321–326. [Google Scholar]
- Hogg, J. The siting of fire stations. J. Oper. Res. Soc. 1968, 19, 275–287. [Google Scholar] [CrossRef]
- Helly, W. Urban Systems Models; Academic Press: Cambridge, MA, USA, 1975. [Google Scholar] [CrossRef]
- Plane, D.R.; Thomas, E.; Hendrick, T.E. Mathematical programming and the location of fire companies for the Denver fire department. Oper. Res. 1977, 25, 563–578. [Google Scholar] [CrossRef]
- Reilly, J.M.; Mirchandani, P.B. Development and application of a fire station placement model. Fire Technol. 1985, 21, 181–198. [Google Scholar] [CrossRef]
- Habibi, K.; Lotfi, S.; Koohsari, M.J. Spatial analysis of urban fire station locations by integrating AHP model and IO logic using GIS (a case study of zone 6 of Tehran). J. Appl. Sci. 2008, 8, 3302–3315. [Google Scholar] [CrossRef]
- Erden, T.; Coşkun, M.Z. Multi-criteria site selection for fire services: The interaction with analytic hierarchy process and geographic information systems. Nat. Hazards Earth Syst. Sci. 2010, 10, 2127–2134. [Google Scholar] [CrossRef]
- Chaudhary, P.; Chhetri, S.K.; Joshi, K.M.; Shrestha, B.M.; Kayastha, P. Application of an Analytic Hierarchy Process (AHP) in the GIS interface for suitable fire site selection: A case study from Kathmandu Metropolitan city, Nepal. Socio-Econ. Plan. Sci. 2016, 53, 60–71. [Google Scholar] [CrossRef]
- Chen, C.; Ren, A. Optimization of fire station locations using computer. Qinghua Daxue Xuebao/J. Tsinghua Univ. (China) 2003, 43, 1390–1393. [Google Scholar]
- Murray, A.T. Optimising the spatial location of urban fire stations. Fire Saf. J. 2013, 62, 64–71. [Google Scholar] [CrossRef]
- Owen, S.H.; Daskin, M.S. Strategic facility location: A review. Eur. J. Oper. Res. 1998, 111, 423–447. [Google Scholar] [CrossRef]
- Badri, M.A.; Mortagy, A.K.; Alsayed, C.A. A multi-objective model for locating fire stations. Eur. J. Oper. Res. 1998, 110, 243–260. [Google Scholar] [CrossRef]
- Chevalier, P.; Thomas, I.; Geraets, D.; Goetghebeur, E.; Janssens, O.; Peeters, D.; Plastria, F. Locating fire stations: An integrated approach for Belgium. Socio-Econ. Plan. Sci. 2012, 46, 173–182. [Google Scholar] [CrossRef] [Green Version]
- Barr, R.C.; Caputo, A.P. Planning fire station locations. In Fire Protection Handbook; Cote, A.E., Ed.; National Fire Protection Association: Quincy, MA, USA, 1996; pp. 311–318. [Google Scholar]
- Yang, L.; Jones, B.F.; Yang, S.H. A fuzzy multi-objective programming for optimization of fire station locations through genetic algorithms. Eur. J. Oper. Res. 2007, 181, 903–915. [Google Scholar] [CrossRef] [Green Version]
- Schreuder, J.A.M. Application of a location model to fire stations in Rotterdam. Eur. J. Oper. Res. 1981, 6, 212–219. [Google Scholar] [CrossRef] [Green Version]
- Kanoun, I.; Chabchoub, H.; Aouni, B. Goal programming model for fire and emergency service facilities site selection. INFOR: Inf. Syst. Oper. Res. 2010, 48, 143–153. [Google Scholar] [CrossRef] [Green Version]
- Liu, N.; Huang, B.; Chandramouli, M. Optimal siting of fire stations using GIS and ANT algorithm. J. Comput. Civ. Eng. 2006, 20, 361–369. [Google Scholar] [CrossRef] [Green Version]
- Uno, T.; Kato, K.; Katagiri, H. An application of interactive fuzzy satisficing approach with particle swarm optimization for multi-objective emergency facility location problem with a-distance. In 2007 IEEE Symposium on Computational Intelligence in Multi-Criteria Decision-Making; IEEE: Kagamiyama, Japan, 2007. [Google Scholar] [CrossRef]
- Li, X.; Xu, G.; Chen, E.; Zong, Y. Learning recency based comparative choice towards point-of-interest recommendation. Expert Syst. Appl. 2015, 42, 4274–4283. [Google Scholar] [CrossRef]
- Yao, Y.; Li, X.; Liu, X.; Liu, P.; Liang, Z.; Zhang, J.; Mai, K. Sensing spatial distribution of urban land use by integrating points-of-interest and Google Word2Vec model. Int. J. Geogr. Inf. Sci. 2017, 31, 825–848. [Google Scholar] [CrossRef]
- Milias, V.; Psyllidis, A. Assessing the influence of point-of-interest features on the classification of place categories. Comput. Environ. Urban Syst. 2021, 86, 101597. [Google Scholar] [CrossRef]
- Martí, P.; Serrano-Estrada, L.; Nolasco-Cirugeda, A. Social media data: Challenges, opportunities and limitations in urban studies. Comput. Environ. Urban Syst. 2019, 74, 161–174. [Google Scholar] [CrossRef]
- Xiong, X.; Qiao, S.; Li, Y.; Han, N.; Yuan, G.; Zhang, Y. A point-of-interest suggestion algorithm in Multi-source geo-social networks. Eng. Appl. Artif. Intell. 2020, 88, 103374. [Google Scholar] [CrossRef]
- Zhu, D.; Wang, N.; Wu, L.; Liu, Y. Street as a big geo-data assembly and analysis unit in urban studies: A case study using Beijing taxi data. Appl. Geogr. 2017, 86, 152–164. [Google Scholar] [CrossRef]
- McKenzie, G.; Janowicz, K. Where is also about time: A location-distortion model to improve reverse geocoding using behavior driven temporal semantic signatures. Comput. Environ. Urban Syst. 2015, 54, 1–13. [Google Scholar] [CrossRef]
- Wuhan Municipal Statistics Bureau; State Statistical Bureau Wuhan Investigation Team. Wuhan Statistical Yearbook 2020; China Statistics Press: Wuhan, China, 2020; Volume 32, p. 9. Available online: http://tjj.hubei.gov.cn/tjsj/sjkscx/tjnj/gsztj/whs/202102/P020210202610060079335.pdf (accessed on 10 October 2021).
- Aly, A.; Jensen, S.S.; Pedersen, A.B. 2017. Solar power potential of Tanzania: Identifying CSP and PV hot spots through a GIS multicriteria decision making analysis. Renew. Energ. 2017, 113, 159–175. [Google Scholar] [CrossRef]
- Zhan, Q.M.; Yang, S. Optimization of emergency facilities layout in villages. J. Geo-Inf. Sci. 2019, 21, 641–653. [Google Scholar] [CrossRef]
- Kim, M.O.; Kim, K.; Yun, J.H.; Kim, M.K. Fire risk assessment of cable bridges for installation of firefighting facilities. Fire Saf. J. 2020, 115, 103146. [Google Scholar] [CrossRef]
- Chainey, S.P. Examining the influence of cell size and bandwidth size on kernel density estimation crime hotspot maps for predicting spatial patterns of crime. Bull. Geogr. Soc. Liege 2013, 60, 7–19. [Google Scholar]
- Lin, Y.P.; Chu, H.J.; Wu, C.F.; Chang, T.K.; Chen, C.Y. Hotspot analysis of spatial environmental pollutants using kernel density estimation and geostatistical techniques. Int. J. Environ. Res. Public Health 2011, 8, 75–88. [Google Scholar] [CrossRef]
- Silverman, B.W. Density Estimation for Statistics and Data Anal, 1st ed.; Routledge: Bath, UK, 1998. [Google Scholar] [CrossRef]
- Potić, I.; Golić, R.; Joksimović, T. Analysis of insolation potential of Knjaževac Municipality (Serbia) using multi-criteria approach. Renew. Sustain. Energy Rev. 2016, 56, 235–245. [Google Scholar] [CrossRef]
- de FSM Russo, R.; Camanho, R. Criteria in AHP: A systematic review of literature. Procedia Comput. Sci. 2015, 55, 1123–1132. [Google Scholar] [CrossRef] [Green Version]
- Dožić, S.; Kalić, M. Comparison of two MCDM methodologies in aircraft type selection problem. Transp. Res. Procedia 2015, 10, 910–919. [Google Scholar] [CrossRef] [Green Version]
- Saaty, T.L. An Eigenvalue Allocation Model for Prioritization and Planning; Energy Management and Policy Center, University of pennsylvania: Philadelphia, PA, USA, 1972; pp. 28–31. [Google Scholar]
- Höfer, T.; Sunak, Y.; Siddique, H.; Madlener, R. Wind farm siting using a spatial Analytic Hierarchy Process approach: A case study of the Städteregion Aachen. Appl. Energy 2016, 163, 222–243. [Google Scholar] [CrossRef]
- Rinner, C.; Voss, S. MCDA4ArcMap–an open-source multi-criteria decision analysis and geovisualization tool for ArcGIS 10. Feature Artic. Cart. Newsl. Can. Cartogr. Assoc. 2013, 86, 12–13. [Google Scholar]
- Pinar, A.O.; Yasin, E.M.; Ertugrul, C.; Cam, E.; Inanc, N. Optimal site selection for a solar power plant in the central anatolian region of Turkey. Int. J. Photoenergy 2017, 2017, 1–13. [Google Scholar] [CrossRef] [Green Version]
- Chakraborty, S.; Banik, D. Design of a material handling equipment selection model using analytic hierarchy process. Int. J. Adv. Manuf. Technol. 2006, 28, 1237–1245. [Google Scholar] [CrossRef]
- Umagandhi, R.; Kumar, A.S. Search query recommendations in web information retrieval using query logs. In Web Usage Mining Techniques and Applications across Industries; IGI Global: Coimbatore, India, 2017; pp. 199–222. [Google Scholar] [CrossRef] [Green Version]
- Pardeshi, S.D.; Autade, S.E.; Pardeshi, S.S. Landslide hazard assessment: Recent trends and techniques. SpringerPlus 2013, 2, 1–11. [Google Scholar] [CrossRef] [Green Version]
- Nagarajan, R.; Roy, A.; Kumar, R.V.; Mukherjee, A.; Khire, M.V. Landslide hazard susceptibility mapping based on terrain and climatic factors for tropical monsoon regions. Bull. Eng. Geol. Environ. 2000, 58, 275–287. [Google Scholar] [CrossRef]
- Doorga, J.R.; Rughooputh, S.D.; Boojhawon, R. Multi-criteria GIS-based modelling technique for identifying potential solar farm sites: A case study in Mauritius. Renew. Energy 2019, 133, 1201–1219. [Google Scholar] [CrossRef]
- Coburn, T.C. GIS and multicriteria decision analysis. Comput. Geosci. 2000, 9, 1067–1068. [Google Scholar] [CrossRef]
- Sun, L.; Jiang, Y.; Guo, Q.; Ji, L.; Xie, Y.; Qiao, Q.; Xiao, K. A GIS-based multi-criteria decision making method for the potential assessment and suitable sites selection of PV and CSP plants. Resour. Conserv. Recycl. 2021, 168, 105306. [Google Scholar] [CrossRef]
- Gay, W.; Siegel, A. Fire station location analysis: A comprehensive planning approach. ICMA MIS Rep. 1987, 19, 1–17. [Google Scholar]
- Johnston, J. The cost effectiveness of fire station siting and the impact on emergency response. Natl. Fire Acad. 1999, 1, 1. [Google Scholar]
- Cooper, L. Location-allocation problems. Oper. Res. 1963, 11, 331–343. [Google Scholar] [CrossRef]
- Menezes, R.C.; Pizzolato, N.D. Locating public schools in fast expanding areas: Application of the capacitated p-median and maximal covering location models. Pesqui. Oper. 2014, 34, 301–317. [Google Scholar] [CrossRef] [Green Version]
- Zarrinpoor, N.; Fallahnezhad, M.S.; Pishvaee, M.S. Design of a reliable hierarchical location-allocation model under disruptions for health service networks: A two-stage robust approach. Comput. Ind. Eng. 2017, 109, 130–150. [Google Scholar] [CrossRef]
- Rahman, M.; Chen, N.; Islam, M.M.; Dewan, A.; Pourghasemi, H.R.; Washakh RM, A.; Ahmed, N. Location-allocation modeling for emergency evacuation planning with GIS and remote sensing: A case study of Northeast Bangladesh. Geosci. Front. 2021, 12, 101095. [Google Scholar] [CrossRef]
Figure 1.
The geographic location of the study region in this study. (a) Geographic situation of study area; (b) regional situation of study area; (c) urban view of study area, showing the three ring roads of Wuhan, China.
Figure 1.
The geographic location of the study region in this study. (a) Geographic situation of study area; (b) regional situation of study area; (c) urban view of study area, showing the three ring roads of Wuhan, China.

Figure 2.
Flow chart of proposed method for selecting fire brigade locations.

Figure 3.
Framework of method for identifying fire-risk zones.

Figure 4.
Flowchart for generating the average-speed road network.

Figure 5.
Constrained layer of Wuhan’s central city.

Figure 6.
Kernel density distribution of various fire-risk zones (Natural Breaks method).

Figure 7.
Spatial distribution of fire-risk zones (central area of Wuhan).

Figure 8.
Spatial distribution of evaluation criteria layer (includes potential fire-risk zones, population, proximity to roads, proximity to existing fire brigades, proximity to the river, and orography).
Figure 8.
Spatial distribution of evaluation criteria layer (includes potential fire-risk zones, population, proximity to roads, proximity to existing fire brigades, proximity to the river, and orography).

Figure 9.
Evaluation of suitability for fire brigades.

Figure 10.
Average vehicle speed as a function of time.

Figure 11.
Average speeds on Wuhan road network.

Figure 12.
Spatial distribution of proximity of existing fire brigades to building construction areas.
Figure 12.
Spatial distribution of proximity of existing fire brigades to building construction areas.

Figure 13.
Spatial distribution of proximity of existing fire brigades to fire-risk areas. (a) Fire brigade covers the top 40% potential fire-risk zones. (b) Fire brigade covers the top 50% potential fire-risk zones.
Figure 13.
Spatial distribution of proximity of existing fire brigades to fire-risk areas. (a) Fire brigade covers the top 40% potential fire-risk zones. (b) Fire brigade covers the top 50% potential fire-risk zones.

Figure 14.
Minimum facilities coverage problem for existing fire brigades in idealized case.

Figure 15.
Spatial distribution of fire brigades that satisfy the needs of the top 50% high-fire-risk zones.
Figure 15.
Spatial distribution of fire brigades that satisfy the needs of the top 50% high-fire-risk zones.

Figure 16.
For experiment (2), the spatial distribution of 48 fire brigades in all building construction sites.
Figure 16.
For experiment (2), the spatial distribution of 48 fire brigades in all building construction sites.

Figure 17.
For experiment (3), the spatial distribution of 56 fire brigades in all building construction sites.
Figure 17.
For experiment (3), the spatial distribution of 56 fire brigades in all building construction sites.


Table 1.
POI data classification table.
| Fire-Risk Zone | POI Data Category |
|---|---|
| Flammable and explosive zone | Chemical plants, gas stations, manufacturing enterprises, etc. |
| Vulnerable-people zone | Kindergartens, elementary schools, junior high schools, emergency centers, hospitals, etc. |
| Crowded zone | Shopping centers, train stations, subway stations, bus stations, etc. |
| Key protected zone | Government agencies, social organizations, museums, scenic spots, etc. |
| General risk zone | Business housing, corporate and lifestyle services, etc. |
Table 2.
Rating scale of AHP method.
| Numerical Scale | Definition (i with Respect to j) | Value | |
|---|---|---|---|
| aij | aji | ||
| 1 | Equal importance | 1 | 1 |
| 3 | Moderate importance | 3 | 1/3 |
| 5 | Strong importance | 5 | 1/5 |
| 7 | Very strong importance | 7 | 1/7 |
| 9 | Extreme importance | 9 | 1/9 |
| 2, 4, 6, 8 | Intermediate values | 2, 4, 6, 8 | 1/2, 1/4, 1/6, 1/8 |
Table 3.
Random consistency index.
| n | 1 | 2 | 3 | 4 | 5 | 6 | 7 | 8 | 9 | 10 |
|---|---|---|---|---|---|---|---|---|---|---|
| RI | 0 | 0 | 0.58 | 0.90 | 1.12 | 1.24 | 1.32 | 1.41 | 1.45 | 1.49 |
Table 4.
Mathematical expressions for both L-A algorithms.
| Maximize Coverage Location Problem (MCLP) | Minimize Facilities Coverage Problem (LSCP) | |
|---|---|---|
| Objective function | Maximize | Minimize |
| Subject to |
Table 5.
Detailed data information of various exclusion criteria.
| Exclusion Criterion | Constraint Variable | Restrictive Area | |
|---|---|---|---|
| EC1 | Protected area | Wetland park | 10.20 km2 |
| EC2 | Land cover | River | 125.74 km2 |
| Agriculture | 8.86 km2 | ||
| Mountains | 117.61 m2 | ||
| Forest land | 42.72 km2 | ||
| Building construction | 176.36 km2 | ||
| EC3 | Transport infrastructure | Road (including railway) | 61.53 km2 |
| EC4 | Slope | >8° | 23.48 km2 |
Table 6.
Decision matrix of various fire-risk zones. (Z1 is general risk zone; Z2 is flammable and explosive zone; Z3 is crowded zone; Z4 is vulnerable people zone; Z5 is key protected zone).
Table 6.
Decision matrix of various fire-risk zones. (Z1 is general risk zone; Z2 is flammable and explosive zone; Z3 is crowded zone; Z4 is vulnerable people zone; Z5 is key protected zone).
| Z1 | Z2 | Z3 | Z4 | Z5 | Weights | CR (%) | |
|---|---|---|---|---|---|---|---|
| Z1 | 1 | 2 | 2 | 2 | 2 | 32.3% | 4.3 |
| Z2 | 1/2 | 1 | 1 | 1 | 2 | 24.5% | |
| Z3 | 1/2 | 1 | 1 | 1 | 2 | 18.5% | |
| Z4 | 1/2 | 1 | 1 | 1 | 2 | 14.1% | |
| Z5 | 1/2 | 1/2 | 1/2 | 1/2 | 1 | 10.7% |
Table 7.
Reclassification of the assessment criteria and corresponding scores.
| Score | Evaluation Criteria | ||||
|---|---|---|---|---|---|
| Flammable and Explosive Zone | Vulnerable People Zone | Crowded Zone | Key Protected Zone | General Risk Zone | |
| 9 | >84,966.50 | >860,656.25 | >1,648,156.50 | >577,049.50 | >20,545,847.33 |
| 8 | 48,545.16–84,966.50 | 596,949.00–860,656.25 | 962,945.25–1648,156.50 | 400,483.00–577,049.50 | 15,293,334.50–20,545,847.33 |
| 7 | 33,427.66–48,545.16 | 406,699.50–596,949.00 | 578,310.16–962,945.25 | 286,380.50–400,483.00 | 11,730,192.83–15,293,334.50 |
| 6 | 23,864.00–33,427.66 | 277,284.00–406,699.50 | 355,903.00–578,310.16 | 204,857.83–286,380.50 | 8,857,090.00–11,730,192.83 |
| 5 | 16,737.50–23,864.00 | 184,978.00–277,284.00 | 214,923.75–355,903.00 | 144,612.00–204,857.83 | 6,454,159.00–8,857,090.00 |
| 4 | 11,100.50–16,737.50 | 114,927.25–184,978.00 | 127,995.00–214,923.75 | 94,521.00–144,612.00 | 4,377,895.75–6,454,159.00 |
| 3 | 6384.75–11,100.50 | 63,171.50–114,927.25 | 67,135.00–127,995.00 | 51,279.16–94,521.00 | 2,536,605.50–4,377,895.75 |
| 2 | 2088.50–6384.75 | 22,307.00–63,171.50 | 24,054.25–67,135.00 | 17,038.00–51,279.16 | 943,294.00–2,536,605.50 |
| 1 | ≤2088.50 | ≤22,307.00 | ≤24,054.25 | ≤17,038.00 | ≤943,294.00 |
Table 8.
Area and proportion of fire-risk zones.
| Type of Fire-Risk Zone | Fire-Risk Area Category (9 Levels) | Area (km2) | Proportion (%) |
|---|---|---|---|
| Fire-risk zone | 1 | 227.48 | 43.38 |
| 2 | 110.91 | 21.15 | |
| 3 | 79.98 | 15.25 | |
| 4 | 44.02 | 8.39 | |
| 5 | 29.34 | 5.60 | |
| 6 | 17.71 | 3.38 | |
| 7 | 9.86 | 1.88 | |
| 8 | 3.79 | 0.72 | |
| 9 | 1.30 | 0.25 |
Table 9.
Evaluation criteria reclassified with the corresponding scores and weight of criteria.
| Factor | Fire-Risk Zone | Location | Orography | ||||
|---|---|---|---|---|---|---|---|
| Evaluation Criterion | Potential Fire-Risk Zones | Population | Proximity to Roads | Proximity to Existing Fire Brigade | Proximity to the River | Slope ≤ 8° | Evaluation Criterion |
| Score | 9 | >6.37 | >133,563 | ≤58.64 | ≤705.91 | ≤75.26 | ≤1.26 |
| 8 | 5.46–6.37 | 91,067–133,563 | 58.64–130.64 | 705.91–1163.75 | 75.26–208.77 | 1.26–2.25 | |
| 7 | 4.73–5.46 | 67,120–91,067 | 130.64–223.76 | 1163.75–1611.16 | 208.77–352.69 | 2.25–3.02 | |
| 6 | 4.09–4.73 | 49,356–67,120 | 223.76–346.78 | 1611.16–2110.72 | 352.69–509.25 | 3.02–3.80 | |
| 5 | 3.45–4.09 | 36,906–49,356 | 346.78–507.10 | 2110.72–2716.73 | 509.25–682.81 | 3.80–4.57 | |
| 4 | 2.82–3.45 | 26,289–36,906 | 507.10–712.75 | 2716.73–3424.88 | 682.81–879.39 | 4.57–5.36 | |
| 3 | 2.09–2.82 | 16,683–26,289 | 712.75–971.23 | 3424.88–4208.33 | 879.39–1114.99 | 5.36–6.21 | |
| 2 | 1.36–2.09 | 6861–16,683 | 971.23–1317.62 | 4208.33–5121.03 | 1114.99–1451.79 | 6.21–7.08 | |
| 1 | ≤1.36 | ≤6861 | >1317.62 | >5121.03 | >1451.79 | >7.08 | |
Table 10.
Decision matrix of factors.
| Fire-Risk Zone | Location | Orography | Weight (%) | CR (%) | |
|---|---|---|---|---|---|
| Fire-risk zone | 1 | 1/2 | 3 | 32 | 1.9 |
| Location | 2 | 1 | 4 | 56 | |
| Orography | 1/3 | 1/4 | 1 | 12 |
Table 11.
Decision matrix of evaluation criteria. (L1 is population; L2 is proximity to roads; L3 is proximity to existing fire brigade; L4 is proximity to the river).
Table 11.
Decision matrix of evaluation criteria. (L1 is population; L2 is proximity to roads; L3 is proximity to existing fire brigade; L4 is proximity to the river).
| L1 | L2 | L3 | L4 | Weight (%) | CR (%) | |
|---|---|---|---|---|---|---|
| L1 | 1 | 1/2 | 1/4 | 2 | 14 | 6.1 |
| L2 | 2 | 1 | 1/5 | 2 | 18 | |
| L3 | 4 | 5 | 1 | 4 | 58 | |
| L4 | 1/2 | 1/2 | 1/4 | 1 | 10 |
Table 12.
Area and proportion of each suitable zone.
| Land Suitability for Fire Brigades | Area (km2) | Area Proportion (%) |
|---|---|---|
| Most suitable | 49.23 | 9.39 |
| Suitable | 18.08 | 3.45 |
| Unsuitable | 457.09 | 87.16 |
Publisher’s Note: MDPI stays neutral with regard to jurisdictional claims in published maps and institutional affiliations. |
© 2021 by the authors. Licensee MDPI, Basel, Switzerland. This article is an open access article distributed under the terms and conditions of the Creative Commons Attribution (CC BY) license (https://creativecommons.org/licenses/by/4.0/).
Share and Cite
MDPI and ACS Style
Jiang, Y.; Lv, A.; Yan, Z.; Yang, Z. A GIS-Based Multi-Criterion Decision-Making Method to Select City Fire Brigade: A Case Study of Wuhan, China. ISPRS Int. J. Geo-Inf. 2021, 10, 777. https://doi.org/10.3390/ijgi10110777
AMA Style
Jiang Y, Lv A, Yan Z, Yang Z. A GIS-Based Multi-Criterion Decision-Making Method to Select City Fire Brigade: A Case Study of Wuhan, China. ISPRS International Journal of Geo-Information. 2021; 10(11):777. https://doi.org/10.3390/ijgi10110777
Chicago/Turabian StyleJiang, Yuncheng, Aifeng Lv, Zhigang Yan, and Zhen Yang. 2021. "A GIS-Based Multi-Criterion Decision-Making Method to Select City Fire Brigade: A Case Study of Wuhan, China" ISPRS International Journal of Geo-Information 10, no. 11: 777. https://doi.org/10.3390/ijgi10110777
Note that from the first issue of 2016, this journal uses article numbers instead of page numbers. See further details here.