
Accuracy of Regional Centrality Using Social Network Analysis: Evidence from Commuter Flow in South Korea


1
Department of Real Estate, Kongju National University, 54 Daehakro, Yesaneup, Yesangun 32439, Korea
2
Department of Spatial Environment System Engineering, Handong Global University, 558 Handongro, Bukgu, Pohang 37554, Korea
3
Institute of Global Education, UNAI Korea, 325 Bongeunsaro, Gangnamgu, Seoul 06103, Korea
*
Author to whom correspondence should be addressed.
ISPRS Int. J. Geo-Inf. 2021, 10(10), 642; https://doi.org/10.3390/ijgi10100642
Submission received: 21 July 2021
/
Revised: 11 September 2021
/
Accepted: 21 September 2021
/
Published: 25 September 2021
(This article belongs to the Special Issue Mobility and Geosocial Networks)
Abstract
:With the recent exponential growth in inter-regional movements of population and information, there is an urgent need for accurately measuring the connectivity and centrality of cities. This study aims to investigate the differences in centrality between different scales of a dataset and to propose a calibration method to minimize the gap between the measures from the two scales. Although urban and regional centrality is examined by analyzing regional commuting datasets, this study proposes that it should be measured using nationwide data to validate the centrality results. To demonstrate this, the differences in regional centrality between different spatial scales of commuting trips for two data groups are shown: Seoul regional data and nationwide data. In this structure, the centrality levels of the 25 districts of Seoul were calculated for both groups. The results clearly show the differences in the centrality levels of districts in both groups: Seongbuk district ranked 10th in the local dataset but fell to 18th in the nationwide dataset; Geumcheon district ranked 22nd in the former but rose to 9th in the latter. The ratio of inner commuting in Seoul is thus relatively low, and each district has dynamic connections with other provinces. Furthermore, the results of a linear regression analysis, which was conducted on a local dataset to obtain similar results as those obtained using a national dataset, demonstrate the significance of a wide-ranging commuting dataset for regional centrality analysis of a specific region.
1. Introduction
Traditionally, when people established national land plans and development strategies, they used the city’s location, population size, and major functions as indicators to measure the hierarchy of regions and cities [1,2,3]. However, with globalization, informatization, and the remarkable developments in telecommunication and transportation technologies, regional network analysis started to receive attention when measuring the hierarchy of cities using dynamic indicators such as population and information movements between cities, rather than static indicators such as population size and infrastructure [4,5,6]. Moreover, due to exponential growth in the inter-regional movement of population and information, the connection between different regions and cities developed more structurally [7]. Consequently, researchers began to study the structural system and intensity of regional connections as meaningful indicators.
First introduced by Moreno [8], social network analysis has been applied to enhance the understanding of the complexity of systems, such as that of a transportation network. Social network analysis can help analyze connections in a transportation network, which shares some fundamental characteristics with social networks. In addition to the fields of physics, data science, computational linguistics, epidemiology, fashion, information exchange, and marketing [9], social network analysis has been applied in transport planning and economics [10]. Furthermore, social network analysis is more cost-effective than traditional traffic network analysis, as data requirements are not stringent but can still deliver reliable results [11]. Therefore, when compared to standard analysis methods, which focus heavily on individual attributes, social network analysis examines and evaluates individual attributes in the context of the overall network relationships [9].
Within this research trend, measuring the hierarchy and centrality of cities per the intensity of the network connectivity is gaining importance [12,13,14,15]. The commuting population and information have previously drawn much attention with improvements in physical infrastructures, such as roads and railroads, and development in both private and public transportation means. Moreover, after 1980, emerging countries like South Korea began to conduct population and housing censuses, and inter-regional commuting data were collected, making it possible to conduct active analysis in regional networks and hierarchical spatial structures around the city center and subcenters [16,17,18,19,20,21,22]; research on commuting patterns through origin-destination (O-D) data was also conducted [16,23,24,25,26,27,28].
Commuting data are an indicator sensitively affected by a city’s growth or decline, and they change in accordance with this. As traffic volume increases with regional development, land use in the region where the population is centered changes dynamically, and inter-spatial connectivity and centrality increase [29,30,31]. Particularly since commuting involves daily movement between residential areas and working areas, it affects the land-use pattern and density of heavily populated areas, helping the areas develop into central nodes of the city [32,33,34]. As population and information movements between cities increase, the development gap between the regions deepens [35]. This also results from the dynamics of the city network. Therefore, there is a need for studies that calculate regional centrality by applying social networking theory to inter-regional flow data, such as commuting data. However, despite the ability to decide regional centrality by the volume of inter-regional commuting, some researchers use only the data of partial regions when calculating regional centrality [21,36,37,38,39,40,41], thus reducing the accuracy of the results. This is because widespread flows, including city outskirts, which are not counted as research areas, are not considered.
Therefore, the purpose of this study is to demonstrate the significance of using a wide-ranging dataset for accurate centrality measurement in this kind of social network analysis. More specifically, first, this research aims to verify the significance of datasets for centrality measurement by comparing and identifying the differences between regional centralities in both groups: the national commuting data and a specific city’s commuting data. Second, through statistical analysis, a method is suggested to correct the inaccuracies of the regional centrality calculation that uses the data of only certain regions, thus aligning it with the accurate results obtained using nationwide data. This alternative method demonstrates the importance of using a wide-ranging dataset, and the validity of the research provides more accurate centrality calculations and a deeper understanding of the shortcomings of regional centrality analysis of prior studies.
2. Literature Review
Connection structure analysis theory of regional systems originates from graph theory, which conceptualizes a network structure as an organization of simple points and lines, and interactions between different objects are understood by drawing graphs that connect vertices, nodes, and points. This theory helps create vertices and edges corresponding to a problem situation to find a resolution [42,43]. The theory developed further into social network analysis and based on the relational attributes of people, human behavior, and social structures, it can be understood in the form of networks. According to this theory, social structures are interactive relational structures, not simply combinations of individuals [44,45,46,47,48]. Members of a society influence each other through interactions, and a social structure is an interactive relational structure rather than a simple combination of individual independent attributes [49]. This theory was further developed as a spatial-cognition system that analyzes regional connection structures and became the basis of deriving centrality, connectivity, and nodularity between regions by changing inter-regional commuting information into an interaction matrix [12,13,14,15,50].
The next step was the development of social network analysis, which is based on graph theory; it expresses the relationship between an individual and groups as nodes and links and quantitatively analyzes the structures of such relationships. Freeman stated that centrality is highly related to the attributes and development processes of important peripheries, and key actors in a network have an important place in the overall structure of a network [51]. Similarly, the centrality concept based on social network analysis considers the role of actors in a network and focuses on the possibility of the centrality changes of actors affected by the surrounding and overall structures of the network.
Centrality analysis methods using social network analysis are used to calculate the following: degree centrality, which considers the volume of commuters of a specific region to indicate the degree of direct connection per region; and eigenvector centrality, which considers the importance of regions directly connected to another region by plus weighting. Furthermore, there is Bonacich centrality, which generalizes degree centrality and eigenvector centrality [52]. Degree centrality is distinguished by non-directional and directional networks. In non-directional networks, because directions are not identified, centrality is decided simply by the number of connection relationships in which the actors engage. However, the directional network is measured by classifying inward and outward degree centralities. Actors who obtain a higher degree of centrality are considered more available to interact with other actors and become the focus of more vectors; thus, these actors are evaluated as influential [31,53]. Eigenvector centrality is an indicator in which the importance of connected actors is reflected by weighting. Therefore, the higher the centrality of actors connected to an actor, the higher is the actor’s own centrality. Each actor’s eigenvector centrality is decided proportionally to the sum of the centrality of actors connected to the actor based on step-by-step calculations [43]. Bonacich centrality is an indicator that reflects the characteristics of an overall network by calculating the value. By this, it can supplement traditional research methods that focus on calculating each actor’s centrality. Bonacich stated that the powers each actor possesses are related not only to proximate actors but also to distant actors; thus, they should be included in the overall network structure [54]. Vector centrality is the sum of potential effects that an actor shows through both direct and indirect ways, and as the length of the vector increases, its weight decreases. In the Bonacich centrality, the characteristics of a network are interpreted differently according to the +, − signs of . If is positive, there is a positive or complementary influence between the actors in the network. Thus, it can be considered a complementary network. However, in a network where the value is negative, there is a negative or competitive influence between the actors, and thus it can be considered a competitive network [43].
Empirical precedent studies on regional centrality using social network analysis are based on the premise that inter-regional relationships are cooperative. Many researchers have used the eigenvector centrality model [21,36,37,55] or the Bonacich ( centrality model [37,38,39,40]. Lee conducted a comparative analysis of the spatial structures of South Korea’s metropolitan areas from 1955 and 2000 [40]. He classified the metropolitan area into districts, studied changes in spatial centrality using centrality indicators, and used a city-county-district unit commuting O-D data. Lee and Kim studied changes in patterns of commuting due to new town development in the metropolitan area using metropolitan city-county-district commuting data for their research. They estimated changes in the centrality of metropolitan areas based on the changes in commuting patterns and then, classified the hierarchy of centrality of the Seoul metropolitan area through metropolitan commuting O-D data [21]. Kim studied changes in the spatial structure of metropolitan areas after the mid-1990s [36]. To determine the centrality of a large cluster in the Seoul area and the interactive network of the southern part, he analyzed the commuting data of 66 different city-county districts in the metropolitan area. Park et al., derived centrality between different districts of Seoul and clarified the relationship between regions by analyzing commuting data of metropolitan areas [38]. Joo and Kim analyzed the regional centrality of Seongnam City by a comparative analysis using commuting data of three districts of Seongnam City [39]. Kim pointed out the problems of previous studies that derived the centrality of the Seoul metropolitan area through city-county-district commuting data and argued the need for more extensive micro-analysis of commuting data to enhance the accuracy of the centrality of the metropolitan area [55]. Veneri studied urban polycentricity by investigating the centrality of Italian metropolitan areas and also used social network analysis on the metropolitan data of commuting flow [56]. Dadashpoor and Jalili also used local commuting data to examine spatial structure change and the regional centrality of a metropolitan area in Iran [57].
The majority of previous studies used commuting O-D data of particular regions for regional centrality analysis. However, because transportation infrastructure and commuting networks are widely and closely related nationwide, although the objective is to derive the centrality of a certain region, it is important to run a comparative analysis on the commuting O-D data of not only particular regions but also the whole country. In this research, we conducted comparative research calculating regional centralities with data of different scales (regional and nationwide) and demonstrated the difference between the two. Furthermore, proposing a statistical correction method to supplement the limits of precedent studies is another distinct feature of this research.
3. Research Methodology
3.1. Analysis Model
As this study aimed to investigate the differences between two dataset groups (regional and nationwide), degree centrality measurement, which clearly shows such differences, was strategically selected. The measurements of eigenvector centrality and Bonacich β centrality are similar types of extended measurements derived from degree centrality. More specifically, in social network analysis, the actor is an individual, and because a steady relationship is assumed between actors, except in some special cases, centrality is calculated through eigenvector centrality or positive value in the Bonacich centrality. However, the majority of inter-regional relationships are regarded as competitive rather than complementary [51]. Therefore, in this research, we also calculated degree centrality based on the following methodology:
If the number of areas is g, degree centrality using the number of commuters is as follows:
- : Number of connections that region i has with different regions
- : Degree centrality of region i
- g: The number of regions
- : The number of links between regions i and j (commuter volume)
Bonacich centrality, which generalizes degree centrality and eigenvector centrality, is as follows [43]:
- : Beta centrality of region i
- : Parameter for standardizing centrality
- : Weighted parameter based on distance from the actor
- : Adjacent matrix of relationship
Since degree centrality is and eigenvector centrality is in the formula for estimating Bonacich centrality shown above, similar results are expected from the three methods (degree centrality, eigenvector centrality, and Bonacich centrality). In other words, while degree centrality considers other directly connected actors, eigenvector centrality considers the importance of connected actors as well as degrees. Moreover, Bonacich centrality is an indicator used to identify and reflect the overall nature of the network comprising all actors that focus on measuring the centrality index of each node or actor. Thus, since these methods of centrality measurement are derived and developed from the degree centrality model, the comparison analysis between the different datasets will show similar results in all methods. This is the reason we chose to conduct this study using degree centrality analysis.
3.2. Data Collection and Rearrangement
To understand the flows (of information, population, and goods) among regions, we may use either population migration statistics based on resident registration or commuting data. Population statistics do not reflect the flow between the same residential and economic spheres. However, commuting data can reveal the flow between residential areas and places of work; therefore, it is suitable statistical data that can comprehensively reflect residents’ daily behaviors, residential and economic activities, and much more. Therefore, to determine the overall regional centralities that consider everyday life, the economy, culture, and other regional characteristics, we used commuting data in this research.
In this research, the 229 city-county-district nationwide units from the National Census of Population and Housing (NCPH) 2015 data from the Bureau of Statistics were used since the NCPH is the process of systematically obtaining and recording demographic, economic and social data from the entire population every 5 years in South Korea and the OD data is one of the most accurate nationwide data in the country. Then we rearranged them for the O-D matrix of inter-regional commuting datasets. The O-D matrix is an efficient way to indicate people’s movement in a certain region. The rows in the matrix show the origins of commuters and the columns show the destinations (Table 1). Further, to consider the sizes of the areas and regions, it was transformed to commuting O-D matrix per 1000 population. When calculating regional centrality using commuter O-D matrix, there is no difference in regional centrality due to regional integration or separation; however, when population increases or decreases, there is a significant impact on the regional centrality score. Furthermore, a symmetrical matrix was created to consider both indegree and outdegree for the degree centrality. These degree centrality values were analyzed using UCINET which is a comprehensive network analysis program developed by Borgatti, Everett, and Freeman.
Since Seoul is the capital city of South Korea, and the largest city with a population of around 10 million, which encompasses one-fifth of the total national population, 25 districts in Seoul, wherein commuting is most concentrated in the country, were chosen as the targets of this analysis. In a preliminary study, we surveyed 25 districts in Seoul with data from 2015. We calculated the commuting ratio of every South Korean district to the districts in Seoul. According to the calculations, Gangbuk district showed the highest ratio of 90.7%, while Geumcheon district showed the lowest ratio of 69.0%. In addition, the O-D dataset indicates the commuting between every province to or from Seoul in South Korea. Therefore, we assume that if we calculate each district’s regional centralities in two ways, one using the whole country’s O-D matrix and the other using only Seoul City’s O-D matrix, there will be a difference. This is because the use of high-speed railroads is increasing and, as a result of transportation infrastructure expansion, people’s commuting ranges continue to spread beyond the capital area. The commuters to or from Seoul can reach every province in around 2 h by the high-speed train network and well-connected highways in the country. Furthermore, the national decentralization policy in implementing projects such as the Sejong relocation project and the Innovation City project has accelerated wider regional commuting trips over the last decade. Therefore, we divided the centrality coefficient into two groups and ran a comparative analysis. The first group’s centralities were calculated with the commuting data of Seoul, which was the centrality of the 25 districts in Seoul based on commuting datasets in Seoul, while the second group’s centralities of Seoul’s districts were calculated with the nationwide commuting data.
4. Results and Discussion
4.1. Difference in Commuting Ratio in Seoul
Comparing the ratio of commuters nationwide to inter-Seoul cities, the Gangbuk district, with a ratio of 90.7%, and the Sungbuk district with a ratio of 90.5% were found to have the highest ratio, while the Geumcheon district, with a ratio of 69.0%, and the Gangnam district with a ratio of 71.7% were the lowest. Therefore, because the centrality calculation of city-county-district is decided by regardless of the method, the centrality of districts in Seoul calculated using the nationwide commuting O-D matrix and Seoul’s commuting O-D matrix must differ. Hence, the lower the commuting ratio of a district compared with other districts within Seoul, the higher the centrality when calculated using nationwide city-county-district connectivity. When we calculated the regional centralities of districts in Seoul with Seoul’s commuting O-D matrix, the districts with the highest ratio were Jung district, Gangnam district, and Jongno district, while the lowest were the Gangdong, Dobong, and Jungryang districts.
However, when we calculated the regional centralities of districts in Seoul with the nationwide city-county-district commuting O-D matrix, Gangnam district showed the highest ratio, followed by the Jung and Jongno districts, while the lowest were the Dobong, Gangbuk, and Jungryang districts. Thus, there were changes in the rankings.
4.2. Difference in Centrality of Districts in Seoul Calculated Using Seoul’s O-D Matrix and Nationwide O-D Matrix
Table 2 shows a comparison of the calculated results of regional centralities of Seoul’s districts using the inter-city commuting O-D matrix of Seoul and nationwide cities-counties-districts commuting O-D matrix. Four critical districts (Gangnam, Jongno, Yeongdeungpo, and Secho districts) showed few differences in their results in the comparison analysis. This is because inter-regional commuting is concentrated in these five districts.
When we look at the districts that showed the largest differences in regional centrality rankings, Seongbuk district ranked 10th in centrality based on 25 districts of Seoul; however, it ranked 18th in centrality when calculated based on nationwide city-county-districts. This is because Seongbuk district’s inter-Seoul commuting ratio was 90.5%, which is very high. Geumcheon district ranked 22nd in the centrality analysis of Seoul cities, but 9th in the nationwide centrality analysis. This implies that the ranking of Geumcheon rose by 13 steps, as Seoul has a total of 25 districts. This is because the district’s commuting ratio with other districts in Seoul was only 69.0%. Similar to these results, in the rate of increase in centrality calculated between districts of Seoul and nationwide city-county-districts, Seongbuk district had the lowest rate of 117.0%, while the Guemcheon district had the highest with 184.9% (Table 2).
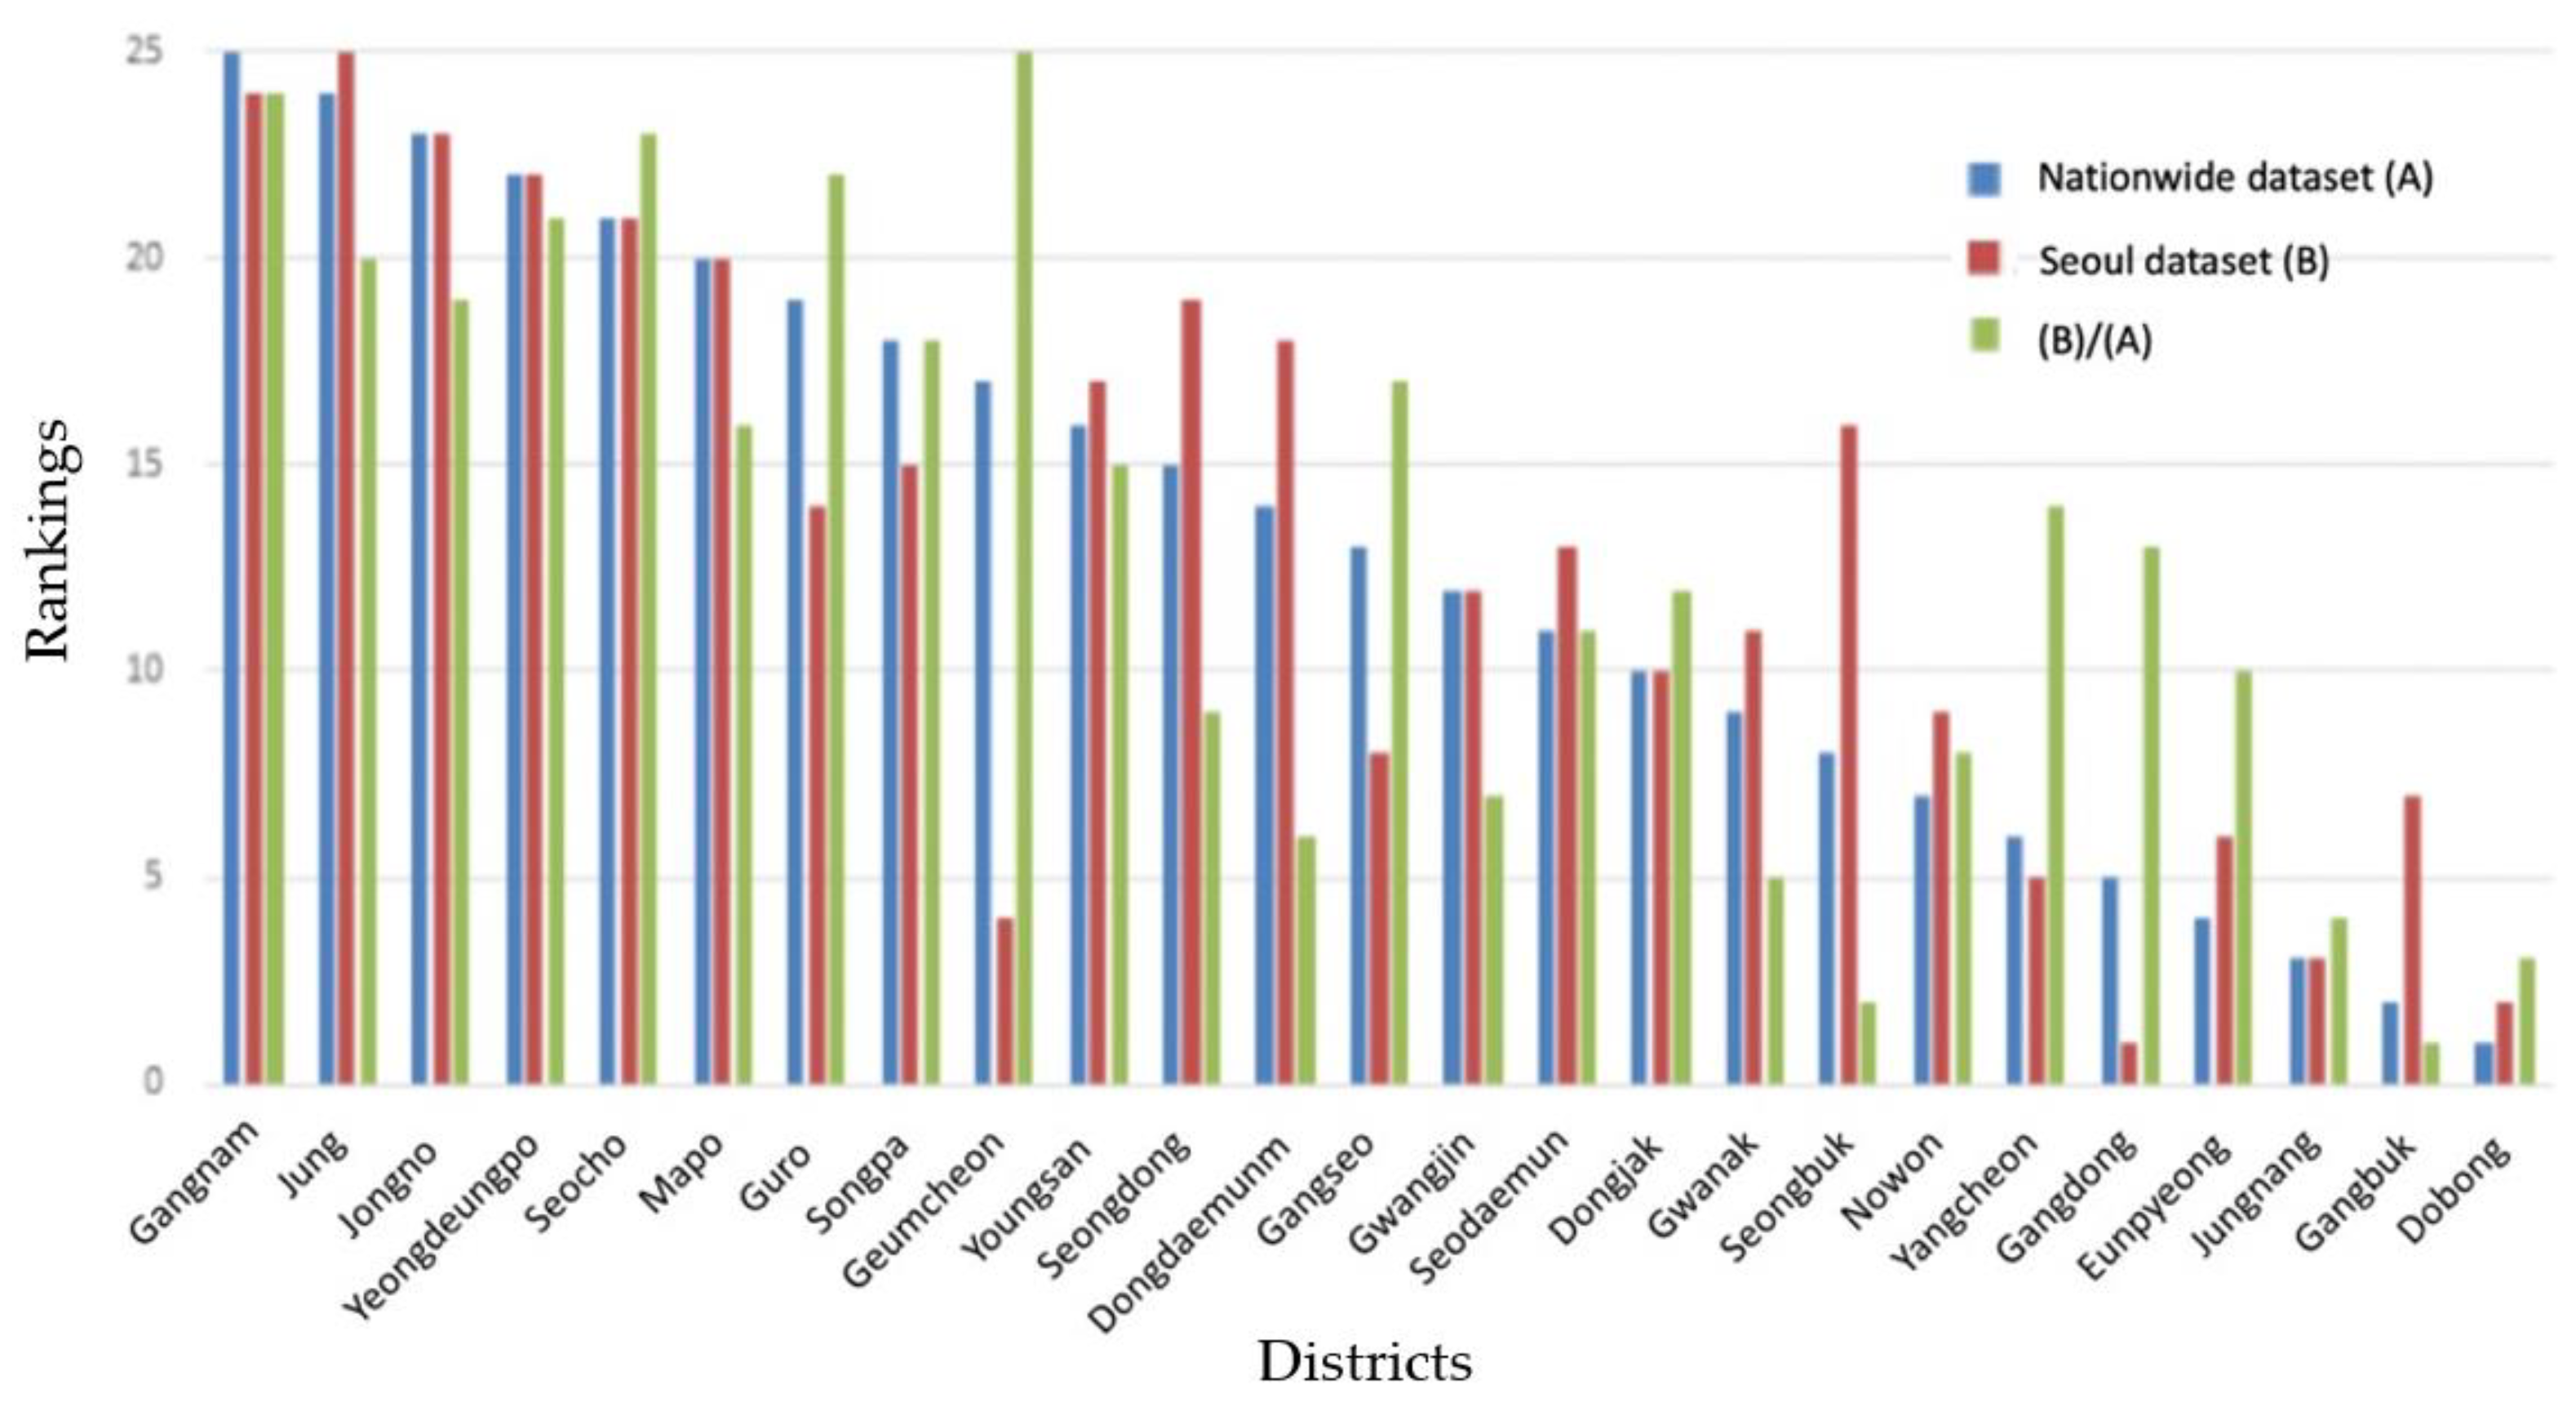
Figure 1 and Figure 2 show the relationships between centrality rankings calculated within Seoul, and centrality rankings calculated within the nation, and the nationwide commuting ratio to inter-Seoul commuting. Centrality and commuting ratios between districts of Seoul compared to nationwide datasets are expressed in 26 rankings. Thus, the higher the centrality, the higher the rank, and for Seoul, the higher the ratio, the lower the commuting ratio.
The districts, where centrality calculated by comparing nationwide cities-counties-districts was found to be higher than the centrality calculated within districts of Seoul, were the Geumcehon (69.0%), Guro (73.4%), and Gangseo (80.3%) districts. The districts where centrality was calculated by comparing nationwide cities-counties-districts was lower than the centrality calculated within the districts of Seoul, were the Gangbuk (90.7) and Seongbuk (90.5) districts. As stated above, there is a great difference in the centrality of districts when analyzed in comparison with only a few districts and when analyzed in comparison with nationwide data.
However, since an area is spatially fixed, the difference in centrality rankings should not exist even if the analysis target changes. Therefore, there is a limit to calculating regional centrality within a limited boundary to properly understand the characteristics of the area. Thus, centrality should be calculated using a wide-ranging dataset.
4.3. Regression Analysis to Calibrate the Difference in Centrality between Both Groups
Many other cases of precedent centrality studies by commuter datasets were analyzed and concluded using only inter-district data as there might have been limitations in accessing nationwide datasets or they might have disregarded a wide-ranging dataset. Thus, they can be calibrated by the following regression analysis through statistical methodologies, and this result also strongly demonstrates the significance of using a wide-ranging dataset in this type of centrality study
The reason for the difference between cases that compare nationwide datasets and a few certain districts’ datasets for analysis is that commuting rates between each district and a specific district is different. Therefore, by setting the nationwide analyzed centrality as a dependent variable, and centrality analyzed with certain areas and commuting ratio within certain areas as an independent variable, performing regression analysis, and estimating the number of regressions, we can correct the analysis and obtain a similar result as that found using the nationwide centrality analysis.
After comparing the centrality of districts in Seoul as calculated using Seoul’s inter-district commuting O-D matrix and nationwide city-county-district commuting O-D matrix, we found that the higher the nationwide commuting ratio to Seoul, the lower the centrality calculated with the nationwide commuting O-D matrix. To demonstrate this correlation, we ran a regression analysis, as shown in Table 2 and Table 3, setting the centrality calculated with the nationwide O-D matrix as a dependent variable and the centrality calculated with the inter-Seoul O-D matrix and inter-Seoul commuting percentage as the independent variable.
As a result of the regression analysis, the two independent variables were able to explain most of the interrelationship, with an value of 0.990 (Table 3). Moreover, it was found that as the inter-Seoul commuting percentage of each district increased by 1%, the degree connectivity score decreased by 5.863 points (Table 4). The coefficient between the two independent variables was −0.548. When the explained variance was decomposed by independent variance and common variance, the degree centrality of the inter-Seoul O-D matrix was 49.7%, and the inter-Seoul commuting ratio to nationwide commuting data was 4%. The common variance was found to be 45.3%.
The results of previous studies that calculated regional centrality using a commuting O-D matrix of only a few districts were not accurate; thus, it is necessary to reconsider these research results. Furthermore, these studies can be corrected by the particular region’s inter-commuting ratio, if required, for increased accuracy.
Table 5 shows the original results of regional centrality calculated using only inter-Seoul data and the corrected centrality scores using the inter-Seoul commuting percentage between each district and Seoul City. Comparing the rankings of corrected centrality scores and the centrality scores calculated using the nationwide 229 city-county-district data, most districts’ rankings show correspondence, and districts with the highest differences in rankings, including the Gwangjin, Seodaemoon, and Songpa districts, showed a difference of two steps. Therefore, using regression analysis to make corrections in the centrality score is a reasonable approach. Such results may have different parameter values according to the area of the district and the year; however, they may be used as a reference in analyzing a few districts.
5. Conclusions
Remarkable developments in transportation and telecommunication technologies are leading to the recent exponential growth of the inter-regional movement in population and information. This change also encourages more inter-regional commuting patterns and activities. Thus, methods are needed for accurately measuring the connectivity and centrality of cities.
When using the centrality of an area to create national land plans or development strategies, regional centrality calculated using commuting datasets of certain regions is widely considered one of the main indicators; however, many studies have not carefully considered the geographical range of datasets. Hence, research should critically and spatially consider the most wide-ranging commuting datasets to enhance the accuracy of regional centrality. However, in cases where wide-ranging datasets cannot be used, such as when national data cannot be accessed in developing countries due to the lack of systematic data collection methods, commuting datasets of only a few areas/regions are inevitably used. For example, previously, Korea’s commuting data system was established only in each regional unit, and thus, most centrality studies relied on partial datasets, which became a limitation of the study. However, even with the establishment of nationwide datasets over the last few decades, some studies continue to use a regional dataset with certain O-D boundaries. As many developing countries are faced with this research limitation, this study has significant implications. Therefore, in this study, the magnitude of centrality difference was demonstrated when using local commuting data and nationwide commuting data. An alternative method was then suggested to correct the centralities calculated in studies that used only local commuting datasets. If the centrality data of previous studies need to be utilized for a purpose, the results can be calibrated using our regression method with a national dataset or much wider regional datasets of the nearest year from the original study.
This study clearly shows that centrality calculated using a commuting O-D matrix of only a few regions is different from that calculated using a nationwide commuting O-D matrix. Furthermore, the results of the regression analysis demonstrated this point and indicated a way to not only calibrate the gap in centrality differences between the two groups but also suggest a method to enhance the accuracy of centrality results found in previous studies conducted using only regional data.
There is a potential limitation in this study. The research results underline the benefit of using nationwide datasets to measure more accurate regional centrality in South Korean contexts that contain various public and private commuting infrastructures including high-speed train networks. While examining countries with similar environments might work using our model and results, other countries that have poor transportation infrastructure or very large-scale national areas might show different patterns of regional centrality measurement scale. In the future, we will produce more empirical studies with different types of commuting environments and patterns to enhance the accuracy of regional centrality.
Author Contributions
Conceptualization, Jongsang Lee and Ducksu Seo; data curation, Jongsang Lee; formal analysis, Jongsang Lee; investigation, Jongsang Lee and Ducksu Seo; methodology, Jongsang Lee and Ducksu Seo; project administration, Jongsang Lee and Ducksu Seo; resources, Jongsang Lee; software, Jongsang Lee; supervision, Ducksu Seo; validation, Ducksu Seo; visualization, Ducksu Seo; writing—original draft, Jongsang Lee and Ducksu Seo; writing—review and editing, Ducksu Seo. Both authors have read and agreed to the published version of the manuscript.
Funding
This research received no external funding.
Institutional Review Board Statement
Ethnical review and approval were waived for this study, as the research was conducted using information available to the general public and not collecting personal identification information.
Informed Consent Statement
Informed consent was obtained from all subjects involved in the study.
Data Availability Statement
The data of the National Census of Population and Housing presented in this study are available on request from the Statistics Korea Database. The request for data can be found here: http://kostat.go.kr/portal/eng/index.action (accessed on 1 December 2019).
Conflicts of Interest
The authors declare no conflict of interest.
References
- Hoover, E.M. Location Theory and the Shoe and Leather Industries; Harvard University Press: Cambridge, MA, USA, 1937. [Google Scholar]
- Hoover, E.M. Location of Economic Activity; McGraw-Hill Book Company, Inc.: New York, NY, USA, 1948. [Google Scholar]
- Porter, M. The Competitive Advantage of the Inner City. Harv. Bus. Rev. 1995, 73, 55–71. [Google Scholar] [CrossRef]
- Hughes, H.L. Metropolitan Structure and the Suburban Hierarchy. Am. Sociol. Rev. 1993, 58, 417. [Google Scholar] [CrossRef]
- Batten, D.F. Network Cities: Creative Urban Agglomerations for the 21st Century. Urban Stud. 1995, 32, 313–327. [Google Scholar] [CrossRef]
- Sassen, S. Hierarchies of Dominance among World Cities: A Network Approach. In Global Networks, Linked Cities; Sassens, S., Ed.; Routledge: New York, NY, USA, 2002; pp. 117–143. [Google Scholar]
- Rabino, G.A.; Occelli, S. Understanding spatial structure from network data: Theoretical considerations and applications. Cybergeo Eur. J. Geogr. 1997. [Google Scholar] [CrossRef]
- Moreno, J.L. The Sociometry Reader; Glencoe: New York, NY, USA, 1960. [Google Scholar]
- El-Adaway, I.H.; Abotaleb, I.; Vechan, E. Identifying the most critical transportation intersections using social network analysis. Transp. Plan. Technol. 2018, 41, 353–374. [Google Scholar] [CrossRef]
- Durland, M.M.; Fredericks, K.A. An introduction to social network analysis. New Dir. Eval. 2005, 107, 5–13. [Google Scholar] [CrossRef]
- El-Adaway, I.H.; Abotaleb, I.S.; Vechan, E. Social Network Analysis Approach for Improved Transportation Planning. J. Infrastruct. Syst. 2017, 23, 05016004. [Google Scholar] [CrossRef]
- Alderson, A.S.; Beckfield, J. Power and Position in the World City System. Am. J. Sociol. 2004, 109, 811–851. [Google Scholar] [CrossRef] [Green Version]
- Boyd, J.P.; Mahutga, M.C.; Smith, D.A. Measuring Centrality and Power Recursively in the World City Network: A Reply to Neal. Urban Stud. 2013, 50, 1641–1647. [Google Scholar] [CrossRef] [Green Version]
- Green, N. Functional Polycentricity: A Formal Definition in Terms of Social Network Analysis. Urban Stud. 2007, 44, 2077–2103. [Google Scholar] [CrossRef]
- Irwin, M.D.; Hughes, H.L. Centrality and the Structure of Urban Interaction: Measures, Concepts, and Applications. Soc. Forces 1992, 71, 17–51. [Google Scholar] [CrossRef]
- Ha, S.K.; Kim, J.I. Spatial Job—Housing Mismatch Phenomena: The Case of Seoul Metropolitan Area. J. Korea Plann. Assoc. 1992, 27, 1051–1071. [Google Scholar]
- Jeon, M.J. Commuting Patterns in a Polycentric City: The Case of Seoul Metropolitan Area. J. Korea Plann. Assoc. 1995, 30, 2223–2236. [Google Scholar]
- Song, M.R. Study on Urban Spatial Structure and Commuting Traffic: Using Seoul as a Case. Ph.D. Thesis, Seoul National University, Seoul, Korea, 1997. [Google Scholar]
- Seo, J.G. A Study on the Relationship Between Urban Structural Changes and Commuting Patterns Changes: Focusing on Seoul Metropolitan Area’s Industrial Distribution and Commuting Patterns Changes. J. Korea Plann. Assoc. 1998, 33, 167–182. [Google Scholar]
- Yim, C.H.; Cho, M.H. An Analysis on Spatial Structure in Seoul Metropolitan Area. KPA Fall Conference Paper. J. Korea Plann. Assoc. 2001, 36, 183–195. [Google Scholar]
- Lee, H.Y.; Kim, H.J. Articles: The Analysis of the Structure of Commuting Network in Seoul Metropolitan Area. J. Korean Urban Geogr. Soc. 2006, 9, 91–111. [Google Scholar]
- Gastner, M.T.; Newman, M.E. The spatial structure of networks. Eur. Phys. J. B 2006, 49, 247–252. [Google Scholar] [CrossRef] [Green Version]
- Lee, B.S. Determinants of Commuting Distance for Seoul Residents. J. Korea Plann. Assoc. 1998, 33, 241–263. [Google Scholar]
- Shin, S.Y. Articles: Jobs-Housing Accessibility and Commuting: The Case of Seoul Metropolitan Area. J. Korea Plann. Assoc. 2003, 38, 73–87. [Google Scholar]
- Jeon, M.J.; Jeong, M.J. Articles: Analysis on Commuting Pattern Change and Its Determinants in Seoul Metropolitan Area. J. Korea Plann. Assoc. 2003, 38, 159–173. [Google Scholar]
- Van Nuffel, N. Determination of the Number of Significant Flows in Origin–Destination Specific Analysis: The Case of Commuting in Flanders. Reg. Stud. 2007, 41, 509–524. [Google Scholar] [CrossRef]
- Zagatti, G.A.; Gonzalez, M.; Avner, P.; Lozano-Gracia, N.; Brooks, C.J.; Albert, M.; Gray, J.; Antos, S.E.; Burci, P.; zu Erbach-Schoenberg, E.; et al. A trip to work: Estimation of origin and destination of commuting patterns in the main metropolitan regions of Haiti using CDR. Dev. Eng. 2018, 3, 133–165. [Google Scholar] [CrossRef]
- Lenormand, M.; Huet, S.; Gargiulo, F.; Deffuant, G. A Universal Model of Commuting Networks. PLoS ONE 2012, 7, e45985. [Google Scholar] [CrossRef]
- Patuelli, R.; Reggiani, A.; Gorman, S.P.; Nijkamp, P.; Bade, F.-J. Network Analysis of Commuting Flows: A Comparative Static Approach to German Data. Netw. Spat. Econ. 2007, 7, 315–331. [Google Scholar] [CrossRef] [Green Version]
- Reggiani, A.; Bucci, P.; Russo, G. Accessibility and Impedance Forms: Empirical Applications to the German Commuting Network. Int. Reg. Sci. Rev. 2011, 34, 230–252. [Google Scholar] [CrossRef] [Green Version]
- Wang, F.; Antipova, A.; Porta, S. Street centrality and land use intensity in Baton Rouge, Louisiana. J. Transp. Geogr. 2011, 19, 285–293. [Google Scholar] [CrossRef] [Green Version]
- Lee, W.Y. Trip and Transportation Structure of Seoul Metropolitan Area. J. Korean Reg. Sci. Assoc. 1994, 10, 105–121. [Google Scholar]
- Fleming, D.K.; Hayuth, Y. Spatial characteristics of transportation hubs: Centrality and intermediacy. J. Transp. Geogr. 1994, 2, 3–18. [Google Scholar] [CrossRef]
- Wang, J.; Mo, H.; Wang, F.; Jin, F. Exploring the network structure and nodal centrality of China’s air transport network: A complex network approach. J. Transp. Geogr. 2011, 19, 712–721. [Google Scholar] [CrossRef]
- Ter Wal, A.L.J.; Boschma, R.A. Applying social network analysis in economic geography: Framing some key analytic issues. Ann. Reg. Sci. 2009, 43, 739–756. [Google Scholar] [CrossRef] [Green Version]
- Kim, S.R. A Study on the Change of Spatial Structure in the Seoul Metropolitan Area Between 1995 and 2010. Geogr. J. Korea 2014, 48, 57–68. [Google Scholar]
- Lee, S.Y.; Ha, C.H. Analysis of Population Movement and Regional Structural Change in Jeju. Natl. Land Plan. 2014, 49, 41–533. [Google Scholar]
- Park, S.H.; Joh, C.H.; Lee, W.D. A Study for Seoul Traffic Network Based on the Metropolitan Household Travel Survey. Geogr. J. Korea 2012, 46, 189–200. [Google Scholar]
- Joo, M.J.; Kim, S.Y. A Study on the Urban Spatial Structure Using Households Trip Survey: Focusing on the Case of Seongnam-si. Natl. Land Res. 2014, 80, 35–48. [Google Scholar] [CrossRef]
- Lee, J.S. The Establishment of Spatial Structure and Its Change in the Capital Region by Using Interaction Analysis: 1995–2005. J. Korean Urban Geogr. Soc. 2008, 11, 91–100. [Google Scholar]
- Nystuen, J.D.; Dacey, M.F. A Graph Theory Interpretation of Nodal Regions. Proc. Pap. Reg. Sci. Assoc. 1961, 7, 29–42. [Google Scholar] [CrossRef] [Green Version]
- Borgatti, S.P.; Everett, M.G. A Graph-theoretic Perspective on Centrality. Soc. Netw. 2006, 28, 466–484. [Google Scholar] [CrossRef]
- Bonacich, P. Power and Centrality: A Family of Measures. Am. J. Sociol. 1987, 92, 1170–1182. [Google Scholar] [CrossRef]
- Borgatti, S.P. Centrality and network flow. Soc. Netw. 2005, 27, 55–71. [Google Scholar] [CrossRef]
- Carrington, P.J.; Scott, J.; Wasserman, S. (Eds.) Models and Methods in Social Network Analysis; Cambridge University Press: Cambridge, UK, 2005; Volume 28. [Google Scholar]
- Friedkin, N.E. Theoretical Foundations for Centrality Measures. Am. J. Sociol. 1991, 96, 1478–1504. [Google Scholar] [CrossRef]
- Wasserman, S.; Faust, K. Social Network Analysis: Methods and Applications; Cambridge University Press: Cambridge, UK, 1994. [Google Scholar]
- Son, D.-W. Social Network Analysis; Kyungmoonsa: Seoul, Korea, 2002. [Google Scholar]
- Zuzańska-Żyśko, E. Role of Advanced Producer Services Shaping Globalization Processes in a Post-Industrial Region: The Case of the Górnośląsko-Zagłębiowska Metropolis. Sustainability 2020, 13, 211. [Google Scholar] [CrossRef]
- Freeman, L.C. Centrality in social networks conceptual clarification. Soc. Netw. 1978, 1.3, 215–239. [Google Scholar] [CrossRef] [Green Version]
- Lee, J.S.; Chang, S.Y.; Kim, S.R. Measure of Regional Centrality Using Network Analysis: Focused on the Competitive Relocation Among Regions. J. Korea Plann. Assoc. 2018, 53, 87–93. [Google Scholar] [CrossRef]
- Koschützki, D.; Lehmann, K.A.; Peeters, L.; Richter, S.; Tenfelde-Podehl, D.; Zlotowski, O. Centrality Indices. In Network Analysis; Brandes, U., Erlebach, T., Eds.; Springer: Cham, Switzerland, 2005; pp. 1–61. [Google Scholar]
- Chang, S.Y. Research on the Centrality and Related Variables of the Korean Si-Gun-Gu. Ph.D. Dissertation, Kongju National University, Yesangun, Korea, 2018. [Google Scholar]
- Kim, H.C.; Ahn, K.H. The Relation of Population, Jobs, Social Capitals and Centrality in Seoul Metropolitan Area, Using Social Network Theory. Natl. Land Plan. 2012, 47, 105–122. [Google Scholar]
- Kim, H.J. A Study on Commuting Patterns Using Social Network Analysis in the Seoul Metropolitan Area. J. Geogr. Educ. 2008, 52, 25–43. [Google Scholar]
- Veneri, P. Urban Polycentricity and the Costs of Commuting: Evidence from Italian Metropolitan Areas. Growth Chang. 2010, 41, 403–429. [Google Scholar] [CrossRef]
- Dadashpoor, H.; Jalili, H. Exploring the Dynamics of Spatial Structure Using an Interaction Pattern (The Case of Mashhad Metropolitan Region, Iran). Iran Univ. Sci. Technol. 2019, 29, 99–111. [Google Scholar]
Figure 1.
Comparison of degree centrality rankings from the Seoul dataset and the nationwide dataset.
Figure 1.
Comparison of degree centrality rankings from the Seoul dataset and the nationwide dataset.

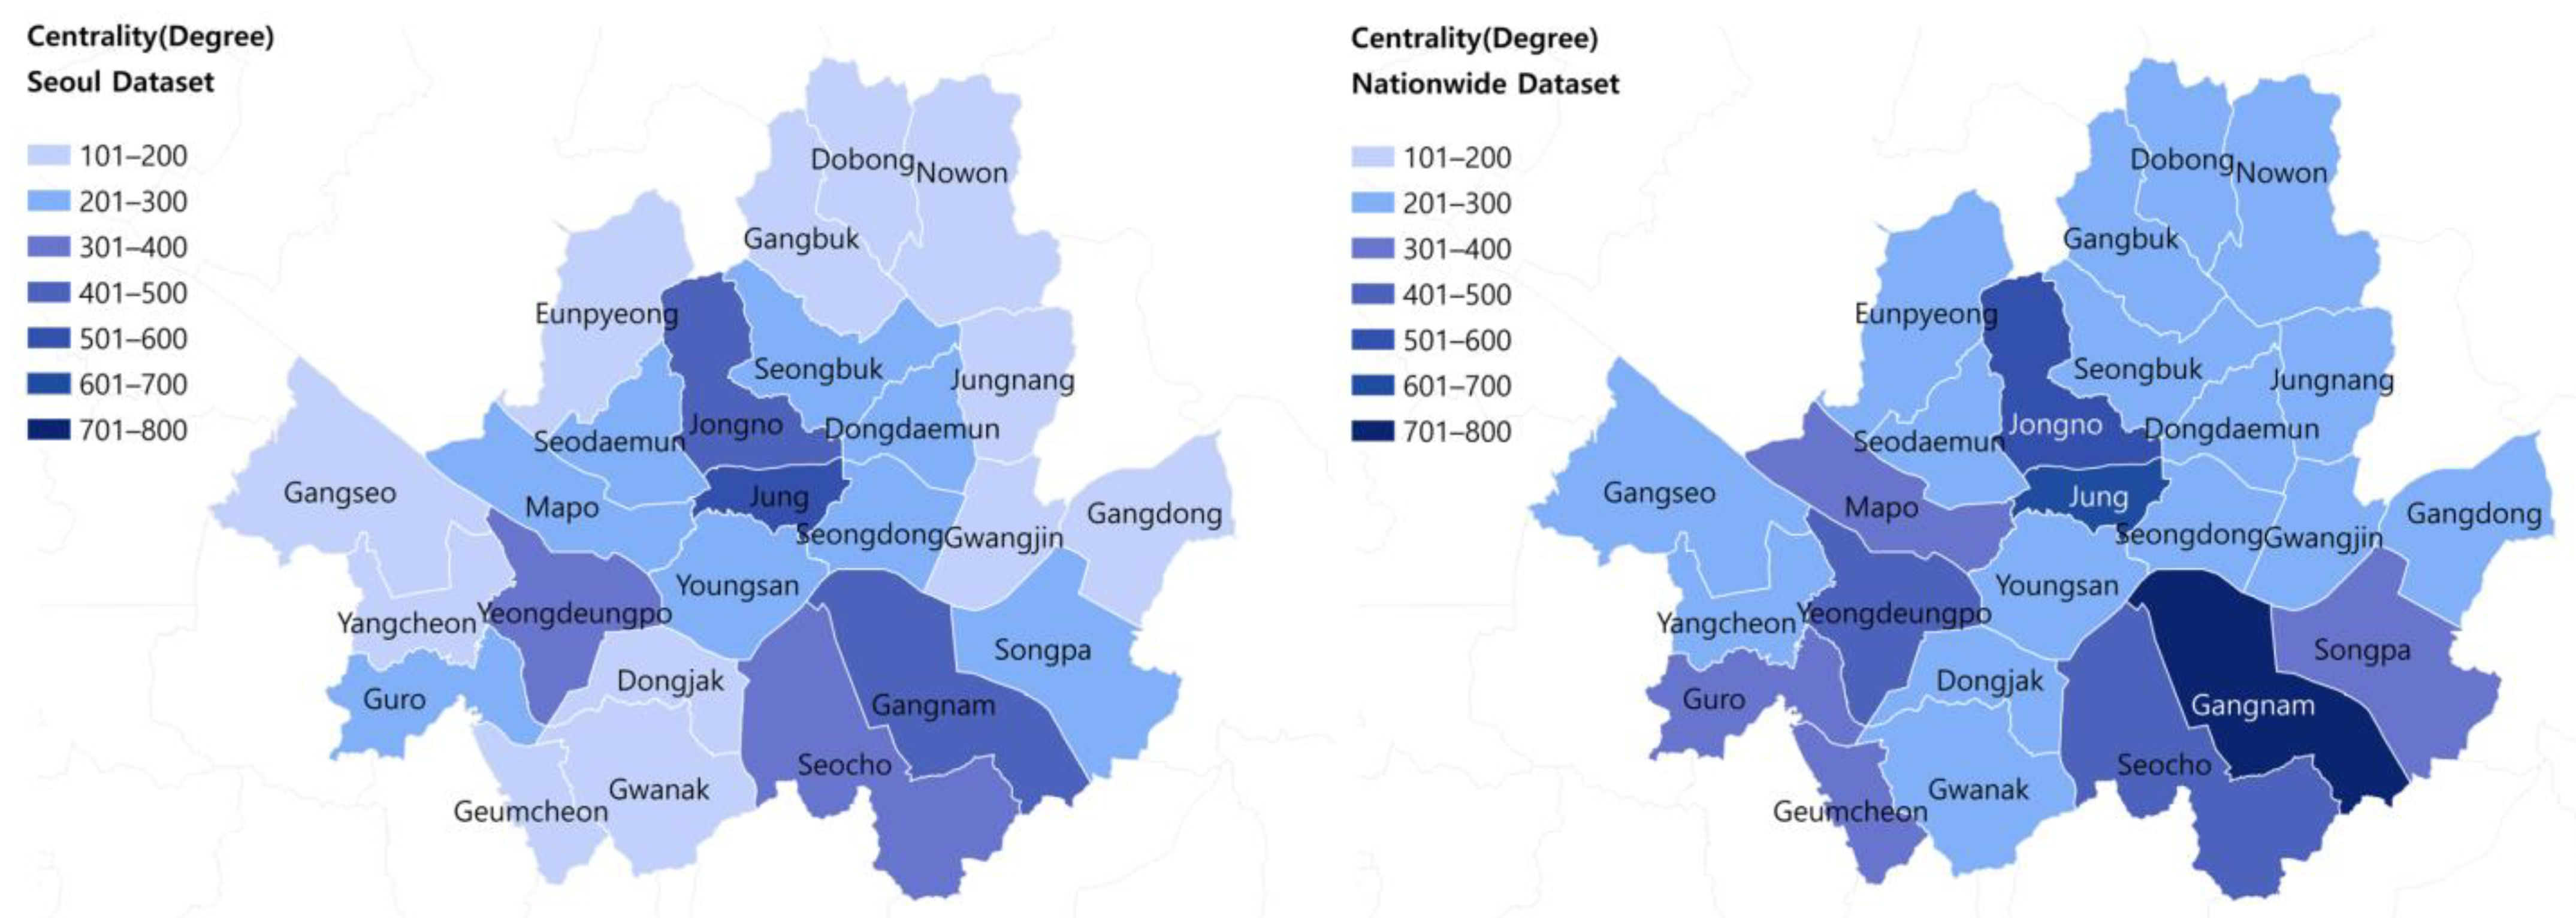
Figure 2.
Comparison of degree centrality from the Seoul dataset(left) and the nationwide dataset(right).
Figure 2.
Comparison of degree centrality from the Seoul dataset(left) and the nationwide dataset(right).


Table 1.
O-D matrix of commuting.
| Destination | 1 | 2 | … | 229 | Population | |
|---|---|---|---|---|---|---|
| Origin | Jongno | Jung | … | Seoquipo | ||
| 1 | Jongno | 35,362 | 6486 | … | 0 | 140,595 |
| 2 | Jung | 3193 | 32,666 | … | 0 | 114,967 |
| … | … | … | … | … | … | … |
| 229 | Seoquipo | 0 | 0 | … | 80,757 | 145,367 |
Table 2.
Degree centrality comparison between the Seoul dataset and the nationwide dataset.
| District | Nationwide Commuter (A) | Commuter within Seoul Region (B) | (B)/ (A) × 100 | Seoul Dataset | Nationwide Dataset | Rank Difference (D)–(F) | (E)/(C) × 100 | |||
|---|---|---|---|---|---|---|---|---|---|---|
| Degree Centrality (C) | Rank (D) | Degree Centrality (E) | Rank (F) | Score | Rank | |||||
| Jongno | 179,884 | 138,668 | 77.1 | 408 | 3 | 541 | 3 | 0 | 132.7 | 12 |
| Jung | 211,047 | 160,060 | 75.8 | 527 | 1 | 698 | 2 | −1 | 132.3 | 13 |
| Youngsan | 129,455 | 104,306 | 80.6 | 220 | 9 | 295 | 10 | −1 | 133.6 | 11 |
| Seongdong | 149,058 | 127,910 | 85.8 | 236 | 7 | 294 | 11 | −4 | 124.8 | 22 |
| Gwangjin | 157,142 | 135,613 | 86.3 | 199 | 14 | 256 | 14 | 0 | 128.4 | 18 |
| Dongdaemun | 170,131 | 147,685 | 86.8 | 228 | 8 | 286 | 12 | −4 | 125.6 | 21 |
| Jungnang | 160,179 | 139,828 | 87.3 | 162 | 23 | 214 | 23 | 0 | 132.2 | 14 |
| Seongbuk | 168,846 | 152,817 | 90.5 | 214 | 10 | 251 | 18 | −8 | 117.0 | 25 |
| Gangbuk | 121,233 | 109,968 | 90.7 | 171 | 19 | 204 | 24 | −5 | 119.2 | 24 |
| Dobong | 123,031 | 107,553 | 87.4 | 156 | 24 | 201 | 25 | −1 | 129.0 | 16 |
| Nowon | 197,601 | 170,308 | 86.2 | 187 | 17 | 244 | 19 | −2 | 130.8 | 15 |
| Eunpyeong | 171,274 | 146,247 | 85.4 | 171 | 20 | 218 | 22 | −2 | 127.6 | 19 |
| Seodaemun | 133,715 | 113,526 | 84.9 | 204 | 13 | 254 | 15 | −2 | 124.3 | 23 |
| Mapo | 214,373 | 172,378 | 80.4 | 272 | 6 | 366 | 6 | 0 | 134.5 | 10 |
| Yangcheon | 176,903 | 146,352 | 82.7 | 170 | 21 | 236 | 20 | 1 | 138.4 | 9 |
| Gangseo | 243,830 | 195,763 | 80.3 | 182 | 18 | 274 | 13 | 5 | 151.1 | 6 |
| Guro | 213,463 | 156,605 | 73.4 | 208 | 12 | 336 | 7 | 5 | 161.8 | 2 |
| Geumcheon | 152,979 | 105,548 | 69.0 | 166 | 22 | 306 | 9 | 13 | 184.9 | 1 |
| Yeongdeungpo | 269,874 | 203,294 | 75.3 | 337 | 4 | 493 | 4 | 0 | 146.1 | 8 |
| Dongjak | 157,128 | 133,158 | 84.7 | 196 | 16 | 252 | 16 | 0 | 128.7 | 17 |
| Gwanak | 199,526 | 173,848 | 87.1 | 199 | 15 | 252 | 17 | −2 | 126.8 | 20 |
| Seocho | 279,561 | 203,731 | 72.9 | 315 | 5 | 477 | 5 | 0 | 151.4 | 5 |
| Gangnam | 488,006 | 349,957 | 71.7 | 488 | 2 | 743 | 1 | 1 | 152.3 | 4 |
| Songpa | 297,706 | 237,762 | 79.9 | 210 | 11 | 316 | 8 | 3 | 150.4 | 7 |
| Gangdong | 186,395 | 154,347 | 82.8 | 149 | 25 | 230 | 21 | 4 | 154.2 | 3 |
Table 3.
ANOVA results of the centrality.
| SS | DF | MS | F-Value | p-Value | R2 | |
|---|---|---|---|---|---|---|
| Regression | 517,516.165 | 2 | 258,758.082 | 1110.924 | 0.000 | 0.990 |
| Error | 5124.275 | 22 | 232.922 | |||
| Total | 522,640.440 | 24 |
Dependent Variable: Degree centrality of the districts by nationwide dataset. Independent Variable: (Constant), Degree centrality of the districts by Seoul dataset, the ratio of commuters within Seoul to nationwide commuters (Commuters in Seoul/Nationwide commuters).
Table 4.
Results of regression analysis.
| Non-Stand Coef | Stand Coef | t | p-Value | ||
|---|---|---|---|---|---|
| B | SE | ||||
| (Constant) | 515.302 | 55.579 | 9.272 | 0.000 | |
| CS | 1.229 | 0.037 | 0.843 | 0.000 | |
| S/N | −5.863 | 0.614 | −0.241 | 0.000 | |
. : Centrality of districts by national dataset (CN). : Centrality of districts by Seoul dataset (CS).: Ratio of commuters within Seoul to nationwide commuters (Commuters in Seoul/Commuters in nationwide) (S/N).
Table 5.
Calibration results of degree centrality by the regression model.
| ID | District | Centrality Score | Rank | Rank Difference | |||||
|---|---|---|---|---|---|---|---|---|---|
| Seoul Dataset | Nationwide Data | Calibration | Seoul Dataset (A) | Nationwide Dataset (B) | Calibration (C) | (A)–(B) | (B)–(C) | ||
| 1 | Jongno | 407.6 | 541.0 | 564.3 | 3 | 3 | 3 | 0 | 0 |
| 2 | Jung | 527.3 | 697.7 | 718.7 | 1 | 2 | 1 | −1 | 1 |
| 3 | Youngsan | 220.5 | 294.6 | 313.9 | 9 | 10 | 9 | −1 | 1 |
| 4 | Seongdong | 235.7 | 294.2 | 301.9 | 7 | 11 | 11 | −4 | 0 |
| 5 | Gwangjin | 199.3 | 255.9 | 254.2 | 14 | 14 | 16 | 0 | −2 |
| 6 | Dongdaemun | 228.1 | 286.5 | 286.6 | 8 | 12 | 12 | −4 | 0 |
| 7 | Jungnang | 161.9 | 214.0 | 202.5 | 23 | 23 | 23 | 0 | 0 |
| 8 | Seongbuk | 214.3 | 250.9 | 248.1 | 10 | 18 | 18 | −8 | 0 |
| 9 | Gangbuk | 171.3 | 204.1 | 194.0 | 19 | 24 | 25 | −5 | −1 |
| 10 | Dobong | 156.2 | 201.4 | 194.7 | 24 | 25 | 24 | −1 | 1 |
| 11 | Nowon | 186.5 | 243.9 | 239.2 | 17 | 19 | 20 | −2 | −1 |
| 12 | Eunpyeong | 170.9 | 218.1 | 224.8 | 20 | 22 | 21 | −2 | 1 |
| 13 | Seodaemun | 203.9 | 253.5 | 268.2 | 13 | 15 | 13 | −2 | 2 |
| 14 | Mapo | 272.0 | 365.8 | 378.1 | 6 | 6 | 6 | 0 | 0 |
| 15 | Yangcheon | 170.4 | 235.8 | 239.6 | 21 | 20 | 19 | 1 | 1 |
| 16 | Gangseo | 181.6 | 274.4 | 267.8 | 18 | 13 | 14 | 5 | −1 |
| 17 | Guro | 207.6 | 335.7 | 340.2 | 12 | 7 | 7 | 5 | 0 |
| 18 | Geumcheon | 165.5 | 306.2 | 314.2 | 22 | 9 | 8 | 13 | 1 |
| 19 | Yeongdeungpo | 337.2 | 492.7 | 488.1 | 4 | 4 | 4 | 0 | 0 |
| 20 | Dongjak | 196.0 | 252.3 | 259.3 | 16 | 16 | 15 | 0 | 1 |
| 21 | Gwanak | 198.7 | 251.9 | 248.7 | 15 | 17 | 17 | −2 | 0 |
| 22 | Seocho | 315.4 | 477.4 | 475.6 | 5 | 5 | 5 | 0 | 0 |
| 23 | Gangnam | 488.0 | 743.2 | 694.6 | 2 | 1 | 2 | 1 | −1 |
| 24 | Songpa | 209.9 | 315.8 | 305.0 | 11 | 8 | 10 | 3 | −2 |
| 25 | Gangdong | 149.2 | 230.0 | 213.1 | 25 | 21 | 22 | 4 | −1 |
Publisher’s Note: MDPI stays neutral with regard to jurisdictional claims in published maps and institutional affiliations. |
© 2021 by the authors. Licensee MDPI, Basel, Switzerland. This article is an open access article distributed under the terms and conditions of the Creative Commons Attribution (CC BY) license (https://creativecommons.org/licenses/by/4.0/).
Share and Cite
MDPI and ACS Style
Lee, J.; Seo, D. Accuracy of Regional Centrality Using Social Network Analysis: Evidence from Commuter Flow in South Korea. ISPRS Int. J. Geo-Inf. 2021, 10, 642. https://doi.org/10.3390/ijgi10100642
AMA Style
Lee J, Seo D. Accuracy of Regional Centrality Using Social Network Analysis: Evidence from Commuter Flow in South Korea. ISPRS International Journal of Geo-Information. 2021; 10(10):642. https://doi.org/10.3390/ijgi10100642
Chicago/Turabian StyleLee, Jongsang, and Ducksu Seo. 2021. "Accuracy of Regional Centrality Using Social Network Analysis: Evidence from Commuter Flow in South Korea" ISPRS International Journal of Geo-Information 10, no. 10: 642. https://doi.org/10.3390/ijgi10100642
Note that from the first issue of 2016, this journal uses article numbers instead of page numbers. See further details here.