
Analysis of the Degree of Threat to Railway Infrastructure by Falling Tree Vegetation


1
Department of Geoinformatics, Palacký University Olomouc, 771 46 Olomouc, Czech Republic
2
Railway Administration, Jeremenkova 103/23, 779 00 Olomouc, Czech Republic
*
Author to whom correspondence should be addressed.
ISPRS Int. J. Geo-Inf. 2021, 10(5), 292; https://doi.org/10.3390/ijgi10050292
Submission received: 4 March 2021
/
Revised: 19 April 2021
/
Accepted: 30 April 2021
/
Published: 3 May 2021
(This article belongs to the Special Issue GIS in Sustainable Transportation)
Abstract
:The article presents a method for determining and evaluating the threat to railway infrastructure from falling trees. The main objective was to identify the degree of threat according to three parameters: the height of tree stands, species composition, and vegetation health. Identification of the threat to individual railway sections would allow the creation of measures that could increase operational safety. Evaluation should be carried out at regular intervals to assess vegetation health during certain seasons. We, therefore, recommend the use of satellite images to provide a data source and regular data updates. The potential benefit is a reduction in railway infrastructure damage and an increase in traffic flow, especially during periods of exceptional weather conditions involving high wind, ice or heavy snow. The new method presented in the paper, based on data for railway infrastructure, law and other data sources in the Czech Republic, determines a Vegetation Threat Index for Railways (VTIR). We selected the Liberec Region as an example case study because of its large spread of wooded areas around railway lines and high incidence of railway traffic accidents.
1. Introduction
Contactless monitoring of railway infrastructure, which is at threat, is a barely studied topic in the Czech Republic and around the world. This fact is most likely due to low maintenance requirements of protection zones that have little high vegetation and therefore low threat of falling trees. However, the Czech railways are atypical, mainly due to their historical development and a rather high network density. They often pass through morphologically complicated areas where it is not possible to maintain a sufficient protection zone. It is, therefore, necessary to appropriately combine existing studies of sub-topics to create a proposed methodology.
The present study applies satellite data to identify threats to railway lines caused by tree vegetation. From this information, it is possible to direct maintenance toward locations most under threat and help eliminate potential emergencies. Act No. 266/1994 Coll., the Railway Act of the Czech Republic [1], requires a protection zone of 60 m around regional railways, extending from the centerline of the edge of the railway track and at least 30 m from the boundary of the railway perimeter. For railway sidings, this distance is reduced to 30 m from the centerline of the edge track. It is not defined for railway sidings located in closed areas [2].
Unfortunately, in some areas, the buffer zone is not sufficiently managed, either due to inadequate maintenance or because natural or ownership conditions do not allow it. An average of 70 train collisions with a fallen tree on the track occurs per year. Specifically, in 2016, 48 collisions occurred with damage totalling 5.6 million Czech crowns. In 2017, 80 collisions by trains and property damage of over 6.6 million Czech crowns were recorded as a result of Cyclone Herwart. Until 2017, the Railway Administration was required to apply for permits to cut down trees at least 15 days in advance. An amendment to the legislation now allows trees to be cut down immediately in cases where health, life or property is put at threat by a tree’s fall [3].
Efforts to predict potential threats and to prevent accidents are not new. The first model, a so-called domino model, was created in 1930 by H.W. Heinrich. Its main concept assumed that minor accidents without injury preceded each serious accident with injury. Heinrich conducted the study by examining emergencies and looking for their causes. He concluded that most of the situations originated from human error. He also compiled a list of human-technology interactions which lead to dangerous situations. This list enables a means to minimise or even eliminate these situations [4].
The cost of damage to transportation infrastructure worldwide is between $3.1 trillion and $22 trillion each year. These costs place significant burdens on national budgets, and it is therefore prudent to shield against and minimise the possible consequences of natural emergencies. For this purpose, the use of models which can assist in the identification of risks are appropriate, and based on the information they provide, measures can be adopted to prevent future damage [5].
The importance of vegetation control is reflected by projects of the worldwide organisation, International Union of Railways (UIC). Project Vegetation Control and Use of Herbicides (2017) solves proper maintenance of vegetation to minimise the environmental impact of herbicides [6]. Project TRISTRAM Transition Strategy on Vegetation Management (2020) solves the ways of vegetation management with respect to legislation and regulations at various levels: EU, national, federal, regional (where applicable) and local [7].
The paper is organised as follows. Section 2 briefly describes existing methods related to the presented work, including tree species characteristics, damage due to fallen trees caused by wind, and the options available for capturing data on vegetation. Section 3 presents the detailed source data used in this study. Section 4 describes the newly proposed method for calculating the Vegetation Threat Index for Railways (VTIR). The results of application of the VTIR are demonstrated in a case study of the Liberec Region. Finally, Section 5 and Section 6 conclude and discuss future work.
2. State of the Art
It is important to take into account the species composition of tree vegetation and its state of health to assess the threat of falling trees. Presented in this chapter, the investigations conducted in previous studies highlight a wealth of expert information on this topic.
2.1. Effect of Species Composition on the Degree of Threat
The composition of forest cover species has a significant effect on its resistance to extraordinary natural influences, such as strong winds or heavy snow cover. Determining the ideal composition is a very difficult process and significantly affected by the economics of logging, which resulted in intensive planting of spruce in the past, even in areas with unsuitable conditions. Resistance in such growths can be assessed as low, although if good stand conditions are ensured, it can increase significantly [8].
According to Vicena [9], this fact was identified during a fracture analysis in the Šumava Mountains in 1955, when a windfallen tree area with a volume of 42 m3/ha was created in areas with homogeneous spruces, whereas 48 m3/ha was created in mixed forest containing beech, fir and spruce. After examination of the cause, the findings showed that beech significantly increased the fertility of the soil, which resulted in taller and larger trees, and consequently exposed the forest to greater gusts of wind.
Another survey between 1995 and 1996 examined ice on the ground in the Bohemian-Moravian Highlands and the Orlické Mountains. In mixed spruce and fir stands, the ground was recorded as up to 79% deeper than in forests of homogeneous spruce. This fact can be attributed to fir wood’s mechanical-physical properties, which has a lower compressive and tensile strength of 7%, a flexural strength of 9% and shear of 24% than spruce wood. A specific vegetation group is a pine. Young trees show lower resistance than adults; however, they are generally up to 70% less damaging than spruce. Greater resistance is also characteristic of larch, which shows strengthening properties and increases its resistance, even in partial representation in a forest. In the statistical survey after a gale in the Brdy Mountains in 1990, fracture damage was 46% lower in forest stands which also contained larch, than in homogeneous spruce stands. Historical surveys also document that this is a native tree in Czech territory. Another important species is beech. It has a strengthening function for wind, ice and snow breaks; however, it must not be a sub-level tree, and its proportion must not be less than 40% [9].
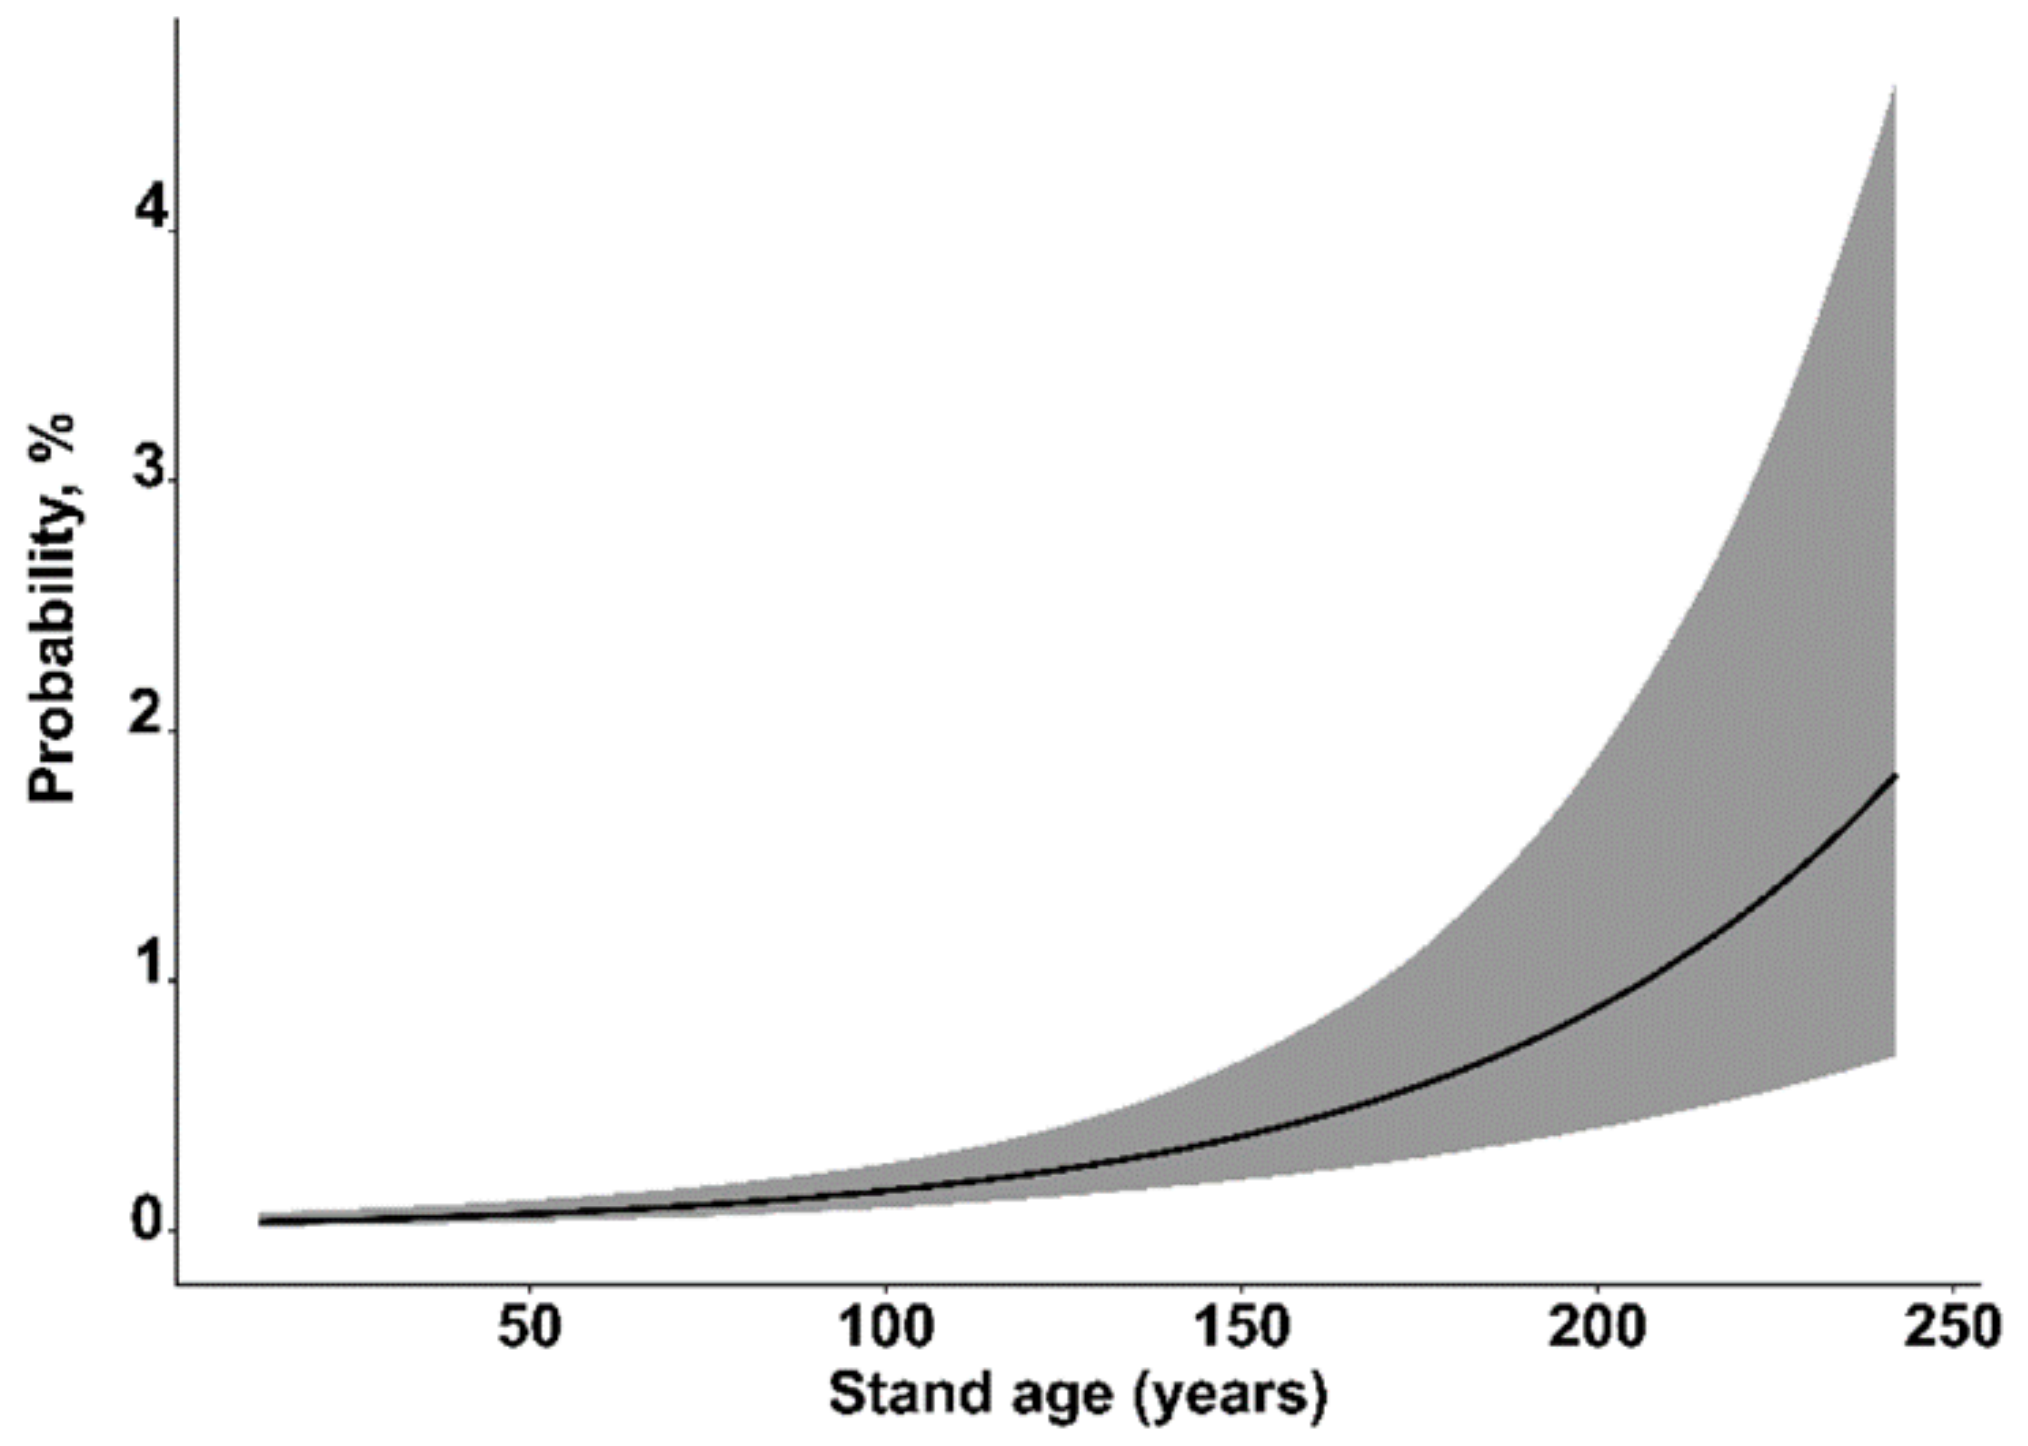
Regular observations of a Lithuanian forest with a predominant spruce culture showed that younger trees with a trunk diameter of up to 25 cm indicated approximately 5% wind damage over a 5-year period. Trees with a larger diameter showed a greater risk of incurring damage (Figure 1). Larger diameters can be attributed to the gradually decreasing flexibility in the tree’s wood [10].
However, the degree of threat of fracture cannot be determined solely based on the species composition in a forest stand. It is necessary to assess other vegetation characteristics, such as height, thickness, age, area, etc., and also analyse the parameters of the terrain, its exposure and orography.
Tavankar et al. [11] conducted an analysis of the degree of damage to 140 ha of forest vegetation by snow cover. The area was divided into smaller units of 100 m2, and a selected representative sample of the stand was evaluated in each unit. The degree of damage was defined according to the following categories: bent tree, broken tree, uprooted tree, and damaged crown. The results of the work showed that a higher recorded rate of damage correlated with increasing altitude. In this case, the damage at an altitude of 1250 m above sea level was 30% greater than at 800 m above sea level. It was also greater on steeper slopes and in areas with shallower soil depth. The slope’s orientation was also a factor, the northeast and southeast displaying almost half the damage compared to the southwest and northwest. Tree height was also an important criterion: with heights over 15 m, the trees showed significantly greater damage. In the case of vegetation with heights over 20 m, the damage was more than three times as great compared to vegetation with heights only up to 10 m. Deciduous vegetation predominated in the evaluated area. The dominant species were eastern beech (14.3%), hornbeam (17.4%), velvet maple (18.7%), Cappadocian maple (23.6%), Caucasian alder (36%) and chestnut oak (29.5%).
Another important criterion is the integrity of the stands. Treeless areas were found to cause a significant increase in hazards due to wind flow disturbances. Areas greater than 0.2 ha increased these hazards by up to 2.5 times [9].
Research by Cheng et al. analysed this issue [12]. The primary aim of this research was not to evaluate the resistance of vegetation but its potential to reduce wind flow. In addition to the distance between trees, the authors also assessed spatial distribution. Row placement was identified as less effective, and random placement was more suitable. Random placement leads to the elimination of long areas where the wind has no barriers and thus does not disturb or reduce speed. An assessment of the distance between trees indicated that maintaining a denser composition of the stand was beneficial. A spacing of 0.4 m between trees demonstrated almost three times the ability to reduce wind speed compared to a spacing of 1.2 m. The same characteristic was demonstrated by the number of rows in the vegetation, five rows possessing three times the ability than just a single row.
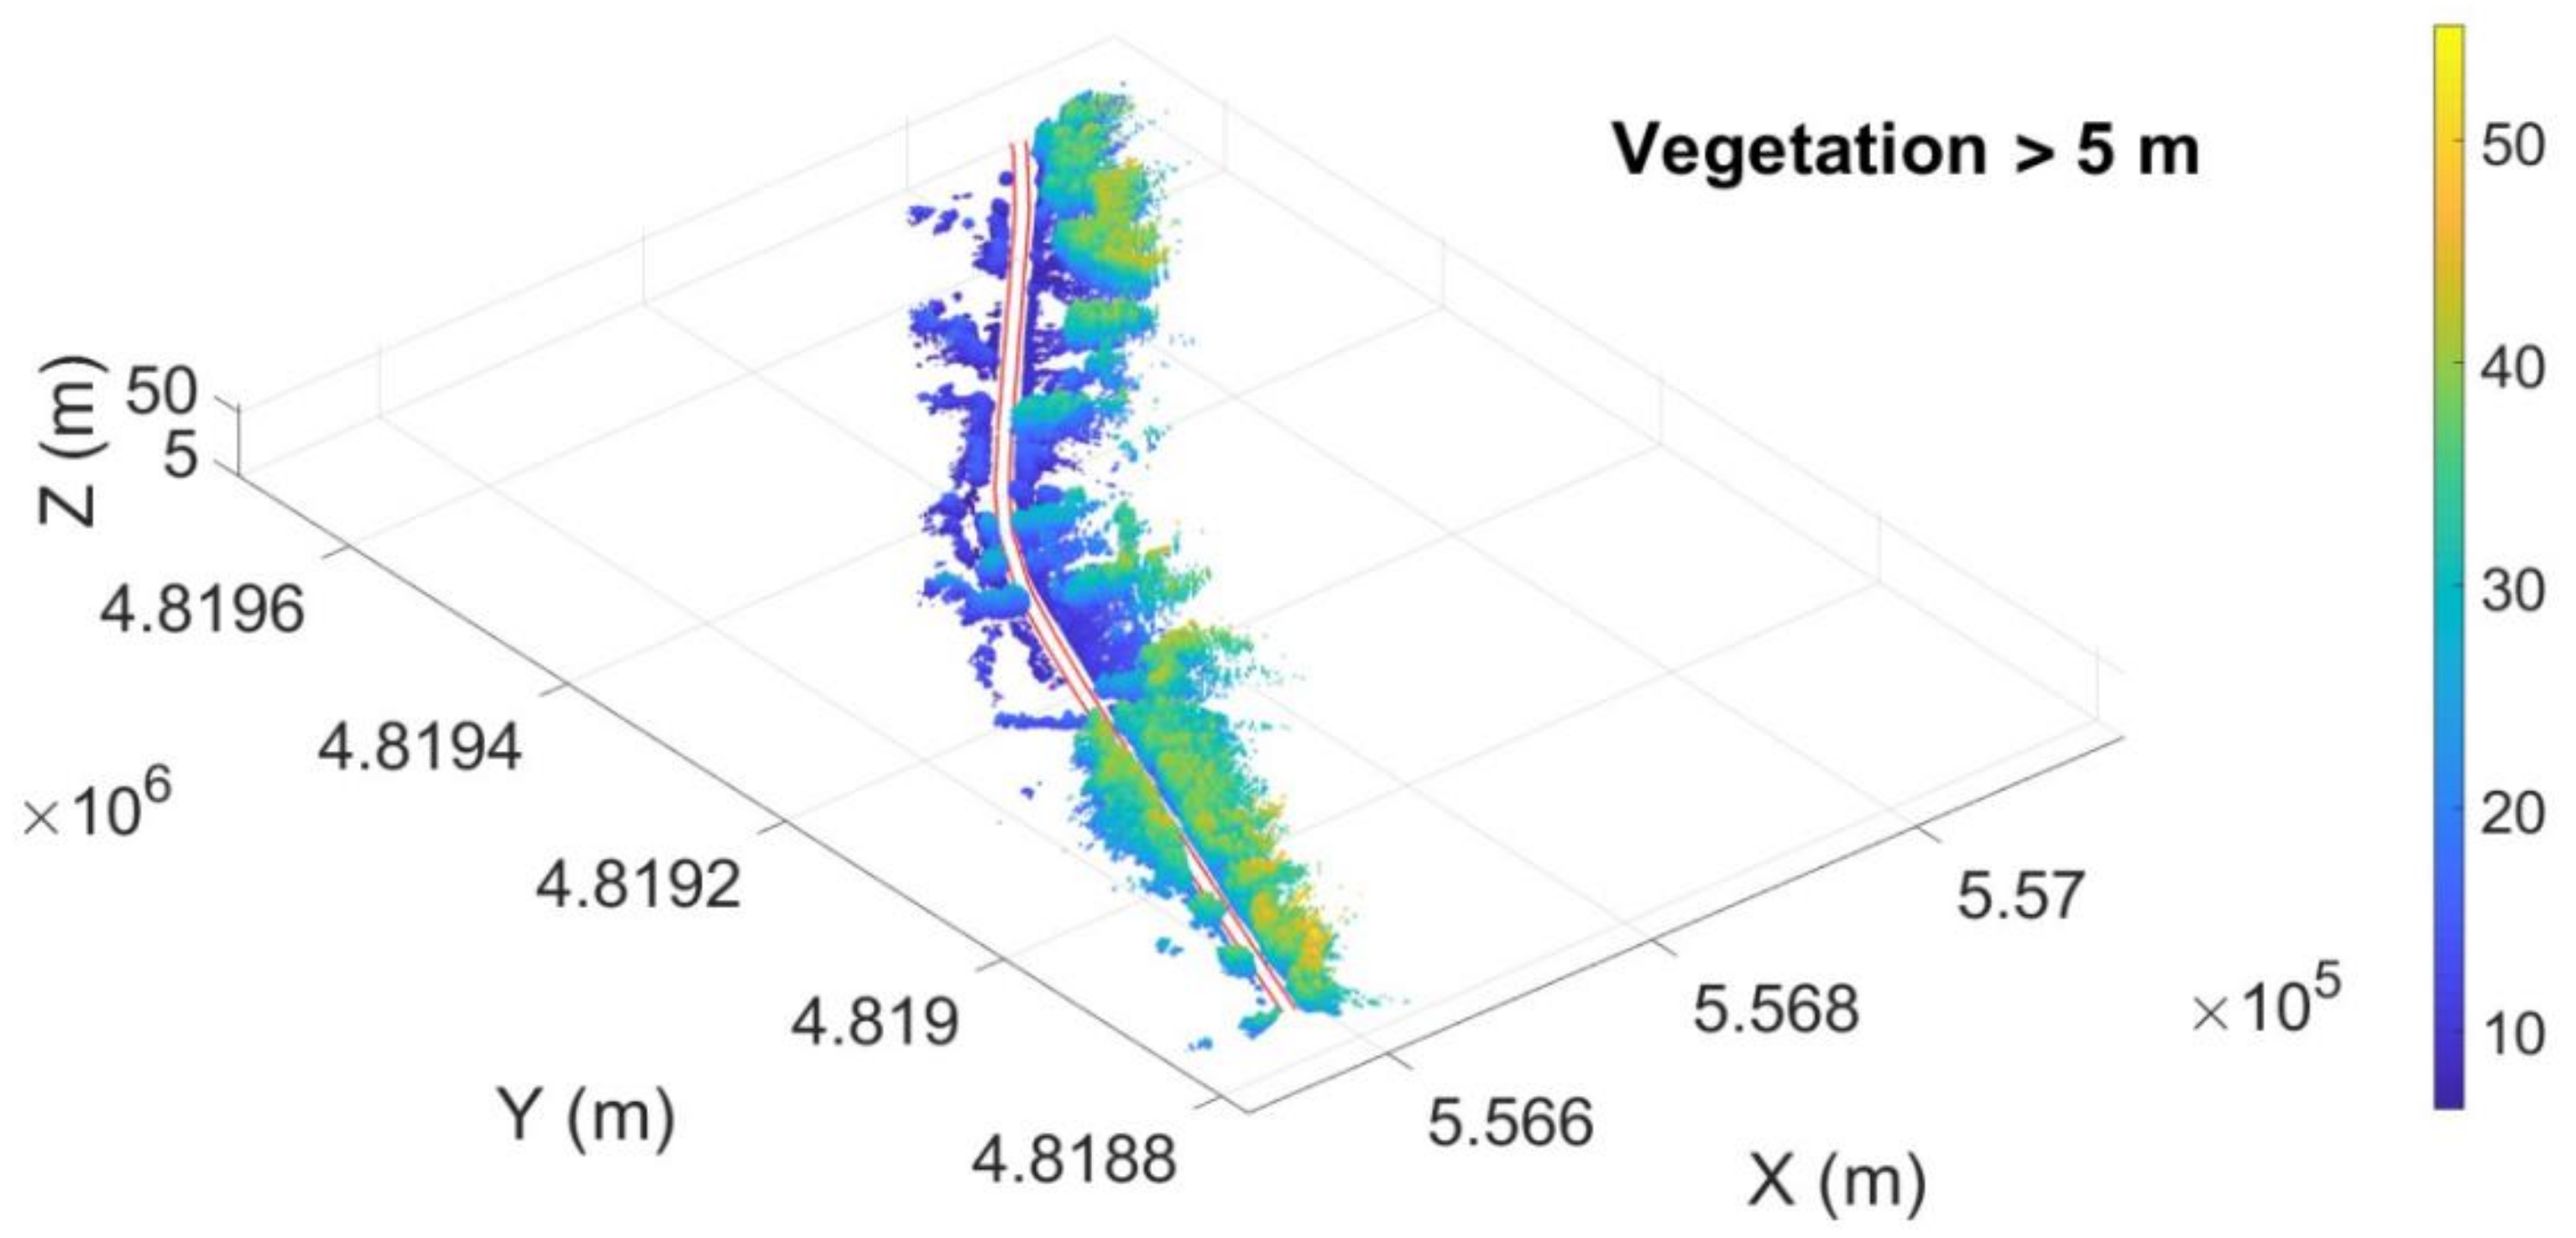
To detect tree vegetation adjacent to tracks, LiDAR (Light Detection and Ranging) data acquired by a device mounted on a vehicle appears to be very suitable. This procedure enables regular updates of the conditions in the surroundings, with automatic classification of vegetation into categories according to height and distance from the infrastructure. Novo et al. [13] applied this method to territory in Spain to identify areas which carried the risk of fire. The vegetation segments were divided into groups according to height (Figure 2). The boundaries were set at 5, 10, 15 and 30 m from the infrastructure. A great advantage over satellite images is the ability to detect even self-growing trees, which can, because of their unprotected location, pose a greater risk than dense forest. The detected stands were visualised and color-coded according to the recorded height. In addition to easy identification of areas with mature trees growing near infrastructure, this data offers high potential for further use in more detailed GIS (Geographical Information Systems) analyses.
Adjacent vegetation cannot be seen only as an adverse element. Its presence can also have a significant effect in reducing the rate of soil erosion. According to McEachran et al. [14], a slope with 50% vegetation cover can double its resistance to landslides. This fact can be an advantage, especially in areas with large slopes. Mature trees also provide shade for trains and increase traveller comfort, although with the gradual modernisation of railway vehicle fleets and deployment of air-conditioning units, this benefit has become less important.
Vegetation can also protect the environment against exhaust pollution and especially noise pollution from train traffic. This is especially important in areas where tracks pass through residential areas. The tree barrier can provide significant attenuation; the rate depends on the amount of vegetation, its height and arrangement. Greater foliage density also has a positive and large effect which can be evaluated according to the NDVI index (Normalized Difference Vegetation Index) [15]. Its principal criterion is the type of vegetation. For example, softwoods provide greater attenuation than hardwoods [16].
Vegetation near the infrastructure does not only have negative effects. Its positive properties were evaluated by Gellatley et al. [17], especially on slope embankments, the roots reinforcement and anchorage, soil buttressing and evapotranspiration effects, leading to enhanced slope stability. The effect of roots reinforcement is frequently used in increasing of geological stability of terrains and protecting roads from landslides.
Nevertheless, removing water from the soil can lead to movements that can negatively affect the quality of the railway infrastructure. According to the amount of consumed water, trees can be divided into groups for which it is necessary to make a specific minimum distance from the railway. For high water consumption (oak, poplar, willow), it is 1.5 times of their height, for medium consumption (ash, cherry, spruce) 0.75 times and for low, 0.5 times (birch, holly) [18]. Davies et al. emphasised that green infrastructure has been used to make the transport network more resilient towards climate change [19].
2.2. Health of the Stand
According to Chase et al. [20], the good health of a forest significantly increases its resistance to intense winds. Healthy wood can withstand wind speeds up to hurricane levels of 30 m/s. However, if wood contains rot, its strength is diminished. For hard rot, attenuation is around 20%, and soft rot may cause a decrease of 40 to 100%. At present, forest health is mainly experiencing the effect of low levels of precipitation, conditions which lead to reduced resistance to attack by harmful organisms.
Vegetation health is the result of several physical factors, among the most important being the amount of sunlight needed for photosynthesis. The amount of incident light directly affects the amount of biomass produced. This parameter is based not only on atmospheric conditions but also vegetation density, which affects the amount of shade produced. Another parameter is the amount of precipitation, whose lack causes water stress. Soil quality is also a significant contributing factor in this adverse phenomenon, as soil absorbs and retains a large amount of precipitation and then supplies the necessary moisture to plants during the dry season to ensure their survival [20].
The final important attribute is temperature. Each plant requires a specific range for optimal growth. A rising average temperature consequently leads to plant species wilting in areas where they previously possessed ideal conditions. Some types of vegetation can adapt to this development by slowly migrating to higher altitudes. A significant factor produced from activities carried out by people is reduced air quality. Air contains flora-damaging compounds, especially in industrial areas. The most significant pollution is sulfur, which causes acid rain [20].
However, climate change does not only have adverse effects. Scientific studies have found that higher concentrations of CO2 in the air and warmer winters benefit some plant species. Higher temperatures, however, may raise the potential numbers of pest species, which can place plant health at risk [21]. Buildings, bridges, viaducts or other artificial obstacles have the positive effects of protection against the wind for vegetation and railway.
2.3. Use of Remote Sensing of the Earth to Monitor the State of Vegetation
Satellite images can be used to determine the health of forest stands. These images serve as input data for the calculation of vegetation indices. The indices are based on the vegetation’s spectral behaviour, characterised by a significant decrease in reflectivity at wavelengths near the infrared radiation band. This manifestation is mainly caused by chlorophyll. It is also affected by the cellular structure of plants, which differs between species and allows us to distinguish them from each other. Spectral behaviour varies during the growing season and can be significantly affected by plant health. In the present study, to assess the health of forest stands, we selected a normalised differential vegetation index (NDVI), which specifies the normalised ratio of surface reflectivity in the red (RED, 600–700 nm) and near-infrared (NIR 700–900 nm) parts of the spectrum. From this information, we were able to determine the amount of biomass in each pixel of the image.
The NDVI index is one of the most widely used methods of assessing the state of vegetation. Long-term monitoring of an area allows the identification of forest processes, which reflect the effects of climate change and the difference in total precipitation. The index values range from −1 to 1, and the vegetation is in the range of 0.1 to 1. The negative range contains, for example, water areas. Areas near 0 have similar reflectivity in the red and near-infrared parts of the spectrum and therefore indicate areas with no vegetation cover. Areas near 1 indicate a high vegetation intensity or level of green areas. Many scientific papers apply the NDVI index to evaluate the effect of change in total precipitation, which is one of the most important climatic factors directly affecting the condition of plants. In addition to the year-on-year comparison, we can also observe seasonal manifestations. These can have a predictive character for future developments [22].
An analysis of the degree of correlation between NDVI development and the amount of precipitation showed an average result of 60%. This value was determined based on monitoring the amount of precipitation in China’s territory over a period of 16 years. The least similarity was recorded in years of below-average precipitation. This can be attributed to the ability of plants to adapt to changes over such a period [23].
Tesfay and Awoke [24] examined the suitability of application of the NDVI index over other indices. The authors calculated this using Sentinel-2 data and compared development over a year with the leaf area index. In their work, they mention the disadvantage of the NDVI index, which at maximum values, i.e., when plants contain the greatest amount of biomass, shows a slight fluctuation in its value. This could be attributed to the fact that although leaves absorb the maximum amount of red radiation, the leaf structures partially scatter near-infrared radiation into the surroundings. This effect can result in an underestimation of the vegetation state. The results of the work, however, showed that the determination coefficient reached a value of 0.98 and thus expressed a very strong dependence. From 2005 to 2016, Goodarzi et al. [25] evaluated 11 vegetation indices of a selected forest area. The authors attempted to identify a correlation based on the Cohen kappa coefficient between the values of the indices and the average precipitation and temperature development. The greatest correlation with changes in precipitation was recorded in the OSAVI (Optimised Soil Adjusted Vegetation Index) index, with a value of 80%. The greatest correlation with temperature was recorded in the MNDWI index (Modification of Normalized Difference Water Index), with a value of 75%.
For a more objective evaluation of the vegetation state, it is necessary to work with data from a longer period. It makes it possible to identify the process of wilting, stagnation or positive development of the stand. For the correctness of the result, it is necessary to define, in each year, several periods in which the imaging was performed. If data were selected from only one time period each year, the result could be affected by an abnormal climate, which can cause the vegetation phase to accelerate or slow down [26].
In the case of index calculation using satellite images, it is possible to determine the health status even in areas that are difficult to access or inaccessible, at the expense of relatively insignificant resources. The disadvantage of using this data is their lower spatial resolution. However, their use can only serve for a general evaluation of a large area as a basis for the specification of problem areas with an identified process of wasting. These can then be photographed in more detail using a drone or an airplane [27,28,29].
The index can also detect windfallen trees caused by extraordinary events when two close periods are evaluated. Based on their comparison, it is possible to identify significant differences that may reflect the damage’s extent. This source can quickly provide data for the analysis of large areas [30]. It is possible to use data that capture the reflectivity in the red and infrared spectra for determining the vegetation index. For large areas, it is offered as the most suitable carrier placed on a satellite. It can scan large areas at regular intervals. However, this data has a disadvantage in lower spatial resolution and image quality, depending on the clouds’ state.
The currently freely available source of quality data comes from the European Space Agency’s, Sentinel-2 program. It was launched in 2015 and currently includes two satellites that scan the Earth’s surface at 5 days of periodicity and 13 parts of the spectral band. The spatial resolution of the scanned area is 10 m. When using this data, it is necessary to make corrections to the clouds and shadows that it creates on the Earth’s surface. If they were not removed, then the results would be significantly degraded [31].
The lack of cloudless data for the evaluated area can be solved by combining multiple sources. However, it is necessary to calculate the conversion relationship between them using transformation equations. It is necessary, mainly due to the different settings and accuracy of the sensors. For example, Landsat images showed a correlation coefficient of 0.9 with the Chinese Huang-Jing 1 system [32].
In the analysis of the time series of vegetation indices, it is possible to identify not only the development of vegetation cover but also its devastation. These purposes seem appropriate, for example, in assessing the impact of human activity on the landscape. These may include, for example, surface mining of minerals, timber, construction of settlements and others. For these needs, it is possible to use a supervised classification, in which training areas are created in the area of healthy vegetation and devastated. Subsequently, it is then possible to detect the extent of the damage. After the destructive processes are completed, these methods can also be used to monitor the gradual renewal of vegetation, during which the values of vegetation indices increase [32].
Sentinel-2 data are currently used by the Forest Management Institute (FMI), which is the Czech national administrator for forestry and hunting. The entire evaluation methodology was compiled based on a comparison of satellite data with ground investigation, during which the leaf area index was determined according to hemispherical photographs. The spatial resolution of 20 m per pixel in the satellite images (corresponding to an area of 0.04 ha) is suitable for monitoring a forest stand’s condition since the average area of a forest unit in the Czech Republic is 0.5 ha. However, it is necessary to evaluate the conditions in the appropriate phenological phase. Spectral resolution in the visible and infrared spectrum reflects the state of key attributes in vegetation: leaf biomass, amount of chlorophyll and amount of water in tissues [33].
Detailed scanning of the Šumava Mountains using a drone to assess the health of woody plants was carried out by Minařík and Langhammer [34] in the Czech Republic. The drone was equipped with multispectral sensors which captured surface reflectance in individual bands. Several vegetation indices were used to determine the health of the forest stand. Their values were then divided into intervals that indicated healthy, dead, or regenerating vegetation. The results were then compared with real conditions. The NDVI index demonstrated the most optimal characteristics for the identification of individual classes.
Hoerbinger et al. assessed the risk of the railway corridors by adjacent woody vegetation in Austria [35]. Their assessment was demonstrated on 27 km of track passing Alpine Rhine Valley. Vegetation risk index was based on data from aerial laser scanning and orthophotos. The main parameters for determining the degree of threat were the height of the stand, the distance from the track and the geometric properties like a slope of the adjacent terrain. Their combination identified trees that could affect the infrastructure in the event of a fall. Two years were evaluated in 2012 and 2017. In the first, the risk was 9.8% of vegetation area and in the second was 11.1%. The results show that it is necessary to monitor the current situation regularly because it shows high dynamics. The capturing data by aerial laser scanning is realised as an occasional gathering of data for selected small areas. GIS (Geographic Information System) helps in processing data [36].
3. Materials and Input Data for the Analysis
The present study uses data on forest species composition and average forest height provided by the Forest Management Institute of the Czech Republic (FMI) [37,38]. The railway infrastructure routes were obtained from the Railway Administration [39]. Vegetation health was assessed according to Sentinel-2 satellite images. A brief description of the source data for a presented case study in the Czech Republic follows. The detailed steps of processing are described in Section 4.
3.1. Forest Species Composition and Height of Forest Stands
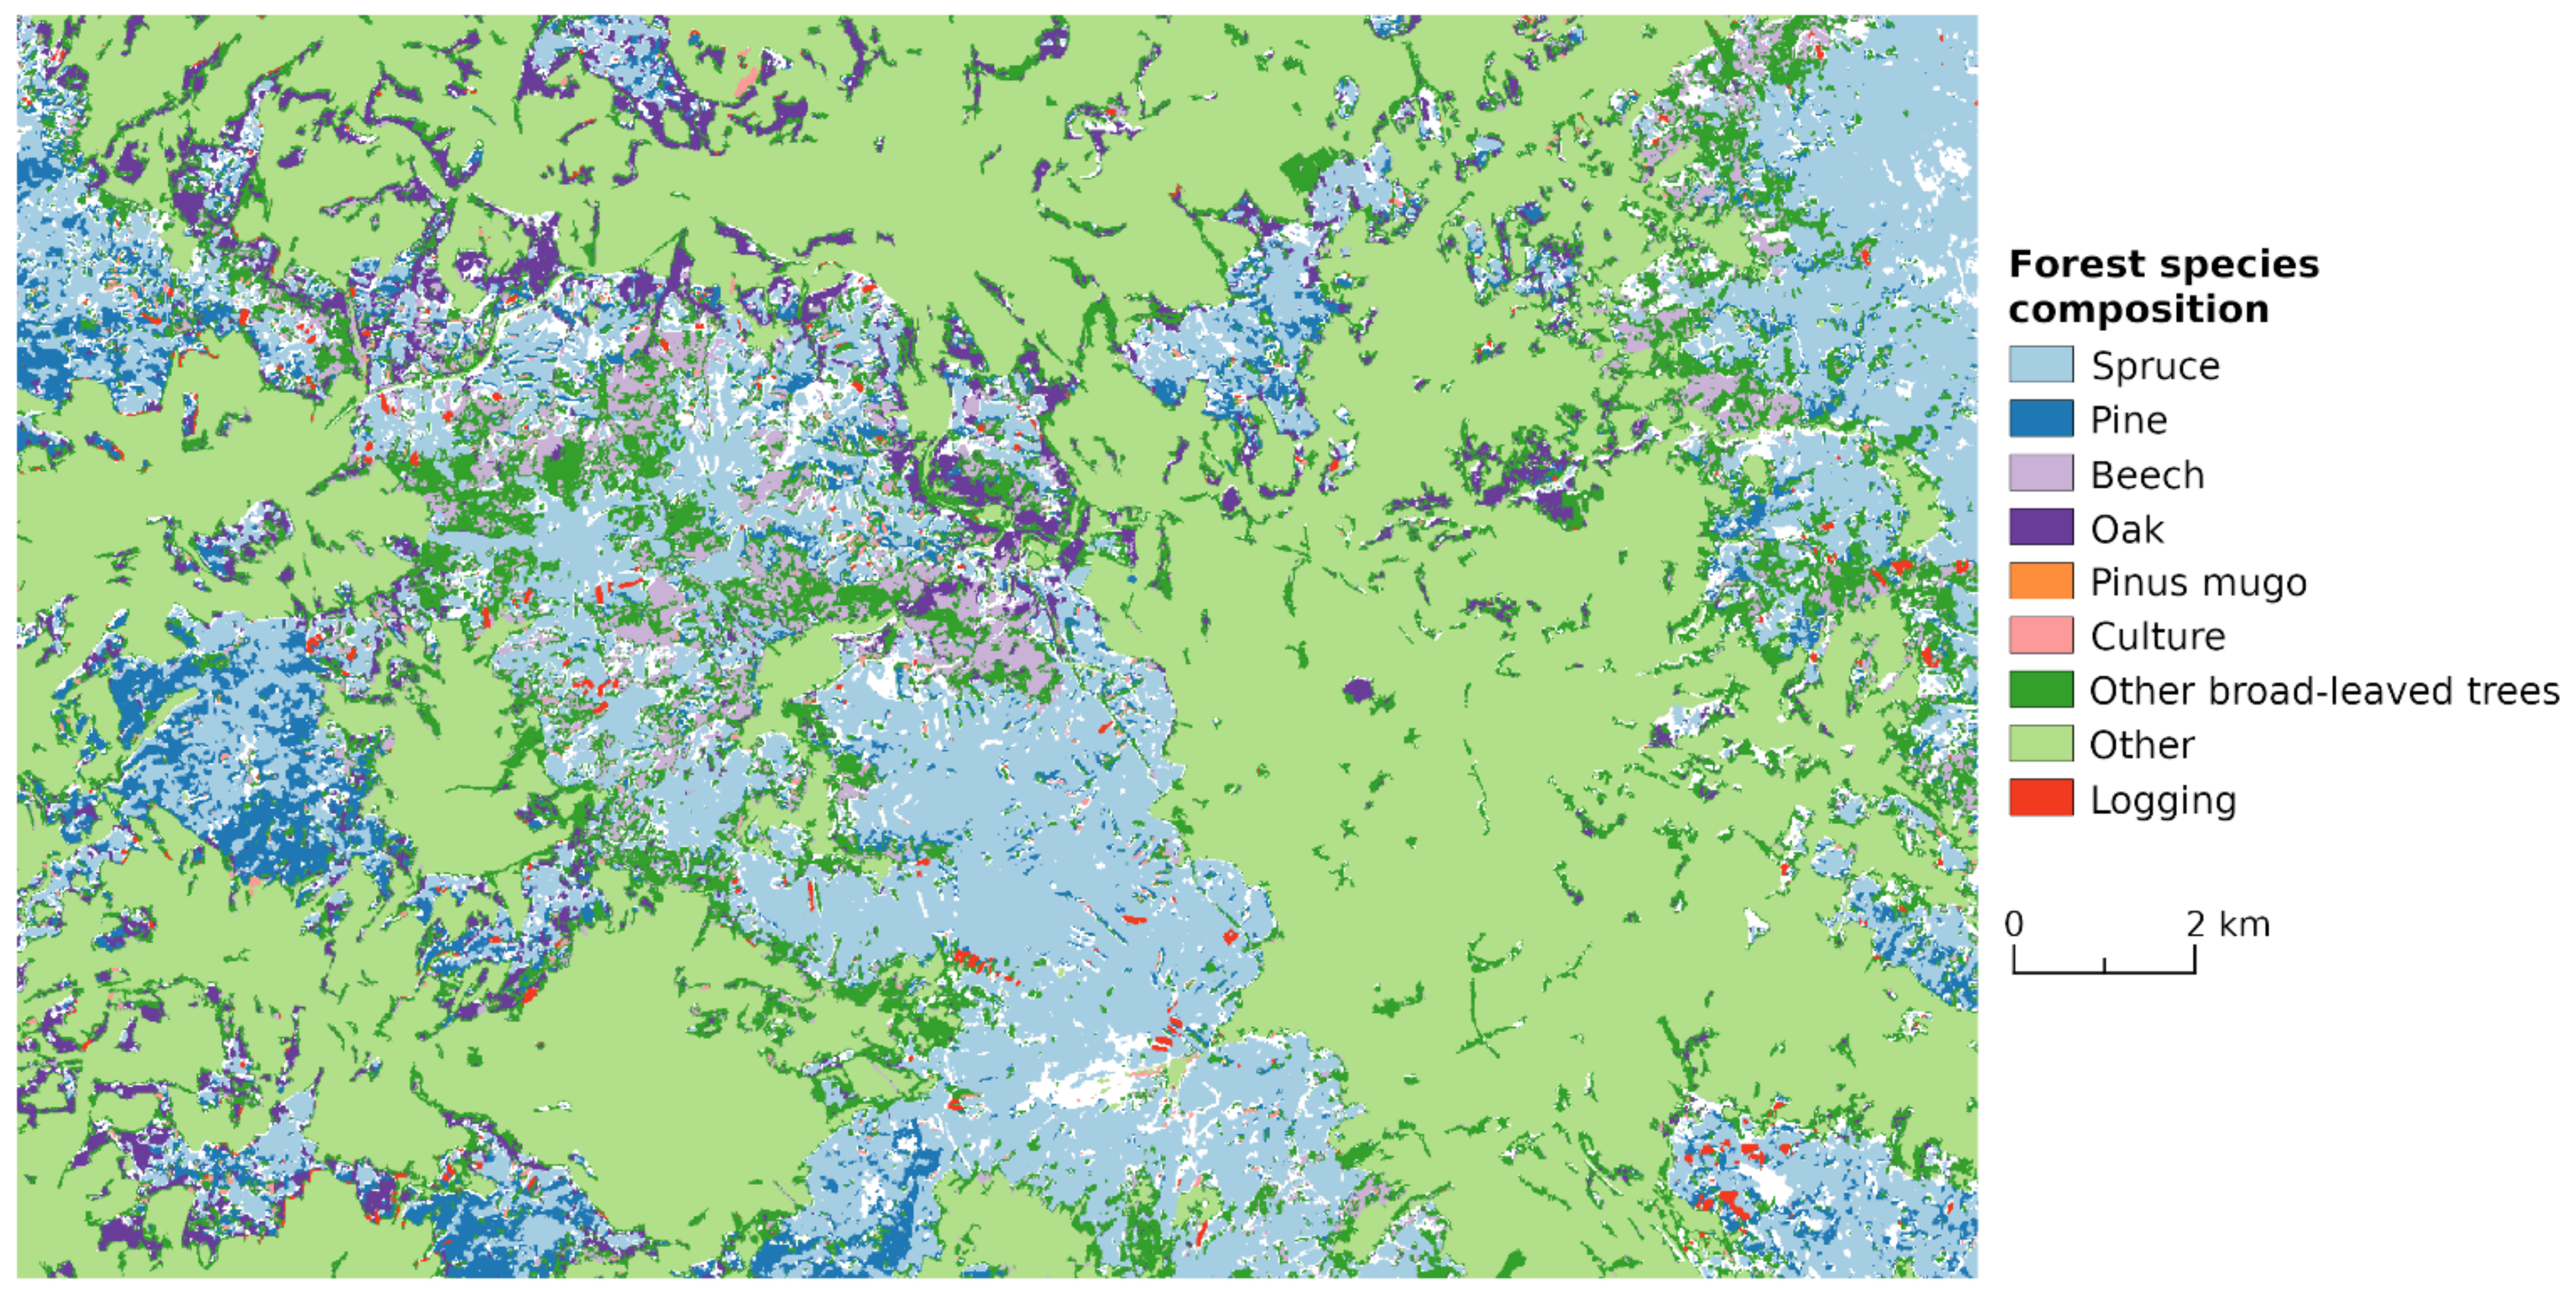
The Forest Management Institute processed a complete classification of forest species composition for the entire Czech Republic. The primary source of classification was LANDSAT-7 satellite data. Species were identified according to different spectral characteristics. Specifically, the following categories of forest species composition were defined: spruce, pine, beech, oak, other broad-leaved trees, culture (young trees less than 1.3 m in height), pinus mugo, other (mixture of trees) and logging (or forest clearing) [37]. The spatial resolution of the data is 10 m. Figure 3 shows an example of species categories identified from the satellite images. For the present research, we requested the classified raster dataset from FMI.
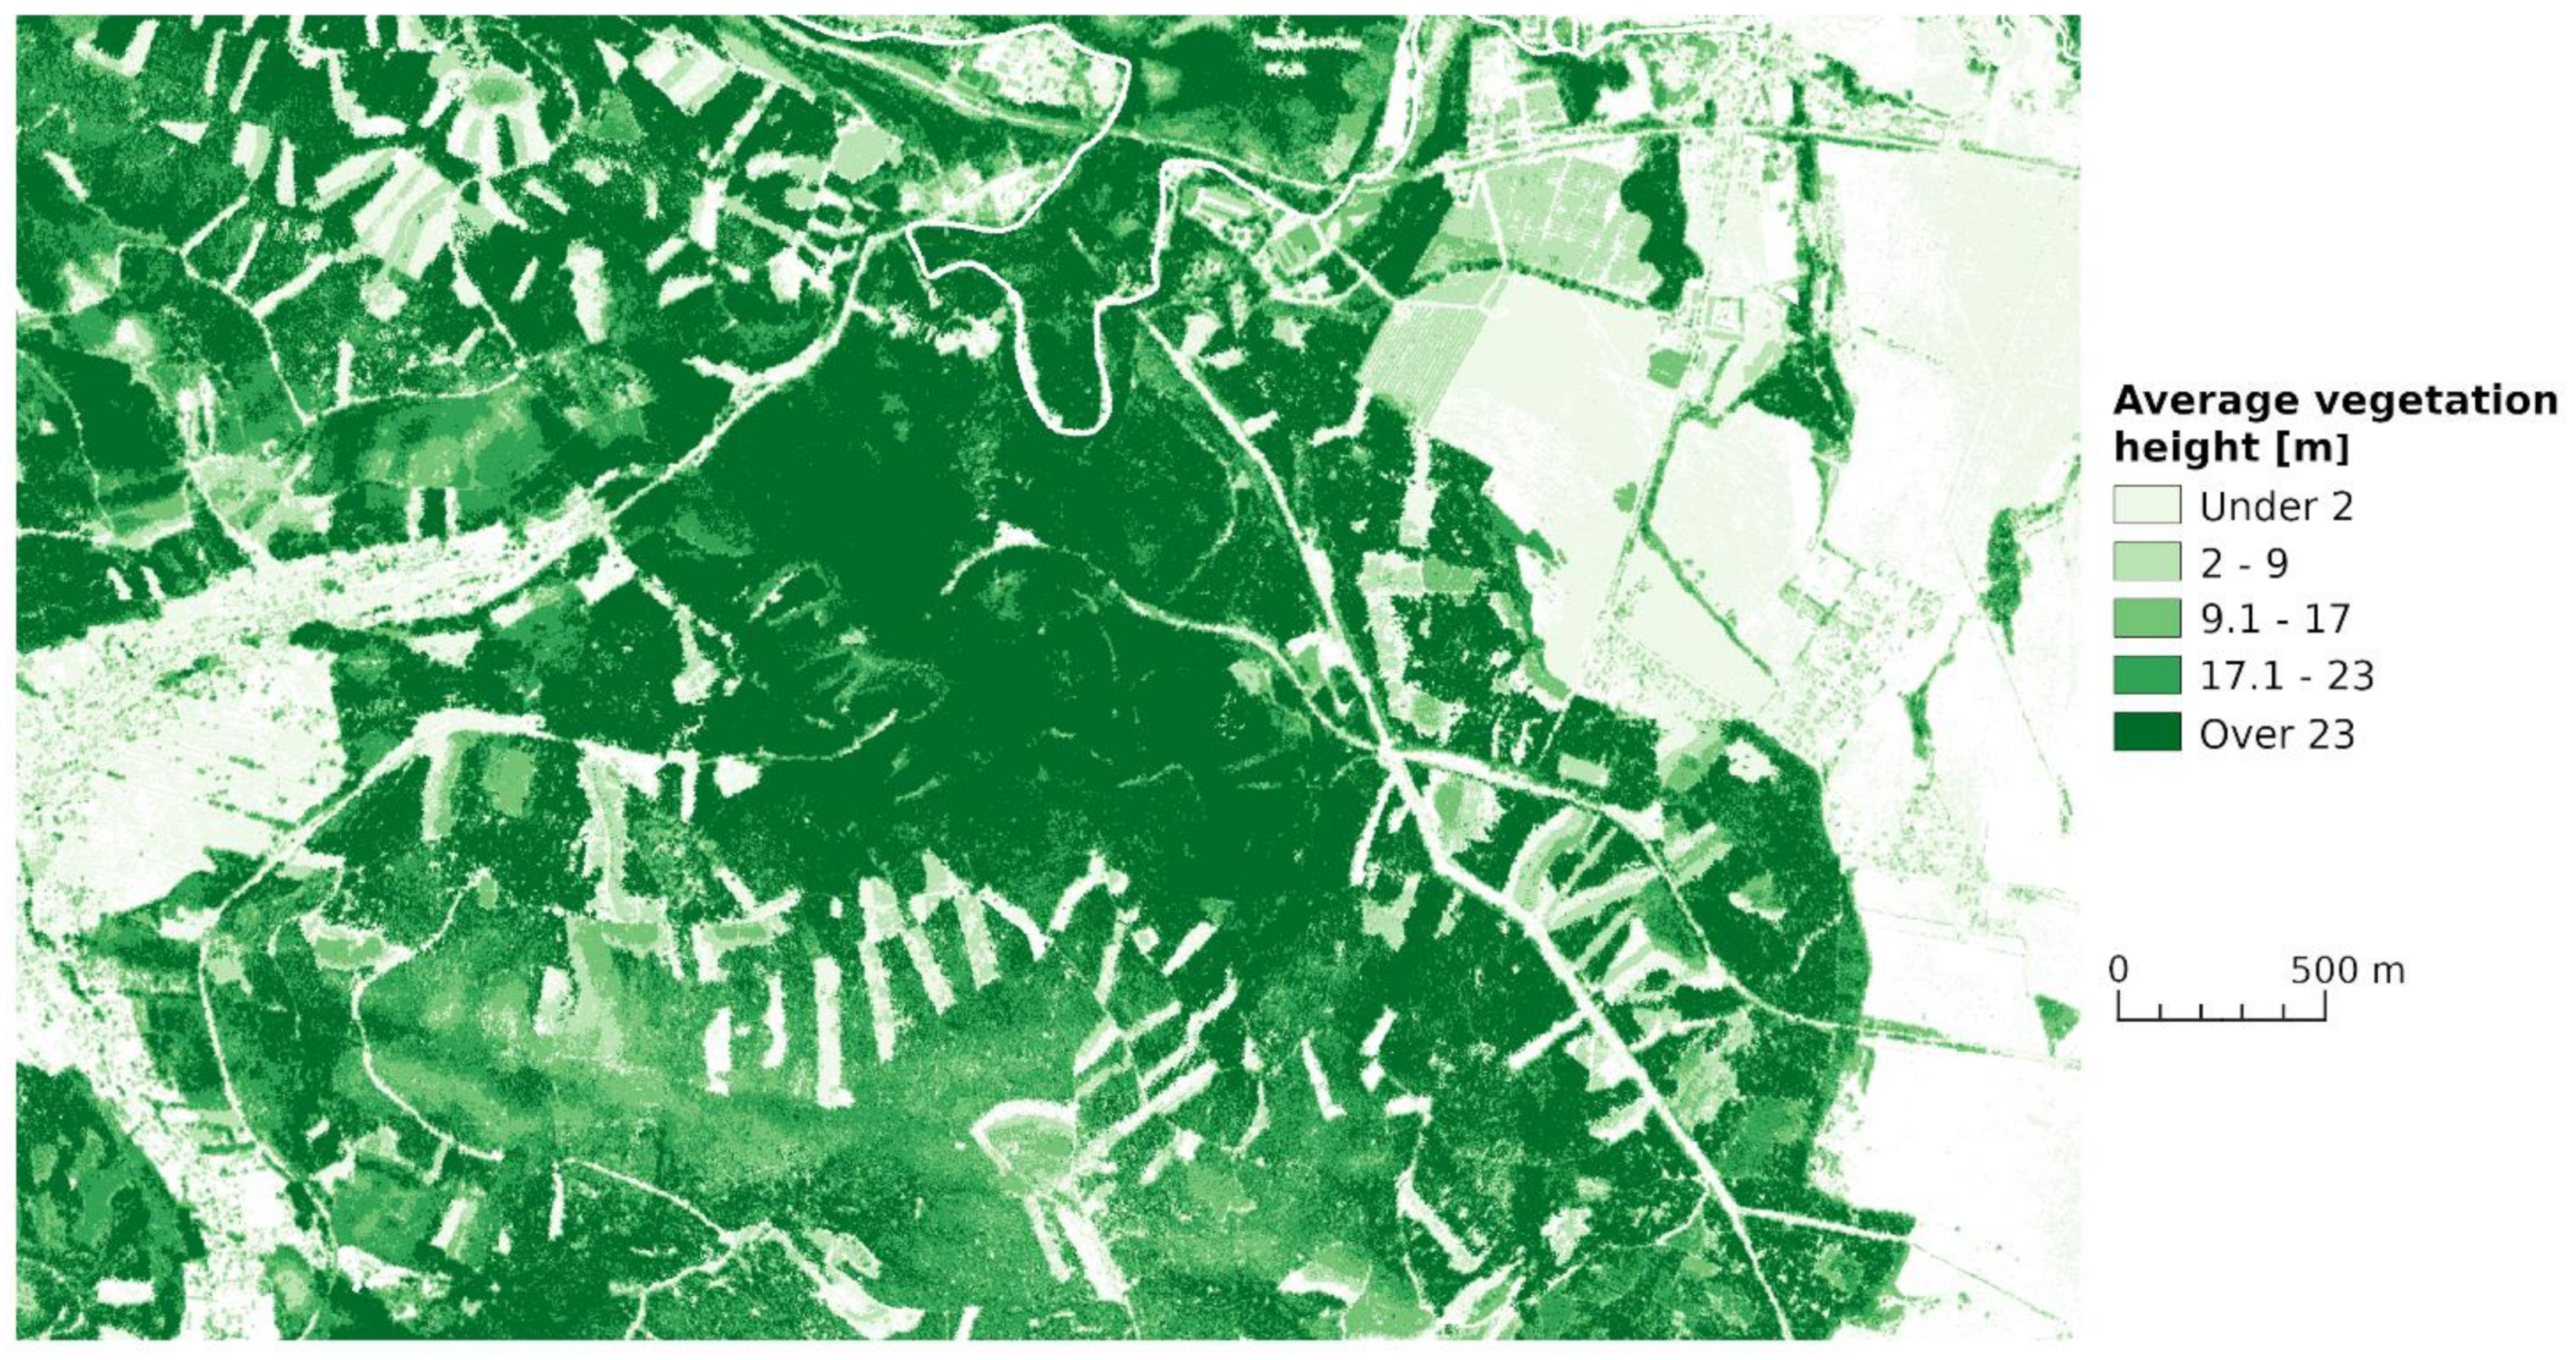
The FMI has also processed raster data on the height of forest trees. Data were created by combining a digital terrain model with digital relief model data. From this information, the average height of the forest stands in individual pixels was determined. The spatial resolution of the data is 2 m [38]. Figure 4 presents an example of this data. For our processing, the data were recalculated from the 2 m resolution to the 10 m resolution, and the average value of height was assigned. For the present research, we requested the raster dataset results from the FMI.
3.2. Sentinel-2 Satellite Imagery
We evaluated the vegetation health around railway infrastructure using Sentinel-2 satellite images. These European Space Agency satellites have a circulation time of 5 days. The spatial resolutions of the images are 10 and 20 m [40]. We selected and processed images with minimum cloud cover from 2017 and 2018 with 20 m resolution. The images already had atmospheric corrections applied by the provider. The effect of low cloud in the images was removed with layers which masked the areas they affected. Three periods from each year were compared to increase the objectivity of the results and reduce the effects from extraordinary climatic conditions which influence the vegetation cycle. The data were resampled from 20 m to 10 m resolution to correspond to other data sources.
3.3. Railway Infrastructure and Accident Records
Vector data from the Railway Administration on railway infrastructure were used. Vector data are based on accurate geodetic measurements and are subsequently generalised for internal use in various FMI projects. The level of generalisation is also suitable for this case study. Figure 5 shows the correspondence of the vector lines with the satellite image.
FMI records data on railway accidents and any other extraordinary events on railway infrastructure in the Czech Republic. The data contains a description of the location, causes, consequences and solution of the accidents, along with other information. Positions in the form of track ID and definition, section and hectometer are unfortunately not recorded identically in each record. This information is only assigned to sections identified with two terminal railway stations. The sections vary in length from a hundred meters to several kilometres. As a result, the precise locations of accidents are not possible to determine. Only extraordinary events on the railway contain this precise information.
Nevertheless, we were able to roughly compare the sites at threat identified in our study with the actual number of accidents, although the comparison is not reliable. The number of accidents and their locations along the railway section where they occurred are shown on the map in Figure 6.
3.4. Vector Layer of Forests in the Czech Republic
The forest data layer was produced from the dataset Data50–Digital Geographical Model of the Territory of the Czech Republic. Data50 was derived from a cartographic database for a base map of the CR at a scale of 1:50,000. The State Administration of Land Surveying and Cadaster produces the data and provides regular updates. Data50 belongs to Open Data [41]. The forest stands vector layer forms a part of the thematic layer Vegetation and Bare Surfaces, at a scale of 1:50,000. This layer was only used to verify the correct locations of forest stands.
4. VTIR and Liberec Region Case Study
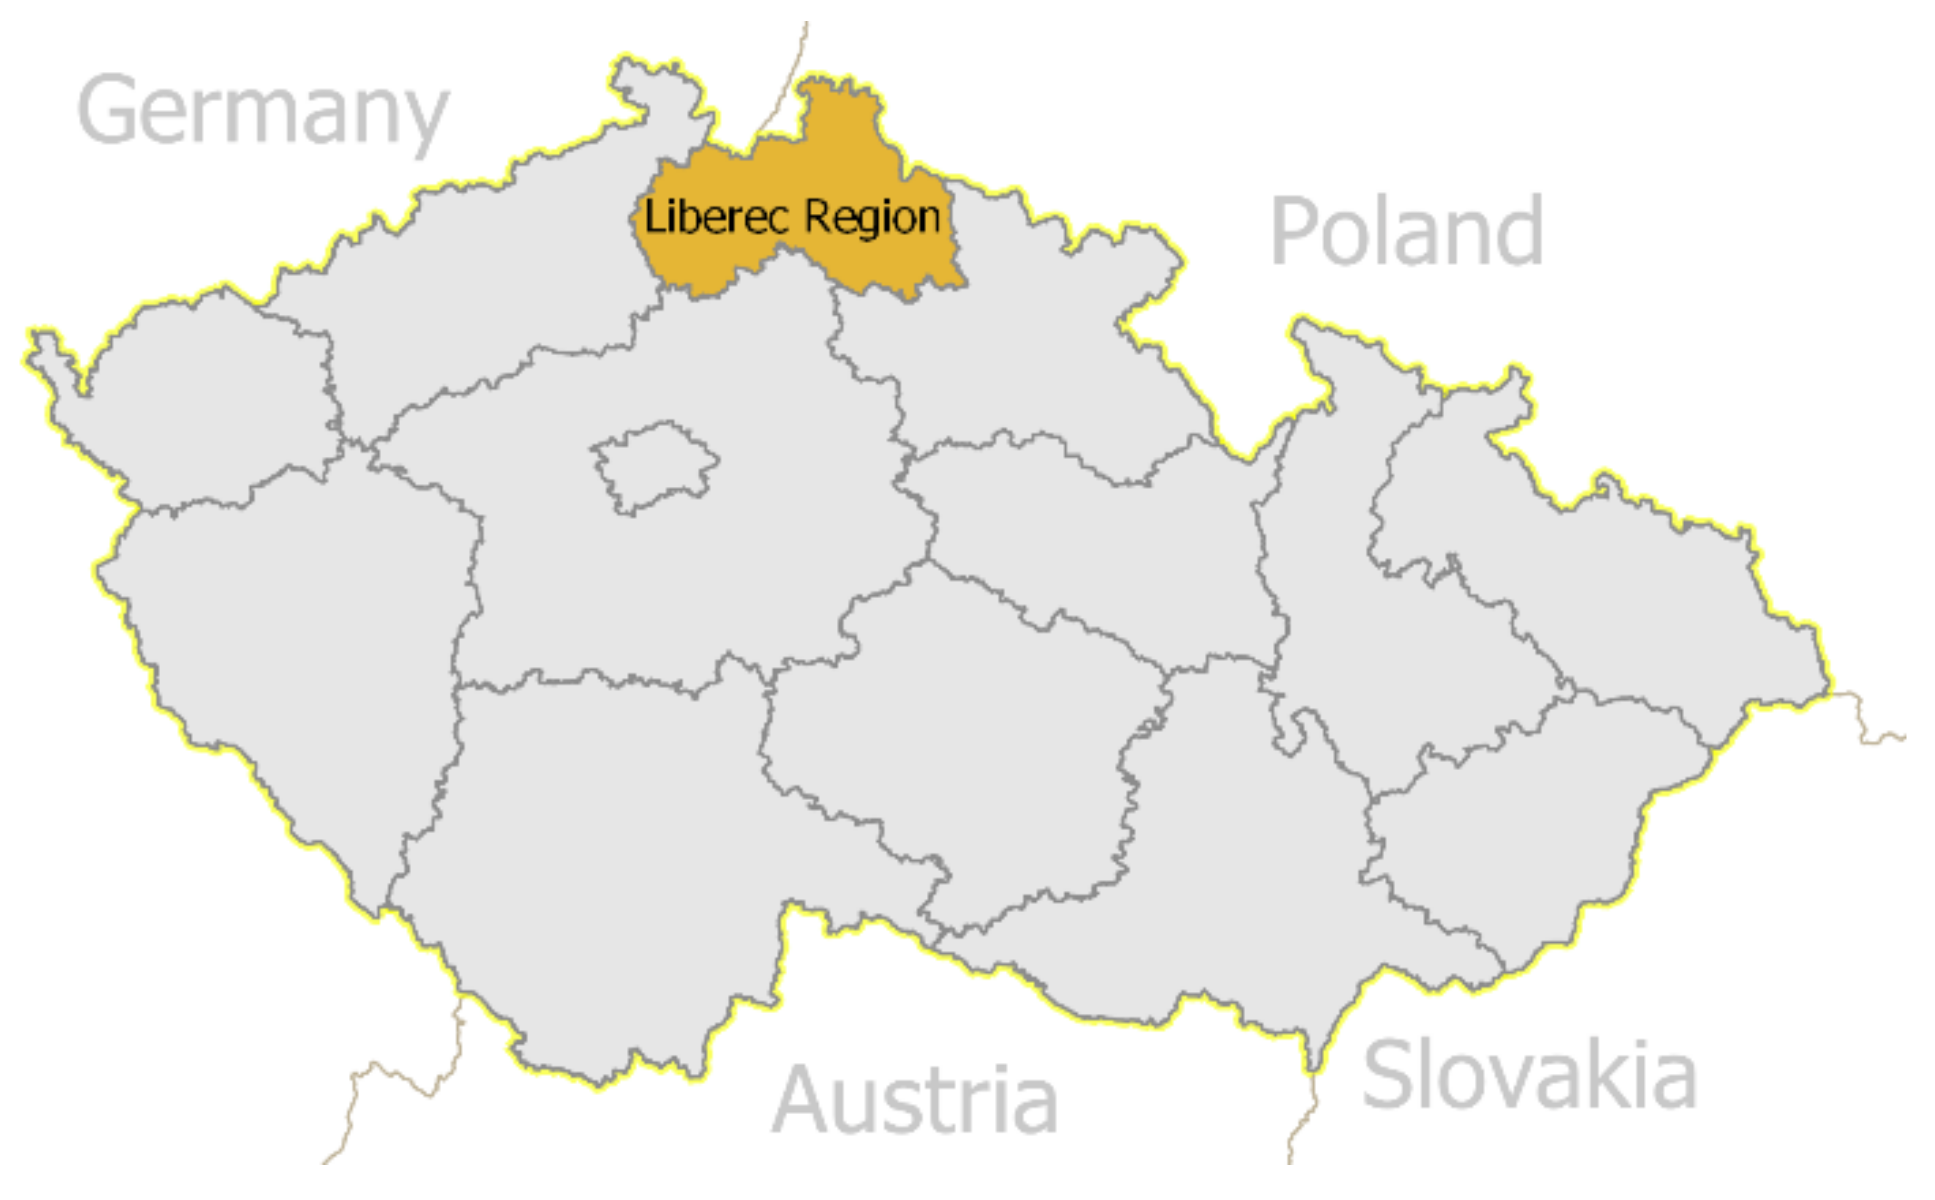
We selected an area of interest as a case study to assess its level of threat, but only one region, not the entire territory of the Czech Republic. One region alone poses sufficient computational complexity to calculate the level of threat. However, based on our findings and the compiled procedure, it would be possible to evaluate larger areas and, therefore, the entire country. The Liberec Region was selected as suitable territory mainly because it is located in the Czech Republic’s mountainous area, which has a significant occurrence of forest stands existing near railway infrastructure (Figure 7).
Some characteristics of the region are given in Table 1. The current data records many extraordinary events occurring to railway infrastructure involving fallen trees and allows us to compare the theoretically determined degree of threat with the actual occurrence of accidents.
The first step was to prepare the case study data which indicated areas of threat to the railway infrastructure by falling trees. Specifically, this entailed the conversion of raster data into a WGS-84 unified coordinate system. Selection of this coordinate system was based on the most frequent occurrence of the input data.
4.1. Reclassification of Forest Species Composition
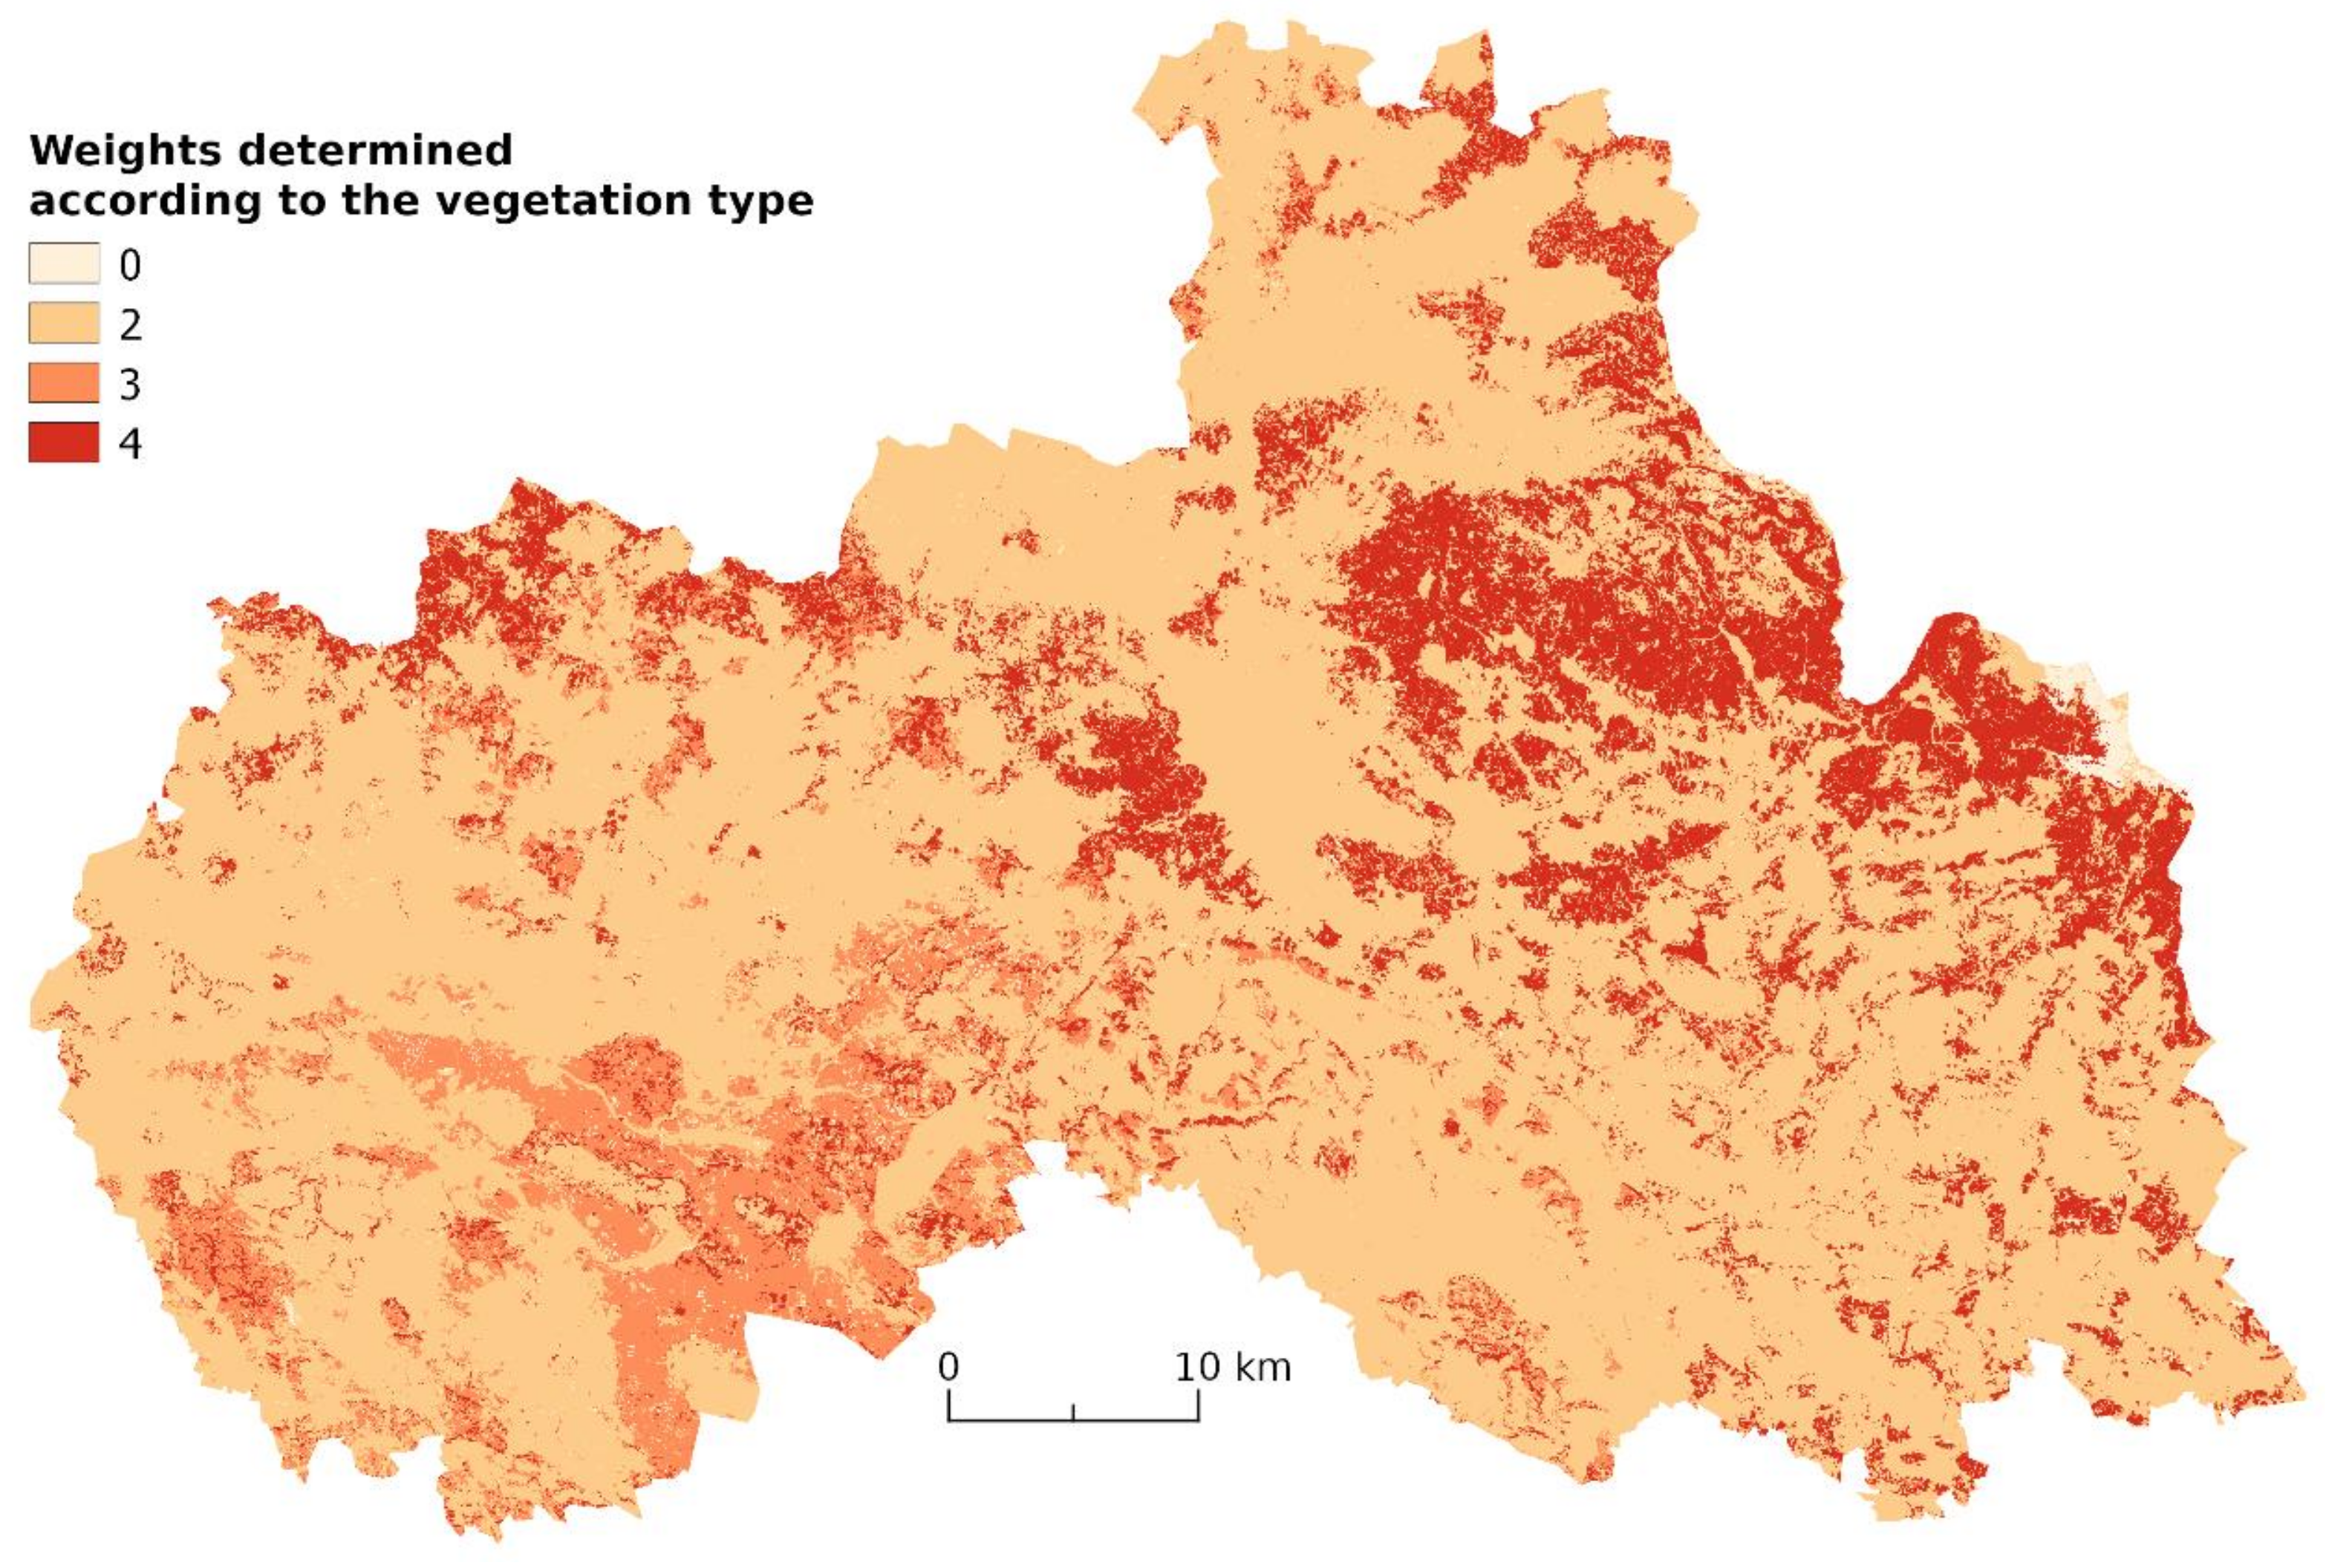
An important step was a reclassification of the source raster with forest species composition (described in Section 3.1). Individual species were assigned weights according to the expected degree of threat from intense wind and snow. Their values were determined according to already previously published forestry studies. Coniferous species, for which a higher degree of threat is expected because of their shallower root systems, were evaluated with greater weights. No threat was expected for pinus mugo, logging and culture (which includes vegetation in the range of 0.6 to 1.3 m in height) [8]. Species compositions with assigned weights are listed in Table 2. Figure 8 shows the reclassified raster for the Liberec Region according to weight.
4.2. Average Height of Forest Stands
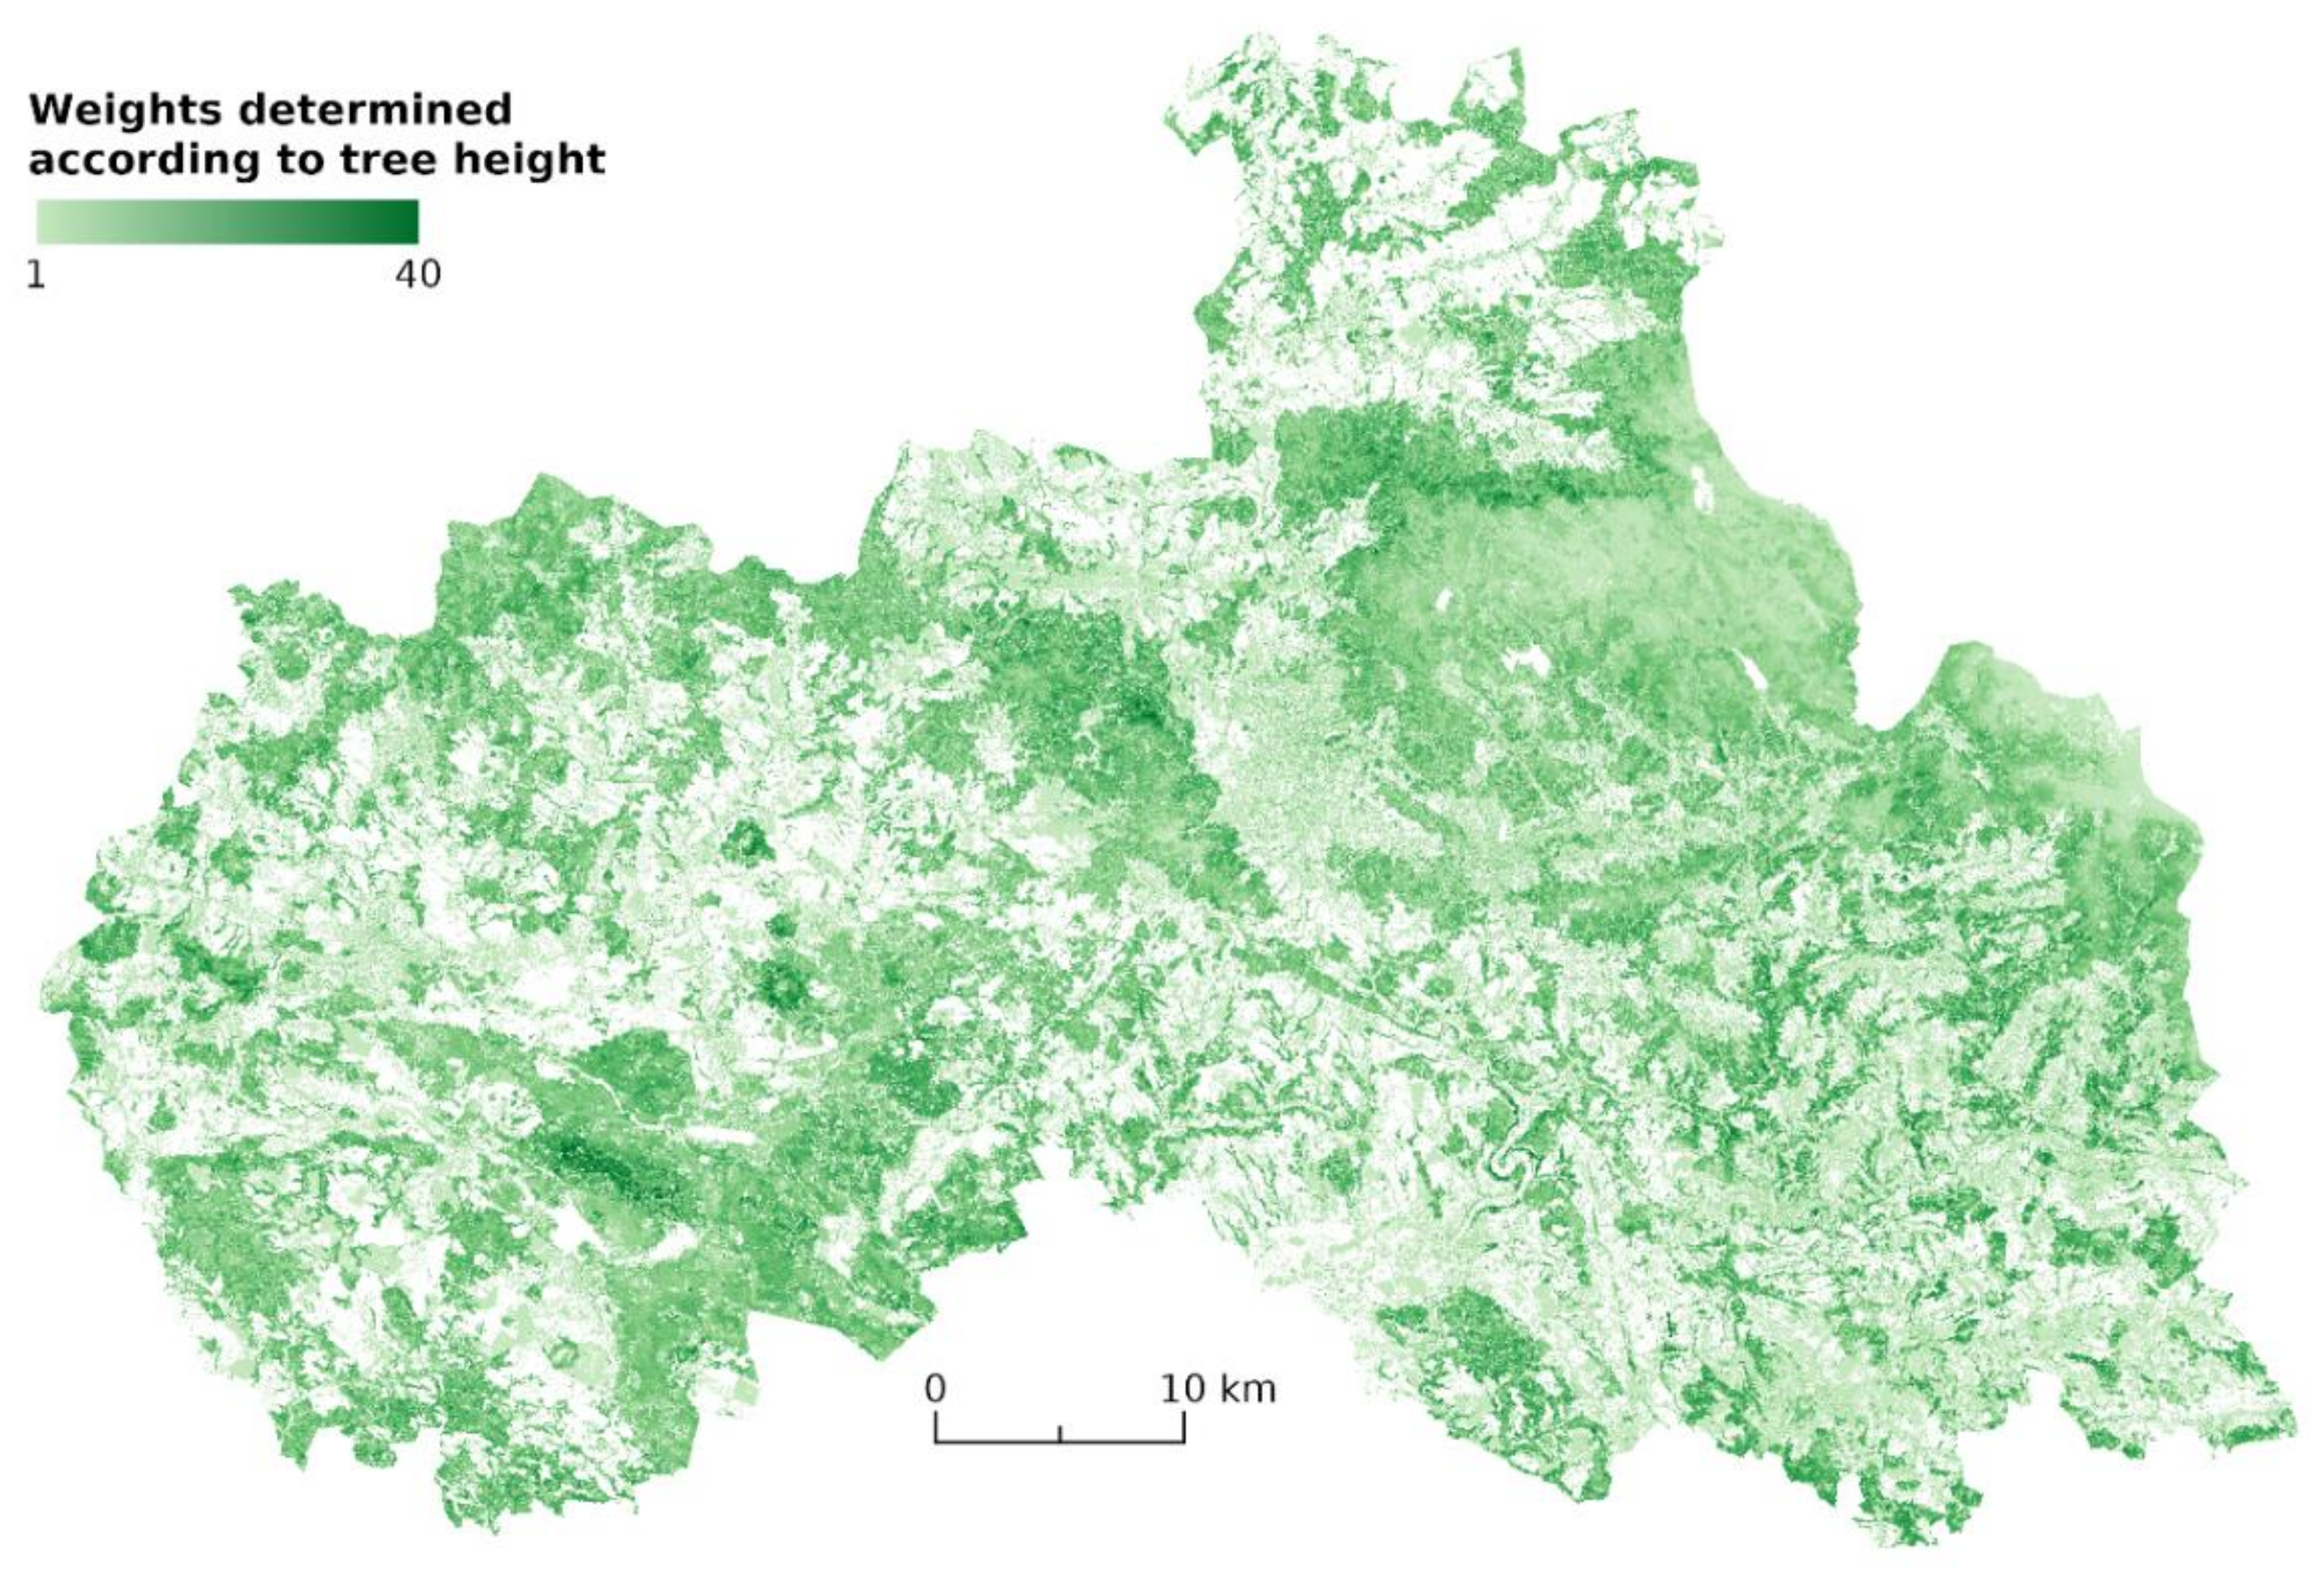
The data containing the average height of vegetation consisted of two raster data sets, each covering half of the territory of the Czech Republic. This form corresponded to the scanning method, in which exactly half of its area is checked annually. No adjustments were made to these data by the FMI since the height of the vegetation near railway infrastructure has a significant effect on the level of its threat. Height represents weights directly in the final calculation of the raster for the level of threat. The raster for the heights of forest stands is shown in Figure 9.
4.3. Evaluation of Forest Vegetation Health
Wilting of vegetation in the stand mainly due to degradation of the trunk and root systems can significantly affect its resistance to external effects. Forest health data was compiled for the entire territory of the Liberec Region; however, for the detailed description in this article, only a smaller area was defined, which included a major part of the railway track leading through forest stands. The current orthophoto map (Figure 5) and vector layer from the Digital Geographical Model of the Czech Republic–Data 50 were used to verify whether the vegetation was actually present in the area [41].
First, we downloaded Sentinel-2 satellite data for the Liberec Region. These data contained T33UVS and T33UWS tiles, and the images contained no high clouds and represented three defined periods, i.e., May, July and September in 2017 and 2018. The images were further processed with masking using vector layers distributed with the images. We subsequently assembled maps in the red (Sentinel-2A 664.6 nm, Sentinel-2B 664.9 nm) and near-infrared (Sentinel-2A 704.1 nm, Sentinel-2B 703.8 nm) parts of the spectrum, covering the entire region. Their final spatial resolution was 20 m [43].
In the next step, we calculated NDVI indices from these mosaics using Equation (1). The indices correspond to the normalised ratio of surface reflectivity in the red (RED 600–700 nm) and near-infrared (NIR 700–900 nm) parts of the spectrum. From the index value, it is possible to determine the amount of biomass in individual pixels of the image.
where NDVI is normalised difference vegetation index; NIR is near-infrared reflectance value and RED is red reflectance value.
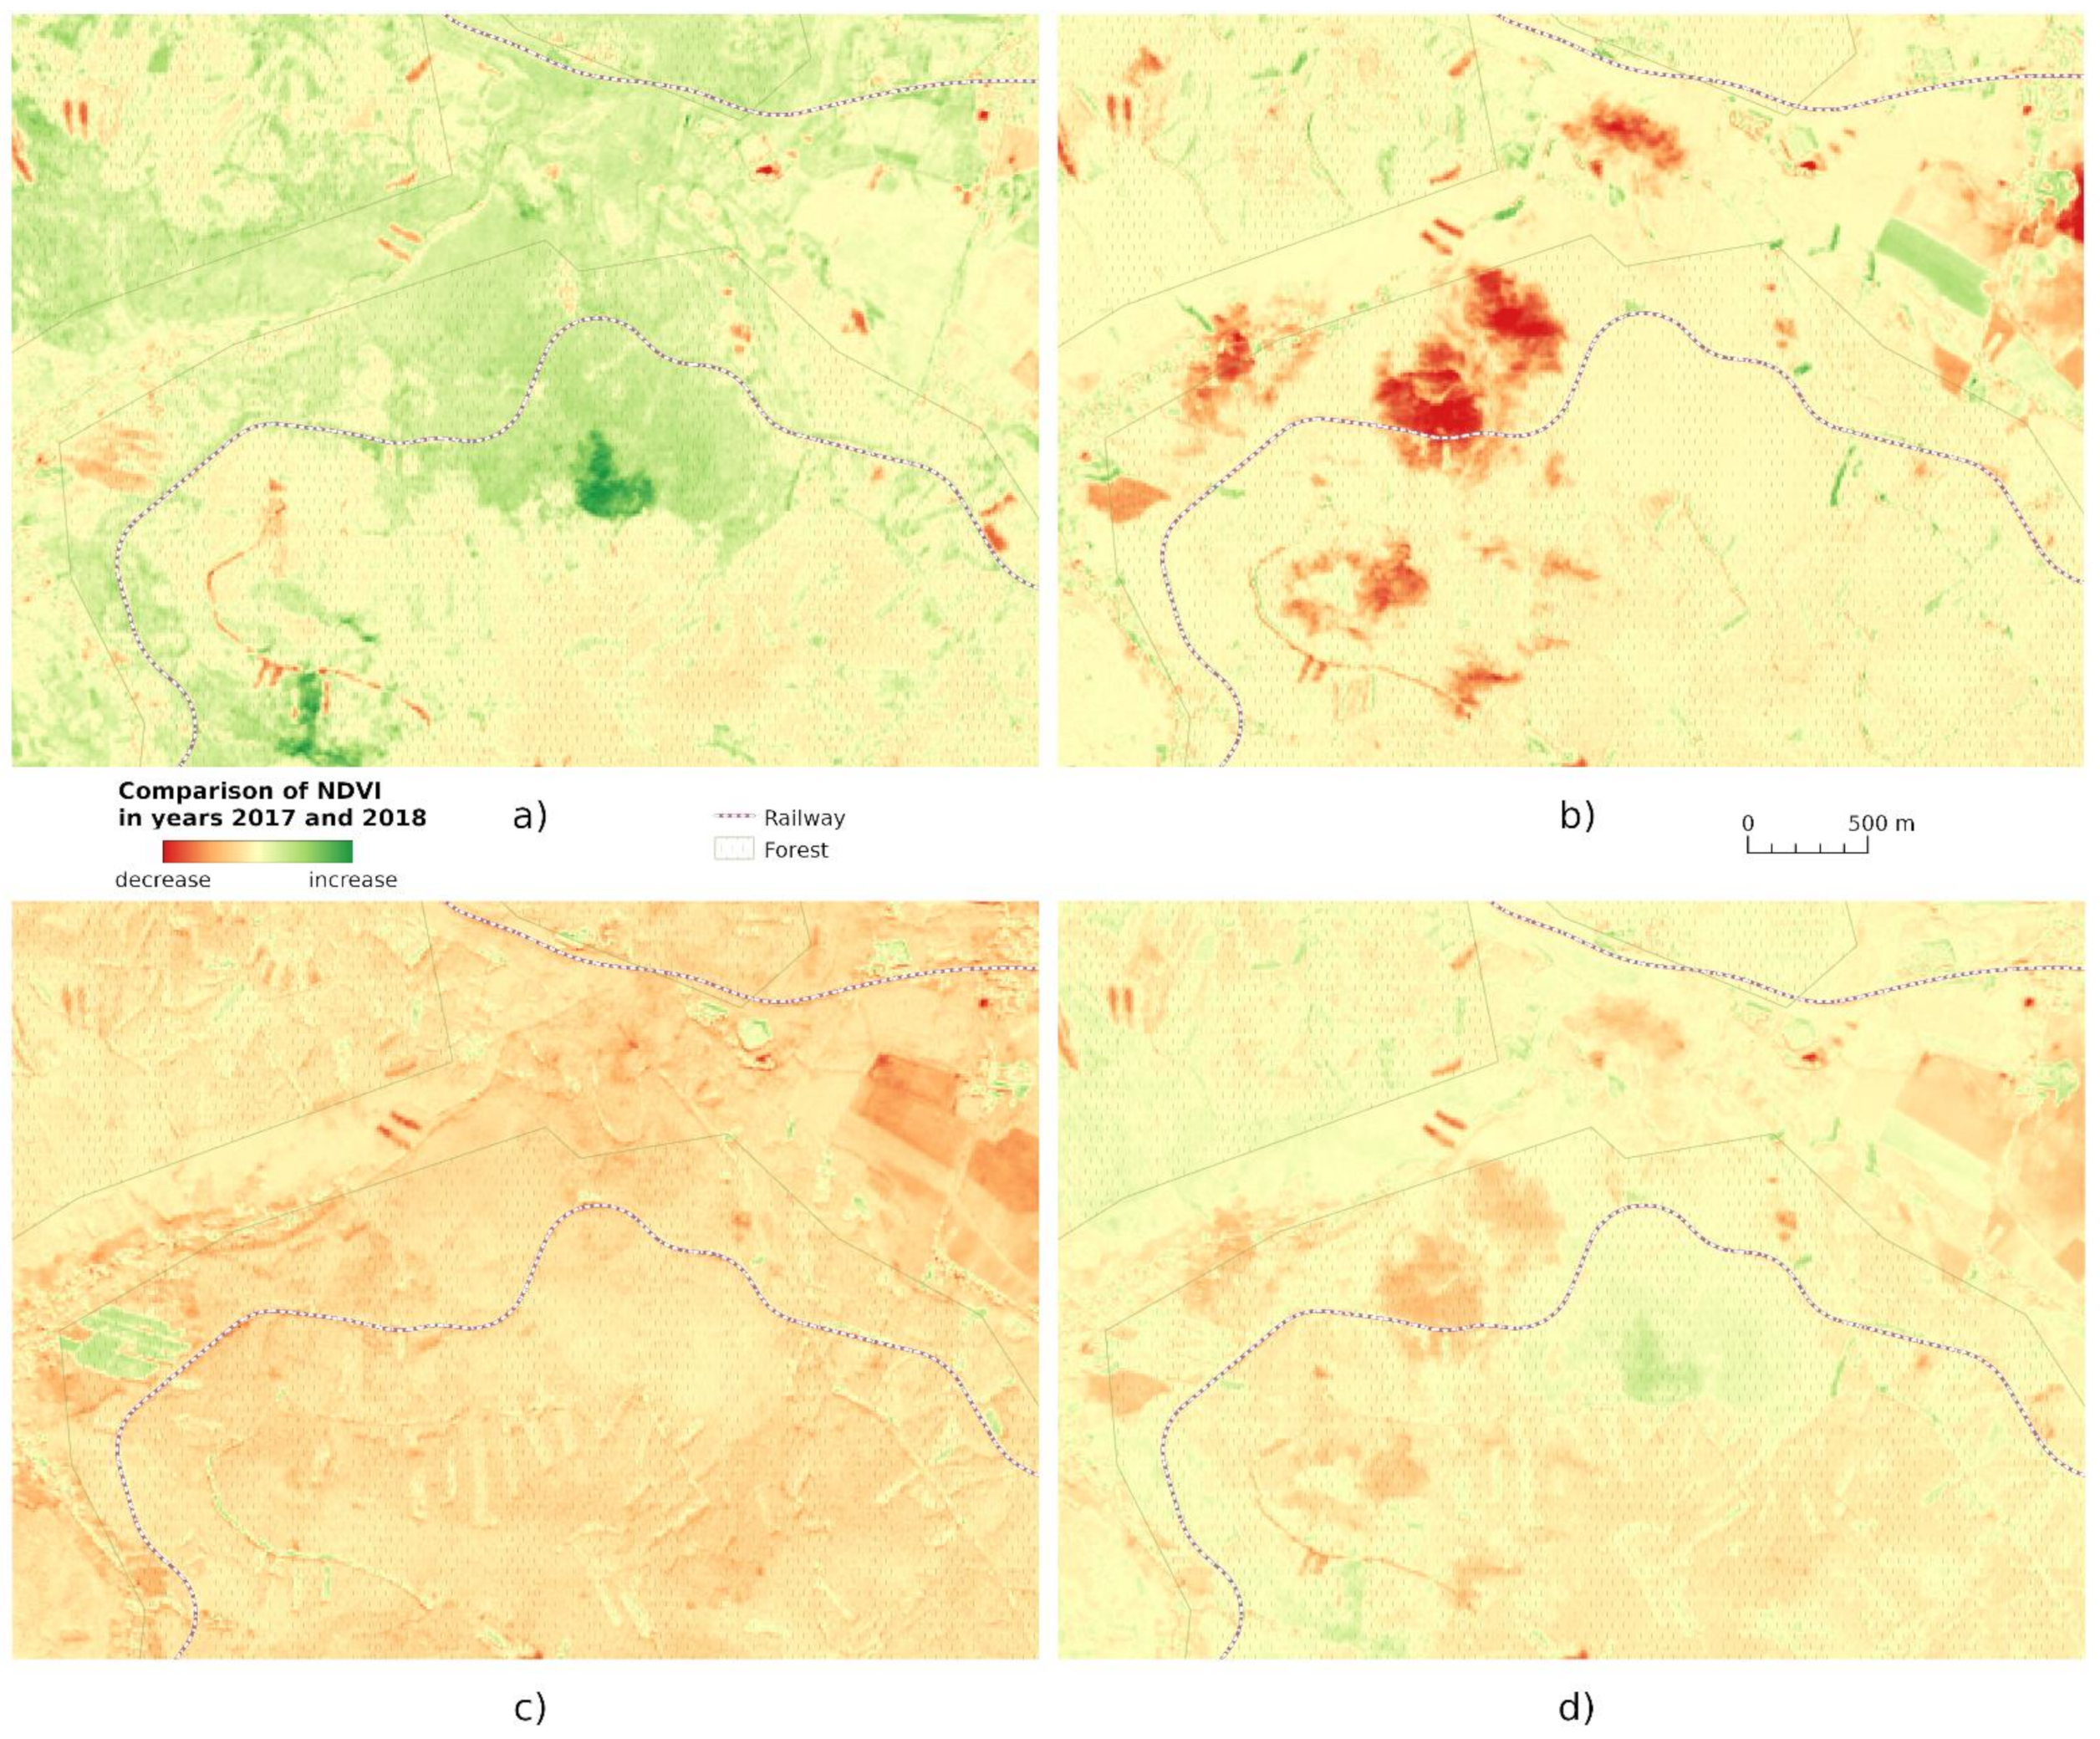
The masked areas which were not included in the calculation were also recorded. To obtain information about year-on-year development, we performed a raster operation in which the corresponding pixel value from the previous year, i.e., 2017, was subtracted from the pixel value for 2018. This calculation was repeated for the map pairs of three periods: spring (May), summer (June/July) and late summer/autumn (August/September). The change in index indicated the year-on-year development of the value for each of the three seasons. A comparison of the three extracts for the three periods is shown in Figure 10a–c. The punctual raster datum pairs are mentioned. The selection was based on finding corresponding rasters from the comparable period with minimal cloud cover.
An evaluation of the presented NDVI change in each period must take into account any associated precipitation. The long-term precipitation total for the period 1981 to 2010 in the Liberec Region is 890 mm. In 2017, this value reached 945 mm [44], indicating a slightly above-average year in precipitation. The following year, 2018, demonstrated a significant decline in precipitation, recording a total of 560 mm [44], i.e., 63% of the long-term precipitation average. Table 3 lists precipitation figures for 2017 and 2018 and the long-term precipitation normal N for that region.
In the year-on-year comparison of the NDVI index from May, the monitored area did not indicate significant negative areas, averages, or locations where the forest would show evidence of decline. On the contrary, a slight tendency towards an increase was evident (Figure 10a). The maximum increases in the index can be attributed to cloud cover that was not fully compensated for.
However, the second evaluated period from June to July indicated a significant negative development. In most areas, the index declined (Figure 10b). This may have been due to significantly less total precipitation, which reached 390 mm from the beginning of the year to July in 2017 and only 267 mm in 2018 (Table 3). Low cloud cover not fully masked created significantly negative values in some areas.
This negative development continued during the third monitored period of August and September (Figure 10c). The reason for this development may be due to the ongoing period of low precipitation, which caused a negative moisture balance in the landscape.
After calculation of the differences for the three periods, we determined the average change from the three indices for each pixel using Equation (2). Equation (2) expresses the average change in the NDVI. The average was always determined from pixels containing no cloud. An extract with average change is shown in Figure 10d.
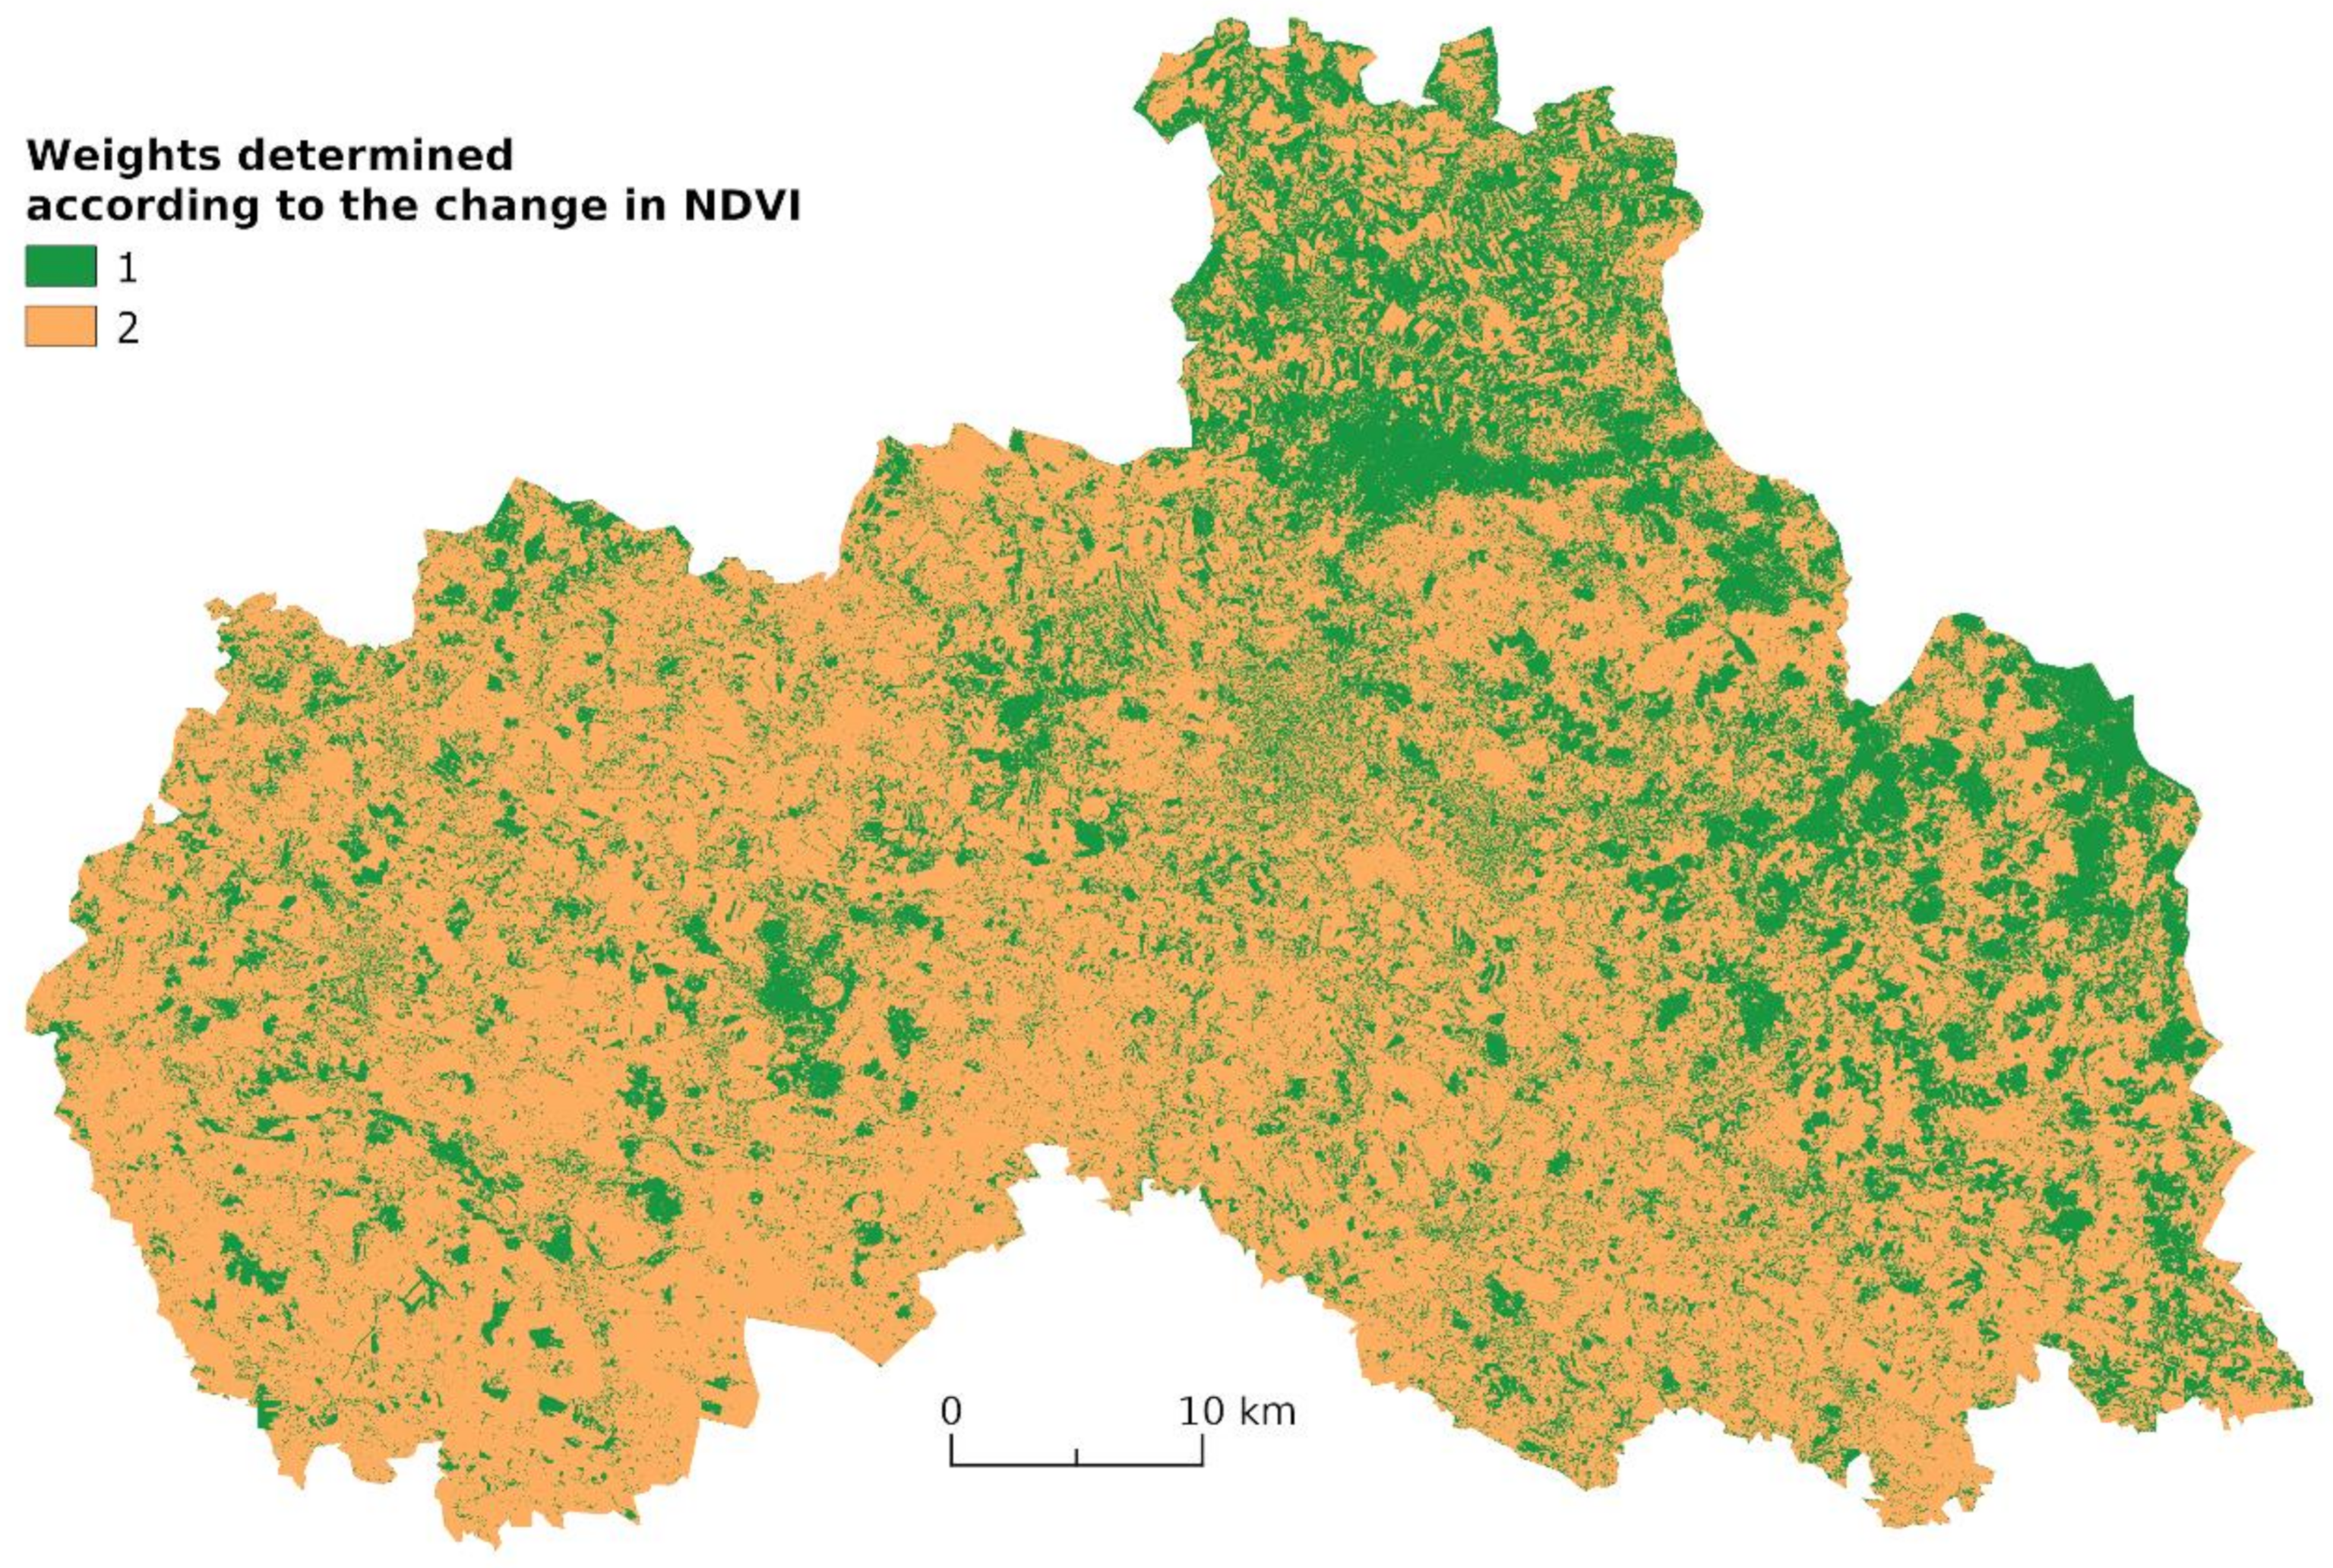
To express the change in the NDVI for the level of threat to the railway, the obtained average values of the differences in indices were allocated to two categories. The pixels in which the average value of change had positive values were assigned a value of 1. Pixels with average negative values were assigned a value of 2. A negative change in the index indicated a decline in the vegetation. As a result, areas with a value of 2 indicated a higher level of threat to the railway than areas with a value of 1. The resulting weight V (for vegetation health) is expressed in Equation (3). The value indicates the weight for subsequent processing.
where is average change of the NDVI over two years; n is number of image pairs;
k is year (e.g., 2017) and V is weight of change of the NDVI, which expresses the vegetation health.
After calculation of the average value of the difference in the NDVI index, we obtained a more objective result of the development in vegetation health over the evaluated periods by eliminating extraordinary short-term effects. Unfortunately, the effect of low cloud could not be completely removed.
Figure 11 depicts the resulting values for V, categorised according to the change in average NDVI between 2017 and 2018 in the Liberec Region. Nevertheless, it is clear that in most areas, it developed adversely, and we can state that the vegetation experienced degradation. This degradation was mainly caused by significantly less precipitation in 2018 than in the previous year.
The vegetation health assessed according to the NDVI index should be performed for longer periods, because a year with low total precipitation may be followed by a more moisture-intensive period and lead to regeneration and renewal of vegetation. However, a longer dry period may damage forest stands, mainly because of a reduction in its ability to resist pests. As a result, the threats from intense wind, snow cover and ice also increase.
4.4. Calculation of the Resulting Vegetation Threat Index
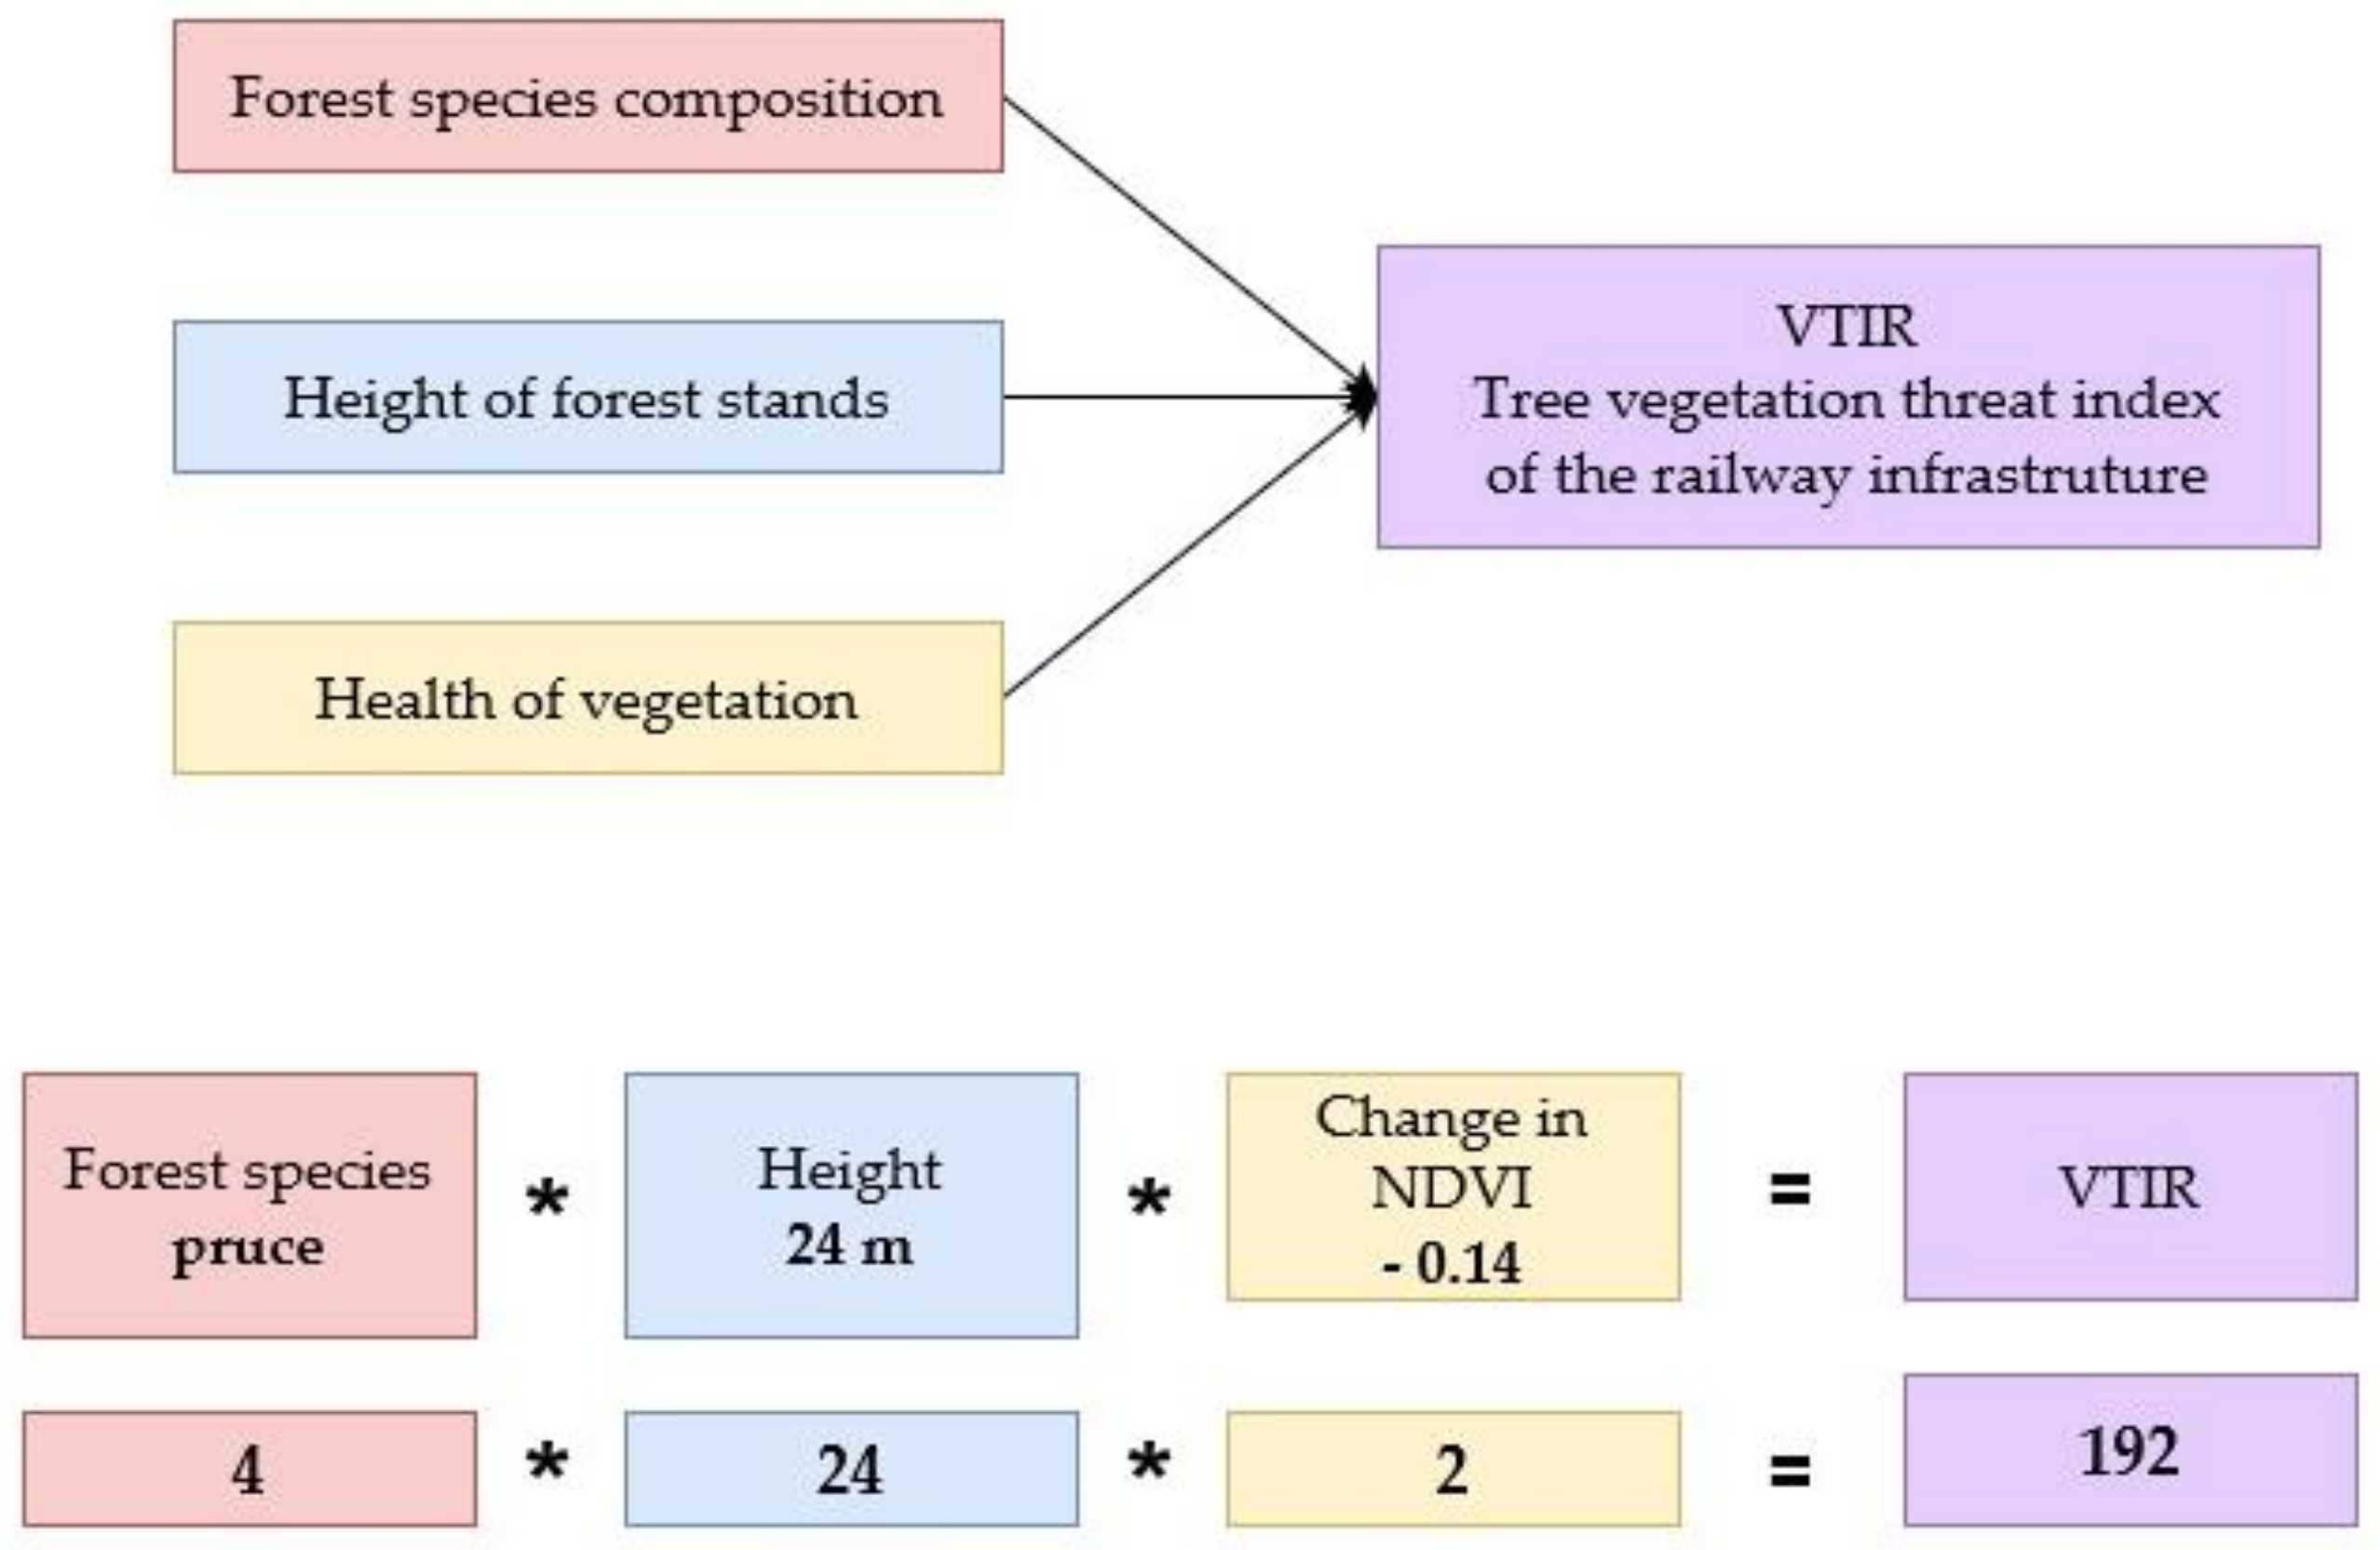
The resulting threat index of the railway infrastructure was calculated from the data compiled in the previously described steps. These were three raster layers with weights determined according to the species composition of vegetation, vegetation height and health (based on the change in NDVI). These three layers were multiplied together. Each pixel of the raster contained the resulting threat index which expressed the final level of threat. Higher values indicated a higher threat of falling trees.
The multiplication of layers and a concrete example for 24-metre-high spruce trees are shown in Figure 12. Equation (4) expresses the total value of threat from tree vegetation falling on railway tracks:
where S is weight of forest species composition; H is weight of tree stand height and V is weight of the change in NDVI—health of tree vegetation.
VTIR = S ∗ H ∗ V
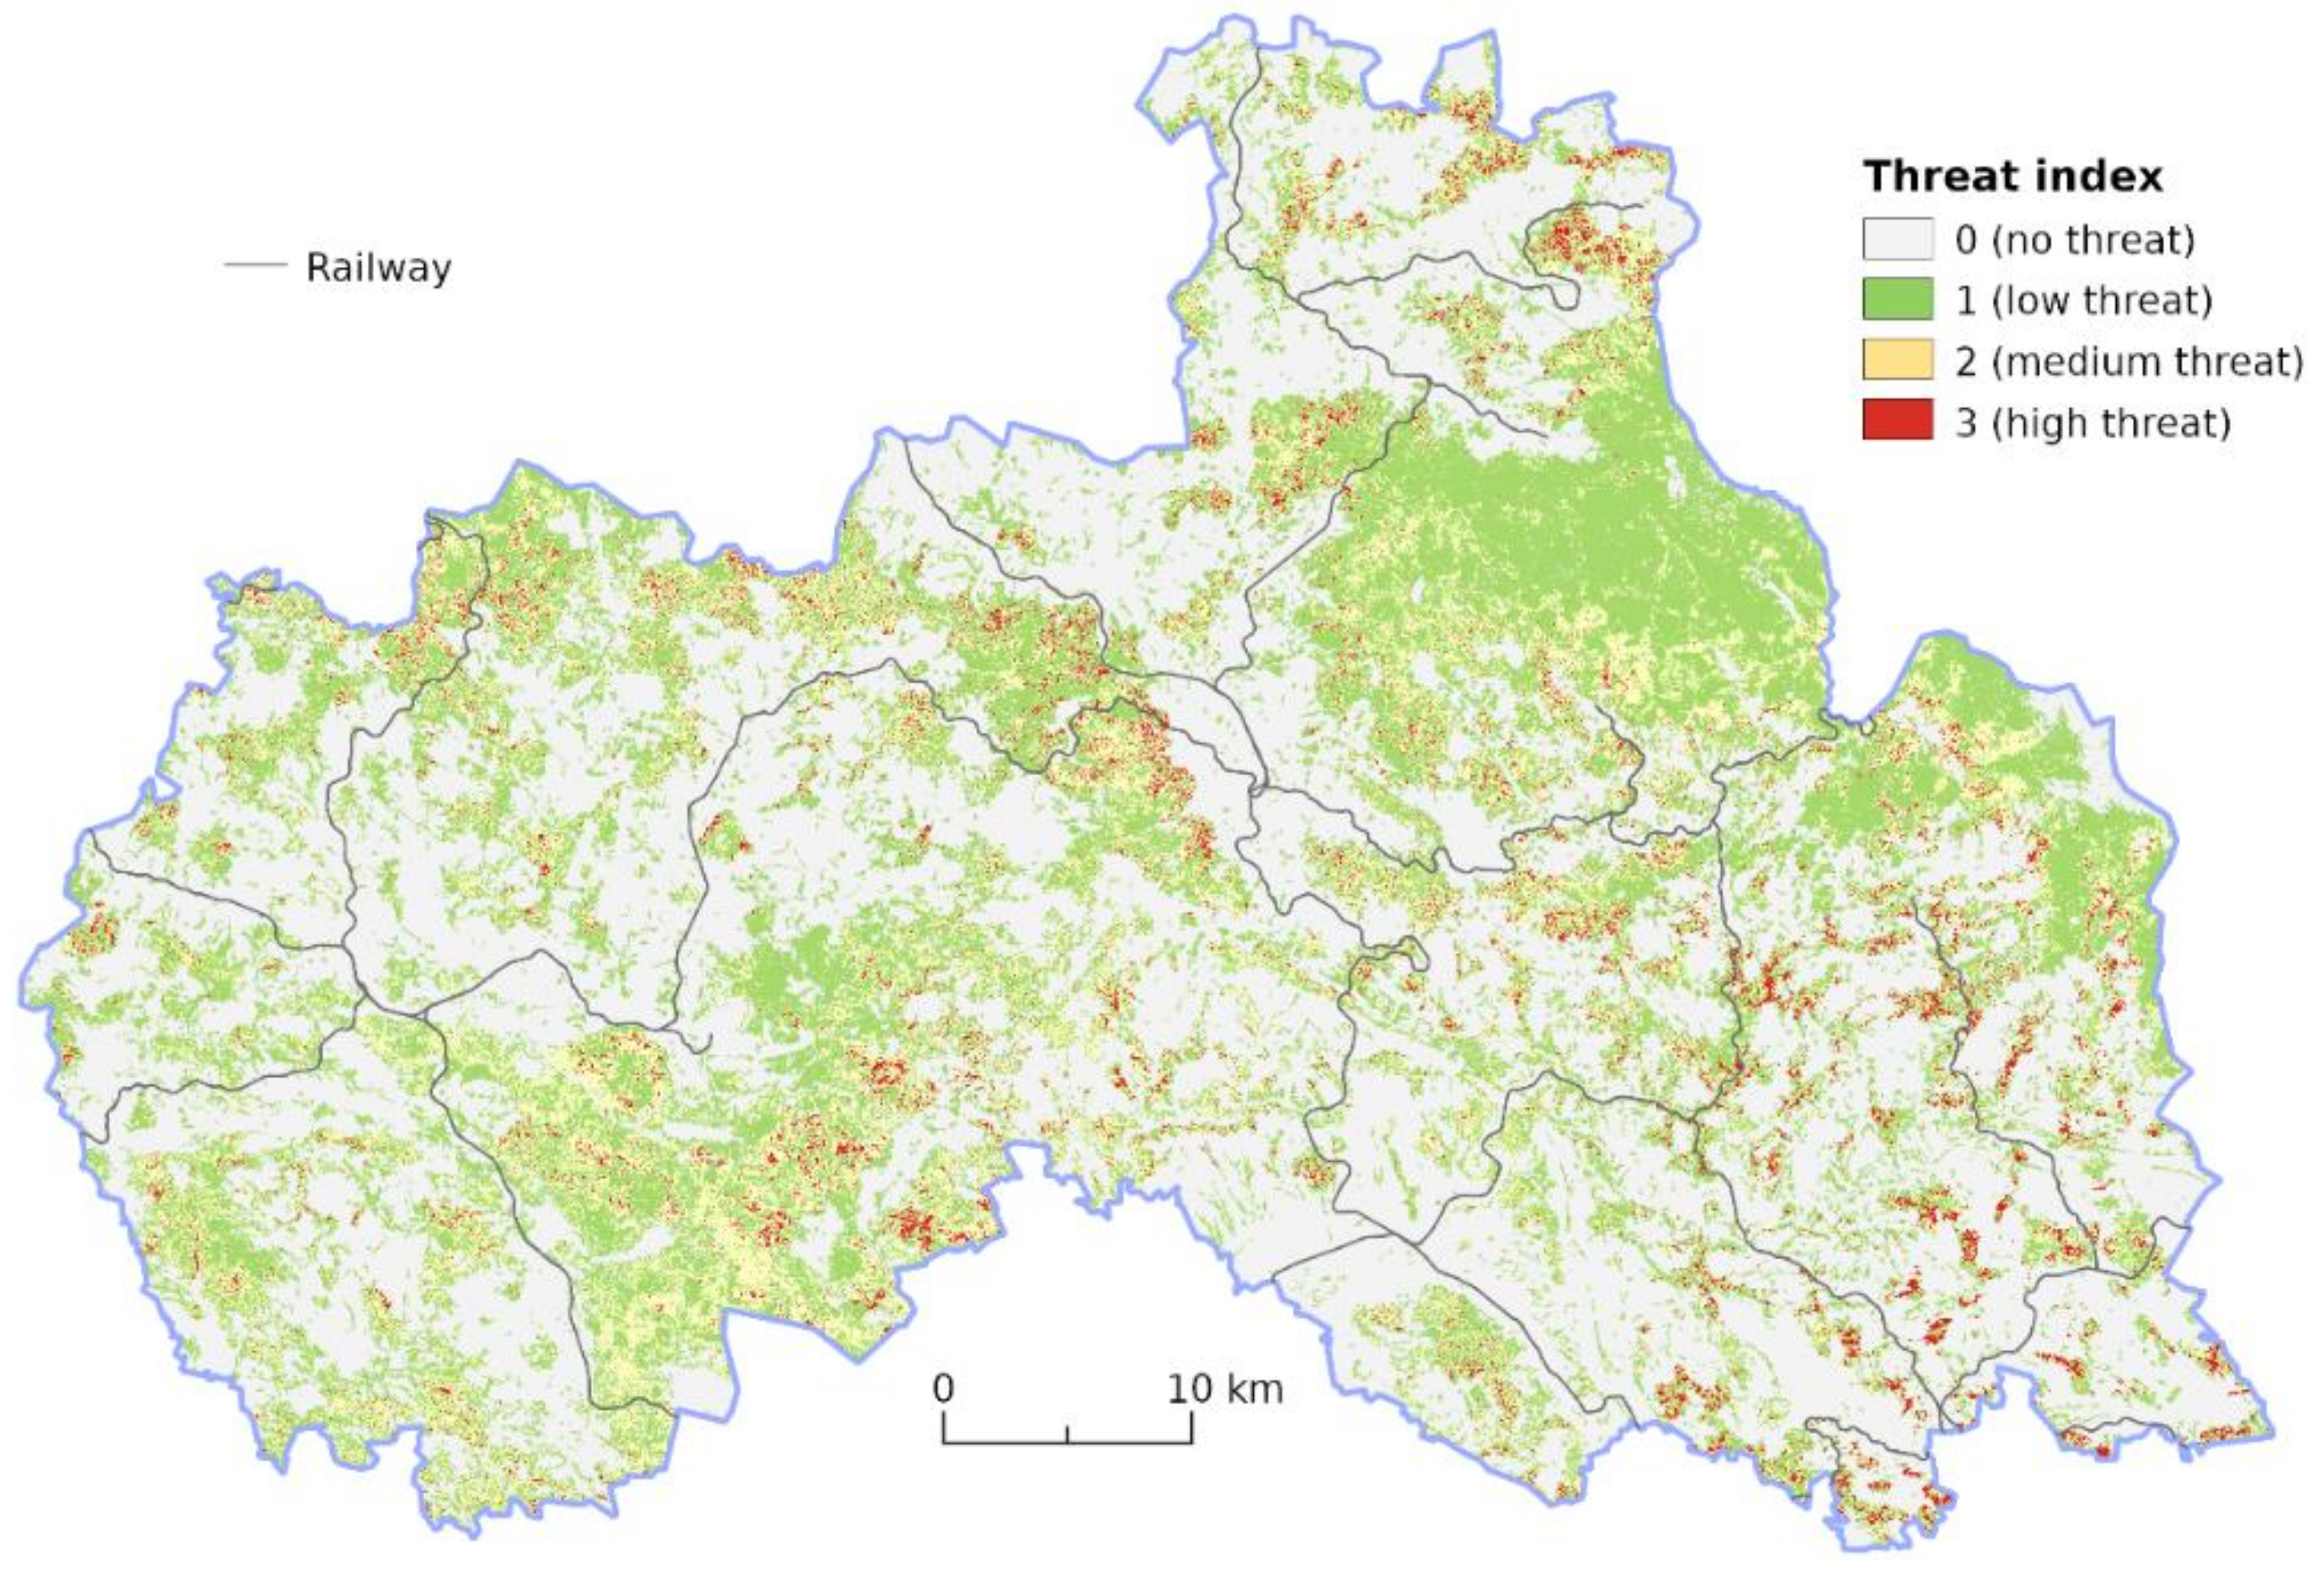
The resulting value of VTIR was calculated according to the presented method. To express the level of threat, the obtained total value was divided into four categories. A value of 0 was assigned to category 0, which indicates no threat from tree vegetation. Values in the interval 1–99 were assigned to category 1, which indicates a low level of threat. Values in the interval between 100–199 were assigned to category 2, which indicates a medium level of threat. Values greater than 200 were assigned to category 3, which indicates a high level of threat. The threat index was calculated for the entire Liberec Region (Figure 13).
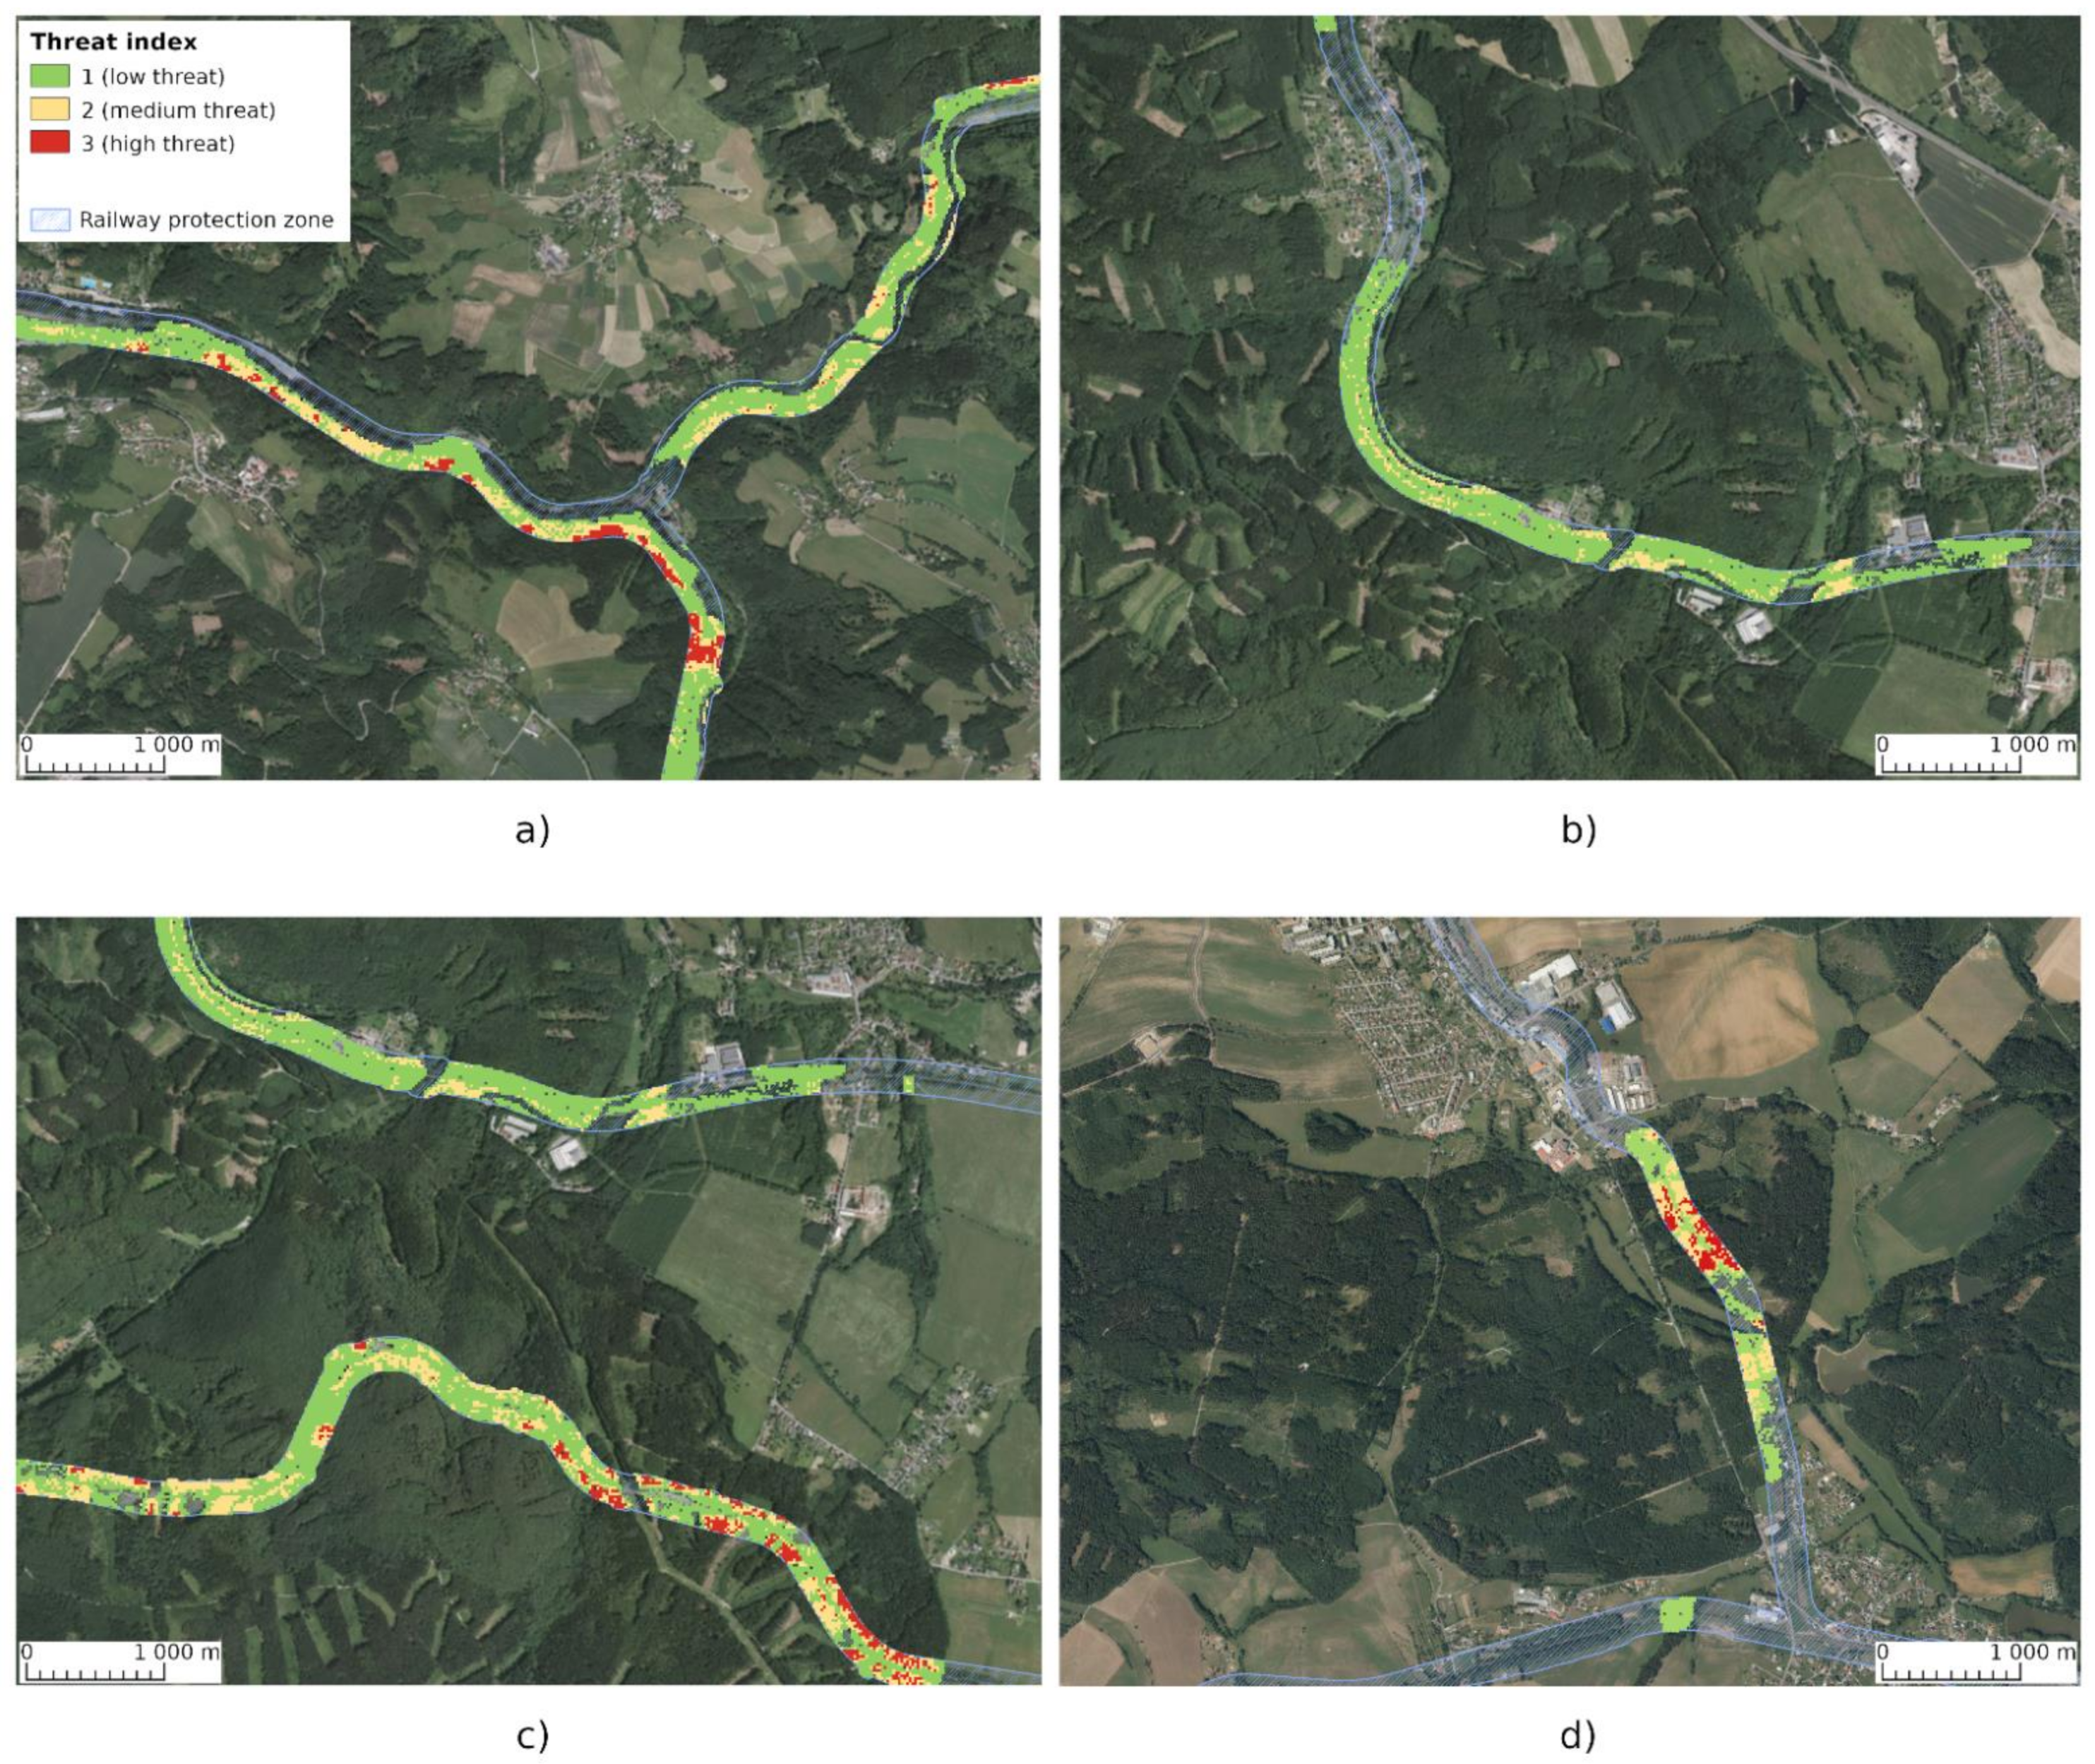
We analysed the surrounding 60-metre railway protection zone in more detail. A close examination of the maps with the VTIR values in the protected zone shows that the locations of greatest threat do not form large continuous areas, but small areas located outside the lower-threat areas. This detail may indicate gradually deteriorating conditions where vegetation is gradually expanding into the terrain (Figure 14).
Category 1, with the lowest level of threat, covers 21.8% of the protection zone. Its area is 1183 ha of a total 5411 ha. This area does not indicate a raised level of threat and it is therefore not necessary to discuss. The second, category 2 (medium threat), extends over 291 ha (5.3%). Ensuring regular monitoring in this area and pruning of woody plants and other possible measures are already recommended. The third, category 3 (high threat), represents the highest level of threat and extends over 49 ha (0.9%). If degradation caused by drought or other poor conditions continues, the area may experience a high level of emergencies. In these areas, clearing the railway protection zone, which would subsequently be restored by new vegetation, is highly recommended. The remaining area (72%) of the protection zone falls under category 0 and poses no threat. The area does not contain forest vegetation or consists only of stands with a weight of 0 in the species assessment (culture, pinus mugo, logging).
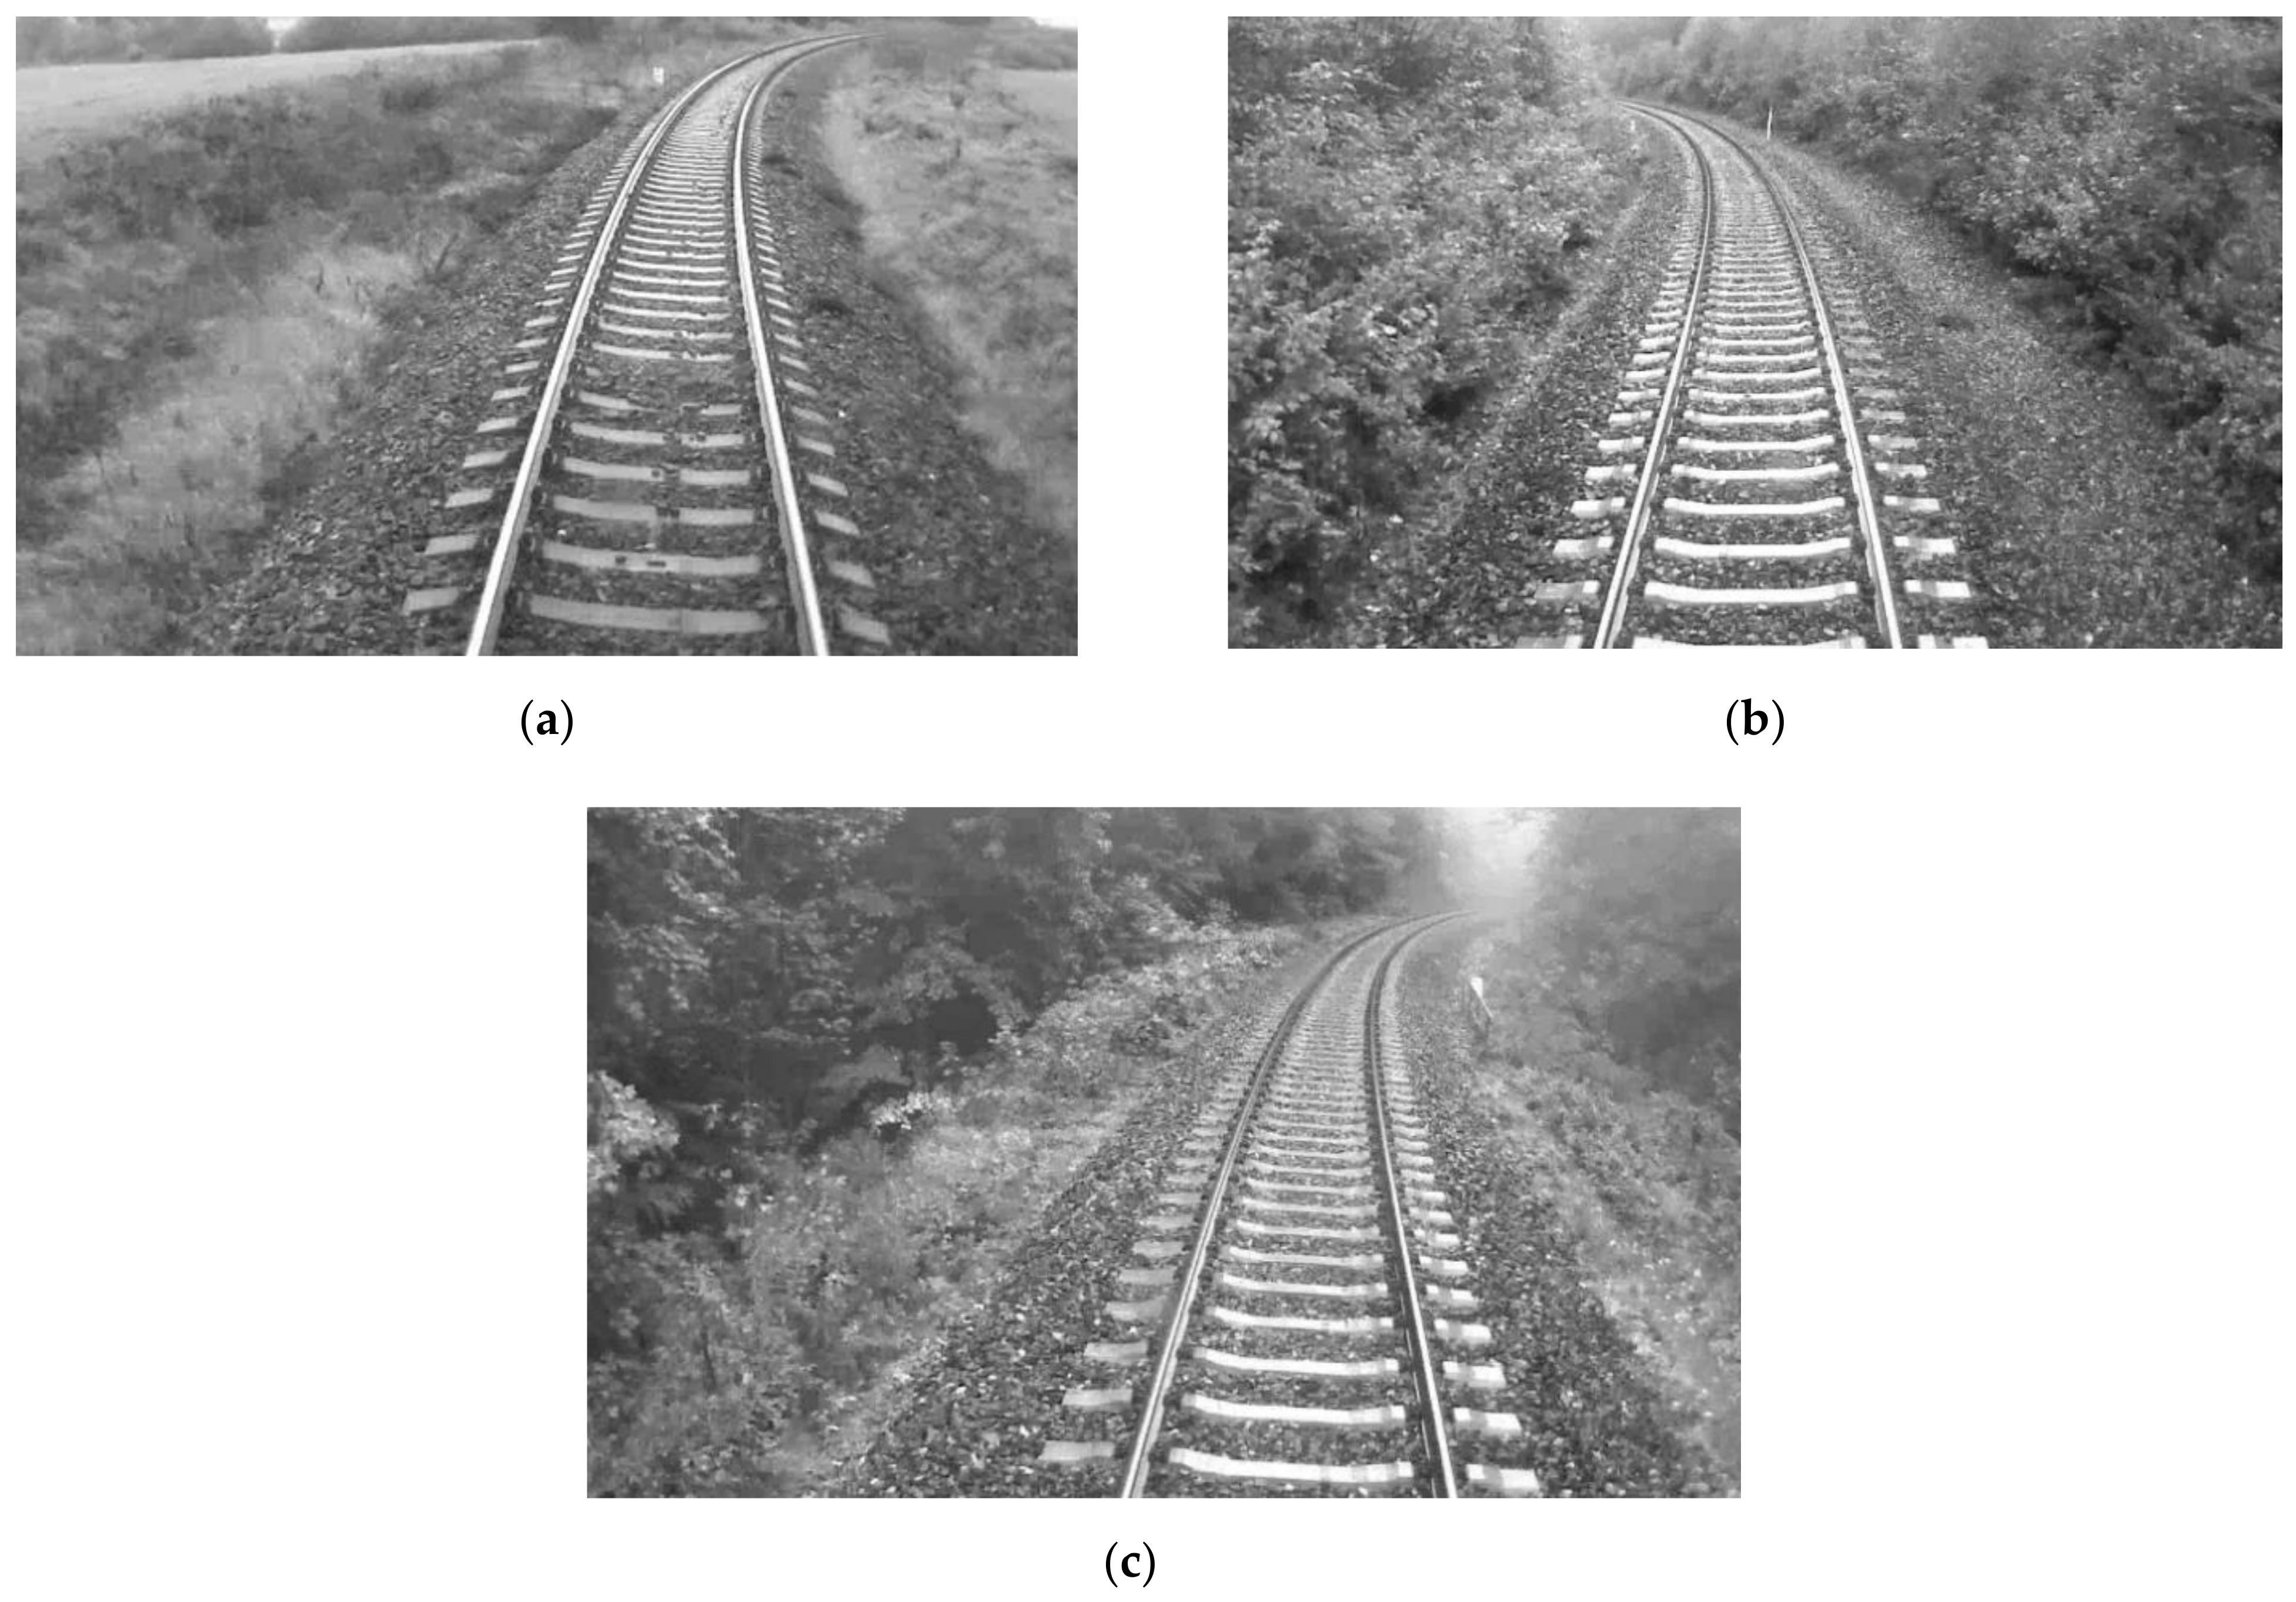
Figure 15 shows the real conditions around different railway tracks. A track with no surrounding vegetation is shown in Figure 15a. The track is not exposed to the threat of falling trees. However, self-growing trees can become a problem since strong winds put them at threat of falling onto tracks as a consequence of their unprotected position in the landscape. The track may also be closed during the winter.
A track with vegetation after intervention is shown in Figure 15b. It is evident that the mature vegetation was removed and has since started to regenerate naturally. Compared to the previous example, the threat level is higher, but to completely eliminate the threat of trees falling onto infrastructure, the protected zone is not in satisfactory condition. If no periodic maintenance is performed in this area, the threat level will increase.
Figure 15c shows a section of the track located in a high-threat area. It is evident that the vegetation is located very near the track and has achieved a significant level of growth. Vegetation forming a homogenous dense wall and consisting mainly of deciduous trees is an advantage that provides relatively high resistance to strong winds. In this example, however, the occurrence of woody plants could be considered a threat. Falling branches and, potentially, entire trees falling during extraordinary weather conditions are likely.
5. Discussion
The assessment of threat caused by adjacent tree vegetation is a seldom discussed topic in the Czech Republic and around the world. Some countries create railway protection zones without tree vegetation or only with trees of low height and therefore do not need to solve issues of identifying potential threat due to falling trees. Hoerbinger et al. concerns vegetation risk on railway used aerial laser scanning [35] in a relatively short line (27 km). The aerial laser scanning is more expensive but more precise in resulted detail. There is an opportunity to use video cameras, thermo-cameras and/or laser scanners mounted on commercial trains for integrating the information acquired from the satellites. These possibilities also need extra costs and organisation demands. Our presented method does not need any costs in the present. Moreover, it is possible to calculate the threat for the whole area in the Czech Republic. In addition, there is an opportunity to scan the track surroundings using a LiDAR only in areas that were identified by VTIR calculation. Subsequently, a precise definition of tree structures and the discovery of stand-alone trees would provide.
An evaluation of vegetation health was demonstrated with images produced by the Sentinel-2 satellite. An effort was made to remove the effect of clouds using correction layers, but a slight effect remains in NDVI calculation. The method could be improved in the future by extending the period which the evaluated images cover. Combining multiple sources and enhancing their compatibility using correction equations is also an option.
The individual weights of the monitored parameters were determined based on theoretical knowledge and proven analyses in forestry. It would be possible to slightly alter and correct the suggested weight values in follow-up research. Only total annual precipitation was analysed in the presented evaluation. Other meteorological conditions could be taken into account as effects on the health of tree vegetation. For long-term monitoring, other weather factors on plant growth could also be considered, including, for example, average temperatures or the number of sunlight hours.
The spatial resolution of the resulting threat layer is 10 m and depends on the resolution of the input data. Source data about forest species composition has a spatial resolution of 10 m, and data about the height of forest stands have a spatial resolution of 2 m recalculated to a resolution of 10 m with an average value of height. The Sentinel-2 data were resampled from 20 m to 10 m resolution to correspond to other data sources. As a result, individual trees which present a threat cannot be accurately identified. The results may be used as a tool to identify the general location of areas of threat and could be checked through more detailed scanning. The advantages of the proposed evaluation methodology are the use of freely available remote sensing data with a high frequency of updates and the evaluation of large areas without direct field investigation. Field investigation could be targeted to locations identified as containing potential threat. The data were obtained for the years 2017 and 2018. Accessing data from the FMI on species compositions and stand heights were limited, in contrast to Sentinel-2 data, which is freely available. If newer data becomes available, recalculating to obtain results for 2020 does not pose a problem.
Due to computational complexity, the study only focuses in detail on the territory of the Liberec Region. Our goal was to design and optimise the process of identifying the level of threat, which can be applied in any territory. The stand’s health status was determined according to the NDVI index, which is currently one of the most widely used. However, individual studies compare NDVI with the ground survey’s information and suggest other suitable indices. This work did not involve a ground investigation, and it was therefore not possible to evaluate the accuracy of the results with the actual conditions. Therefore, it would be appropriate to extend the study with field investigation, and if required, improve it based on the findings. We suppose that the field findings could correspond with results mainly with the finding of vegetation height and species composition because they are based on FMI data. In fact, more interesting is verification with real incidents. However, it is hard to explore the places where real falling trees appear immediately. Nevertheless, we are now closely connected with the Railway Administration in a stage of incidents, reporting and comparing our results in contemporary season.
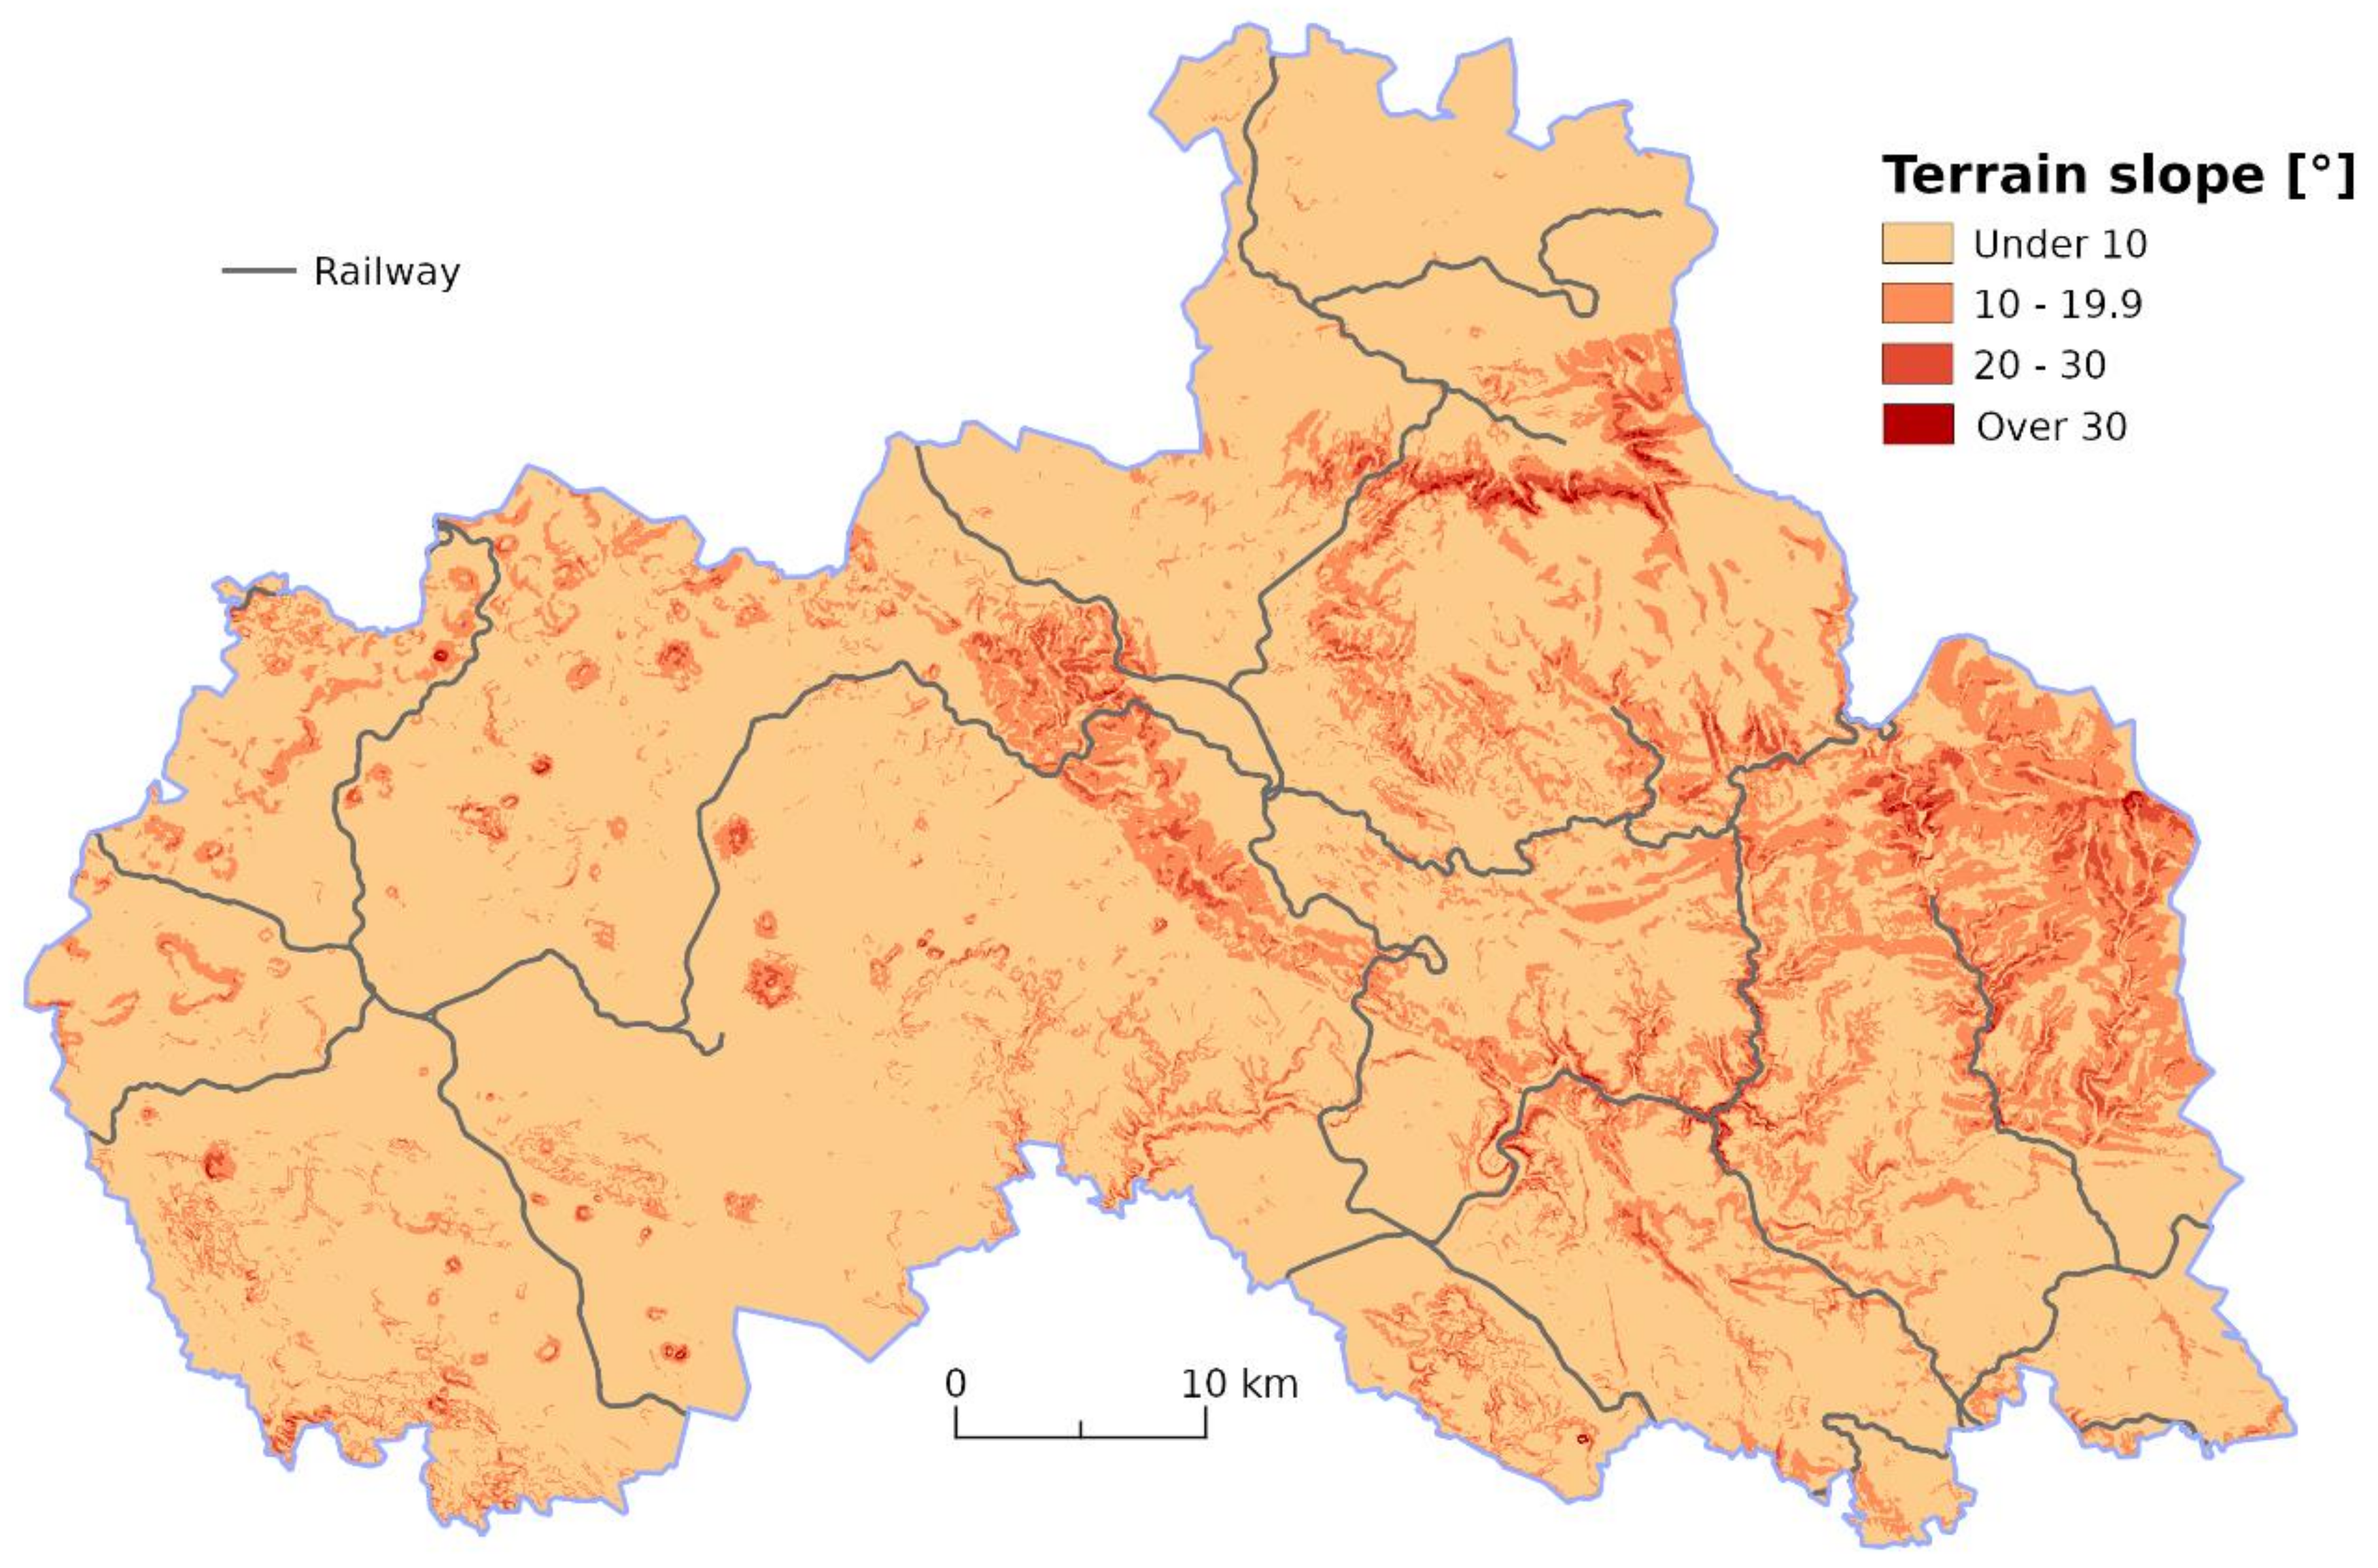
The proposed idea is to integrate the influence of the morphology of surrounding terrain, namely the slope of hillsides and embankments. The steep slopes increase the threat. Hoerbinger et al. defined five geometric categories: depressional to level (−10° to 10°), gently sloping (>10° to 20°), steeply sloping (>20° to 30°), very steeply sloping (>30° to 90°) and downward sloping (>−10° to −90°). Figure 16 shows the terrain slope in the Liberec Region. The calculation is based on free accessible data of the Digital geographical model of the territory of the Czech Republic (Data50)–Terrain relief [41]. The calculation of slope areas is presented in Table 4 for the protection zone in the Liberec Region. The steeply and very steeply sloping areas cover only 3.8% of protecting zone together. This small part could be affected by the influence of the slope. Nearly 80% of the area remains untouched by slope influence.
The presented VTIR uses the term threat. According to the definition, “The threat is a natural or man-made occurrence, individual, entity, or action that has or indicates the potential to harm life, information, operations, the environment and/or property.” [46] The term risk has another meaning and definition. “Risk is potential for an unwanted outcome resulting from an incident, event, or occurrence, as determined by its likelihood and the associated consequences.” [46]. Threat is a state in the general sense, and risk is the mathematical probability that damage will occur under certain defined conditions. The threat is the potential harm that can come to an asset (the thing you are trying to protect). Risk is the likelihood that the harm will be realised [47]. Therefore, the presented VTIR only indicate the potential of threat.
6. Conclusions
The study used several existing data sources from the field of forestry and remote sensing. We aimed to create a method for detecting the threat of falling adjacent tree vegetation on railway transport infrastructure. The result was a compound VTIR index. We designed a procedure that could be easily sustained and applied, with an emphasis on minimisation of potential costs. With this procedure, the threat level can be updated at regular intervals and respond to developments in the tree vegetation, and alerts can also be generated automatically. These alerts could be responded to within a short time and thereby increase railway transport safety.
Detection using satellite image data is intended primarily for the identification of threats arising from adjacent forest structures. These may currently be considered as areas with the greatest threat of potentially falling trees. In such situations, removal is more complicated due to the expected large number of damaged trees. Free-standing trees are also a threat as a result of their uncovered position in the landscape, although the probability of these types of a tree falling onto tracks is lower.
FMI data on the species composition in forest stands and average stand height were first adjusted. Based on existing studies, the threat to individual groups in the event of exceptional weather conditions was then calculated as specific weights.
The health of a forest stand is an important parameter that can significantly affect the resilience of tree vegetation. To determine this level of health, we evaluated Sentinel-2 satellite data and compiled the vegetation index (NDVI), which also took into account any significant changes in the amount of biomass indicating adverse tree development. The images were produced in 2017 and 2018 during the same phenological phases. The development trend was determined from these data. In most areas, a decrease in the index corresponding to forest deterioration was recorded. A comparison of the total precipitation revealed a sharp decrease from one year to the next, and it can be assumed that the decline in rainfall was cause of the decrease in the vegetation index.
The overall threat of VTIR was classified according to values assigned to four different categories: no threat plus low threat, which have no significant probability of the occurrence of emergencies; medium threat, which requires regular monitoring and high threat, which carries a significant assumption of damage to railway tracks. In areas with a high degree of threat, countermeasures such as the removal and replacement of tall trees should already be in place. This would help stabilise the landscape surrounding the railway track and reduce the noise pollution into the immediate area.
We selected the Liberec Region for the case study. The lowest threat was recorded for 1183 ha of the protection zone, which is 21.8% of the zone’s total area. A medium level was identified for 291 ha (5.3%) and a high level of 49 ha (0.9%). The remainder of the area did not have forest cover. The results reflect only the threats posed by forest vegetation; they do not reflect free-standing trees or small clusters of trees potentially falling. This was not the study’s primary aim, and the current nature of the data we used is not suitable for this purpose.
The main advantages of this research include the use of currently existing data sources to increase railway operation safety. We aim to automate the entire process and thereby provide the Railway Administration of the Czech Republic with a tool for detecting threats and producing potential measures. We did not assess the health of vegetation near railway tracks on a national scale since ground investigation is a costly and time-consuming process. However, periodic imaging with the Sentinel-2 system allows the possibility of regular nationwide evaluation.
Author Contributions
Conceptualisation Michal Kučera; methodology, Michal Kučera; investigation, Michal Kučera; resources, Michal Kučera and Zdena Dobesova; data curation Michal Kučera; writing—original draft preparation Michal Kučera and Zdena Dobesova; writing—review and editing Zdena Dobesova; visualisation Michal Kucera; supervision Zdena Dobesova; project administration Zdena Dobesova; funding acquisition, Zdena Dobesova All authors have read and agreed to the published version of the manuscript.
Funding
This paper was created within the project “Application of geospatial technologies for spatial analysis, modelling, and visualisation of spatial phenomena” (IGA_PrF_2021_020) with the support of the Internal Grant Agency of Palacký University Olomouc).
Acknowledgments
Thanks for the scientific support and consultation provided by Ján Feranec from the Slovak Academy of Sciences and Radek Barvíř for cartography support.
Conflicts of Interest
The authors declare no conflict of interest.
References
- Czech Republic Act No. 266/1994 Coll., Railways Act, 1994. In Collection of Laws of the Czech Republic; Amount 79; 1994; Available online: https://www.updi.cz/images/Documents/Applicable_national_legislation/Act_266-1994_Coll-on_Rail_Systems.pdf (accessed on 22 March 2021).
- Czech Republic Act No. 181/2006 Coll., Act amending Act No. 266/1994 Coll., On railways, as amended, and Act No. 200/1990 Coll., On misdemeanours, as amended. In Collection of Laws of the Czech Republic; 2006; Available online: https://www.updi.cz/images/Documents/Applicable_national_legislation/Act_266-1994_Coll-on_Rail_Systems.pdf (accessed on 22 March 2021).
- Railway Administration. For the Media. Railway Administration Proceeds with Cut down of Vegetation in Accordance with valid Laws. Available online: www.spravazeleznic.cz/pro-media/tiskovy-servis-tiskove-zpravy-prohlaseni/kaceni-stromu-kolem-trati (accessed on 26 January 2021).
- Klockner, K.; Toft, Y. Railway accidents and incidents: Complex socio-technical system accident modelling comes of age. Saf. Sci. 2018, 110, 59–66. [Google Scholar] [CrossRef]
- Koks, E.E.; Rozenberg, J.; Zorn, C.; Tariverdi, M.; Vousdoukas, M.; Fraser, S.A.; Hall, J.W.; Hallegatte, S. A global multi-hazard risk analysis of road and railway infrastructure assets. Nat. Commun. 2019, 10, 2677. [Google Scholar] [CrossRef] [PubMed] [Green Version]
- UIC. Vegetation Control and Use of Herbicides. Available online: https://uic.org/projects/vegetation-control-and-use-of-herbicides-348 (accessed on 13 April 2021).
- UIC. TRISTRAM Transition Strategy on Vegetation Management. Available online: https://uic.org/projects/article/tristram (accessed on 12 April 2021).
- Bednář, P.; Petr, V.; Kantor, P. Problems of Secondary Spruce Monocultures and Possibilities of Their Reconstruction by Forest Beech; Faculty of Forestry and Wood Technology, Mendel Univerzity: Brno, Czech Republic, 2012. [Google Scholar]
- Vicena, I. Current State of Forest Protection Against Breakage; Forestry Work Publisher: Kostelec nad Černými lesy, Czech Republic, 2006. [Google Scholar]
- Snepsts, G.; Kitenberga, M.; Elferts, D.; Donis, J.; Jansons, A. Stem Damage Modifies the Impact of Wind on Norway Spruces. Forests 2020, 11, 463. [Google Scholar] [CrossRef] [Green Version]
- Tavankar, F.; Lo Monaco, A.; Nikooy, M.; Venanzi, R.; Bonyad, A.; Picchio, R. Snow damages on trees of an uneven age in mixed broadleaf forests: Effects of topographical conditions and tree characteristics. J. For. Res. 2019, 30, 1383–1394. [Google Scholar] [CrossRef]
- Chen, L.; Zhang, D.; Li, P.; Lv, P. Change Detection of Remote Sensing Images Based on Attention Mechanism. Comput. Intell. Neurosci. 2020, 2020, 6430627. [Google Scholar] [CrossRef]
- Novo, A.; González-Jorge, H.; Martínez-Sánchez, J.; González-de Santos, L.M.; Lorenzo, H. Automatic detection of forest-road distances to improve clearing operation in road management. Int. Arch. Photogramm. Remote Sens. Spat. Inf. Sci. 2019, XLII-2/W13, 1083–1088. [Google Scholar] [CrossRef] [Green Version]
- McEachran, Z.P.; Slesak, R.A.; Karwan, D.L. From skid trails to landscapes: Vegetation is the dominant factor influencing erosion after forest harvest in a low relief glaciated landscape. For. Ecol. Manag. 2018, 430, 299–311. [Google Scholar] [CrossRef]
- Schäffer, B.; Brink, M.; Schlatter, F.; Vienneau, D.; Wunderli, J.M. Residential green is associated with reduced annoyance to road traffic and railway noise but increased annoyance to aircraft noise exposure. Environ. Int. 2020, 143, 105885. [Google Scholar] [CrossRef]
- Hosseini, S.A.O.; Zandi, S.; Fallah, A.; Nasiri, M. Effects of geometric design of forest road and roadside vegetation on traffic noise reduction. J. For. Res. 2016, 27, 463–468. [Google Scholar] [CrossRef]
- Gellatley, M.J.; McGinnity, B.T.; Barker, D.H.; Rankin, W.J. Interaction of vegetation with the LUL surface railway sytem. In Vegetation and Slopes: Stabilisation, Protection and Ecology, In Proceedings of the International Conference Held at The University Museum, Oxford, UK, 29–30 September 1994; Thomas Telford Limited: London, UK, 1995; pp. 60–71. [Google Scholar] [CrossRef]
- National House Building Council. NHBC Standards. In 4.2 Building Near Trees; 2021; Available online: https://nhbc-standards.co.uk/4-foundations/4-2-building-near-trees/ (accessed on 11 January 2021).
- Davies, H.; Image, M.; Calrow, L.; Ffoulkes, C.; Frandsen, M.; Duignan, M. Review of Literature—How Transport’s Soft Estate Has Enhanced Green Infrastructure, Ecosystem Services, and Transport Resilience in the EU, Natural England Commisioned Report Number NECR 169; Natural England: London, UK, 2014. [Google Scholar]
- Chase, C.W.; Kimsey, M.J.; Shaw, T.M.; Coleman, M.D. The response of light, water, and nutrient availability to pre-commercial thinning in dry inland Douglas-fir forests. For. Ecol. Manag. 2016, 363, 98–109. [Google Scholar] [CrossRef]
- Loehle, C.; Idso, C.; Bently Wigley, T. Physiological and ecological factors influencing recent trends in United States forest health responses to climate change. For. Ecol. Manag. 2016, 363, 179–189. [Google Scholar] [CrossRef]
- Dagnachew, M.; Kebede, A.; Moges, A.; Abebe, A. Effects of Climate Variability on Normalized Difference Vegetation Index (NDVI) in the Gojeb River Catchment, Omo-Gibe Basin, Ethiopia. Adv. Meteorol. 2020, 2020, 8263246. [Google Scholar] [CrossRef]
- Kundu, A.; Denis, D.; Patel, N.; Dutta, D. A Geo-spatial study for analysing temporal responses of NDVI to rainfall. Singap. J. Trop. Geogr. 2018, 39, 107–116. [Google Scholar] [CrossRef]
- Aklilu Tesfaye, A.; Gessesse Awoke, B. Evaluation of the saturation property of vegetation indices derived from sentinel-2 in mixed crop-forest ecosystem. Spat. Inf. Res. 2020. [Google Scholar] [CrossRef]
- Goodarzi, M.; Pourhashemi, M.; Azizi, Z. Investigation on Zagros forests cover changes under the recent droughts using satellite imagery. J. For. Sci. 2019, 65, 9–17. [Google Scholar] [CrossRef] [Green Version]
- Wittke, S.; Yu, X.; Karjalainen, M.; Hyyppä, J.; Puttonen, E. Comparison of two-dimensional multitemporal Sentinel-2 data with three-dimensional remote sensing data sources for forest inventory parameter estimation over a boreal forest. Int. J. Appl. Earth Obs. Geoinf. 2019, 76, 167–178. [Google Scholar] [CrossRef]
- Mirijovský, J.; Brus, J.; Pechanec, V. Utilization of a small-format aerial photography from drone pixy in the evaluation of landscape changes. Surv. Geol. Min. Ecol. Manag. (SGEM) 2011, 2, 345–352. [Google Scholar]
- Dobrovolný, P. Vegetation Mapping Using Satellite Imagery: Main Features Spectral Behavior of Vegetation; Faculty of Science, Masaryk Univerzity: Brno, Czech Republic, 2001. [Google Scholar]
- Pour, T.; Miřijovský, J.; Purket, T. Airborne thermal remote sensing: The case of the city of Olomouc, Czech Republic. Eur. J. Remote Sens. 2019, 52, 209–218. [Google Scholar] [CrossRef]
- Cortés-Ramos, J.; Farfán, L.M.; Herrera-Cervantes, H. Assessment of tropical cyclone damage on dry forests using multispectral remote sensing: The case of Baja California Sur, Mexico. J. Arid Environ. 2020, 178, 104171. [Google Scholar] [CrossRef]
- Nazarova, T.; Martin, P.; Giuliani, G. Monitoring Vegetation Change in the Presence of High Cloud Cover with Sentinel-2 in a Lowland Tropical Forest Region in Brazil. Remote Sens. 2020, 12, 1829. [Google Scholar] [CrossRef]
- Hengkai, L.; Feng, X.; Qin, L. Remote sensing monitoring of land damage and restoration in rare earth mining areas in 6 counties in southern Jiangxi based on multisource sequential images. J. Environ. Manag. 2020, 267, 110653. [Google Scholar] [CrossRef]
- Lukeš, P.; Strejček, R.; Křístek, Š.; Mlčoušek, M. Forest Health Assessment in the Czech Republic Using Sentinel-2 Satellite Data; Forest Management Institute Brandýs nad: Labem, Czech Republic, 2018; p. 68. [Google Scholar]
- Minařík, R.; Langhammer, J. Use of a multispectral UAV photogrammetry for detection and tracking of forest disturbance dynamics. Int. Arch. Photogramm. Remote Sens. Spat. Inf. Sci. 2016, XLI-B8, 711–718. [Google Scholar] [CrossRef]
- Hoerbinger, S.; Obriejetan, M.; Rauch, H.P.; Immitzer, M. Assessment of safety-relevant woody vegetation structures along railway corridors. Ecol. Eng. 2020, 158, 106048. [Google Scholar] [CrossRef]
- Hoerbinger, S.; Immitzer, M.; Obriejetan, M.; Rauch, H.P. GIS-based assessment of ecosystem service demand concerning green infrastructure line-side vegetation. Ecol. Eng. 2018, 121, 114–123. [Google Scholar] [CrossRef]
- FMI. Composition of Tree Species in 2016–2017; Forest Management Institute: Frýdek-Místek, Czech Republic, 2017. [Google Scholar]
- FMI. Altitude Structure of the Stand Segments; Forest Management Institute: Frýdek-Místek, Czech Republic, 2017. [Google Scholar]
- Railway Administration. Railway Infrastructure Data; Railway Administration: Prague, Czech Republic, 2019. [Google Scholar]
- ESA. Sentinel-2. Available online: https://sentinel.esa.int/web/sentinel/missions/sentinel-2 (accessed on 2 September 2020).
- ČÚZK. Data50; State Administration of Land Surveying: Prague, Czech Republic, 2021. [Google Scholar]
- Czech Statistical Office. Public Database. Available online: https://vdb.czso.cz/vdbvo2/ (accessed on 11 January 2021).
- ESA. Copernicus Open Access Hub. Available online: https://scihub.copernicus.eu (accessed on 15 January 2021).
- Czech Hydrometeorological Institute. Historical Data. Territorial Precipitations. Available online: http://portal.chmi.cz/historicka-data/pocasi/uzemni-srazky (accessed on 10 October 2020).
- Railway Administration. Photobank of Monitoring Railway Infrastructure; RailwayAdministration: Prague, Czech Republic, 2020. [Google Scholar]
- Jamison, R.D. DHS Risk Lexicon; U.S. Department of Homeland Security, Risk Steering Commitie, Office of Risk Management and Analysis: Washington, DC, USA; CreateSpace Independent Publishing Platform: Scotts Valley, CA, USA, 2008; p. 60.
- Ami, T. Protection Circle. Threats and Risks. Available online: https://protectioncircle.org/2017/01/27/threats-and-risks/ (accessed on 12 February 2021).
Figure 1.
The influence of stand age on the probability of wind damage. The grey area represents the ±95% credibility interval [10].
Figure 1.
The influence of stand age on the probability of wind damage. The grey area represents the ±95% credibility interval [10].

Figure 2.
Vegetation points along roads in categories according to height (at a distance of more than 5 m from the road) [13].
Figure 2.
Vegetation points along roads in categories according to height (at a distance of more than 5 m from the road) [13].

Figure 3.
Example of classifications according to forest species composition.

Figure 4.
Example of average forest tree stand heights.

Figure 5.
Example of railway line vector data in a true-color satellite image.

Figure 6.
Extraordinary railway events in the Liberec Region caused by fallen trees in 2016–2018.

Figure 7.
Location of the Liberec Region in the Czech Republic.

Figure 8.
Raster with weights for the Liberec Region after reclassification of species composition.

Figure 9.
Raster with weights according to the average height of forest stands for Liberec Region in the period 2016–2017.
Figure 9.
Raster with weights according to the average height of forest stands for Liberec Region in the period 2016–2017.

Figure 10.
NDVI index changes in three periods and final average change: (a) difference between 11 May 2017 and 6 May 2018; (b) difference between 20 June 2017 and 3 July 2018; (c) difference between 29 August 2017 and 18 September 2018 and (d) average value of difference calculated from three periods depicted in (a–c).

Figure 11.
Raster with the resulting weight V according to the change in NDVI from 2017 to 2018 for the Liberec Region.
Figure 11.
Raster with the resulting weight V according to the change in NDVI from 2017 to 2018 for the Liberec Region.

Figure 12.
Example of calculation of the vegetation threat index for one pixel.

Figure 13.
Threat indices (VTIR) for the entire Liberec Region.

Figure 14.
Detailed extracts of four protected areas and their threat indices: (a) protected zone with continuous areas of high threat 3 in red; (b) protected zone with a prevailing index of 1—low threat in green and minor areas of category 2 in yellow; (c) protected zones with many isolated areas of high threat in the southern area and (d) protected zone near settlements.

Figure 15.
Examples of the railway with various levels of threat: (a) low level; (b) medium level and (c) high level [45].
Figure 15.
Examples of the railway with various levels of threat: (a) low level; (b) medium level and (c) high level [45].

Figure 16.
Terrain slope in Liberec Region.


| Characteristic | Value |
|---|---|
| Area of the region | 3163 km2 |
| Area and portion of wooded area | 1409 km2 (44.5%) |
| Total length of railway infrastructure managed by the Railway Administration | 457 km |
| Protected zone around the railway infrastructure | 52 km2 |
Table 2.
Weights assigned to individual species composition.
| Species Composition | Raster Value | Weight |
|---|---|---|
| spruce | 1 | 4 |
| pine | 5 | 3 |
| beech | 4 | 2 |
| oak | 9 | 2 |
| pinus mugo | 22 | 0 |
| culture | 21 | 0 |
| other broad-leaved tree | 6 | 2 |
| other (mixture of trees) | 2 | 2 |
| logging | 10 | 0 |
Table 3.
Total precipitation in the Liberec Region in 2017 and 2018 [44].
Table 3.
Total precipitation in the Liberec Region in 2017 and 2018 [44].
| Year | Month | ||||||||||||
|---|---|---|---|---|---|---|---|---|---|---|---|---|---|
| 1 | 2 | 3 | 4 | 5 | 6 | 7 | 8 | 9 | 10 | 11 | 12 | ||
| Total precipitation (mm) | 2017 | 70 | 48 | 60 | 65 | 48 | 99 | 115 | 83 | 70 | 144 | 68 | 75 |
| 2018 | 75 | 4 | 48 | 37 | 36 | 67 | 33 | 34 | 40 | 44 | 11 | 127 | |
| N * | 74 | 60 | 68 | 50 | 70 | 83 | 100 | 99 | 71 | 60 | 74 | 81 | |
* N—long-term precipitation normal 1981–2010.
Table 4.
Portions of area in railway protected zone in categories of slopes.
| Slope (°) | Area (ha) | Portion (%) |
|---|---|---|
| Under 10 | 3134.3 | 79.9 |
| 10–20 | 636.1 | 16.2 |
| 20–30 | 135.5 | 3.4 |
| Over 30 | 16.7 | 0.4 |
Publisher’s Note: MDPI stays neutral with regard to jurisdictional claims in published maps and institutional affiliations. |
© 2021 by the authors. Licensee MDPI, Basel, Switzerland. This article is an open access article distributed under the terms and conditions of the Creative Commons Attribution (CC BY) license (https://creativecommons.org/licenses/by/4.0/).
Share and Cite
MDPI and ACS Style
Kučera, M.; Dobesova, Z. Analysis of the Degree of Threat to Railway Infrastructure by Falling Tree Vegetation. ISPRS Int. J. Geo-Inf. 2021, 10, 292. https://doi.org/10.3390/ijgi10050292
AMA Style
Kučera M, Dobesova Z. Analysis of the Degree of Threat to Railway Infrastructure by Falling Tree Vegetation. ISPRS International Journal of Geo-Information. 2021; 10(5):292. https://doi.org/10.3390/ijgi10050292
Chicago/Turabian StyleKučera, Michal, and Zdena Dobesova. 2021. "Analysis of the Degree of Threat to Railway Infrastructure by Falling Tree Vegetation" ISPRS International Journal of Geo-Information 10, no. 5: 292. https://doi.org/10.3390/ijgi10050292
Note that from the first issue of 2016, this journal uses article numbers instead of page numbers. See further details here.