
Natural Background and the Anthropogenic Enrichment of Mercury in the Southern Florida Environment: A Review with a Discussion on Public Health
 , ,
, , 
Abstract
:1. Introduction
2. Geochemistry of Mercury
2.1. Chemical Properties
2.2. Oxidation–Reduction Reactions in the Atmosphere
2.3. Oxidation Reactions in Surface Ocean Water and Other Freshwater Bodies
2.4. Oxidation–Reduction Reactions in Soils and Bioavailability of Mercury
3. Overview of Natural Global Occurrence of Mercury in Rocks and Soils with Emphasis on Carbonate Rocks and Sediments
4. Naturally Occurring Hg Concentrations in Geological Units and Soils of Southern Florida
4.1. Hg Occurrence in Major Stratigraphic Units (Miocene to Early Eocene) in Southern Florida
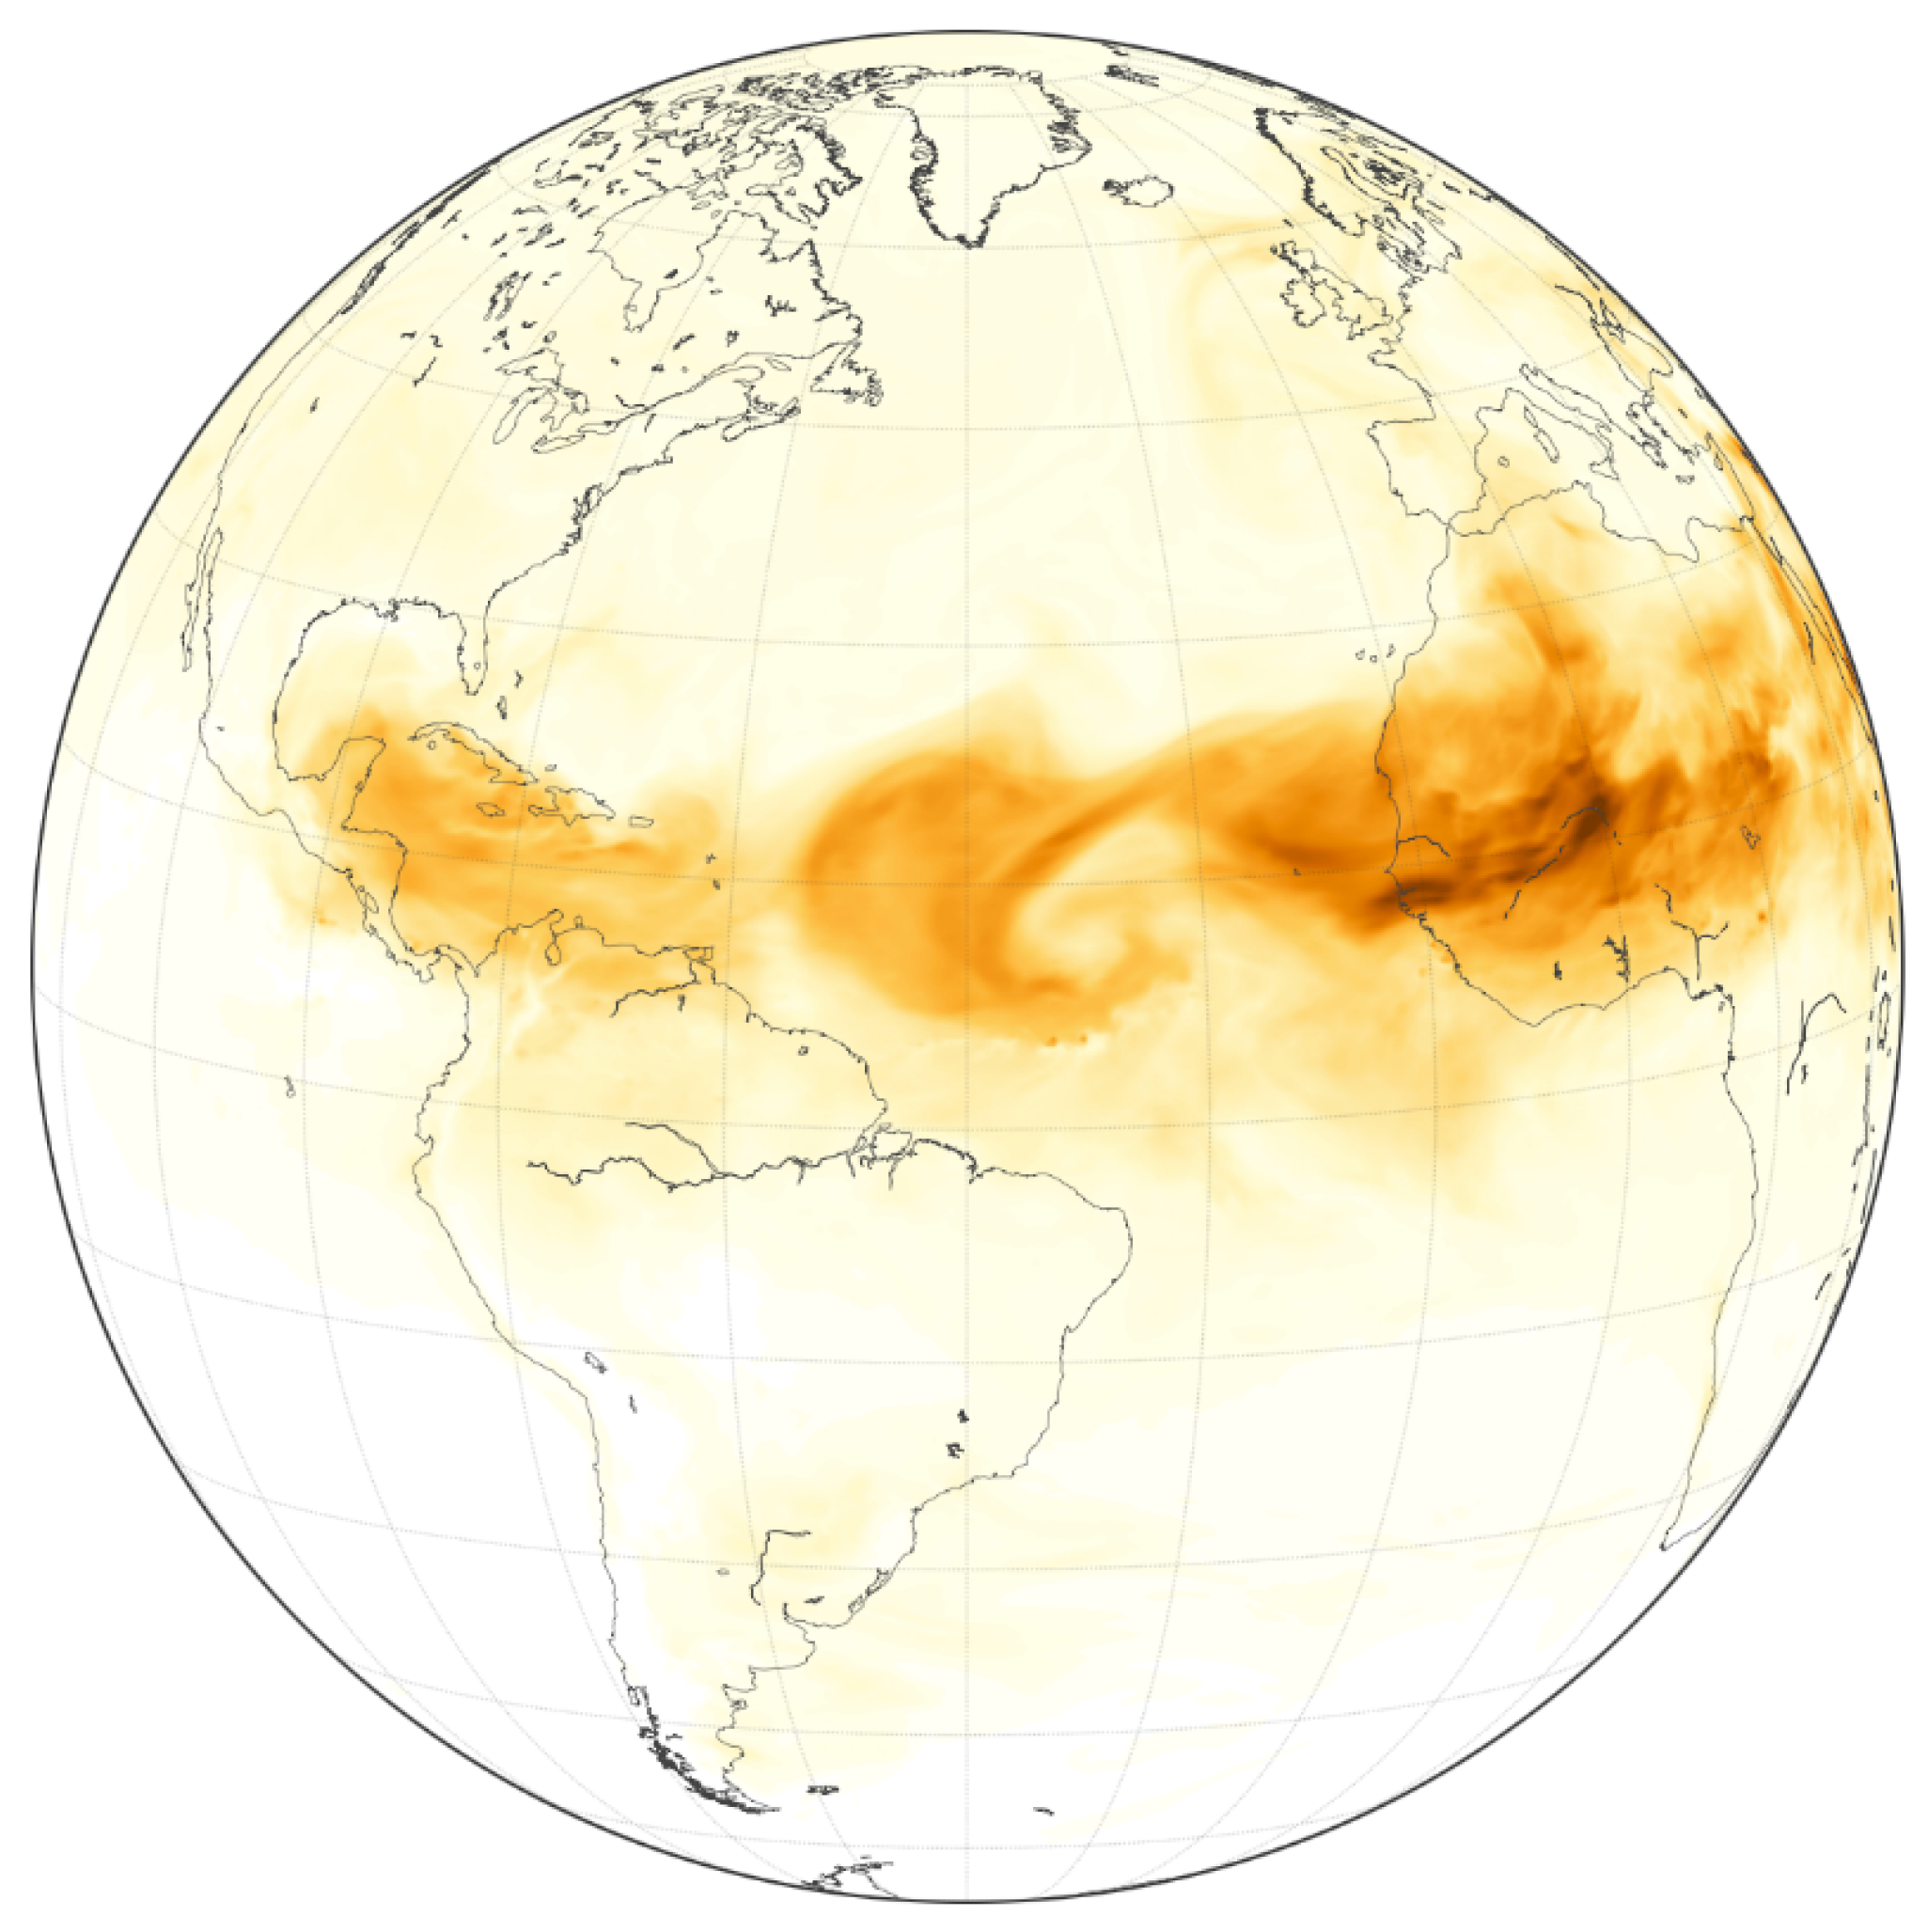
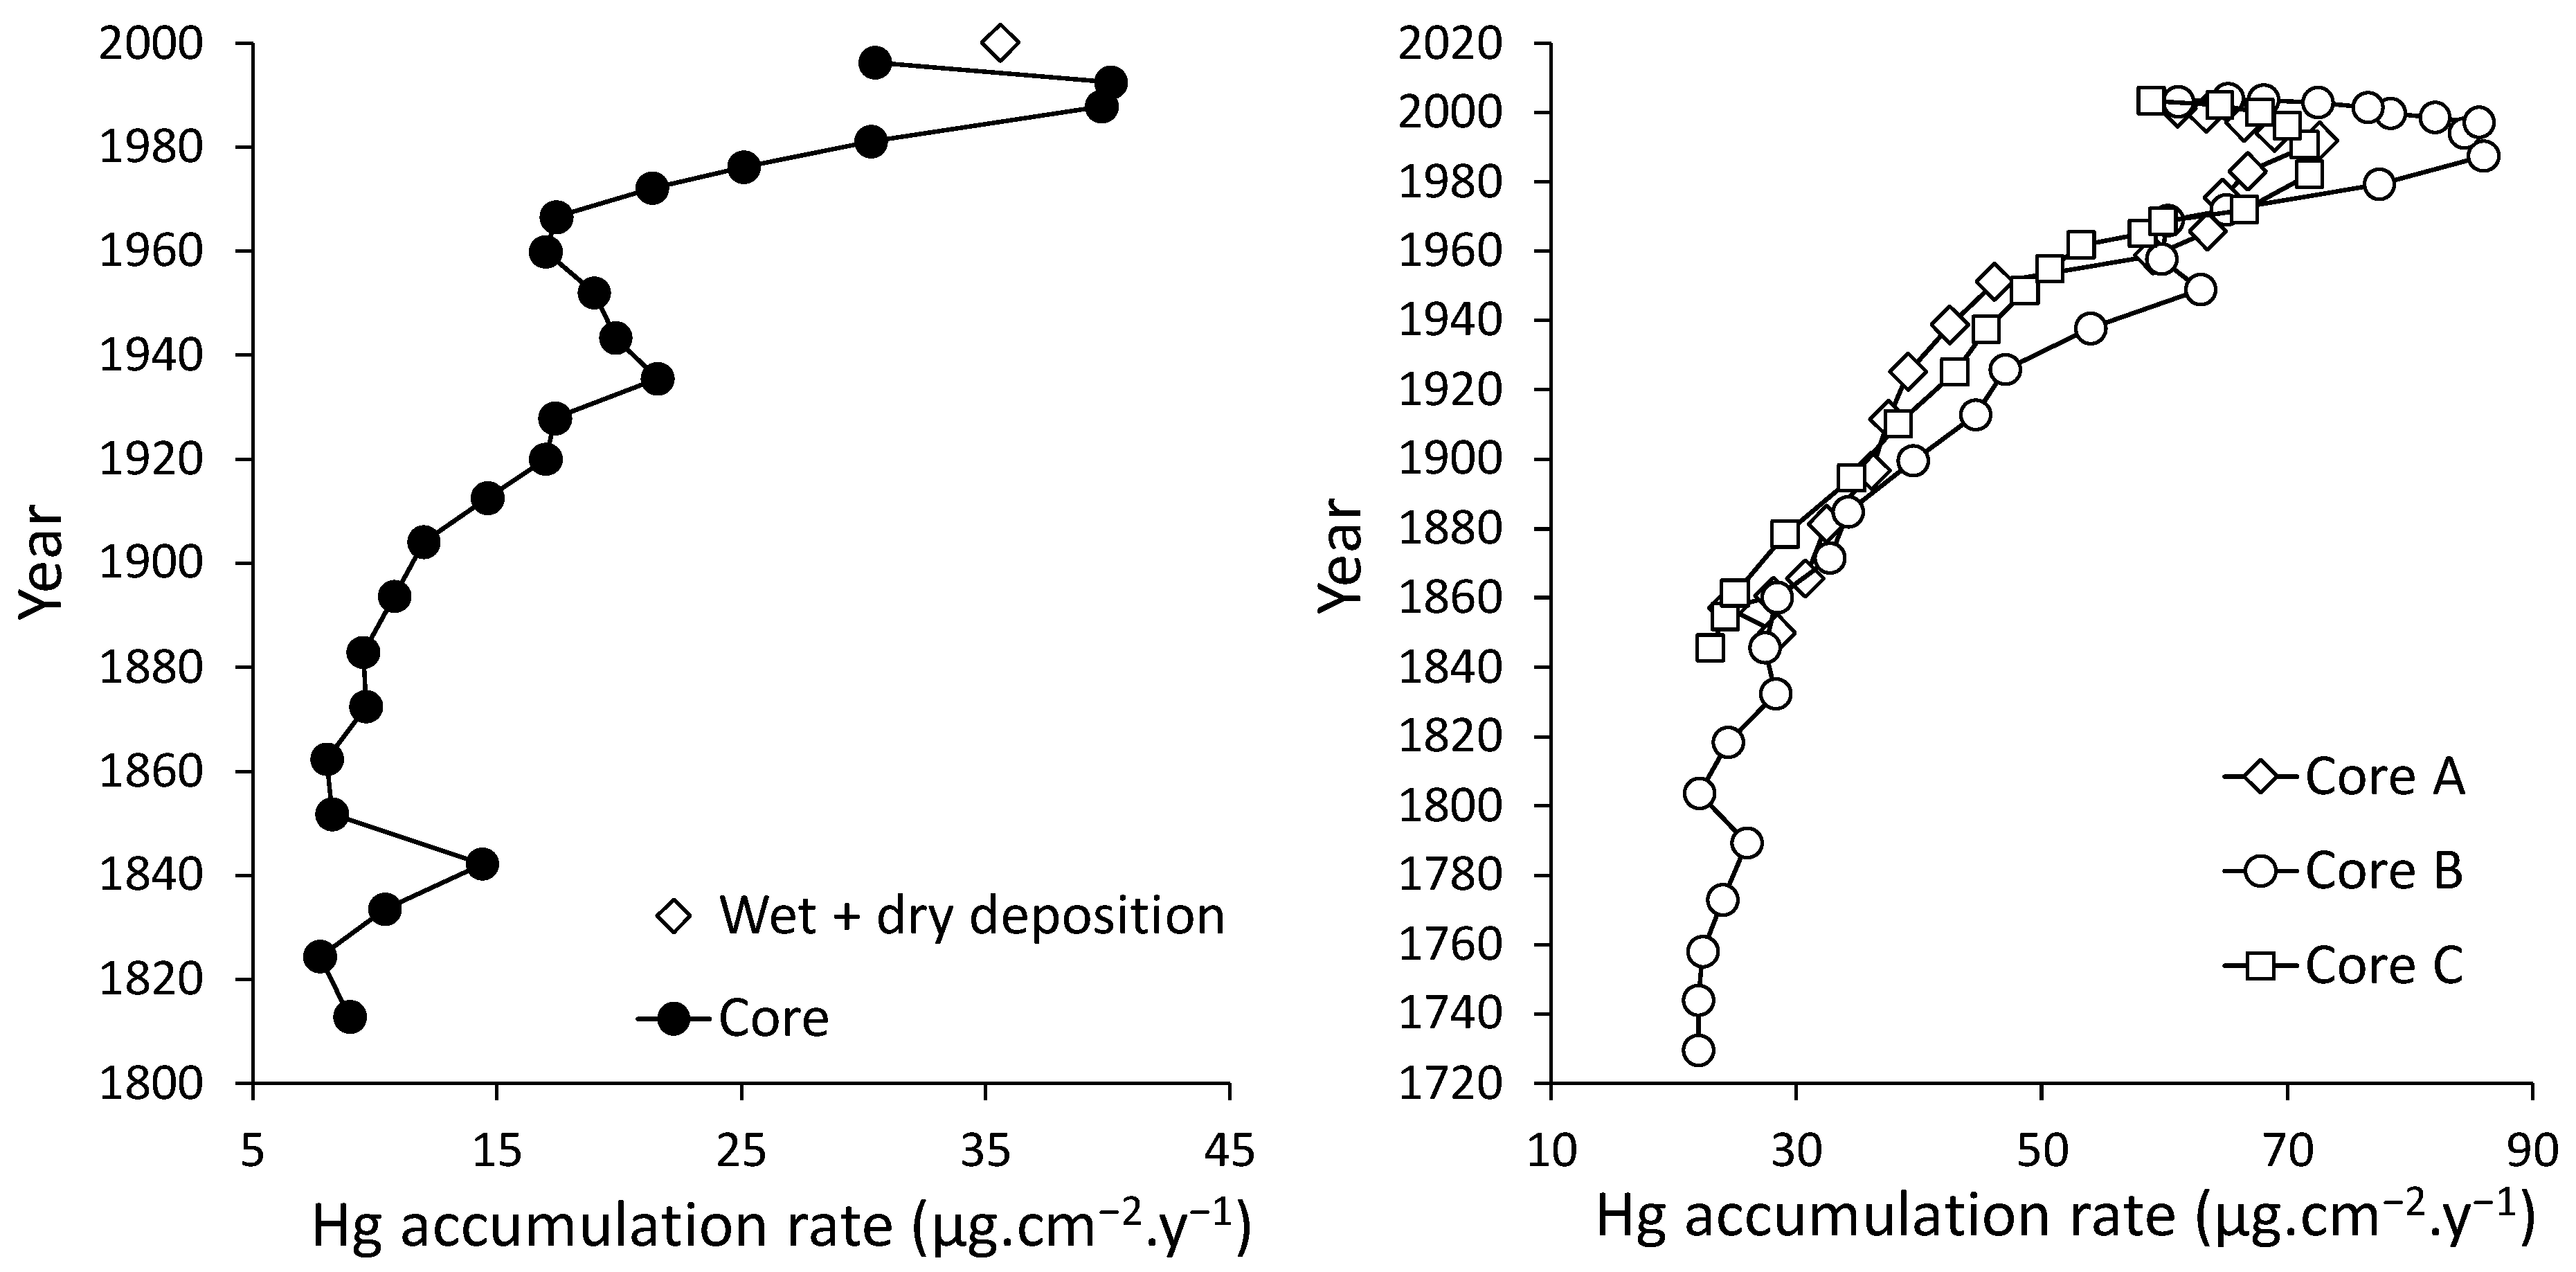
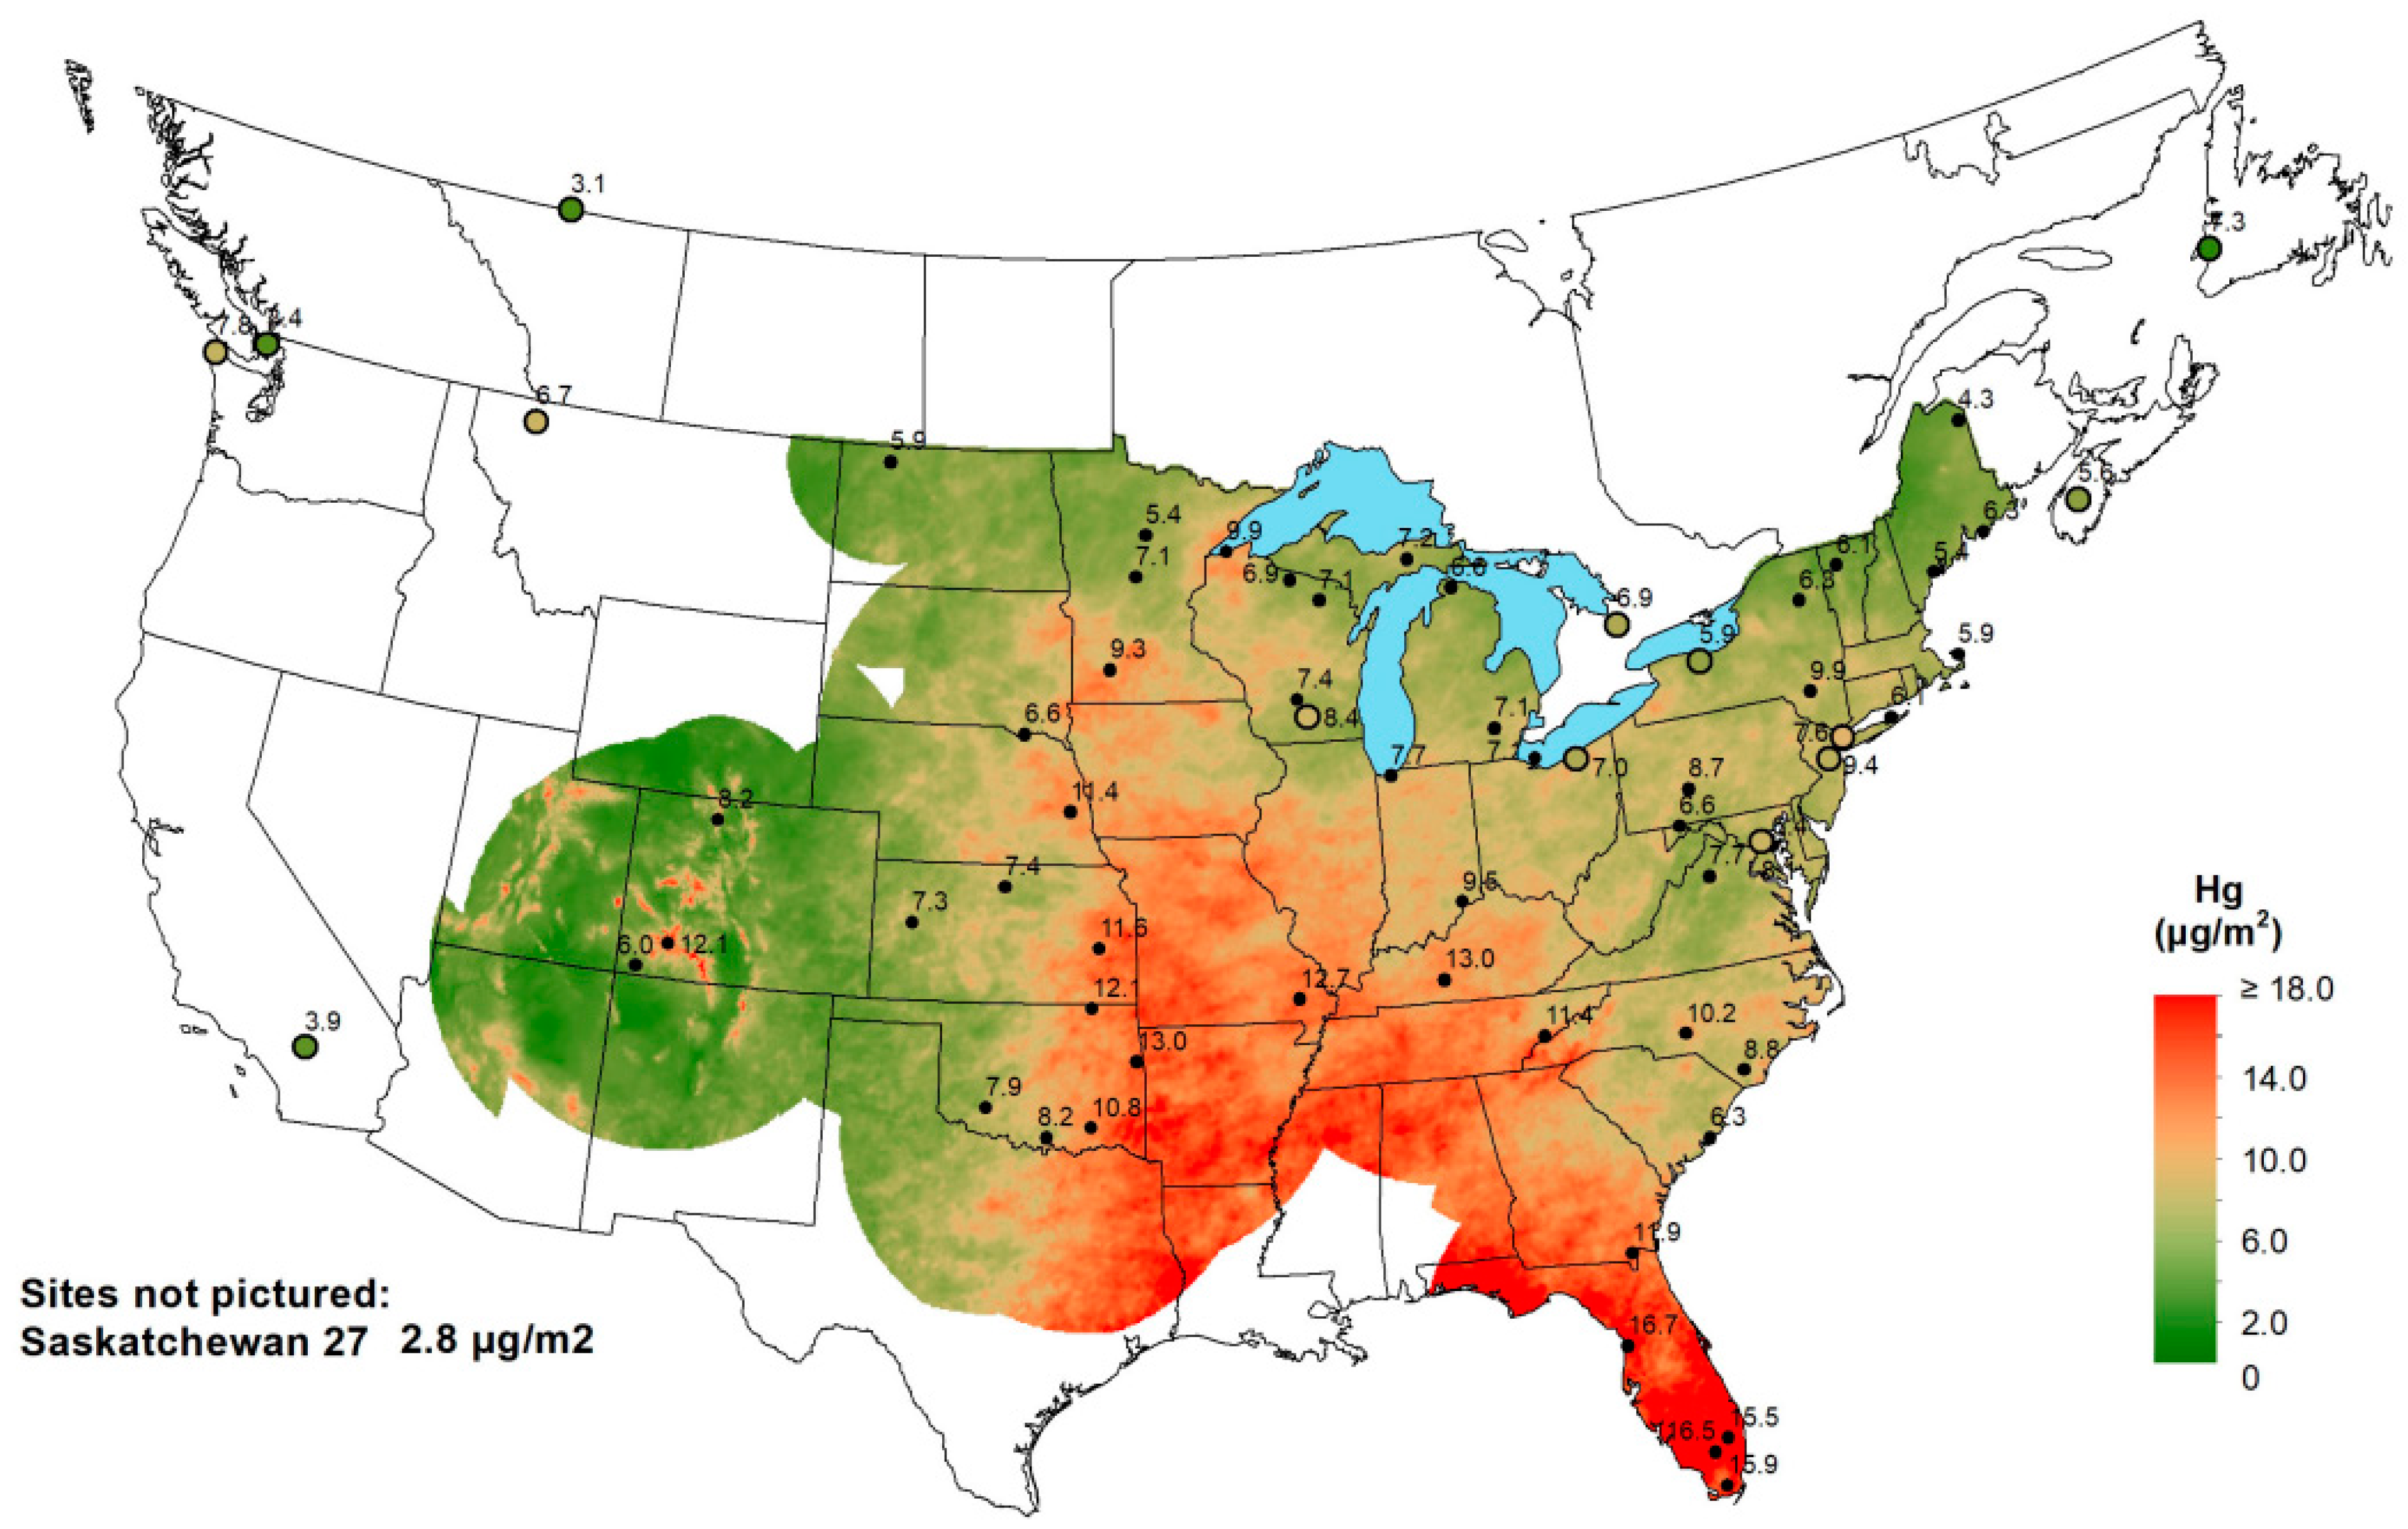
4.2. Atmospheric Deposition of Hg in the Southern Florida Environment

4.3. Naturally Occurring Hg Sources in Southern Florida Soils, Wetland, Lake and Tidal Sediments
4.4. Oceanic Evasion of Hg into the Southern Florida Environment
5. Anthropogenic Sources of Hg in the Southern Florida Environment
5.1. Anthropogenic Hg Deposition in Southern Florida: Sources, Accumulation, and Recycling
5.2. Historical Use of Hg Compounds in Agriculture and Common Domestic and Industrial Products in Southern Florida
5.3. Atmospheric Emissions and Deposition of Hg in Southern Florida from Power Plants, Other Large Emission Sites, and Sources
5.4. Atmospheric Emissions of Hg from Cement Plants
5.5. Hg in Soil Amendments (e.g., Wastewater Sludge) and Domestic Wastewater Used for Irrigation
5.6. Industrial and Landfill Aerosol and Groundwater Discharges
5.7. Atmospheric Aerosol Emissions Deposition from Muck and Forest Fires
5.8. Hg Emissions from Vehicle Exhaust
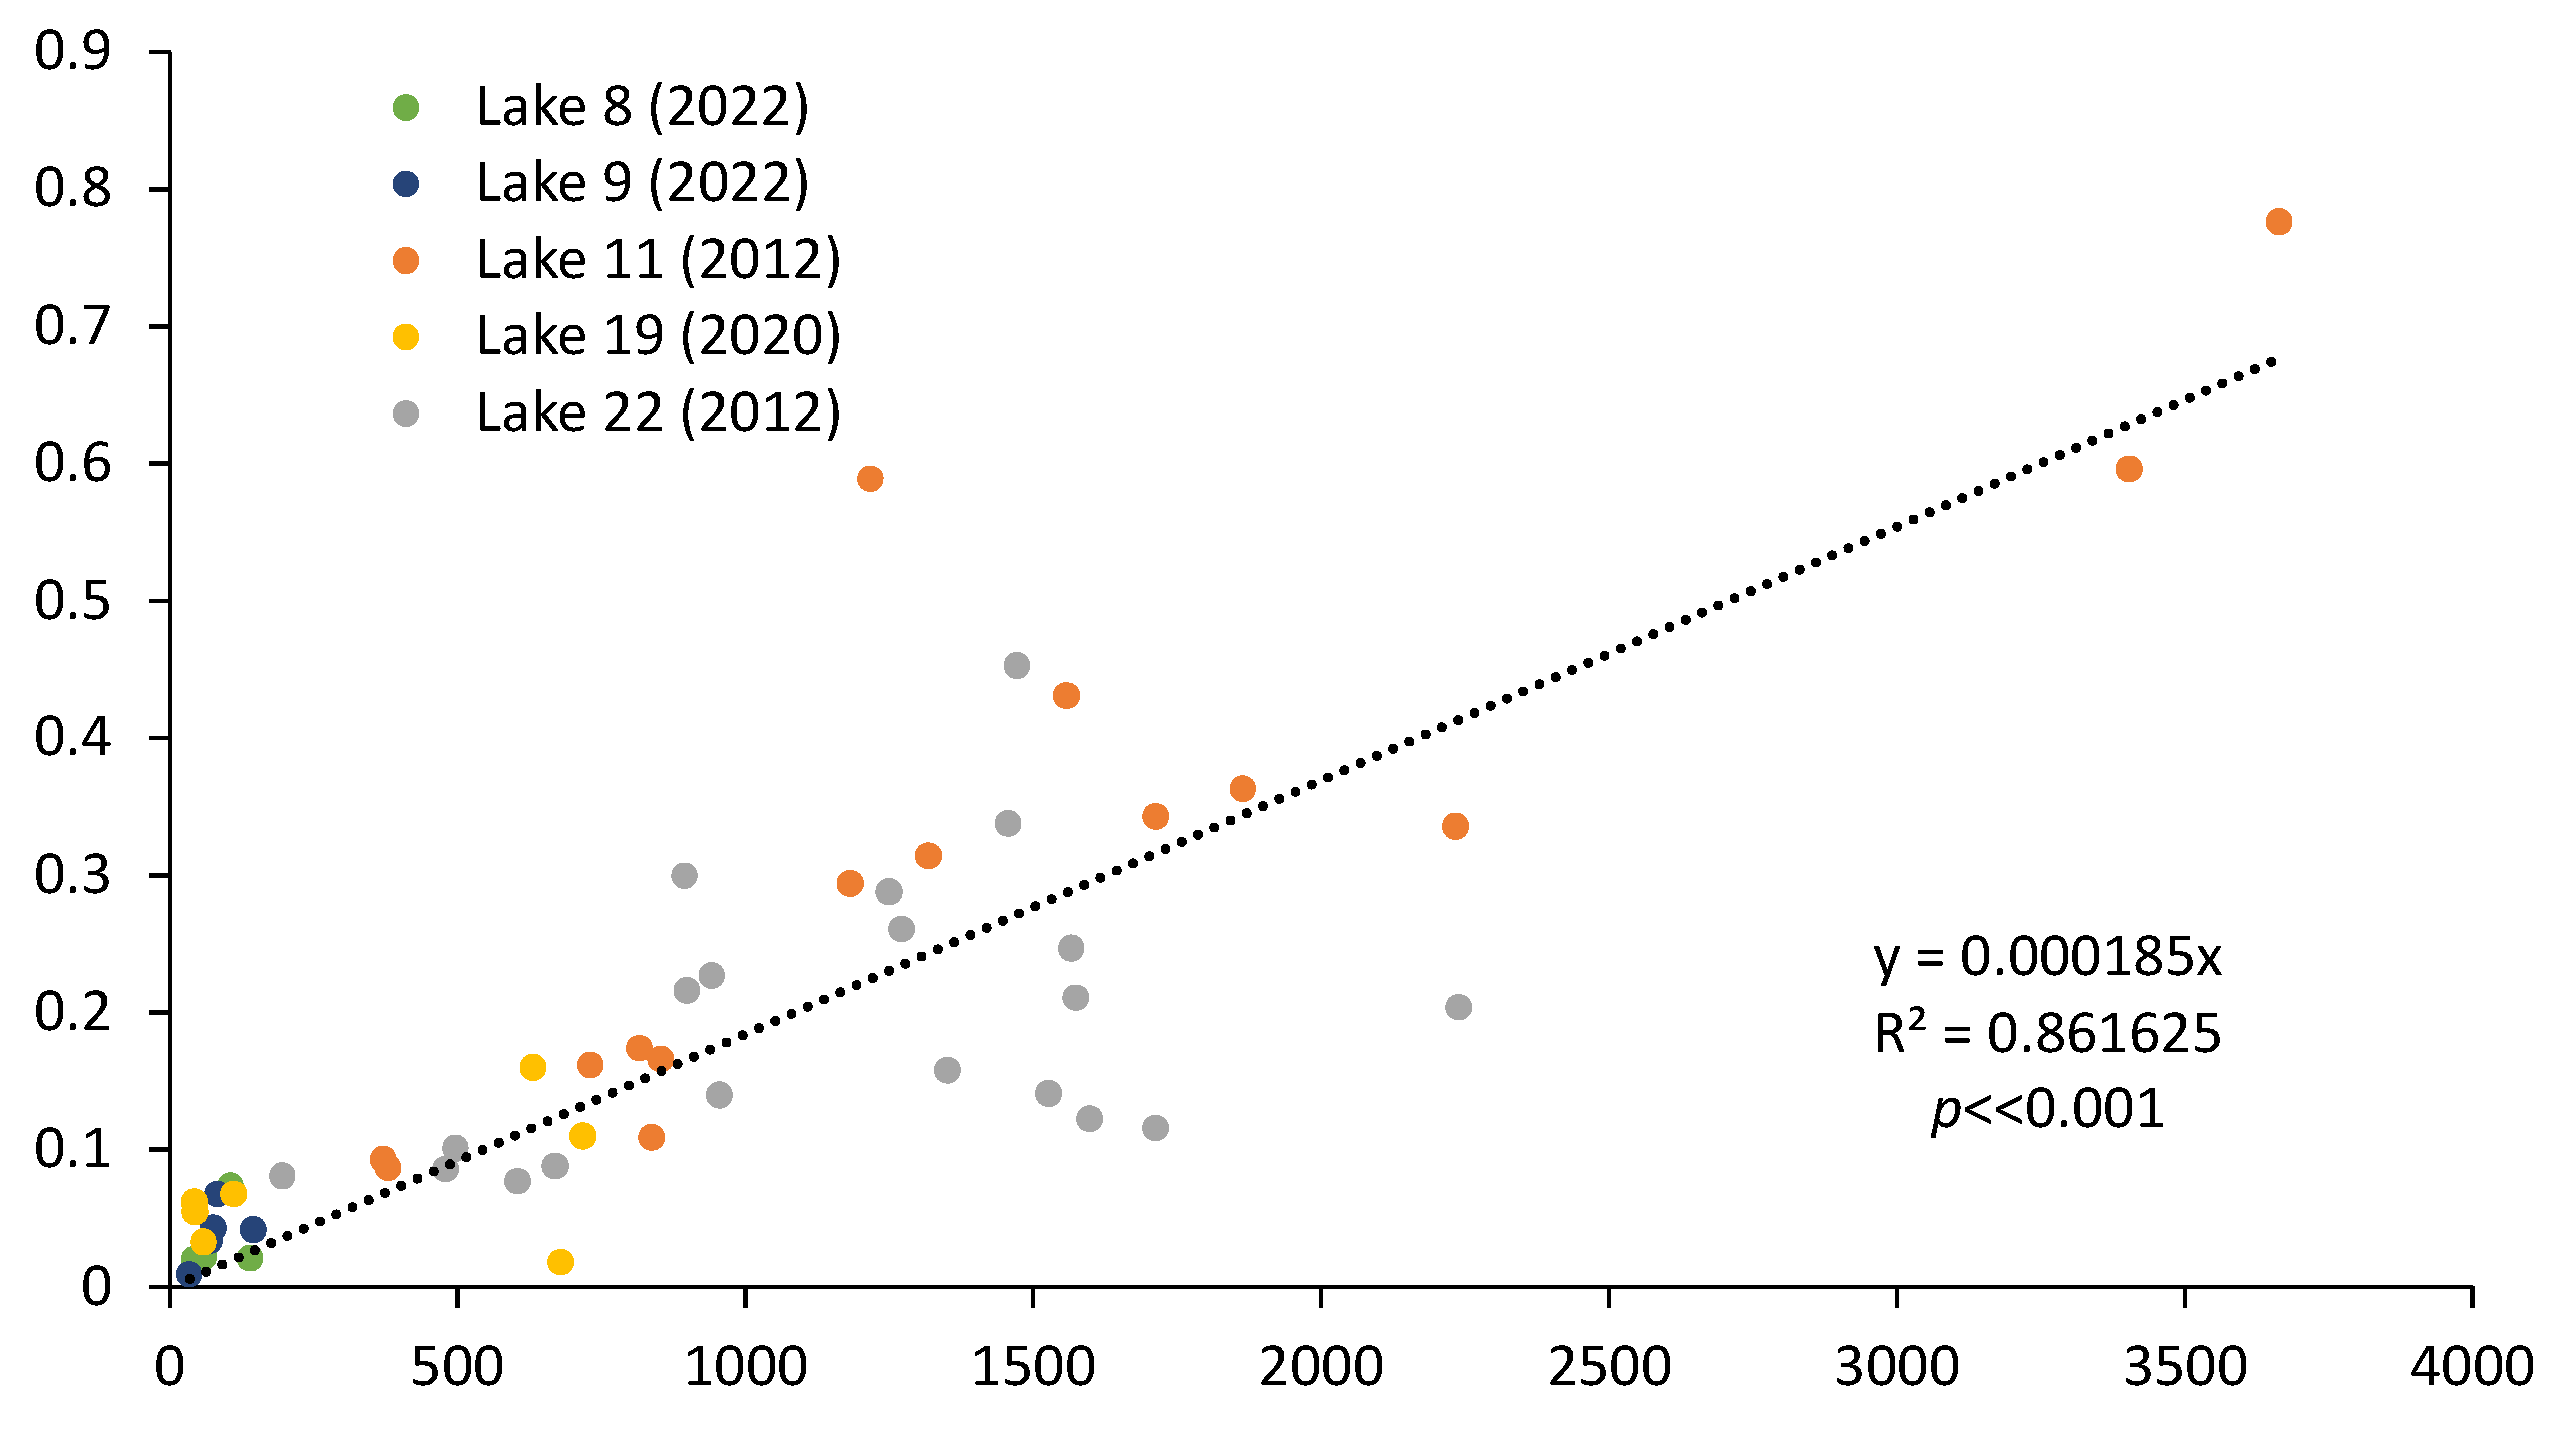
5.9. Hg in Urban Stormwater Management Facility Sediments and Street Sweepings
6. Hg Concentrations in Sediment, Surface Water, and Groundwater in Southern Florida
6.1. Atmospheric Hg Investigations in Southern Florida
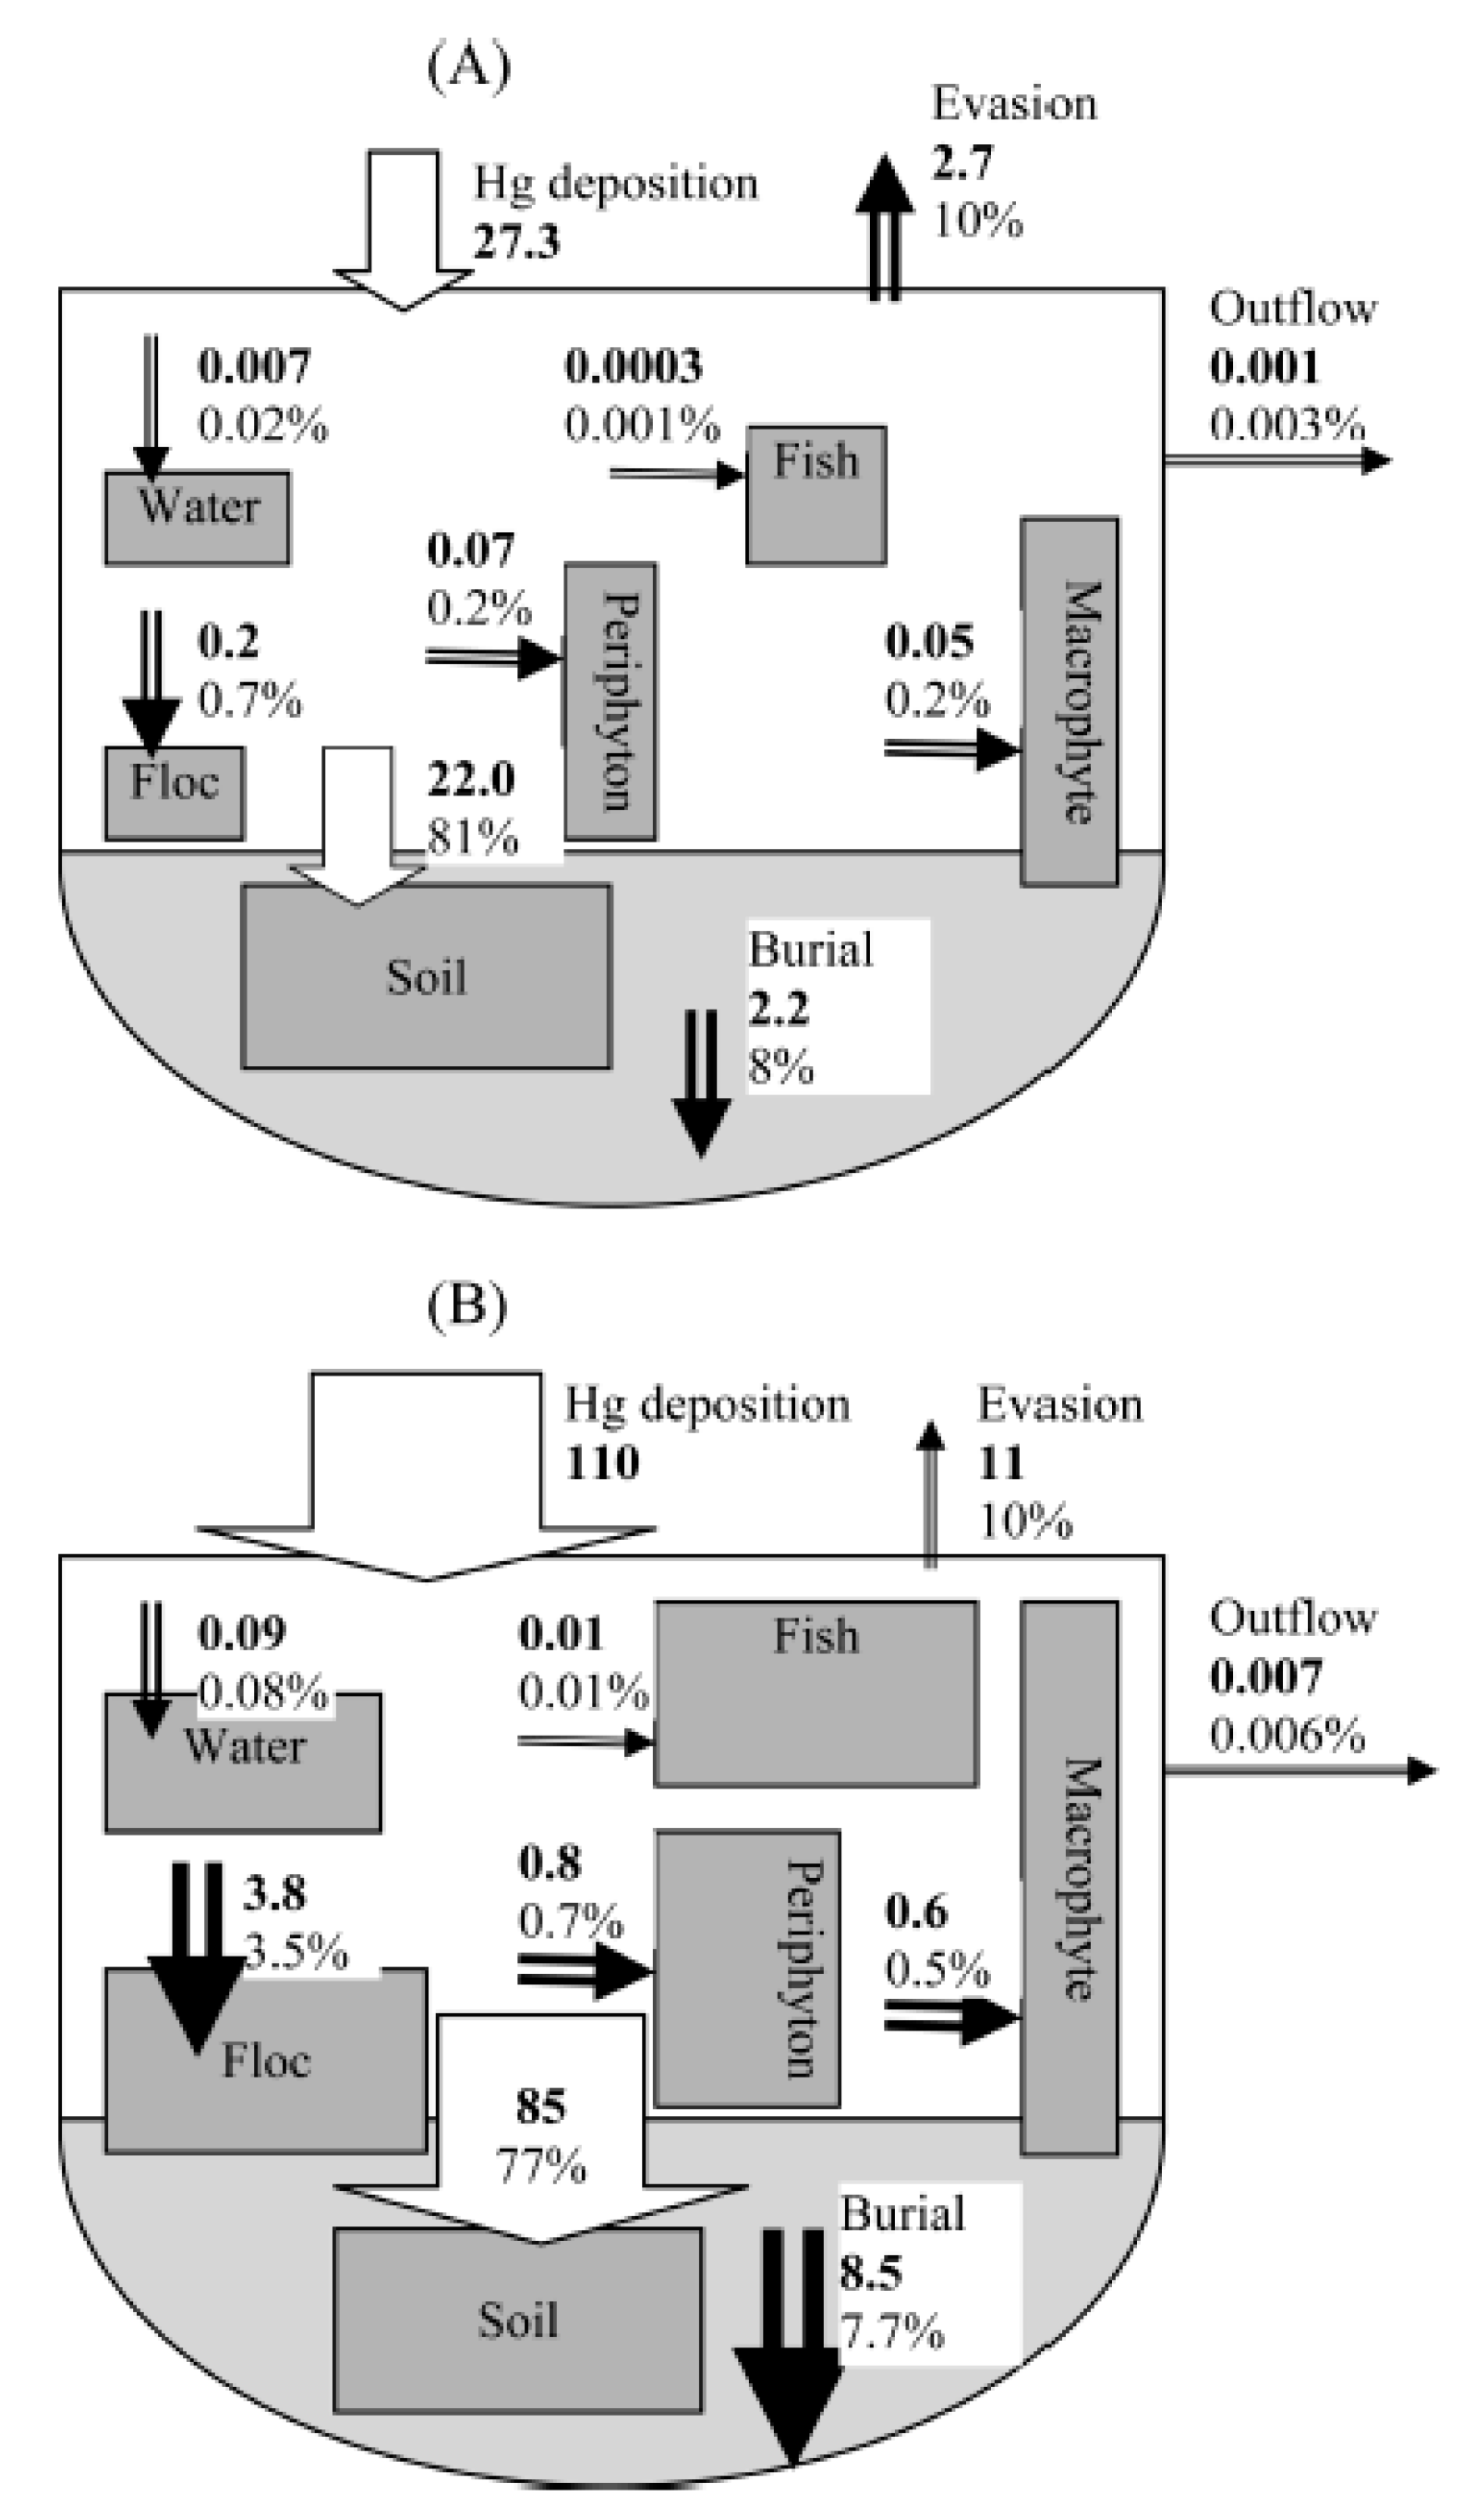
6.2. Sources and Sinks of Hg in Southern Florida: A Proposed Mercury Budget
7. Health Risk Aspects of Hg Exposure
7.1. Public Health Perspective of Mercury Exposure
7.2. Exposure to Hg in Soils, Surface Water, and Drinking Water in Southern Florida: Health and Regulatory Perspectives
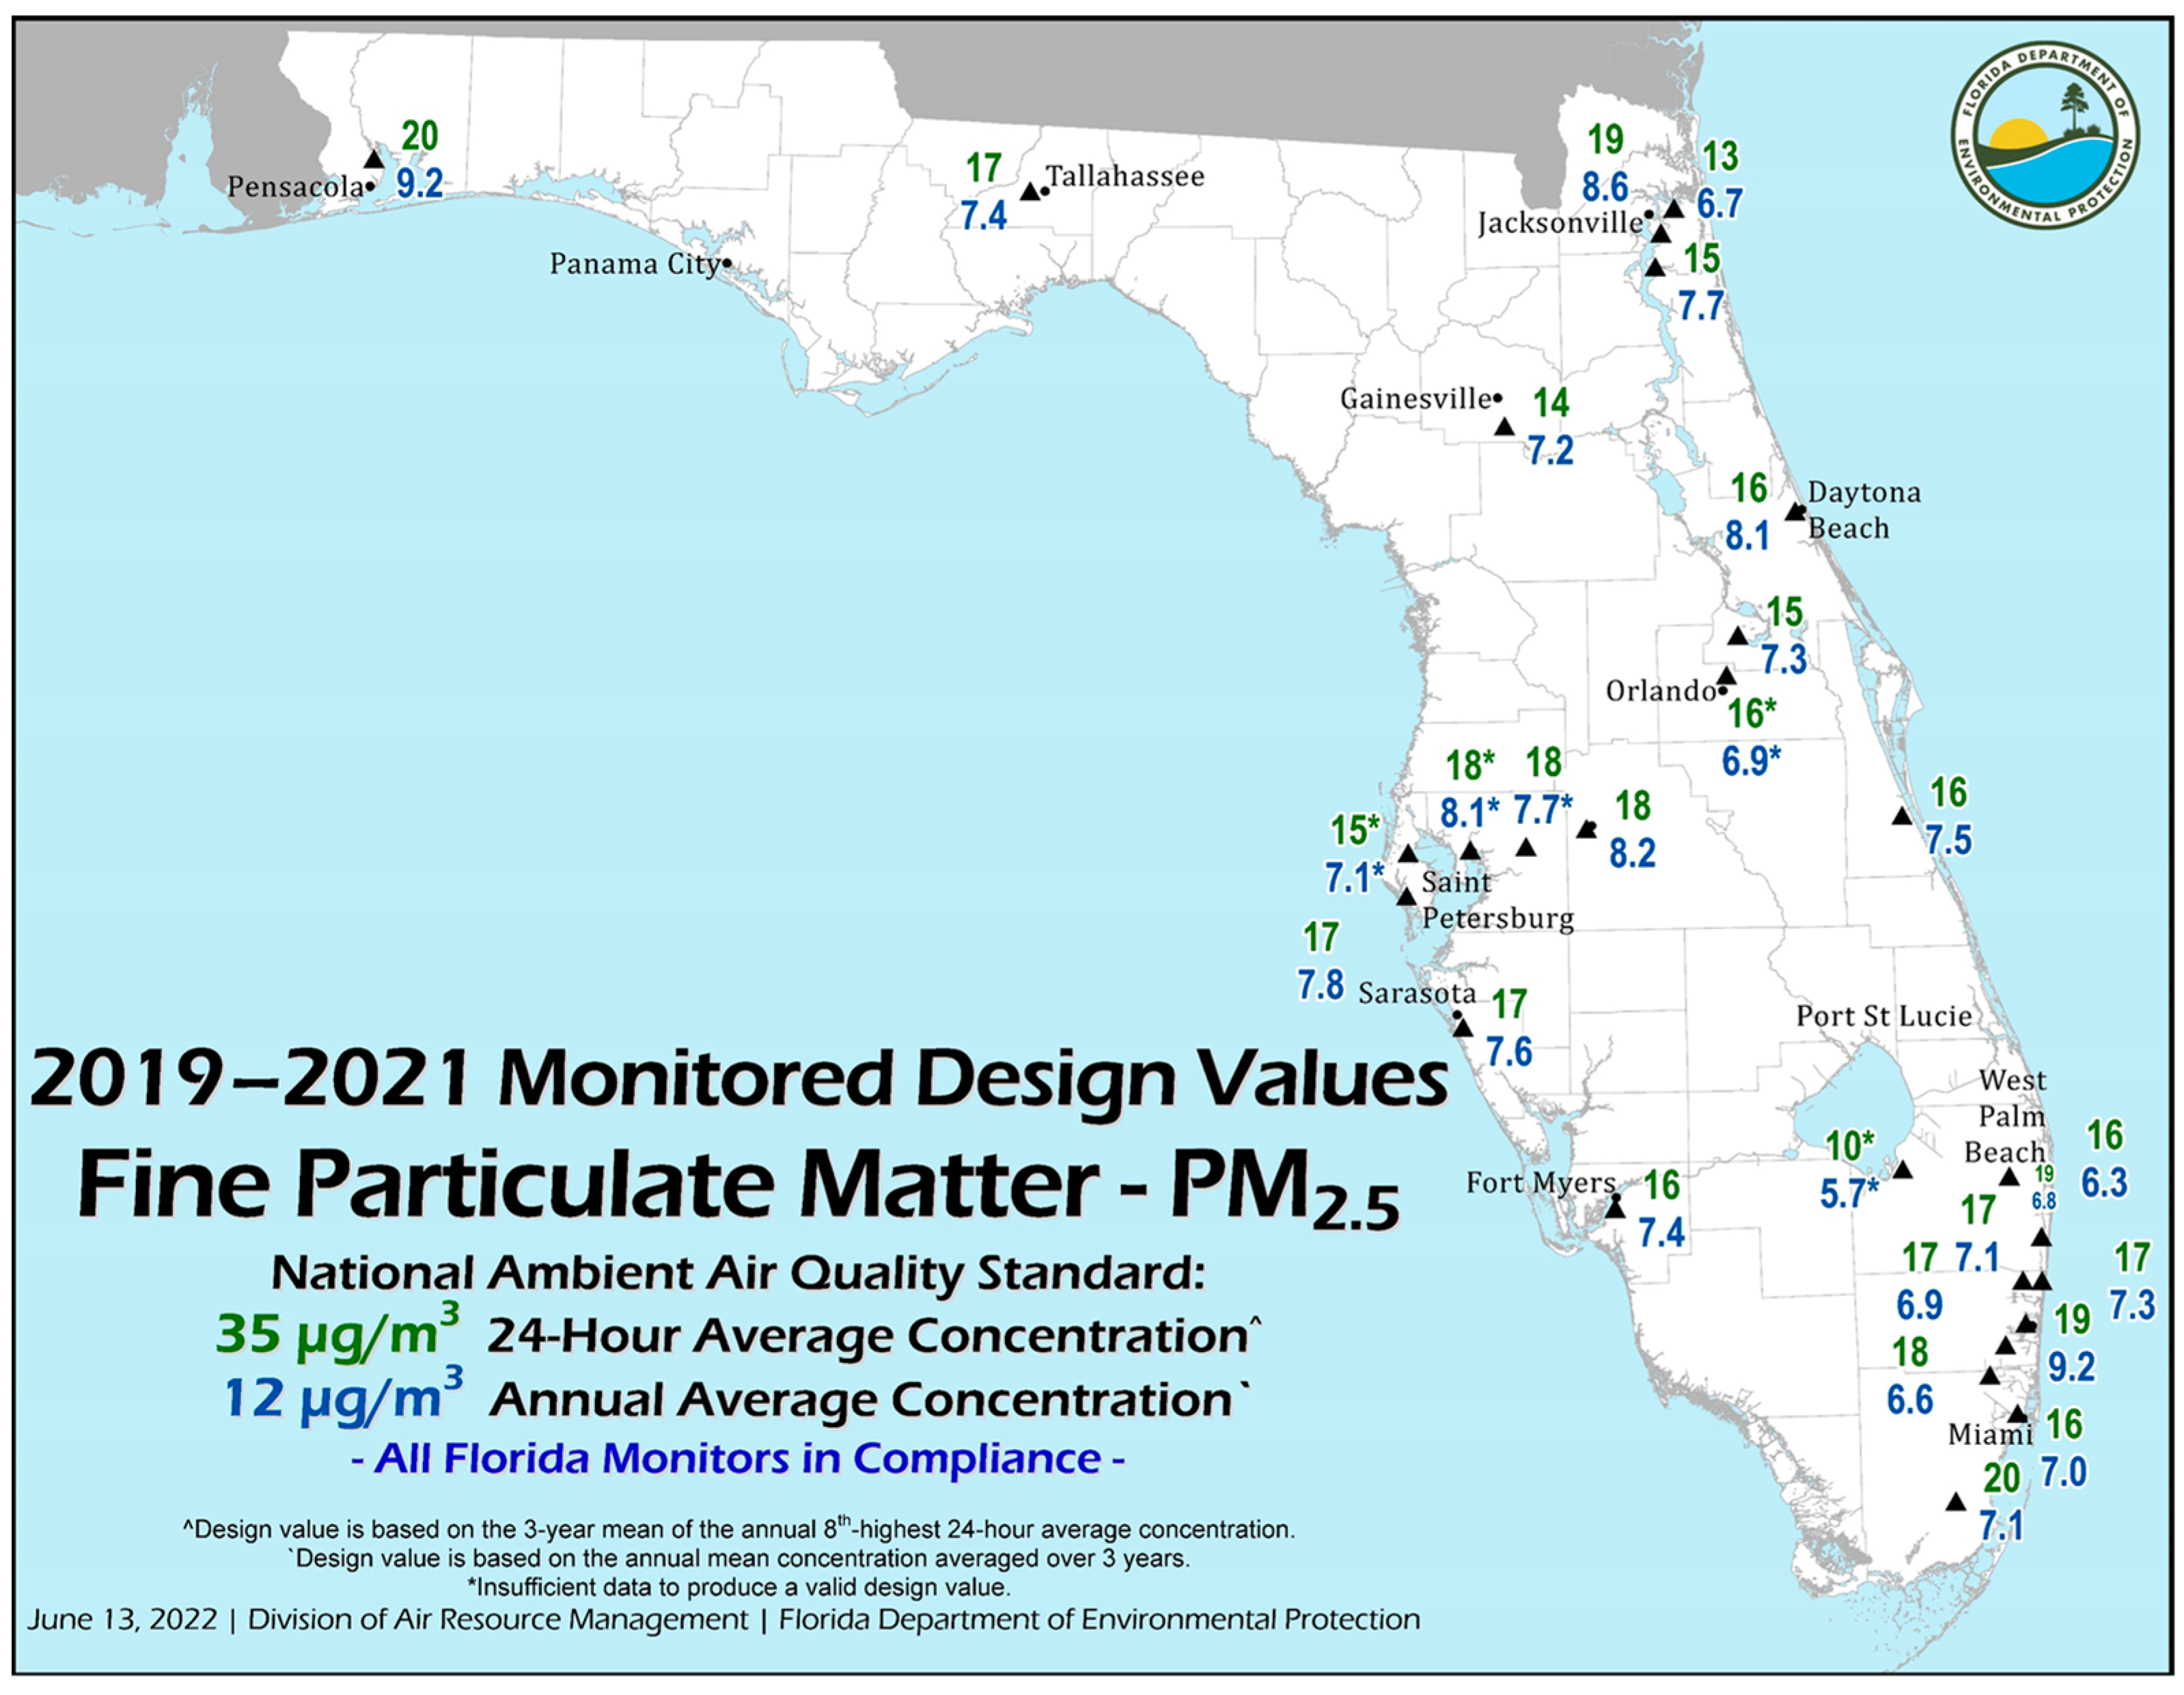
7.3. Exposure to Hg in Ambient Air: Health and Regulatory Aspects
7.4. Hg Bioaccumulation in Fish and Animals
8. Conclusions
Author Contributions
Funding
Institutional Review Board Statement
Informed Consent Statement
Data Availability Statement
Acknowledgments
Conflicts of Interest
References
- National Institute for Occupational Safety and Health (NIOSH). Criteria Documents: Criteria for a Recommended Standard: Occupational Exposure to Inorganic Mercury; DHHS (NIOSH) Publication No. 73-11024; NIOSH Publication: Washington, DC, USA, 1973.
- National Institute for Occupational Safety and Health (NIOSH). Inorganic Mercury and Organic Mercury; DHHS (NIOSH) Publication No. 81-123; NIOSH Publication: Washington, DC, USA, 1981.
- National Institute for Occupational Safety and Health (NIOSH). Hazard ID No. 6: Exposure to Mercury Vapor during the Use of Mercury Carburetor Synchronizers; DHHS (NIOSH) Publication No. 99-111; NIOSH Publication: Washington, DC, USA, 1999.
- Zilloux, E.J.; Porcella, D.B.; Benoit, J.M. Mercury cycling and effects in freshwater wetland ecosystems. Environ. Toxicol. Chem. 1993, 12, 2245–2264. [Google Scholar] [CrossRef]
- Krabbenhoft, D.P.; Hurley, J.P.; Marvin-DiPasquale, M.; Orem, W.H.; Aiken, G.R.; Schuster, P.J.; Gilmour, C.C.; Harris, R. The aquatic cycling of mercury in the Everglades (ACME) project: A process-based investigation of mercury biogeochemistry in a complex environmental setting. In U.S. Geological Survey, Program on the South Florida Ecosystem—Proceedings of South Florida Restoration Science Forum, Boca Raton, FL, USA, 17–19 May 1999.; U.S. Geological Survey Open-File Report 99–181; Gerould, S., Higer, A., Eds.; U.S. Geological Survey: Reston, VA, USA, 1999; pp. 54–56. [Google Scholar]
- Jones, R.L.; Sinks, T.; Schober, S.E.; Pickett, M. Blood mercury levels in young children and childbearing-aged women-united States, 1999–2002. Morb. Mortal. Wkly. Rep. 2004, 53, 1018–1020. [Google Scholar]
- Pirrone, N.; Mahaffey, K. Where we stand on mercury pollution and its health effects on regional and global scales. In Dynamics of Mercury Pollution on Regional and Global Scales: Atmospheric Processes, Human Health, and Policy; Pirrone, N., Mahaffey, K., Eds.; Springer: Norwell, MA, USA, 2005; Chapter 1; pp. 1–21. [Google Scholar]
- Bernhoft, R.A. Mercury toxicity and treatment: A review of the literature. J. Environ. Public Health 2012, 2012, 460508. [Google Scholar] [CrossRef] [PubMed]
- Gustin, M.S.; Weiss-Penzias, P.S.; Peterson, C. Investigating sources of gaseous oxidized mercury in dry deposition at three sites across Florida, USA. Atmos. Chem. Phys. 2012, 12, 9201–9219. [Google Scholar] [CrossRef]
- U.S. Environmental Protection Agency (USEPA). 2023 Regional Screening Levels Table; U.S. Environmental Protection Agency: Washington, DC, USA, 2023. Available online: https://www.epa.gov/risk/regional-screening-levels-rsls-generic-tables (accessed on 1 November 2023).
- Pirrone, N.; Cinnirella, S.; Feng, X.; Finkelman, R.B.; Friedli, H.R.; Leaner, J.; Mason, R.; Mukherjee, A.B.; Stracher, G.; Streets, D.G.; et al. Global mercury emissions to the atmosphere from natural and anthropogenic sources. In Mercury Fate and Transport in the Global Atmosphere: Emissions Measurements and Models; Pirrone, N., Mason, R., Eds.; Springer Science + Business Media: New York, NY, USA, 2009; Chapter 1; pp. 3–49. [Google Scholar]
- Pirrone, N.; Sprovieri, S.; Hedgecock, I.; Trunfio, A.; Cinnirella, S. Dynamic processes of atmospheric mercury and its species in the Mediterranean Region. In Dynamics of Mercury Pollution on Regional and Global Scales: Atmospheric Processes, Human Health, and Policy; Pirrone, N., Mahaffey, K., Eds.; Springer: Norwell, MA, USA, 2005; Chapter 23. [Google Scholar]
- Hedgecock, I.M.; Pirrone, N.; Trunfio, G.A.; Sprovieri, F. Integrated mercury cycling transport, and airbourne exchange (MERCAWEx) model. J. Geophys. Res. 2006, 111, D20302. [Google Scholar] [CrossRef]
- Lindberg, S.; Bullock, R.; Ebinghaus, R.; Engstrom, D.; Feng, X.; Fitzgerald, W.; Pirrone, N.; Prestbo, E.; Seigneur, C. A synthesis of progress and uncertainties in attributing the sources of mercury in deposition. AMBIO J. Hum. Environ. 2007, 36, 19–32. [Google Scholar] [CrossRef]
- Lindqvist, O.; Rodhe, H. Atmospheric mercury—A review. Tellus B 1985, 31, 36–159. [Google Scholar] [CrossRef]
- Lindqvist, G.; Johansson, K.; Astrup, A.; Anderson, A.; Bringmark, L.; Hovenius, G.; Iverfeldt, Å.; Meili, M.; Timm, B. Mercury in the Swedish environment. Water Air Soil Pollut. 1991, 55, xi-261. [Google Scholar] [CrossRef]
- Rasmussen, P.E.; Edwards, G.C.; Kemp, J.R.; Fitzgerald-Hubble, C.R.; Schroeder, W.H. Towards an improved natural source inventory for mercury. In Proceedings of the Metals in the Environment: An International Symposium, Montreal, QC, Canada, 5–6 May 1998; Sheaff, J., Ed.; Canadian Institute of Mining, Metallurgy and Petroleum, Montreal, Canada Publisher: Montreal, QC, Canada, 1998; pp. 74–82. [Google Scholar]
- Gustin, M.S.; Lindberg, S.E.; Austin, K.; Coolbaugh, M.; Vette, A.; Zhang, Z. Assessing contribution of natural sources to regional atmospheric mercury budgets. Sci. Total Environ. 2000, 259, 61–71. [Google Scholar] [CrossRef]
- Navarro-Flores, A.; Martinez-Frias, J.; Font, X.; Viladevakk, M. Modeling of modern mercury vapor transport in an ancient hydrothermal system: Environmental and geochemical implications. Appl. Geochem. 2000, 15, 281–294. [Google Scholar] [CrossRef]
- Gustin, M.S. Are mercury emissions from geologic sources significant: A status report. Sci. Total Environ. 2003, 304, 153–167. [Google Scholar] [CrossRef] [PubMed]
- Shen, J.; Fe4ng, Q.; Algeo, T.J.; Liu, J.; Zhou, C.; Wei, W.; Liu, J.; Them, T.R., II; Gill, B.C.; Chen, J. Sedimentary host phases of mercury (Hg) and implications for use of Hg as a volcanic proxy. Earth Planet. Sci. Lett. 2020, 543, 116333. [Google Scholar] [CrossRef]
- Gustin, M.S.; Maxey, R.A.; Rasmussen, P.; Biester, H. Mechanisms influencing the volatile loss of mercury from soils. In Symposium Volume, Measurement of Toxic and Related Air Pollutants, Air Waste Management Association; United States Environmental Protection Agency: Cary, NC, USA, 1998; pp. 224–234. [Google Scholar]
- Wallschläger, D.; Turner, R.R.; London, J.; Ebinghaus, R.; Kovk, H.H.; Sommar, J.; Xiao, J. Factors affecting the measurement of mercury emissions from soils with flux chambers. J. Geophys. Res. 1999, 104, 21859–21871. [Google Scholar] [CrossRef]
- Viega, M.M.; Meech, J.A.; Onante, N. Mercury pollution from deforestation. Nature 1994, 38, 816–817. [Google Scholar] [CrossRef]
- Carvalho, J.A.; Higuchi, N.; Anaujo, T.; Santos, J.C. Combustion completeness in a rainforest clearing experiment in Manaus, Brazil. J. Geophys. Res. 1998, 103, 13195–13200. [Google Scholar] [CrossRef]
- Roulet, M.; Lucotte, M.; Farella, N.; Serique, G.; Coelho, H.; Sousa Passos, C.J.; De Jesus de Silva, E.; Scavone de Andrade, P.; Mergler, D.; Guimarães, J.R.D.; et al. Effects of recent human colonization on the presence of mercury in Amazonian ecosystems. Water Air Soil Pollut. 1999, 112, 297–313. [Google Scholar] [CrossRef]
- Friedli, H.R.; Radke, L.F.; Lu, J.Y. Mercury in smoke from biomass fires. Geophys. Res. Lett. 2001, 28, 3223–3226. [Google Scholar] [CrossRef]
- Friedli, H.R.; Radke, L.F.; Lu, J.Y.; Banic, C.M.; Leaitch, W.R.; MacPherson, J.I. Mercury emissions from burning of biomass from temperate North American forests: Laboratory and airborne measurements. Atmospheric. Environ. 2003, 37, 253–267. [Google Scholar] [CrossRef]
- Sigler, J.M.; Lee, X.; Munger, W. Emission and long-range transport of gaseous mercury from a large-scale Canadian boreal forest fire. Environ. Sci. Technol. 2003, 37, 4343–4347. [Google Scholar] [CrossRef]
- Cossa, D.; Coquery, M.; Gobeil, C.; Martin, J.M. Mercury fluxes at the ocean margins. In Global and Regional Mercury Cycles: Sources, Fluxes and Mass Balances; Baeyens, W., Ebinghaus, R., Vasiliev, O., Eds.; Kluwer Academic Publishers: Amsterdam, The Netherlands, 1996; pp. 229–247. [Google Scholar]
- Pirrone, N.; Ferrara, R.; Hedgecock, I.M.; Kailos, G.; Mamane, Y.; Munthe, J.; Pacyna, J.M.; Pytharoulis, I.; Sprovieri, F.; Voudouri, A.; et al. Dynmic processes of mercury over the Mediterranean Region: Results from the Mediterranean Atmospheric Mercury Cycle System (MAMCS) project. Atmos. Environ. 2003, 37, 21–39. [Google Scholar] [CrossRef]
- Mason, R.P.; Lawson, N.M.; Sheu, G.-R. Mercury in the Atlantic Ocean: Factors controlling air-sea exchange of mercury and its distribution in the upper waters. Deep. Sea Res. Part II 2001, 48, 2829–2853. [Google Scholar] [CrossRef]
- Mason, R.P.; Sheu, G.P. Role of the ocean in the global mercury cycle. Glob. Biogeochem. Cycles 2002, 16, 1093. [Google Scholar] [CrossRef]
- Mason, R.P. Air-sea exchange and marine boundary layer atmospheric transformations of mercury and their importance in the global mercury cycle. In Dynamics of Mercury Pollution on Regional and Global Scales; Pirrone, N., Mahaffey, K.R., Eds.; Springer: New York, NY, USA, 2005; pp. 219–229. [Google Scholar]
- Mason, R.; Hammerschmidt, C.; Lamborg, C.; Bowman, K.; Swarr, G.; Shelley, R. The air-sea exchange of mercury in the low-latitude Pacific and Atlantic Oceans. Deep. Sea Res. Part I 2017, 122, 17–28. [Google Scholar] [CrossRef]
- Grasby, S.E.; Them, T.R., II; Chen, Z.; Yin, R.S.; Ardakani, O.H. Mercury as a proxy for volcanic emissions in the geologic record. Earth Sci. Rev. 2019, 196, 102880. [Google Scholar] [CrossRef]
- Ferrara, R.; Mazzolai, B.; Lanzillotta, E.; Nucaro, E.; Pirrone, N. Volcanoes as emission sources of atmospheric mercury in the Mediterranean basin. Sci. Total Environ. 2000, 259, 115–121. [Google Scholar] [CrossRef] [PubMed]
- Saiz-Lopez, A.; Travnikov, O.; Sonke, J.E.; Thackray, C.P.; Javob, D.J.; Carmona-García, J.; Francés-Monerris, A.; Roca-Sanjuán, D.; Ulises Acuña, A.; Dávalos, J.Z.; et al. Photochemistry of oxidized Hg(I) and Hg(II) species suggests missing mercury oxidation in the troposphere. Proc. Natl. Acad. Sci. USA 2020, 117, 30949–30956. [Google Scholar] [CrossRef]
- Lindström, S.; Callegaro, S.; Davies, J.; Tegner, C.; van der Schootbrugge, B.; Pedersen, G.K.; Youbi, N.; Sanei, H.; Marzoli, A. Tracing volcanic emissions from the Central Atlantic Magmatic Province in the sedimentary record. Earth Sci. Rev. 2021, 212, 103444. [Google Scholar] [CrossRef]
- Chu, P. An Assessment of Mercury Emissions from U.S. Coal Fired Power Plants; EPRI Report No. 1000608; EPRI: Palo Alto, CA, USA, 2000. [Google Scholar]
- Tewalt, S.J.; Bragg, L.J.; Finkelman, R.B. Mercury in U.S. Coal—Abundance, Distribution, and Modes of Occurrence; U.S. Geological Survey Fact Sheet FS-095-091; U.S. Geological Survey: Reston, VA, USA, 2006.
- Pacyna, E.G.; Pacyna, J.M.; Steenhuisen, F.; Wilson, S. Global anthropogenic mercury emission inventory for 2000. Atmos. Environ. 2006, 40, 4048–4063. [Google Scholar] [CrossRef]
- Pacyna, E.G.; Pacyna, J.M. Global emission of mercury from anthropogenic sources in 1995. Air Water Soil Pollut. 2002, 137, 149–165. [Google Scholar] [CrossRef]
- Jones, G.; Miller, G. Mercury and Modern Gold Mining in Nevada. University of Nevada. 2005. Available online: www.unep.org (accessed on 18 March 2023).
- Telmer, R.; Vega, M. Knowledge gaps in mercury pollution from gold mining. In Mercury Fate and Transport in the Global Atmosphere; Pirrone, N., Mason, R., Eds.; Springer: New York, NY, USA, 2008; pp. 131–172. [Google Scholar]
- Pirrone, N.; Costa, P.; Pacyna, J.M.; Rerrara, R. Mercury emissions to the atmosphere from natural and anthropogenic sources in the Mediterranean Region. Atmos. Environ. 2001, 35, 2997–3006. [Google Scholar] [CrossRef]
- Stracher, G.B.; Taylor, T.P. Coal fires burning out of control around the world: Thermodynamic receipt for environmental catastrophe. Inter. J. Coal Geol. 2004, 59, 7–17. [Google Scholar] [CrossRef]
- U.S. Environmental Protection Agency (USEPA). Mercury in Medical Waste. Mercury Fact Sheet #1. U.S. Environmental Protection Agency Region 5 Air and Radiation Division. 2008. Available online: www.epa.gov/ARD-R5/glakes/fact1.htm (accessed on 15 May 2023).
- Lindberg, S.E.; Roy, K.; Owens, J. Pathways of Mercury in Solid Waste Proposal ORNL Sampling Operations Summary and Preliminary Data Report for PaMSWaD-1; Brevard County Landfill: Cocoa, FL, USA, 6 January 1996. [Google Scholar]
- Lindberg, S.E.; Price, J.L. Airborne emissions of mercury from municipal landfill operations: A short-term measurement study in Florida. J. Air Waste Manag. Assoc. 1999, 49, 520–532. [Google Scholar] [CrossRef] [PubMed]
- Lindberg, S.E.; Wallschlaeger, D.; Prestbo, E.M.; Bloom, N.S.; Price, J.; Reinhart, D. Methylated mercury species in municipal waste landfill gas sampled in Florida, USA. Atmos. Environ. 2001, 35, 4011–4015. [Google Scholar] [CrossRef]
- Culver, A. How to Specify Low Mercury and Lead-Free Lighting Equipment; Association of Bay Area Governments: San Francisco, CA, USA, 2007. [Google Scholar]
- Huber, K. Mercury Use: Wastewater Treatment Plants, Great Lakes Binational Toxics Strategy—The Wisconsin Mercury Source Book. 1997. Available online: https://p2infohouse.org/ref/04/03851/waste.pdf (accessed on 20 August 2023).
- Carpi, A.; Lindberg, S.E.; Prestbo, E.M.; Bloom, N.S. Methyl mercury contamination and emission to the atmosphere from soil amended with municipal sewage sludge. J. Environ. Qual. 1997, 26, 1650–1655. [Google Scholar] [CrossRef]
- Navarro, A.; Cardellach, E.; Corbella, M. Mercury mobility in mine waste from Hg-mining areas in Almería Andalusia (Se Spain). J. Geochem. Explor. 2009, 101, 236–246. [Google Scholar] [CrossRef]
- Nartey, V.K.; Klake, R.K.; Doamekpor, L.L.; Kumankomah, S. Speciation of mercury in mine waste: Case study of abandoned and active gold mine sites at the Bibiani-Anwiaso-Bekwai area of south Western Ghana. Environ. Monitor. Assess. 2012, 184, 7623–7634. [Google Scholar] [CrossRef]
- Slemr, F.; Brunke, E.-G.; Ebinghaus, R.; Temme, C.; Munthe, J.; Wangberg, I.; Schroeder, W.; Steffen, A.; Berg, T. Worldwide trend of atmospheric mercury since 1977. Geophys. Res. Lett. 2003, 30, 1515. [Google Scholar] [CrossRef]
- Sather, M.E.; Mukerjee, S.; Smith, L.; Mathew, J.; Jackson, C.; Flournoy, M. Gaseous oxidized mercury dry deposition measurements in the Four Corners area USA, after large power plant mercury emission reductions. Atmos. Pollut. Res. 2021, 12, 48–158. [Google Scholar] [CrossRef]
- Skov, H.; Sorenson, B.T.; Landis, M.S.; Johnson, M.S.; Sacco, P.; Goodsite, M.E.; Lohsen, C.; Christiansen, K.S. Performance of a new diffusive sampler of HgO determination in the troposphere. Environ. Chem. 2007, 4, 75–80. [Google Scholar] [CrossRef]
- Schroeder, W.H.; Munthe, J. Atmospheric mercury—An overview. Atmos. Environ. 1998, 32, 809–822. [Google Scholar] [CrossRef]
- Lin, C.-J.; Shetty, S.K.; Pan, L.; Pongprueksa, P.; Jang, C.; Chu, H.-W. Source attribution for mercury deposition in the contiguous United States: Regional difference and season variation. J. Air Waste. Manag. Assoc. 2012, 62, 52–63. [Google Scholar] [CrossRef] [PubMed]
- Lyman, S.N.; Cheng, I.; Gratz, L.E.; Weiss-Penzias, P.; Zhang, L. An updated review of atmospheric mercury. Sci. Total Environ. 2019, 707, 135575. [Google Scholar] [CrossRef] [PubMed]
- Zhang, L.; Wright, L.P.; Blanchard, P. A review of current knowledge concerning dry deposition of atmospheric mercury. Atmos. Environ. 2009, 43, 5853–5864. [Google Scholar] [CrossRef]
- Mason, R.P.; Fitzgerald, W.F.; Morel, F.M. The biogeochemical cycling of elemental mercury: Anthropogenic influences. Geochem. Cosmochim. Acta 1994, 58, 3191–3198. [Google Scholar] [CrossRef]
- Selin, N.E.; Jacob, D.J.; Park, R.J.; Yantosca, R.M.; Strode, S.; Jaegle, L.; Jaffe, D. Chemical cycling and deposition of atmospheric mercury: Global constraints from observations. J. Geophys. Res. Atmos. 2007, 112, D02308. [Google Scholar] [CrossRef]
- Gustin, M.S.; Lindberg, S.E.; Weisberg, P.J. An update on the natural sources and sinks of atmospheric mercury. Appl. Geochem. 2008, 23, 482–493. [Google Scholar] [CrossRef]
- Ariya, P.A.; Peterson, K.; Snider, G.; Amyot, M. Mercury chemical transformations in the gas, aqueous and heterogeneous phases: State-of-the-art science and uncertainties. In Mercury Fate and Transport in the Global Atmosphere; Mason, R., Pirrone, N., Eds.; Springer Science + Business Media: New York, NY, USA, 2009. [Google Scholar]
- Amos, H.M.; Jacob, D.J.; Holmes, C.D.; Fisher, J.A.; Wang, Q.; Yantosca, R.M.; Corbitt, E.S.; Galarneau, E.; Rutter, A.P.; Gustin, M.S.; et al. Gas-particle partitioning of atmospheric Hg(II) and its effect on global mercury deposition. Atmos. Chem. Phys. 2012, 12, 591–603. [Google Scholar] [CrossRef]
- Gustin, M.S. Exchange of mercury between the atmosphere and terrestrial ecosystems. In Environmental Chemistry and Toxicology of Mercury; Liu, G., Cai, Y., O’Driscoll, N., Eds.; John Wiley and Sons: New York, NY, USA, 2012; pp. 423–454. [Google Scholar]
- Engstrom, D.R.; Fitzgerald, W.F.; Cooke, C.A.; Lamborg, C.H.; Drevnick, P.E.; Swain, E.B.; Balogh, S.J.; Balcom, P.H. Atmospheric Hg emissions from preindustrial gold and silver extraction in the America: A reevaluation from lake sediment archives. Environ. Sci. Technol. 2014, 48, 6533–6543. [Google Scholar] [CrossRef]
- Swartzendruber, P.; Jaffe, D. Sources and transport: A global issue. In Mercury in the Environment; Bank, M.S., Ed.; University of California Press: Berkley, CA, USA, 2012; Chapter 1; pp. 3–18. [Google Scholar]
- Enrico, M.; Le Roux, G.; Heimbürger-Boavida, L.-E.; Van Beek, L.; Souhaut, M.; Chmeleff, J.; Sonke, J.E. Holocene atmospheric mercury levels reconstructed from peat bog mercury stable isotopes. Environ. Sci. Technol. 2017, 51, 5899–5906. [Google Scholar] [CrossRef]
- Gochfeld, G. Cases of mercury exposure, bioavailability, and adsorption. Ecotoxicol. Environ. Saf. 2003, 56, 174–179. [Google Scholar] [CrossRef]
- Chary, N.S.; Kamala, C.T.; Raj, D.S.S. Assessing risk of heavy metals from consuming food grown on sewage-irrigated soil and food chain transfer. Ecotoxicol. Environ. Saf. 2008, 69, 513–524. [Google Scholar] [CrossRef] [PubMed]
- El-Kady, A.A.; Adbel-Wahhab, M.A. Occurrence of trace metals in foodstuffs and their health impact. Trends Food Sci. Technol. 2018, 75, 36–45. [Google Scholar] [CrossRef]
- Nelson, N.; Byerly, J.C.; Kolbe, A.C.; Kurland, L.T.; Shapiro, S.I.; Stickel, W.H.; Thompson, J.E.; Van der Berg, L.A.; Weissler, A. Hazards of mercury: Special report to the secretary’s advisory committee, department of health, education, and welfare, November, 1970. Environ. Res. 1971, 4, 1–60. [Google Scholar]
- Lambert, K.F.; Evers, D.C.; Warner, K.A.; King, S.L.; Selin, N.E. Integrating mercury science and policy in the marine context: Challenges and opportunities. Environ. Res. 2012, 119, 132–142. [Google Scholar] [CrossRef]
- U.S. Environmental Protection Agency (USEPA). Guidelines for Eating Fish that Contain Mercury; U.S. Environmental Protection Agency: Washington, DC, USA, 2023. Available online: https://www.epa.gov/mercury/guidelines-eating-fish-contain-mercury (accessed on 1 March 2023).
- Ruckelshaus, W.D. Reasons underlying the registration decisions concerning products containing DDT, 2,4,5-T, Aldrin, and Dieldrin. Press release 18 March. 1971.
- U.S. Environmental Protection Agency (USEPA). Mercurial Pesticides, Man and the Environment; U.S. Environmental Protection Agency: Washington, DC, USA, 1971; 109p.
- U.S. Environmental Protection Agency (USEPA). Mercury Study Report to Congress, Volume VI. An Ecological Assessment for Anthropogenic Mercury Emissions in the United States; EPA-452/R-97-008; U.S. Environmental Protection Agency: Washington, DC, USA, 1997. Available online: https://www.epa.gov/mercury/mercury-study-report-congress (accessed on 28 August 2022).
- U.S. Environmental Protection Agency (USEPA). 1999 National Emissions Inventory (NEI) Version 3 IDA Files; U.S. Environmental Protection Agency: Washington, DC, USA, 2004. Available online: https://gaftp.epa.gov/air/nei/nei_criteria_summaries/1999criteriasummaryfiles/ (accessed on 20 September 2023).
- U.S. Environmental Protection Agency (USEPA). Mercury (HG) Emission Inventory for the Clean Air Mercury Rule (CAMR); U.S. Environmental Agency: Washington, DC, USA, 2004. Available online: http://www.epa.gov/ttn/chief/emch/invent/hg_smoke/2001camr_112204.zipS (accessed on 20 September 2023).
- U.S. Environmental Protection Agency (USEPA). Technical Support Document for the Final Clean Air Mercury Rule: Air Quality Modeling. US Environmental Protection Agency Office of Air Quality Planning and Standards. U.S. Environmental Protection Agency, Research Triangle Park, NC 27711, March 2005, USA. Available online: http://www.epa.gov/ttn/atw/utility/aqm_oar-2002-0056-6130.pdfS (accessed on 20 September 2023).
- U.S. Environmental Protection Agency (USEPA). Mercury Deposition in the US Environmental Protection Agency Clean Air Mercury Rule, Charts and Tables; U.S. Environmental Protection Agency: Washington, DC, USA, 2006. Available online: http://www.epa.gov/air/mercuryrule/charts.htmS (accessed on 20 September 2023).
- U.S. Environmental Protection Agency (USEPA). Health Effects of Exposures to Mercury; U.S. Environmental Protection Agency: Washington, DC, USA, 2013. Available online: http://www.epa.gov/mercury/health-effects-exposures-mercury (accessed on 20 September 2023).
- U.S. Environmental Protection Agency (USEPA). Mercury Inventory Report; U.S. Environmental Protection Agency: Washington DC, USA, 2020. Available online: https://www.epa.gov/mercury/2020-mercury-inventory-report (accessed on 20 September 2023).
- Krabbenhoft, D.P.; Sunderland, E.M. Environmental science. Global change and mercury. Science 2013, 341, 1457–1458. [Google Scholar] [CrossRef]
- Sun, Y. Transnational public-private partnerships as learning facilitators: Global governance of mercury. Glob. Environ. Polit. 2017, 17, 21–44. [Google Scholar] [CrossRef]
- You, M. Interpretation of the source-specific substantive control measures of the Minamata Convention on Mercury. Environ. Int. 2015, 75, 1–10. [Google Scholar] [CrossRef]
- Pollman, C.D.; Engstrom, D.R. Legacy mercury. In Mercury and the Everglades. A Synthesis and Model for Complex Ecosystem Restoration: Volume III—Temporal Trends of Mercury in the Everglades, Synthesis and Management Implications; Pollman, C.D., Axelrad, D.M., Rumbold, D.G., Eds.; Springer: Cham, Switzerland, 2020. [Google Scholar]
- Pollman, C.D.; Engstrom, D.R. Trends in atmospheric deposition of mercury. In Mercury and the Everglades. A Syntheis and Model for Complex Ecosystem Restoration: Volume III—Temporal Trends of Mercury in the Everglades, Synthesis sand Management Implications; Pollman, C.D., Axelrad, D.M., Rumbold, D.G., Eds.; Springer: Cham, Switzerland, 2020; Chapter 1; pp. 1–26. [Google Scholar]
- Martinez-Cortizas, A.; Pontevevedra-Pombal, X.; Garcia-Rodeja, E.; Novoa-Munoz, J.C.; Shotyk, W. Mercury in a Spanish peat bog: Archive of climate change and atmospheric mercury deposition. Science 1999, 284, 939–942. [Google Scholar] [CrossRef]
- Bindler, R. Estimating the natural background atmospheric deposition rate of mercury utilizing ombrotrophic bogs in northern Sweden. Environ. Sci. Technol. 2003, 37, 40–46. [Google Scholar] [CrossRef]
- Roos-Barraclough, F.; Shotyk, W. Millennial-scale records of atmospheric mercury deposition obtained from ombrotrophic and minerotrophic peatlands in the Swiss Jura Mountains. Environ. Sci. Technol. 2003, 37, 235–244. [Google Scholar] [CrossRef]
- Le Roux, G.; De Vleeschouwer, F. Preparation of peat samples for inorganic geochemistry used as paleoenvironmental proxies. Mires Peat 2011, 7, 1–9. [Google Scholar]
- Guentzel, J.L.; Landing, W.M.; Gill, G.A.; Pollman, C.D. Atmospheric deposition of mercury in Florida: The FAMS project. Water Air Soil Pollut. 1995, 80, 393–402. [Google Scholar] [CrossRef]
- Gill, G.A.; Guentzel, J.L.; Landing, W.D.; Pollman, C.D. Total gaseous mercury measurements in Florida: The FAMS project (1992–1994). Water Air Soil Pollut. 1995, 80, 235–244. [Google Scholar] [CrossRef]
- Pollman, C.; Gill, G.; Landing, W.; Guentzel, J.; Bare, D.; Porcella, D.; Zillioux, E.; Atkeson, T. Overview of the Florida Atmospheric Mercury Study (FAMS). Water Air Soil Pollut. 1995, 80, 285–290. [Google Scholar] [CrossRef]
- Clever, H.L.; Johnson, S.A.; Derrick, M.E. The solubility of mercury and some sparingly soluble mercury salts in water and aqueous electrolyte solutions. J. Phys. Chem. Ref. Data 1985, 14, 631. [Google Scholar] [CrossRef]
- Fitzgerald, W.F.; Lamborg, C.H.; Hammerschmidt, C.R. Marine biogeochemical cycling of mercury. Chem. Rev. 2007, 107, 641–662. [Google Scholar] [CrossRef] [PubMed]
- Chen, C.; Amirbahman, A.; Fisher, N.; Harding, G.; Lamborg, C.; Nacci, D.; Taylor, D. Methylmercury in marine ecosystems: Spatial patterns and processes of production, bioacummulation and biomagnification. Ecohealth 2008, 5, 399–408. [Google Scholar] [CrossRef] [PubMed]
- National Research Council. Toxiological Effects of Methylmercury; National Academies Press: Washington, DC, USA, 2000. [Google Scholar] [CrossRef]
- Lyman, S.N.; Jaffe, D.A. Formation and fate of oxidized mercury in the upper troposphere and lower stratosphere. Nat. Geosci. 2012, 5, 114–117. [Google Scholar] [CrossRef]
- Travnikov, O.; Angot, H.; Artaxo, P.; Bencardino, M.; Bieser, J.; D’Amore, F.; Dastoor, A.; De Simone, F.; del Carmen Diéguez, M.; Dommergue, A.; et al. Multi-model study of mercury dispersion in the atmosphere: Atmospheric processes and model evaluation. Atmos. Chem. Phys. 2017, 17, 5271–5295. [Google Scholar] [CrossRef]
- Slemr, F.; Weigelt, A.; Ebinghaus, R.; Bieser, J.; Brenninkmeijer, C.A.M.; Rauthe-Schöch, A.; Hermann, M.; Martinsson, B.G.; van Velthoven, P.; Bönisch, H.; et al. Mercury distribution in the upper troposphere and lowermost stratosphere according to measurements by the IAGOS-CARIBIC observatory: 2014–2016. Atmos. Chem. Phys. 2018, 18, 12329–12343. [Google Scholar] [CrossRef]
- Amyot, M.; Gill, G.A.; Morel, F.M.M. Production and loss of dissolved gaseous mercury in coastal seawater. Environ. Sci. Technol. 1997, 31, 3606–3611. [Google Scholar] [CrossRef]
- Qureshi, A.; O’Driscoll, N.J.; MacLeod, M.; Neuhold, Y.M.; Hungerbuhler, K. Photoreactions of mercury in surface oceanwater: Gross reaction kinetics and possible pathways. Environ. Sci. Technol. 2010, 44, 644–649. [Google Scholar] [CrossRef] [PubMed]
- Siciliano, S.D.; O’Driscoll, N.J.; Lean, D.R.S. Microbial reduction and oxidation of mercury in freshwater lakes. Environ. Sci. Technol. 2002, 36, 3064–3068. [Google Scholar] [CrossRef] [PubMed]
- Feng, S.; Ai, Z.; Zheng, S.; Gu, B.; Li, Y. Effects of dryout and inflow water quality on mercury methylation in a constructed wetland. Water Air Soil Pollut. 2014, 225, 1929. [Google Scholar] [CrossRef]
- Rudd, J.W.M. Sources of methyl mercury to freshwater ecosystems: A review. Water Air Soil Pollut. 1995, 80, 697–713. [Google Scholar] [CrossRef]
- Matilainen, T.; Verta, M.; Korhonen, H.; UUsi-Rauva, A.; Niemi, M. Behavior of mercury in soil profiles: Impact of increased precipitation, acidity, and fertilization on mercury methylation. Water Air Soil Pollut. 2001, 125, 105–119. [Google Scholar] [CrossRef]
- Gu, B.; Bian, Y.; Miller, C.L.; Dong, W.; Jiang, X.; Liang, L. Mercury reduction and complexation by natural organic matter in anoxic environments. Proc. Nat. Acad. Sci. USA 2011, 108, 1479–1483. [Google Scholar] [CrossRef]
- Zheng, W.; Liang, L.; Gu, B. Mercury reduction and oxidation by reduced natural organic matter in anoxic environments. Environ. Sci. Technol. 2012, 46, 292–299. [Google Scholar] [CrossRef]
- Zheng, W.; Lin, H.; Mann, B.F.; Liang, L.; Gu, B. Oxidation of dissolved elemental mercury by thiol compounds under anoxic conditions. Environ. Sci. Technol. 2013, 47, 12827–12834. [Google Scholar] [CrossRef]
- Zhou, X.-Q.; Qu, X.-M.; Yang, Z.; Zhao, J.; Hao, Y.-Y.; Feng, J.; Huang, Q.; Liu, Y.-R. Increased water inputs fuel microbial mercury methylation in upland soils. J. Hazard. Mater. 2022, 439, 129578. [Google Scholar] [CrossRef]
- Fleischer, M. Summary of the literature on inorganic chemistry geochemistry of mercury. In Mercury in the Environment; U.S. Geological Survey Professional Paper 713; U.S. Geological Survey: Washington, DC, USA, 1970; pp. 6–13. [Google Scholar]
- Rytuba, J.J. Mercury from mineral deposits and potential environmental impact. Environ. Earth Sci. 2003, 43, 326–338. [Google Scholar] [CrossRef]
- U.S. Geological Survey (USGS). Mercury in the Environment; U.S. Geological Survey Professional Paper 713; U.S. Geological Survey: Washington, DC, USA, 1970.
- Stock, A.; Friedrich, C. Die Verbreitung des Quecksilbers. Naturwissenschaften 1934, 22, 390–393. [Google Scholar] [CrossRef]
- Heide, F.; Lerz, H.; Böhm, G. Lead and mercury content of water from the Saale River. Naturwissenshaften 1957, 44, 441–442. [Google Scholar] [CrossRef]
- Ozernova, N.A.; Aidinyan, N.K. Distribution of mercury in sedimentary rocks. Litol. I Polezn. Iskop. 1966, 3, 49–57. [Google Scholar]
- Abuev, D.V.; Divakov, K.S.; Rad’ko, V.I. Mercury in some neo-intrusives of the area of Caucasus mineral springs. Geol. Rudn. Mestorozhd. 1965, 7, 101–103. (In Russian) [Google Scholar]
- Bulkin, G.A. The geochemistry of mercury in the Crimean highlands. Geokhimiya 1962, 1219–1230. [Google Scholar]
- Karasik, M.A.; Goncharov, Y.I. Mercury in the Lower Permian sediments of the Donets Basin. Akad. Nauk SSSR Doklady 1963, 150, 898–901. (In Russian) [Google Scholar]
- Nikiforov, N.A.; Aidin’yan, N.K.; Kusevich. The content of mercury in Paeozoic sedimentary rocks of southern Ferglana. Akad. Nauk SSSR Inst. Geol. Redn. Mestorozhd. Petrog. Mineral. Geokhim. Ocherki Geockhim. Endogenn. Gpergenn Protsessov 1966, 294–296. (In Russian) [Google Scholar]
- Nekrasov, I.Y.; Timofeeva, M.A. Mercury in rocks and minerals of northwestern Yakutia. Akad. Nauk SSSR Ser. Geol. 1963, 16, 23–38. (In Russian) [Google Scholar]
- Aidin’yan, N.K.; Troitskii, A.I.; Balavakaya, G.A. Distribution of mercury in various soils of the U.S.S.R. and Vietnam. Geokhimiya 1964, 654, 659. (In Russian) [Google Scholar]
- Sahayam, J.D.; Chandrasekar, N.; Kumar, S.K.; Rajamanickam, G.V. Distribution of arsenic and mercury in subtrophical coastal beachrock, Gulf of Mannar, India. J Earth Syst. Sci. 2010, 119, 129–135. [Google Scholar] [CrossRef]
- MacDonald, J.H.; Missimer, T.M.; Rotz, R.; Chou, J.; Molina, R.; Kassis, Z.R.; Morejon, S.; Waldrop, R. Geochemical Analysis of a Continuous Core, Lake Okeechobee Watershed Restoration Project Aquifer Storage and Recovery Wells: Phase 1. Analysis of L-63N Core and Refinement of Methodology; Report from Florida Coast University to the South Florida Water Management District; Geological Society of America: Boulder, CO, USA, 2022. [Google Scholar]
- MacDonald, J.H.; Missimer, T.M.; Rotz, R.; Chou, J.; Molina, R.; Kassis, Z.R.; Morejon, S.; Waldrop, R. Geochemical Analysis of a Continuous Core: Lake Okeechobee Water Restoration Project Aquifer Storage and Recovery Well L63N, Florida, USA. In Proceedings of the 135th Annual Meeting, Denver, CO, USA, 6–9 January 2022; Geological Society of America: Boulder, CO, USA, 2022; Volume 54. [Google Scholar] [CrossRef]
- Marsik, F.J.; Keeler, G.J.; Landis, M.S. The dry-deposition of speciated mercury to the Florida Everglades: Measurements and modeling. Atmos. Environ. 2007, 41, 136–149. [Google Scholar] [CrossRef]
- Rood, B.E.; Gottgens, J.F.; Delfino, J.J.; Earle, C.D.; Crisman, T.L. Mercury accumulation trends in Florida Everglades and savannas marsh flooded soils. Water Air Soil Pollut. 1995, 80, 981–990. [Google Scholar] [CrossRef]
- Arfstrom, C.; Macfarlane, A.W.; Jones, R.D. Distributions of mercury and phosphorus in everglades soils from water conservation area 3A, Florida, USA. Water Air Soil Pollut. 2000, 121, 133–159. [Google Scholar] [CrossRef]
- Benoit, J.; Mason, R.P.; Gilmour, C.C.; Aiken, G.R. Constants for mercury binding dissolved organic matter isolates from the Florida Everglades. Geochim. Cosmochim. Acta 2001, 65, 4445–4451. [Google Scholar] [CrossRef]
- Drexel, R.T.; Haitzer, M.; Ryan, J.N.; Aiken, G.R.; Nagy, K. Mercury (II) sorption to two Florida Everglades peats: Evidence for strong and weak binding and competition by dissolved organic matter released from the peat. Environ. Sci. Technol. 2002, 36, 4058–4064. [Google Scholar] [CrossRef] [PubMed]
- Cohen, M.J.; Lamsal, S.; Osborne, T.Z.; Bonzongo, J.C.; Reddy, K.R.; Newman, S. Soil total mercury concentrations across the greater Everglades. Soil Sci. Soc. Am. J. 2009, 73, 675–685. [Google Scholar] [CrossRef]
- Rumbold, D.G.; Fink, L.E. Extreme spatial variability and unprecedented methylmercury concentrations within a constructed wetland. Environ. Monit. Assess. 2006, 112, 115–135. [Google Scholar] [CrossRef]
- Craft, C.B.; Richardson, C.J. Soil characteristics of the Everglades peatland. In The Everglades Experiments: Lessons for Ecosystem Restoration; Richardson, C.J., Ed.; Springer: New York, NY, USA, 2008; pp. 59–73. [Google Scholar]
- McDowell, L.L.; Stephens, J.C.; Stewart, E.H. Radiocarbon chronology of the Florida Everglades peat. Soil Sci. Soc. Am. Proc. 1969, 33, 743–745. [Google Scholar] [CrossRef]
- Gleason, P.J.; Cohen, A.D.; Brooks, R.K.; Stone, P.; Goodrick, R.; Smith, W.G.; Spackman, W., Jr. The environmental significance of Holocene sediments from the Everglades and saline tidal plain. In Environments of South Florida: Present and Past II; Gleason, P.J., Ed.; Miami Geological Society: Coral Gables, FL, USA, 1984; pp. 297–351. [Google Scholar]
- Gleason, P.J.; Stone, P. Age, origin and landscape evolution of the Everglades peatland. In Everglades: The Ecosystem and Its Restoration; Davis, S.M., Ogden, J.C., Park, W.A., Eds.; St. Lucie Press: Delray Beach, FL, USA, 1994; pp. 149–197. [Google Scholar]
- Glaser, P.H.; Volin, J.C.; Givnish, T.J.; Hansen, B.C.S.; Stricker, C.A. Carbon and sediment accumulation in the Everglades (USA) during the past 4000 years: Rates, drivers, and sources of error. J. Geophys. Res. 2012, 117, G03026. [Google Scholar] [CrossRef]
- Dekker, S.C.; de Boer, H.L.; Dermody, B.J.; Wagner-Cremer, F.; Wassen, M.J.; Eppings, M.B. Holocene peatland initiation in the Greater Everglades. J. Geophys. Res. Biogeosci. 2015, 120, 254–269. [Google Scholar] [CrossRef]
- Streets, D.G.; Horowitz, H.M.; Lu, Z.; Levin, L.; Thackray, C.P.; Sunderland, E.M. Five hundred years of anthropogenic mercury: Spatial and temporal release profiles. Environ. Res. Lett. 2019, 14, 084004. [Google Scholar] [CrossRef]
- Streets, D.G.; Horowitz, H.M.; Lu, Z.; Levin, L.; Thackray, C.P.; Sunderland, E.M. Global and regional trends in mercury emissions and concentrations, 2010–2015. Atmos. Environ. 2019, 201, 417–427. [Google Scholar] [CrossRef]
- Huneeus, N.; Schulz, M.; Balkanski, Y.; Griesfeller, J.; Prospero, J.; Kinne, S.; Bauer, S.; Boucher, O.; Chin, M.; Dentener, F.; et al. Global dust model intercomparison in AeroCom phase 1. Atmos. Chem. Phys. 2011, 11, 7781–7816. [Google Scholar] [CrossRef]
- Shinn, E.A. African Dust Causes Widespread Environmental Disease; U.S. Geological Survey Open-File Report 1-246; U.S. Geological Survey: St. Petersburg, FL, USA, 2001; p. 5.
- Bailey, N. Saharan Dust as a mercury vector. Unpublished. Master of Science Thesis, Department of Environment and Geography, University of Manitoba, Winnipeg, MB, Canada, 2021. [Google Scholar]
- National Aeronautics and Space Administration (NASA). NASA GOES Satellite Image of a Dust Plume Extending across the Atlantic Ocean. 28 June 2018. Available online: https://earthobservatory.nasa.gov/images/92358/here-comes-the-saharan-dust (accessed on 30 January 2023).
- Evans, A.T.; Flamant, C.; Gaetani, M.; Guichard, F. The past, present and future of African dust. Nature 2016, 531, 493–495. [Google Scholar] [CrossRef] [PubMed]
- Mason, R.P. Mercury emission from natural processes and their importance in the global mercury cycle. In Mercury Fate and Transport in the Global Atmosphere; Pirrone, N., Mason, R.P., Eds.; Springer Science + Business Media: New York, NY, USA, 2009; pp. 173–191. [Google Scholar]
- Chen, M.; Ma, L.O.; Harris, W.G. Baseline concentrations of 15 trace elements in Florida surface soils. J. Water Qual. 1999, 28, 11731181. [Google Scholar] [CrossRef]
- Ramirez, C.E.; Quinete, N.; de Astudillo, L.R.; Arroyo-Mora, L.F.; Seba, D.; Gardinali, P. Elemental composition of airborne particular matter from coastal South Florida are influenced by African dust events. Aeolian Res. 2022, 54, 100774. [Google Scholar] [CrossRef]
- Engstrom, D.R.; Pollman, C.D.; Fitzgerald, W.F.; Balcom, P.H. Evaluation of Recent Trend in Atmospheric Mercury Deposition in South Florida from Lake Sediment Records; Final Research Report; Florida Department of Environmental Protection: Tallahassee, FL, USA, 2003.
- Lamborg, C.H.; Engstrom, D.R.; Fitzgerald, W.F.; Balcom, P.H. Apportioning global and non-global components of mercury deposition through 210Pb indexing. Sci. Total Environ. 2013, 448, 132–140. [Google Scholar] [CrossRef]
- Kang, W.J.; Trefry, J.H.; Nielson, T.A.; Wanless, H.R. Direct atmospheric input versus runoff fluxes of mercury into the lower Everglades and Florida Bay. Environ. Sci. Technol. 2000, 34, 408–4063. [Google Scholar] [CrossRef]
- Rumboldt, D.G.; Evans, D.W.; Niemczyk, S.; Fink, L.E.; Laine, K.A.; Howard, N.; Krabbenhoft, D.P.; Zucker, M. Source identificationod Florida Bay’s methylmercury problem: Mainland runoff verses atmospheric deposition. Estuaries Coasts 2011, 34, 494–513. [Google Scholar] [CrossRef]
- Dvonch, J.T.; Graney, J.R.; Keeler, G.J.; Stevens, R.K. Use of elemental tracers to source apportion mercury in South Florida precipitation. Environ. Sci. Technol. 1999, 24, 4522–4527. [Google Scholar] [CrossRef]
- Sunderland, E.M.; Mason, R.P. Human impacts to open ocean mercury concentrations. Glob. Biogeochem. Cycles 2007, 21, GB4022. [Google Scholar] [CrossRef]
- Kuss, J.; Zülicke, C.; Pohl, C.; Schneider, B. Atlantic mercury emission determined from continuous analysis of the elemental mercury sea-air concentration difference within transects between 50° N and 50° S. Glob. Biogeochem. Cycles 2011, 25, GB3021. [Google Scholar] [CrossRef]
- Liu, G.Y.; Cai, P.; Calla, D.; Scheidt, J.; Richards, L.J.; Scinto, E.; Gaiser, E.; Appleby, C. Mercury mass budget estimates and cycling seasonality in the Florida Everglades. Environ. Sci. Technol. 2008, 42, 1954–1960. [Google Scholar] [CrossRef] [PubMed]
- Aich, S.; McVoy, C.W.; Dreschel, T.W.; Santamaria, F. Estimating soil subsidence and carbon loss in the Everglades Agricultural Area, Florida using geospatial techniques. Agric. Ecosyst. Environ. 2013, 171, 124–133. [Google Scholar] [CrossRef]
- Mathews, S.L.; McCracken, I.R.; Lonergan, G. Mercury contamination on golf courses due to pesticide use. Environ. Contam. Toxicol. 1993, 55, 390–397. [Google Scholar] [CrossRef]
- Lewis, M.A.; Quarles, R.L.; Dantin, D.D.; Moore, J.C. Evaluation of a Florida coastal golf courses a local and watershed source of bioavailable contaminants. Mar. Pollut. Bull. 2004, 48, 254–262. [Google Scholar] [CrossRef]
- Milar, M. Characterisation of secondary metal-bearing phases used in dental amalgam and assessment of gastric solubility. Environ. Geochem. Health 2017, 39, 1607–1619. [Google Scholar] [CrossRef]
- Muresan, B.; Liu, Y.; Gac, Y.L.; Lumière, L.; Cerezo, V. In-line measurement of exhaust mercury emissions by an instrumented light-duty vehicle using both on-road and test track experiments. Sci. Total Environ. 2022, 805, 150265. [Google Scholar] [CrossRef]
- U.S. Environmental Protection Agency (USEPA). Final Mercury and Air Toxics Standards (MATS) Rule; U.S. Environmental Protection Agency: Washington, DC, USA, 2012. Available online: https://www.epa.gov/mats (accessed on 20 September 2023).
- Xinyu, l.; Zhonggen, L.; Wu, T.; Chen, J.; Fu, C.; Zhang, L.; Feng, X.; Fu, X.; Tang, L.; Wang, Z.; et al. Atmospheric mercury emissions from two pre-calciner cement plants in southwest China. Atmospheric Environment 2019, 199, 177–188. [Google Scholar]
- Zhou, D.; Dai, Y.; Yu, C. China’s Sustainable Energy Scenarios 2002; China Environmental Science Press: Beijing, China, 2003. [Google Scholar]
- Senior, C.; Sarofim, A.; Eddings, E. Behavior and measurement of mercury in cement kilns. In Proceedings of the IEEE-ISA/PCA 5th Cement Industry Technical Conference, Dallas TX, USA, 1–5 May 2003; p. 16. [Google Scholar]
- Senior, C.; Montgomery, C.J.; Sarofim, A. Transient model for behavior of mercury in Portland cement kilns. Ind. Eng. Chem. Res. 2010, 49, 1436–1443. [Google Scholar] [CrossRef]
- U.S. Environmental Protection Agency (USEPA). Impacts Worksheet for 40 CFR Parts 60 and 63 National Emissions Standards for Hazardous Air Pollutants from the Portland Cement Manufacturing Industry. Available online: http://www.epa.gov/ttn/atw/pcem/summary_impacts.pdf (accessed on 16 February 2023).
- Balogh, S.J.; Liang, L. Mercury pathways in municipal wastewater treatment plants. Water Air Soil Pollut. 1995, 80, 1181–1190. [Google Scholar] [CrossRef]
- Bodaly, R.A.; Rudd, J.W.M.; Flett, R.J. Effect of urban sewage treatment on total and methyl mercury concentrations in effluents. Biogeochemistry 1998, 40, 279–291. [Google Scholar] [CrossRef]
- Mukherjee, A.B.; Zevenhoven, R.; Brodersen, J.; Hylander, L.D.; Bhattacharya, P. Mercury in waste in the European Union: Sources, disposal methods and risks. Resour. Conserv. Recycl. 2004, 42, 155–182. [Google Scholar] [CrossRef]
- Balogh, S.J.; Nollet, Y.H. Mercury mass balance at a wastewater treatment plant employing sludge incineration with offgas mercury control. Sci. Total Environ. 2008, 389, 125–131. [Google Scholar] [CrossRef] [PubMed]
- Bravo, A.G.; Bouchet, S.; Guédron, S.; Armouroux, D.; Dominick, J.; Zopfi, J. High methylmercury production under ferruginous conditions in sediments impacted by sewage treatment plant discharges. Water Res. 2015, 80, 245–255. [Google Scholar] [CrossRef] [PubMed]
- Chansler, J.M. The future for effluent reuse. Water Eng. Manag. 1991, 138, 31–34. [Google Scholar]
- Archer, J.E.; Luffman, I.; Joyner, T.A.; Nandi, A. Identifying untapped potential: A geospatial analysis of Florida and California’s 2009 recycled water production. J. Water Reuse Desalinat. 2019, 9, 173–192. [Google Scholar] [CrossRef]
- Godman, R.R.; Kuyk, D.D. A dual water system for Cape Coral. J. Am. Water Work. Assoc. 1997, 89, 45–53. [Google Scholar] [CrossRef]
- Nevondo, V.; Malehase, T.; Daso, A.P.; Okonkwo, O.J. leachate seepage rom landfill: A source of groundwater mercury contamination in South Africa. Water SA 2019, 45, 225. [Google Scholar] [CrossRef]
- Slack, R.; Gronow, J.; Voulvoulis, N. Hazardous components of household waste. Crit. Rev. Environ. Sci. Technol. 2004, 34, 419–445. [Google Scholar] [CrossRef]
- Ward, M.L.; Bitton, G.; Townsend, T. Heavy metal binding capacity (HMBC) of municipal solid waste landfill leachates. Chemosphere 2005, 60, 206–215. [Google Scholar] [CrossRef] [PubMed]
- Reinhart, D.R.; Grosh, C.J. Analysis of Florida MSW Land Leachate Quality; Final Report; Florida Center for Solid and Hazardous Waste Management: Gainesville, FL, USA, 1998. [Google Scholar]
- Friedli, H.R.; Arellano, A.F.; Cinnirella, S.; Pirrone, N. Mercury emissions from global biomass burning: Spatial and temporal distribution. In Mercury Fate and Transport in the Global Atmosphere: Emissions Measurements and Models; Pirrone, N., Mason, R., Eds.; Springer Science + Business Media: New York, NY, USA, 2009; Chapter 8; pp. 193–222. [Google Scholar]
- Greenplate, R.; Thomas, S.; Danly-Thomson, A.; Missimer, T.M. Phytoremediation potential of the coastal plan willow Salix caroliniana for remediation of mercury and other heavy metals. Water 2023, 15, 3628. [Google Scholar] [CrossRef]
- Meng, B.; Li, Y.; Cui, W.; Jiang, P.; Liu, G.; Wang, Y.; Richards, J.; Feng, X.; Cai, Y. Tracing the uptake, transport, and fate of mercury in sawgrass (Cladium jamaicense) in the Florida Everglades using a multi-isotope technique. Environ. Sci. Technol. 2018, 52, 3384–3391. [Google Scholar] [CrossRef]
- Rayment, G.E.; Jeffery, A.J.; Barry, G. A Heavy metals in Australian sugarcane. Commun. Soil Sci. Plant Anal. 2002, 44, 3203–3212. [Google Scholar] [CrossRef]
- Bingham, M.D. Field detection and implications of mercury in natural gas. SPE Prod. Eng. 1990, 5, 120–124. [Google Scholar] [CrossRef]
- Wilhelm, S.M.; Bloom, N.S. Mercury in petroleum. Fuel Process. Technol. 2000, 63, 1–74. [Google Scholar] [CrossRef]
- Wilhelm, S.M.; Liang, L.; Cussen, D.; Kirchgessner, D.A. Mercury in crude oil processed in the United States (2004). Environ. Sci. Technol. 2007, 41, 4509–4514. [Google Scholar] [CrossRef]
- Won, J.H.; Park, J.Y.; Lee, T.G. Mercury emissions from automobiles in gasoline, diesel, and LPG. Atmos. Environ. 2007, 41, 7547–7552. [Google Scholar] [CrossRef]
- Mojammal, A.H.M.; Back, S.-K.; Seo, Y.C.; Kim, J.-H. Mass balance of mercury and behavior in refinery facilities. Atmos. Pollut. Res. 2019, 10, 145–151. [Google Scholar] [CrossRef]
- Gan, Y.; Lu, Z.; Wu, Q.; He, X.; Dai, Q.; Kelly, J.C.; Ankathi, S.K.; Wang, M. Cradle-to-grave mercury emissions of light-duty gasoline and electric vehicles in China. Resour. Conserv. Recycl. 2023, 190, 106736. [Google Scholar] [CrossRef]
- Hoyer, M.; Baldauf, R.W.; Scarbro, C.; Barres, J.; Keeler, G.J. Mercury emissions from motor vehicles. In Proceedings of the 13th International Emissions Inventory Conference, Clearwater, FL, USA, 8–10 June 2007; Available online: http://www.epa.gov/ttn/chief/conference/ei13/toxics/hoyer (accessed on 10 October 2023).
- Duke, L.D.; Mullen, M.N.; Unger, K.E.; Rotz, R.R.; Thomas, S. Flood mitigation: Regulatory and hydrologic effectiveness of multicomponent runoff detention at a Southwest Florida site. J. Am. Water Res. Assoc. 2023, 8, JAWR-22-0118. [Google Scholar] [CrossRef]
- Canfield, D.C.; Thomas, S.; Rotz, R.R.; Missimer, T.M. Stormwater pond evolution and challenges in measuring the hydraulic conductivity of pond sediments. Water 2023, 15, 1122. [Google Scholar] [CrossRef]
- Goeckner, A.H.; Lusk, M.G. 2022. Florida’s urban stormwater ponds are net sources of carbon to the atmosphere despite increased carbon burial over time. Commun. Earth Environ. 2022, 3, 53. [Google Scholar] [CrossRef]
- Lusk, M.G.; Chapman, K. Chemical Fractionation of Sediment Phosphorus in Residential Urban Stormwater Ponds in Florida, USA. Urban Sci. 2021, 5, 81. [Google Scholar] [CrossRef]
- Brooks, J.M.; Stewart, C.J.; Haberstroh, C.J.; Arias, M.E. Characteristics and fate of plastic pollution in urban stormwater ponds. Environ. Pollut. 2023, 320, 121052. [Google Scholar] [CrossRef]
- WSP. City of Naples North Lake and South Lake Feasibility Study; Final Report; Streets and Stormwater Department: Naples, FL, USA, 2023; 63p.
- Thomas, S. Bathymetry and Sediment Characterization of Lake Manor, City of Naples, FL; Final Report; Streets and Stormwater Department: Naples, FL, USA, 2013; 89p.
- Thomas, S. Bathymetry and Sediment Characterization of Spring Lake, City of Naples, FL; Final Report; Streets and Stormwater Department: Naples, FL, USA, 2013; 90p.
- Thomas, S. Sediment Assessment of Lakes 11 and 31 (City of Naples); Final Report; Streets and Stormwater Department: Naples, FL, USA, 2020; 41p.
- Thomas, S. Sediment Assessment of Lake 19 (City of Naples); Final Report; Streets and Stormwater Department: Naples, FL, USA, 2020; 46p.
- Krabbenhoft, D.P.; Wiener, J.G.; Brumbaugh, W.G.; Olson, M.L.; DeWild, J.F.; Sabin, T.J. A national pilot study of mercury contamination of aquatic ecosystems along multiple gradients. In US Geological Survey Toxic Substances Hydrology Program, Proceedings of the Technical Meeting, Charleston, SC, USA, 8–12 March 1999; Morganwalp, D.W., Buxton, H.T., Eds.; USGS: Reston, VA, USA, 1999; pp. 147–160. [Google Scholar]
- Gilmour, C.C.; Krabbenhoft, D.; Orem, W.; Aiken, G.; Roden, E. Appendix 3B-2: Status Report on ACME Studies on the Control of Mercury Methylation and Bioaccumulation in the Everglades. In South Florida Environmental Report—Volume I; South Florida Water Management District: West Palm Beach, FL, USA, 2007. [Google Scholar]
- Pollman, C.D. Modeling Sulfate and Gambusia Mercury Relationships in the Everglades—Final Report; Florida Department of Environmental Protection: Tallahassee, FL, USA, 2012.
- Tai, C.; Li, Y.; Yin, Y.; Scinto, L.J.; Jiang, G.; Cai, Y. Methylmercury photodegradation in surface water of the Florida Everglades: Importance of dissolved organic matter-methyl Hg complexation. Environ. Sci. Technol. 2014, 48, 7333–7340. [Google Scholar] [CrossRef]
- Lange, T.; Rumbold, D.G.; Frederick, P.C.; Cunningham, M.; Pollman, C.D. Temporal changes in mercury concentration in Everglades biota. In Mercury and the Everglades. A Synthesis and Model for Complex Ecosystem Restoration; Pollman, C.D., Axelrad, D.M., Rumbold, D.G., Eds.; Springer: Cham, Switzerland, 2020; Chapter 2; pp. 27–50. [Google Scholar]
- Graney, J.R.; Dvonch, J.T.; Keeler, G.J. Use of multi-element tracers to source apportion mercury in south Florida aerosols. Atmos. Environ. 2004, 38, 1715–1736. [Google Scholar] [CrossRef]
- National Atmospheric Deposition Program. National Atmospheric Deposition Program 2021 Annual Summary; Wisconsin State Laboratory of Hygiene, University of Wisconsin–Madison: Madison, WI, USA, 2021. [Google Scholar]
- Guentzel, J.L.; Landing, W.D.; Gill, G.A.; Pollman, C.D. Mercury and major ions in rainfall, throughfall, and foliage from the Florida Everglades. Sci. Total Environ. 1998, 213, 43–51. [Google Scholar] [CrossRef]
- Dvonch, J.G.; Keeler, G.J.; Marsik, F.J. The influence of meteorological conditions on the wet deposition of mercury in southern Florida. J. Appl. Meteorol. Climatol. 2005, 44, 1421–1435. [Google Scholar] [CrossRef]
- Peterson, C.; Alishahi, M.; Gustin, M.S. Testing the use of passive sampling systems for understanding air mercury concentrations and dry deposition across Florida, USA. Sci. Total Environ. 2012, 424, 297–309. [Google Scholar] [CrossRef] [PubMed]
- He, M.; Tian, L.; Braaten, H.F.V.; Wu, Q.; Luo, J.; Cai, L.-M.; Meng, J.-H.; Lin, Y. Mercury-organic matter interaction in soils and sediments: Angel or devil? Bull. Environ. Contam. Toxicol. 2019, 12, 621–627. [Google Scholar] [CrossRef] [PubMed]
- Faulkner, S.P.; do la Cruz, A.A. Nutrient mobilization following winter fires in an irregularly flooded marsh. J. Environ. Qual. 1982, 11, 129–133. [Google Scholar] [CrossRef]
- Smith, S.M.; Newman, S.; Garrett, P.B.; Leeds, J.A. Differential effects of surface and peat fire on soil constituents in a degraded wetland of the northern Everglades. J. Environ. Qual. 2001, 30, 1998–2005. [Google Scholar] [CrossRef] [PubMed]
- Flower, H.; Rains, M.; Fitz, H.C.; Orem, W.; Newman, S.; Osbourne, T.Z.; Reddy, K.R.; Obeysekera, J. Shifting ground: Landscape-scale modeling of biogeochemical processes under climate change in the Florida Everglades. J. Environ. Manag. 2019, 64, 416–435. [Google Scholar] [CrossRef]
- Alexander, C.R.; Smith, R.G.; Calder, F.D.; Schropp, S.J.; Windom, H.L. The historical records of heavy metal enrichments in two Florida estuaries. Estuaries 1993, 16, 627–637. [Google Scholar] [CrossRef]
- Kannan, K.; Smith, R.G., Jr.; Lee, R.F.; Windom, H.L.; Heitmuller, P.T.; Macauley, J.M.; Summers, J.K. Distribution of total mercury and methyl mercury in water, sediment, and fish from South Florida estuaries. Arch. Environ. Contam. Toxicol. 1998, 34, 109–118. [Google Scholar] [CrossRef]
- United Nations Environment Programme (UNEP). Global Mercury Assessment 2013; United Nations Environment Programme: Geneva, Switzerland, 2013. [Google Scholar]
- Goldwater, L.J. The toxicology of inorganic mercury. Ann. N. Y. Acad. Sci. 1957, 65, 498. [Google Scholar] [CrossRef]
- Battigelli, M.C. Mercury toxicity from industrial exposure—A critical review of the literature. J. Occup. Med. 1969, 2, 337. [Google Scholar] [CrossRef]
- World Health Organization (WHO). Mercury and Health Factsheet; World Health Organization: Geneva, Switzerland, 31 March 2017; Available online: https://www.who.int/news-room/fact-sheets/detail/mercury-and-health (accessed on 1 November 2023).
- Aaseth, J.; Hilt, B.; Bjørklund, G. Mercury exposure and health impacts in dental personnel. Environ. Res. 2018, 164, 65–69. [Google Scholar] [CrossRef]
- Bjørklund, G.; Dadar, M.; Mutter, J.; Aaseth, J. The toxicology of mercury: Current research and emerging trends. Environ. Res. 2017, 159, 545–554. [Google Scholar] [CrossRef] [PubMed]
- Guallar, E.; Sanz-Gallardo, M.I.; van’t Veer, P.; Bode, P.; Aro, A.; Gómez Aracena, J.; Kark, J.D.; Riemersma, R.A.; Martín-Moreno, J.M.; Kok, F.J. Mercury, fish oils, and the risk of myocardial infarction. N. Engl. J. Med. 2002, 347, 1747–1754. [Google Scholar] [CrossRef] [PubMed]
- Henriques, M.C.; Loureiro, S.; Fardilha, M.; Herdeiro, M.T. Exposure to mercury and human reproductive health: A systematic review. Reprod. Toxicol. 2019, 85, 93–103. [Google Scholar] [CrossRef] [PubMed]
- Kim, H.; Lee, J.; Woo, H.D.; Kim, D.W.; Oh, J.H.; Chang, H.J.; Sohn, D.K.; Shin, A.; Kim, J. Dietary mercury intake and colorectal cancer risk: A case-control study. Clin. Nutr. 2020, 39, 2106–2113. [Google Scholar] [CrossRef]
- Tsai, T.L.; Kuo, C.C.; Pan, W.H.; Wu, T.N.; Lin, P.; Wang, S.L. Type 2 diabetes occurrence and mercury exposure—From the National Nutrition and Health Survey in Taiwan. Environ. Int. 2019, 126, 260–267. [Google Scholar] [CrossRef] [PubMed]
- Agency for Toxic Substances and Disease Registry (ATSDR). Toxicological Profile for Mercury. Draft for Public Comment, April 2022; United States Department of Health and Human Services: Washington, DC, USA, 2022.
- Risher, J.F.; Murray, H.E.; Prince, G.R. Organic mercury compounds: Human exposure and its relevance to public health. Toxicol. Ind. Health 2002, 18, 109–160. [Google Scholar] [CrossRef] [PubMed]
- Schaefer, A.M.; Zoffer, M.; Yrastorza, L.; Pearlman, D.M.; Bossart, G.D.; Stoessel, R.; Reif, J.S. Mercury exposure, fish consumption, and perceived risk among pregnant women in coastal Florida. Int. J. Environ. Res. Public Health 2019, 16, 4903. [Google Scholar] [CrossRef]
- Florida Department of Environmental Protection (FDEP). Technical Report: Development of Cleanup Target Levels (CTLs) for Chapter 62-777, F.A.C; Florida Department of Environmental Protection: Tallahassee, FL, USA, 2005. Available online: https://floridadep.gov/waste/district-business-support/documents/technical-report-development-cleanup-target-levels-ctls (accessed on 1 November 2023).
- Florida Department of Environmental Protection (FDEP). Final Report: Mercury TMDL for the State of Florida; Florida Department of Environmental Protection: Tallahassee, FL, USA, 24 October 2013. Available online: https://floridadep.gov/sites/default/files/Mercury-TMDL.pdf. (accessed on 1 November 2023).
- Fitzgerald, W.F.; Clarkson, T.W. Mercury and monomethylmercury: Present and future concerns. Environ. Health Perspect. 1991, 96, 159–166. [Google Scholar] [CrossRef]
- Gabriel, M.C.; Howard, N.; Osbourne, T.Z. Fish mercury and surface water sulfate relationships in the Everglades Protection Are. Environ. Manag. 2014, 53, 583–593. [Google Scholar] [CrossRef]
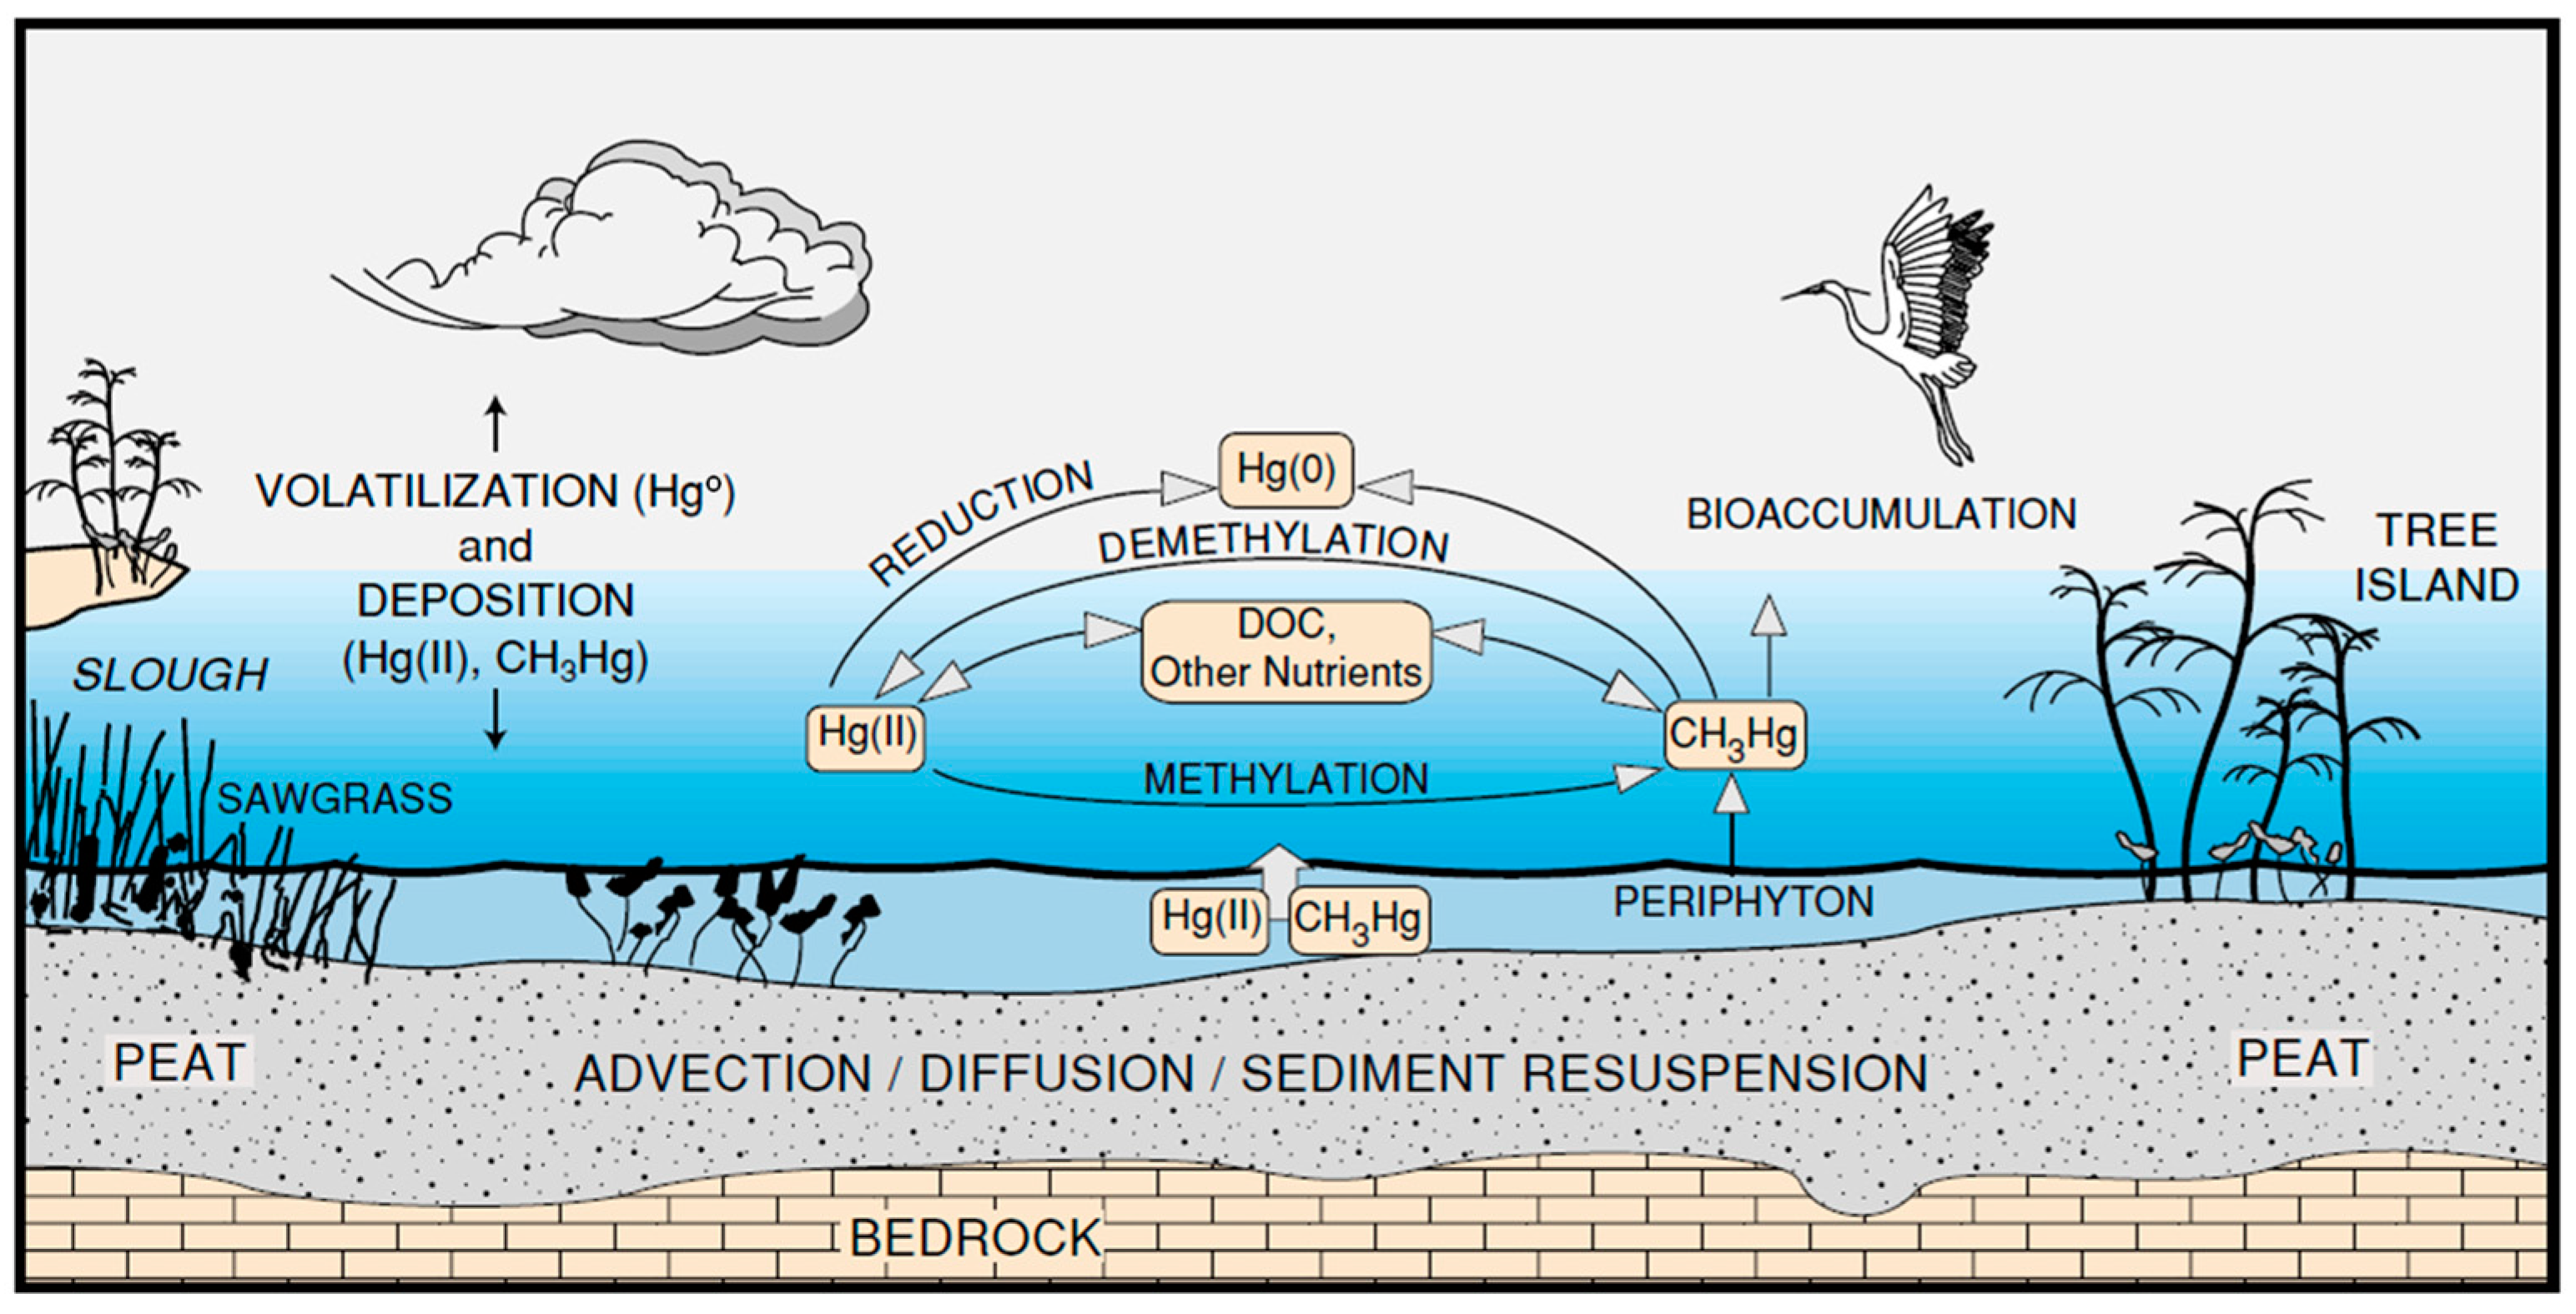
- Branfireun, B.A.; Cosio, C.; Poulain, A.J.; Riise, G.; Bravo, A.G. Mercury cycling in freshwater systems—An updated conceptual model. Sci. Total Environ. 2020, 745, 140906. [Google Scholar] [CrossRef]
- Gu, B.; Axelrod, D.; Lange, T. Chapter 3B: Regional mercury and sulfur monitoring and environmental assessment. In 2012 South Florida environmental report—Volume I; South Florida Water Management District: West Palm Beach, FL, USA, 2012. Available online: https://www.researchgate.net/publication/261993520_Mercury_and_Sulfur_Environmental_Assessment_for_the_Everglades#fullTextFileContent (accessed on 10 September 2022).
- Helmrich, S.; Vlassopoulos, D.; Alpers, C.N.; O’Day, P.A. Critical reciew of mercury methylation and methylmercury deethylation rate constants in aquatic sediments for biochemical modeling. Crit. Rev. Environ. Sci. Technol. 2022, 24, 4353–4378. [Google Scholar] [CrossRef]
- Hand, J.; Friedman, M. Mercury in Largemouth Bass and Water Quality; Florida Department of Environmental Protection: Tallahassee, FL, USA, 1990.
- Beyer, W.N.M.; Spalding, M.; Morrison, D. Mercury concentrations in feathers of wading birds from Florida. AMBIO J. Hum. Environ. 1997, 26, 97–100. [Google Scholar]
- Sepulveda, M.S.; Frederick, P.C.; Spalding, M.G.; Williams, G.E., Jr. Mercury contamination in free-ranging great egret nestlings (Ardea albus) from southern Florida. Environ. Toxicol. Chem. 1999, 18, 985–992. [Google Scholar]
- Roelke, M.; Schultz, D.; Faemire, C.; Sundlof, S.; Royals, H. Mercury Contamination in Florida Panthers; Florida Game and Freshwater Fish Commission: Gainesville, FL, USA, 1991. [Google Scholar]
- Ware, F.; Royals, H.; Lange, T. Mercury contamination in Florida largemouth bass. In Proceedings of the Annual Conference Southeastern Association of Fish and Wildlife Agencies (SEAFWA), Tallahassee, FL, USA, 21–24 October 1990; pp. 5–12. [Google Scholar]
- McPherson, B.F.; Miller, R.L.; Haag, K.H.; Bradner, A. Water Quality in Southern Florida, 1996–1998; U.S. Geological Survey Circular 1207; USGS: Denver, CO, USA, 2000.
- Florida Department of Health (FDOH). Your Guide to Eating Fish Caught in Florida; Florida Department of Health: Tallahassee, FL, USA, 2008. Available online: http://www.doh.state.fl.us/floridafishadvice/ (accessed on 1 September 2022).


| Peat Bog | 8008–1000 CE | 500–1500 CE | 1760–1880 CE | 1971–2001 CE | 2001–2011 CE |
| Pinet | |||||
| HgARtotal | 1.5 ± 1.0 | 1.7 ± 0.1 | 6.3 ± 2.4 | 40 ± 6 | 29 ± 3 |
| HgARdry | 1.1 ±0.4 | 1.22 ± 0.07 | 4.7 ± 1.8 | 36 ± 7 | 24 ± 2 |
| HgARwet | 0.4 ± 0.2 | 0.46 ± 0.02 | 1.8 ± 0.7 | 5.1 ± 2.9 | 4.5 ± 0.9 |
| 800–1500 CE | 1760–1880 CE | 1946–1967 CE | 1990–2011 CE | ||
| Estibere | |||||
| HgARtotal | NA | 2.4 ± 0.5 | 6.0 ± 1.3 | 24 ± 2 | 9.2 ± 3.5 |
| HgARdry | NA | 1.3 ± 0.3 | 3.4 ± 0.8 | 14 ± 1 | 5.2 ± 2.0 |
| HgARwet | NA | 1.1 ± 0.3 | 2.6 ± 0.6 | 11 ± 1 | 4.0 ± 1.5 |
| Property | Number or Description |
|---|---|
| Atomic number | 80 |
| Atomic weight (std) | 200.592 (3) |
| Oxidation states | −2, +1, +2 |
| Atomic radius | 1.51 angstrom |
| Covalent radius | 1.31 ± 0.05 angstrom |
| Van der Waals radius | 1.55 angstrom |
| Electronegativity | Pauling: 2.00 |
| Melting point | 234.3210 K |
| Vapor pressure (std) | 0.00243 atm |
| Heat of fusion | 2.29 kJ/mol |
| Heat of vaporization | 59.11 kJ/mol |
| Molar heat capacity | 27.893 J(mol*K) |
| Location | No. Samples | Min. | Max. | Avg. | Reference |
|---|---|---|---|---|---|
| Unknown location | 1 | - | - | 33 | Stock and Cucuel [120] |
| Germany | 14 | 28 | 220 | 66 | Heide et el. [121] |
| Russian Platform (argillaceous marls) | 19 | 10 | 90 | 31 | Ozerova and Aidin’yan [122] |
| 1 | 10 | 8000 | - | Abuev et al. [123] | |
| Crimean highlands (limestones) | 8 | 100 | 6400 | 2300 | Bulkin [124] |
| Crimean highlands (marls) | 5 | 500 | 5000 | 1000 | Bulkin [124] |
| Donets Basin | 314 | <100 | 10,000 | 900 | Karasik and Goncharov [125] |
| Southern Ferghana (limestones and dolomites) | 22 | 20 | 150 | 75 | Nikiforov et al. [126] |
| Northeast Yakutia | 26 | <2 | 70 | 18 | Nekrasov and Timofeeva [127] |
| Vietnam (marble) | 1 | - | - | 500 | Aidin’yan et al. [128] |
| India (beachrock) | 25 | 0.06 | 0.31 | 0.17 | Sahayam et al. [129] |
| Well No. | Depth Minimum (m bls) | Depth Minimum (m bls) | Formation | County | Hg (μg/kg) Hg-FIMS |
|---|---|---|---|---|---|
| W-17001 | 154.9 | 155.2 | Hawthorn | Highlands | 5 |
| W-17001 | 168.4 | 168.6 | Hawthorn | Highlands | 8 |
| W-17001 | 187.8 | 188.1 | Hawthorn | Highlands | 12 |
| W-17001 | 201.7 | 202.1 | Suwannee | Highlands | BDL |
| W-17001 | 208.2 | 211.3 | Suwannee | Highlands | BDL |
| W-17001 | 210.7 | 211.3 | Suwannee | Highlands | BDL |
| W-17001 | 214.6 | 215.2 | Ocala | Highlands | BDL |
| W-17001 | 218.3 | 218.9 | Ocala | Highlands | 5 |
| W-17001 | 225.3 | 226.8 | Ocala | Highlands | 5 |
| W-17001 | 236.6 | 237.0 | Ocala | Highlands | BDL |
| W-17001 | 247.0 | 247.4 | Ocala | Highlands | BDL |
| W-17001 | 261.3 | 281.9 | Ocala | Highlands | BDL |
| W-17986 | 309.5 | 309.8 | Hawthorn | Palm Beach | 13 |
| W-17986 | 310.7 | 311 | Hawthorn | Palm Beach | 8 |
| W-17986 | 311.6 | 311.9 | Hawthorn | Palm Beach | 11 |
| W-17986 | 318 | 318.3 | Hawthorn | Palm Beach | 145 |
| W-17986 | 318.9 | 319.5 | Hawthorn | Palm Beach | 7 |
| W-17986 | 319.6 | 320.1 | Hawthorn | Palm Beach | 9 |
| W-17986 | 344.5 | 344.8 | Avon Park | Palm Beach | 9 |
| W-17986 | 345.4 | 345.7 | Avon Park | Palm Beach | 6 |
| W-17986 | 352.1 | 352.4 | Avon Park | Palm Beach | 10 |
| W-17986 | 356.7 | 357.0 | Avon Park | Palm Beach | 76 |
| W-18253 | 266.5 | 266.8 | Suwannee | Glades | BDL |
| W-18253 | 267.4 | 267.7 | Suwannee | Glades | 104 |
| W-18253 | 268.6 | 268.9 | Suwannee | Glades | BDL |
| W-18253 | 303.0 | 303.4 | Ocala | Glades | BDL |
| W-18253 | 304.3 | 304.6 | Ocala | Glades | BDL |
| W-18253 | 306.4 | 306.7 | Ocala | Glades | 51 |
| W-18253 | 397.6 | 397.9 | Avon Park | Glades | 33 |
| W-18253 | 399.1 | 399.4 | Avon Park | Glades | 43 |
| W-18253 | 400.6 | 400.9 | Avon Park | Glades | 15 |
| W-18255 | 176.8 | 178.4 | Ocala | Okeechobee | BDL |
| W-18255 | 209.1 | 209.5 | Ocala | Okeechobee | BDL |
| W-18255 | 210.4 | 210.7 | Ocala | Okeechobee | BDL |
| W-18255 | 225.6 | 234.8 | Ocala | Okeechobee | BDL |
| W-18255 | 243.9 | 253 | Ocala | Okeechobee | BDL |
| W-18255 | 260.7 | 269.8 | Avon Park | Okeechobee | 19 |
| W-18256 | 194.5 | 184.7 | Hawthorn | Martin | 23 |
| W-18256 | 196 | 196.2 | Hawthorn | Martin | 19 |
| W-18256 | 243.3 | 243.6 | Ocala | Martin | 20 |
| W-18256 | 244.5 | 244.8 | Ocala | Martin | 24 |
| W-18256 | 245.4 | 245.7 | Ocala | Martin | 20 |
| W-18256 | 278.7 | 279 | Ocala | Martin | BDL |
| W-18256 | 279.9 | 280.2 | Ocala | Martin | 6 |
| W-18256 | 284.2 | 284.5 | Avon Park | Martin | BDL |
| W-18256 | 286.0 | 286.3 | Avon Park | Martin | BDL |
| Average | 15.3 | ||||
| Maximum | 145 | ||||
| Minimum | BDL |
| Compound | Use | Application Concentration (μg/g) |
|---|---|---|
| Phenylmercuric acetate | Preservation | 45–250 |
| Phenylmercuric acetate | Mildew control | 3500–15,000 |
| Phenylmercuric oleate | Fungicide on furniture | 500–5000 |
| Phenylmercuric hydroxide | Bacterial preservative (paint) | 5000 (est.) |
| Phenylmercuric acetate | Bacterial preservative (cement) | 1600 (est.) |
| Phenylmercuric acetate | Fungicide (cement and plaster preservation) | 45–200 |
| Phenylmercuric acetate | Fungicide (cement and plaster after application) | 3500–15,000 |
| Mercuric oxide | Marine antifouling coating | ? |
| Phenylmercuric oleate | Bacterial preservative (pint) | 1500 (est.) |
| Chloromethoy-acetoxymercuipropane | Mildew control (paints, stains, varnishes) | ? |
| Di (phenylmercury) dodcylsuccinate | Mildew control (paints, stains, varnishes) | 3750 |
| Phenylmercuric acetate | Mildew control (paints, stains, varnishes) | 1500 (est.) |
| Phenylmercuric borate | Mildew control (paints, stains, varnishes) | 1500 (est.) |
| Phenylmercuric hydroxide | Mildew control (paints, stains, varnishes) | 4500–9000 |
| Phenylmercuric oleate | Mildew control (paints, stains, varnishes) | ? |
| Phenylmercuric oleate | Bacterial preservative (marine paint) | 1500 (est.) |
| Chloromethoy-acetoxymercuipropane | Mildew control (paints, stains, varnishes) | 3570 |
| Di (phenylmercury) dodcylsuccinate | Mildew control (paints, stains, varnishes) | 3570 |
| Phenylmercuric acetate | Mildew control (paints, stains, varnishes) | 1500 (est.) |
| Phenylmercuric borate | Mildew control (paints, stains, varnishes) | 1500 (est.) |
| Bacteriostatic (paint) | Mildew control (paints, stains, varnishes) | 1500 (est.) |
| Phenylmercuric acetate | Bacteriostatic (paint) | 3000 (est.) |
| Phenylmercuric propionate | Bacteriostatic (latex paint on asbestos) | 5000 (est.) |
| Chloromethoxypropylmercuric | Bacteriostatic (latex paint on asbestos) | 5000 (est.) |
| Phenylmercuric acetate | Bacteriostatic (latex paint) | 5000 (est.) |
| Di (phenylmercury) dodcylsuccinate | Wallpaper coating | ? |
| Phenylmercuric acetate | Fungicide (fabrics and textiles) | 25–225 |
| Phenylmercuric borate and chloride | Fungicide (industrial fabrics and textiles) | 26.5 |
| Phenylmercuric oleate | Fungicide (awnings, sail covers, boat covers) | 2000–2800 |
| Phenylmercuric acetate | Mold resistant paper | 150–225 |
| Phenylmercuric acetate | Fungicide (plastics surface) | 150–225 |
| Phenylmercuric borate | Fungicide (plastics surface) | 50 |
| Phenylmercuric propionate | Fungicide (plastics surface) | ? |
| Phenylmercuric borate | Fungicide (plastics-polystyrene) | 50 |
| Phenylmercuric propionate | Bacteriostatic surface coating (plastics-PVC) | ? |
| Phenylmercuric hydroxide | Bacteriostatic (vinyl) | ? |
| Phenylmercuric acetate | Fungicide (rubber) | 125–225 |
| Phenylmercuric borate | Fungicide (rubber) | 50 |
| Phenylmercuric acetate | Bacteriostatic (floor wax) | High (undiluted) |
| Phenylmercuric acetate | Bacteriostatic and fungicide (tanneries) | 305 |
| Ethylmercury phosphate | Mold control (wood) | 150–300 |
| Phenylmercuric acetate | Mold control (wood) | 1600 |
| Phenylmercuric hydroxide | Mold control (wood) | High |
| Phenylmercuric lactate | Mold control (wood) | High |
| Mercuric chloride | Rot control (fence posts) | High (soak) |
| Phenylmercuric oleate | Rot control (fence posts) | High (soak) |
| Phenylmercuric borate | Dental tool disinfection | High |
| 3-(hydroxymercuri)-4-nitro-o-cresol | Dental tool disinfection | High |
| Hg (mg/kg) | |||||
|---|---|---|---|---|---|
| Lakes | Mean ± S.D. (n) | Min | Max | Range | EPA Method |
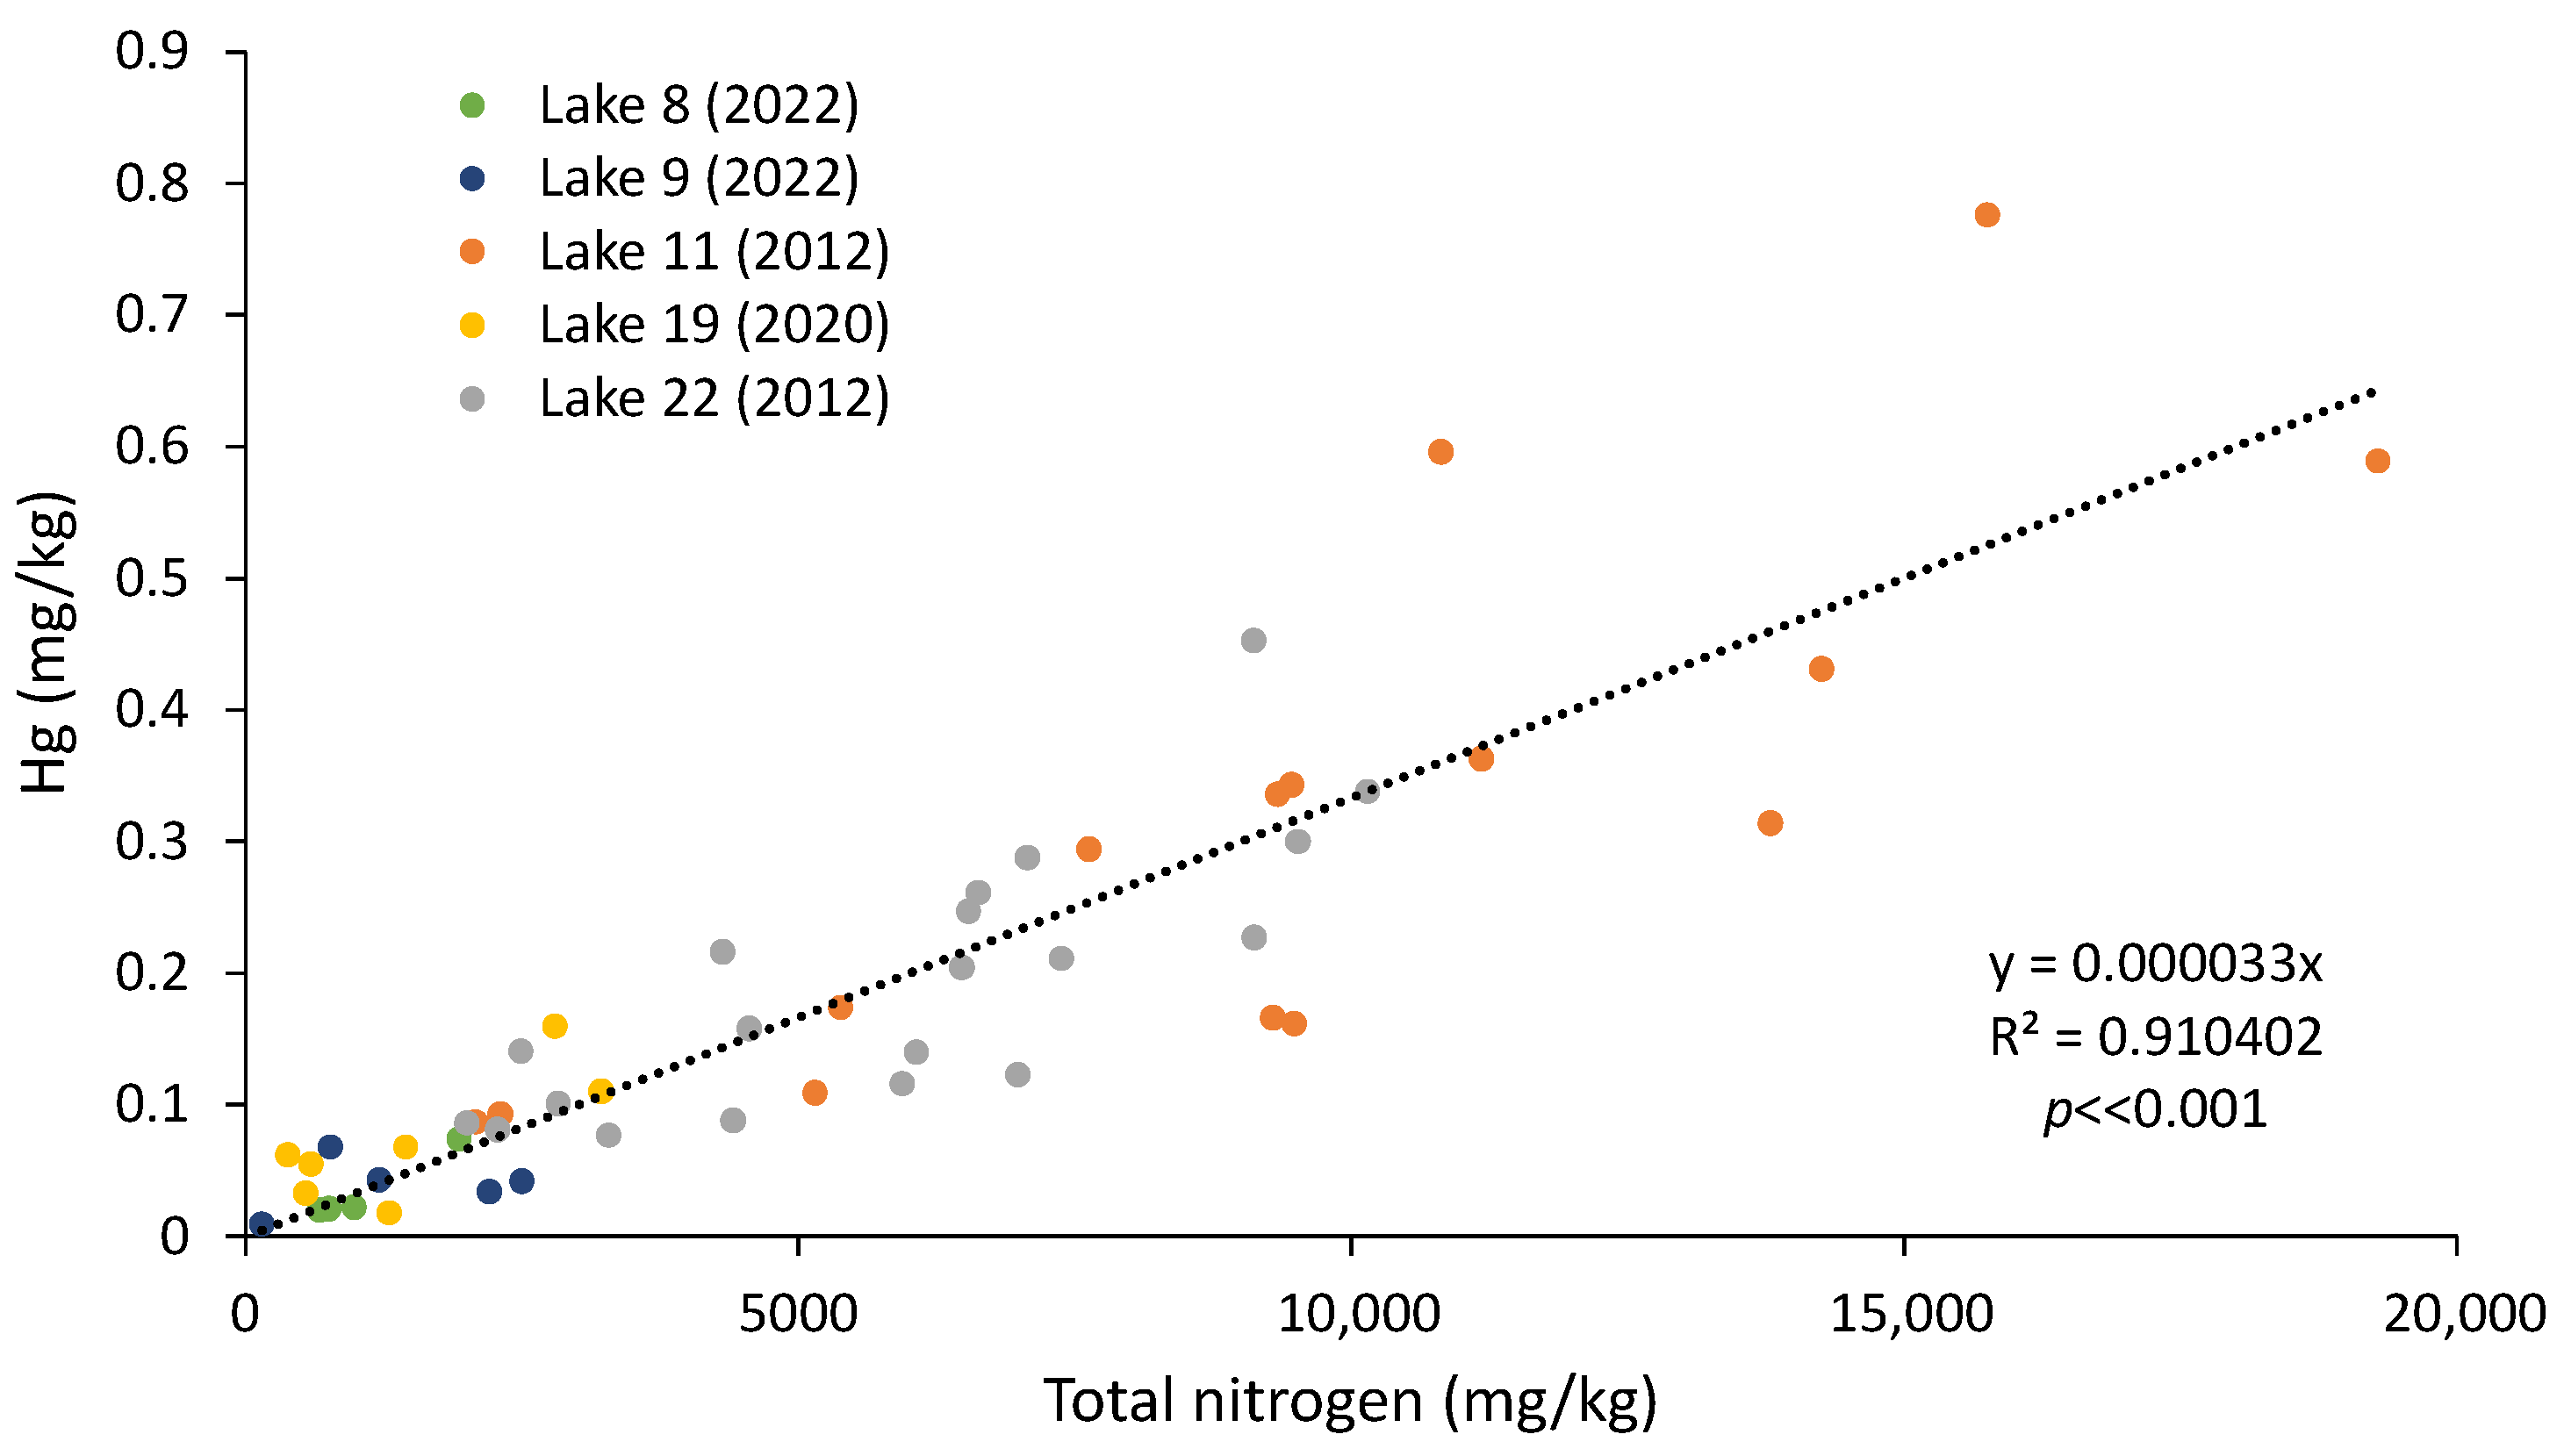
| 8 | 0.038 ± 0.031 (3) | 0.020 | 0.074 | 0.054 | 7471 |
| 9 | 0.039 ± 0.022 (6) | 0.009 * | 0.068 | 0.059 | 7471 |
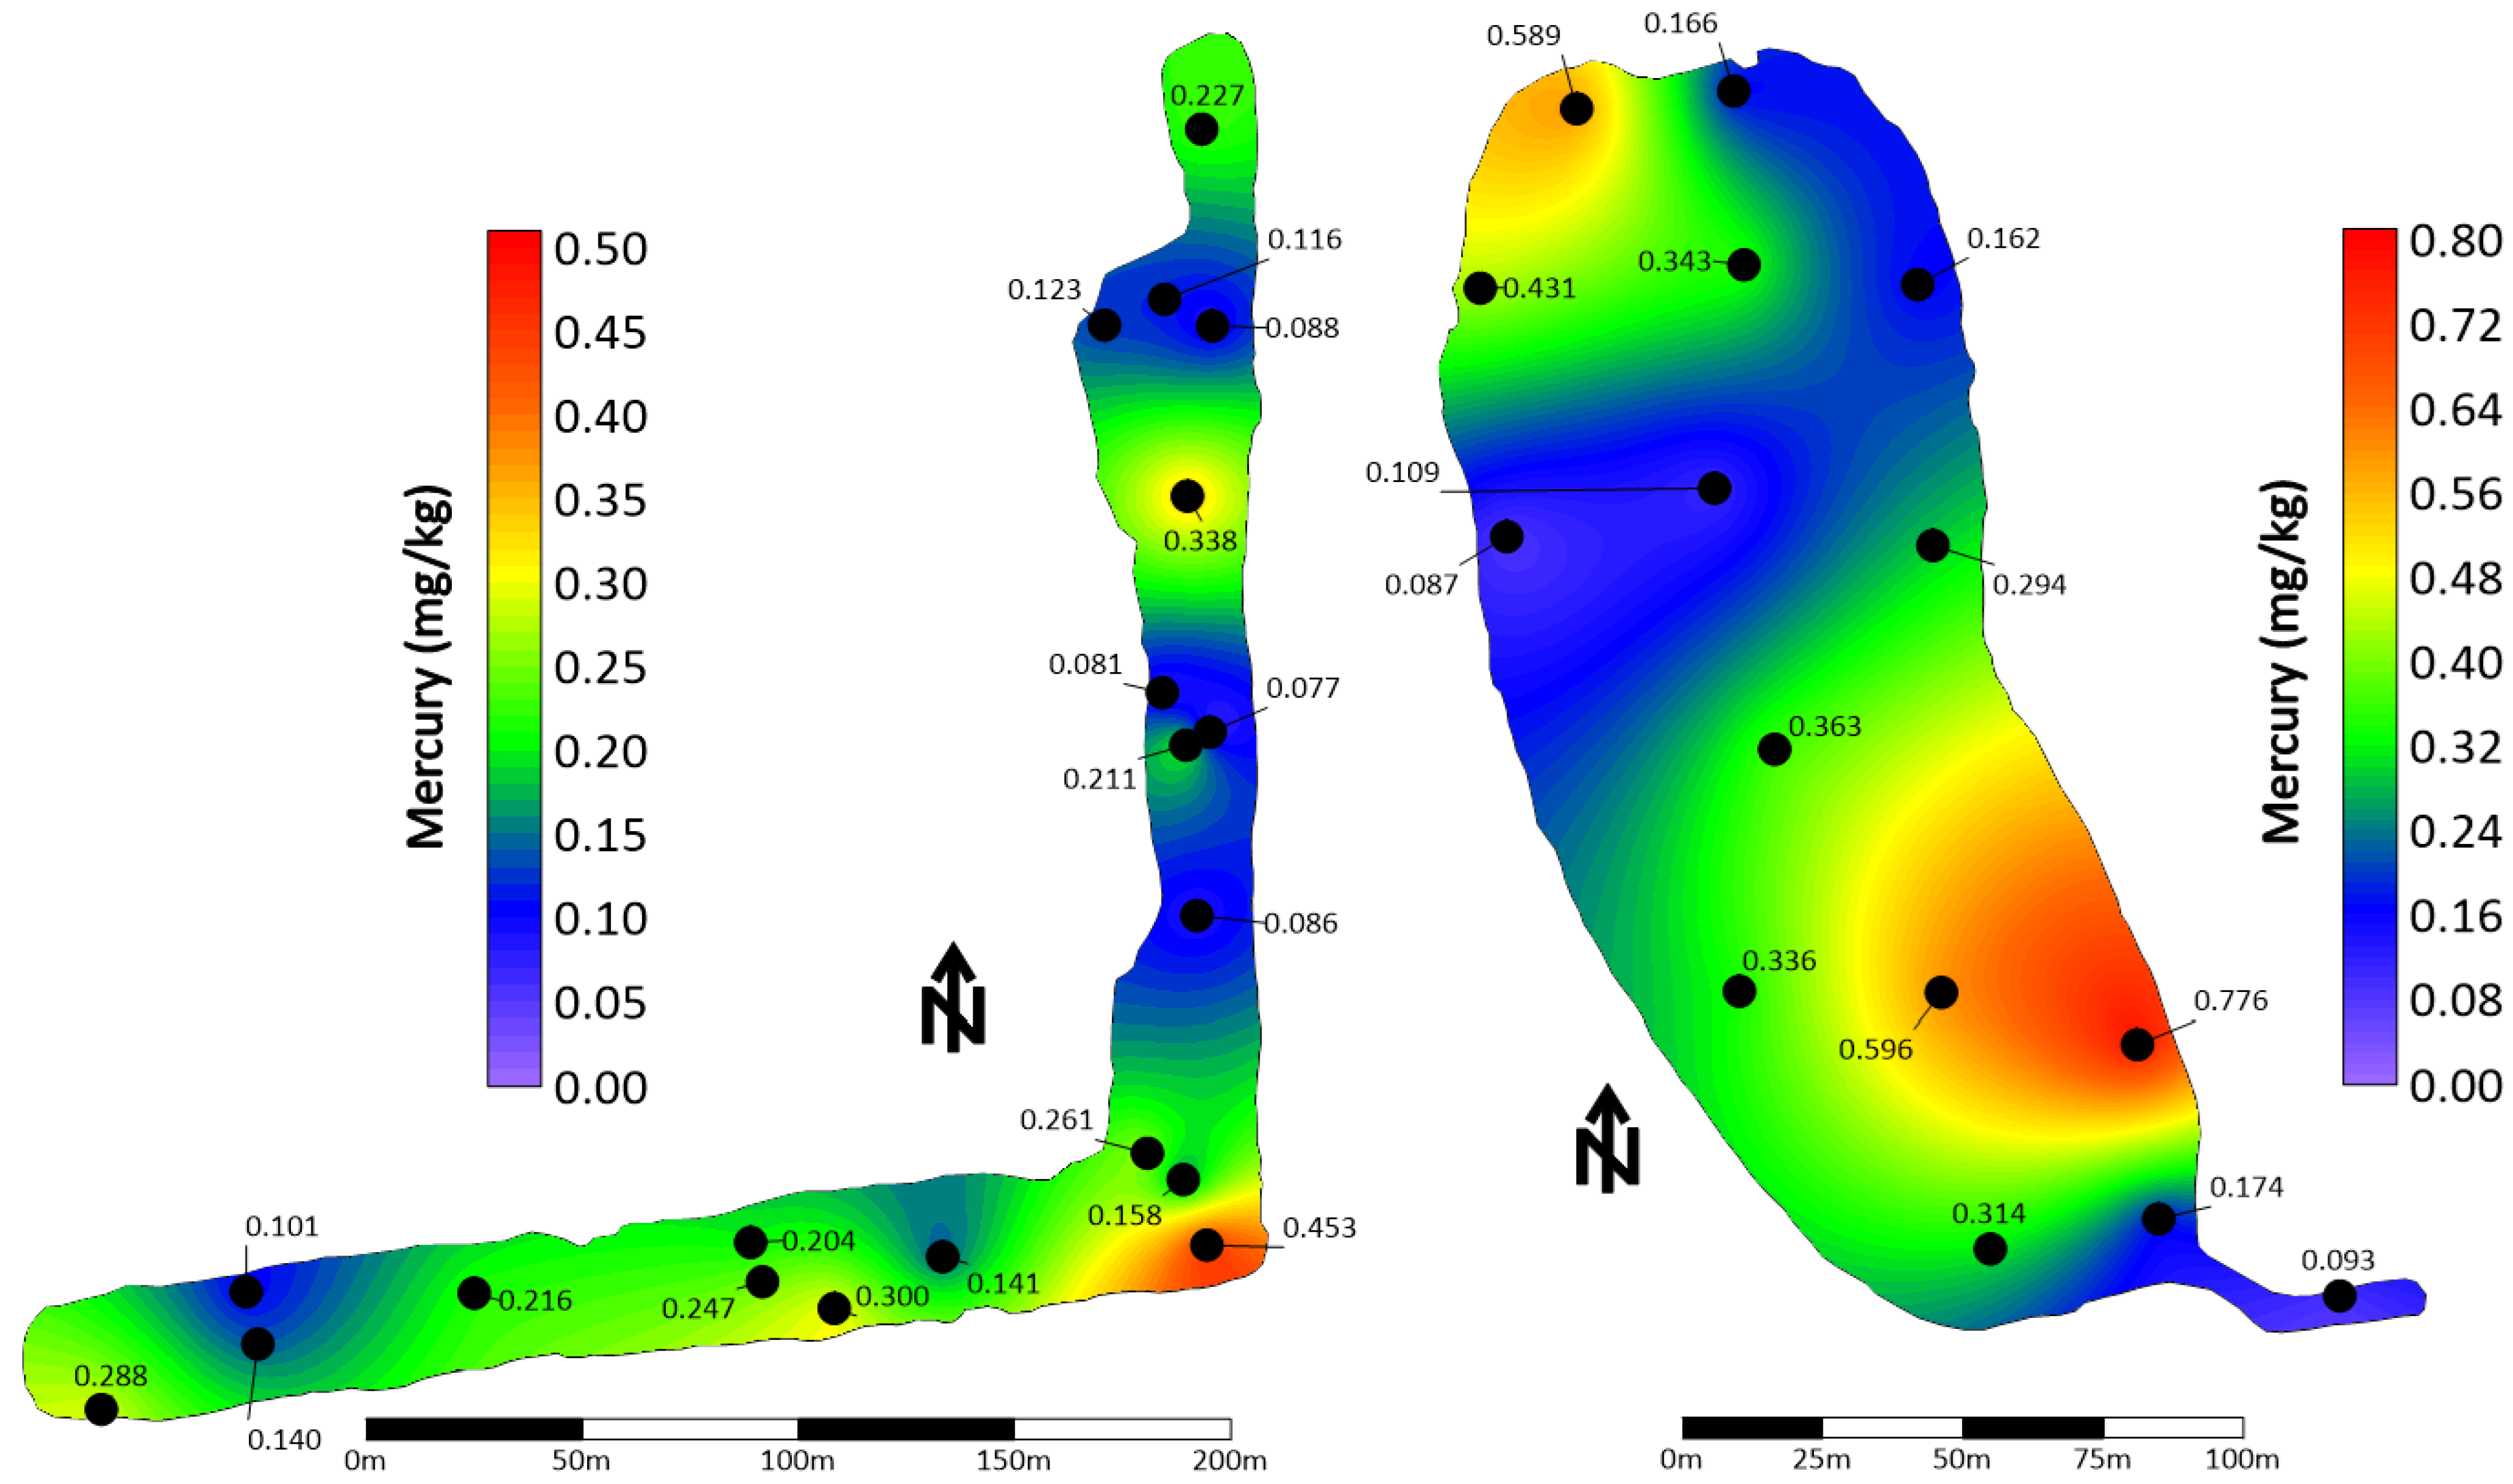
| 11 | 0.322 ± 0.206 (15) | 0.087 | 0.776 | 0.689 | 1631 |
| 19 | 0.072 ± 0.048 (7) | 0.018 | 0.160 | 0.142 | 7471 |
| 22 | 0.193 ± 0.101 (20) | 0.077 | 0.453 | 0.376 | 1631 |
| Overall | 0.187 ± 0.166 (51) | 0.009 | 0.776 | 0.767 | |
| Sources | Approximate Annual Inflows/kg yr−1 | Notes | References |
|---|---|---|---|
| Sea spray/ocean flux/evasion excluding the Everglades/Saharan dust and aerosols | 257.1–514.2 | It is not possible to clearly quantify each of these sources | National Atmospheric Deposition Program, 2021; Section 4.3 |
| Soil/dust/local sources | ? | Insufficient data | |
| Cement plant stack discharge | 150.6 | FDEP, 2023 | |
| Electrical power generation plants (natural gas fired) | 0 a | Most measurement below the threshold for reporting | FDEP, 2023 |
| Incinerators/waste to energy | 204.1 | FDEP, 2023 | |
| Incinerators/medical/crematories | 159.7+ | FDEP, 2023 | |
| Fuel emissions from vehicles | 1.4 | Calculated | Section 5.7 |
| Plant transpiration | ? | Contradictory data | Mason, 2009 |
| Municipal landfalls/gas discharge | 4 | Section 5.6 | |
| Minor: asphalt plants, soil amendments evasion | <1 | Not fully characterized | FDEP, 2023 |
| Remobilization via wildfire and peat loss in Everglades peatland | 215 | Based on loss of peat over 133 years | Section 6.2 |
| Remobilization in sugarland controlled fires | ? | Insufficient data (could be grouped into peat loss) | None available |
| Approximate Totals | 991.9–1249 |
| Residential Land Use mg/kg | Commercial/Industrial Land Use mg/kg | |
|---|---|---|
| Mercury (Hg) | 3 | 17 |
| Methylmercury | 1.1 | 6.1 |
Disclaimer/Publisher’s Note: The statements, opinions and data contained in all publications are solely those of the individual author(s) and contributor(s) and not of MDPI and/or the editor(s). MDPI and/or the editor(s) disclaim responsibility for any injury to people or property resulting from any ideas, methods, instructions or products referred to in the content. |
© 2024 by the authors. Licensee MDPI, Basel, Switzerland. This article is an open access article distributed under the terms and conditions of the Creative Commons Attribution (CC BY) license (https://creativecommons.org/licenses/by/4.0/).
Share and Cite
Missimer, T.M.; MacDonald, J.H., Jr.; Tsegaye, S.; Thomas, S.; Teaf, C.M.; Covert, D.; Kassis, Z.R. Natural Background and the Anthropogenic Enrichment of Mercury in the Southern Florida Environment: A Review with a Discussion on Public Health. Int. J. Environ. Res. Public Health 2024, 21, 118. https://doi.org/10.3390/ijerph21010118
Missimer TM, MacDonald JH Jr., Tsegaye S, Thomas S, Teaf CM, Covert D, Kassis ZR. Natural Background and the Anthropogenic Enrichment of Mercury in the Southern Florida Environment: A Review with a Discussion on Public Health. International Journal of Environmental Research and Public Health. 2024; 21(1):118. https://doi.org/10.3390/ijerph21010118
Chicago/Turabian StyleMissimer, Thomas M., James H. MacDonald, Jr., Seneshaw Tsegaye, Serge Thomas, Christopher M. Teaf, Douglas Covert, and Zoie R. Kassis. 2024. "Natural Background and the Anthropogenic Enrichment of Mercury in the Southern Florida Environment: A Review with a Discussion on Public Health" International Journal of Environmental Research and Public Health 21, no. 1: 118. https://doi.org/10.3390/ijerph21010118