
Diagnostic Accuracy of Frailty Screening Instruments Validated for Use among Older Adults Attending Emergency Departments: A Systematic Review and Meta-Analysis

 ,
,
Abstract
:1. Introduction
1.1. Study Design
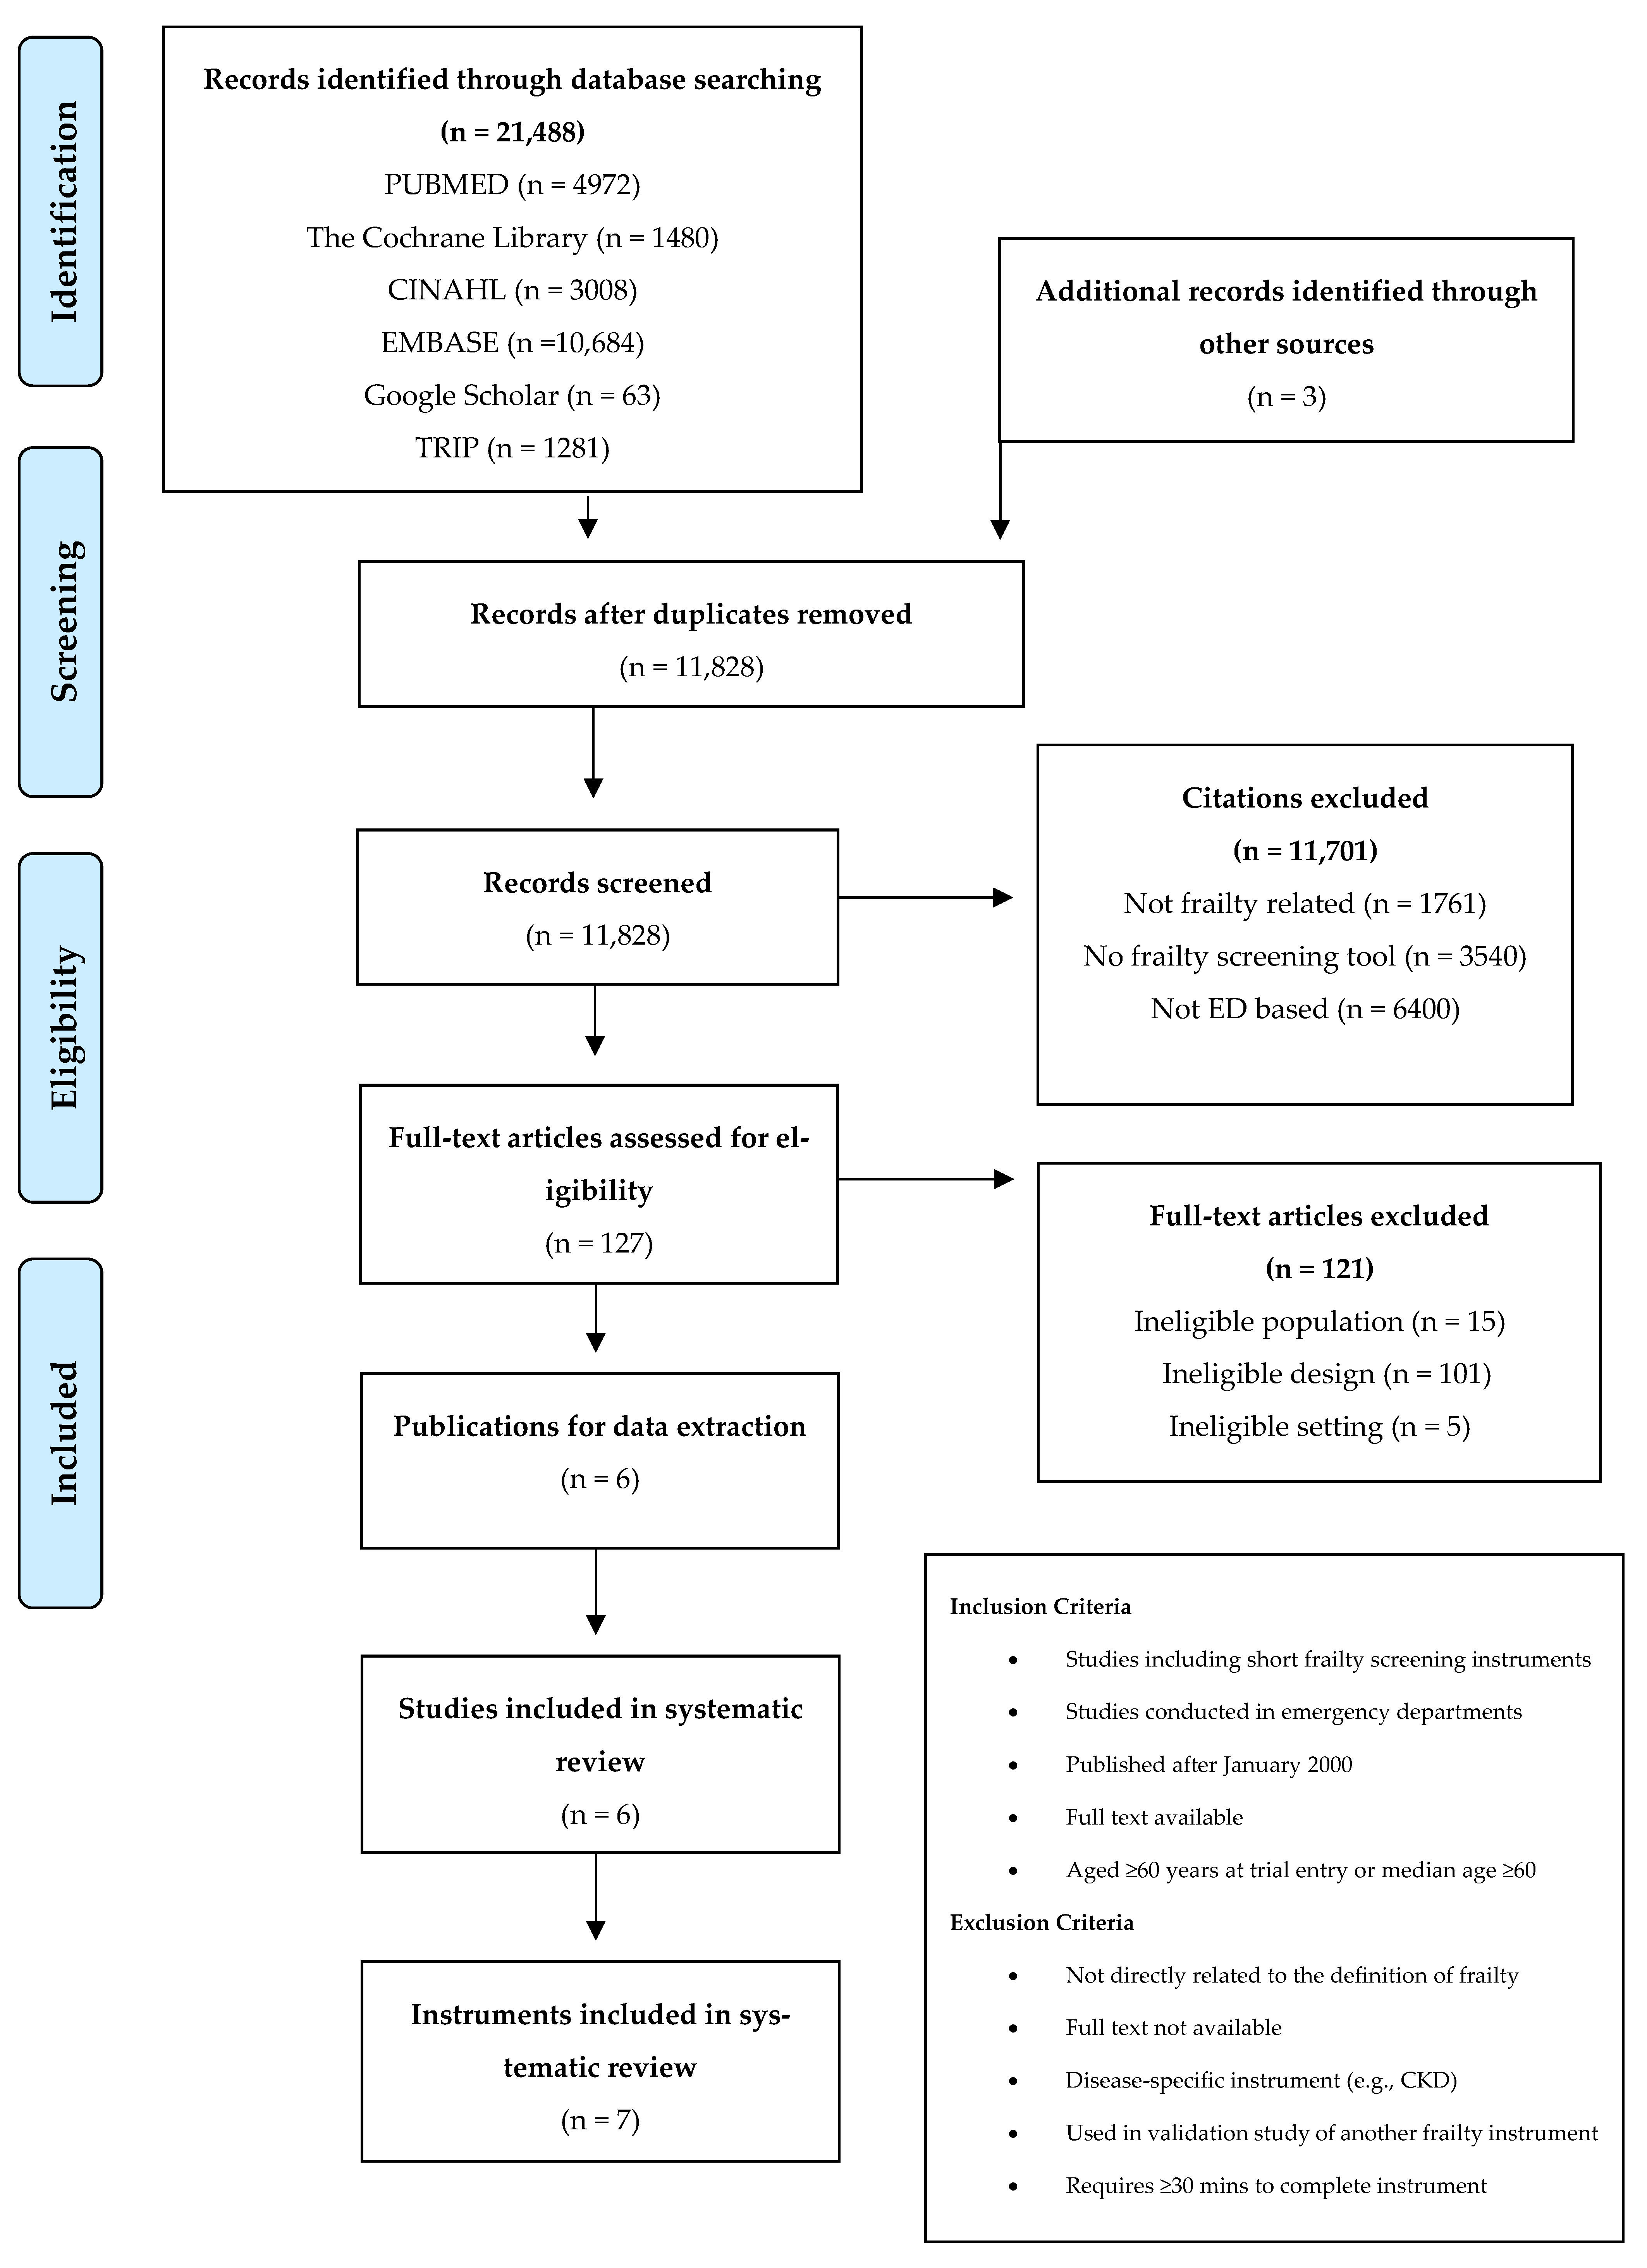
1.2. Eligibility Criteria
1.3. Exclusion Criteria
1.4. Information Sources (Search Strategy)
1.5. Study Selection and Data Retrieval
- Administrative details: Author, title, type of publication, journal, country.
- Study features: Design, aim(s), sample size, demographics, clinical location, results.
- Components of the instrument(s) used to measure frailty: number of domains/items, what are the domains/items, whether it requires specialised equipment, mode of administration, administration time, details on the development of the tool, and measurement properties.
- Which “gold standard” the instruments being studied were compared with (e.g., CGA or other frailty measures).
- Prevalence of frailty measured.
1.6. Risk of Bias
1.7. Analysis
2. Results
2.1. Search Results
2.2. Quality of Methodology of Included Publications
2.3. Study Characteristics
2.4. Meta-Analysis
Pooled Estimates for Frailty
3. Discussion
3.1. Overview
3.2. Results in Context
3.3. Strengths and Weaknesses
3.4. Clinical Implications and Future Research
4. Conclusions
Author Contributions
Funding
Institutional Review Board Statement
Informed Consent Statement
Data Availability Statement
Acknowledgments
Conflicts of Interest
Appendix A
Description of Included Studies

| Search Details | PubMed | Cinahl | Cochrane | Embase | Google Scholar | Trip | Total |
|---|---|---|---|---|---|---|---|
| Search #1 FRAIL * OR PREFRAIL * OR PRE FRAIL * | 18,514 | 8857 | 3967 | 24,609 | N/A | 11,797 | 43,135 |
| Search #2 TOOL * OR SCREEN * OR SCALE * OR SCORE * OR INSTRUMENT * OR MEASURE * OR INDEX * OR RISK OR PREDICTION * | 949,076 | 376,975 | 1,529,902 | 1,400,342 | N/A | 1,801,459 | 6,057,754 |
| Search #3 “EMERGENCY DEPARTMENT” OR “EMERGENCY SERVICES” OR HOSPITAL * | 929,624 | 305,742 | 309,120 | 1,272,570 | N/A | 96,115 | 2,913,171 |
| #1 AND #2 | 10,199 | 3008 | 3967 | 18,819 | N/A | 60,259 | 79,322 |
| #1 AND #3 | 8056 | 3008 | 1488 | 13,605 | N/A | 1427 | 27,584 |
| #1 AND # 2 AND #3 | 4972 | 3008 | 1480 | 10,684 | 63 | 1281 | 21,488 |
| Total citation count | 21,488 |
| Tool | Reference | Self-Report of Fatigue | Function | Weight Loss | Mobility | Falls | Vision/ Hearing | Cognition | Nutrition | Social Support | Medication | Recent Hospitalization |
|---|---|---|---|---|---|---|---|---|---|---|---|---|
| CFS | McGauaran et al., 2020 [37] O’Caoimh et al., 2019 [10] Lague et al., 2018 | + | + | - | + | - | - | + | - | - | - | - |
| ISAR | O’Caoimh et al., 2019 [10] Salvi et al., 2012 [8] | - | + | - | - | - | + | + | - | - | + | + |
| TRST | Piffer et al., 2020 [36] | - | + | - | + | + | - | + | - | - | + | + |
| PRISMA-7 | McGauran et al., 2020 [37] O’Caoimh et al., 2019 [10] | - | + | - | + | - | - | - | - | + | - | - |
| FRESH (4 Question version) | Kajsa et al., 2016 [34] | + | + | - | - | + | - | - | - | - | - | - |
| VIP | McGauran et al., 2020 [37] O’Caoimh et al., 2019 [10] | - | + | - | - | - | - | - | - | + | - | - |
References
- Lowthian, J.; Curtis, A.; Stoelwinder, J.; McNeil, J.; Cameron, P. Emergency demand and repeat attendances by older patients. Intern. Med. J. 2013, 43, 554–560. [Google Scholar] [CrossRef]
- Wan, H.; Goodkind, D.; Kowal, P. An Aging World: 2015; United States Census Bureau: Washington, DC, USA. Available online: https://www.census.gov/content/dam/Census/library/publications/2016/demo/p95-16-1.pdf (accessed on 21 March 2023).
- Beard, J.R.; Officer, A.; De Carvalho, I.A.; Sadana, R.; Pot, A.M.; Michel, J.P.; Lloyd-Sherlock, P.; Epping-Jordan, J.E.; Peeters, G.G.; Mahanani, W.R.; et al. The World report on ageing and health: A policy framework for healthy ageing. Lancet 2016, 387, 2145–2154. [Google Scholar] [CrossRef] [PubMed] [Green Version]
- Clegg, A.; Young, J.; Iliffe, S.; Rikkert, M.O.; Rockwood, K. Frailty in elderly people. Lancet 2013, 381, 752–762. [Google Scholar] [CrossRef] [Green Version]
- O’caoimh, R.; Sezgin, D.; O’donovan, M.R.; Molloy, D.W.; Clegg, A.; Rockwood, K.; Liew, A. Prevalence of frailty in 62 countries across the world: A systematic review and meta-analysis of population-level studies. Age Ageing 2021, 50, 96–104. [Google Scholar] [CrossRef]
- Lucke, J.A.; Mooijaart, S.P.; Heeren, P.; Singler, K.; McNamara, R.; Gilbert, T.; Nickel, C.H.; Castejon, S.; Mitchell, A.; Mezera, V.; et al. Providing care for older adults in the Emergency Department: Expert clinical recommendations from the European Task Force on Geriatric Emergency Medicine. Eur. Geriatr. Med. 2022, 13, 309–317. [Google Scholar] [CrossRef]
- Leahy, A.; McNamara, R.; Reddin, C.; Corey, G.; Carroll, I.; SOLAR team; O’Neill, A.; Flannery, D.; Devlin, C.; Barry, L.; et al. The impact of frailty Screening of Older adults with muLtidisciplinary assessment of those At-Risk during emergency hospital attendance on the quality, safety and cost-effectiveness of care (SOLAR): A randomised controlled trial. Trials 2021, 22, 581. [Google Scholar] [CrossRef] [PubMed]
- Salvi, F.; Morichi, V.; Grilli, A.; Lancioni, L.; Spazzafumo, L.; Polonara, S.; Abbatecola, A.M.; De Tommaso, G.; Dessi-Fulgheri, P.; Lattanzio, F. Screening for frailty in elderly emergency department patients by using the Identification of Seniors At Risk (ISAR). J. Nutr. Health Aging 2012, 16, 313–318. [Google Scholar] [CrossRef]
- Conroy, S.; Turpin, S. New horizons: Urgent care for older people with frailty. Age Ageing 2016, 45, 579–586. [Google Scholar] [CrossRef] [Green Version]
- O’caoimh, R.; Costello, M.; Small, C.; Spooner, L.; Flannery, A.; O’reilly, L.; Heffernan, L.; Mannion, E.; Maughan, A.; Joyce, A.; et al. Comparison of frailty screening instruments in the emergency department. Int. J. Environ. Res. Public Health 2019, 16, 3626. [Google Scholar] [CrossRef] [Green Version]
- Ge, L.; Yap, C.W.; Heng, B.H.; Tan, W.S. Frailty and healthcare utilisation across care settings among community-dwelling older adults in Singapore. BMC Geriatr. 2020, 20, 389. [Google Scholar] [CrossRef] [PubMed]
- Samaras, N.; Chevalley, T.; Samaras, D.; Gold, G. Older Patients in the Emergency Department: A Review. Ann. Emerg. Med. 2010, 56, 261–269. [Google Scholar] [CrossRef]
- Latham, L.P.; Ackroyd-Stolarz, S. Emergency department utilization by older adults: A descriptive study. Can. Geriatr. J. 2014, 17, 118–125. [Google Scholar] [CrossRef] [PubMed] [Green Version]
- Fried, L.P.; Tangen, C.M.; Walston, J.; Newman, A.B.; Hirsch, C.; Gottdiener, J.; Seeman, T.; Tracy, R.; Kop, W.J.; Burke, G.; et al. Cardiovascular Health Study Collaborative Research Group. Frailty in older adults: Evidence for a phenotype. J. Gerontol. Ser. A: Biol. Sci. Med. Sci. 2001, 56, M146–M157. [Google Scholar] [CrossRef] [PubMed]
- Rockwood, K.; Song, X.; MacKnight, C.; Bergman, H.; Hogan, D.B.; McDowell, I.; Mitnitski, A. A global clinical measure of fitness and frailty in elderly people. CMAJ 2005, 173, 489–495. [Google Scholar] [CrossRef] [PubMed] [Green Version]
- Morrison, L.; Costello, M.; Flannery, A.; Small, C.; Nevin, R.; Havelin, A.; O’reilly, L.; Heffernan, L.; Hong, Y.Y.; Waters, R.; et al. 279Frailty in an acute hospital: Point prevalence and change in baseline status during hospitalisation. Age Ageing 2017, 46, 11–12. [Google Scholar] [CrossRef]
- Galvin, R.; Gilleit, Y.; Wallace, E.; Cousins, G.; Bolmer, M.; Rainer, T.; Smith, S.M.; Fahey, T. Adverse outcomes in older adults attending emergency departments: A systematic review and meta-analysis of the Identification of Seniors At Risk (ISAR) screening tool. Age Ageing 2017, 46, 179–186. [Google Scholar] [CrossRef] [Green Version]
- Stille, K.; Temmel, N.; Hepp, J.; Herget-Rosenthal, S. Validation of the Clinical Frailty Scale for retrospective use in acute care. Eur. Geriatr. Med. 2020, 11, 1009–1015. [Google Scholar] [CrossRef]
- Morley, J.E.; Malmstrom, T.K.; Miller, D.K. A simple frailty questionnaire (FRAIL) predicts outcomes in middle aged African Americans. J. Nutr. Health Aging 2012, 16, 601–608. [Google Scholar] [CrossRef] [Green Version]
- Lewis, E.T.; Dent, E.; Alkhouri, H.; Kellett, J.; Williamson, M.; Asha, S.; Holdgate, A.; Mackenzie, J.; Winoto, L.; Fajardo-Pulido, D.; et al. Which frailty scale for patients admitted via Emergency Department? A cohort study. Arch. Gerontol. Geriatr. 2019, 80, 104–114. [Google Scholar] [CrossRef]
- Wallis, S.; Wall, J.; Biram, R.; Romero-Ortuno, R. Association of the clinical frailty scale with hospital outcomes. Qjm Int. J. Med. 2015, 108, 943–949. [Google Scholar] [CrossRef] [Green Version]
- Elliott, A.; Hull, L.; Conroy, S.P. Frailty identification in the emergency department—A systematic review focussing on feasibility. Age Ageing 2017, 46, 509–513. [Google Scholar] [CrossRef] [Green Version]
- Clegg, A.; Rogers, L.; Young, J. Diagnostic test accuracy of simple instruments for identifying frailty in community-dwelling older people: A systematic review. Age Ageing 2015, 44, 148–152. [Google Scholar] [CrossRef] [Green Version]
- Fehlmann, C.A.; Nickel, C.H.; Cino, E.; Al-Najjar, Z.; Langlois, N.; Eagles, D. Frailty assessment in emergency medicine using the Clinical Frailty Scale: A scoping review. Intern. Emerg. Med. 2022, 17, 2407–2418. [Google Scholar] [CrossRef]
- Moloney, E.; Sezgin, D.; O’donovan, M.; Adja, K.Y.C.; McGrath, K.; Liew, A.; Lenzi, J.; Gori, D.; O’connor, K.; Molloy, D.W.; et al. The Diagnostic Accuracy and Clinimetric Properties of Screening Instruments to Identify Frail Older Adults Attending Emergency Departments: A Protocol for a Mixed Methods Systematic Review and Meta-Analysis. Int. J. Environ. Res. Public Health 2022, 19, 1380. [Google Scholar] [CrossRef]
- Higgins, J. Cochrane Handbook for Systematic Reviews of Interventions, 2nd ed.; Wiley-Blackwell: Hoboken, NJ, USA, 2019. [Google Scholar]
- Page, M.J.; McKenzie, J.E.; Bossuyt, P.M.; Boutron, I.; Hoffmann, T.C.; Mulrow, C.D.; Shamseer, L.; Tetzlaff, J.M.; Akl, E.A.; Brennan, S.E.; et al. The PRISMA 2020 statement: An updated guideline for reporting systematic reviews. Syst. Rev. 2021, 89, 105906. [Google Scholar]
- PRISMA-P Group; Moher, D.; Shamseer, L.; Clarke, M.; Ghersi, D.; Liberati, A.; Petticrew, M.; Shekelle, P.; Stewart, L.A. Preferred reporting items for systematic review and meta-analysis protocols (prisma-p) 2015 statement. Syst. Rev. 2015, 4, 1. [Google Scholar] [CrossRef] [Green Version]
- Munn, Z.; Stern, C.; Aromataris, E.; Lockwood, C.; Jordan, Z. What kind of systematic review should I conduct? A proposed typology and guidance for systematic reviewers in the medical and health sciences. BMC Med. Res. Methodol. 2018, 18, 5. [Google Scholar] [CrossRef] [Green Version]
- Campbell, J.M.; Klugar, M.; Ding, S.; Carmody, D.P.; Hakonsen, S.J.M.; Jadotte, Y.T.; White, S.; Munn, Z. Diagnostic test accuracy: Methods for systematic review and meta-analysis. Int. J. Evidence-Based Health 2015, 13, 154–162. [Google Scholar] [CrossRef] [Green Version]
- Yang, B.; Mallett, S.; Takwoingi, Y.; Davenport, C.F.; Hyde, C.J.; Whiting, P.F.; Deeks, J.J.; Leeflang, M.M. The QUADAS-C Group† QUADAS-C: A Tool for Assessing Risk of Bias in Comparative Diagnostic Accuracy Studies. Ann. Intern. Med. 2021, 174, 1592–1599. [Google Scholar] [CrossRef]
- Reitsma, J.B.; Glas, A.S.; Rutjes, A.W.; Scholten, R.J.; Bossuyt, P.M.; Zwinderman, A.H. Bivariate analysis of sensitivity and specificity produces informative summary measures in diagnostic reviews. J. Clin. Epidemiology 2005, 58, 982–990. [Google Scholar] [CrossRef]
- Youden, W.J. Index for rating diagnostic tests. Cancer 1950, 3, 32–35. [Google Scholar] [CrossRef] [PubMed]
- Kajsa, E.; Katarina, W.; Sten, L.; Synneve, I.-D. Screening for frailty among older emergency department visitors: Validation of the new FRESH-screening instrument. BMC Emerg. Med. 2016, 16, 1–7. [Google Scholar] [CrossRef] [PubMed] [Green Version]
- Laguë, A.; Voyer, P.; Ouellet, M.-C.; Boucher, V.; Giroux, M.; Pelletier, M.; Gouin, É.; Daoust, R.; Berthelot, S.; Morin, M. Using the Bergman-Paris Question to screen seniors in the emergency department. Can. J. Emerg. Med. 2018, 20, 753–761. [Google Scholar] [CrossRef] [PubMed] [Green Version]
- Piffer, I.; Goetz, C.; Zevering, Y.; Andre, E.; Bourouis, Z.; Blettner, N. Ability of Emergency Department Physicians Using a Functional Autonomy-Assessing Version of the Triage Risk Screening Tool to Detect Frail Older Patients Who Require Mobile Geriatric Team Consultation. J. Nutr. Health Aging 2020, 24, 634–641. [Google Scholar] [CrossRef] [PubMed]
- McGuaran, J.; Alcock, M.; O’Donovan, M.; Moloney, E.; Walsh, C.; O’Hea, A.; Hayes, M.; O’Connor, K.; O’Caoimh, R. Comparison of the variable indicative of placement risk to short frailty screens in the emergency department. Eur. Geriatr. Med. 2020, 11, 1–309. [Google Scholar] [CrossRef]
- O’caoimh, R.; McGauran, J.; O’donovan, M.R.; Gillman, C.; O’hea, A.; Hayes, M.; O’connor, K.; Moloney, E.; Alcock, M. Frailty Screening in the Emergency Department: Comparing the Variable Indicative of Placement Risk, Clinical Frailty Scale and PRISMA. Int. J. Environ. Res. Public Health 2023, 20, 290. [Google Scholar] [CrossRef]
- Lalla, R.; Sammy, I.; Paul, J.; Nunes, P.; Maharaj, V.R.; Robertson, P. Assessing the validity of the Triage Risk Screening Tool in a third world setting. J. Int. Med. Res. 2017, 46, 557–563. [Google Scholar] [CrossRef]
- Salvi, F.; Morichi, V.; Grilli, A.; Spazzafumo, L.; Giorgi, R.; Polonara, S.; De Tommaso, G.; Dessì-Fulgheri, P. Predictive validity of the Identification of Seniors At Risk (ISAR) screening tool in elderly patients presenting to two Italian Emergency Departments. Aging Clin. Exp. Res. 2009, 21, 69–75. [Google Scholar] [CrossRef]
- Oviedo-Briones, M.; Laso, R.; Carnicero, J.A.; Cesari, M.; Grodzicki, T.; Gryglewska, B.; Sinclair, A.; Landi, F.; Vellas, B.; Checa-López, M. A Comparison of Frailty Assessment Instruments in Different Clinical and Social Care Settings: The Frailtools Project. J. Am. Med. Dir. Assoc. 2021, 22, 607.e7–607.e12. [Google Scholar] [CrossRef]
- Carpenter, C.R.; Shelton, E.; Fowler, S.; Suffoletto, B.; Platts-Mills, T.F.; Rothman, R.E.; Hogan, T.M. Risk factors and screening instruments to predict adverse outcomes for undifferentiated older emergency department patients: A systematic review and meta-analysis. Acad. Emerg. Med. 2015, 22, 1–21. [Google Scholar] [CrossRef]
- Apóstolo, J.; Cooke, R.; Bobrowicz-Campos, E.; Santana, S.; Marcucci, M.; Cano, A.; Vollenbroek-Hutten, M.; Germini, F.; Holland, C. Predicting risk and outcomes for frail older adults: An umbrella review of frailty screening tools. JBI Évid. Synth. 2017, 15, 1154–1208. [Google Scholar] [CrossRef] [Green Version]
- Drubbel, I.; Bleijenberg, N.; Kranenburg, G.; Eijkemans, R.J.; Schuurmans, M.J.; de Wit, N.J.; E Numans, M. Identifying frailty: Do the Frailty Index and Groningen Frailty Indicator cover different clinical perspectives? A cross-sectional study. BMC Fam. Pr. 2013, 14, 64. [Google Scholar] [CrossRef]
- Parker, S.G.; McCue, P.; Phelps, K.; McCleod, A.; Arora, S.; Nockels, K.; Kennedy, S.; Roberts, H.; Conroy, S. What is comprehensive geriatric assessment (CGA)? An umbrella review. Age Ageing 2018, 47, 149–155. [Google Scholar] [CrossRef] [Green Version]
- Trevethan, R. Sensitivity, Specificity, and Predictive Values: Foundations, Pliabilities, and Pitfalls in Research and Practice. Front. Public Health 2017, 5, 307. [Google Scholar] [CrossRef]
- British Geriatrics Society. Fit for Frailty—Consensus Best Practice Guidance for the Care of Older People Living in Community and Outpatient Settings. British Geriatrics Society 2014. Available online: https://www.bgs.org.uk/sites/default/files/content/resources/files/2018-05-14/fff2_short_0.pdf (accessed on 28 June 2021).
- Higginbotham, O.; O’Neill, A.; Barry, L.; Leahy, A.; Robinson, K.; O’Connor, M.; Galvin, R. The diagnostic and predictive accuracy of the PRISMA-7 screening tool for frailty in older adults: A systematic review protocol. HRB Open Res. 2020, 3, 26. [Google Scholar] [CrossRef]
- Church, S.; Rogers, E.; Rockwood, K.; Theou, O. A scoping review of the Clinical Frailty Scale. BMC Geriatr. 2020, 20, 393. [Google Scholar] [CrossRef]
- Rockwood, K.; Theou, O. Using the Clinical Frailty Scale in Allocating Scarce Health Care Resources. Can. Geriatr. J. 2020, 23, 254–259. [Google Scholar] [CrossRef]
- Sayers, K.; Pender, C.; Maher, J.; Ryan, S.; Cooney, E.; O’Reilly, A.; Donnellan, C.; Pillay, I. 140 The Use of the Variable Indicative of Placement risk (VIP) as a Frailty Identification Tool. Age Ageing 2019, 48, iii17–iii65. [Google Scholar] [CrossRef] [Green Version]
- Checa-López, M.; Oviedo-Briones, M.; Pardo-Gómez, A.; Gonzales-Turín, J.; Guevara-Guevara, T.; Carnicero, J.A.; Alamo-Ascencio, S.; Landi, F.; Cesari, M.; Grodzicki, T.; et al. FRAILTOOLS study protocol: A comprehensive validation of frailty assessment tools to screen and diagnose frailty in different clinical and social settings and to provide instruments for integrated care in older adults. BMC Geriatr. 2019, 19, 86. [Google Scholar] [CrossRef] [Green Version]
- O’Caoimh, R.; Kennelly, S.; Ahern, E.; O’Keeffe, S.; Ortuño, R.R. Letter to the Editor: COVID-19 and the Challenges of Frailty Screening in Older Adults. J. Frailty Aging 2020, 9, 185–186. [Google Scholar] [CrossRef]
- Warren, N.; Gordon, E.; Pearson, E.; Siskind, D.; Hilmer, S.N.; Etherton-Beer, C.; Hanjani, L.S.; Young, A.M.; Reid, N.; Hubbard, R.E. A systematic review of frailty education programs for health care professionals. Australas. J. Ageing 2022, 41, e310–e319. [Google Scholar] [CrossRef] [PubMed]
- Rosenbaum, L. Facing COVID-19 in Italy—Ethics, Logistics, and Therapeutics on the Epidemic’s Front Line. N. Engl. J. Med. 2020, 382, 1873–1875. [Google Scholar] [CrossRef]
- Carpenter, C.R.; Mooijaart, S.P. Geriatric Screeners 2.0: Time for a Paradigm Shift in Emergency Department Vulnerability Research. J. Am. Geriatr. Soc. 2020, 68, 1402–1405. [Google Scholar] [CrossRef] [PubMed]
- UNHCR Emergency Handbook (2015). Available online: https://emergency.unhcr.org/entry/43935/older-per-sons#:~{}:text=An%20older%20person%20is%20defined,or%20age%2Drelated%20health%20conditions (accessed on 6 November 2021).
- Mowbray, F.I.; Heckman, G.; Hirdes, J.P.; Costa, A.P.; Beauchet, O.; Eagles, D.; Perry, J.J.; Sinha, S.; Archambault, P.; Wang, H.; et al. Examining the utility and accuracy of the interRAI Emergency Department Screener in identifying high-risk older emergency department patients: A Canadian multiprovince prospective cohort study. J. Am. Coll. Emerg. Physicians Open 2023, 4, e12876. [Google Scholar] [CrossRef] [PubMed]
- Heeren, P.; Devriendt, E.; Slt, N.I.W.; Rn, M.D.; Flamaing, J.; Sabbe, M.; Milisen, K. Comment on: Geriatric Screeners 2.0: Time for a Paradigm Shift in Emergency Department Vulnerability Research. J. Am. Geriatr. Soc. 2020, 68, 2414–2415. [Google Scholar] [CrossRef]
- Abdulwahid, M.A.; Booth, A.; Kuczawski, M.; Mason, S.M. The impact of senior doctor assessment at triage on emergency department performance measures: Systematic review and meta-analysis of comparative studies. Emerg. Med. J. 2016, 33, 504–513. [Google Scholar] [CrossRef] [Green Version]
- Teguo, M.T.; Kuate-Tegueu, C.; Dartigues, J.-F.; Cesari, M. Frailty in sub-Saharan Africa. Lancet 2015, 385, 2151. [Google Scholar] [CrossRef]
- Ellis, B.; Carpenter, C.; Lowthian, J.; Mooijaart, S.; Nickel, C.; Melady, D. Statement on minimum standards for the care of older people in emergency de-partments by the Geriatric Emergency Medicine Special Interest Group of the International Federation for Emergency Medicine. Can. J. Emerg. Med. 2018, 20, 368–369. [Google Scholar] [CrossRef] [Green Version]
- Hoogendijk, E.O.; Rijnhart, J.J.; Kowal, P.; Pérez-Zepeda, M.U.; Cesari, M.; Abizanda, P.; Ruano, T.F.; Schop-Etman, A.; Huisman, M.; Dent, E. Socioeconomic inequalities in frailty among older adults in six low- and middle-income countries: Results from the WHO Study on global AGEing and adult health (SAGE). Maturitas 2018, 115, 56–63. [Google Scholar] [CrossRef]


| PIRD Question Layout | |||
|---|---|---|---|
| Population | Index Test | Reference Test | Diagnosis of Interest |
| Persons aged ≥ 60 years presenting to ED utilising an established definition of frailty | Short screens and risk stratifying instruments utilised to highlight older adults with frailty | CGA or components of existing frailty models in the context of independent review | Accurate frailty diagnosis and prediction of defined adverse events |
| Study | Risk of Bias | Applicability Concerns | |||||
|---|---|---|---|---|---|---|---|
| Patient Selection | Index Test | Reference Standard | Flow and Timing | Patient Selection | Index Test | Reference Standard | |
| Salvi et al., 2012 [8] | Low | Low | Unclear | Low | Low | Low | Low |
| Kajsa et al., 2016 [34] | Low | Unclear | Unclear | Low | Low | Low | Low |
| Lague et al., 2018 [35] | Unclear | Unclear | Low | Low | Low | Low | Low |
| O’Caoimh et al., 2019 [10] | Low | Low | Low | Low | Low | Low | Low |
| McGuaran et al., 2020 [37] | Low | Low | Unclear | Low | Low | Low | Low |
| Piffer et al., 2020 [36] | Low | Unclear | Unclear | Low | Low | Low | Low |
| Study (Country) | N = X | Mean or Median Age | % F | Inclusion Criteria | Study Design | Frailty Screens Used with Cut-Offs | Reference Standard | Time to Complete | AUC for Each Screen (95% Confidence Interval) |
|---|---|---|---|---|---|---|---|---|---|
| Salvi et al., 2012 [8], (Italy) | 200 | 80 | 57% | ≥65 years screened after triage | Prospective observation cohort, unclear sampling type | ISAR ≥ 2 | CGA | ND | ISAR = 0.92 (0.88–0.96) |
| Kajsa et al., 2016 [34], (Sweden) | 161 | 82 | 55% | ≥80 years or 65–79 with ≥1 chronic disease and help ≥1 ADL | Cross-sectional, consecutive sampling | FRESH ≥ 2 | CGA | ND | FRESH = 0.86 (0.79–0.92) |
| Lague et al., 2018 [35], (Canada) | 171 | 76.9 | 52% | ≥65 yrs Independent or semi-independent; ≥ 8 h in ED; Admitted to any hospital ward. | Prospective observational cohort, unclear sampling type | BPQ No= Positive | CGA | ND | BPQ = 0.63 (0.53–0.72) |
| O’Caoimh et al. 2019 [10], (Ireland) | 265 | 78 | 54% | ≥70 years screened at triage | Prospective cross-sectional, consecutive sampling | CFS ≥ 5 PRISMA-7 ≥ 3 ISAR ≥ 2 | CGA | ND | CFS = 0.83 (0.77–0.88) PRISMA-7 = 0.88 (0.83–0.93) ISAR = 0.78 (0.71–0.84) |
| McGuaran et al. 2020 [37], (Ireland) | 197 | 79 | 45% | ≥70 years screened at triage | Prospective cross-sectional, consecutive sampling | VIP-3 ≥ 2 VIP-4 ≥ 3 CFS ≥ 5 PRISMA-7 ≥ 3 | CGA | ND | CFS = 0.91 (0.87–0.95) PRISMA-7 = 0.91 (0.86–0.95) VIP-3 = 0.84 (0.78–0.89) VIP-4 = 0.84 (0.79–0.90) |
| Piffer et al., 2020 [36], (France) | 498 | 86 | 60% | ≥75-year-olds who (1). required hospital admission over 1 year; (2). were scored with the E-TRST, G-TRST, and SEGA within 24 h. | Prospective, cross-sectional, consecutive sampling | TRST ≥ 2 | CGA | ND | E-TRST = 0.86 (0.83–0.89) G-TRST = 0.90 (0.87–0.93) |
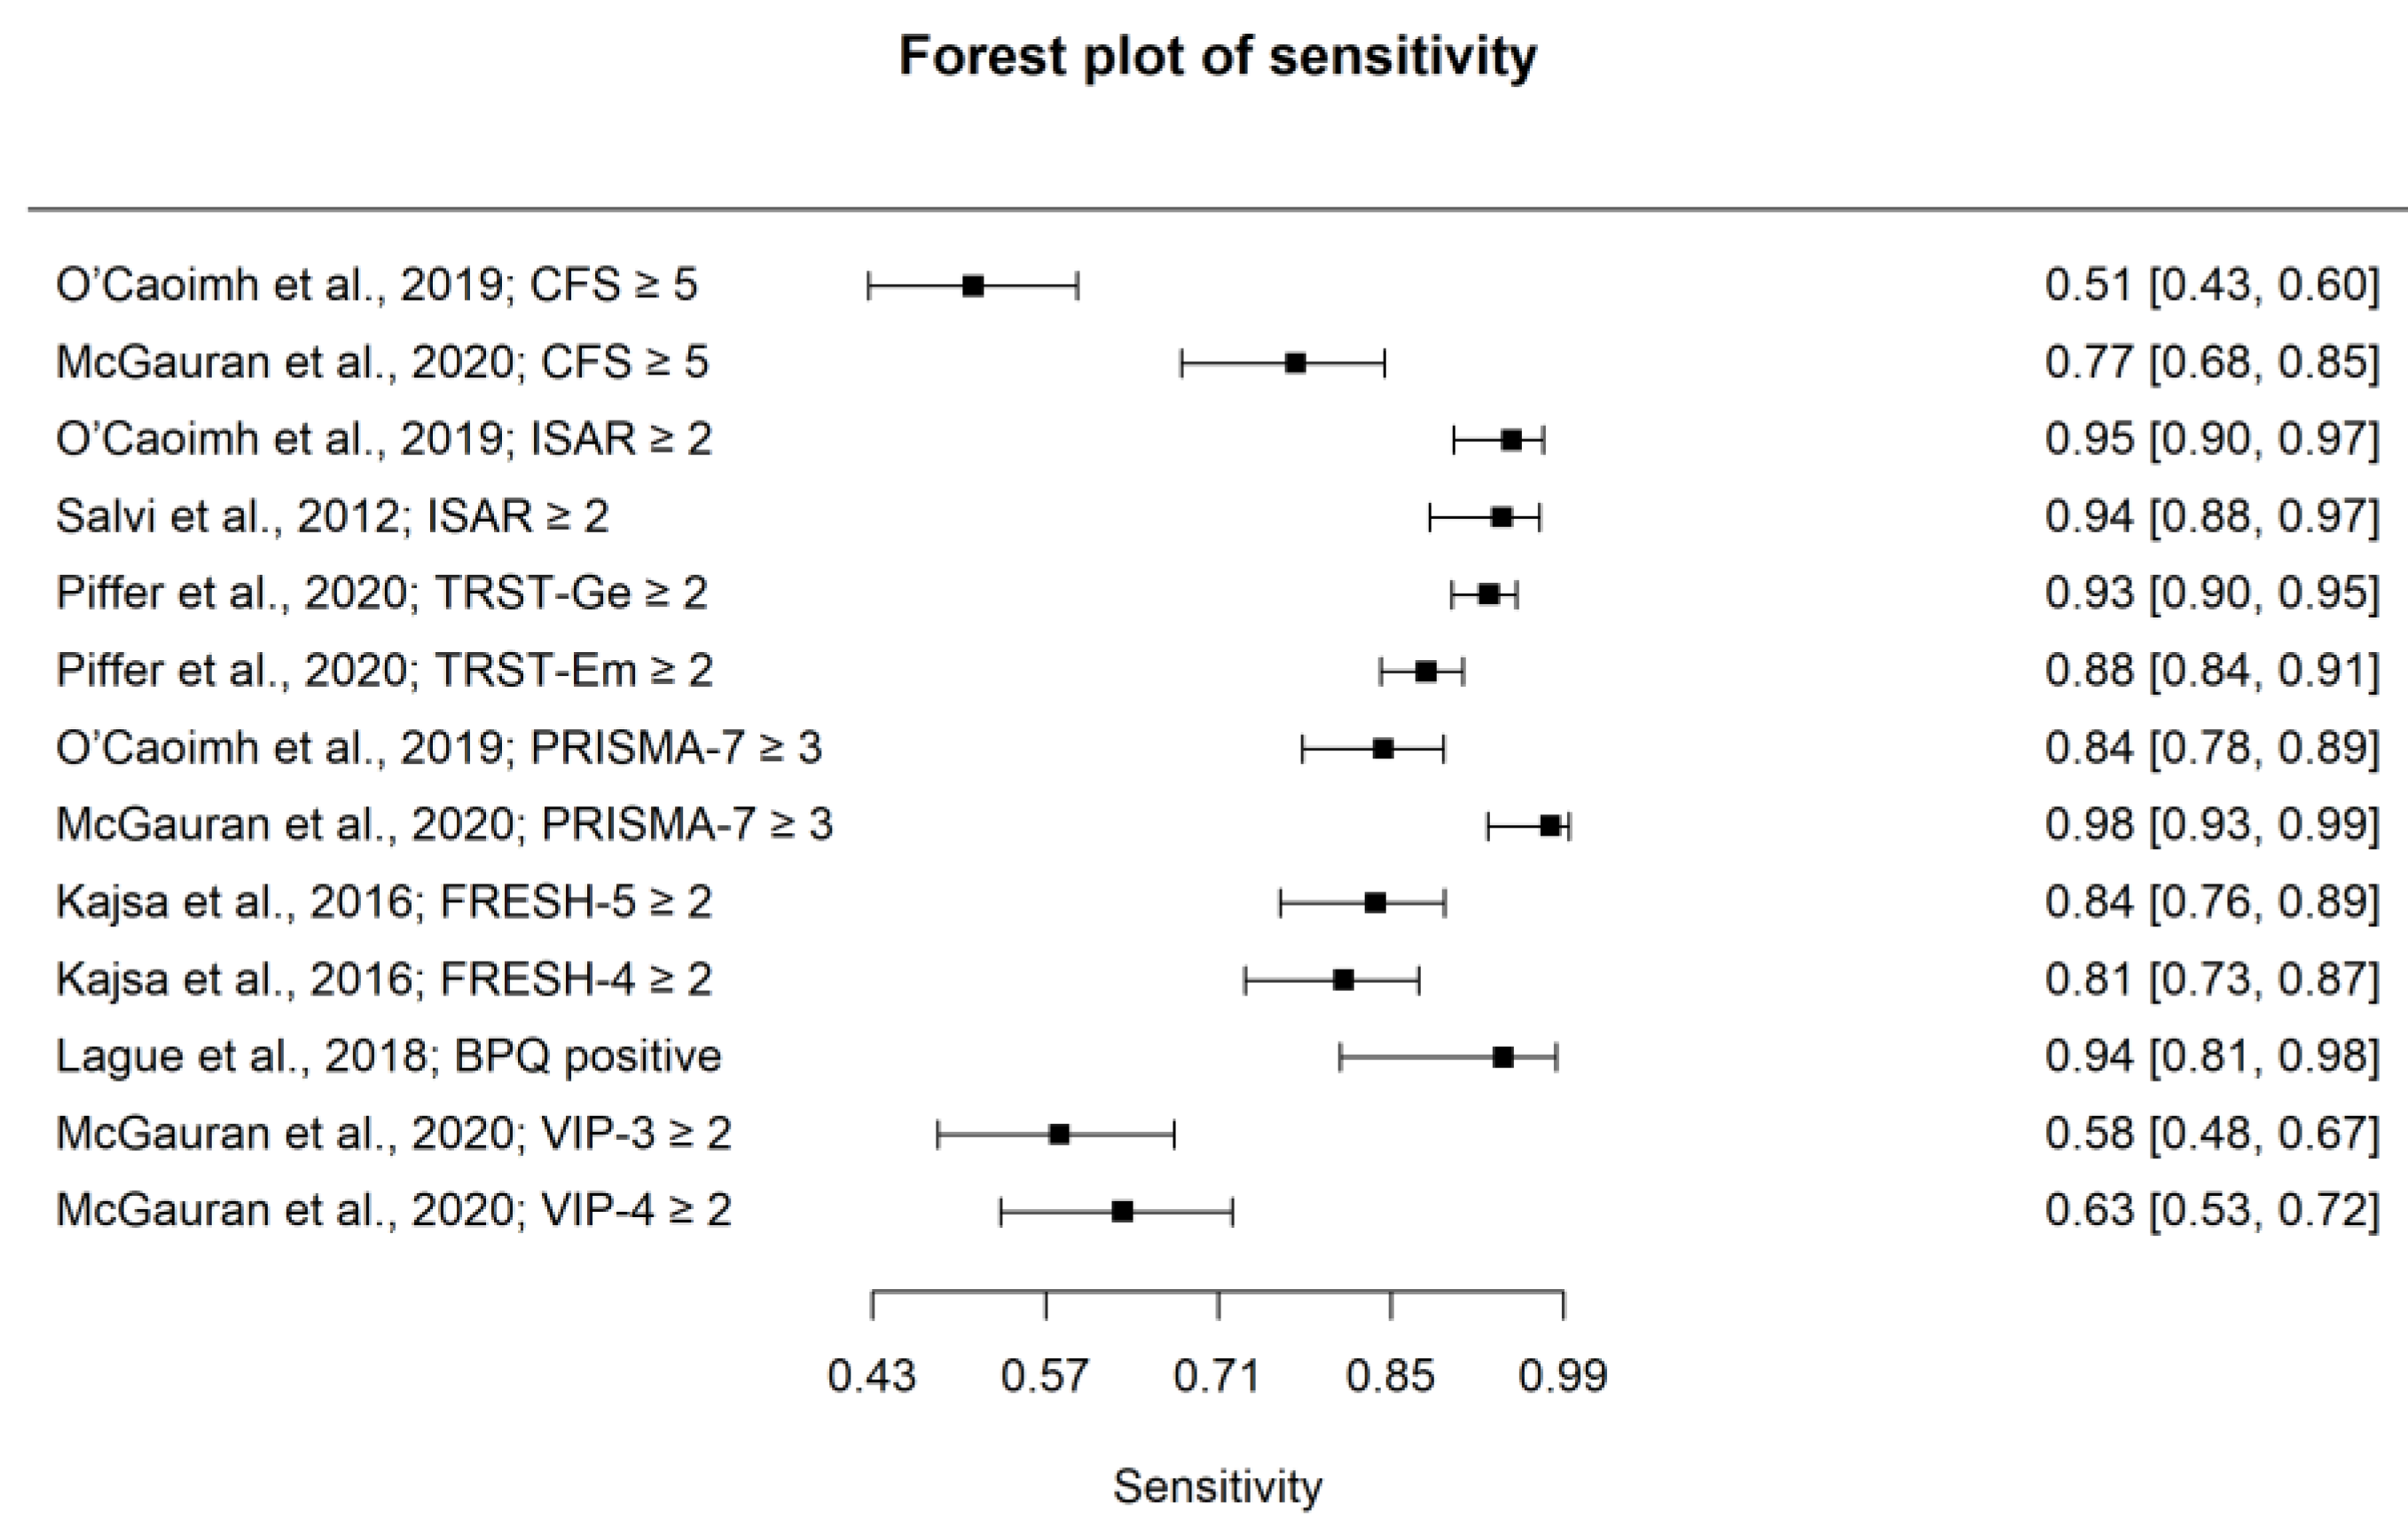
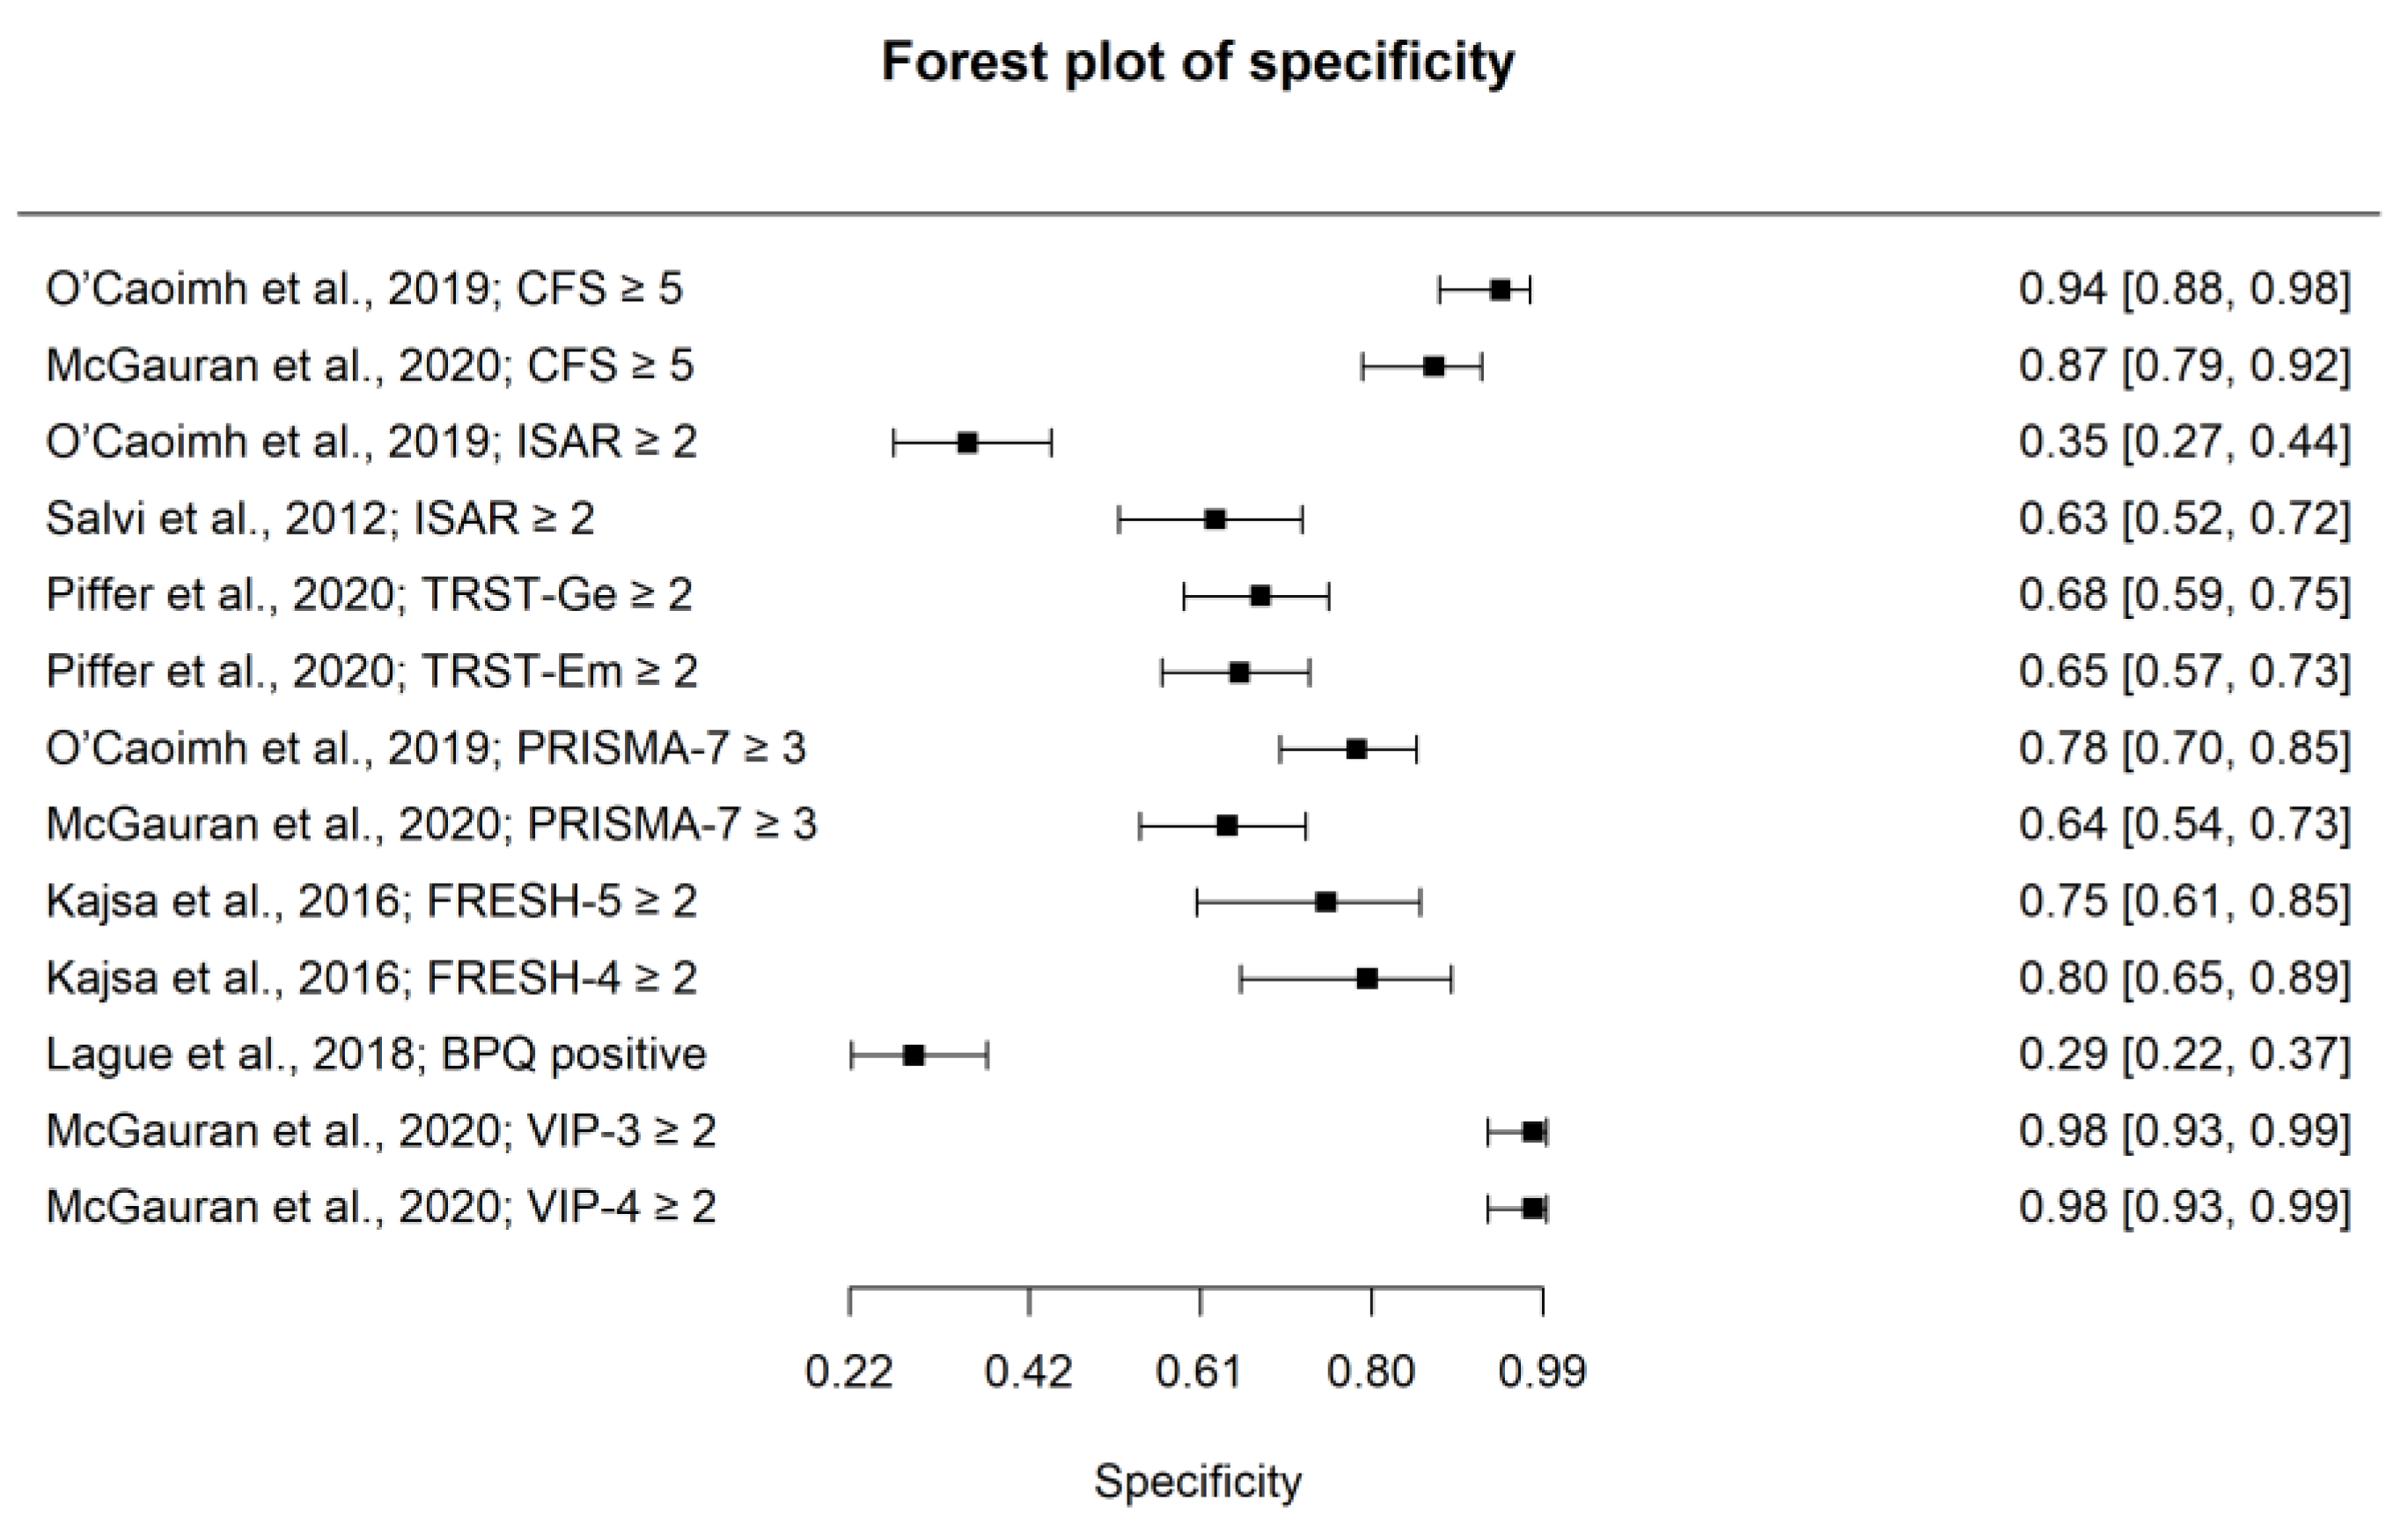
| Author | Year | Tool | TP | FN | FP | TN | N | Sen | Spec | Wt-Sen | Wt-Spec |
|---|---|---|---|---|---|---|---|---|---|---|---|
| O’Caoimh et al., | 2019 [10] | CFS ≥ 5 | 67 | 64 | 5 | 84 | 220 | 0.51 | 0.94 | 5.551 | 6.218 |
| McGauran et al., | 2020 [37] | CFS ≥ 5 | 75 | 22 | 13 | 86 | 196 | 0.77 | 0.87 | 5.88 | 6.131 |
| Salvi et al., | 2012 [8] | ISAR ≥ 2 | 110 | 7 | 31 | 52 | 200 | 0.94 | 0.63 | 6.075 | 5.457 |
| O’Caoimh et al., | 2019 [10] | ISAR ≥ 2 | 146 | 8 | 72 | 39 | 265 | 0.95 | 0.35 | 6.105 | 5.342 |
| O’Caoimh et al., | 2019 [10] | PRISMA-7 ≥ 3 | 130 | 24 | 24 | 87 | 265 | 0.84 | 0.78 | 6.065 | 6.061 |
| McGauran et al., | 2020 [37] | PRISMA-7 ≥ 3 | 95 | 2 | 36 | 63 | 196 | 0.98 | 0.64 | 6.051 | 5.423 |
| McGauran et al., | 2020 [37] | VIP-3 item ≥ 2 | 57 | 40 | 2 | 97 | 196 | 0.59 | 0.98 | 5.154 | 6.24 |
| McGauran et al., | 2020 [37] | VIP-4 item. ≥ 3 | 61 | 36 | 2 | 97 | 196 | 0.63 | 0.98 | 5.263 | 6.23 |
| Piffer et al., | 2020 [36] | G-TRST ≥ 2 | 345 | 26 | 41 | 86 | 498 | 0.93 | 0.68 | 6.16 | 5.822 |
| Piffer et al., | 2020 [36] | E-TRST ≥ 2 | 326 | 45 | 44 | 83 | 498 | 0.88 | 0.65 | 6.16 | 6.025 |
| Kajsa et al., | 2016 [34] | FRESH 4 item | 98 | 19 | 11 | 33 | 161 | 0.84 | 0.75 | 6.03 | 5.486 |
| Kajsa et al., | 2016 [34] | FRESH 5 item | 95 | 22 | 9 | 35 | 161 | 0.81 | 0.80 | 6.001 | 5.591 |
| Lague et al., | 2018 [35] | BPQ “No” | 32 | 2 | 97 | 40 | 171 | 0.94 | 0.29 | 5.741 | 5.339 |
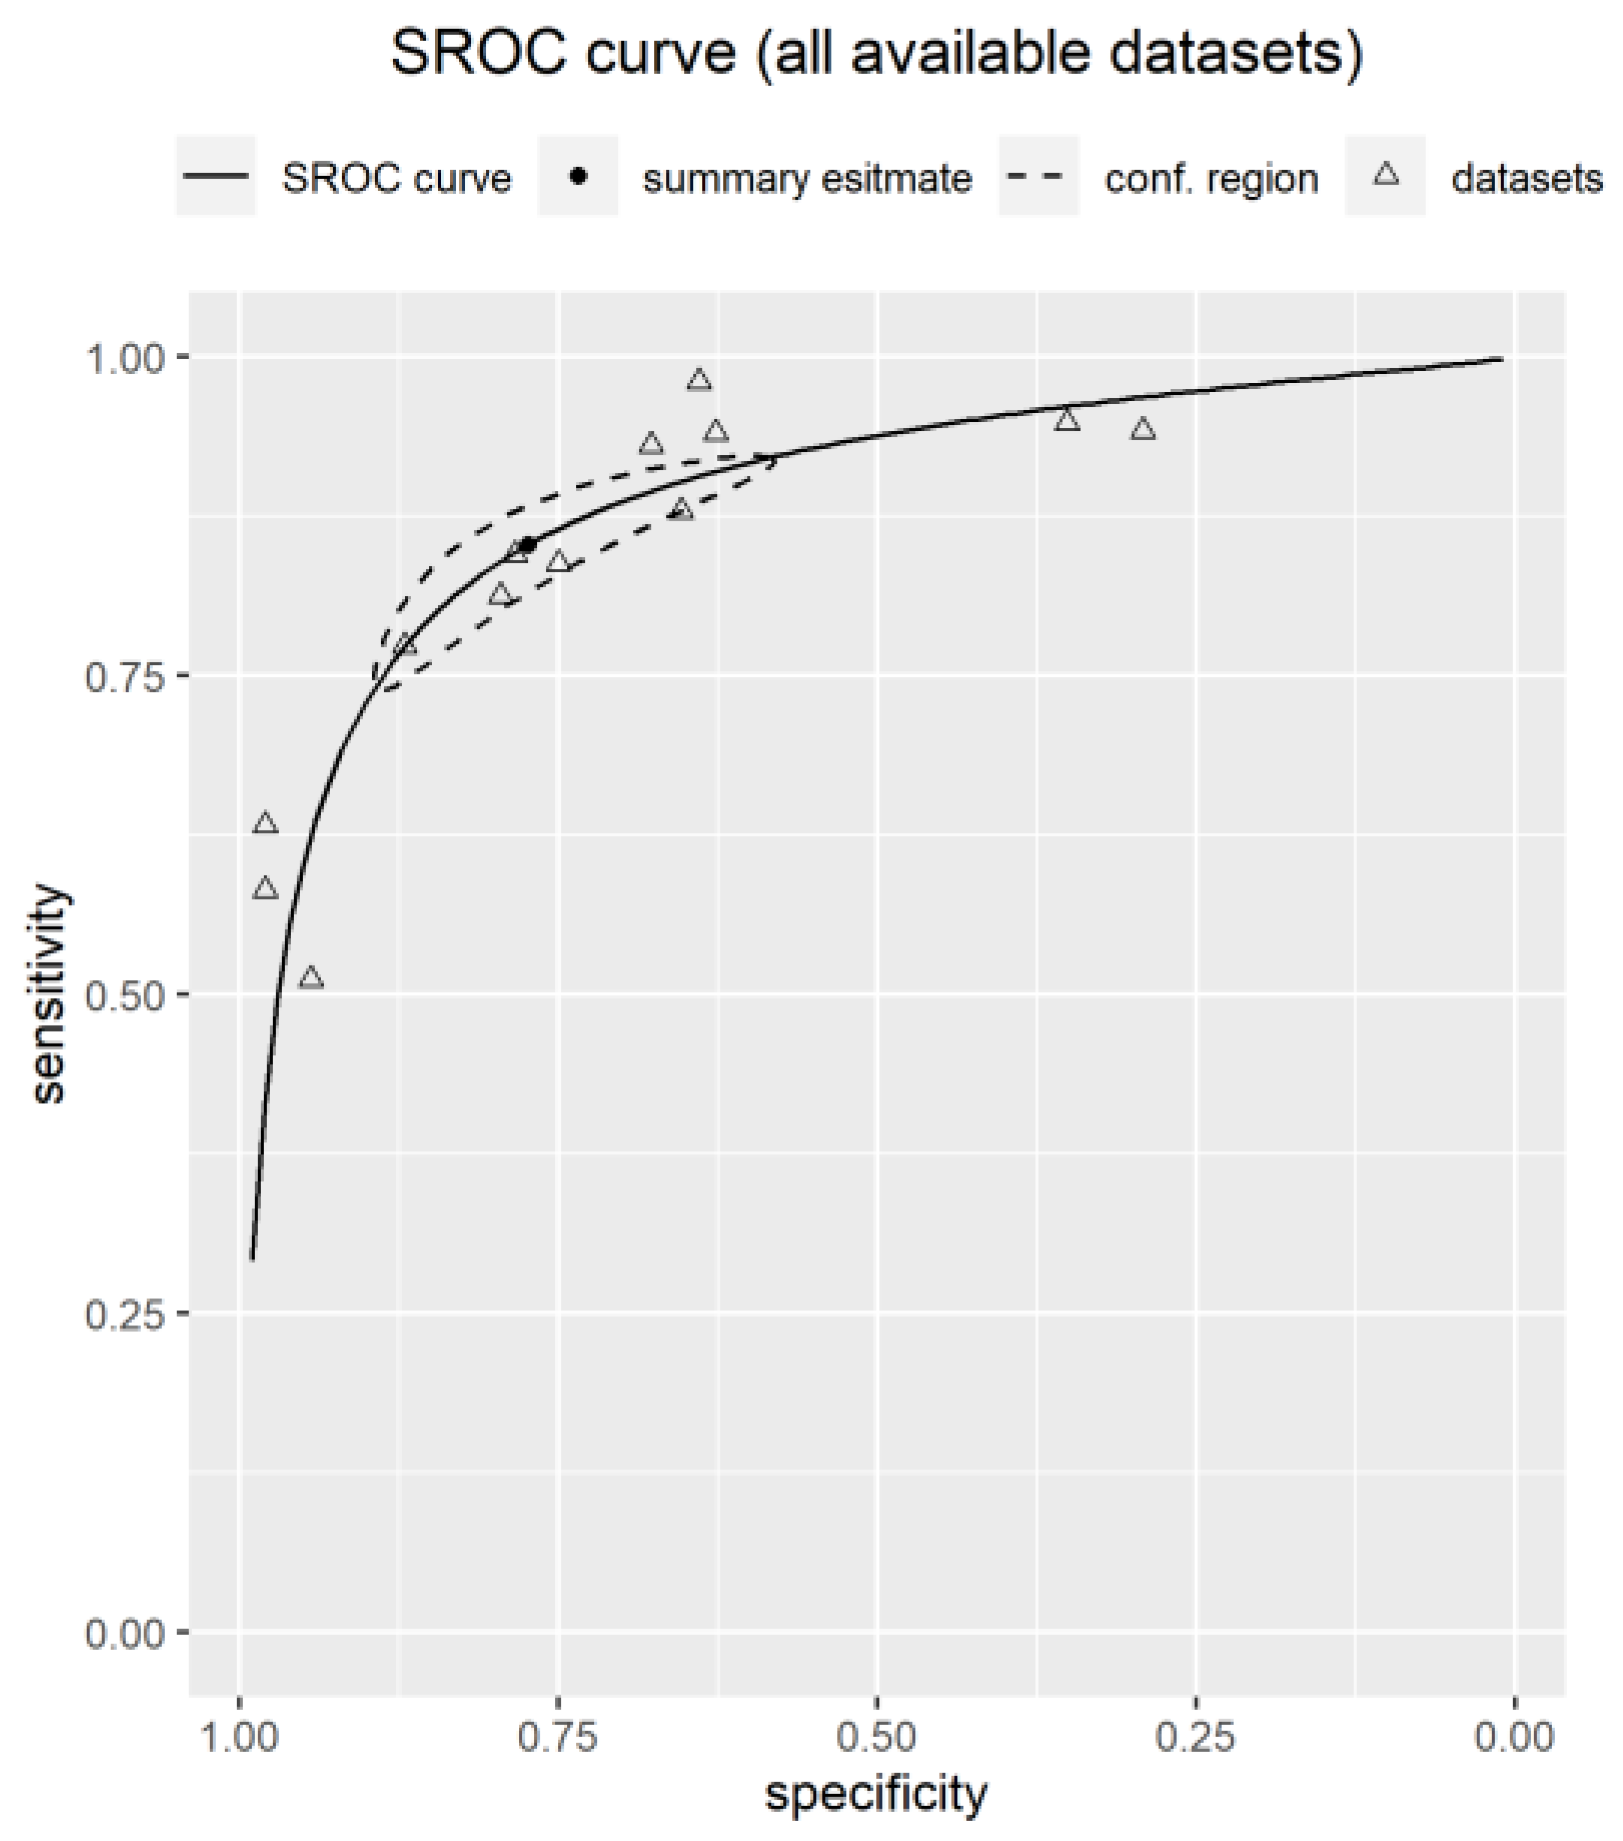
| Pooled Estimates (Datasets) | AUC (95% CI) | FPR (95% CI) | FNR (95% CI) | Sensitivity (95% CI) | Specificity (95% CI) | Youden’s (95% CI) | Accuracy (95% CI) | PPV (95% CI) | NPV (95% CI) | PLR (95% CI) | NLR (95% CI) |
|---|---|---|---|---|---|---|---|---|---|---|---|
| All available data points (n = 13) | 0.89 (0.86–0.90) | 0.23 (0.12–0.38) | 0.15 (0.09–0.24) | 0.85 (0.76– 0.91) | 0.77 (0.62– 0.88) | 0.62 (0.53– 0.67) | 0.82 (0.79– 0.84) | 0.85 (0.79–0.91) | 0.77 (0.70–0.82) | 3.91 (2.41–6.23) | 0.20 (0.14–0.27) |
Disclaimer/Publisher’s Note: The statements, opinions and data contained in all publications are solely those of the individual author(s) and contributor(s) and not of MDPI and/or the editor(s). MDPI and/or the editor(s) disclaim responsibility for any injury to people or property resulting from any ideas, methods, instructions or products referred to in the content. |
© 2023 by the authors. Licensee MDPI, Basel, Switzerland. This article is an open access article distributed under the terms and conditions of the Creative Commons Attribution (CC BY) license (https://creativecommons.org/licenses/by/4.0/).
Share and Cite
Moloney, E.; O’Donovan, M.R.; Sezgin, D.; Flanagan, E.; McGrath, K.; Timmons, S.; O’Caoimh, R. Diagnostic Accuracy of Frailty Screening Instruments Validated for Use among Older Adults Attending Emergency Departments: A Systematic Review and Meta-Analysis. Int. J. Environ. Res. Public Health 2023, 20, 6280. https://doi.org/10.3390/ijerph20136280
Moloney E, O’Donovan MR, Sezgin D, Flanagan E, McGrath K, Timmons S, O’Caoimh R. Diagnostic Accuracy of Frailty Screening Instruments Validated for Use among Older Adults Attending Emergency Departments: A Systematic Review and Meta-Analysis. International Journal of Environmental Research and Public Health. 2023; 20(13):6280. https://doi.org/10.3390/ijerph20136280
Chicago/Turabian StyleMoloney, Elizabeth, Mark R. O’Donovan, Duygu Sezgin, Evelyn Flanagan, Keith McGrath, Suzanne Timmons, and Rónán O’Caoimh. 2023. "Diagnostic Accuracy of Frailty Screening Instruments Validated for Use among Older Adults Attending Emergency Departments: A Systematic Review and Meta-Analysis" International Journal of Environmental Research and Public Health 20, no. 13: 6280. https://doi.org/10.3390/ijerph20136280