
Characterization of Static Strength, Vertical Jumping, and Isokinetic Strength in Soccer Players According to Age, Competitive Level, and Field Position
 ,
,  ,
,  ,
,  , , ,
, , ,  ,
,  and
and 
Abstract
:1. Introduction
2. Materials and Methods
2.1. Participants
2.2. Static Strength
2.3. Vertical Jumping Assessment
2.4. Isokinetic Assessment
2.5. Statistics
3. Results
4. Discussion
5. Conclusions
Author Contributions
Funding
Institutional Review Board Statement
Informed Consent Statement
Data Availability Statement
Acknowledgments
Conflicts of Interest
References
- Faude, O.; Koch, T.; Meyer, T. Straight sprinting is the most frequent action in goal situations in professional football. J. Sport. Sci. 2012, 30, 625–631. [Google Scholar] [CrossRef] [PubMed]
- Loturco, I.; Contreras, B.; Kobal, R.; Fernandes, V.; Moura, N.; Siqueira, F.; Winckler, C.; Suchomel, T.; Pereira, L.A. Vertically and horizontally directed muscle power exercises: Relationships with top-level sprint performance. PLoS ONE 2018, 13, e0201475. [Google Scholar] [CrossRef] [PubMed]
- Padulo, J.; Migliaccio, G.M.; Ardigò, L.P.; Leban, B.; Cosso, M.; Samozino, P. Lower limb force, velocity, power capabilities during leg press and squat movements. Int. J. Sport. Med. 2017, 38, 1083–1089. [Google Scholar] [CrossRef]
- Lehance, C.; Binet, J.; Bury, T.; Croisier, J.-L. Muscular strength, functional performances and injury risk in professional and junior elite soccer players. Scand. J. Med. Sci. Sport. 2009, 19, 243–251. [Google Scholar] [CrossRef]
- Knapik, J.J.; Ramos, M.U. Isokinetic and isometric torque relationships in the human body. Arch. Phys. Med. Rehabil. 1980, 61, 64–67. [Google Scholar] [PubMed]
- Duarte, J.P.; Valente-dos-Santos, J.; Coelho-e-Silva, M.J.; Couto, P.; Costa, D.; Martinho, D.; Seabra, A.; Cyrino, E.S.; Conde, J.; Rosado, J. Reproducibility of isokinetic strength assessment of knee muscle actions in adult athletes: Torques and antagonist-agonist ratios derived at the same angle position. PLoS ONE 2018, 13, e0202261. [Google Scholar] [CrossRef] [Green Version]
- Delvaux, F.; Schwartz, C.; Rodriguez, C.; Forthomme, B.; Kaux, J.-F.; Croisier, J.-L. Preseason assessment of anaerobic performance in elite soccer players: Comparison of isokinetic and functional tests. Sport. Biomech. 2020, 1–15. [Google Scholar] [CrossRef]
- Gleeson, N.; Mercer, T. The utility of isokinetic dynamometry in the assessment of human muscle function. Sport. Med. 1996, 21, 18–34. [Google Scholar] [CrossRef]
- Spiteri, T.; Nimphius, S.; Hart, N.H.; Specos, C.; Sheppard, J.M.; Newton, R.U. Contribution of strength characteristics to change of direction and agility performance in female basketball athletes. J. Strength Cond. Res. 2014, 28, 2415–2423. [Google Scholar] [CrossRef]
- Wisloff, U.; Castagna, C.; Helgerud, J.; Jones, R.; Hoff, J. Strong correlation of maximal squat strength with sprint performance and vertical jump height in elite soccer players. Br. J. Sport. Med. 2004, 38, 285–288. [Google Scholar] [CrossRef]
- Križaj, J.; Rauter, S.; Vodičar, J.; Hadžić, V.; Šimenko, J. Predictors of vertical jumping capacity in soccer players. Isokinet. Exerc. Sci. 2019, 27, 9–14. [Google Scholar] [CrossRef]
- McGuigan, M.R.; Doyle, T.L.; Newton, M.; Edwards, D.J.; Nimphius, S.; Newton, R.U. Eccentric utilization ratio: Effect of sport and phase of training. J. Strength Cond. Res. 2006, 20, 992–995. [Google Scholar] [CrossRef] [PubMed]
- Cometti, G.; Maffiuletti, N.; Pousson, M.; Chatard, J.-C.; Maffulli, N. Isokinetic strength and anaerobic power of elite, subelite and amateur French soccer players. Int. J. Sport. Med. 2001, 22, 45–51. [Google Scholar] [CrossRef]
- Ostojic, S.M. Elite and nonelite soccer players: Preseasonal physical and physiological characteristics. Res. Sport. Med. 2004, 12, 143–150. [Google Scholar] [CrossRef]
- Trosclair, D.; Bellar, D.; Judge, L.; Smith, J.; Mazerat, N.; Brignac, A. Hand-grip strength as a predictor of muscular strength and endurance. J. Strength Cond. Res. 2011, 25, S99. [Google Scholar] [CrossRef]
- Cronin, J.; Lawton, T.; Harris, N.; Kilding, A.; McMaster, D.T. A brief review of handgrip strength and sport performance. J. Strength Cond. Res. 2017, 31, 3187–3217. [Google Scholar] [CrossRef] [Green Version]
- Silva, J.R.L.C.; Detanico, D.; Pupo, J.D.; Freitas, C.d.l.R. Bilateral asymmetry of knee and ankle isokinetic torque in soccer players u20 category. Rev. Bras. Cineantropometria Desempenho Hum. 2015, 17, 195–204. [Google Scholar]
- Ruas, C.V.; Minozzo, F.; Pinto, M.D.; Brown, L.E.; Pinto, R.S. Lower-extremity strength ratios of professional soccer players according to field position. J. Strength Cond. Res. 2015, 29, 1220–1226. [Google Scholar] [CrossRef] [PubMed]
- Tourny-Chollet, C.; Leroy, D.; Léger, H.; Beuret-Blanquart, F. Isokinetic knee muscle strength of soccer players according to their position. Isokinet. Exerc. Sci. 2000, 8, 187–193. [Google Scholar] [CrossRef]
- Gerodimos, V. Reliability of handgrip strength test in basketball players. J. Hum. Kinet. 2012, 31, 25. [Google Scholar] [CrossRef]
- Bosco, C.; Luhtanen, P.; Komi, P.V. A simple method for measurement of mechanical power in jumping. Eur. J. Appl. Physiol. Occup. Physiol. 1983, 50, 273–282. [Google Scholar] [CrossRef] [PubMed]
- Petrigna, L.; Karsten, B.; Marcolin, G.; Paoli, A.; D’Antona, G.; Palma, A.; Bianco, A. A review of countermovement and squat jump testing methods in the context of public health examination in adolescence: Reliability and feasibility of current testing procedures. Front. Physiol. 2019, 10, 1384. [Google Scholar] [CrossRef] [PubMed] [Green Version]
- Wu, P.P.-Y.; Sterkenburg, N.; Everett, K.; Chapman, D.W.; White, N.; Mengersen, K. Predicting fatigue using countermovement jump force-time signatures: PCA can distinguish neuromuscular versus metabolic fatigue. PLoS ONE 2019, 14, e0219295. [Google Scholar] [CrossRef] [PubMed] [Green Version]
- Ishak, A.; Wong, F.Y.; Seurot, A.; Cocking, S.; Pullinger, S.A. The influence of recovery period following a pre-load stimulus on physical performance measures in handball players. PLoS ONE 2022, 17, e0249969. [Google Scholar] [CrossRef] [PubMed]
- Markovic, S.; Mirkov, D.M.; Nedeljkovic, A.; Jaric, S. Body size and countermovement depth confound relationship between muscle power output and jumping performance. Hum. Mov. Sci. 2014, 33, 203–210. [Google Scholar] [CrossRef] [PubMed] [Green Version]
- Correia, P.; Mil-Homens, P.; Mendonça, G. Avaliação, planeamento e aplicações. In Treino da Força (Volume 2); FMH, E., Ed.; Faculdade de Motricidade Humana: Lisbon, Cruz Quebrada, 2017. [Google Scholar]
- Osternig, L.R. Isokinetic dynamometry: Implications for muscle testing and rehabilitation. Exerc. Sport Sci. Rev. 1986, 14, 45–80. [Google Scholar] [CrossRef]
- Baltzopoulos, V.; Williams, J.G.; Brodie, D.A. Sources of error in isokinetic dynamometry: Effects of visual feedback on maximum torque measurements. J. Orthop. Sport. Phys. Ther. 1991, 13, 138–142. [Google Scholar] [CrossRef] [Green Version]
- Croix, M.D.S.; ElNagar, Y.O.; Iga, J.; Ayala, F.; James, D. The impact of joint angle and movement velocity on sex differences in the functional hamstring/quadriceps ratio. Knee 2017, 24, 745–750. [Google Scholar] [CrossRef]
- Biodex. Biodex System 4 (Advantage BX Software 5.3X): Instructions for Use; Biodex: New York, NY, USA, 2021. [Google Scholar]
- Keiner, M.; Kapsecker, A.; Stefer, T.; Kadlubowski, B.; Wirth, K. Differences in Squat Jump, Linear Sprint, and Change-of-Direction Performance among Youth Soccer Players According to Competitive Level. Sports 2021, 9, 149. [Google Scholar] [CrossRef]
- Gissis, I.; Papadopoulos, C.; Kalapotharakos, V.I.; Sotiropoulos, A.; Komsis, G.; Manolopoulos, E. Strength and speed characteristics of elite, subelite, and recreational young soccer players. Res. Sport. Med. 2006, 14, 205–214. [Google Scholar] [CrossRef]
- Parpa, K.; Michaelides, M. Peak isokinetic Torques of football players participating in different levels in cyprus and lower limb asymmetries. J. Sport. Sci. 2017, 5, 250–255. [Google Scholar]
- Beato, M.; Young, D.; Stiff, A.; Coratella, G. Lower-limb muscle strength, anterior-posterior and inter-limb asymmetry in professional, elite academy and amateur soccer players. J. Hum. Kinet. 2021, 77, 135–146. [Google Scholar] [CrossRef] [PubMed]
- Nikolaidis, P. Age-related differences in countermovement vertical jump in soccer players 8-31 years old: The role of fat-free mass. Am. J. Sport. Sci. Med. 2014, 2, 60–64. [Google Scholar]
- Aagaard, P.; Simonsen, E.B.; Andersen, J.L.; Magnusson, P.; Dyhre-Poulsen, P. Increased rate of force development and neural drive of human skeletal muscle following resistance training. J. Appl. Physiol. 2002, 93, 1318–1326. [Google Scholar] [CrossRef]
- Stone, M.H.; Sands, W.A.; Pierce, K.C.; Carlock, J.; Cardinale, M.; Newton, R.U. Relationship of maximum strength to weightlifting performance. Med. Sci. Sport. Exerc. 2005, 37, 1037–1043. [Google Scholar]
- Śliwowski, R.; Grygorowicz, M.; Hojszyk, R.; Jadczak, Ł. The isokinetic strength profile of elite soccer players according to playing position. PLoS ONE 2017, 12, e0182177. [Google Scholar] [CrossRef] [Green Version]
- Sporis, G.; Jukic, I.; Ostojic, S.M.; Milanovic, D. Fitness profiling in soccer: Physical and physiologic characteristics of elite players. J. Strength Cond Res. 2009, 23, 1947–1953. [Google Scholar] [CrossRef] [Green Version]
- Aagaard, P.; Simonsen, E.B.; Magnusson, S.P.; Larsson, B.; Dyhre-Poulsen, P. A new concept for isokinetic hamstring: Quadriceps muscle strength ratio. Am. J. Sport. Med. 1998, 26, 231–237. [Google Scholar] [CrossRef]
- Sapega, A. Muscle performance evaluation in orthopaedic practice. JBJS 1990, 72, 1562–1574. [Google Scholar] [CrossRef]


| Variables | Units | Description |
|---|---|---|
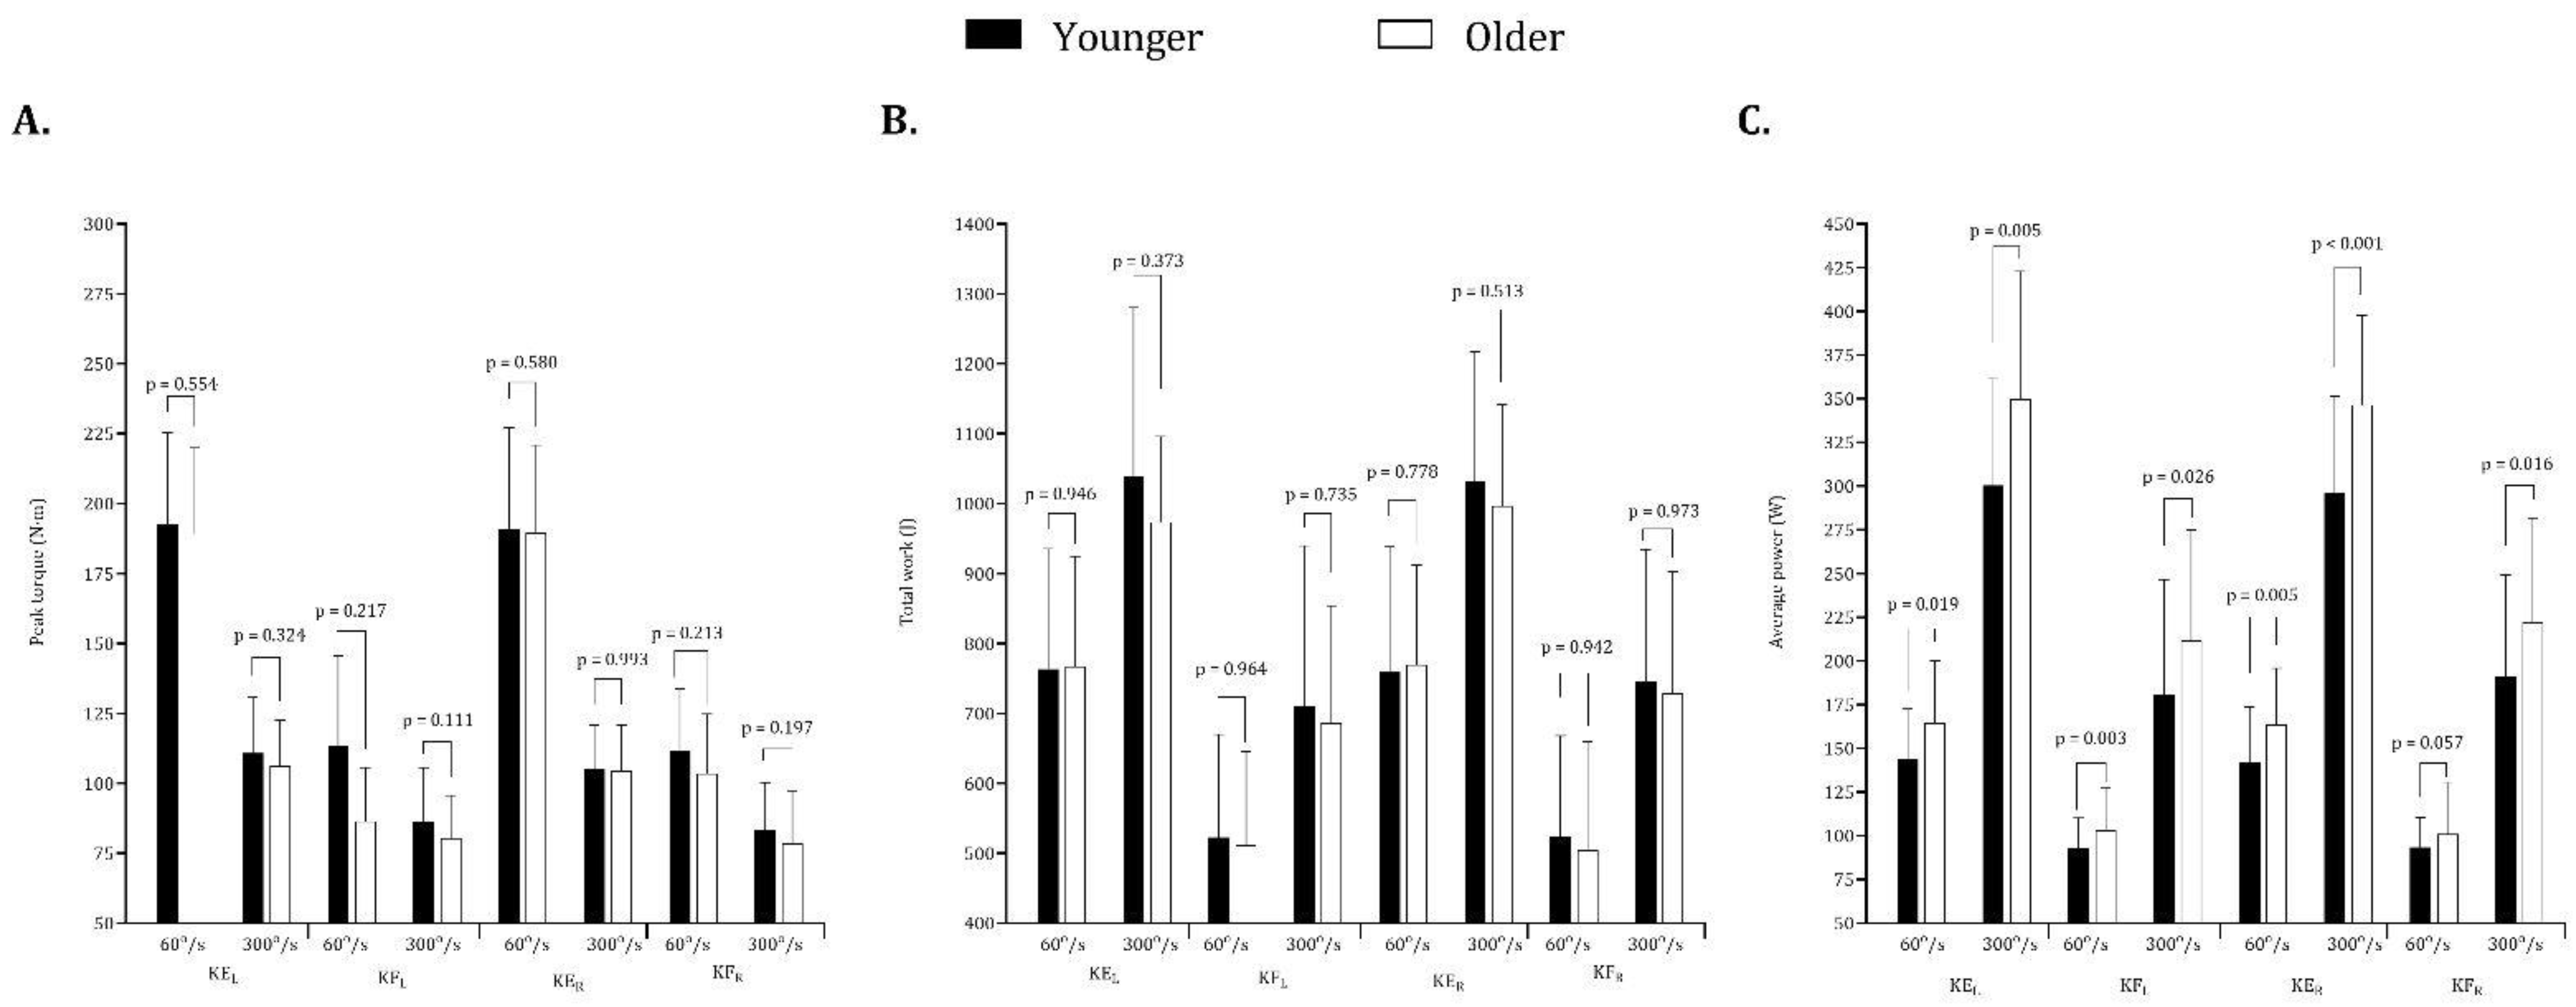
| Peak torque | Newtons/meter (N·m) | Highest force output during a repetition. Indicative of muscle strength capabilities. |
| Total work | Joules (J) | The sum of work for every repetition performed. Represents a more functional value of muscle performance, as work is torque sustained over time in an isometric test. |
| Average power | Watts (W) | The average rate of doing work. This is how effectively the muscle can perform work over time. |
| Variables | A Team (1) | B Team (2) | U-23 (3) | U-19 (4) | p | * |
|---|---|---|---|---|---|---|
| Mean (SD) | Mean (SD) | Mean (SD) | Mean (SD) | |||
| Strength indicators | ||||||
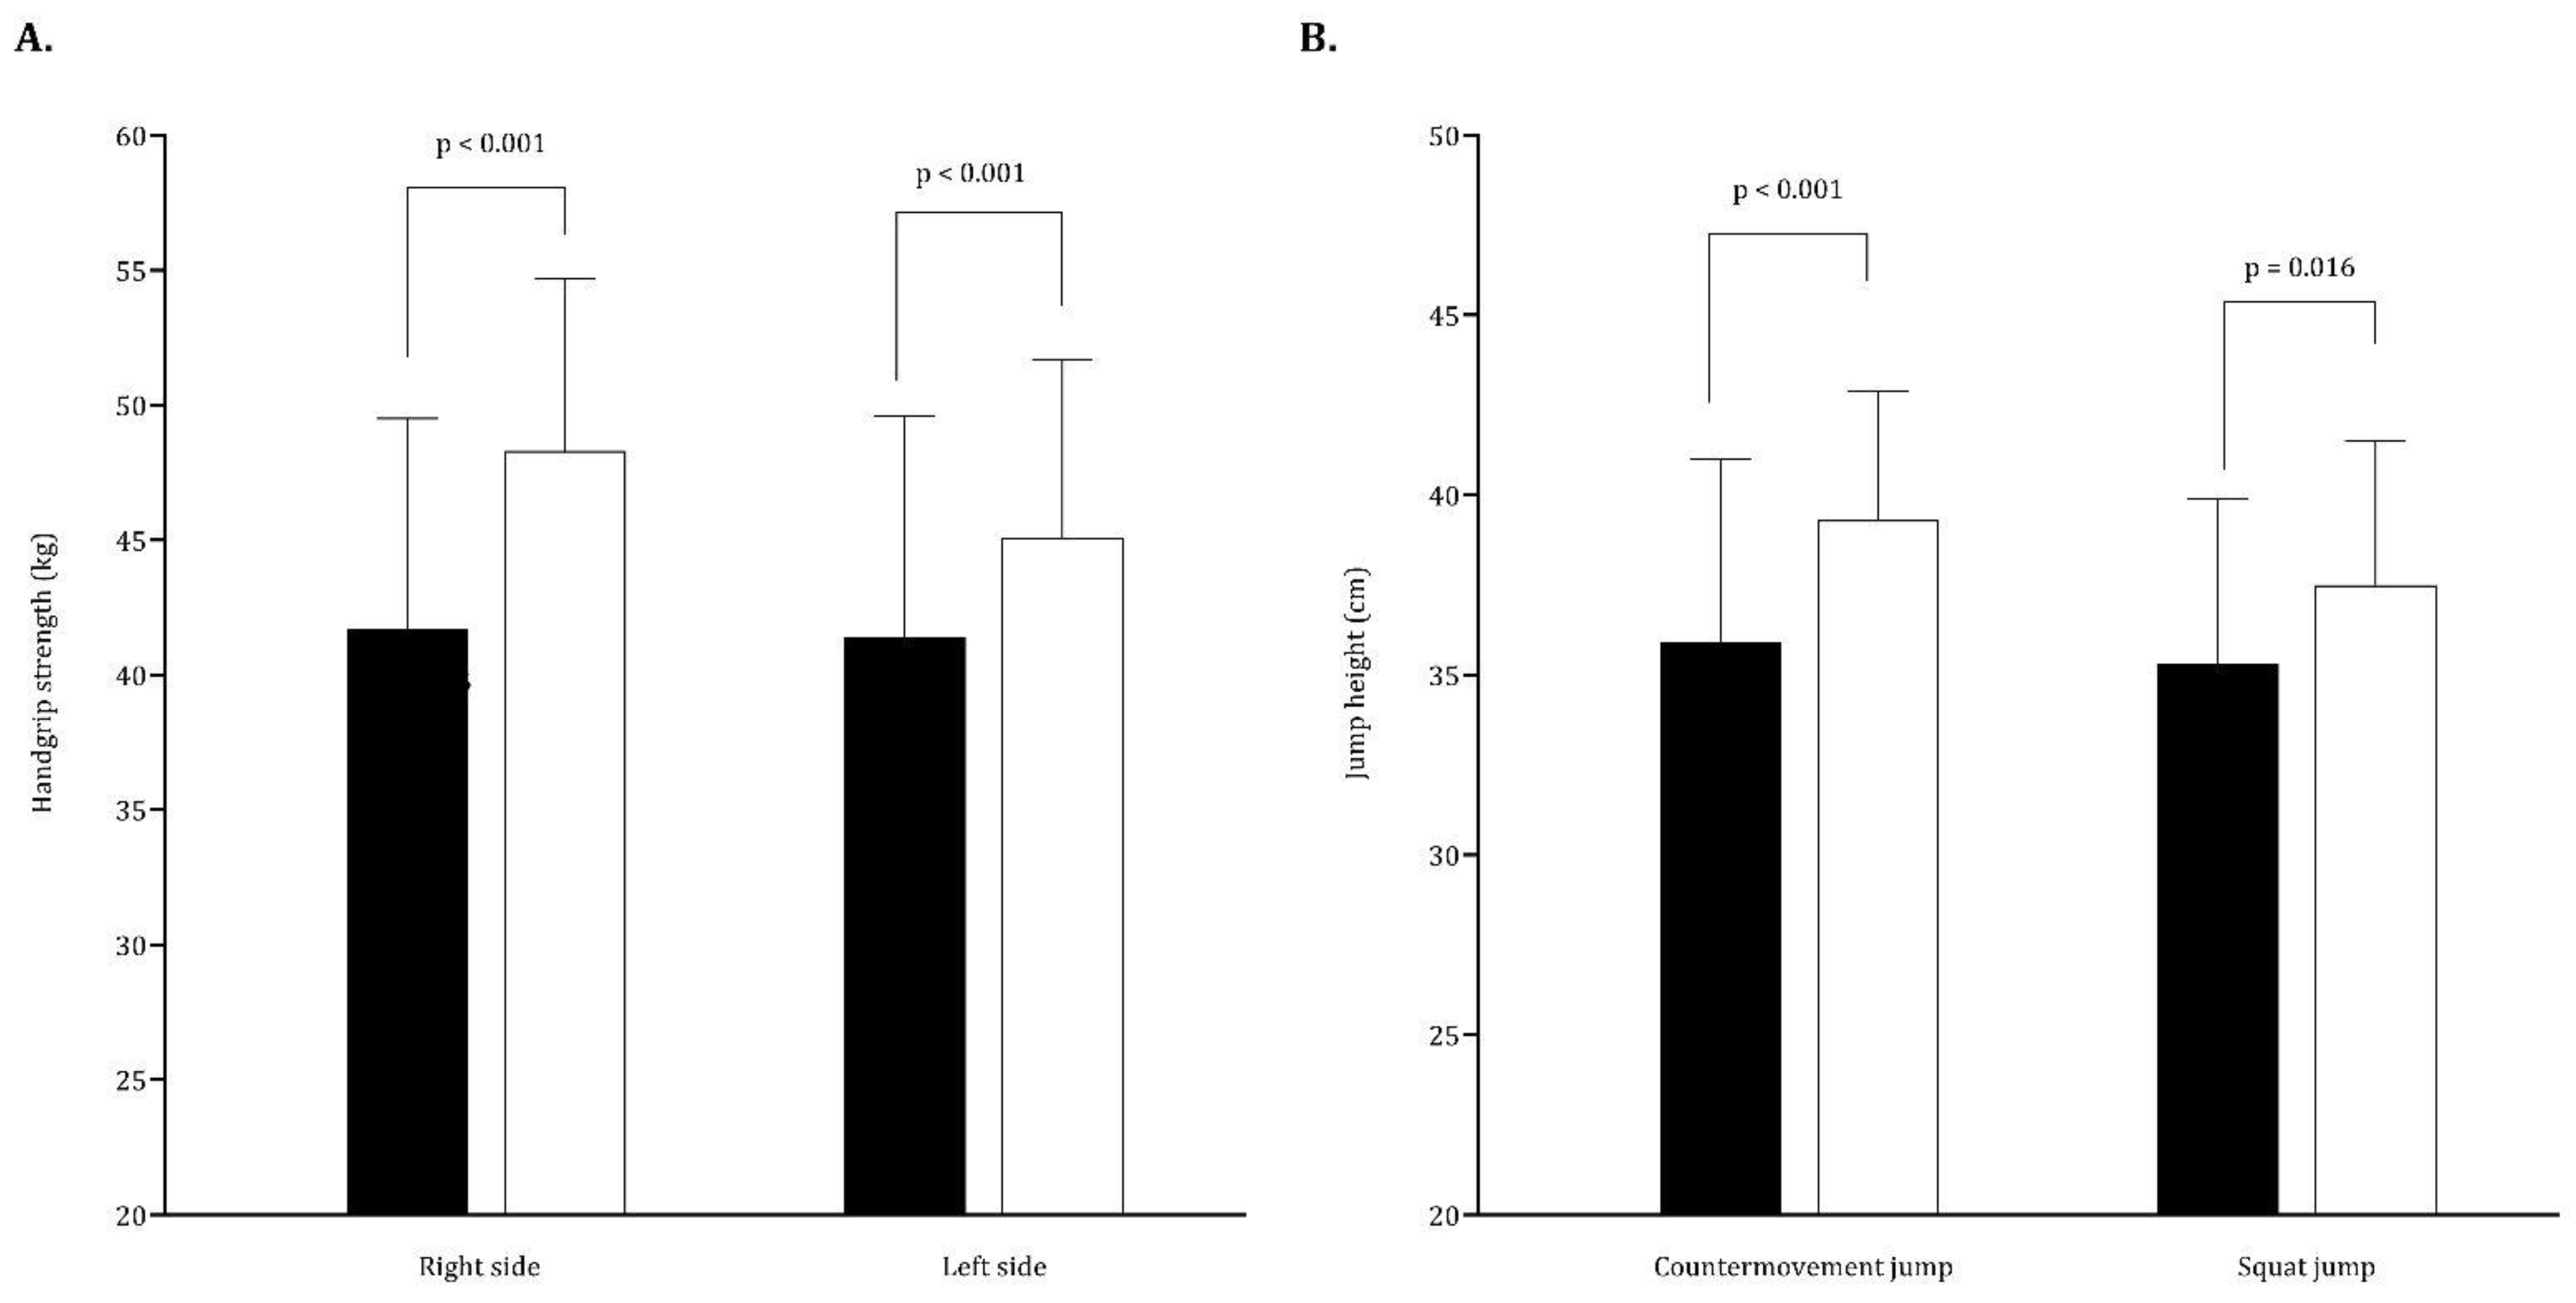
| Handgrip right side (kg) | 49 (4.6) | 48.1 (7.6) | 44.2 (8.4) | 39.7 (6) | ≤0.001 | 1 > 3 and 4; 2 > 4; 3 > 4 |
| Handgrip left side (kg) | 47.9 (6.5) | 43.5 (6.6) | 42.8 (8.1) | 39.1 (6.8) | ≤0.001 | 1 > 3 and 4; 2 > 4 |
| CMJ height (cm) | 40.7 (4.3) | 38.2 (3.5) | 37.2 (4.2) | 34.5 (4.5) | ≤0.001 | 1 > 2, 3 and 4; 2 > 4; 3 > 4 |
| SJ height (cm) | 38.4 (4.3) | 37.3 (3.8) | 35.3 (4.1) | 34.7 (4.5) | 0.019 | 1 > 3 and 4 |
| Extension—Left Knee | Extension—Right Knee | |||||||||||
|---|---|---|---|---|---|---|---|---|---|---|---|---|
| A Team (1) | B Team (2) | U-23 (3) | U-19 (4) | A Team (1) | B Team (2) | U-23 (3) | U-19 (4) | |||||
| Mean (SD) | Mean (SD) | Mean (SD) | Mean (SD) | p | * | Mean (SD) | Mean (SD) | Mean (SD) | Mean (SD) | p | * | |
| Peak Torque | ||||||||||||
| 60°/s (N·m) | 198.0 (29.6) | 177.7 (32.8) | 177.2 (27.0) | 206.5 (28.2) | 0.007 | 1 > 3; 2 ≤ 4; 3 ≤ 4 | 196.3 (26.7) | 186.3 (36.1) | 171.1 (37.7) | 205.1 (26.5) | 0.056 | 3 ≤ 4 |
| 300°/s (N·m) | 108.4 (14.2) | 106.6 (20.3) | 99.2 (15.1) | 119.1 (19.3) | 0.027 | 3 ≤ 4 | 106.4 (12.7) | 105.0 (20.1) | 96.6 (14.1) | 111.0 (15.4) | 0.082 | n.s. |
| Total Work | ||||||||||||
| 60°/s (J) | 808.9 (156.6) | 722.0 (157.2) | 674.2 (142.0) | 838.5 (151.8) | 0.007 | 1 > 3; 2 ≤ 4; 3 ≤ 4 | 811.1 (142.5) | 747.4 (151.9) | 666.2 (144.5) | 820.5 (163.0) | 0.022 | 1 > 3; 3 ≤ 4 |
| 300°/s (J) | 1010.9 (106.1) | 954.0 (156.7) | 882.2 (141.4) | 1160.3 (229.8) | ≤0.001 | 1 > 3; 2 ≤ 4; 3 ≤ 4 | 1019.6 (115.0) | 1019.5 (185.0) | 886.7 (126.9) | 1124.8 (159.9) | 0.001 | 1 > 3; 3 ≤ 4 |
| Average Power | ||||||||||||
| 60°/s (W) | 172.4 (34.9) | 155.8 (37.3) | 154.1 (27.3) | 134.1 (24.5) | 0.011 | 1 > 4 | 167.5 (30.2) | 163.7 (34.9) | 151.6 (35.7) | 130.3 (20.7) | 0.002 | 1 > 4; 2 > 4 |
| 300°/s (W) | 350.3 (37.7) | 370.8 (109.0) | 309.9 (45.6) | 279.5 (58.9) | ≤0.001 | 1 > 3 and 4; 2 > 4 | 353.1 (35.9) | 355.0 (68.0) | 313.9 (45.5) | 270.0 (44.2) | ≤0.001 | 1 > 3 and 4; 2 > 4; 3 ≤ 4 |
| Flexion—Left Knee | Flexion—Right Knee | |||||||||||
| Peak Torque | ||||||||||||
| 60°/s (N·m) | 111.2 (17.8) | 94.5 (23.0) | 95.1 (15.4) | 129.3 (34.8) | ≤0.001 | 1 > 2 and 3; 1 ≤ 4; 2 ≤ 4; 3 ≤ 4 | 107.9 (18.2) | 96.5 (25.0) | 97.7 (16.0) | 125.0 (18.4) | ≤0.001 | 1 > 3 and 1 ≤ 4; 2 ≤ 4; 3 ≤ 4 |
| 300°/s (N·m) | 82.1 (11.7) | 81.5 (20.9) | 77.9 (16.1) | 91.2 (20.0) | 0.179 | 78.9 (13.5) | 81.3 (25.6) | 75.8 (12.5) | 87.2 (19.9) | 0.419 | ||
| Total Work | ||||||||||||
| 60°/s (J) | 559.7 (129.5) | 453.4 (141.9) | 441.6 (104.6) | 588.5 (132.5) | 0.001 | 1 > 2 and 3; 2 ≤ 4; 3 ≤ 4 | 561.8 (141.7) | 430.3 (167.2) | 444.2 (90.3) | 587.7 (140.8) | 0.002 | 1 > 2 and 3; 2 ≤ 4; 3 ≤ 4 |
| 300°/s (J) | 748.2 (164.0) | 635.2 (176.6) | 633.5 (124.3) | 750.5 (277.3) | 0.013 | 1 > 2 and 3; 3 ≤ 4 | 761.3 (139.7) | 720.4 (224.5) | 667.1 (128.4) | 791.0 (216.5) | 0.145 | 1 > 3 |
| Average Power | ||||||||||||
| 60°/s (W) | 111.7 (20.8) | 91.4 (27.3) | 98.2 (16.2) | 86.9 (15.6) | 0.003 | 1 > 3 and 4 | 108.9 (23.6) | 89.6 (35.7) | 97.5 (19.2) | 89.5 (14.3) | 0.018 | 1 > 4 |
| 300°/s (W) | 232.8 (60.7) | 199.7 (72.6) | 193.7 (40.8) | 155.6 (65.5) | 0.002 | 1 > 3 and 4 | 237.5 (51.9) | 214.4 (70.8) | 206.7 (47.6) | 165.5 (54.1) | 0.003 | 1 > 4; 2 > 4; 3 ≤ 4 |
| Strength Indicators | GK (1) | DEF (2) | MID (3) | AT (4) | p | * |
|---|---|---|---|---|---|---|
| Mean ± SD | Mean ± SD | Mean ± SD | Mean ± SD | |||
| Handgrip right side (kg) | 45.8 (9.5) | 48.1 (7.6) | 44.2 (8.4) | 39.7 (6.8) | 0.554 | n.s. |
| Handgrip left side (kg) | 43.9 (8.3) | 43.5 (6.6) | 42.8 (8.1) | 39.1 (6.8) | 0.398 | n.s. |
| CMJ height (cm) | 38.4 (5.2) | 38.2 (3.5) | 37.2 (4.2) | 34.5 (4.5) | 0.939 | n.s. |
| SJ height (cm) | 36.6 (3.8) | 37.3 (3.8) | 35.3 (4.1) | 34.7 (4.5) | 0.985 | n.s. |
| Extension—Left Knee | Extension—Right Knee | |||||||||||
|---|---|---|---|---|---|---|---|---|---|---|---|---|
| GK (1) | DEF (2) | MID (3) | AT (4) | GK (1) | DEF (2) | MID (3) | AT (4) | |||||
| Mean (SD) | Mean (SD) | Mean (SD) | Mean (SD) | p | * | Mean (SD) | Mean (SD) | Mean (SD) | Mean (SD) | p | * | |
| Peak Torque | ||||||||||||
| 60°/s (N·m) | 202.9 (27.0) | 194.4 (31.4) | 182.8 (35.3) | 194.5 (25.2) | 0.287 | n.s. | 196.3 (26.7) | 186.3 (36.1) | 171.1 (37.7) | 205.1 (26.5) | 0.056 | 3 ≤ 4 |
| 300°/s (N·m) | 117.2 (17.8) | 107.4 (18.1) | 104.4 (20.6) | 113.3 (13.3) | 0.190 | n.s. | 104.2 (8.4) | 106.0 (15.6) | 100.4 (17.1) | 109.9 (15.6) | 0.439 | n.s. |
| Total Work | ||||||||||||
| 60°/s (J) | 857.9 (177.7) | 757.6 (149.5) | 744.3 (186.1) | 782.3 (143.7) | 0.352 | n.s. | 772.1 (146.1) | 762.1 (161.0) | 743.5 (156.9) | 798.0 (174.3) | 0.705 | n.s. |
| 300°/s (J) | 1096.4 (189.4) | 989.4 (173.4) | 1002.2 (237.2) | 1005.2 (130.4) | 0.712 | n.s. | 984.7 (68.2) | 1021.6 (171.8) | 988.7 (180.8) | 1042.9 (157.6) | 0.854 | n.s. |
| Average Power | ||||||||||||
| 60°/s (W) | 170.2 (34.4) | 157.5 (35.2) | 146.5 (32.1) | 159.5 (34.1) | 0.296 | n.s. | 160.2 (31.3) | 155.2 (40.3) | 145.3 (28.8) | 161.0 (29.4) | 0.355 | n.s. |
| 300°/s (W) | 331.4 (37.7) | 320.3 (69.5) | 313.0 (52.9) | 353.8 (98.8) | 0.606 | n.s. | 303.1 (70.4) | 327.1 (68.8) | 316.4 (57.1) | 332.1 (40.1) | 0.744 | n.s. |
| Flexion—Left Knee | Flexion—Right Knee | |||||||||||
| Peak Torque | ||||||||||||
| 60°/s (N·m) | 113.8 (15.6) | 112.5 (35.7) | 102.0 (21.3) | 110.3 (22.4) | 0.626 | n.s. | 113.3 (15.3) | 106.8 (24.6) | 101.8 (21.5) | 114.8 (18.9) | 0.173 | n.s. |
| 300°/s (N·m) | 80.5 (8.7) | 87.5 (17.4) | 78.5 (19.0) | 84.7 (16.1) | 0.173 | n.s. | 74.6 (14.7) | 86.1 (19.9) | 76.7 (17.9) | 80.4 (15.1) | 0.234 | n.s. |
| Total Work | ||||||||||||
| 60°/s (J) | 517.2 (135.4) | 509.3 (145.4) | 515.6 (140.6) | 528.9 (143.7) | 0.955 | n.s. | 513.5 (156.8) | 499.7 (159.9) | 516.9 (152.4) | 528.0 (140.7) | 0.964 | n.s. |
| 300°/s (J) | 641.7 (247.9) | 697.1 (205.1) | 724.8 (204.3) | 677.0 (172.8) | 0.941 | n.s. | 589.7 (202.7) | 767.5 (206.1) | 734.8 (192.8) | 739.6 (76.0) | 0.377 | n.s. |
| Average Power | ||||||||||||
| 60°/s (W) | 103.0 (29.8) | 97.7 (22.6) | 95.7 (20.6) | 101.0 (22.4) | 0.777 | n.s. | 104.8 (28.8) | 95.3 (29.5) | 95.6 (20.3) | 101.1 (22.6) | 0.696 | n.s. |
| 300°/s (W) | 184.2 (87.4) | 196.4 (77.8) | 197.2 (45.5) | 202.6 (70.4) | 0.933 | n.s. | 169.2 (87.7) | 213.7 (72.8) | 206.3 (50.7) | 210.7 (46.0) | 0.755 | n.s. |
Disclaimer/Publisher’s Note: The statements, opinions and data contained in all publications are solely those of the individual author(s) and contributor(s) and not of MDPI and/or the editor(s). MDPI and/or the editor(s) disclaim responsibility for any injury to people or property resulting from any ideas, methods, instructions or products referred to in the content. |
© 2023 by the authors. Licensee MDPI, Basel, Switzerland. This article is an open access article distributed under the terms and conditions of the Creative Commons Attribution (CC BY) license (https://creativecommons.org/licenses/by/4.0/).
Share and Cite
Gouveia, J.N.; França, C.; Martins, F.; Henriques, R.; Nascimento, M.d.M.; Ihle, A.; Sarmento, H.; Przednowek, K.; Martinho, D.; Gouveia, É.R. Characterization of Static Strength, Vertical Jumping, and Isokinetic Strength in Soccer Players According to Age, Competitive Level, and Field Position. Int. J. Environ. Res. Public Health 2023, 20, 1799. https://doi.org/10.3390/ijerph20031799
Gouveia JN, França C, Martins F, Henriques R, Nascimento MdM, Ihle A, Sarmento H, Przednowek K, Martinho D, Gouveia ÉR. Characterization of Static Strength, Vertical Jumping, and Isokinetic Strength in Soccer Players According to Age, Competitive Level, and Field Position. International Journal of Environmental Research and Public Health. 2023; 20(3):1799. https://doi.org/10.3390/ijerph20031799
Chicago/Turabian StyleGouveia, João Nuno, Cíntia França, Francisco Martins, Ricardo Henriques, Marcelo de Maio Nascimento, Andreas Ihle, Hugo Sarmento, Krzysztof Przednowek, Diogo Martinho, and Élvio Rúbio Gouveia. 2023. "Characterization of Static Strength, Vertical Jumping, and Isokinetic Strength in Soccer Players According to Age, Competitive Level, and Field Position" International Journal of Environmental Research and Public Health 20, no. 3: 1799. https://doi.org/10.3390/ijerph20031799