
Family Structure and Child Behavior Problems in Australia, the United Kingdom, and the United States
 , and
, and
Abstract
:1. Introduction
1.1. Resources
1.2. Selectivity
1.3. Examining Additional Contexts: Cross-National Comparisons
1.4. Research Questions
2. Methods
Nations in the Analysis
2.2. Data
2.2.1. The Longitudinal Study of Australian Children: An Australian Government initiative (Australia)
2.2.2. Millennium Cohort Study (United Kingdom)
2.2.3. Early Childhood Longitudinal Study-Kindergarten Cohort (United States)
2.3. Measures
2.3.1. Child Behavior Problems
2.3.2. Family Structure
2.3.3. Family Transitions
2.3.4. Potential Explanatory Variables
2.3.5. Additional Controls
2.4. Analytic Plan
3. Findings
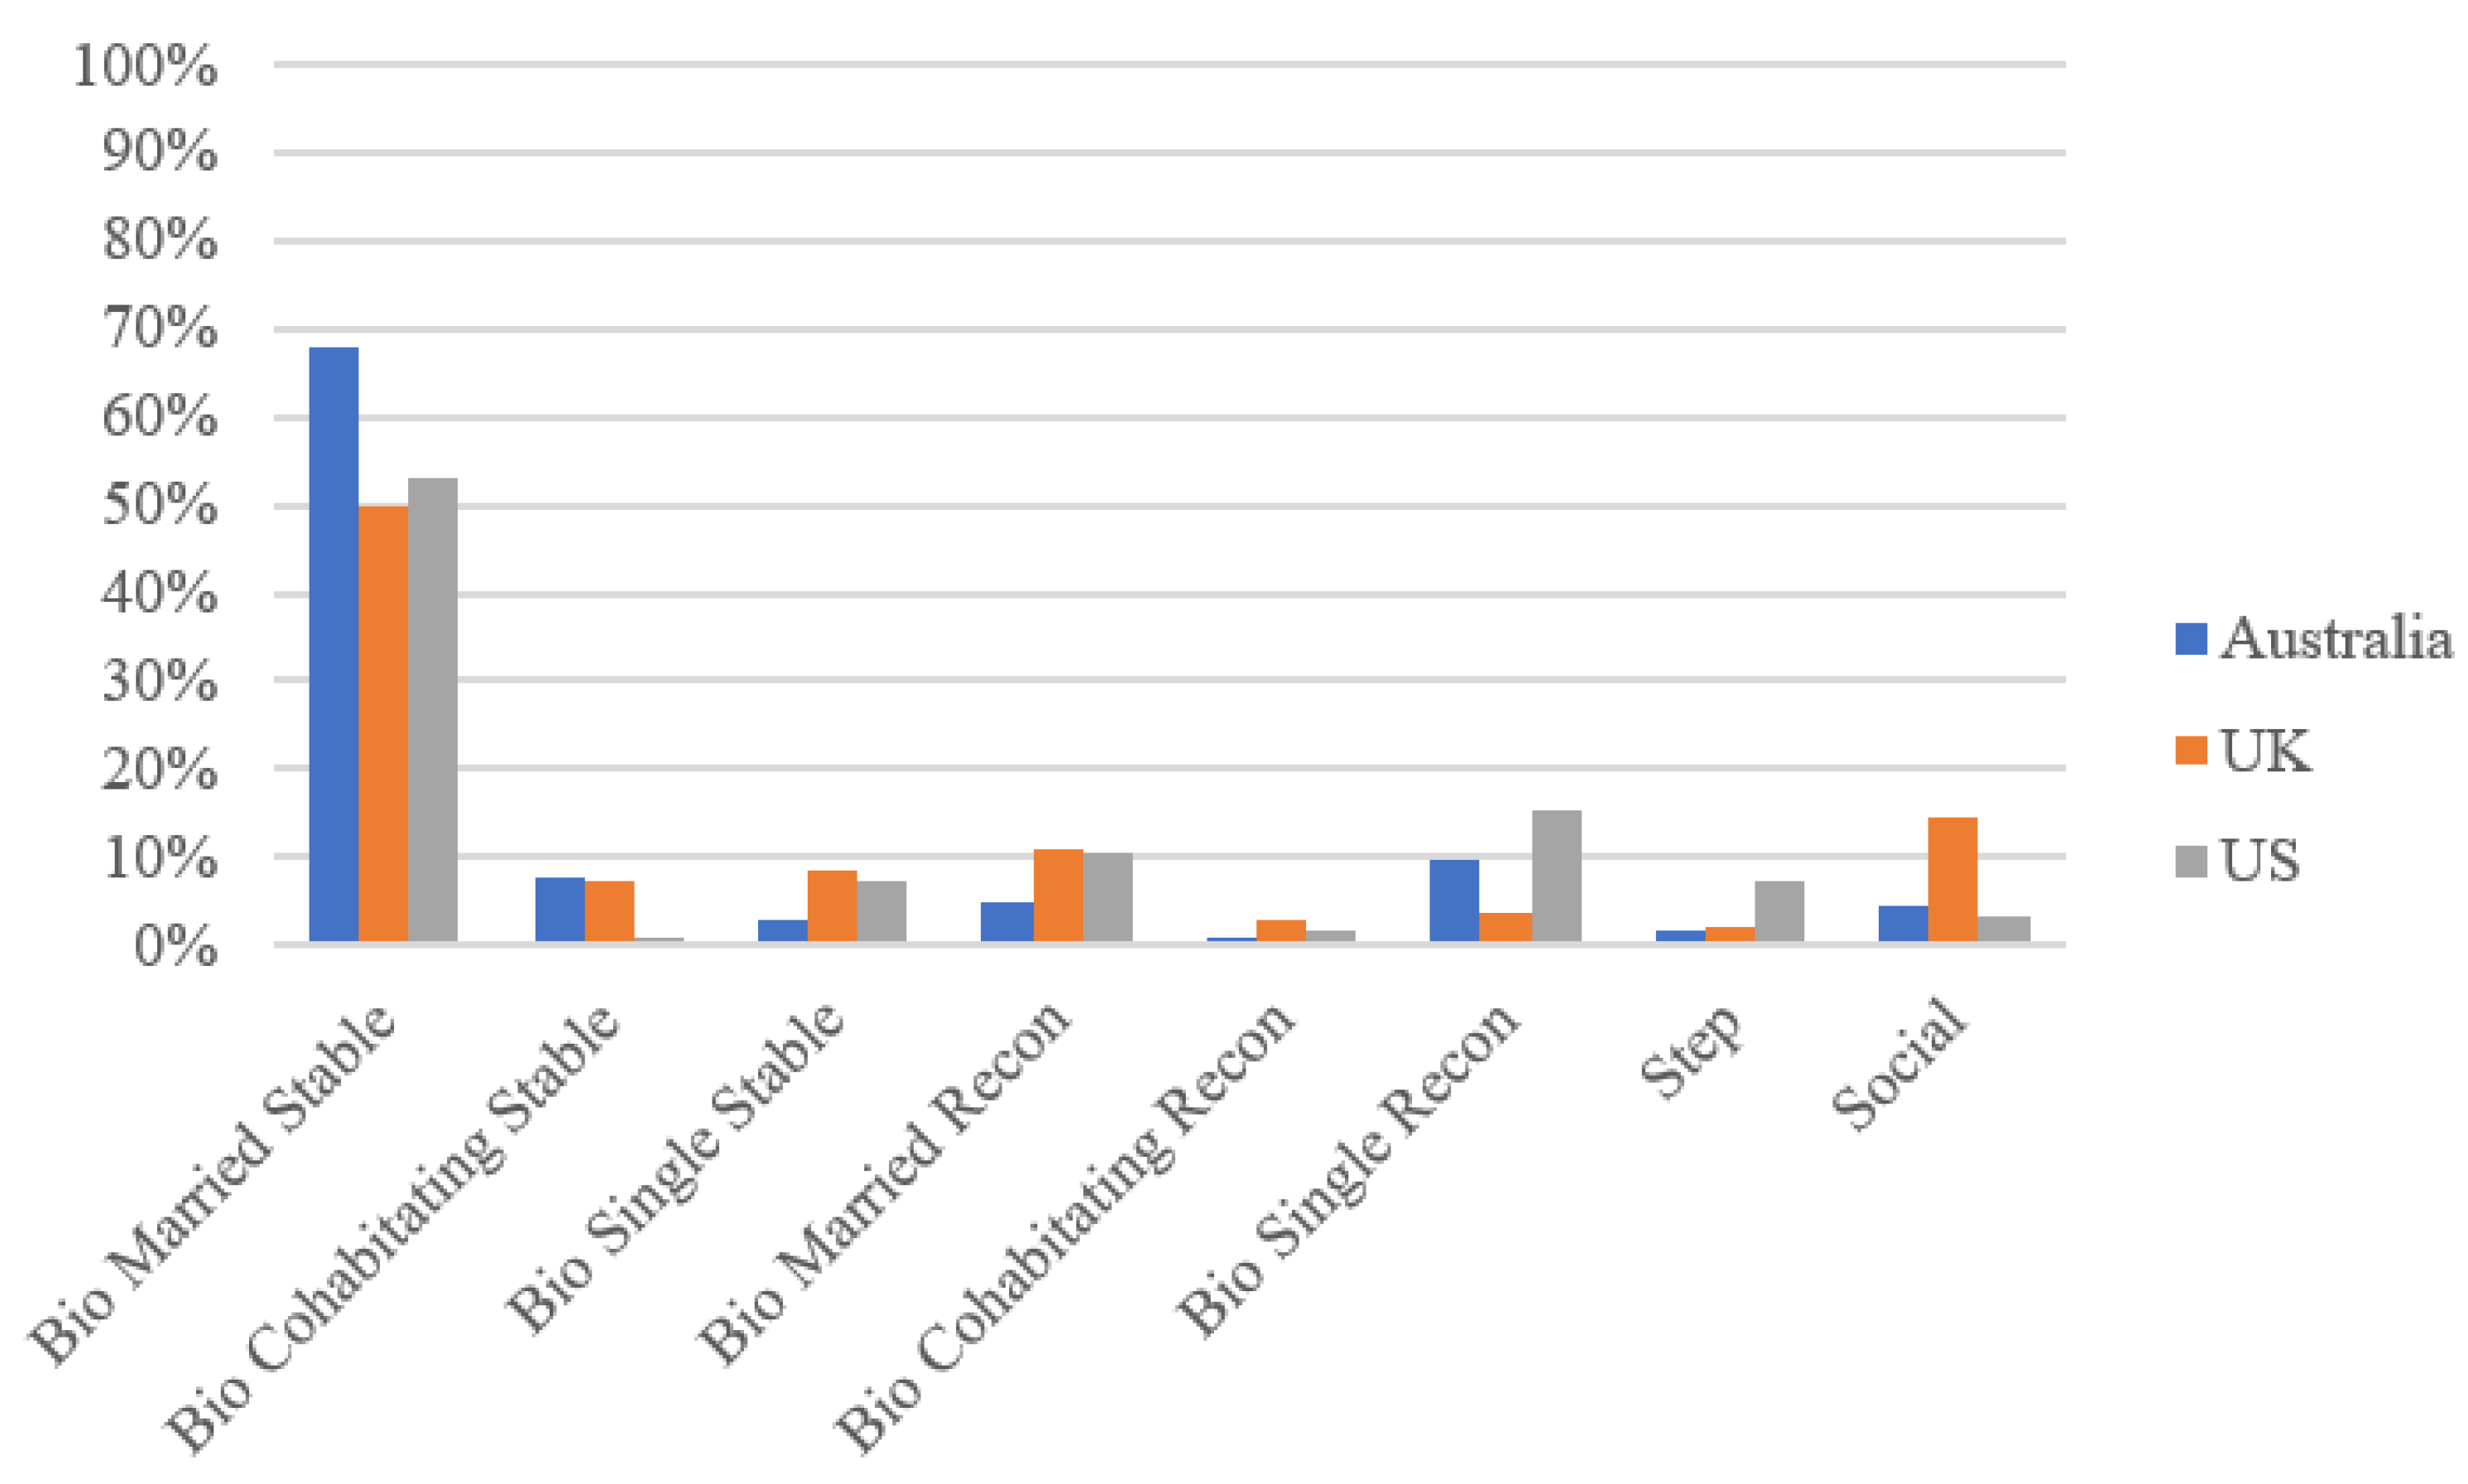
Family Structure
3.2. Internalizing Behavior Problems
3.2.1. Australia
3.2.2. United Kingdom
3.2.3. United States
3.2.4. Cross-Country Comparisons
3.3. Externalizing Behavior Problems
3.3.1. Australia
3.3.2. United Kingdom
3.3.3. United States
3.3.4. Cross-Country Comparisons
4. Discussion
Author Contributions
Funding
Institutional Review Board Statement
Informed Consent Statement
Data Availability Statement
Conflicts of Interest
References
- Brown, S.L. Marriage and child well-being: Research and policy perspectives. J. Marriage Fam. 2010, 72, 1059–1077. [Google Scholar] [CrossRef] [PubMed]
- Breivik, K.; Olweus, D. Adolescent's adjustment in four post-divorce family structures: Single mother, stepfather, joint physical custody and single father families. J. Divorce Remarriage 2006, 44, 99–124. [Google Scholar] [CrossRef]
- Dufur, M.J.; Parcel, T.L.; Troutman, K.P. Does capital at home matter more than capital at school? Social capital effects on academic achievement. Res. Soc. Stratif. Mobil. 2013, 31, 1–21. [Google Scholar] [CrossRef]
- Dufur, M.J.; Howell, N.C.; Downey, D.B.; Ainsworth, J.W.; Lapray, A.J. Assessing structuralist versus individualist explanations for sex differences in behavior by comparing single-mother and single-father households. J. Marriage Fam. 2010, 72, 1092–1106. [Google Scholar] [CrossRef]
- Bramlett, M.D.; Blumberg, S.J. Family structure and children's physical and mental health. Health Aff. 2007, 26, 549–558. [Google Scholar] [CrossRef] [PubMed]
- Wen, M. Family structure and children’s health and behavior: Data from the 1999 National Survey of America’s Families. J. Fam. Issues 2008, 29, 1492–1519. [Google Scholar]
- Carballo, J.; García-Nieto, R.; Álvarez-García, R.; Caro-Cañizares, I.; López-Castromán, J.; Muñoz-Lorenzo, L.; Baca-García, E. Sibship size, birth order, family structure and childhood mental disorders. Soc. Psychiatry Psychiatr. Epidemiol. 2013, 48, 1327–1333. [Google Scholar] [CrossRef]
- Kim, H.S. Consequences of parental divorce for child development. Am. Sociol. Rev. 2011, 76, 486–511. [Google Scholar] [CrossRef]
- Amato, P.R.; Anthony, C.J. Estimating the effects of parental divorce and death with fixed effects models. J. Marriage Fam. 2014, 76, 370–386. [Google Scholar] [CrossRef] [Green Version]
- Gorman, G.H.; Eide, M.; Hisle-Gorman, E. Wartime military deployment and increased pediatric mental and behavioral health complaints. Pediatrics 2010, 126, 1058–1066. [Google Scholar] [CrossRef] [Green Version]
- Creighton, M.J.; Park, H.; Teruel, G.M. The role of migration and single motherhood in upper secondary education in Mexico. J. Marriage Fam. 2009, 71, 1325–1339. [Google Scholar] [CrossRef]
- Wildeman, C.; Wakefield, S.; Turney, K. Misidentifying the effects of parental incarceration? A comment on Johnson and Easterling (2012). J. Marriage Fam. 2013, 75, 252–258. [Google Scholar] [CrossRef]
- Thomson, E.; McLanahan, S.S. Reflections on family structure and child well-being: Economic resources vs. parental socialization. Soc. Forces 2012, 91, 45–53. [Google Scholar] [CrossRef] [PubMed]
- Sun, Y.; Li, Y. Effects of family structure type and stability on children’s academic performance trajectories. J. Marriage Fam. 2011, 73, 541–556. [Google Scholar] [CrossRef]
- McLanahan, S.; Sandefur, G. Growing Up with a Single Parent: What Hurts, What Helps; Harvard University Press: Cambridge, MA, USA, 1994. [Google Scholar]
- Amato, P.R. The impact of family formation change on the cognitive, social, and emotional well-being of the next generation. Future Child. 2005, 15, 75–96. [Google Scholar] [CrossRef]
- Ginther, D.K.; Pollack, R.A. Family structure and children’s educational outcomes: Blended families, stylized facts, and descriptive regressions. Demography 2005, 41, 671–696. [Google Scholar] [CrossRef] [PubMed]
- Eisenberg, N.; Cumberland, A.; Spinrad, T.L.; Fabes, R.A.; Shepard, S.A.; Reiser, M.; Murphy, B.C.; Losoya, S.H.; Guthrie, I.K. The relations of regulation and emotionality to children’s externalizing and internalizing problem behavior. Child Dev. 2001, 72, 1112–1134. [Google Scholar] [CrossRef]
- Zahn-Waxler, C.; Klimes-Dougan, B.; Slattery, M.J. Internalizing problems of childhood and adolescence: Prospects, pitfalls, and progress in understanding the development of anxiety and depression. Dev. Psychopathol. 2000, 12, 443–466. [Google Scholar] [CrossRef]
- Rosenfield, S.; Lennon, M.C.; White, H.R. The self and mental health: Self-salience and the emergence of internalizing and externalizing problems. J. Health Soc. Behav. 2005, 46, 323–340. [Google Scholar] [CrossRef]
- McLeod, J.D.; Kaiser, K. Childhood emotional and behavioral problems and educational attainment. Am. Sociol. Rev. 2004, 69, 636–658. [Google Scholar] [CrossRef]
- Dufur, M.J.; Parcel, T.L.; McKune, B.A. Capital and context: Using social capital at home and school to predict child social adjustment. J. Health Soc. Behav. 2008, 49, 146–161. [Google Scholar] [CrossRef] [PubMed]
- Hoffmann, J.P. The community context of family structure and adolescent drug use. J. Marriage Fam. 2002, 64, 314–330. [Google Scholar] [CrossRef]
- Ryan, R.M.; Claessens, A. Associations between family structure changes and children's behavior problems: The moderating effects of timing and marital birth. Dev. Psychol. 2013, 49, 1219–1231. [Google Scholar] [CrossRef] [PubMed]
- Lamb, M.E. Mothers, fathers, families, and circumstances: Factors affecting children’s adjustment. Appl. Dev. Sci. 2012, 16, 98–111. [Google Scholar] [CrossRef]
- Geiger, J.M.; Hayes, M.J.; Lietz, C.A. Should I stay or should I go? A mixed methods study examining the factors influencing foster parents’ decisions to continue or discontinue providing foster care. Child. Youth Serv. Rev. 2013, 35, 1356–1365. [Google Scholar] [CrossRef]
- Lopoo., L.M.; DeLeire, T. Family structure and the economic wellbeing of children in youth and adulthood. Soc. Sci. Res. 2014, 43, 30–44. [Google Scholar] [CrossRef] [PubMed]
- Connelly, R.; Kimmel, J. The effect of child care costs on the employment and welfare recipiency of single mothers. South. Econ. J. 2003, 69, 498–519. [Google Scholar]
- Downey, D.B. When bigger is not better: Family size, parental resources, and children’s educational performance. Am. Sociol. Rev. 1995, 60, 746–761. [Google Scholar] [CrossRef] [Green Version]
- Western, B.; Pettit, B. Incarceration & social inequality. Daedalus 2010, 139, 8–19. [Google Scholar]
- Furstenberg, F.F. Fifty years of family change: From consensus to complexity. ANNALS Am. Acad. Political Soc. Sci. 2014, 364, 12–30. [Google Scholar] [CrossRef] [Green Version]
- Wildeman, C.; Waldfogel, J. Somebody’s children or nobody’s children? How the sociological perspective could enliven research on foster care. Annu. Rev. Sociol. 2014, 40, 599–618. [Google Scholar] [CrossRef] [Green Version]
- McLanahan, S.; Tach, L.; Schneider, D. The causal effects of father absence. Annu. Rev. Sociol. 2013, 39, 399–427. [Google Scholar] [CrossRef] [Green Version]
- Bjarnason, T.; Bendtsen, P.; Amarsson, A.M.; Borup, I.; Iannotti, R.J.; Löfstedt, P.; Haapasalo, I.; Niclasen, B. Life satisfaction among children in different family structures: A comparative study of 36 western societies. Child. Soc. 2012, 26, 51–62. [Google Scholar] [CrossRef]
- McCulloch, A.; Wiggins, R.D.; Joshi, H.E.; Sachdev, D. Internalising and externalising children's behaviour problems in Britain and the US: Relationships to family resources. Child. Soc. 2000, 14, 368–383. [Google Scholar] [CrossRef]
- Najman, J.M.; Behrens, B.C.; Andersen, M.; Bor, W.; O’Callaghan, M.; Williams, G.M. Impact of family type and family quality on child behavior problems: A longitudinal study. J. Am. Acad. Child Adolesc. Psychiatry 1997, 36, 1357–1365. [Google Scholar] [CrossRef]
- Jarvis, J.A.; Otero, C.; Poff, J.M.; Dufur, M.J.; Pribesh, S.L. Family structure and child behavior in the United Kingdom. J. Child Fam. Stud. 2021, 1–20. [Google Scholar] [CrossRef]
- World Bank. Data, GDP per Capita (Current US$). World Bank National Accounts Data, and OECD National Accounts Data Files. 2021. Available online: https://data.worldbank.org/indicator/NY.GDP.PCAP.CD?end=2020&start=2020&view=bar (accessed on 17 January 2023).
- Van Acker, E. Marriage and Values in Public Policy: Conflicts in the UK, the US and Australia; Routledge: Abingdon, UK, 2017. [Google Scholar]
- Fehlberg, B. With All My Worldly Goods I Thee Endow? The Partnership Theme in Australian Matrimonial Property Law. Int. J. Law Policy Fam. 2005, 19, 176–193. [Google Scholar] [CrossRef]
- OECD. OECD Family Database, Chart SF3.1.B. Mean Age at First Marriage by Sex, 1990, 2000, and 2019 or Latest Available Year. OECD Family Database. 2022. Available online: https://www.oecd.org/social/family/SF_3_1_Marriage_and_divorce_rates.pdf (accessed on 17 January 2023).
- World Bank. International Labour Organization, ILOSTAT Database. The World Bank. 2022. Available online: https://data.worldbank.org/indicator/SL.UEM.TOTL.ZS?name_desc=false (accessed on 17 January 2023).
- U.S. Census Bureau. Decennial Censuses, 1890 to 1940, and Current Population Survey, Annual Social and Economic Supplements, 1947 to 2021. US Census Bureau. 2021. Available online: https://www.census.gov/content/dam/Census/library/visualizations/time-series/demo/families-and-households/ms-2.pdf (accessed on 17 January 2023).
- OECD. Income Inequality (Indicator). OECD. 2023. Available online: https://data.oecd.org/inequality/income-inequality (accessed on 17 January 2023).
- CDC/NCHS. Provisional Number of Marriages and Marriage Rate: United States, 2000–2018. CDC.NCHS. 2019. Available online: https://www.cdc.gov/nchs/data/dvs/national-marriage-divorce-rates-00-18.pdf (accessed on 17 January 2023).
- Australian Bureau of Statistics. Marriage Divorces in Australia. Aust. Bur. Stat. 2021. Available online: https://www.abs.gov.au/statistics/people/people-and-communities/marriages-and-divorces-australia/latest-release (accessed on 17 January 2023).
- Eurostat. Crude Marriage Rate and Crude Divorce Rate. Eurostat. 2021. Available online: https://ec.europa.eu/eurostat/databrowser/view/tps00206/default/table?lang=en (accessed on 17 January 2023).
- Rasmussen, K.; Sigler, E.K.; Slighting, S.A.; Jarvis, J.A.; Dufur, M.J.; Pribesh, S. Family Structure and Maternal Depressive Symptoms: A Cross-National Comparison of Australia, the United Kingdom, and the United States. Soc. Sci. 2022, 11, 78. [Google Scholar] [CrossRef]
- Pilkauskas, N.V.; Martinson, M.L. Three-generation family households in early childhood: Comparisons between the United States, the United Kingdom, and Australia. Demogr. Res. 2014, 30, 1639. [Google Scholar] [CrossRef] [Green Version]
- De Vaus, D.; Gray, M.; Qu, L.; Stanton, D. The economic consequences of divorce in six OECD countries. Aust. J. Soc. Issues 2017, 52, 180–199. [Google Scholar] [CrossRef]
- Fehlberg, B.; Maclean, M. Child support policy in Australia and the United Kingdom: Changing priorities but a similar tough deal for children? Int. J. Law Policy Fam. 2009, 23, 1–24. [Google Scholar] [CrossRef]
- Mohal, J.; Lansangan, C.; Gasser, C.; Howell, L.; Duffy, J.; Renda, J.; Scovelle, A.; Jessup, K.; Daraganova, G.; Mundy, L. Growing Up in Australia: The Longitudinal Study of Australian Children–Data User Guide, Release 9.0C2; Australian Institute of Family Studies: Melbourne, Australia, 2022.
- Kelly, Y. Ethnicity Coding for the Millennium Cohort Study, First Survey, 2001–2003; University of London, Institute of Education, Centre for Longitudinal Studies: London, UK, 2008. [Google Scholar]
- Plewis, I.; Nathan, G.; Calderwood, L.; Hawkes, D. National Child Development Study and 1970 British Cohort Study Technical Report: Changes in the NCDS and BCS70 Populations over Time; University of London, Institute of Education, Centre for Longitudinal Studies: London, UK, 2004. [Google Scholar]
- ECLS-K Third Grade Public-Use: Data Files and Electronic Codebook; National Center for Education Statistics, U.S. Dept. of Education, Institute of Education Sciences: Washington, DC, USA, 2004.
- Tourangeau, K.; Nord, C.; Lê, T.; Sorongon, A.G.; Najarian, M. Early Childhood Longitudinal Study, Kindergarten Class of 1998–99 (ECLS-K): Combined User’s Manual for the ECLS-K Eighth-Grade and K-8 Full Sample Data Files and Electronic Codebooks. NCES 2009-004; National Center for Education Statistics: Washington, DC, USA, 2009.
- Little, R.A.J.; Rubin, D.B. Statisical Analysis with Missing Data; Wiley-Interscience: Hoboken, NJ, USA, 2002. [Google Scholar]
- Von Hippel, P.T. Regression with missing Ys: An improved strategy for analyzing multiply-imputed data. Sociol. Methodol. 2007, 37, 83–117. [Google Scholar] [CrossRef] [Green Version]
- Nikstat, A.; Riemann, R. On the etiology of internalizing and externalizing problem behavior: A twin-family study. PloS ONE 2020, 15, e0230626. [Google Scholar] [CrossRef]
- Goodman, R. The Strengths and Difficulties Questioners: A Research Note. J. Child Psychol. Psychiatry 2006, 38, 581–586. [Google Scholar]
- Fitzsimons, E. Millennium Cohort Study Sixth Survey 2015-2016 User Guide, 1 st ed; University of London, Institute of Education, Centre for Longitudinal Studies: London, UK, 2017. [Google Scholar]
- Duncan, G.J.; Brooks-Gunn, J.; Yeung, W.J.; Smith, J.R. How much does childhood poverty affect the life chances of children? Am. Sociol. Rev. 1998, 63, 406–423. [Google Scholar] [CrossRef] [Green Version]
- Hope, S.; Pearce, A.; Whitehead, M.; Law, C. Family employment and child socioemotional behaviour: Longitudinal findings from the UK Millennium Cohort Study. J. Epidemiol. Community Health 2014, 68, 950–957. [Google Scholar] [CrossRef]
- Hakim, C. Five feminist myths about women’s employment. Br. J. Sociol. 1995, 46, 429–455. [Google Scholar] [CrossRef]
- Cooper, L.G.; Leland, N.L.; Alexander, G. Effect of maternal age on birth outcomes among young adolescents. Soc. Biol. 1995, 42, 22–35. [Google Scholar] [CrossRef]
- Musick, K.; Brand, J.E.; Davis, D. Variation in the relationship between education and marriage: Marriage market mismatch? J. Marriage Fam. 2012, 74, 53–69. [Google Scholar]
- Blum, R.W.; Beuhring, T.; Shew, M.L.; Bearinger, L.H.; Sieving, R.E.; Resnick, M.D. The effects of race/ethnicity, income, and family structure on adolescent risk behaviors. Am. J. Public Health 2000, 90, 1879. [Google Scholar]
- Caspi, A.; Henry, B.; McGee, R.O.; Moffitt, T.E.; Silva, P.A. Temperamental origins of child and adolescent behavior problems: From age three to age fifteen. Child Dev. 1995, 66, 55–68. [Google Scholar] [CrossRef]
- Howson, C.P.; Kinney, M.V.; McDougall, L.; Lawn, J.E. Born too soon: Preterm birth matters. Reprod. Health 2013, 10, 1–9. [Google Scholar] [CrossRef] [Green Version]
- Hack, M.; Klein, N.K.; Taylor, H.G. Long-term developmental outcomes of low birth weight infants. Future Child. 1995, 5, 176–196. [Google Scholar] [CrossRef]
- England, P. Sometimes the social becomes personal: Gender, class, and sexualities. Am. Sociol. Rev. 2016, 81, 4–28. [Google Scholar] [CrossRef]
- Duncan, G.J.; Magnuson, K.A. Off with Hollingshead: Socioeconomic resources, parenting, and child development. Socioecon. Status Parent. Child Dev. 2003, 287, 83–106. [Google Scholar]
- Downey, D.B.; Condron, D. Fifty years since the Coleman Report: Rethinking the relationship between schools and inequality. Sociol. Educ. 2016, 89, 207–220. [Google Scholar] [CrossRef]
- Tach, L.; Edin, K.; Harvey, H.; Bryan, B. The family-go-round: Family complexity and father involvement from a father’s perspective. ANNALS Am. Acad. Political Soc. Sci. 2014, 364, 169–185. [Google Scholar] [CrossRef]
- Cavanagh, S.E.; Huston, A.C. The timing of family instability and children’s social development. J. Marriage Fam. 2008, 70, 1258–1270. [Google Scholar] [CrossRef]
- Mitchell, C.; McLanahan, S.; Hobcraft, J.; Brooks-Gunn, J.; Garfinkel, I.; Notterman, D. Family structure instability, genetic sensitivity, and child well-being. Am. Sociol. Rev. 2015, 120, 1195–1225. [Google Scholar] [CrossRef]


| Country | GDP Rank (2020) | GPD per Capita (2020) | First Age of Marriage (M/F) | Unemployment Rate (2019) | GINI (Year) | Crude Divorce Rate (per 1000) |
|---|---|---|---|---|---|---|
| Australia | 13 | 51,692.8 | 32.2/30.06 | 5.2% | 32.5 (2018) | 1.9 (2020) |
| UK | 5 | 41,124.5 | 33.4/31.5 | 3.74% | 36.6 (2019) | 1.8 (2016) |
| US | 1 | 63,413.5 | 30.4/28.6 | 3.67% | 39.5 (2019) | 2.9 (2018) |
| Variable | Proportion or M | Range | ||
|---|---|---|---|---|
| Australia | UK | US | Australia, UK, US | |
| Family Structure | (1, 8) | |||
| Biological Married Stable | 0.68 | 0.50 | 0.60 | |
| Biological Cohabiting Stable | 0.08 | 0.07 | 0.02 | |
| Biological Single Stable | 0.03 | 0.09 | 0.07 | |
| Post-Birth Biological Married | 0.05 | 0.11 | 0.09 | |
| Post-Birth Stepfamily | 0.02 | 0.03 | 0.055 | |
| Post-Birth Biological Cohabiting | 0.01 | 0.04 | 0.02 | |
| Post-Birth Social Family | 0.05 | 0.02 | 0.03 | |
| Post-Birth Transition to Single | 0.10 | 0.15 | 0.11 | |
| Internalizing Behavior | −0.01 | 0.00 | 0.00 | (−1.06, 4.69) (−1.01, 5.68) (−1.11, 3.68) |
| Externalizing Behavior | −0.02 | 0.00 | 0.00 | (−1.30, 4.56) (−1.28, 3.77) (−1.00, 5.70) |
| Father’s Employment | (0, 1) (1, 4) (1, 5) | |||
| Full-time | 0.89 | 0.64 | 0.71 | |
| Part-time | 0.11 | 0.06 | 0.03 | |
| Not in paid labor force | 0.08 | 0.03 | ||
| Looking for work | 0.02 | |||
| No partner to be employed | 0.23 | 0.21 | ||
| Mother’s Employment | (1, 3) (1, 4) (1, 5) | |||
| Full-time | 0.33 | 0.15 | 0.48 | |
| Part-time | 0.42 | 0.45 | 0.23 | |
| Looking for work | 0.03 | |||
| Not in paid labor force | 0.25 | 0.40 | 0.24 | |
| No partner to be employed | 0.00 | 0.02 | ||
| Income (reported in quintiles) | (1, 5) | |||
| Bottom | 0.24 | 0.19 | 0.34 | |
| Second | 0.20 | 0.19 | 0.13 | |
| Third | 0.20 | 0.20 | 0.30 | |
| Fourth | 0.18 | 0.21 | 0.11 | |
| Top | 0.18 | 0.21 | 0.12 | |
| Number of Siblings | 1.59 | 1.48 | 1.47 | (0, 4) (0, 13) (0, 11) |
| Parent Highest Education | 2.82 | (1–5) | ||
| Less than secondary school | 0.15 | 0.08 | ||
| Secondary school | 0.48 | 0.22 | ||
| Some college | 0.13 | 0.34 | ||
| Bachelor’s degree | 0.16 | 0.19 | ||
| Graduate School | 0.08 | 0.17 | ||
| Mother’s Age at Birth | 31.2 | 28.52 | 28.57 | (15, 48) (14, 51) (12, 46) |
| Child Race | (N/A) (1, 11) (1, 5) | |||
| White | 0.85 | 0.59 | ||
| Black/Other Black | 0.00 | 0.13 | ||
| Hispanic | 0.18 | |||
| Asian/Other Asian | 0.00 | 0.05 | ||
| Mixed | 0.03 | |||
| Indian | 0.02 | |||
| Pakistani | 0.04 | |||
| Bangladeshi | 0.01 | |||
| Black Caribbean | 0.01 | |||
| Black African | 0.02 | |||
| Other | 0.00 | 0.05 | ||
| Child Gender | ||||
| Male | 0.51 | 0.51 | 0.51 | (0, 1) |
| Female | 0.48 | 0.49 | 0.49 | |
| Child’s Birth weight | 121.2 | 118.39 | 118.46 | (19.40, 191.89) (14, 255) (16, 219) |
| Pre-term Birth | (0, 1) | |||
| Not Pre-term | 0.94 | 0.92 | 0.93 | |
| Pre-term | 0.06 | 0.08 | 0.07 | |
| Child’s Age (years) | 8.96 | 7.23 | 9.17 | (8.17, 9.85) (6.34, 8.15) (7.92, 11.12) |
| Maternal Depression | 7.08 | 4.48 | 1.35 | (0.90, 7.94) (1–5) (1–4) |
| Australia | UK | US | ||||
|---|---|---|---|---|---|---|
| Model 1 | Model 2 | Model 1 | Model 2 | Model 1 | Model 2 | |
| Family Structure | ||||||
| Biological Cohabiting Stable | 0.039 (0.061) | −0.041 (0.059) | 0.119 *** (0.012) | 0.065 *** (0.012) | 0.270 *** (0.076) | 0.089 (0.074) |
| Biological Single Stable | 0.415 *** (0.096) | 0.129 (0.095) | 0.204 *** (0.012) | 0.070 ** (0.021) | 0.551 *** (0.030) | 0.286 *** (0.077) |
| Post-Birth Biological Married | 0.337 *** (0.054) | 0.157 * (0.055) | 0.144 *** (0.009) | 0.041 * (0.019) | 0.378 *** (0.022) | 0.218 ** (0.071) |
| Post-Birth Stepfamily | 0.003 (0.076) | −0.107 (0.073) | 0.071 *** (0.010) | 0.026 * (0.010) | 0.202 *** (0.026) | 0.119 *** (0.026) |
| Post-Birth Biological Cohabiting | 0.505 *** (0.131) | 0.462 *** (0.126) | 0.172 *** (0.020) | 0.088 *** (0.019) | 0.451 *** (0.030) | 0.323 *** (0.031) |
| Post Birth Social Family | 0.737 *** (0.158) | 0.524 ** (0.152) | 0.187 *** (0.017) | 0.082 *** (0.017) | 0.218 *** (0.058) | 0.070 (0.058) |
| Post-Birth Transition to Single | 0.388 *** (0.077) | 0.235 ** (0.076) | 0.215 *** (0.021) | 0.112 *** (0.021) | 0.484 *** (0.043) | 0.297 *** (0.044) |
| Resources | ||||||
| Paternal labor force participation | ||||||
| Part-time | 0.122 * (0.061) | −0.011 (0.010) | −0.001 (0.043) | |||
| Homemaker | 0.021 * (0.009) | |||||
| Student | ||||||
| Unemployed, looking | 0.059 (0.063) | |||||
| Other | 0.118 ** (0.044) | |||||
| No father | −0.012 (0.014) | −0.058 (0.073) | ||||
| Maternal labor force participation | ||||||
| Part-time | 0.177 *** (0.042) | 0.001 (0.006) | −0.022 (0.020) | |||
| Homemaker | 0.037 *** (0.007) | |||||
| Student | ||||||
| Unemployed, looking | 0.037 (0.045) | |||||
| Other | −0.043 (0.036) | 0.018 (0.020) | ||||
| No mother | −0.062 (0.041) | 0.041 (0.089) | ||||
| Family income | −0.000 * (0.036) | −0.015 *** (0.003) | −0.030 *** (0.004) | |||
| Number of siblings | −0.040 * (0.017) | 0.005 * (0.002) | 0.006 (0.007) | |||
| Selectivity Issues | ||||||
| Parental education | ||||||
| High school or less | −0.024 (0.013) | |||||
| Some college | −0.042 *** (0.007) | −0.005 (0.033) | ||||
| First degree | −0.053 *** (0.009) | −0.015 (0.033) | ||||
| Higher tertiary degree | −0.055 *** (0.009) | −0.060 (0.037) | ||||
| Other educational qualification | −0.059 *** (0.010) | −0.106 ** (0.039) | ||||
| Maternal age at birth | −0.005 (0.003) | −0.002 *** (0.000) | 0.002 (0.001) | |||
| Child race | ||||||
| Hispanic | −0.120 *** (0.023) | |||||
| Black | 0.087 (0.045) | −0.150 *** (0.027) | ||||
| Black—African origin | −0.038 * (0.016) | |||||
| Black—Other origin | −0.011 (0.019) | |||||
| Asian | 0.068 * (0.016) | 0.264 *** (0.036) | ||||
| Chinese | 0.040 (0.062) | |||||
| Indian | 0.037 ** (0.014) | |||||
| Pakistani | 0.086 *** (0.011) | |||||
| Bangladeshi | 0.079 *** (0.019) | |||||
| Multiple ethnicities | 0.013 (0.013) | |||||
| Other ethnicity | 0.085 ** (0.032) | 0.011 (0.036) | ||||
| Other controls | ||||||
| Child is male | 0.041(0.030) | 0.021 *** (0.004) | 0.080 *** (0.016) | |||
| Child birthweight | −0.002 * (0.001) | −0.000 (0.000) | −0.000 (0.000) | |||
| Preterm birth | −0.060(0.071) | 0.019 * (0.009) | 0.098 ** (0.034) | |||
| Child age at assessment | 0.118 * (0.050) | −0.009 (0.008) | −0.004 * (0.002) | |||
| Depression | 0.288 *** (0.016) | 0.095 *** (0.003) | 0.007 *** (0.001) | |||
| Constant | −0.087 *** | 1.58 ** | 1.244 *** | 1.908 *** | −0.133 *** | 0.53 *** |
| Australia | UK | US | ||||
|---|---|---|---|---|---|---|
| Model 1 | Model 2 | Model 1 | Model 2 | Model 1 | Model 2 | |
| Family Structure | ||||||
| Biological Cohabiting Stable | 0.039 (0.061) | −0.041 (0.059) | 0.119 *** (0.012) | 0.065 *** (0.012) | 0.270 *** (0.076) | 0.089 (0.074) |
| Biological Single Stable | 0.415 *** (0.096) | 0.129 (0.095) | 0.204 *** (0.012) | 0.070 ** (0.021) | 0.551 *** (0.030) | 0.286 *** (0.077) |
| Post-Birth Biological Married | 0.337 *** (0.054) | 0.157 * (0.055) | 0.144 *** (0.009) | 0.041 * (0.019) | 0.378 *** (0.022) | 0.218 ** (0.071) |
| Post-Birth Stepfamily | 0.003 (0.076) | −0.107 (0.073) | 0.071 *** (0.010) | 0.026 * (0.010) | 0.202 *** (0.026) | 0.119 *** (0.026) |
| Post-Birth Biological Cohabiting | 0.505 *** (0.131) | 0.462 *** (0.126) | 0.172 *** (0.020) | 0.088 *** (0.019) | 0.451 *** (0.030) | 0.323 *** (0.031) |
| Post Birth Social Family | 0.737 *** (0.158) | 0.524 ** (0.152) | 0.187 *** (0.017) | 0.082 *** (0.017) | 0.218 *** (0.058) | 0.070 (0.058) |
| Post-Birth Transition to Single | 0.388 *** (0.077) | 0.235 ** (0.076) | 0.215 *** (0.021) | 0.112 *** (0.021) | 0.484 *** (0.043) | 0.297 *** (0.044) |
| Resources | ||||||
| Paternal labor force participation | ||||||
| Part-time | 0.026 (0.055) | −0.005 (0.014) | 0.046 (0.042) | |||
| Homemaker | 0.036 ** (0.0013) | |||||
| Student | ||||||
| Unemployed, looking | −0.042 (0.061) | |||||
| Other | −0.026 (0.055) | 0.108 * (0.043) | ||||
| No father | −0.011 (0.019) | −0.057 (0.070) | ||||
| Maternal labor force participation | ||||||
| Part-time | −0.041 (0.036) | −0.026 ** (0.009) | −0.145 *** (0.020) | |||
| Homemaker | 0.009 (0.010) | |||||
| Student | ||||||
| Unemployed, looking | 0.002 (0.043) | |||||
| Other | 0.064 (0.042) | −0.124 *** (0.020) | ||||
| No mother | −0.047 (0.058) | −0.038 (0.086) | ||||
| Family income | −0.000 (0.000) | −0.021 *** (0.004) | −0.022 *** (0.003) | |||
| Number of siblings | −0.049 ** (0.017) | −0.000 (0.003) | −0.044 *** (0.007) | |||
| Selectivity Issues | ||||||
| Parental education | −0.063 *** (0.013) | |||||
| High school or less | −0.065 *** (0.009) | −0.033 (0.031) | ||||
| Some college | −0.081 *** (0.012) | 0.002 (0.032) | ||||
| First degree | 0.142 *** (0.012) | −0.098 ** (0.036) | ||||
| Higher tertiary degree | 0.126 *** (0.015) | −0.121 *** (0.037) | ||||
| Other educational qualification | ||||||
| Maternal age at birth | −0.006 (0.003) | −0.004 *** (0.001) | −0.001 (0.001) | |||
| Child race | ||||||
| Hispanic | −0.103 *** (0.022) | |||||
| Black | −0.073 (0.064) | 0.193 *** (0.026) | ||||
| Black-- African origin | −0.075 ** (0.023) | |||||
| Black-- Other origin | −0.005 (0.027) | |||||
| Asian | −0.011 (0.041) | −0.302 *** (0.034) | ||||
| Chinese | −0.039 (0.087) | |||||
| Indian | 0.023 (0.020) | |||||
| Pakistani | 0.021 (0.016) | |||||
| Bangladeshi | −0.032 (0.026) | |||||
| Multiple ethnicities | −0.003 (0.018) | |||||
| Other ethnicity | −0.016 (0.046) | −0.013 (0.034) | ||||
| Other controls | ||||||
| Child is male | 0.462 *** (0.031) | 0.146 *** (0.006) | 0.418 *** (0.015) | |||
| Child birthweight | −0.002 (0.001) | −0.001 *** (0.000) | −0.001 (0.000) | |||
| Preterm birth | −0.108 (0.071) | 0.009(0.013) | −0.016 (0.033) | |||
| Child age at assessment | −0.007 (0.050) | −0.064 *** (0.011) | −0.006 *** (0.002) | |||
| Depression | 0.165 *** (0.016) | 0.093 *** (0.005) | 0.006 *** (0.001) | |||
| Constant | −0.097 *** | 1.580 ** | 1.43 *** | 2.666 *** | −0.176 *** | 0.748 *** |
Disclaimer/Publisher’s Note: The statements, opinions and data contained in all publications are solely those of the individual author(s) and contributor(s) and not of MDPI and/or the editor(s). MDPI and/or the editor(s) disclaim responsibility for any injury to people or property resulting from any ideas, methods, instructions or products referred to in the content. |
© 2023 by the authors. Licensee MDPI, Basel, Switzerland. This article is an open access article distributed under the terms and conditions of the Creative Commons Attribution (CC BY) license (https://creativecommons.org/licenses/by/4.0/).
Share and Cite
Stoddard-Bennett, N.A.; Coburn, J.; Dufur, M.J.; Jarvis, J.A.; Pribesh, S.L. Family Structure and Child Behavior Problems in Australia, the United Kingdom, and the United States. Int. J. Environ. Res. Public Health 2023, 20, 1780. https://doi.org/10.3390/ijerph20031780
Stoddard-Bennett NA, Coburn J, Dufur MJ, Jarvis JA, Pribesh SL. Family Structure and Child Behavior Problems in Australia, the United Kingdom, and the United States. International Journal of Environmental Research and Public Health. 2023; 20(3):1780. https://doi.org/10.3390/ijerph20031780
Chicago/Turabian StyleStoddard-Bennett, Nina A., Jordan Coburn, Mikaela J. Dufur, Jonathan A. Jarvis, and Shana L. Pribesh. 2023. "Family Structure and Child Behavior Problems in Australia, the United Kingdom, and the United States" International Journal of Environmental Research and Public Health 20, no. 3: 1780. https://doi.org/10.3390/ijerph20031780