
Comparing Mobility-Based PM2.5 Concentrations and Activity Satisfaction in Beijing between 2012 and 2017

Abstract
:1. Introduction
2. Methodology
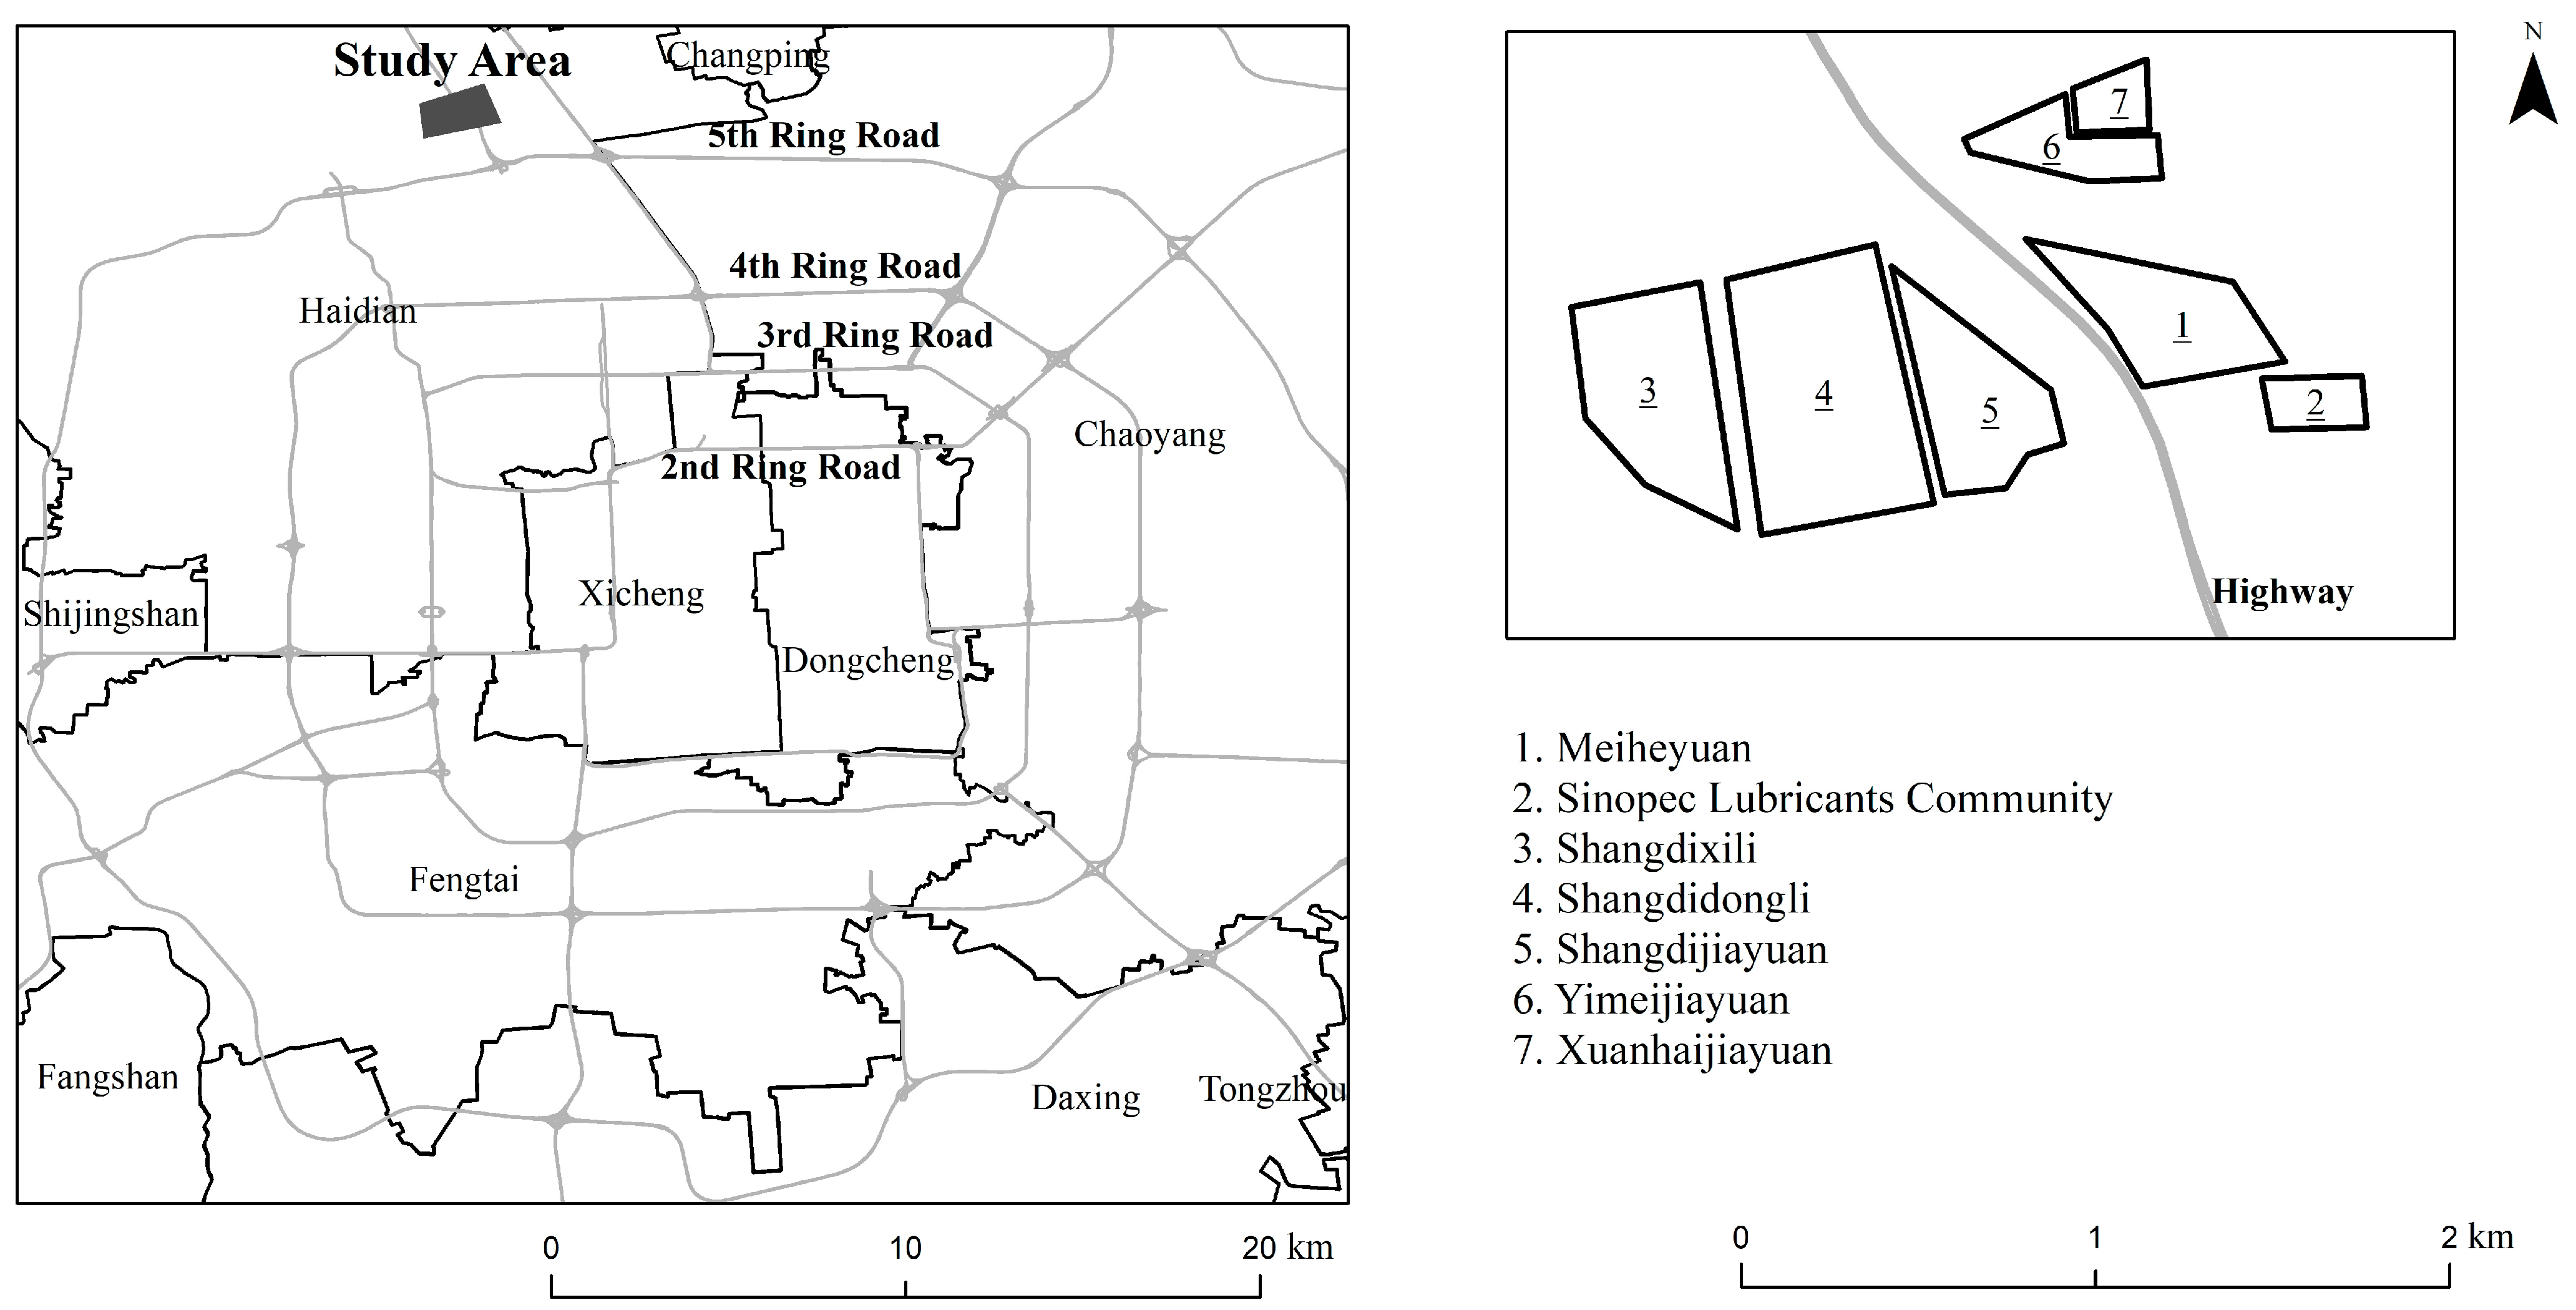
2.1. Activity-Travel Survey of Beijing Residents in 2012
2.2. Daily Activities and Environmental Health Survey of Beijing Residents in 2017
2.3. Data and Sample
2.4. Measuring Mobility-Based Air Pollution Exposure
2.5. Analysis and Model
3. Descriptive Analysis
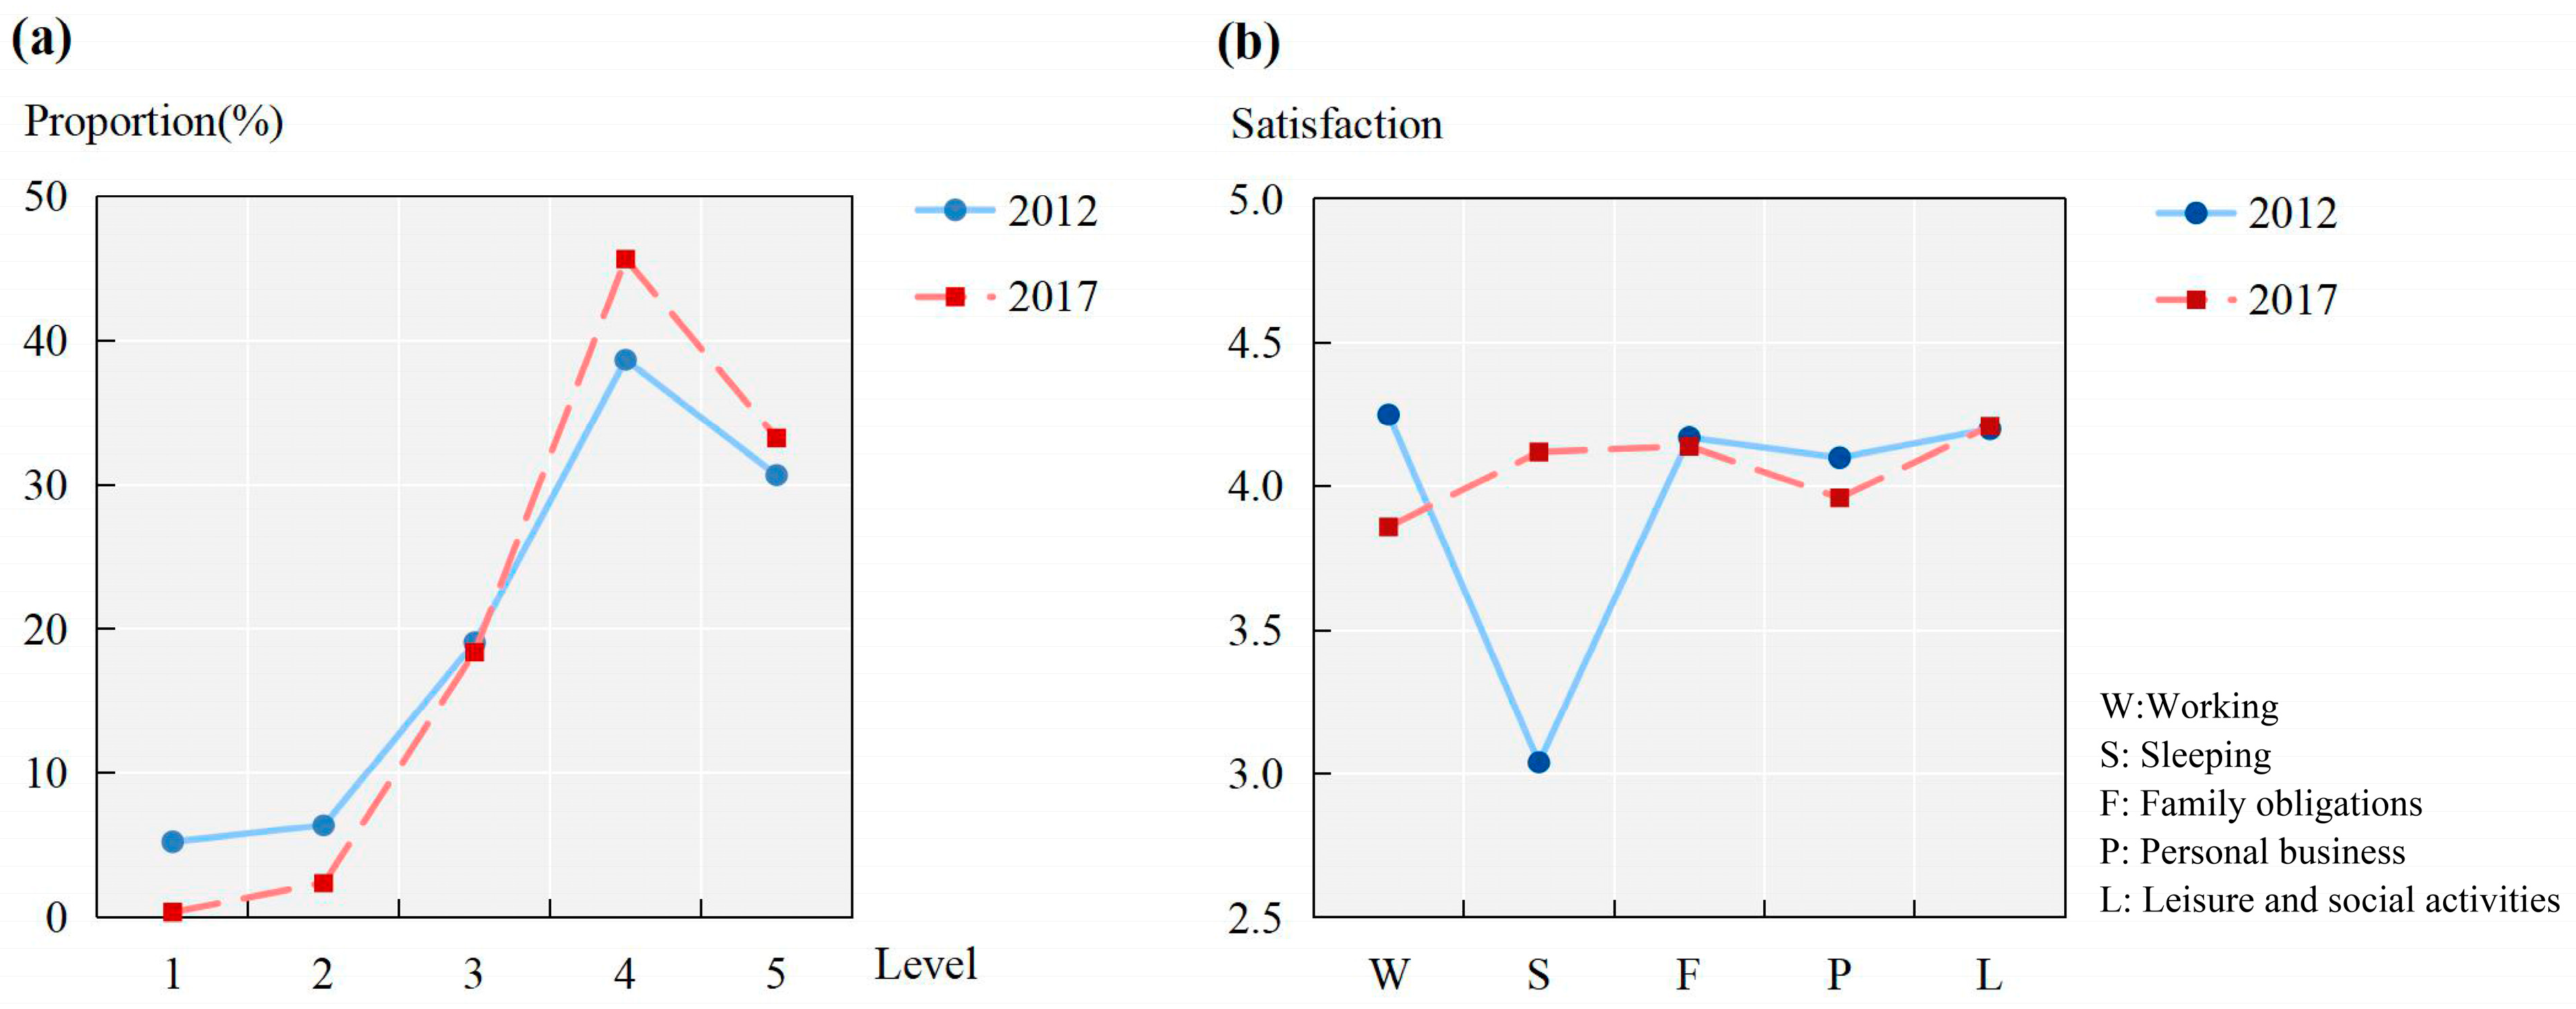
3.1. Comparing Activity Satisfaction across the Two Years
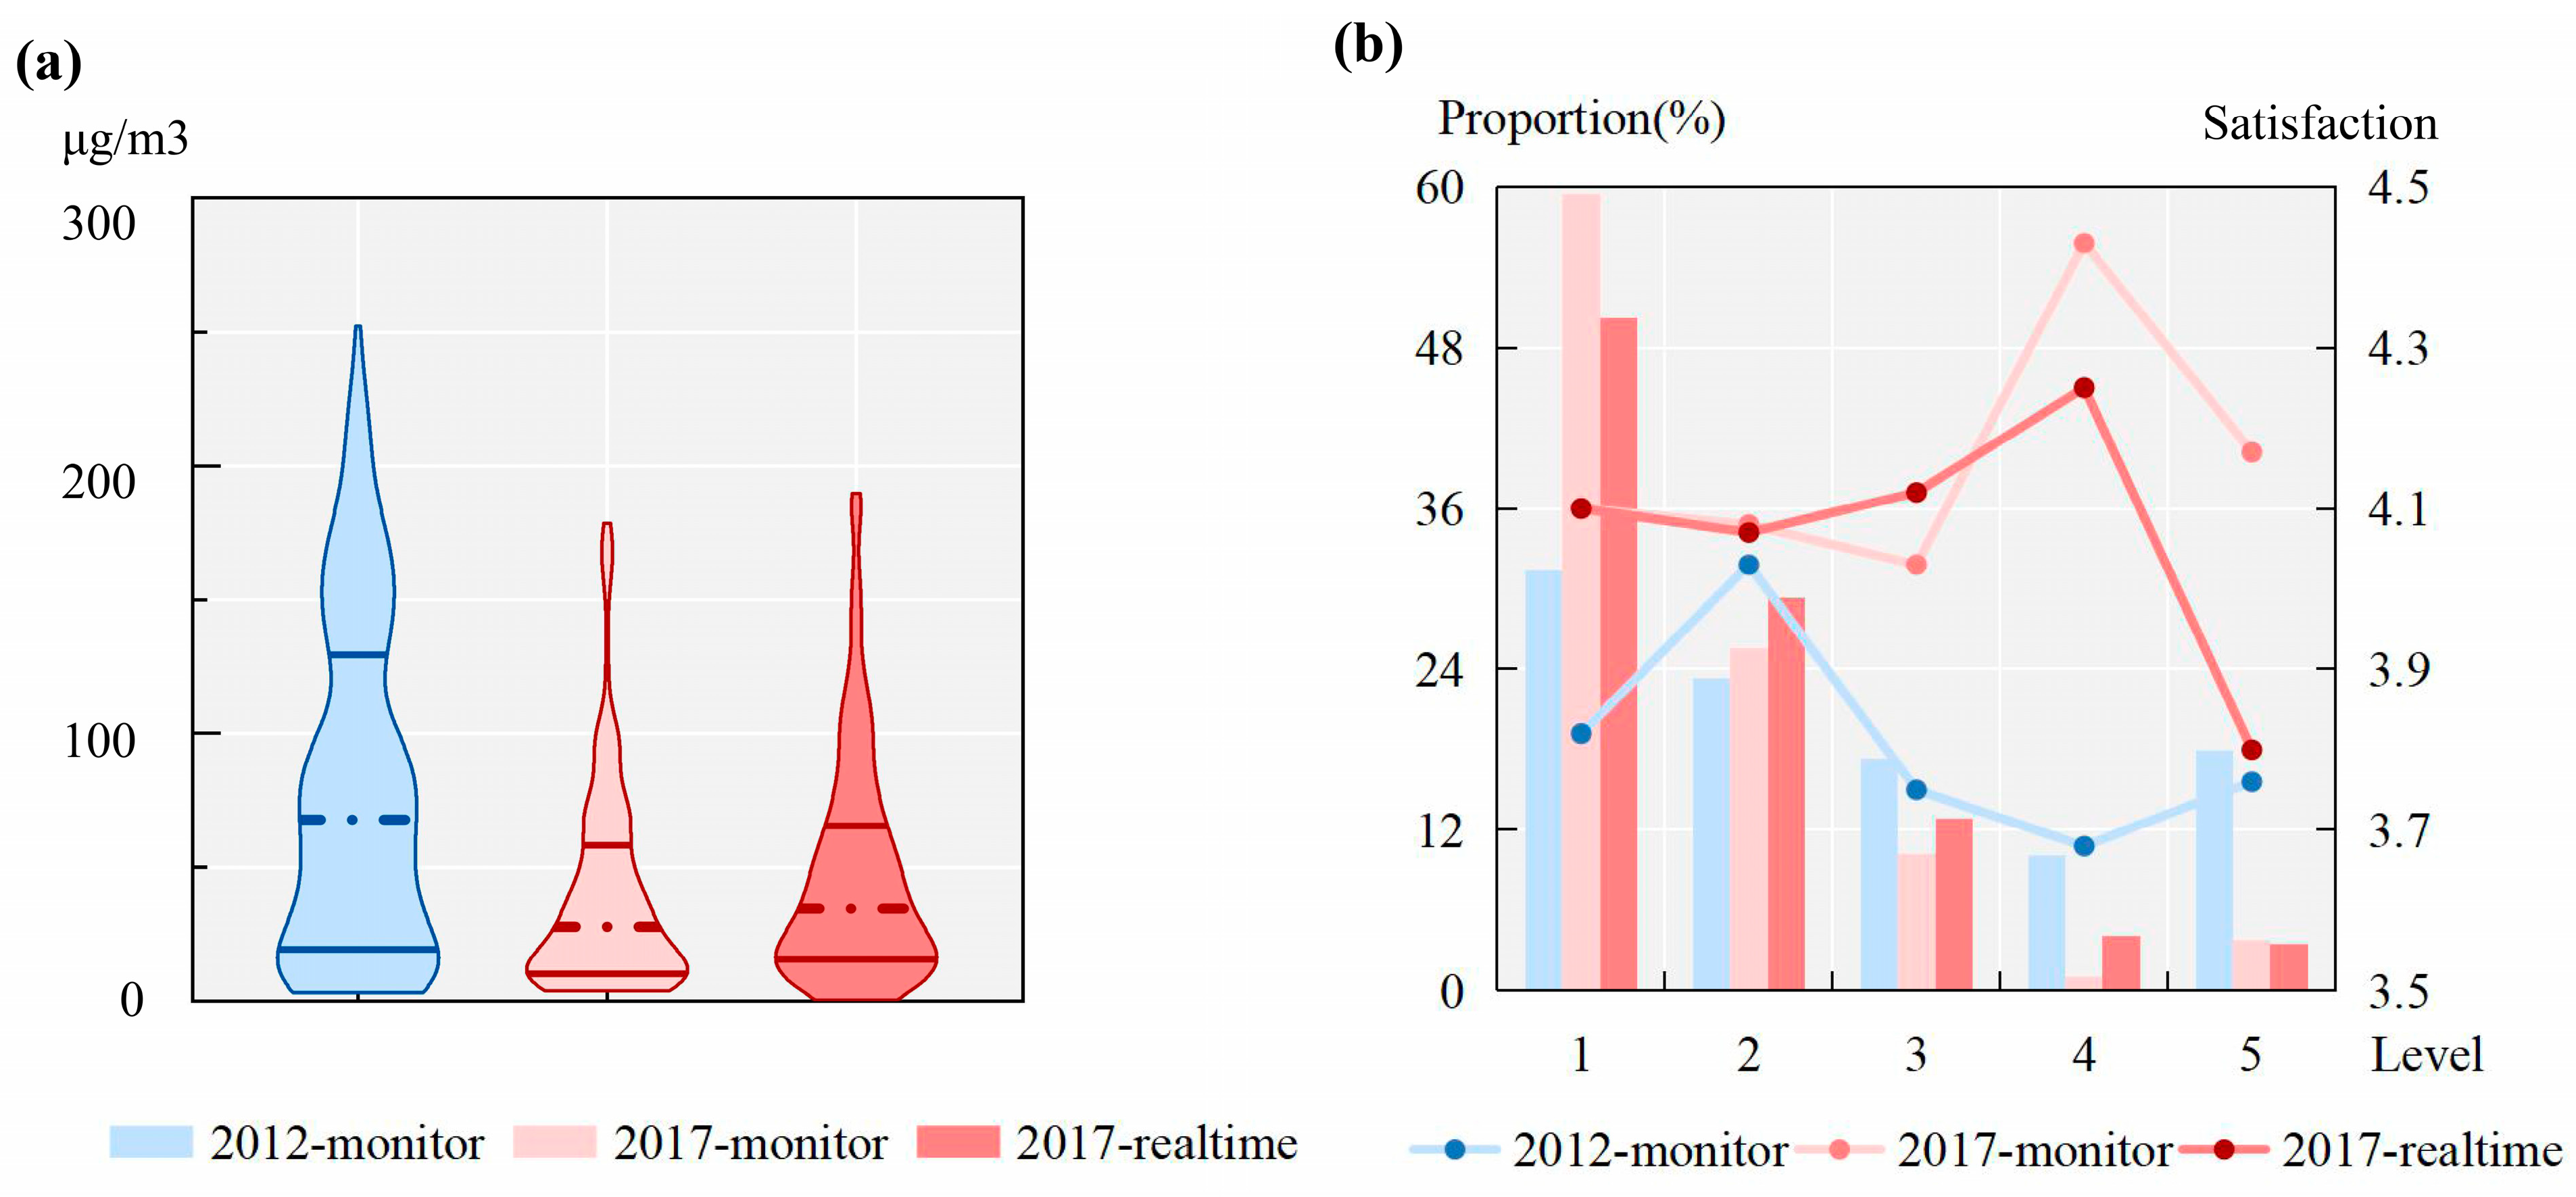
3.2. Comparing Air Pollution across the Two Years
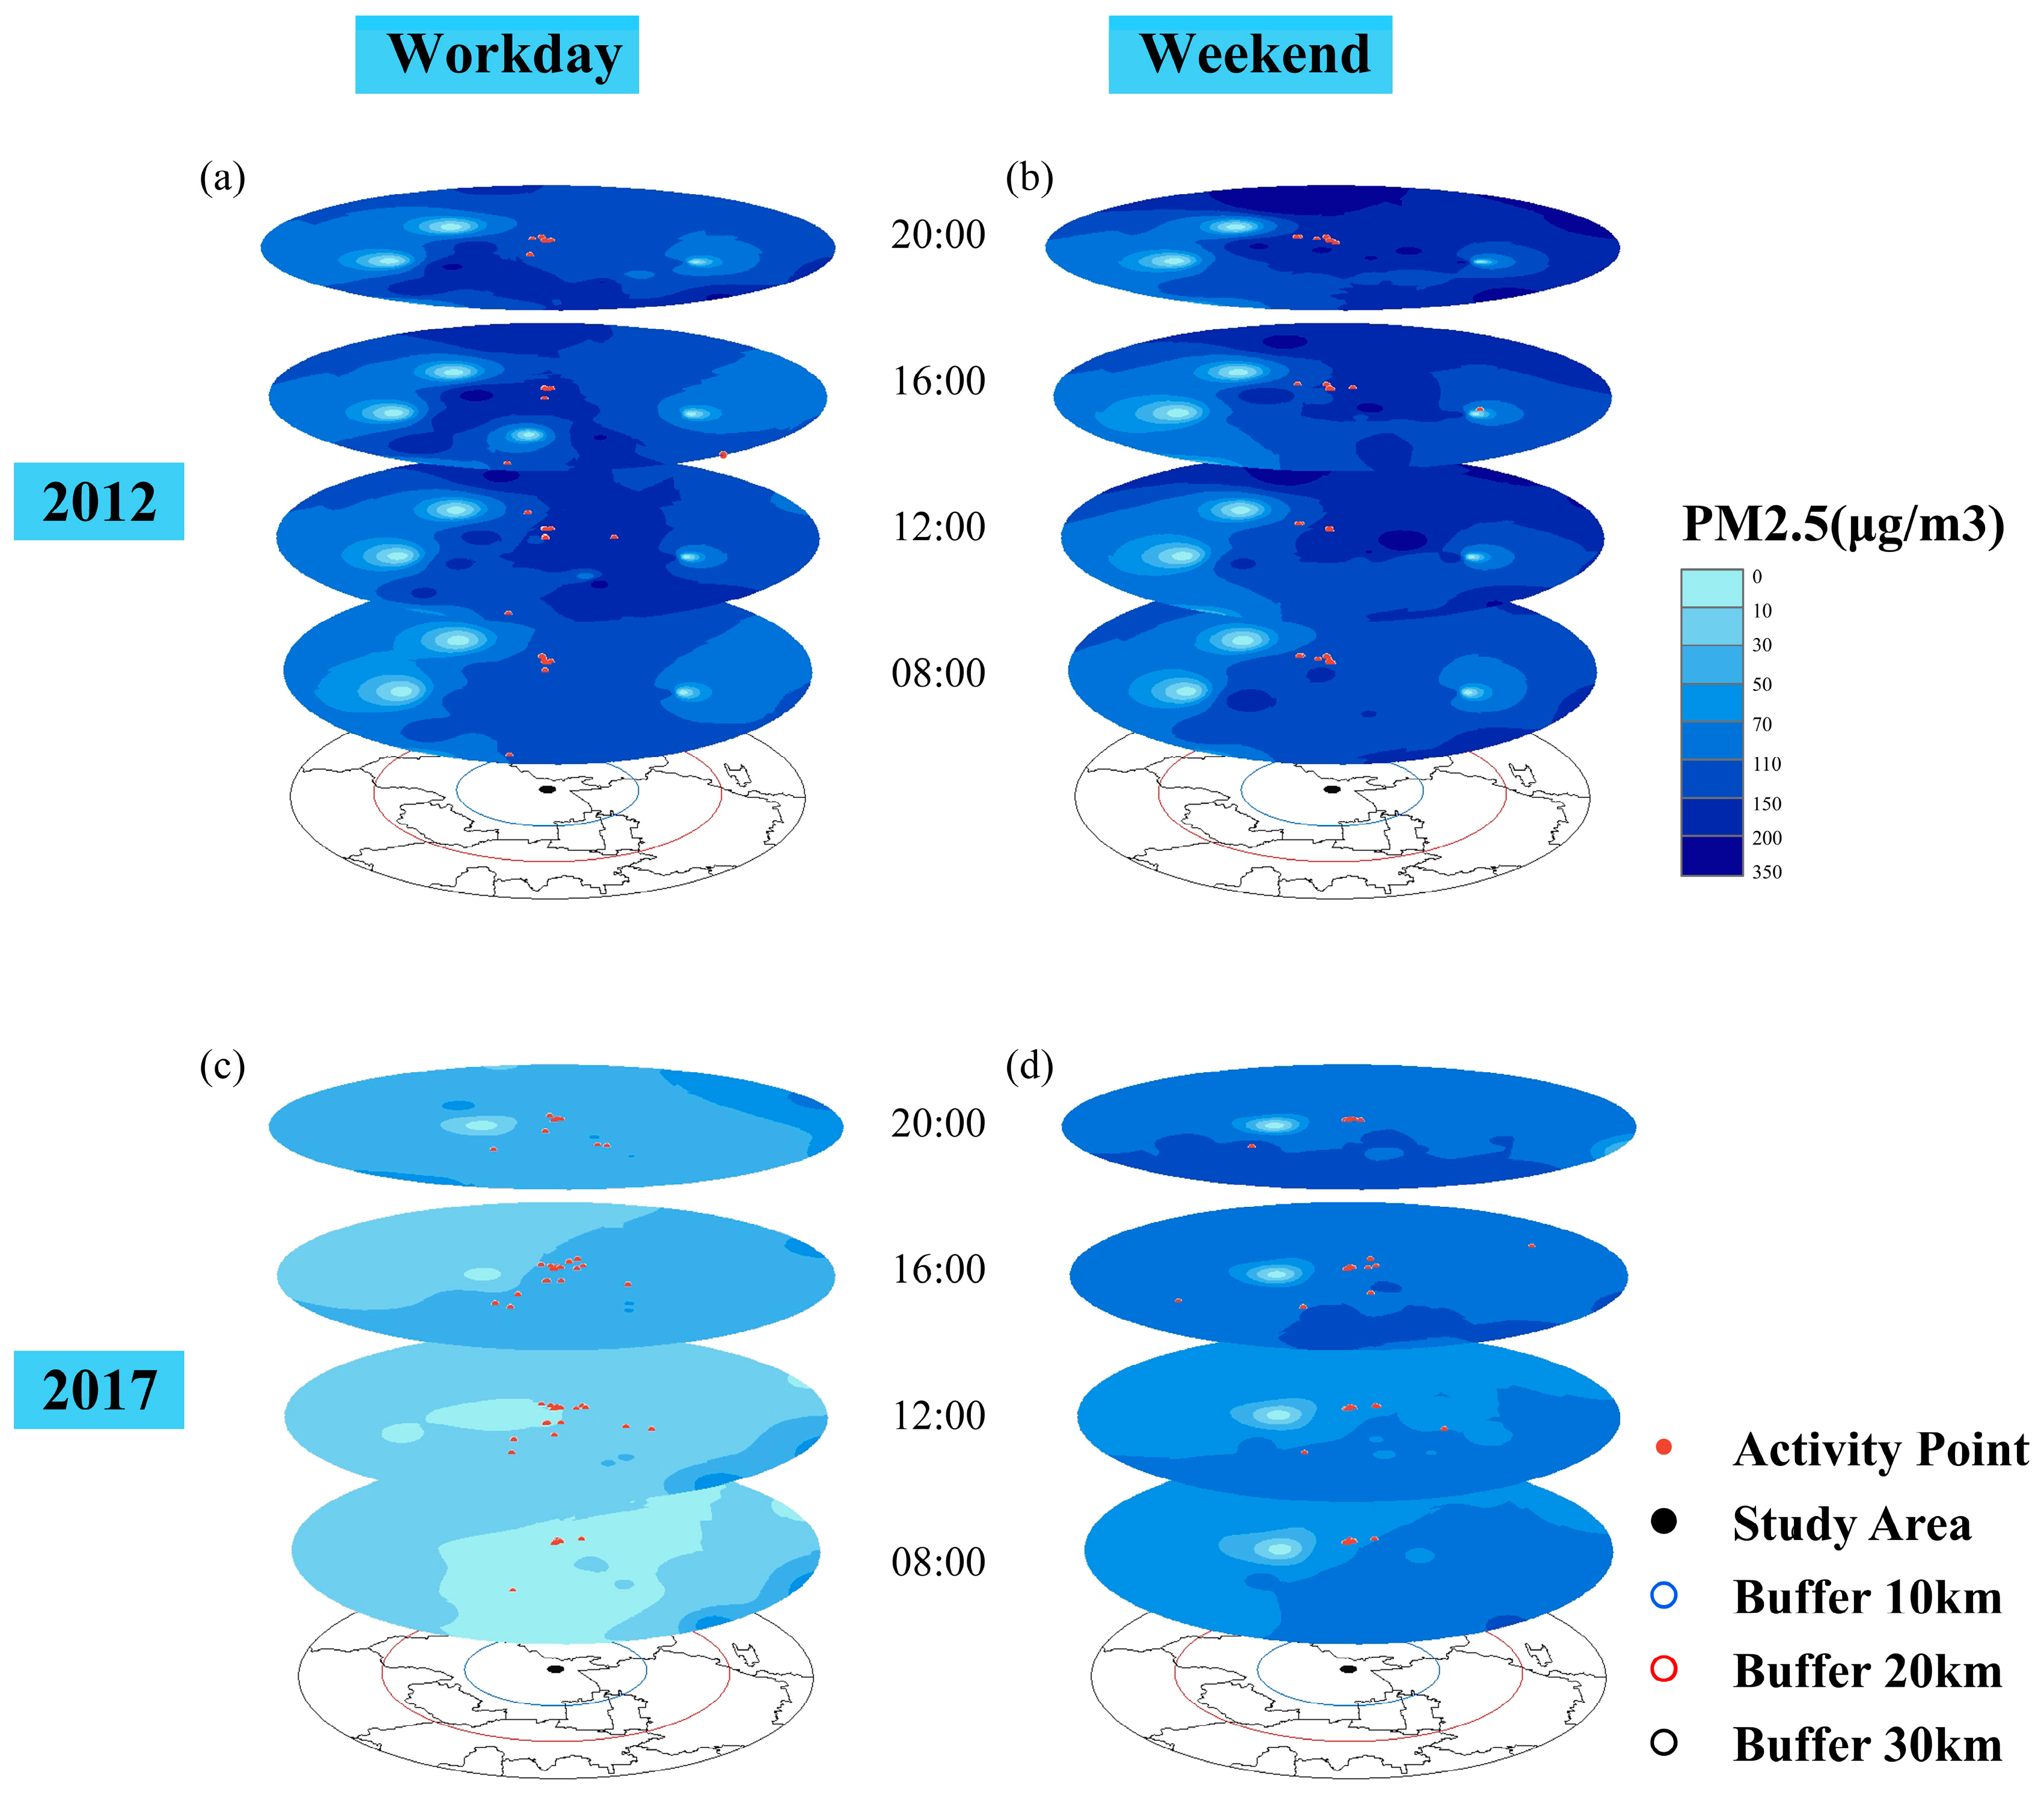
3.3. Activity Distribution on Workdays and Weekends
4. Modeling Results
5. Discussion and Conclusions
Author Contributions
Funding
Institutional Review Board Statement
Informed Consent Statement
Data Availability Statement
Conflicts of Interest
References
- Diener, E.; Larsen, R.J.; Levine, S.; Emmons, R. Intensity and frequency: Dimensions underlying positive and negative affect. J. Personal. Soc. Psychol. 1985, 48, 1253. [Google Scholar] [CrossRef]
- Diener, E.; Suh, E.M.; Lucas, R.E.; Smith, H.L. Subjective well-being: Three decades of progress. Psychol. Bull. 1999, 125, 276–302. [Google Scholar] [CrossRef]
- Diener, E.; Lucas, R.E.; Oishi, S. Subjective well-being: The science of happiness and life satisfaction. In Oxford Handbook of Positive Psychology, 2nd ed.; Lopez, S.J., Snyder, C.R., Eds.; Oxford University Press: Oxford, UK, 2009; pp. 187–194. [Google Scholar]
- Easterlin, R.A. Does economic growth improve the human lot? Some empirical evidence. In Nations and Households in Economic Growth, 2nd ed.; David, P.A., Reder, M.W., Eds.; Academic Press: Cambridge, MA, USA, 1974; pp. 89–125. [Google Scholar]
- Brockmann, H.; Delhey, J.; Welzel, C.; Yuan, H. The China Puzzle: Falling Happiness in a Rising Economy. J. Happiness Stud. 2009, 10, 387–405. [Google Scholar] [CrossRef]
- Easterlin, R.A.; Morgan, R.; Switek, M.; Wang, F. China’s Life satisfaction, 1990–2010. Proc. Natl. Acad. Sci. USA 2012, 109, 9775–9780. [Google Scholar] [CrossRef] [Green Version]
- Liu, J.; Xiong, M.; Su, Y. National happiness in the period of economic growth—A tracking study based on CGSS data. Soc. Sci. China. 2012, 12, 82–102. (In Chinese) [Google Scholar]
- Yang, Y.; Zhang, S. Income Distribution Unfairness, Social Insurance and Happiness of the Chinese. J. Financ. Res. 2016, 8, 34–50. (In Chinese) [Google Scholar]
- Schwanen, T.; Wang, D. Well-being, context, and everyday activities in space and time. Ann. Assoc. Am. Geogr. 2012, 104, 833–851. [Google Scholar] [CrossRef]
- Abou-Zeid, M.; Ben-Akiva, M. Well-being and activity-based models. Transportation 2012, 39, 1189–1207. [Google Scholar] [CrossRef] [Green Version]
- Easterlin, R.A.; McVey, L.A.; Switek, M.; Sawangfa, O.; Zweig, J.S. The happiness–Income paradox revisited. Proc. Natl. Acad. Sci. USA 2010, 107, 22463–22468. [Google Scholar] [CrossRef] [PubMed] [Green Version]
- Du, G.; Shin, K.; Managi, S. Variability in impact of air pollution on subjective well-being. Atmos. Environ. 2018, 183, 175–208. [Google Scholar] [CrossRef]
- MacKerron, G.; Mourato, S. Life satisfaction and air quality in London. Ecol. Econ. 2009, 68, 1441–1453. [Google Scholar] [CrossRef]
- Welsch, H. Environment and happiness: Valuation of air pollution using life satisfaction data. Ecol. Econ. 2006, 58, 801–813. [Google Scholar] [CrossRef]
- Levinson, A. Valuing public goods using happiness data: The case of air quality. J. Public Econ. 2012, 96, 869–880. [Google Scholar] [CrossRef]
- Ma, J.; Tao, Y.; Kwan, M.-P.; Chai, Y. Assessing mobility-based real-time air pollution exposure in space and time using smart sensors and GPS trajectories in Beijing. Ann. Am. Assoc. Geogr. 2020, 110, 434–448. [Google Scholar] [CrossRef]
- Kwan, M.-P. The uncertain geographic context problem. Ann. Assoc. Am. Geogr. 2012, 102, 958–968. [Google Scholar] [CrossRef]
- Wang, X.; Yin, C.; Shao, C. Relationships among haze pollution, commuting behavior and life satisfaction: A quasi-longitudinal analysis. Transp. Res. Part D Transp. Environ. 2021, 92, 102723. [Google Scholar] [CrossRef]
- UN Environment. A Review of 20 Years’ Air Pollution Control in Beijing, 3rd ed.; United Nations Environment Programme: Nairobi, Kenya, 2019; pp. 6–15. [Google Scholar]
- Kahneman, D.; Krueger, A.B.; Schkade, D.A.; Schwarz, N.; Stone, A.A. A survey method for characterizing daily life experience: The day reconstruction method. Science 2004, 306, 1776–1780. [Google Scholar] [CrossRef]
- Camacho, D.; Lee, Y.; Bhattacharya, A.; Vargas, L.X.; Kimberly, L.; Lukens, E. High Life Satisfaction: Exploring the Role of Health, Social Integration and Perceived Safety among Mexican Midlife and Older Adults. J. Appl. Gerontol. 2019, 62, 521–542. [Google Scholar] [CrossRef]
- Ma, J.; Rao, J.; Kwan, M.; Chai, Y. Examining the effects of mobility-based air and noise pollution on activity satisfaction. Transp. Res. Part D Transp. Environ. 2020, 89, 102633. [Google Scholar] [CrossRef]
- Ettema, D.; Friman, M.; Gärling, T.; Olsson, L.E. How in-vehicle activities affect work commuters’ satisfaction with public transport. J. Transp. Geogr. 2012, 24, 215–222. [Google Scholar] [CrossRef]
- Ferreira, S.; Akay, A.; Brereton, F.; Cuñado, J.; Martinsson, P.; Moro, M.; Ningal, T.F. Life satisfaction and air quality in Europe. Ecol. Econ. 2013, 88, 1–10. [Google Scholar] [CrossRef]


| Variable | Description | 2012 (%) | 2017 (%) |
|---|---|---|---|
| Age | 18–29 | 23.08 | 16.67 |
| 30–39 | 50.43 | 26.19 | |
| 40–49 | 19.66 | 32.14 | |
| >50 | 5.98 | 25.00 | |
| Gender | Male | 46.15 | 46.43 |
| Female | 53.85 | 53.57 | |
| Residence status | Migrants | 9.40 | 20.24 |
| Local residents | 90.60 | 79.76 | |
| Employment | Employed | 92.31 | 72.62 |
| Unemployed | 7.69 | 27.38 | |
| Education | College or above | 84.62 | 65.48 |
| High school or below | 15.38 | 34.52 | |
| Activity type | Working | 3.69 | 10.55 |
| Sleeping | 29.82 | 22.04 | |
| Family obligations | 12.61 | 17.37 | |
| Personal business | 33.97 | 28.79 | |
| Leisure and social activities | 19.91 | 21.25 | |
| Activity duration | ≤1 h | 40.05 | 46.31 |
| 1~3 h | 33.05 | 27.10 | |
| 3 h | 26.90 | 26.45 |
| Monitor Data | Real-Time Data | |
|---|---|---|
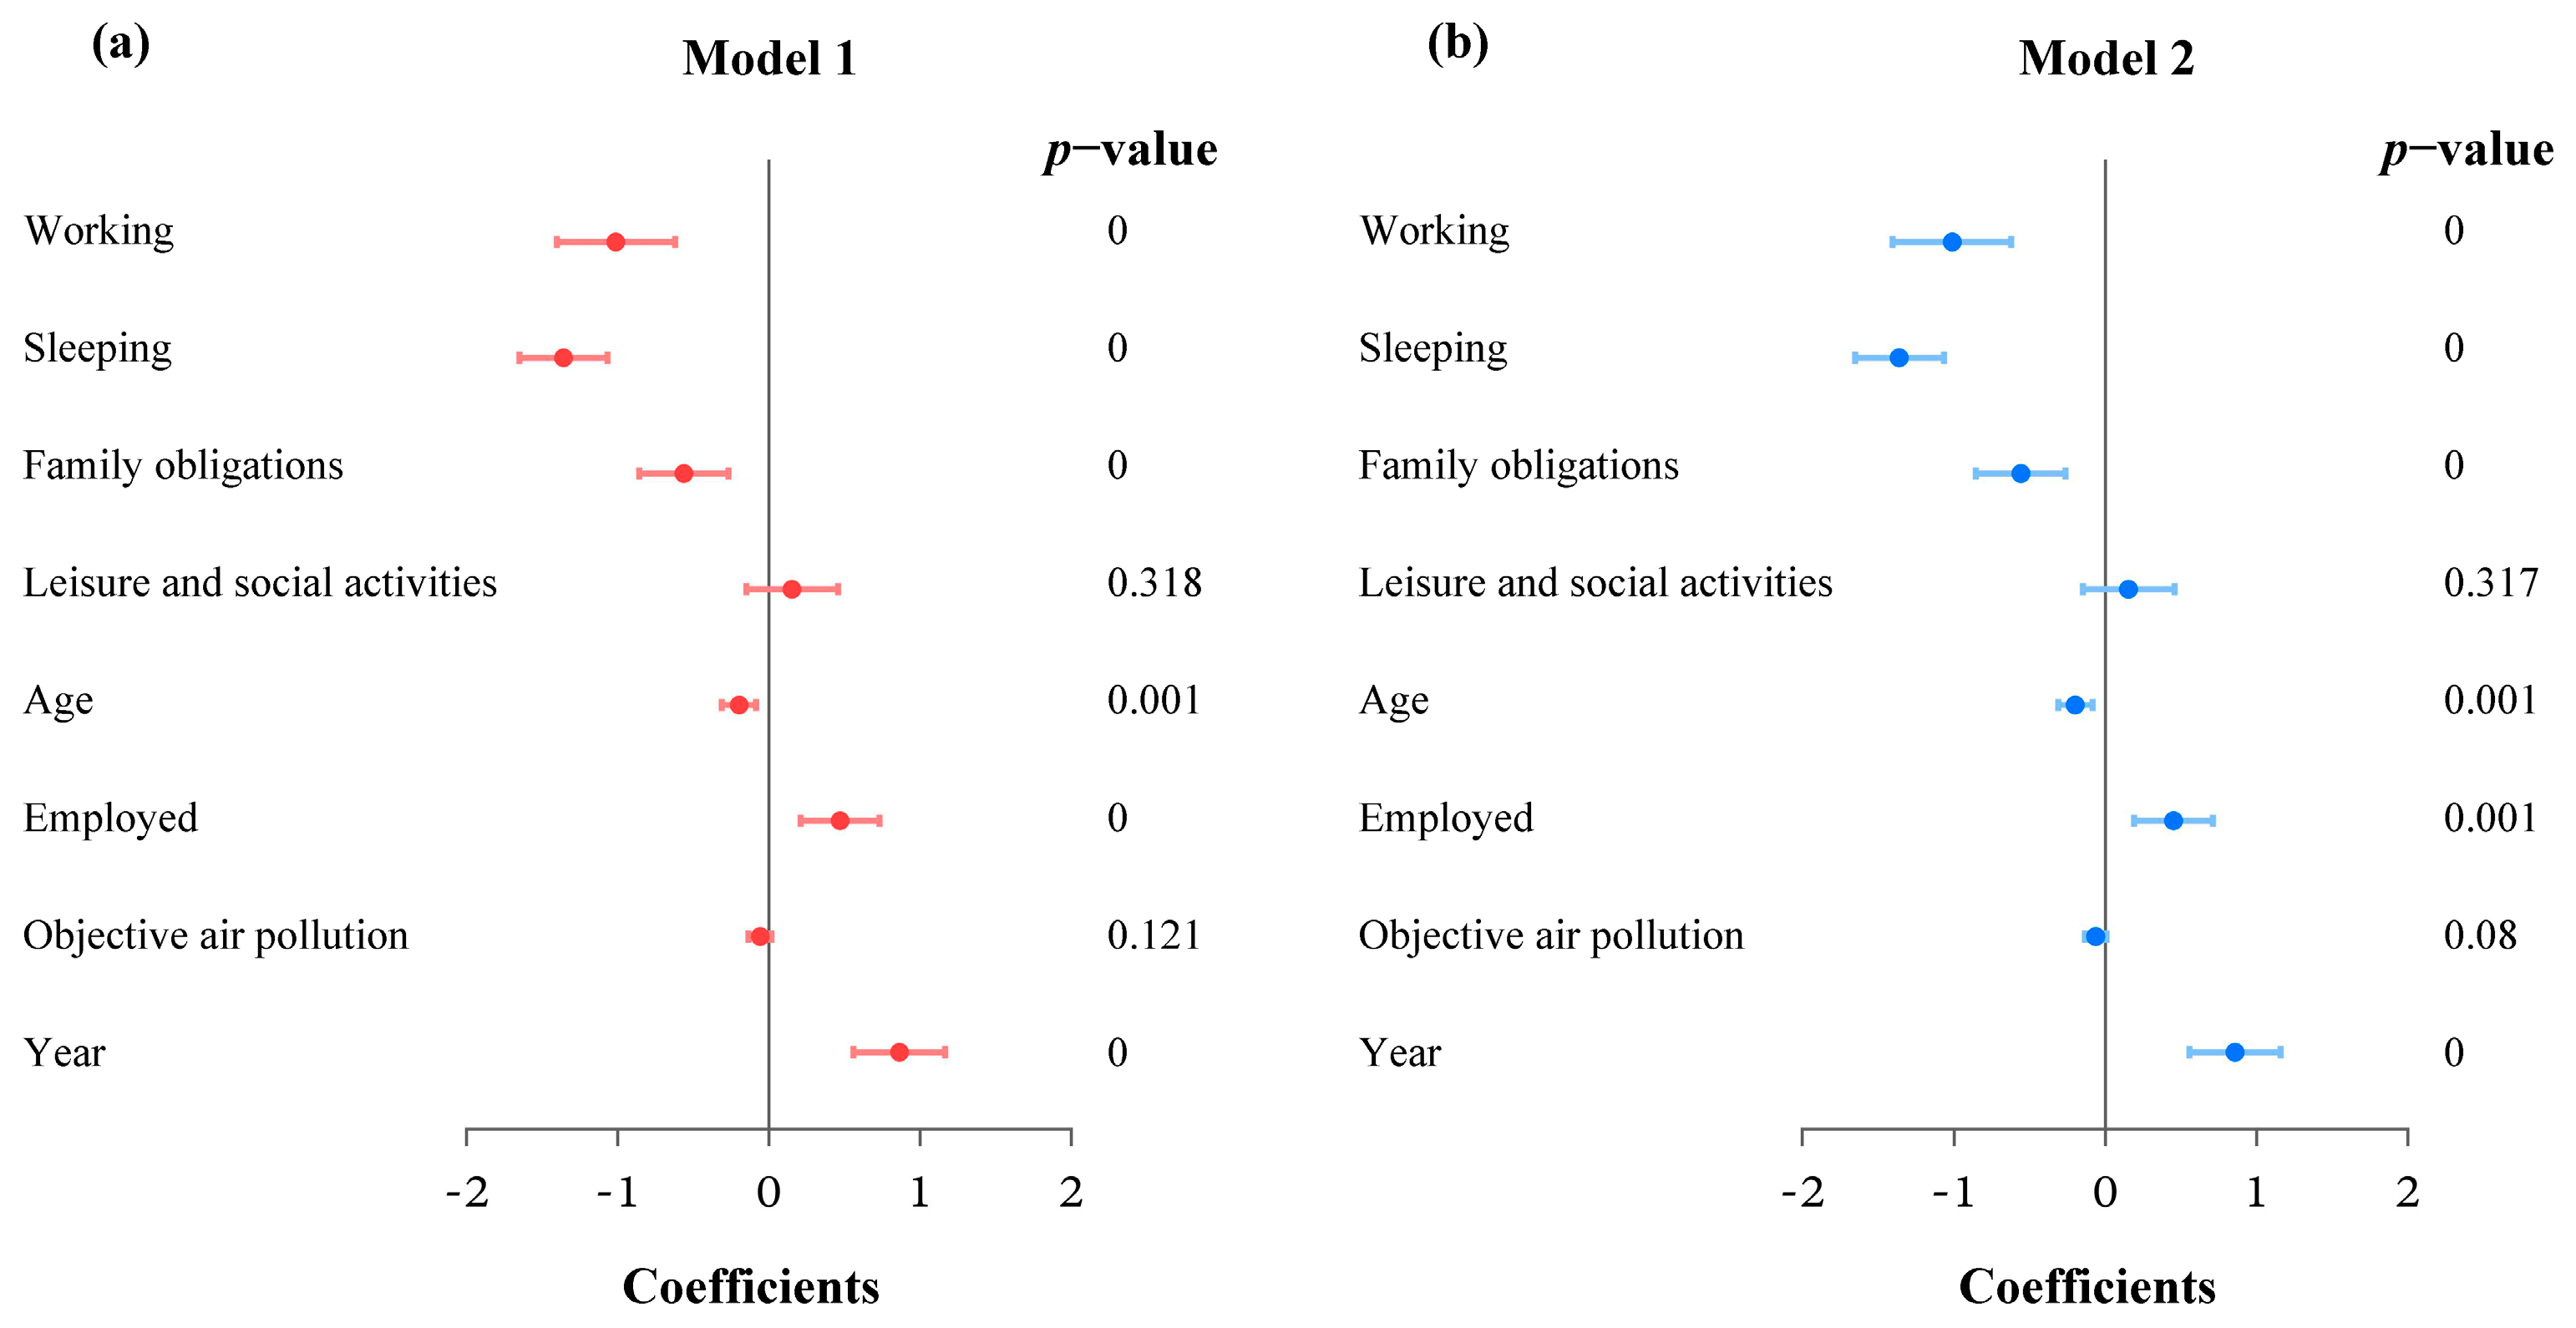
| Variables | Model 1 | Model 2 |
| Duration | 0.041 | 0.040 |
| Workday | −0.013 | −0.009 |
| Type | ||
| Working | −1.012 ** | −1.013 ** |
| Sleeping | −1.359 ** | −1.360 ** |
| Family obligations | −0.562 ** | −0.561 ** |
| Leisure and social activities | 0.154 | 0.154 |
| Age | −0.197 ** | −0.199 ** |
| Male | 0.089 | 0.093 |
| Migrant | −0.162 | −0.155 |
| Employed | 0.470 ** | 0.451 ** |
| Education | 0.110 | 0.097 |
| Objective air pollution | −0.059 | −0.064 * |
| Year | 0.862 ** | 0.857 ** |
| Workday | Weekend | |||
|---|---|---|---|---|
| Monitor Data | Real-Time Data | Monitor Data | Real-Time Data | |
| Variables | Model 3 | Model 4 | Model 5 | Model 6 |
| Duration | 0.107 | 0.103 | −0.014 | −0.017 |
| Type | ||||
| Working | −1.030 ** | −1.031 ** | −1.122 ** | −1.126 ** |
| Sleeping | −1.508 ** | −1.510 ** | −1.226 ** | −1.225 ** |
| Family obligations | −0.574 ** | −0.571 ** | −0.525 ** | −0.523 ** |
| Leisure and social activities | 0.114 | 0.115 | 0.194 | 0.195 |
| Age | −0.182 ** | −0.192 ** | −0.208 ** | −0.204 ** |
| Male | 0.211 | 0.218 | −0.016 | −0.014 |
| Migrant | −0.167 | −0.156 | −0.180 | −0.182 |
| Employed | 0.558 ** | 0.529 ** | 0.383 ** | 0.371 ** |
| Education | 0.046 | 0.022 | 0.148 | 0.140 |
| Objective air pollution | −0.109 | −0.059 ** | −0.033 | −0.019 |
| Year | 0.722 ** | 0.862 ** | 0.984 ** | 0.994 ** |
| Monitor Data | Real-Time Data | |
|---|---|---|
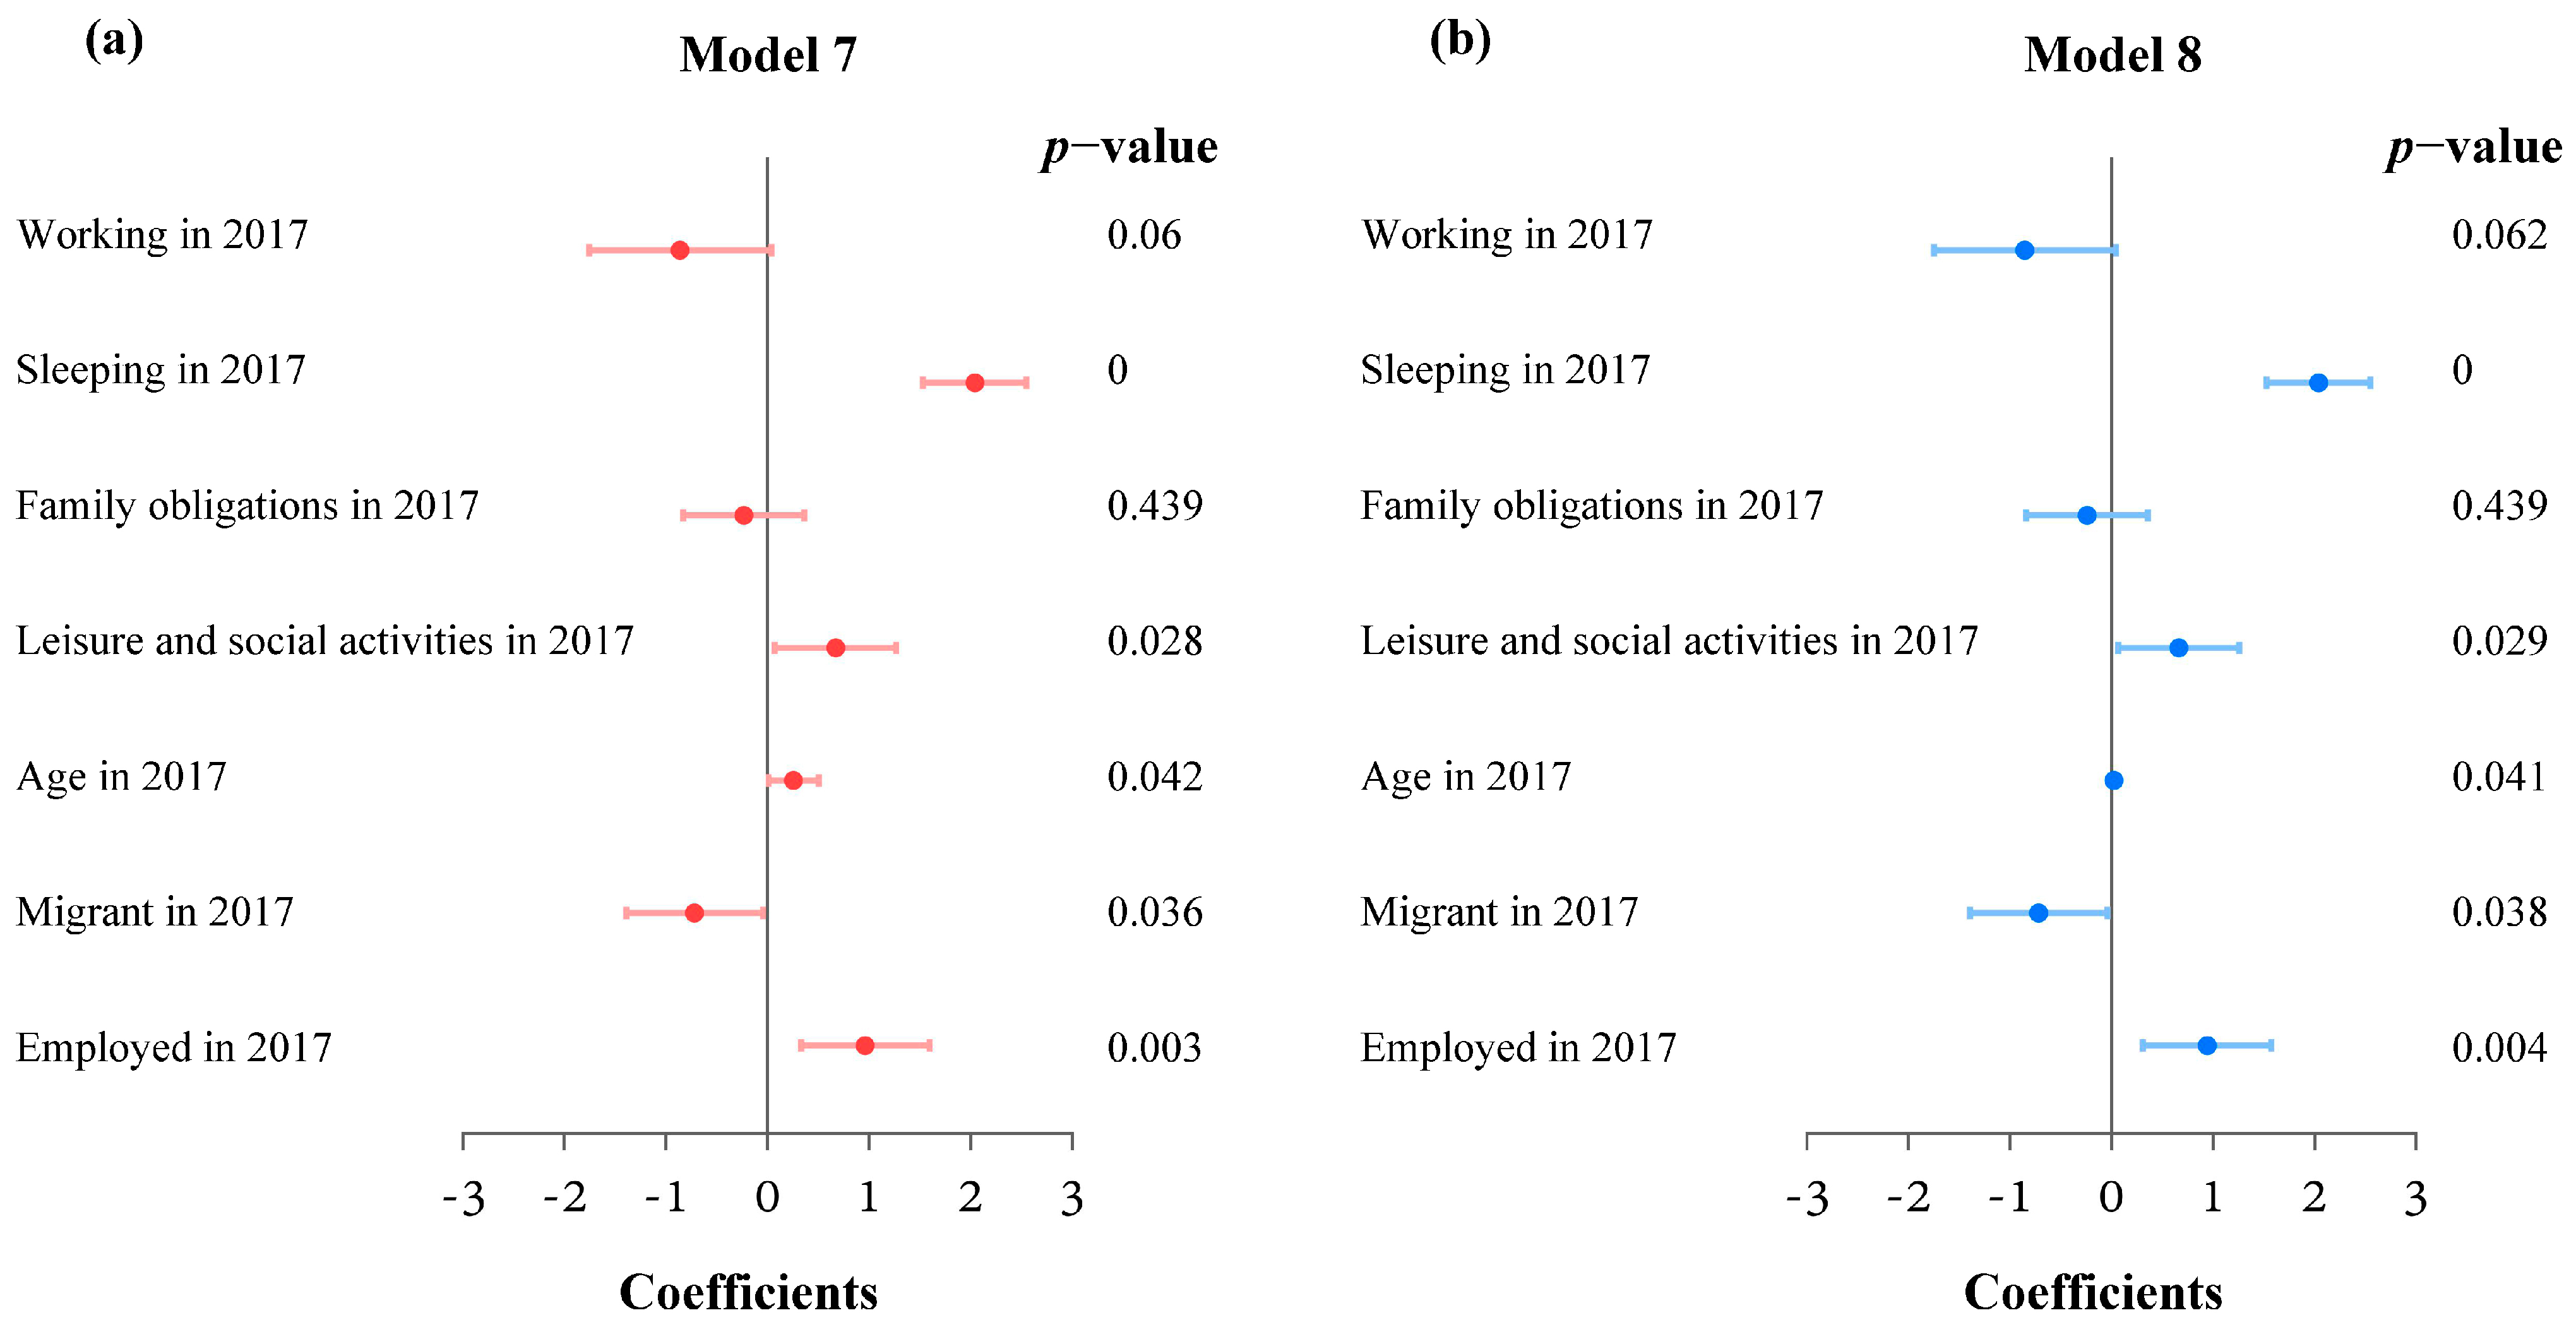
| Variables | Model 7 | Model 8 |
| Working in 2017 | −0.861 * | −0.852 * |
| Sleeping in 2017 | 2.040 ** | 2.041 ** |
| Family obligations in 2017 | −0.236 | −0.237 |
| Leisure and social activities in 2017 | 0.670 ** | 0.665 ** |
| Age in 2017 | 0.027 ** | 0.027 ** |
| Male in 2017 | −0.024 | −0.019 |
| Migrant in 2017 | −0.722 ** | −0.714 ** |
| Employed in 2017 | 0.962 ** | 0.943 ** |
| Education in 2017 | 0.182 | 0.174 |
| Objective air pollution in 2017 | −0.019 | 0.009 |
Disclaimer/Publisher’s Note: The statements, opinions and data contained in all publications are solely those of the individual author(s) and contributor(s) and not of MDPI and/or the editor(s). MDPI and/or the editor(s) disclaim responsibility for any injury to people or property resulting from any ideas, methods, instructions or products referred to in the content. |
© 2023 by the authors. Licensee MDPI, Basel, Switzerland. This article is an open access article distributed under the terms and conditions of the Creative Commons Attribution (CC BY) license (https://creativecommons.org/licenses/by/4.0/).
Share and Cite
Rao, J.; Ma, J.; Chai, Y. Comparing Mobility-Based PM2.5 Concentrations and Activity Satisfaction in Beijing between 2012 and 2017. Int. J. Environ. Res. Public Health 2023, 20, 1386. https://doi.org/10.3390/ijerph20021386
Rao J, Ma J, Chai Y. Comparing Mobility-Based PM2.5 Concentrations and Activity Satisfaction in Beijing between 2012 and 2017. International Journal of Environmental Research and Public Health. 2023; 20(2):1386. https://doi.org/10.3390/ijerph20021386
Chicago/Turabian StyleRao, Jingwen, Jing Ma, and Yanwei Chai. 2023. "Comparing Mobility-Based PM2.5 Concentrations and Activity Satisfaction in Beijing between 2012 and 2017" International Journal of Environmental Research and Public Health 20, no. 2: 1386. https://doi.org/10.3390/ijerph20021386