
Hydrological Analysis of Batu Dam, Malaysia in the Urban Area: Flood and Failure Analysis Preparing for Climate Change
 ,
,
Abstract
:
1. Introduction
2. Materials and Methods
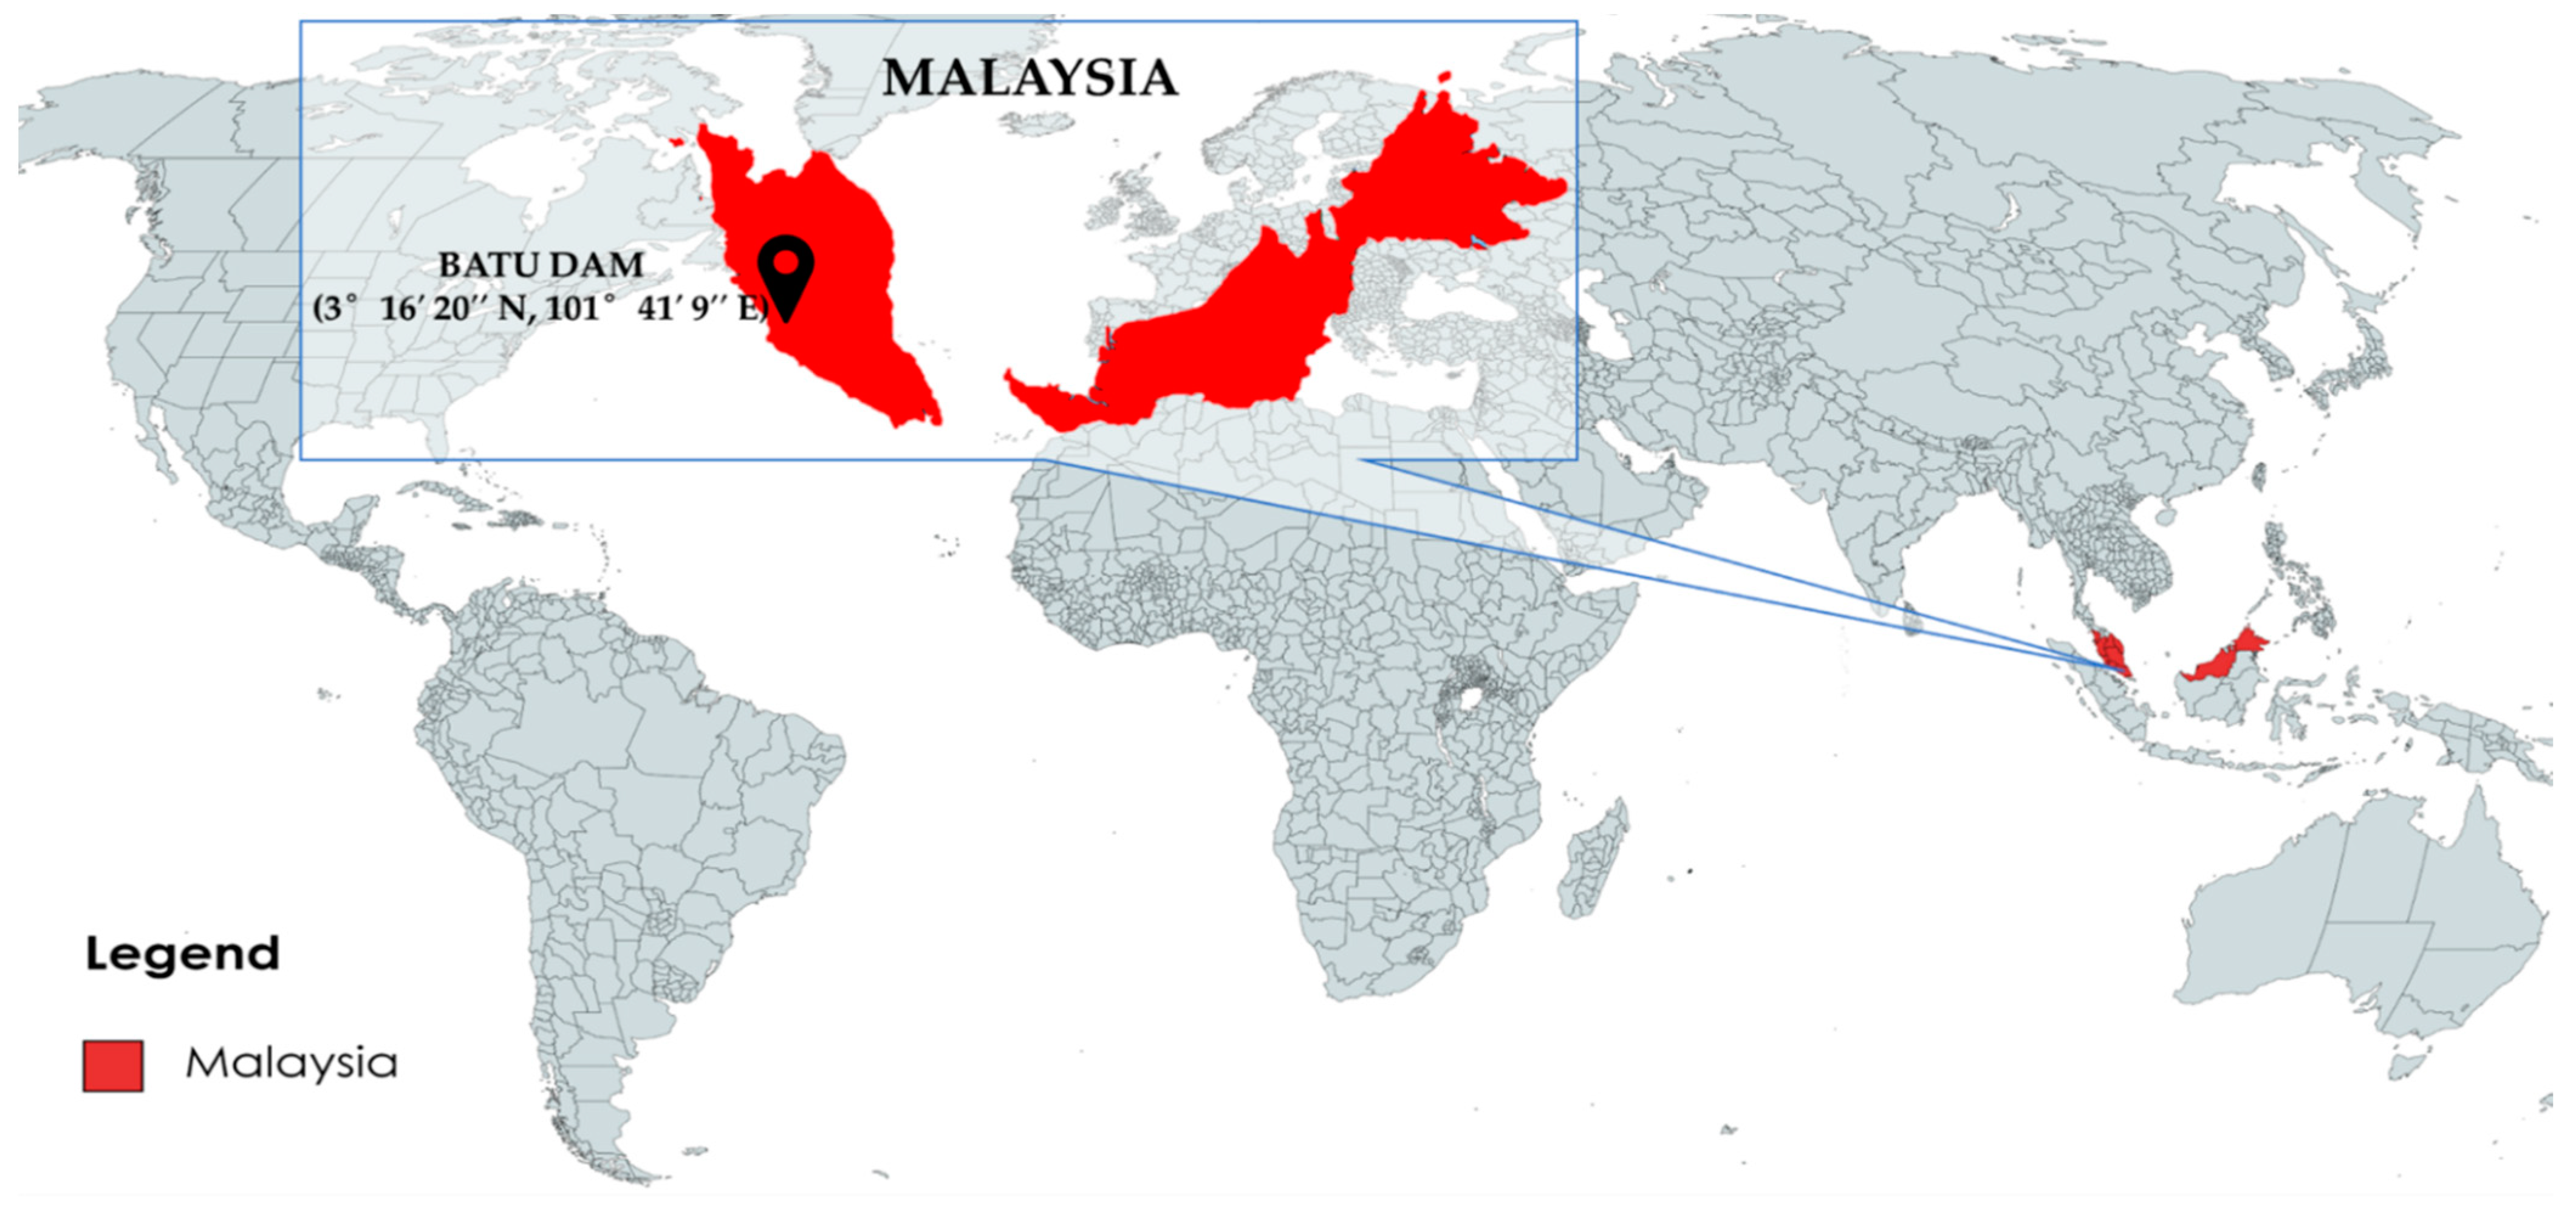
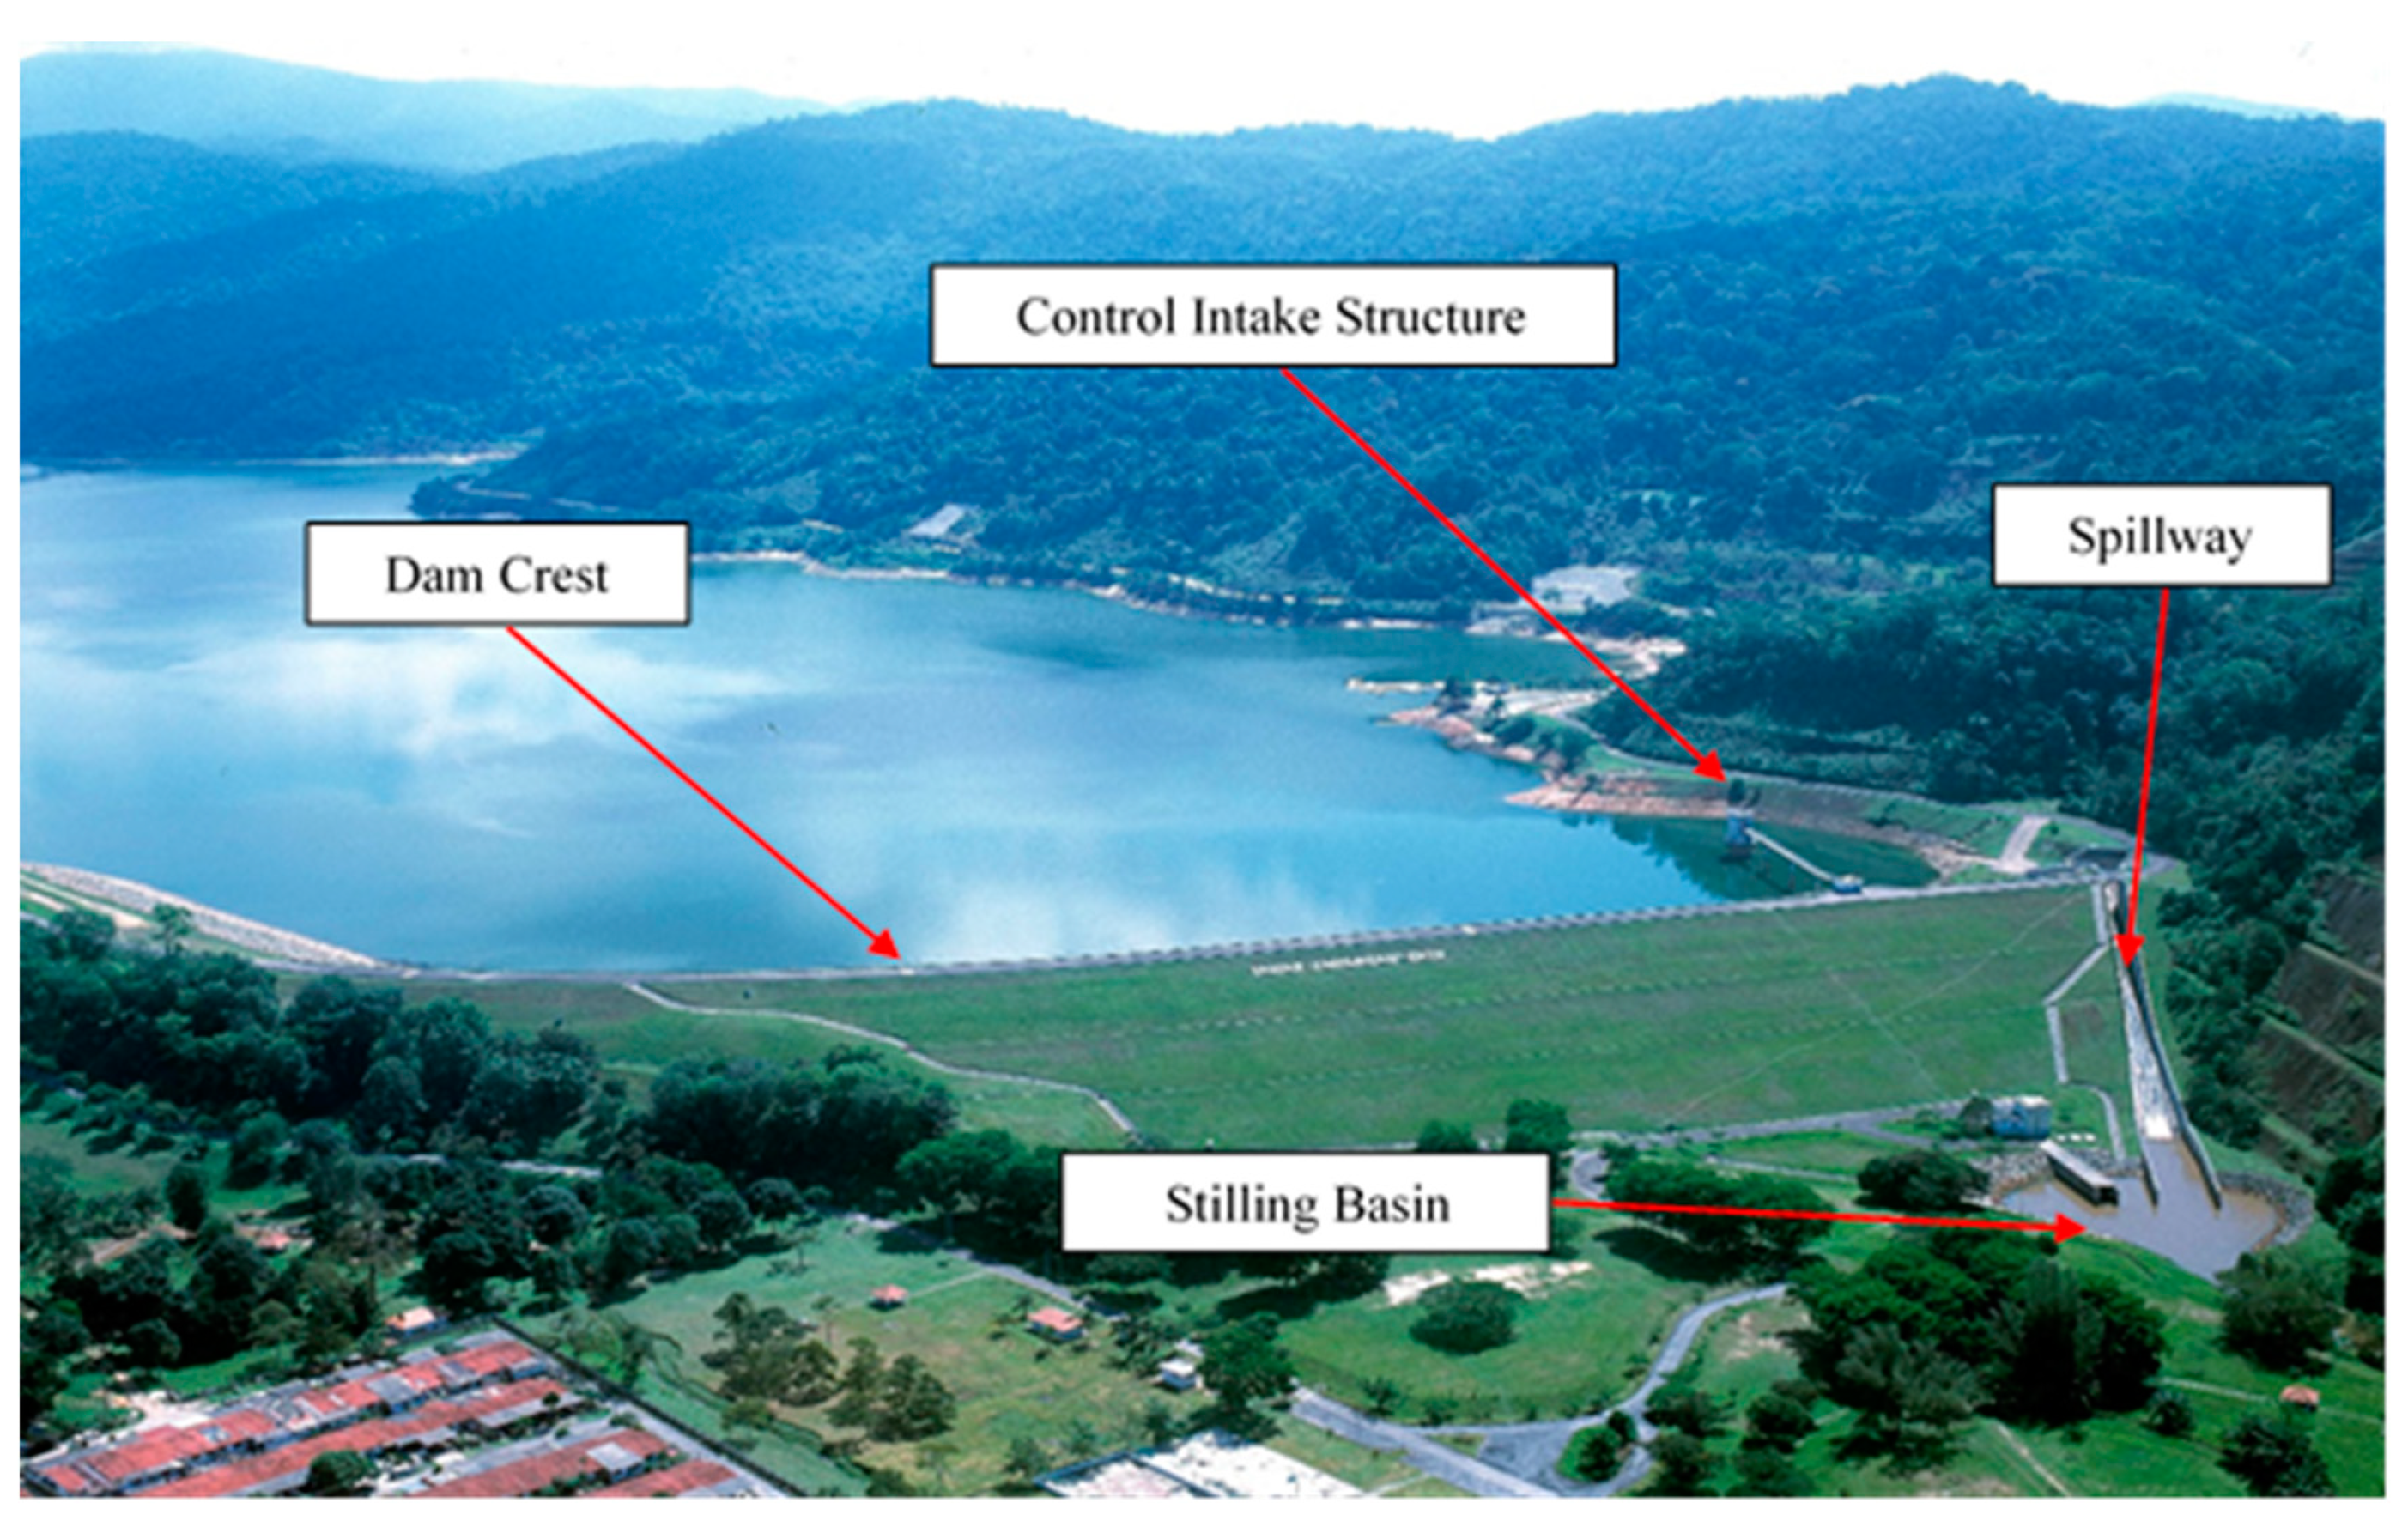
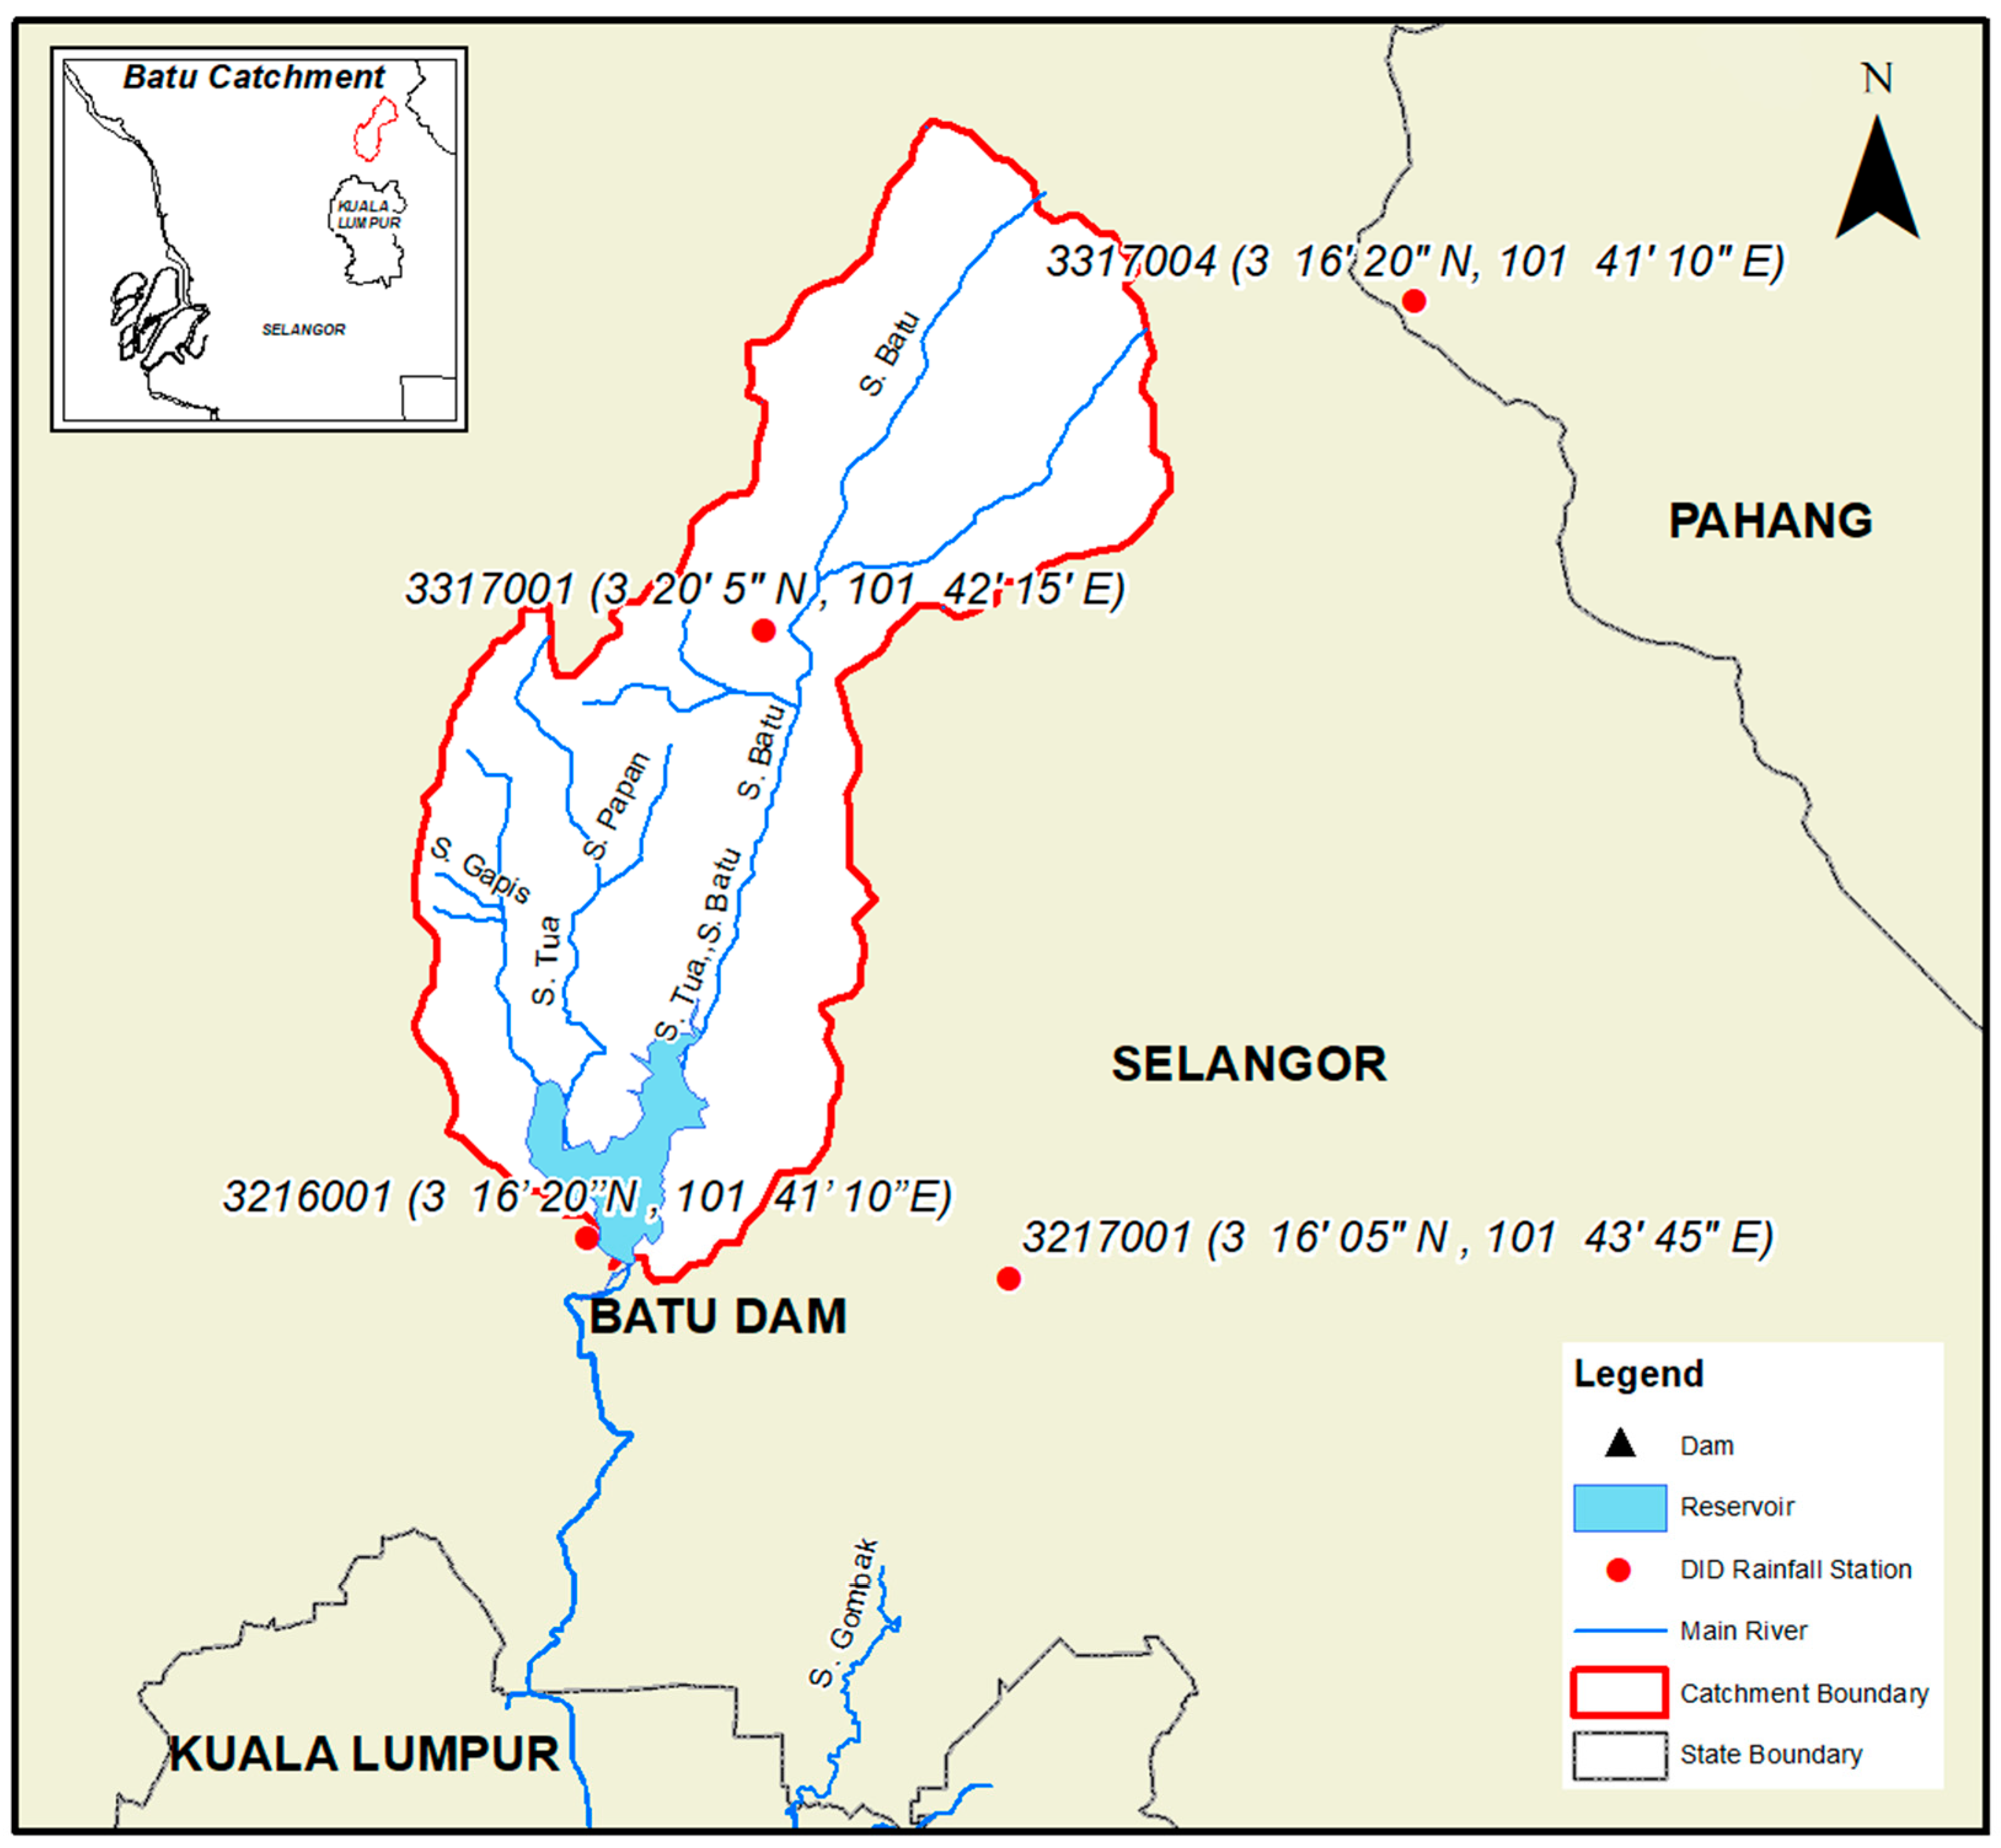
2.1. Study Area
2.2. Methods
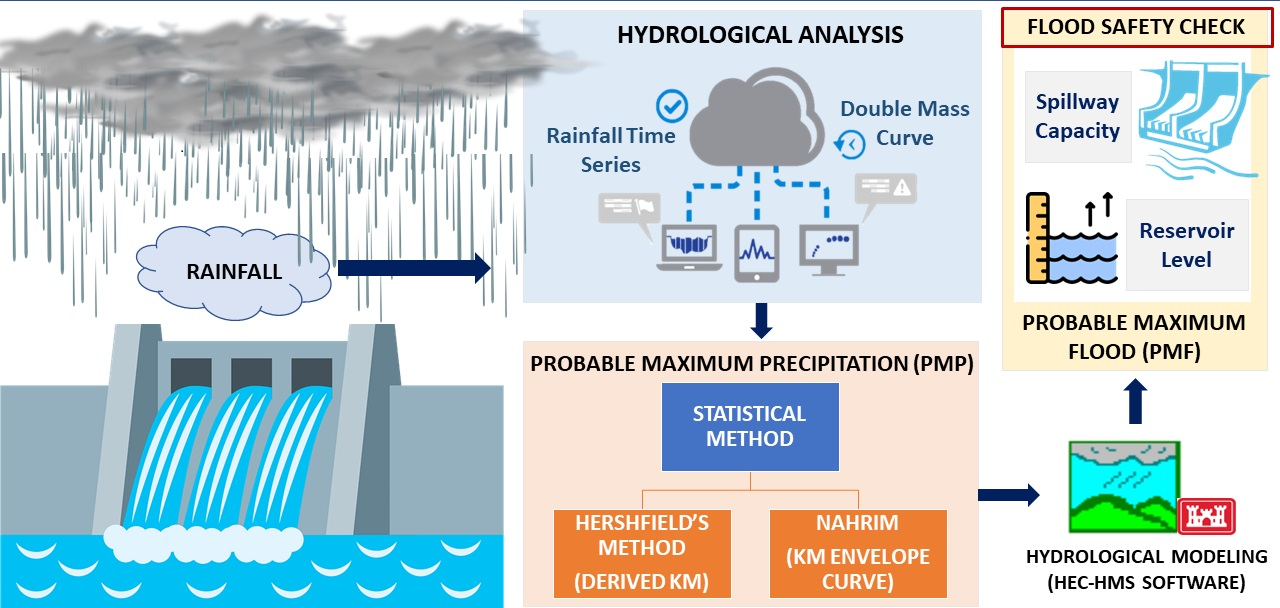
2.2.1. Hydrological Analysis
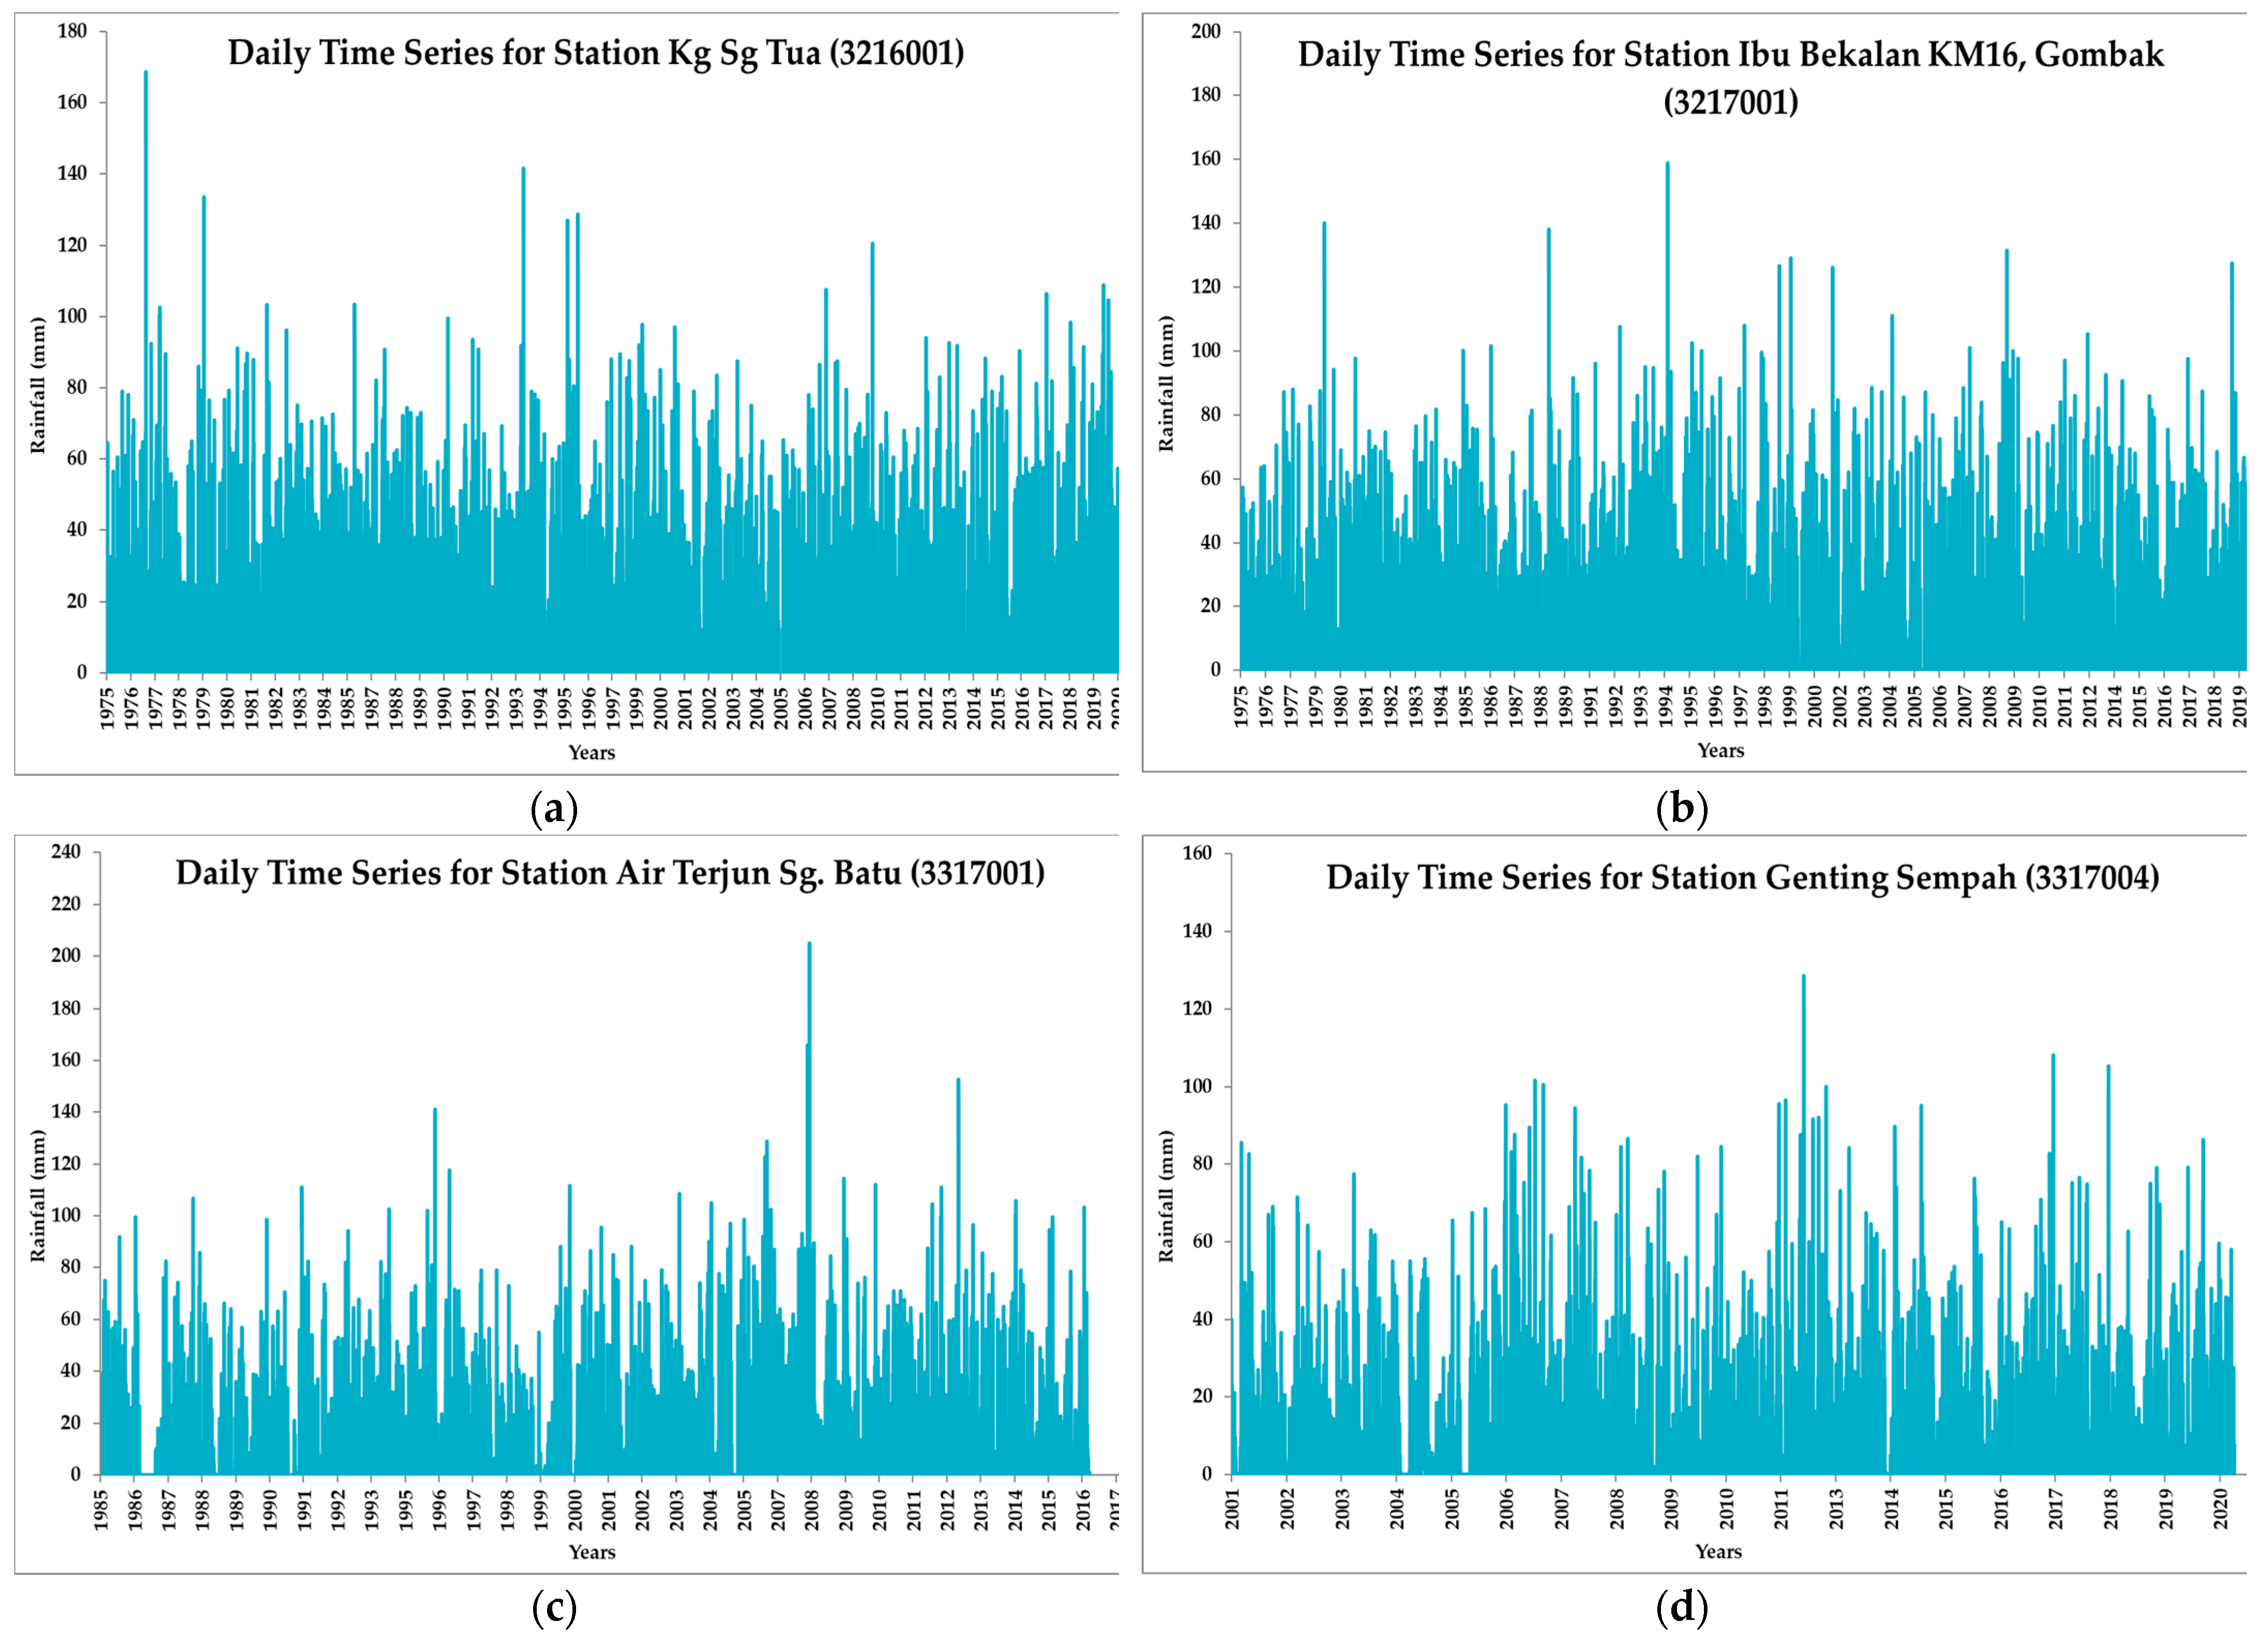
- Rainfall Time Series
- 2.
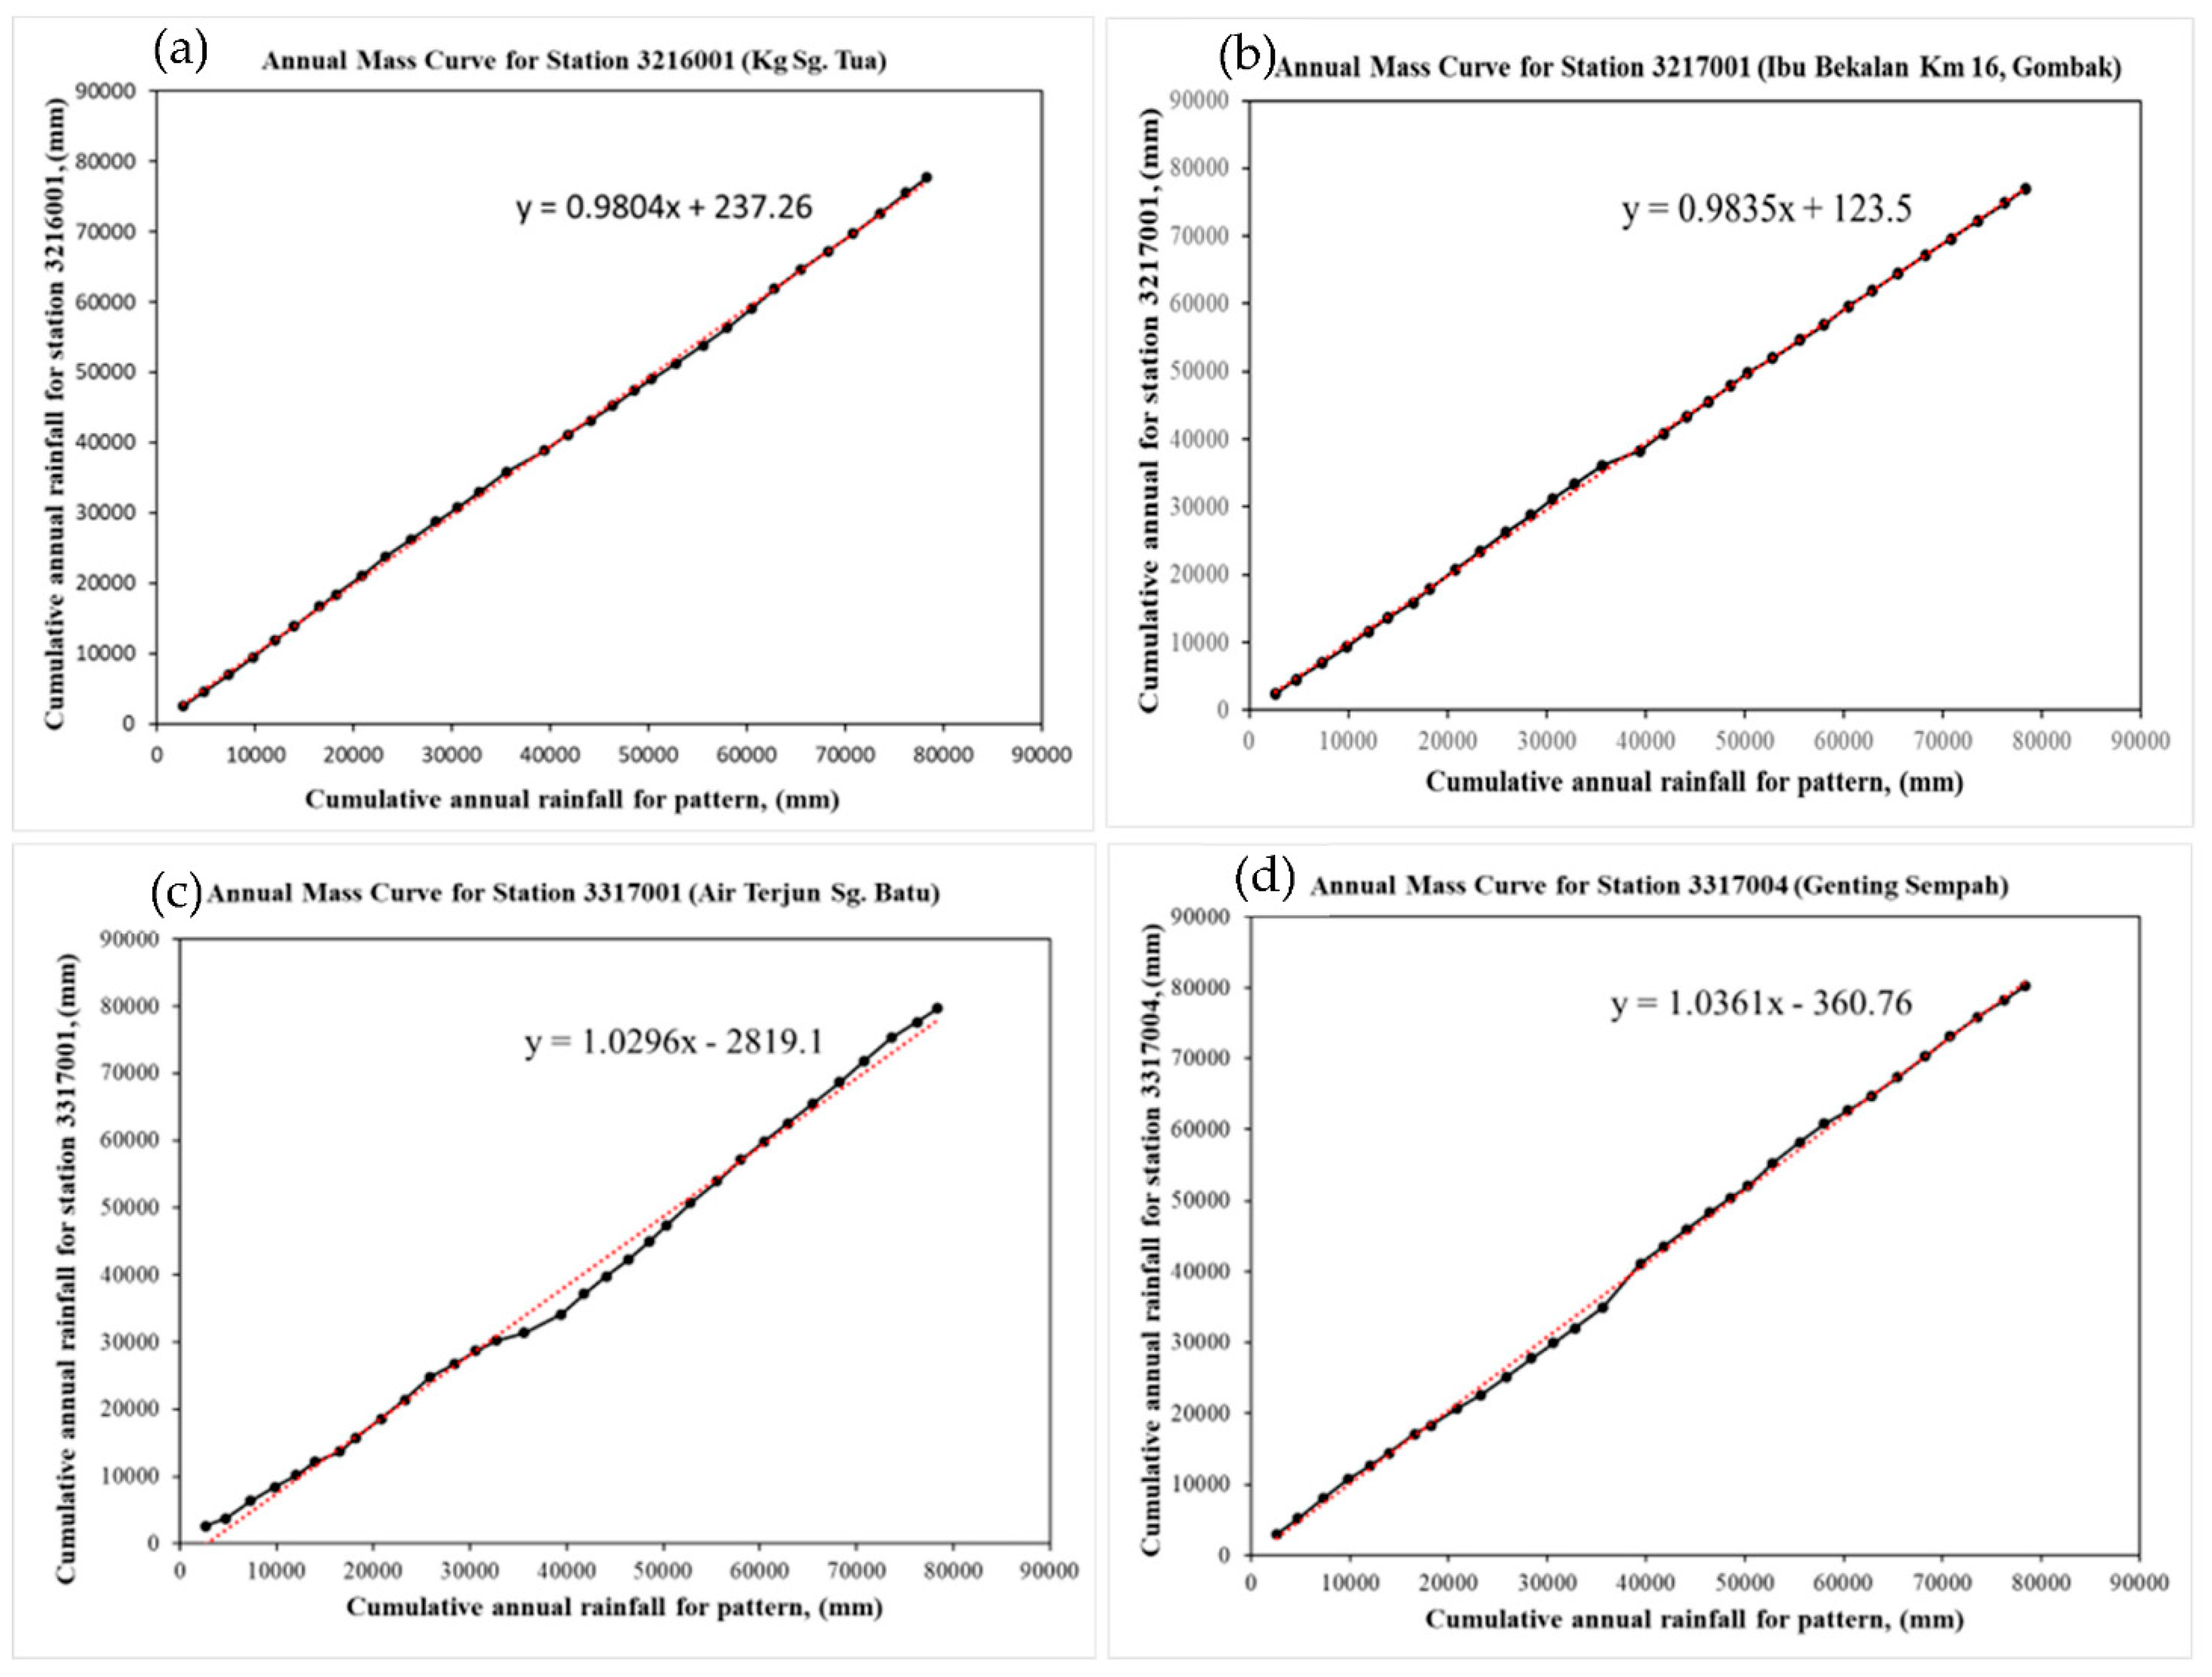
- Double Mass Curve (DMC)
- 3.
- Rainfall Temporal Pattern
- 4.
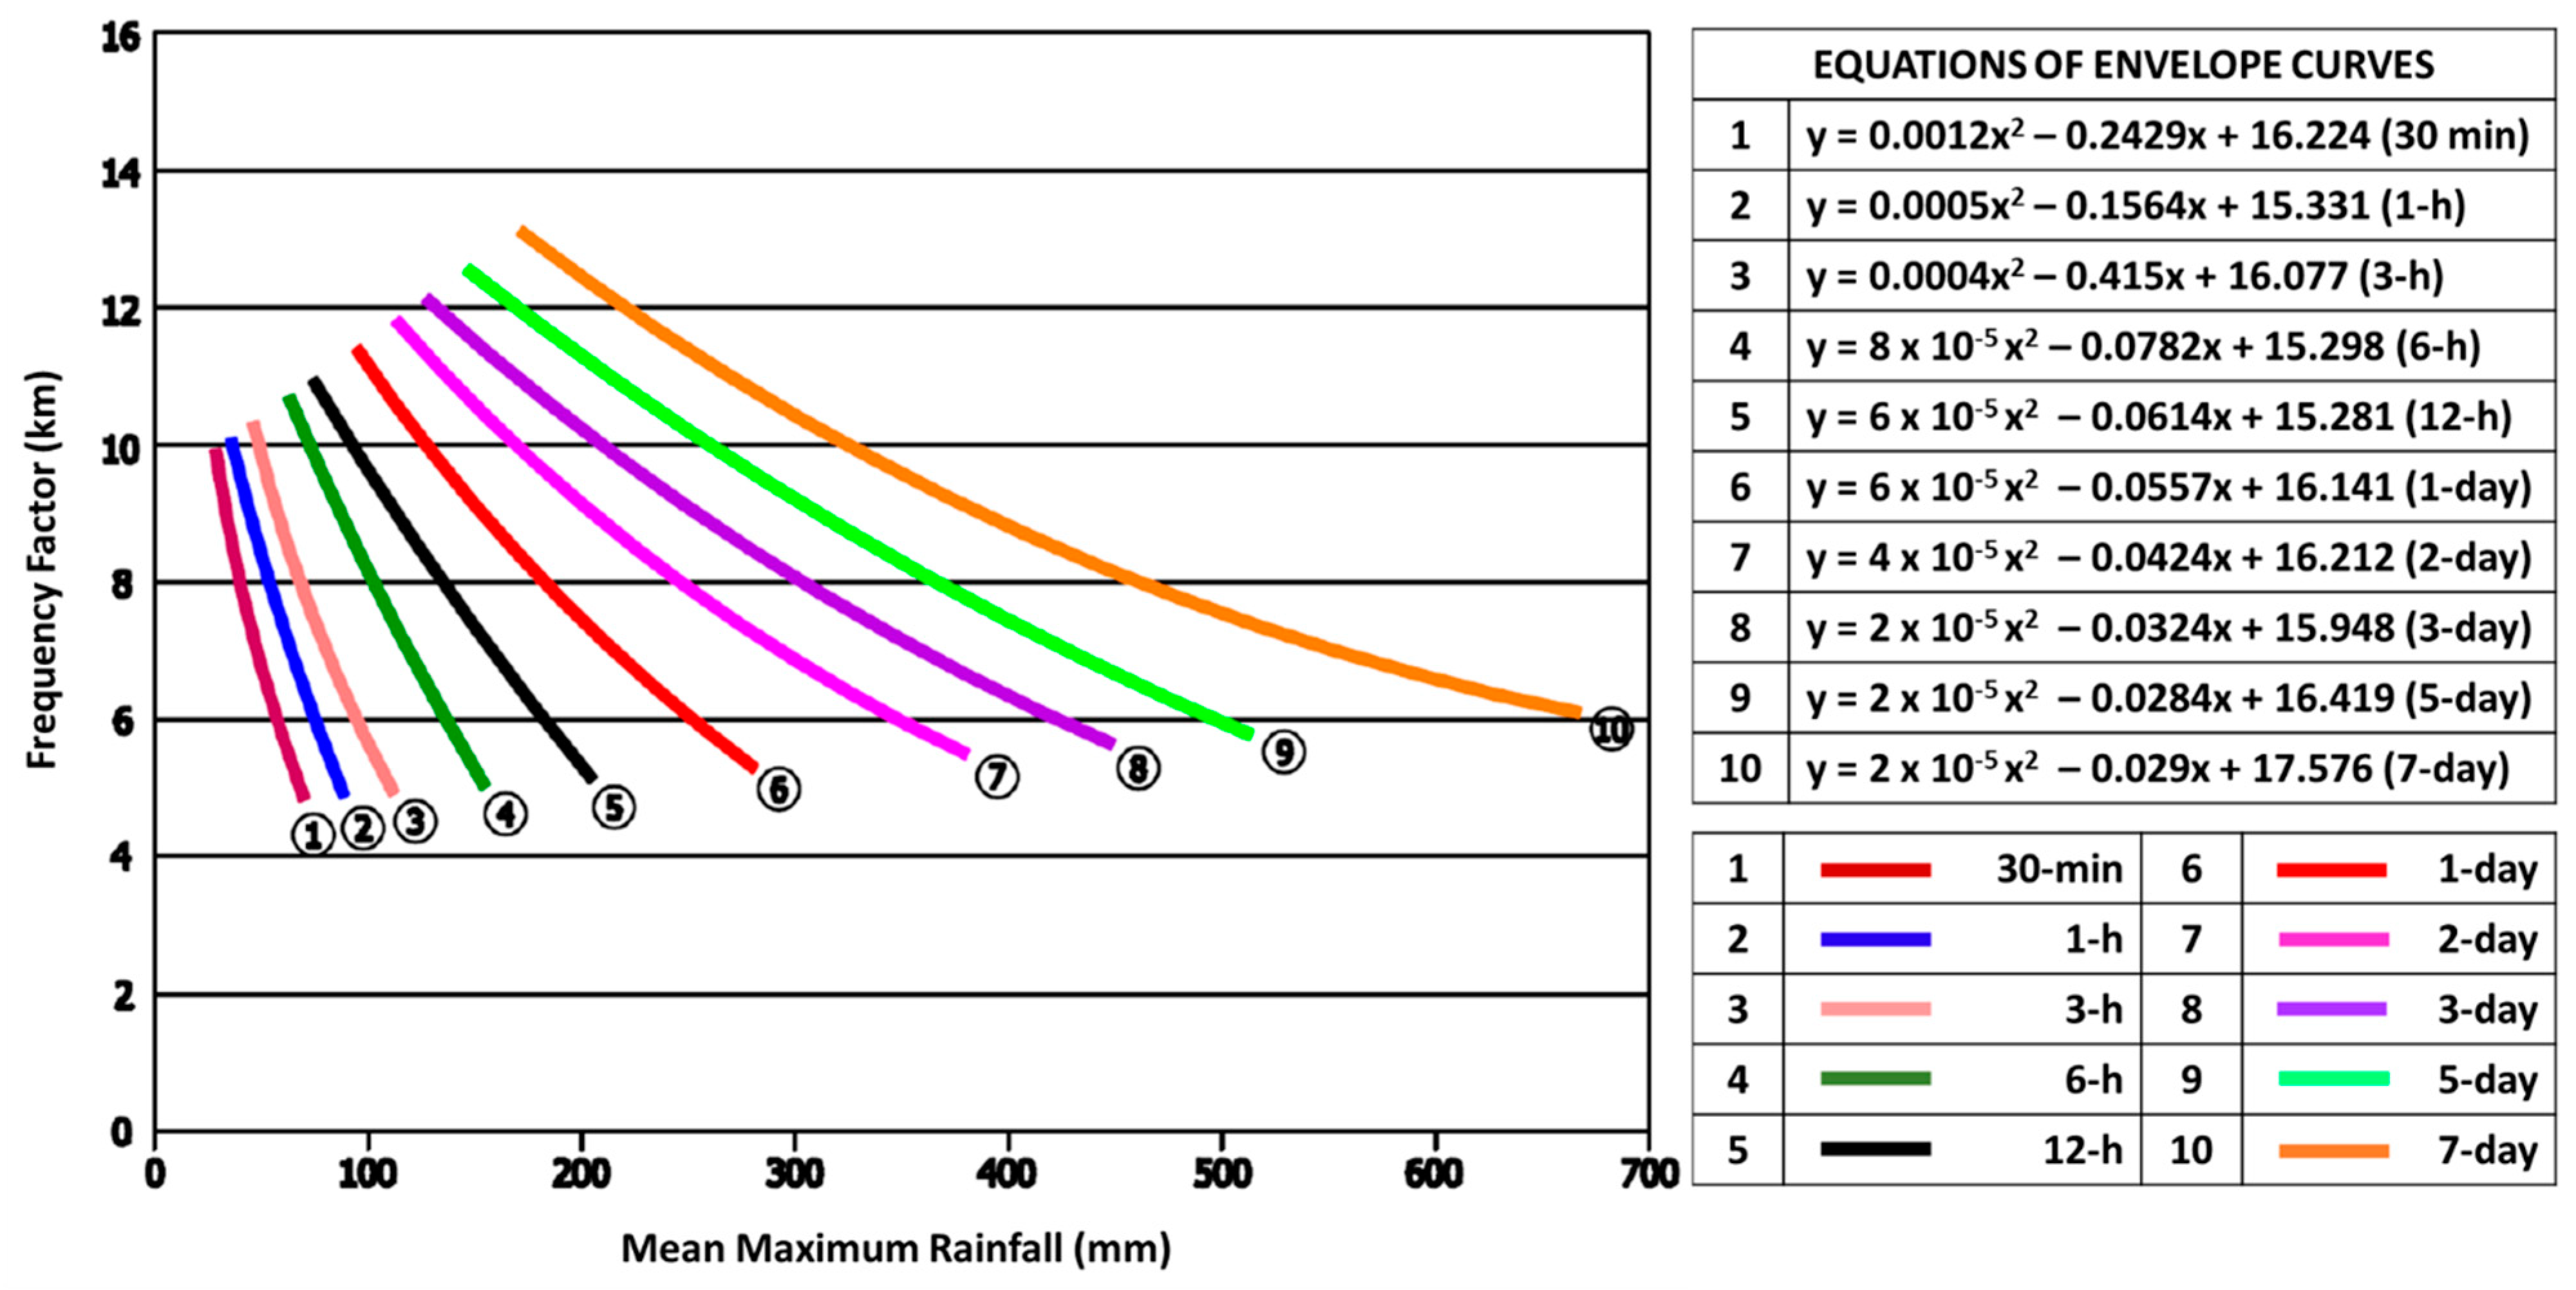
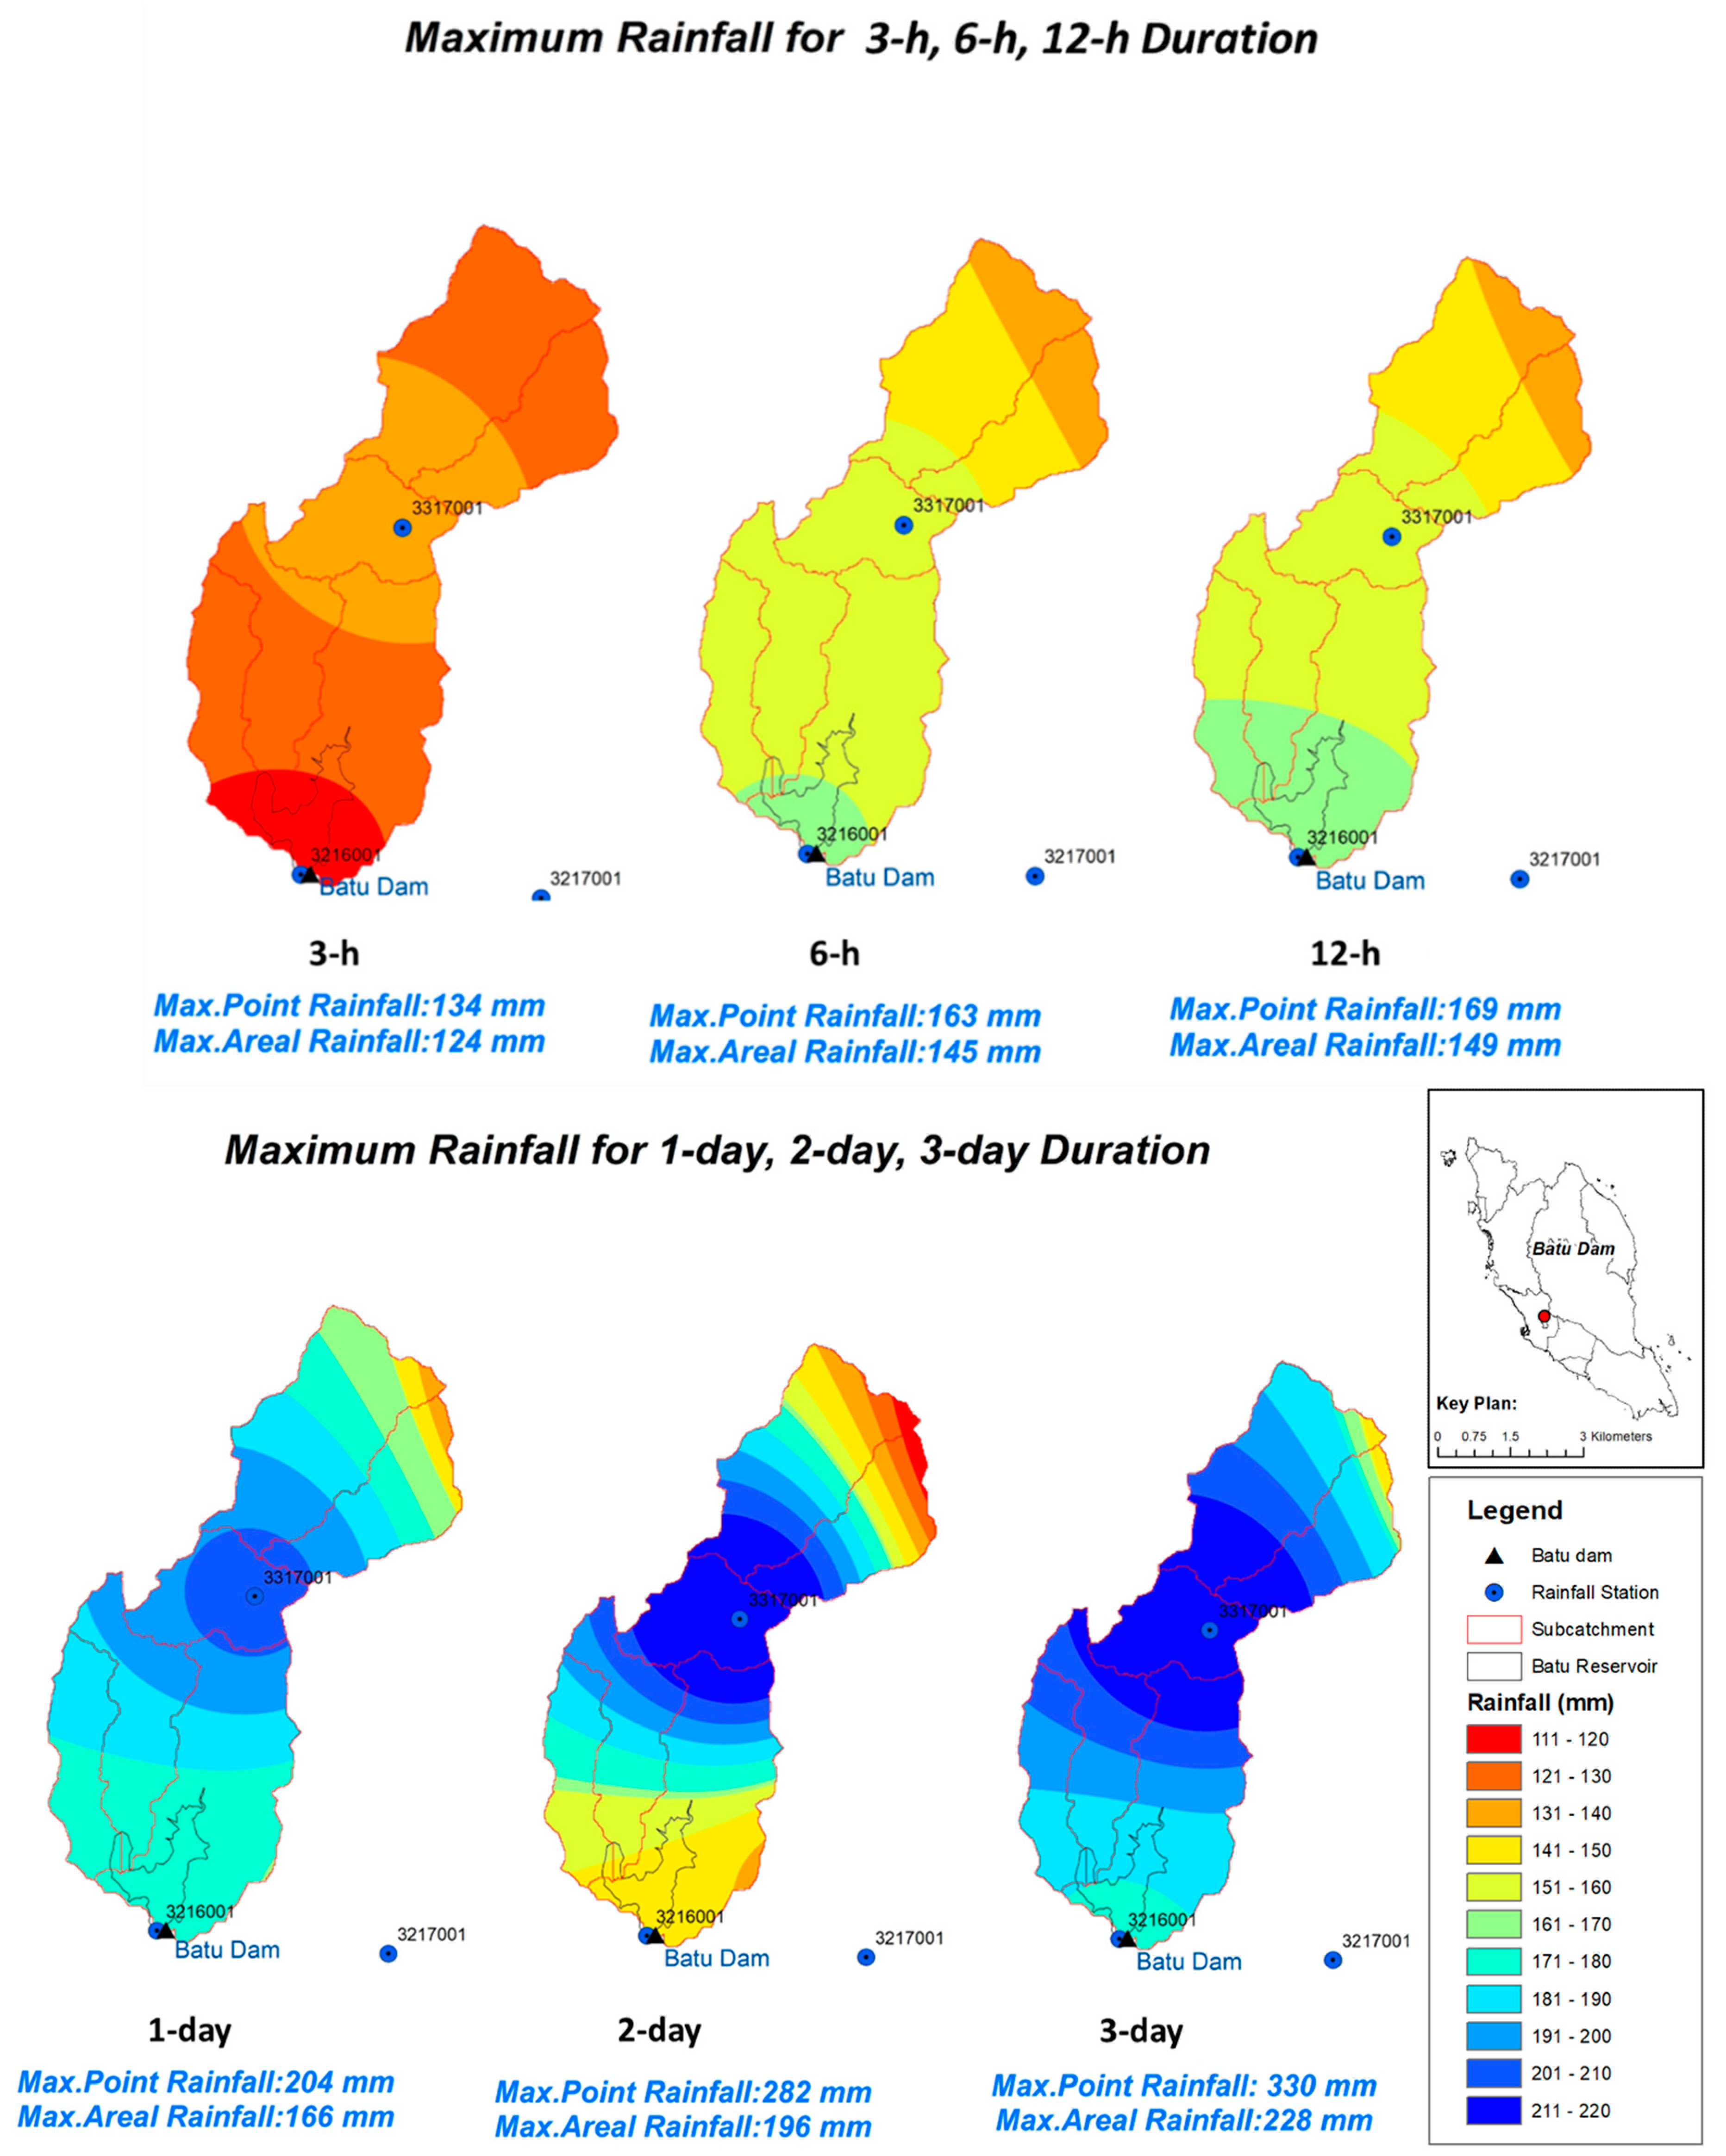
- Probable Maximum Precipitation (PMP)
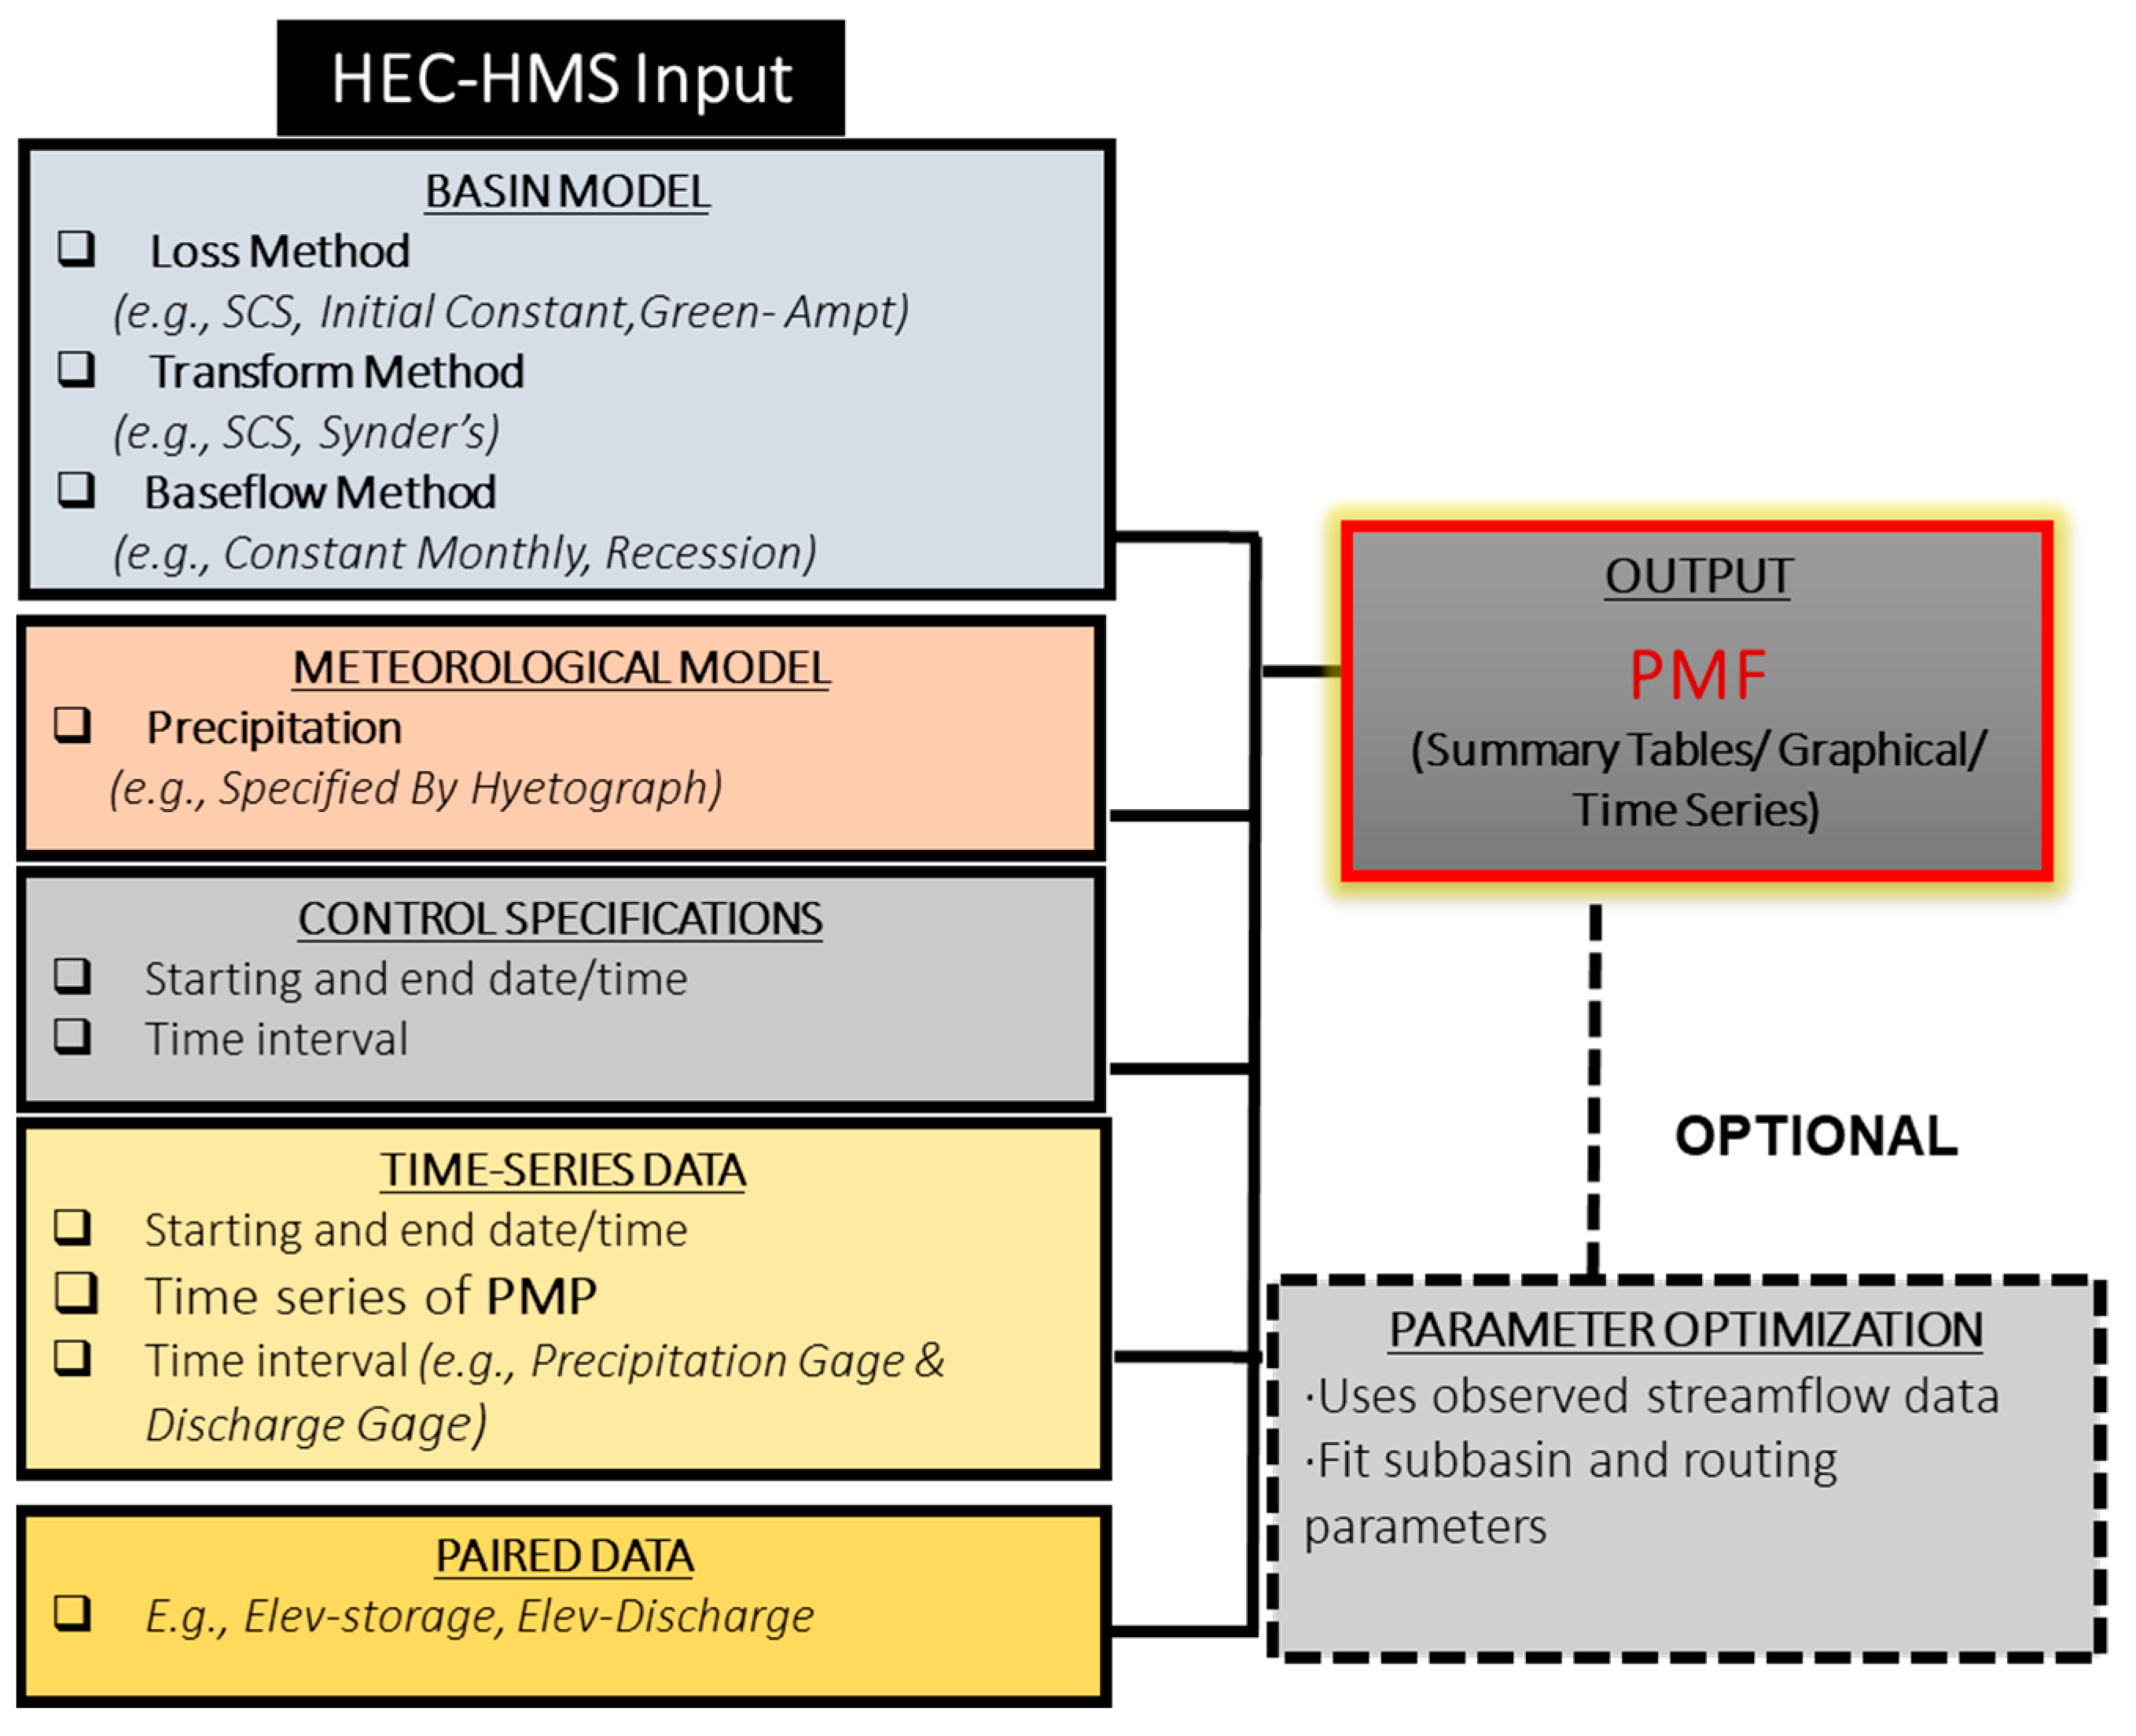
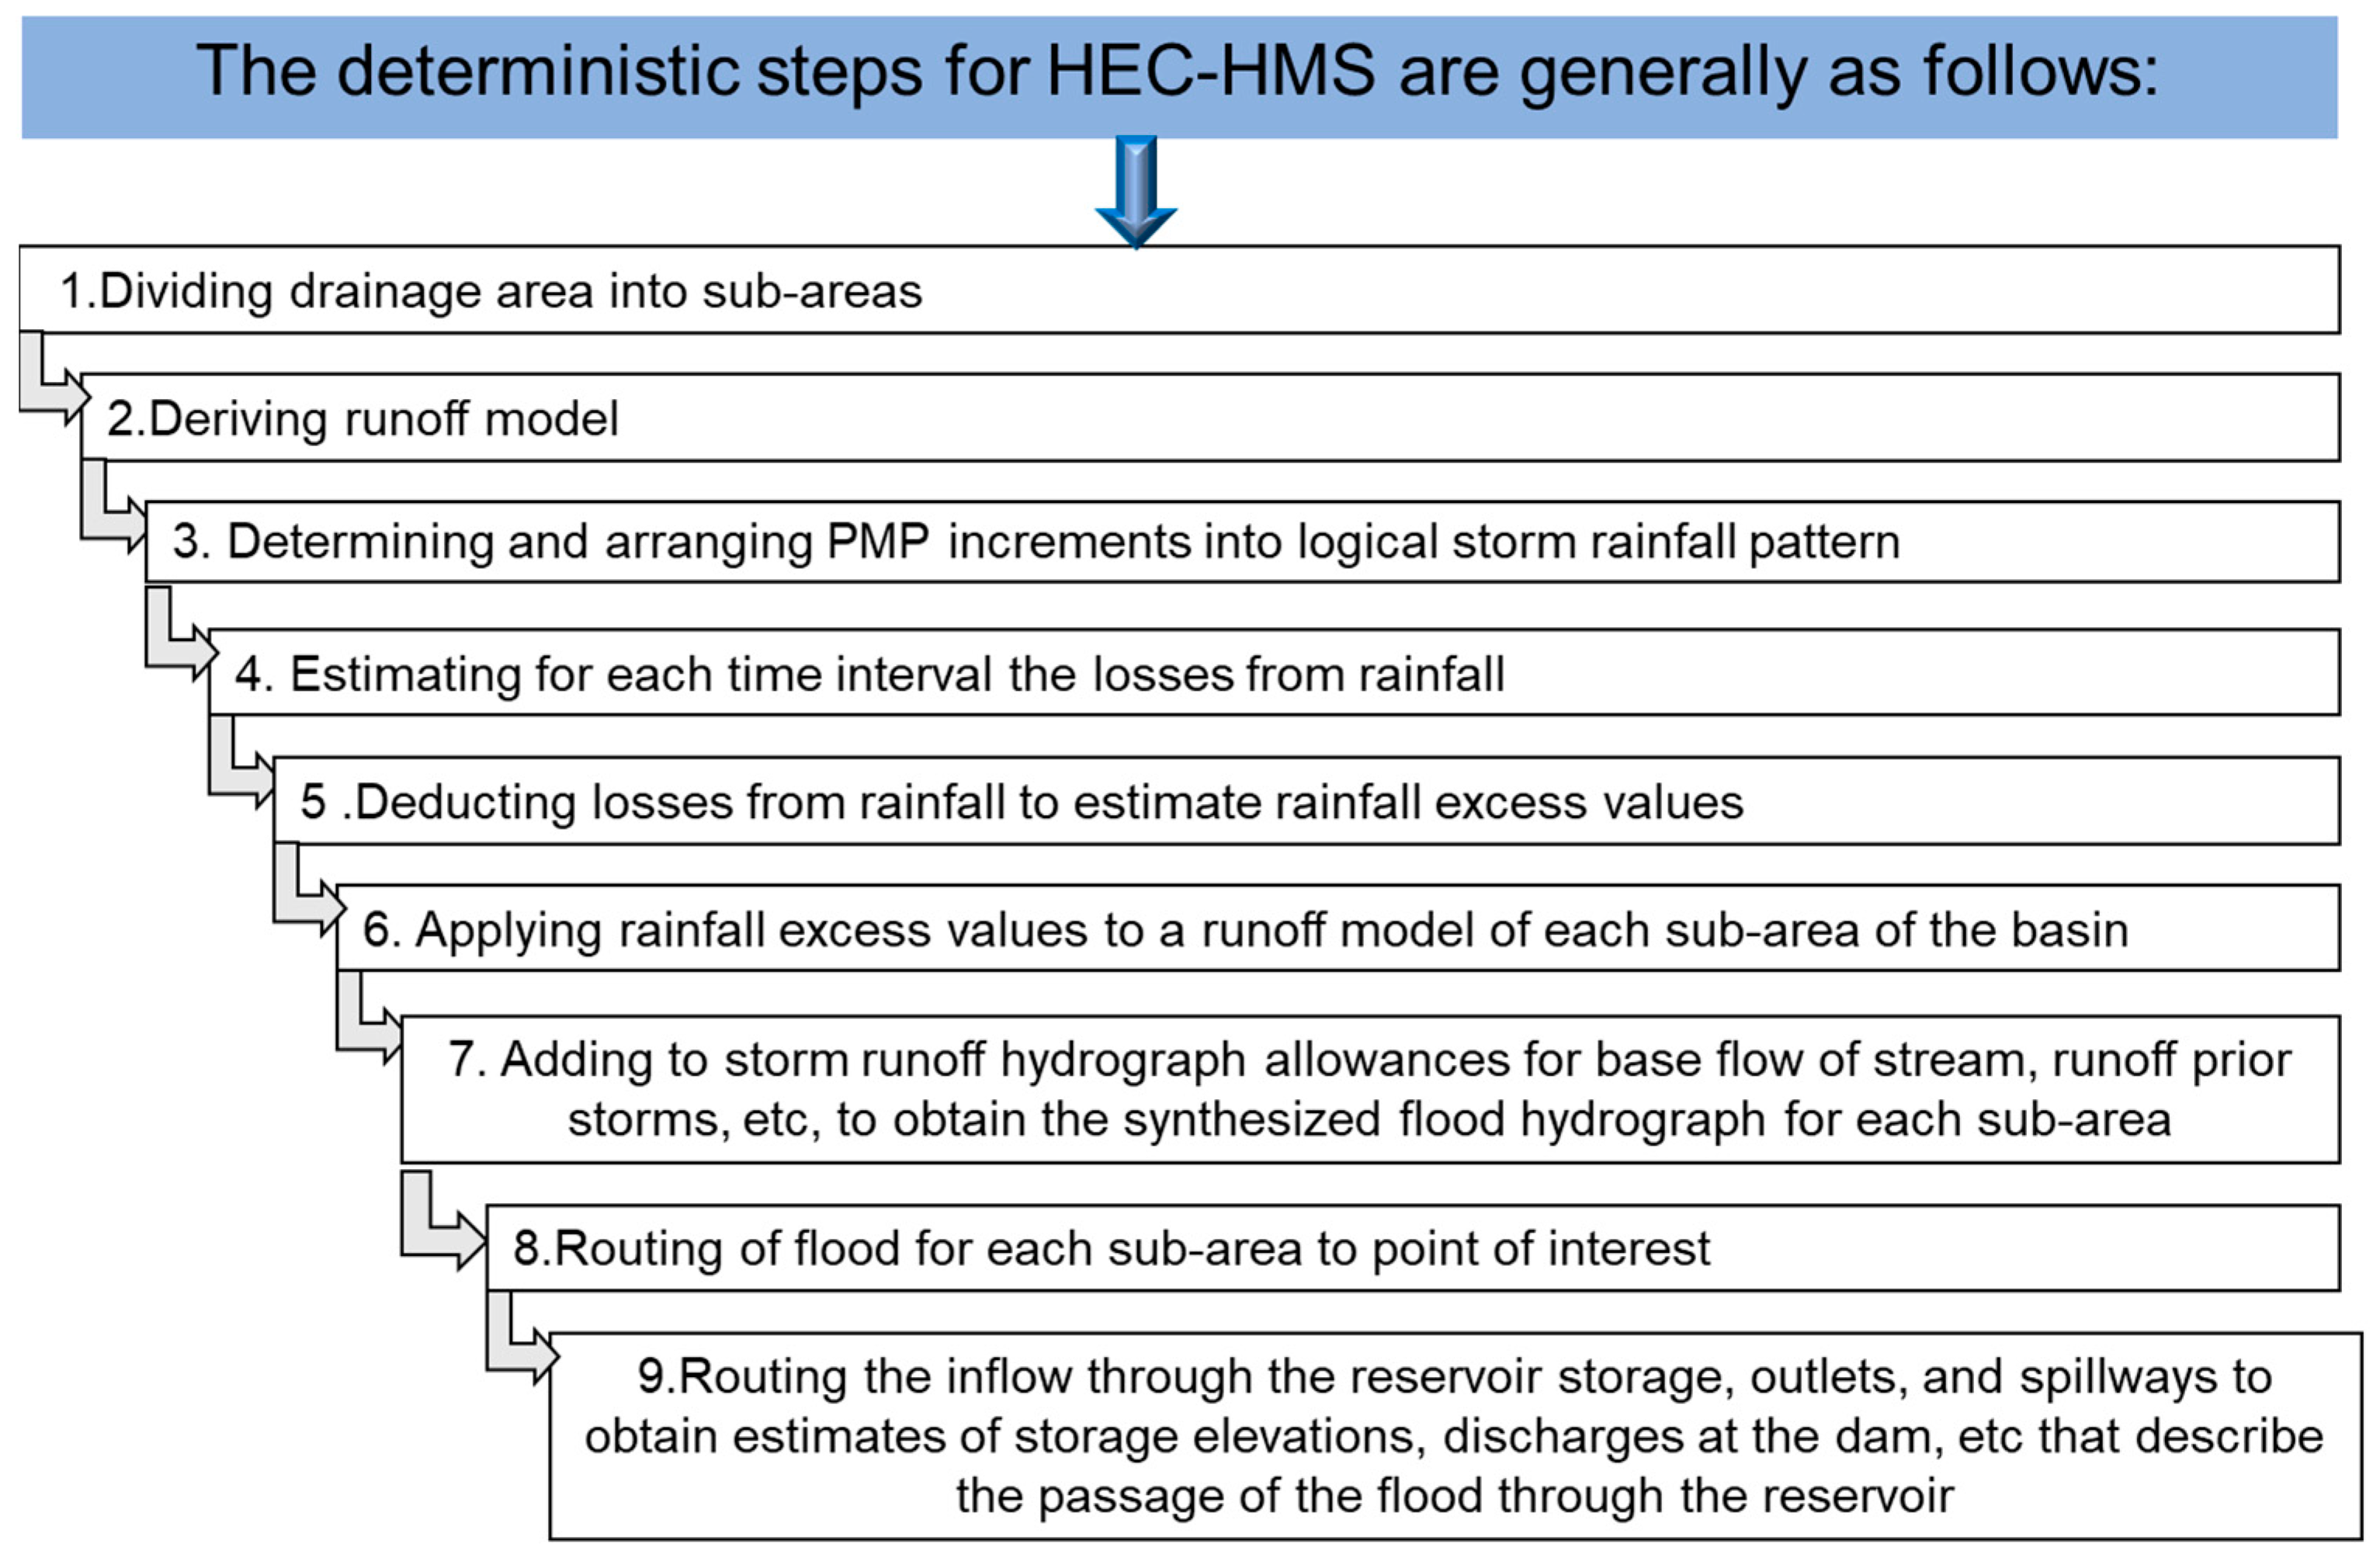
2.2.2. Hydrological Modeling
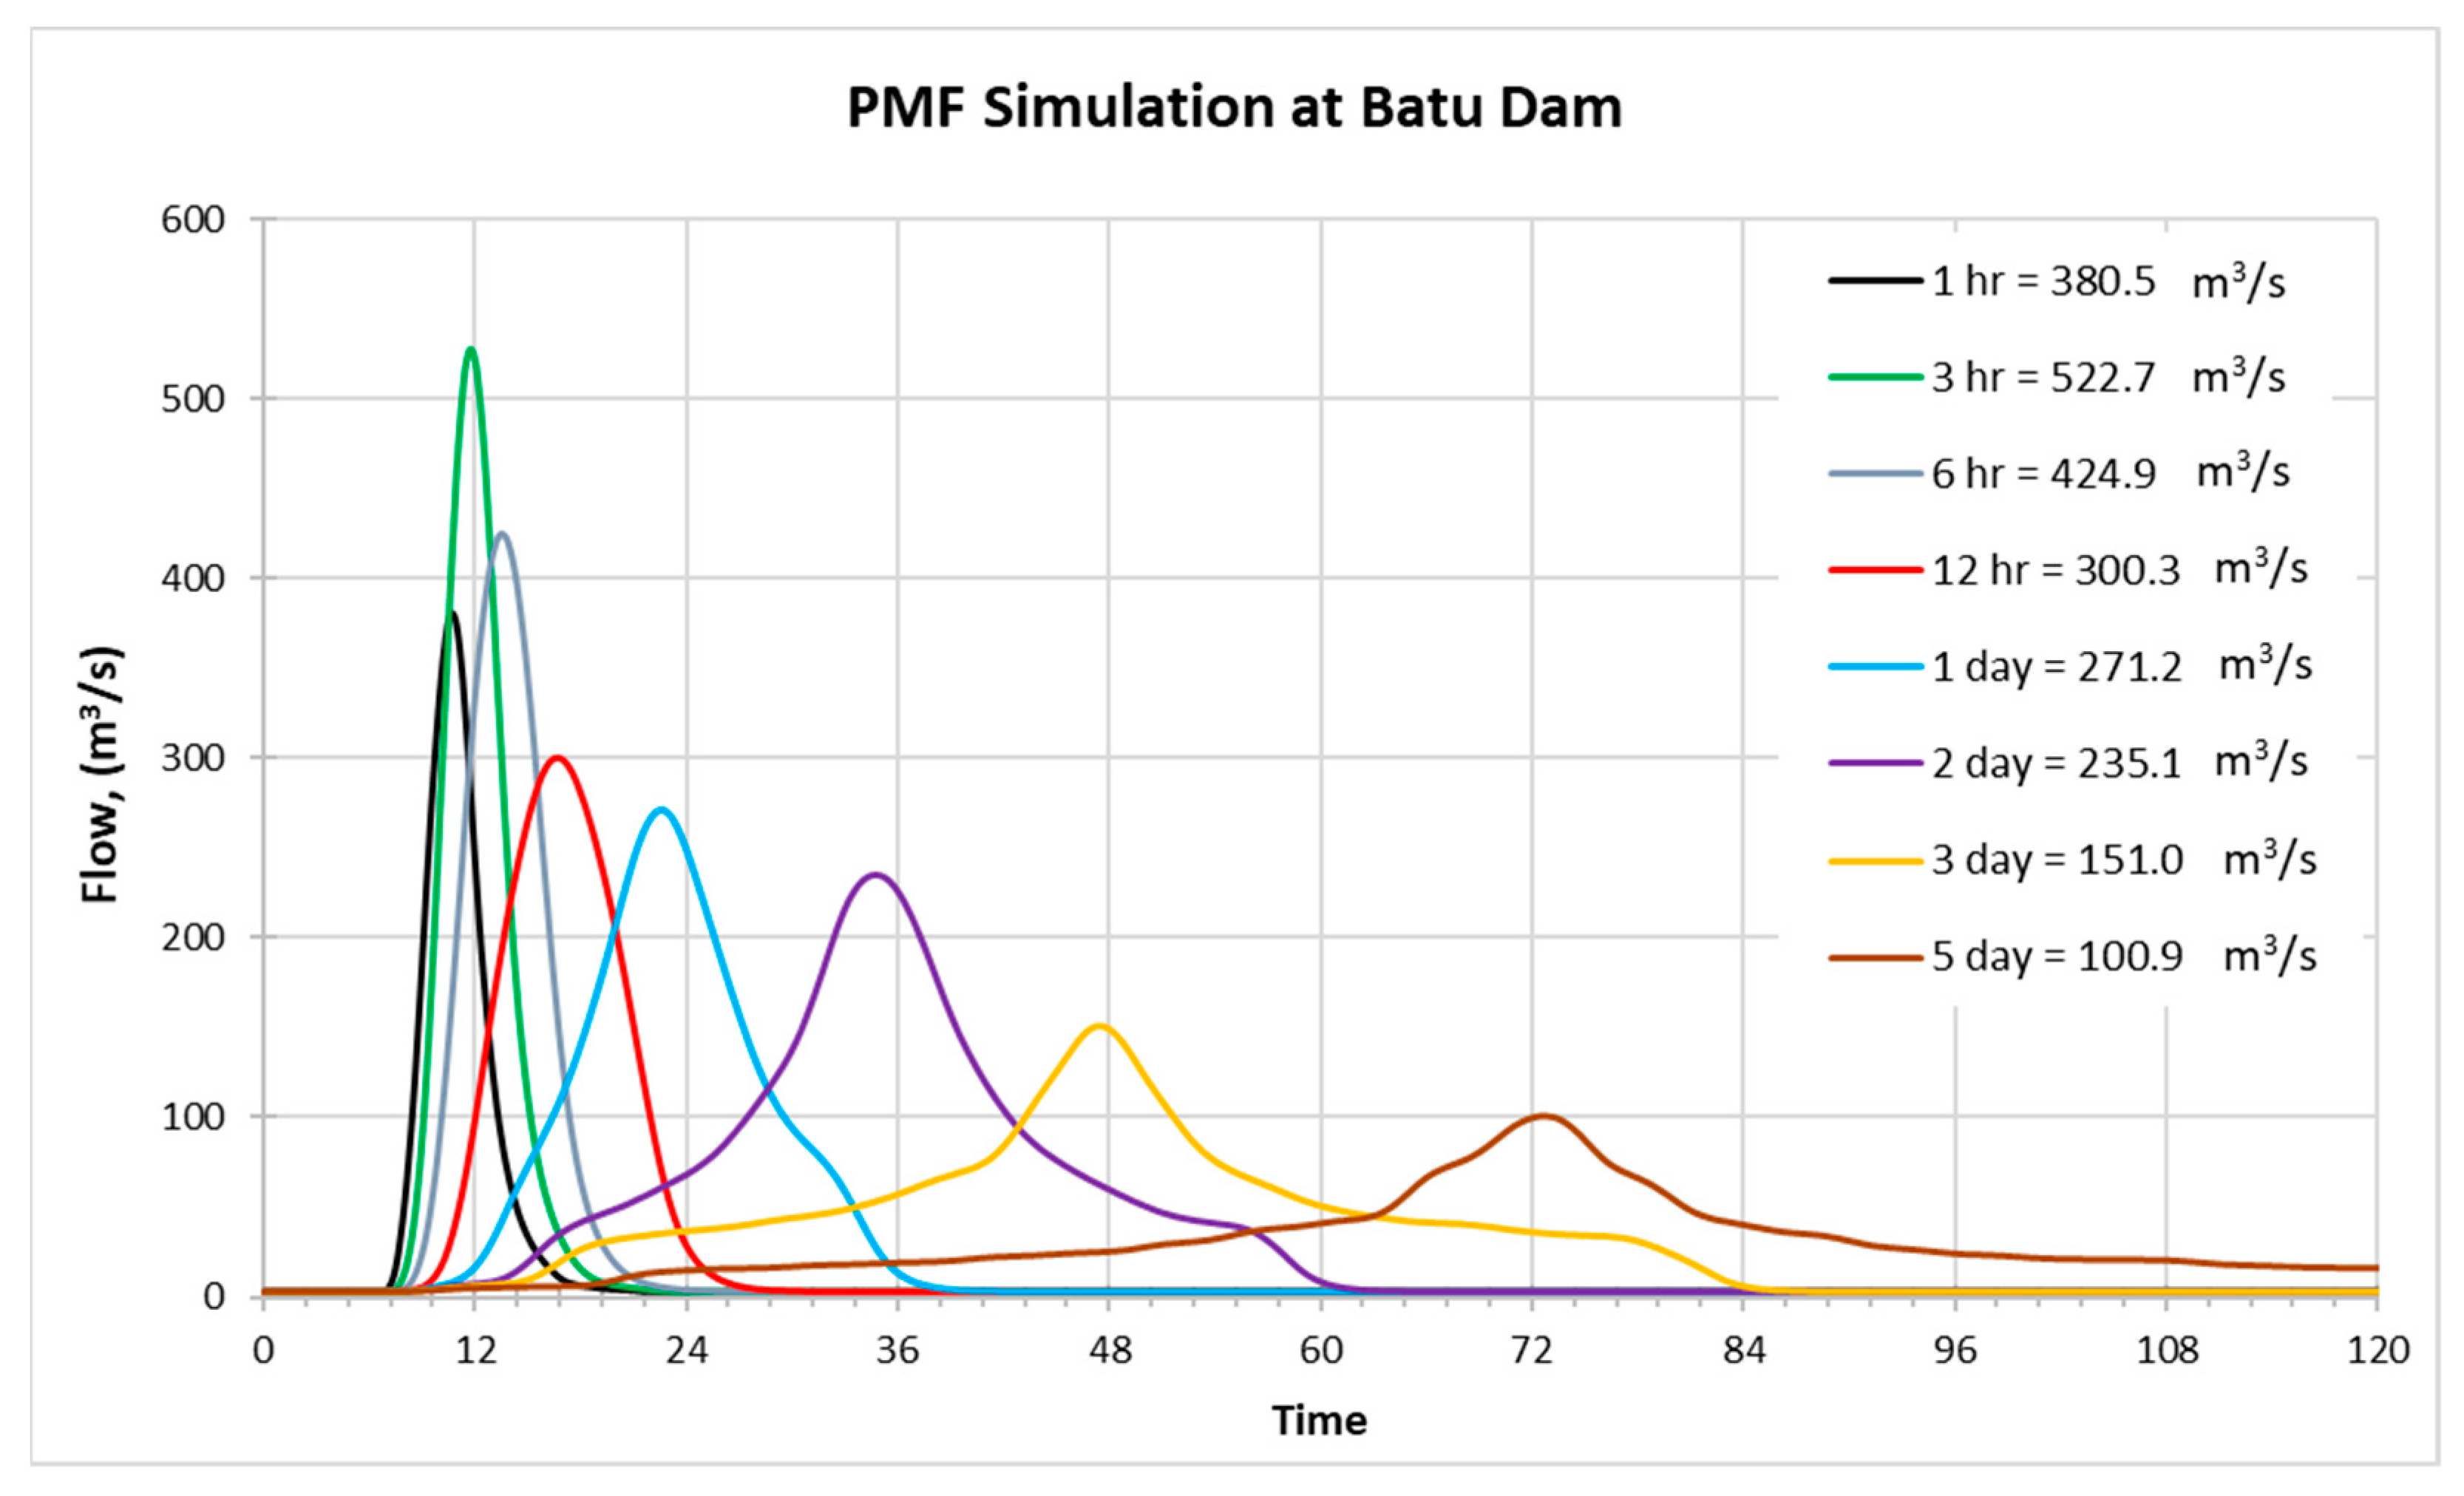
- Probable Maximum Flood (PMF)
- 2.
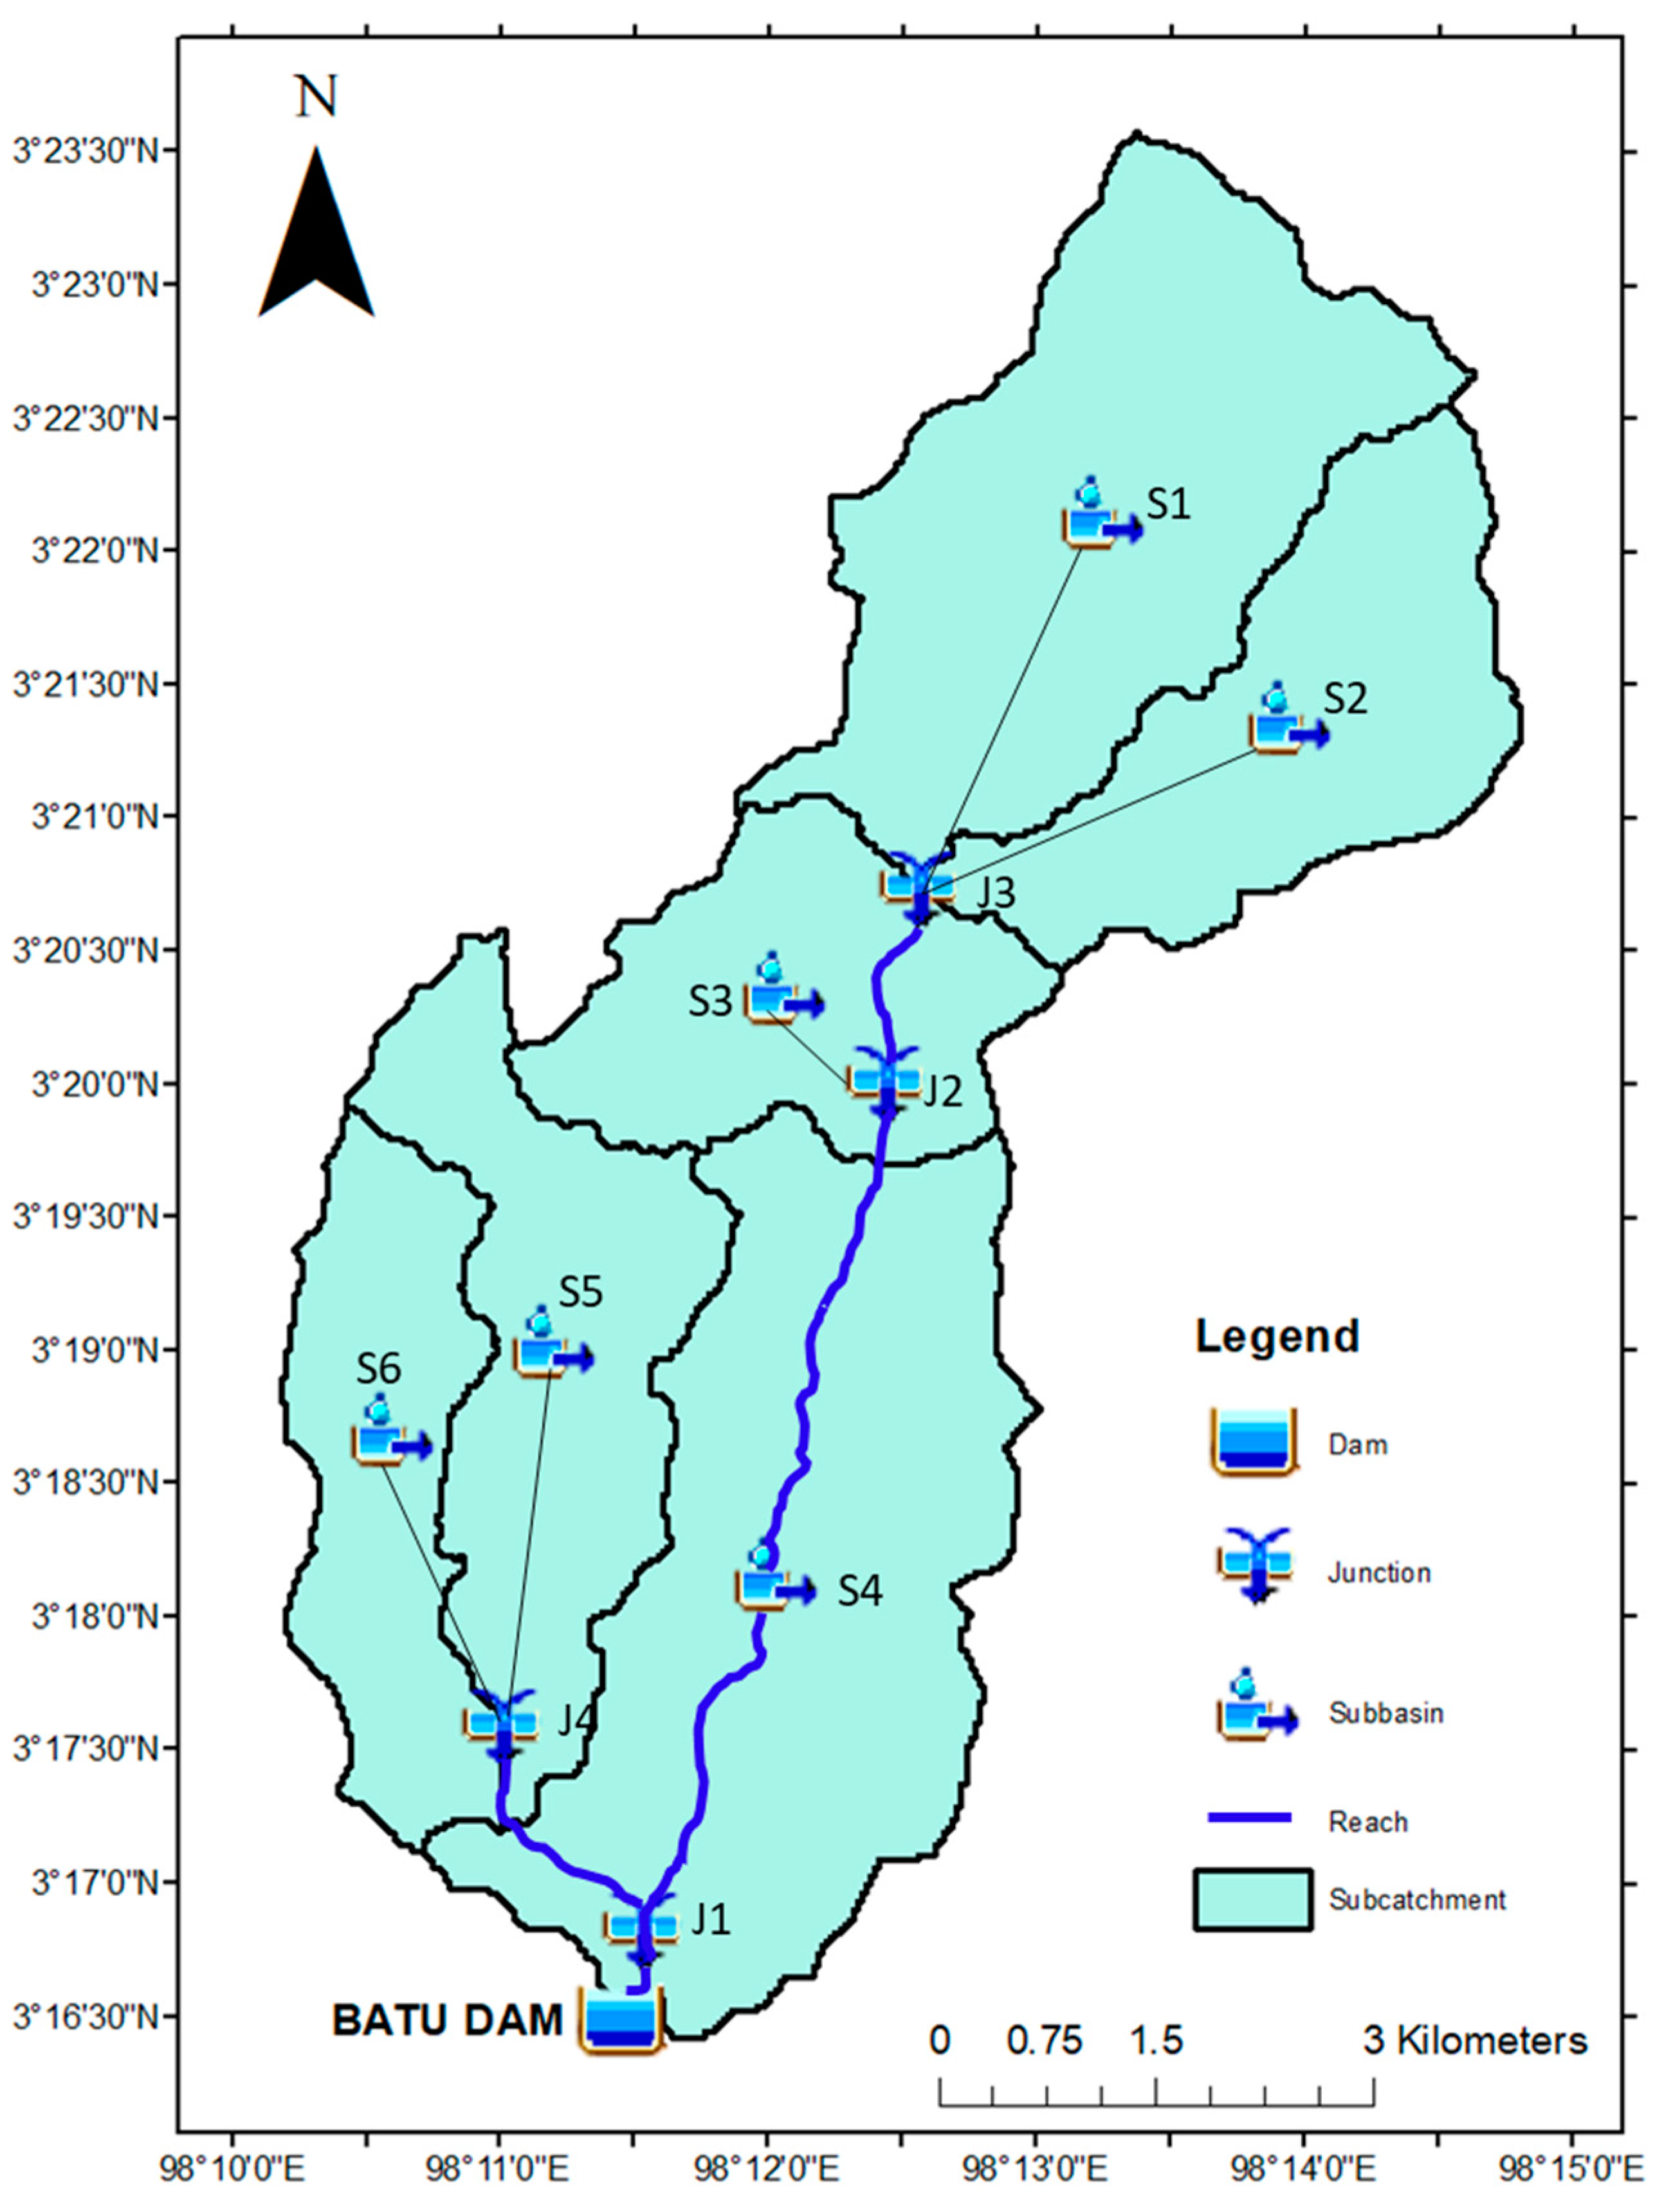
- Delineation of Subcatchment
3. Results and Discussion
3.1. Rainfall Time Series
3.2. Double Mass Curve
3.3. Isohyet Map
3.4. Probable Maximum Precipitation (PMP)
3.5. Probable Maximum Flood (PMF) and Dam Safety Check
4. Conclusions
Author Contributions
Funding
Institutional Review Board Statement
Informed Consent Statement
Data Availability Statement
Acknowledgments
Conflicts of Interest
References
- Gebregiorgis, A.S.; Hossain, F. Hydrological Risk Assessment of Old Dams: Case Study on Wilson Dam of Tennessee River Basin. J. Hydrol. Eng. 2012, 17, 201–212. [Google Scholar] [CrossRef] [Green Version]
- Gabriel-Martin, I.; Sordo-Ward, A.; Garrote, L.; Granados, I. Hydrological risk analysis of dams: The influence of initial reservoir level conditions. Water 2019, 11, 461. [Google Scholar] [CrossRef] [Green Version]
- Norouzi, N. Climate change impacts on the water flow to the reservoir of the Dez Dam basin. Water Cycle 2020, 1, 113–120. [Google Scholar] [CrossRef]
- Raudkivi, A.J. Hydrology: An Advanced Introduction to Hydrological Processess and Modelling; Elsevier: Amsterdam, The Netherlands, 2013. [Google Scholar]
- Goodarzi, E.; Shui, L.T.; Ziaei, M. Dam overtopping risk using probabilistic concepts-Case study: The Meijaran Dam, Iran. Ain Shams Eng. J. 2013, 4, 185–197. [Google Scholar] [CrossRef] [Green Version]
- Tingsanchali, T.; Tanmanee, S. Assessment of hydrological safety of Mae Sruai Dam, Thailand. Procedia Eng. 2012, 32, 1198–1204. [Google Scholar] [CrossRef] [Green Version]
- Singh, A.; Singh, V.P.; Ar, B. Computation of probable maximum precipitation and its uncertainty. Int. J. Hydrol. 2018, 2, 504–514. [Google Scholar] [CrossRef] [Green Version]
- Suribabu, C.R. An alternate method for finding Probable Maximum Precipitation (PMP) for Indian monsoon precipitation. ISH J. Hydraul. Eng. 2021, 27, 371–375. [Google Scholar] [CrossRef]
- Koutsoyiannis, D. A probabilistic view of Hershfield’s method for estimating probable maximum precipitation. Water Resour. Res. 1999, 35, 1313–1322. [Google Scholar] [CrossRef]
- Lave, L.B.; Balvanyos, T. Risk analysis and management of dam safety. Risk Anal. 1998, 18, 455–462. [Google Scholar] [CrossRef]
- Liu, Z.; Xu, X.; Cheng, J.; Wen, T.; Niu, J. Hydrological risk analysis of dam overtopping using bivariate statistical approach: A case study from Geheyan Reservoir, China. Stoch. Environ. Res. Risk Assess. 2018, 32, 2515–2525. [Google Scholar] [CrossRef]
- Hershfield, D.M. Estimating the Probable Maximum Precipitation. J. Hydraul. Div. 1961, 87, 99–106. [Google Scholar] [CrossRef]
- Hershfield, D.M. Method for Estimating Probable Maximum Precipitation. J. Am. Water Work. Assoc. 1965, 57, 965–972. [Google Scholar] [CrossRef]
- National Hydraulic Research Institute of Malaysia (NAHRIM). Derivation of Probable Maximum Precipitation for Design Floods in Malaysia, NAHRIM Technical Research Publication No. 1 (TRP 1); No. 1; NAHRIM: Seri Kembangan, Malaysia, 2008; Volume 1.
- Department of Irrigation and Drainage (DID). Batu Dam. 2017. Available online: https://www.water.gov.my/index.php/pages/view/1241 (accessed on 9 August 2021).
- Suratman, S. Geology and related activities in the construction of Batu Dam, Kuala Lumpur. Bull. Geol. Soc. Malays. 1994, 35, 15–23. [Google Scholar] [CrossRef] [Green Version]
- Ali Benzaghta, M. Prediction of evaporation in tropical climate using artificial neural network and climate based models. Sci. Res. Essays 2012, 7, 3133–3148. [Google Scholar] [CrossRef]
- Desa, M.N.M.; Noriah, A.; Rakhecha, P. Probable maximum precipitation for 24h duration over southeast Asian monsoon region—Selangor, Malaysia. Atmos. Res. 2001, 58, 41–54. [Google Scholar] [CrossRef]
- Naill, P.E.; Momani, M. Time Series Analysis Model for Rainfall Data in Jordan: Case Study for Using Time Series Analysis. Am. J. Environ. Sci. 2009, 5, 599–604. Available online: http://www.thescipub.com/abstract/?doi=ajessp.2009.599.604 (accessed on 7 September 2022).
- Searcy, J.K.; Hardison, C.H. Double Mass Curves—Manual of Hydrology: Part 1. General Surface-Water Techniques; Issue 1541, U.S. Government Printing Office: Washington, DC, USA, 1960.
- Gao, P.; Li, P.; Zhao, B.; Xu, R.; Zhao, G.; Sun, W.; Mu, X. Use of double mass curves in hydrologic benefit evaluations. Hydrol. Process. 2017, 31, 4639–4646. [Google Scholar] [CrossRef]
- Hong, J.L.; Jafri, A.; Ibrahim, I.; Shafie, S.; Hong, K.A.; Naubi, I. Design Rainfall Temporal Patterns for Upper Klang Catchment. J. Inst. Eng. Malays. 2018, 79, 21–30. [Google Scholar] [CrossRef]
- Department of Irrigation and Drainage (DID). Hydrological Procedure No. 1 (Revised and Updated 2015) Estimation of Design Rainstorm in Peninsular Malaysia; No. 1; DID: Kuala Lumpur, Malaysia, 2015; Volume 1.
- Hansen, E.M.; Schreiner, L.C.; Miller, J.F. Hydrometeorological Report 52 Application of Probable Maximum Precipitation Estimates—United States East of the 105th Meridian; U.S. Department of Commerce: Washington, DC, USA, 1982.
- WMO. Operational Hydrology Report No. 1: Manual for Estimation of Probable Maximum Precipitation; WMO: Geneva, Switzerland, 1986. [Google Scholar]
- Te Chow, V. A General Formula for Hydrologic Frequency Analysis. Trans. Am. Geophys. Union 1951, 32, 231–237. [Google Scholar] [CrossRef]
- Durbude, D.G. Estimation of Probable Maximum Precipitation for Planning of Soil and Water Conservation Structures. J. Water Conserv. 2008, 7, 31–35. [Google Scholar]
- Deshpande, N.R.; Kulkarni, B.D.; Verma, A.K.; Mandal, B.N. Extreme rainfall analysis and estimation of probable maximum precipitation (PMP) by statistical methods over the Indus river basin in India. J. Spat. Hydrol. 2008, 8, 22–35. [Google Scholar]
- Lariyah, M.S.; Faizah, C.R.; Mohd Noh, A.; Rahsidi, S.M.; Azwin Zailti, A.R.; Mohd Nor, M.D.; Hidayah, B.; Intan Shafilah, A.A. Development of Probable Maximum Flood (PMF) for Sultan Abu Bakar Dam. In Proceedings of the EnCon 2012, 5th Engineering Conference, “Engineering Towards Change—Empowering Green Solutions”, Kuching Sarawak, Malaysia, 10–12 July 2012. [Google Scholar]
- Fleming, M.J. Hydrologic Modeling System Quick Start Guide; US Army Corps of Engineers; Hydrologic Engineering Center: Davis, CA, USA, 2013; p. 52.
- Boota, M.W.; Nabi, G.; Abbas, T.; Yaseen, M.; Faisal, M.; Azam, M.I. Estimation of Probable Maximum Flood (PMF): A Case Study of Pothwar Region, Pakistan. Int. J. Sci. Res. Eng. Dev. 2015, 2, 6471–6475. Available online: http://www.sci-int.com/pdf/636339897657542910.pdf (accessed on 7 September 2022).
- Department of Irrigation and Drainage (DID). Hydrological Procedure No. 27: Estimation of Design Flood Hydrograph Using Clark Method for Rural Catchments in Peninsular Malaysia; No. 27; DID: Kuala Lumpur, Malaysia, 2010.
- Department of Irrigation and Drainage (DID). Hydrological Procedure No. 11: Design Flood Hydrograph Estimation for Rural Cachments in Malaysia; DID: Kuala Lumpur, Malaysia, 2018.
- Nur, H.S.; Mohd, K.; Mohd, E.T.; Hafizan, J.; Ata, F.M.; Azman, A.; Noor Jima, A.W.; Umar, R.; Khalit, S.I.; Makhtar, M. Relationship of rainfall distribution and water level on major flood 2014 in Pahang River Basin, Malaysia. Environ. Asia 2017, 10, 1–8. [Google Scholar]
- Yiau, S.S.; Putuhena, F.J. Probable Maximum Precipitation (PMP) Analysis for Bakun Dam Area. J. Civ. Eng. Sci. Technol. 2011, 2, 53–59. [Google Scholar]
- Razali, J.; Sidek, L.M.; Rashid, M.A.; Hussein, A.; Marufuzzaman, M. Probable Maximum Precipitation comparison using hershfield’s statistical method and hydro-meteorological method for Sungai Perak Hydroelectric Scheme. Int. J. Eng. Technol. 2018, 7, 603–608. [Google Scholar] [CrossRef]
- Sammen, S.; Mohamed, T.; Ghazali, A.A.; Sideq, L.; Aziz, A.A. Estimation of probable maximum precipitation for tropical catchment. MATEC Web Conf. 2018, 162, 1–5. [Google Scholar] [CrossRef]


| BATU DAM | |
|---|---|
| Function | Water supply for both municipal and industrial, sediment control, and flood control |
| Direct Catchment Area | 50 km2 |
| Surface Area at Maximum FSL | 2.5 km2 |
| Normal Pool Level | El. 102.7 m |
| Full Supply Level | EL 107.3 m |
| RESERVOIR | |
| Storage Capacity | 36.6 Mm3 |
| Peak inflow design flood (IDF) | 492.7 m3/s |
| Design Discharge Capacities | 251.6/s (spillway and outlet) 234.2 m3/s (spillway only) |
| DAM | |
| Type | Earthfill |
| Height | 44 m |
| Length | 550 m |
| Crest Elevation (m) | El. 109.0 m |
| SPILLWAY | |
| Crest Elevation | El. 104.85 m |
| Invert Elevation | El. 97.83 m at upstream |
| Crest Length | 23 m |
| Total length | 226.53 m to the stilling basin |
| Sub-Basin | Loss Method | Transform Method | Baseflow Method | |||
|---|---|---|---|---|---|---|
| Initial and Constant | Clark (UH) | Constant Monthly | ||||
| Initial Loss (mm) | Constant Rate (mm/h) | Imperviousness (%) | SCS Tc Eq. (h) | R (h) HP27 | HP 27 (m3/s) | |
| S1 | 30 | 2.5 | 10 | 3.11 | 1.218 | 0.905 |
| S2 | 30 | 2.5 | 10 | 2.66 | 1.116 | 0.584 |
| S3 | 30 | 2.5 | 10 | 2.18 | 0.839 | 0.496 |
| S4 | 30 | 2.5 | 10 | 6.03 | 2.262 | 1.073 |
| S5 | 30 | 2.5 | 10 | 4.68 | 1.957 | 0.597 |
| S6 | 30 | 2.5 | 10 | 3.00 | 1.279 | 0.449 |
| Method | PMP in mm for Various Durations | |||||||
|---|---|---|---|---|---|---|---|---|
| 1-h | 3-h | 6-h | 12-h | 1-Day | 2-Day | 3-Day | 5-Day | |
| Statistical–Hershfield’s Method (Derived Km) | 104.38 | 182.62 | 197.26 | 187.02 | 215.68 | 305.63 | 329.90 | 437.27 |
| Statistical–NAHRIM Method (Km Envelope Curve) | 179.31 | 261.91 | 280.43 | 309.01 | 398.42 | 549.59 | 557.78 | 613.27 |
| Dam | Designed Inflow (m3/s) | PMF (m3/s) | Designed Discharge Capacities (m3/s) | Revised Spillway Capacities (m3/s) | Reservoir Level for Designed Inflow (m) | Simulated Reservoir Level (m) |
|---|---|---|---|---|---|---|
| Batu | 492.7 | 522.7 | 234.2 | 200.6 | 108.0 | 107.4 |
Publisher’s Note: MDPI stays neutral with regard to jurisdictional claims in published maps and institutional affiliations. |
© 2022 by the authors. Licensee MDPI, Basel, Switzerland. This article is an open access article distributed under the terms and conditions of the Creative Commons Attribution (CC BY) license (https://creativecommons.org/licenses/by/4.0/).
Share and Cite
Allias Omar, S.M.; Wan Ariffin, W.N.H.; Mohd Sidek, L.; Basri, H.; Moh Khambali, M.H.; Ahmed, A.N. Hydrological Analysis of Batu Dam, Malaysia in the Urban Area: Flood and Failure Analysis Preparing for Climate Change. Int. J. Environ. Res. Public Health 2022, 19, 16530. https://doi.org/10.3390/ijerph192416530
Allias Omar SM, Wan Ariffin WNH, Mohd Sidek L, Basri H, Moh Khambali MH, Ahmed AN. Hydrological Analysis of Batu Dam, Malaysia in the Urban Area: Flood and Failure Analysis Preparing for Climate Change. International Journal of Environmental Research and Public Health. 2022; 19(24):16530. https://doi.org/10.3390/ijerph192416530
Chicago/Turabian StyleAllias Omar, Siti Mariam, Wan Noorul Hafilah Wan Ariffin, Lariyah Mohd Sidek, Hidayah Basri, Mohd Hazri Moh Khambali, and Ali Najah Ahmed. 2022. "Hydrological Analysis of Batu Dam, Malaysia in the Urban Area: Flood and Failure Analysis Preparing for Climate Change" International Journal of Environmental Research and Public Health 19, no. 24: 16530. https://doi.org/10.3390/ijerph192416530