
Motor Vehicle Crash and Hospital Charges in Front- and Rear-Seated Restrained and Unrestrained Adult Motor Vehicle Occupants
 ,
,
Abstract
:1. Introduction
2. Materials and Methods
2.1. Data Source(s)
2.2. Study Population
2.3. Exposure Variables
2.4. Outcome Variables
2.5. Covariate Variable Definitions
2.5.1. Occupant Characteristics
2.5.2. Vehicle Characteristics
2.5.3. Crash Characteristics
2.6. Hospitalization Length of Stay, Discharge and Insurance Payment Characteristics
2.7. Statistical Analyses
3. Results
3.1. Population Characteristics
3.2. Vehicle Characteristics
3.3. Crash Characteristics
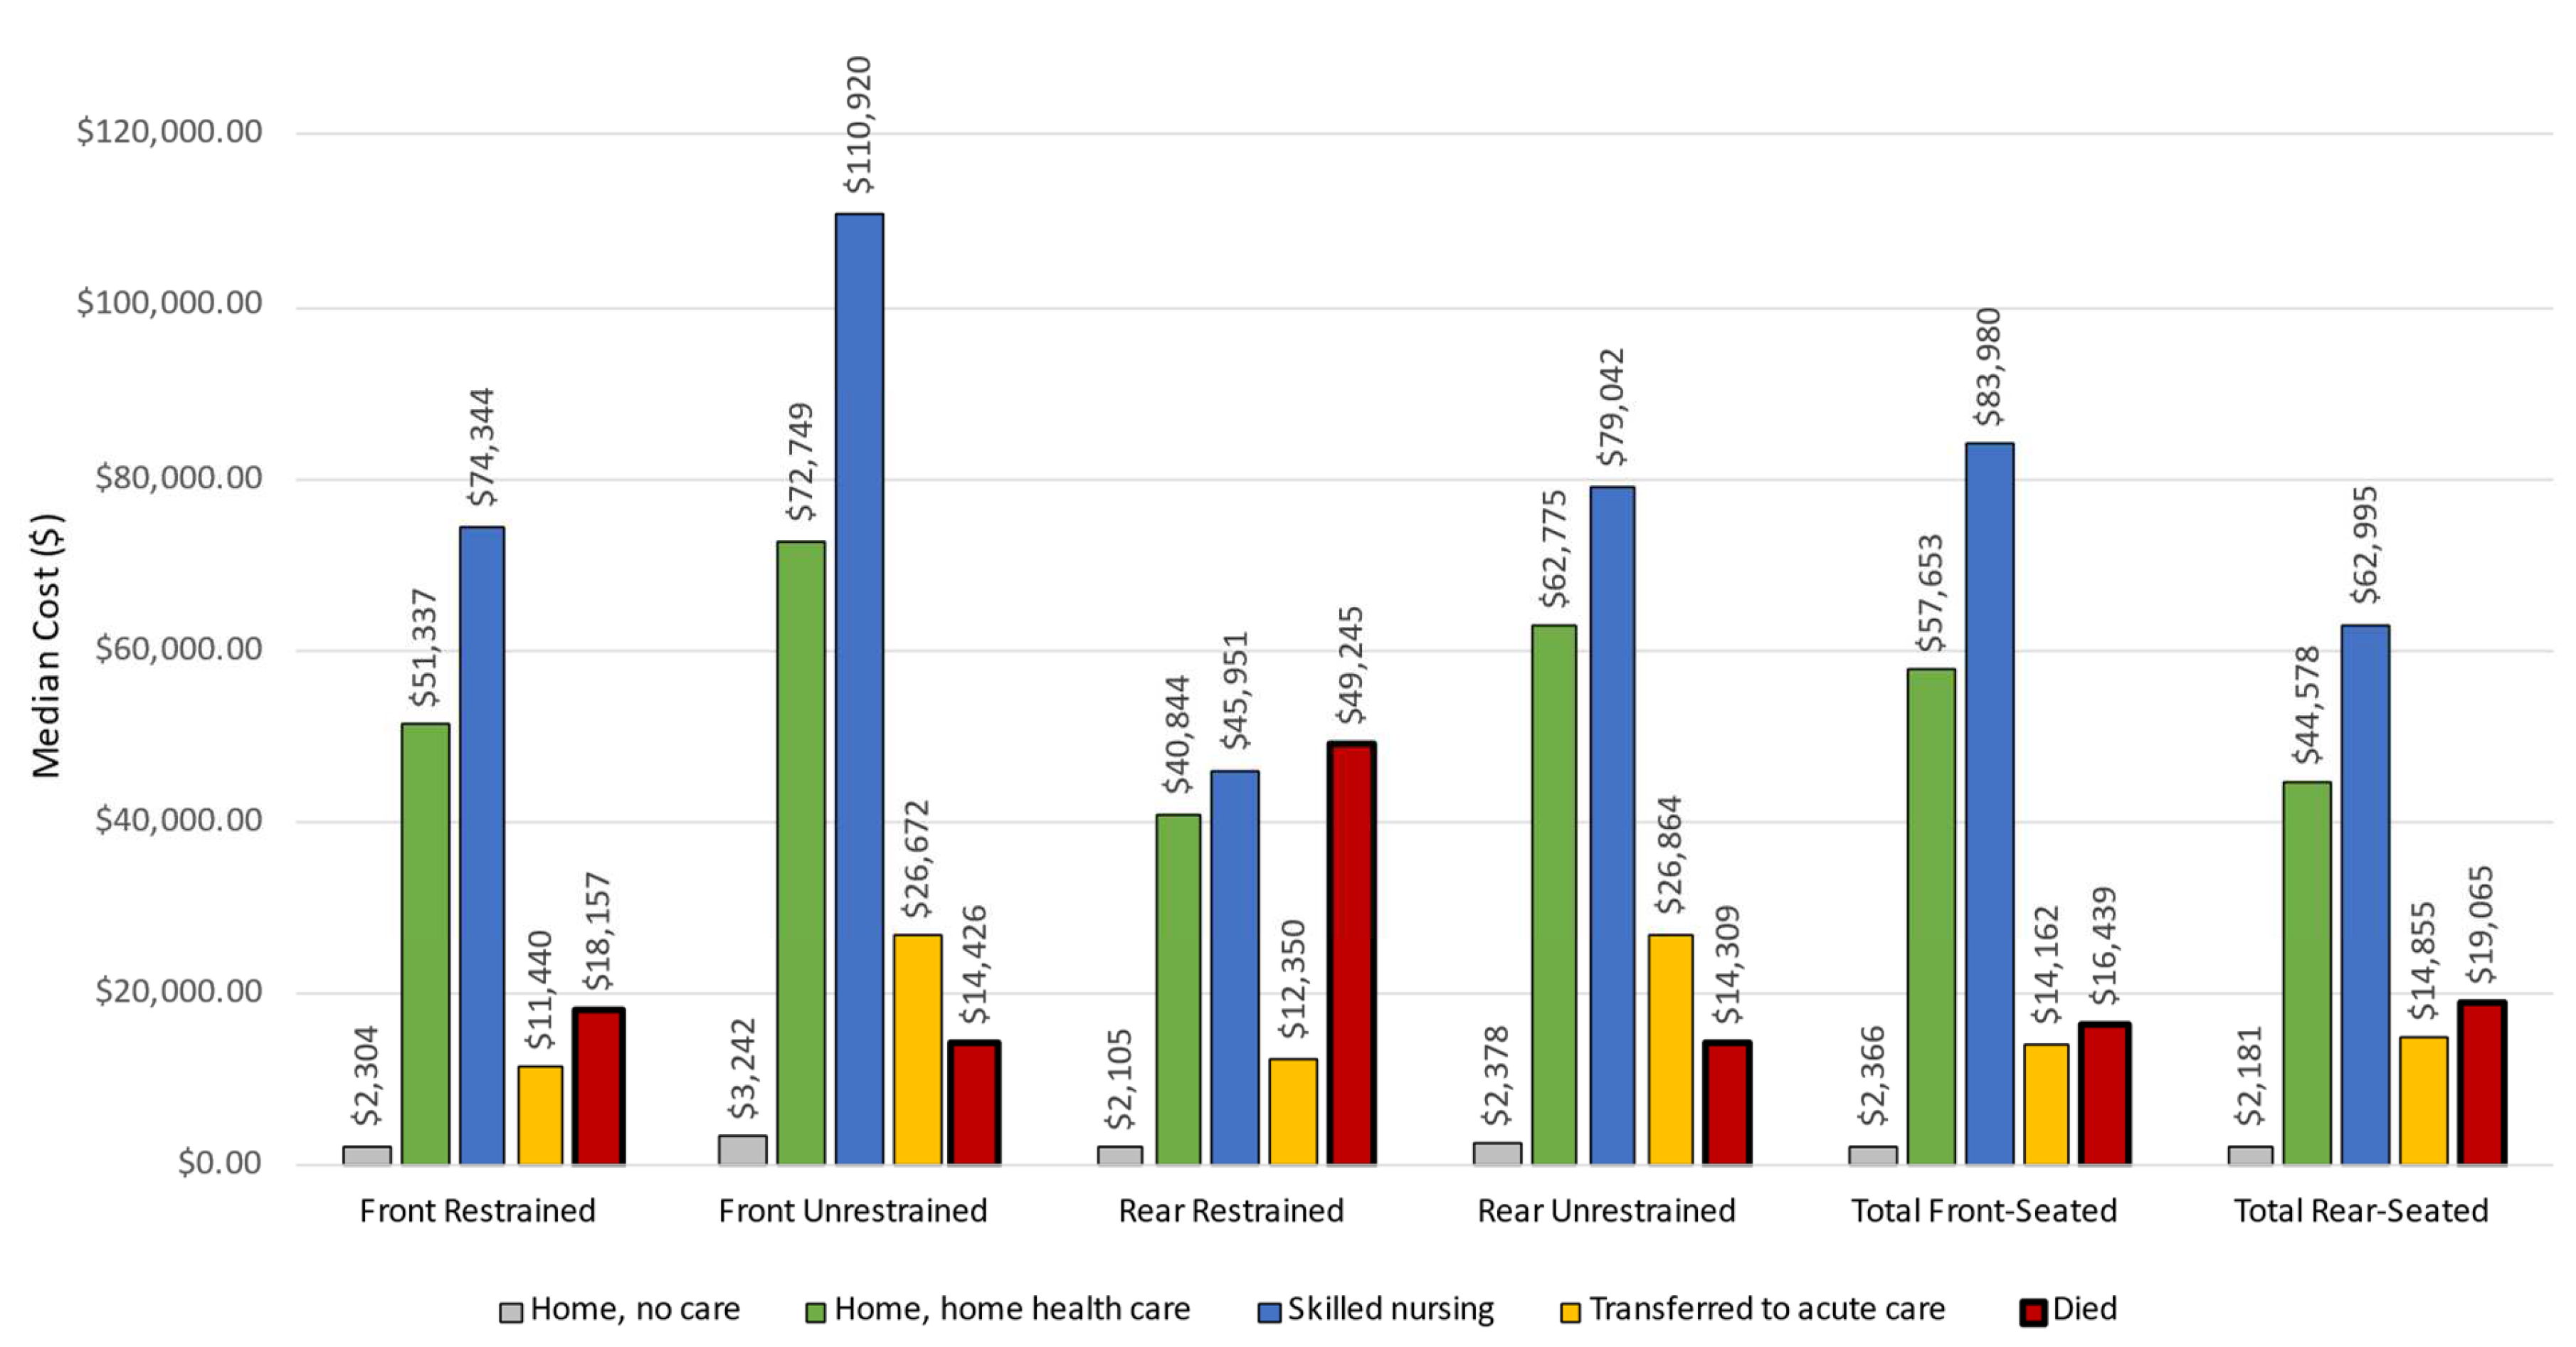
3.4. Resource Use and Medical Charges
4. Discussion
5. Conclusions
Supplementary Materials
Author Contributions
Funding
Institutional Review Board Statement
Informed Consent Statement
Data Availability Statement
Acknowledgments
Conflicts of Interest
References
- Raneses, E.; Pressley, J.C. Factors associated with mortality in rear-seated adult passengers involved in fatal motor vehicle crashes on US roadways. Inj. Epidemiol. 2015, 2, 5. [Google Scholar] [CrossRef] [Green Version]
- Allen, S.; Zhu, S.; Sauter, C.; Layde, P.; Hargarten, S. A comprehensive statewide analysis of seatbelt non-use with injury and hospital admissions: New data, old problem. Acad. Emerg. Med. 2006, 13, 427–434. [Google Scholar] [CrossRef] [Green Version]
- Evans, L.; Frick, M.C. Seating position in cars and fatality risk. Am. J. Public Health 1988, 78, 1456–1458. [Google Scholar] [CrossRef] [PubMed]
- Evans, L. Rear seat restraint system effectiveness in preventing fatalities. Accid. Anal. Prev. 1988, 20, 129–136. [Google Scholar] [CrossRef]
- Bodiwala, G.; Thomas, P.; Otubshin, A. Protective effect of rear-seat restraints during car collisions. Lancet 1989, 1, 369–371. [Google Scholar] [CrossRef]
- Nambisan, S.H.S.; Vasudevan, V. Is seat belt usage by front seat passengers related to seat belt usage by their drivers? J. Saf. Res. 2007, 38, 545–555. [Google Scholar] [CrossRef] [PubMed]
- Pressley, J.C.; Gatollari, H.J.; Liu, C. Rear seat belt laws and restraint use in rear-seated teen passengers traveling in passenger vehicles involved in a fatal collision on a U.S. roadway. J. Trauma Acute Care Surg. 2016, 81, S36–S43. [Google Scholar] [CrossRef]
- Smith, K.M.; Cummings, P. Passenger seating position and the risk of passenger death in traffic crashes: A matched cohort study. Inj. Prev. 2006, 12, 83–86. [Google Scholar] [CrossRef] [Green Version]
- Zhu, M.; Cummings, P.; Chu, H.; Cook, L.J. Association of rear seat safety belt use with death in a traffic crash: A matched cohort study. J. Int. Soc. Child Adolesc. Inj. Prev. 2007, 13, 183–185. [Google Scholar] [CrossRef]
- Beck, L.; West, B. Vital signs: Nonfatal, motor vehicle-occupant injuries (2009) and seat belt use (2008) among adults—United States. MMWR Morb. Mortal. Wkly. Rep. 2011, 59, 1681. [Google Scholar]
- Gill, S.S.; Jakub, J.W.; Pease, M.C.; Woollen, C.D. The economic impact of motor vehicle crashes: The cost of restrained versus unrestrained occupants in South Carolina. Am. Surg. 2002, 68, 569–574. [Google Scholar]
- Reath, D.B.; Kirby, J.; Lynch, M.; Maull, K.I. Injury and cost comparison of restrained and unrestrained motor vehicle crash victims. J. Trauma 1989, 29, 1173–1177. [Google Scholar] [CrossRef] [PubMed]
- Governors Highway Safety Association. State Laws by Issue: Seat Belts, June 2019. Available online: http://www.ghsa.org/state-laws/issues/Seat-Belts (accessed on 25 February 2020).
- Smith, K.M.; Cummings, P. Passenger seating position and the risk of passenger death or injury in traffic crashes. Accid. Anal. Prev. 2004, 36, 257–260. [Google Scholar] [CrossRef]
- Mayrose, J.; Priya, A. The safest seat: Effect of seating position on occupant mortality. J. Saf. Res. 2008, 39, 433–436. [Google Scholar] [CrossRef] [PubMed]
- National Center for Statistics and Analysis. Traffic Safety Facts: Seat Belt Use in 2019. National Highway Traffic Association 2019. Available online: https://crashstats.nhtsa.dot.gov/Api/Public/ViewPublication/812115 (accessed on 10 October 2021).
- Bilston, L.E.; Du, W.; Brown, J. A matched-cohort analysis of belted front and rear seat occupants in newer and older model vehicles shows that gains in front occupant safety have outpaced gains for rear seat occupants. Accid. Anal. Prev. 2010, 42, 1974–1977. [Google Scholar] [CrossRef] [PubMed]
- Liu, C.; Pressley, J.C. Side impact motor vehicle crashes: Driver, passenger, vehicle and crash characteristics for fatally and nonfatally injured rear-seated adults. Inj. Epidemiol. 2016, 3, 23. [Google Scholar] [CrossRef] [PubMed] [Green Version]
- Durbin, D.R.; Jermakian, J.S.; Kallan, M.J.; McCartt, A.T.; Arbogast, K.B.; Zonfrillo, M.R.; Myers, R.K. Rear seat safety: Variation in protection by occupant, crash and vehicle characteristics. Accid. Anal. Prev. 2015, 80, 185–192. [Google Scholar] [CrossRef] [PubMed]
- Prince, P.; Hines, L.M.; Bauer, M.J.; Liu, C.; Luo, J.; Garnett, M.; Pressley, J.C. Pediatric restraint use and injury in New York City taxis compared to other passenger vehicles. Transp. Res. Rec. 2019, 2673, 541–549. [Google Scholar] [CrossRef]
- Bauer, M.J.; Hines, L.M.; Pawlowski, E.; Scott, A.; Garnett, M.; Pressley, J.C. Using crash outcome data evaluation system (CODES) to examine injury in front- vs. rear-seated infants and children involved in a motor vehicle crash in New York State. Inj. Epidemiol. 2021, 8, 1–10. [Google Scholar] [CrossRef] [PubMed]
- McGlincy, M.H. A Bayesian Record Linkage Methodology for Multiple Imputation of Missing Links; Section on Survey Research Methods. In Proceeding of the ASA Proceedings of the Joint Statistical Meetings, Toronto, ON, Canada, 8–12 August 2004; American Statistical Association: Alexandria, VA, USA, 2004; pp. 4001–4008. [Google Scholar]
- NHTSA. The Crash Outcome Data Evaluation System (CODES) and Applications to Improve Traffic Safety Decision-Making. DOT HS 811 181. April 2010. Available online: https://crashstats.nhtsa.dot.gov/Api/Public/ViewPublication/811181 (accessed on 1 February 2020).
- National Highway Traffic Safety Administration. Estimating Median Hospital Charge in the CODES Crash Outcome Data Evaluation System, DOT HS 811 217, October 2009. Available online: https://crashstats.nhtsa.dot.gov/Api/Public/ViewPublication/811217 (accessed on 27 February 2020).
- Statewide Planning and Research Cooperative System (SPARCS). Available online: https://www.health.ny.gov/statistics/sparcs/download.htm (accessed on 26 February 2020).
- National Highway Traffic Safety Administration (NHTSA). FARS/NASS GES Coding and Validation Manual. 2017. Available online: https://static.nhtsa.gov/nhtsa/downloads/GES/GES14/2014%20FARS%20NASS%20GES%20C&V%20Manual.pdf (accessed on 15 October 2021).
- Ryb, G.E.; Dischinger, P.C.; Braver, E.R.; Burch, C.A.; Ho, S.M.; Kufera, J.A. Expected differences and unexpected commonalities in mortality, injury severity and injury patterns between near verses far occupants of side impact crashes. J. Trauma Acute Care Surg. 2009, 66, 499–503. [Google Scholar] [CrossRef]
- Federal Highway Administration. Manual for Selecting Safety Improvements on High Risk Rural Roads; Federal Highway Administration: Washington, DC, USA, 2014. Available online: https://safety.fhwa.dot.gov/hsip/hrrr/manual/hrrr_2014.pdf (accessed on 3 April 2019).
- SAS/STAT® 15.1 User’s Guide: The MIANALYZE Procedure; SAS Institute Inc.: Cary, NC, USA, 2018; Available online: https://documentation.sas.com/api/collections/pgmsascdc/9.4_3.4/docsets/statug/content/mianalyze.pdf?locale=en (accessed on 20 February 2018).
- SAS Support; SAS Institute: Cary, NC, USA. Available online: http://support.sas.com/kb/43522.html (accessed on 20 February 2018).
- Aitken, M.E.; Bowman, S.M.; Card-Higginson, P.; Carson, J.E.; Lin, T.M.; Thompson, J.W.; Zhao, Y. Safety restraint use linked to hospital use and charges in Arkansas. J. Ark. Med. Soc. 2008, 104, 161–164. [Google Scholar] [PubMed]
- Miller, T.R.; Lestina, D.C.; Spicer, R.S. Highway crash costs in the United States by driver age, blood alcohol level, victim age, and restraint use. Accid. Anal. Prev. 1998, 30, 137–150. [Google Scholar] [CrossRef]
- Nelson, D.E.; Peterson, T.D.; Chorba, T.L.; Devine, O.J.; Sacks, J.J. Cost savings associated with increased safety belt use in Iowa, 1987–1988. Accid. Anal. Prev. 1993, 25, 521–528. [Google Scholar] [CrossRef]
- Sokolosky, M.C.; Prescott, J.E.; Collins, S.L.; Timberlake, G.A. Safety belt use and hospital charge differences among motor vehicle crash victims. W V Med. J. 1993, 89, 328–333. [Google Scholar] [PubMed]
- Rutledge, R.; Lalor, A.; Oller, D.; Hansen, A.; Thomason, M.; Meredith, W.; Foil, B.; Baker, C. The cost of not wearing seat belts. A comparison of outcome in 3396 patients. Ann. Surg. 1993, 217, 122–127. [Google Scholar] [CrossRef]
- Orsay, E.M. Prospective study of the effect of safety belts on morbidity and health care costs in motor-vehicle accidents. JAMA 1988, 260, 3598. [Google Scholar] [CrossRef]
- Han, G.M.; Newmyer, A.; Qu, M. Seatbelt use to save money: Impact on hospital costs of occupants who are involved in motor vehicle crashes. Int. Emerg. Nurs. 2017, 31, 2–8. [Google Scholar] [CrossRef] [PubMed]


| Front-Seated Occupants (n,%) | Rear-Seated Occupants (n,%) | Total (n,%) | X2 Front vs. Rear | ||||
|---|---|---|---|---|---|---|---|
| Restrained | Unrestrained | Restrained | Unrestrained | Front-Seated 1 | Rear-Seated 1 | X2 (p-Value) | |
| Study population (Total N) | 110,843 | 5096 | 4515 | 1214 | 130,671 | 6641 | |
| Driver characteristics | |||||||
| Driver age (in years) | NA 2 | NA 2 | |||||
| ≤25 | 20,055 (22.9) | 715 (26.3) | |||||
| 26–44 | 35,244 (40.3) | 1171 (43.1) | |||||
| 45–64 | 28,220 (32.3) | 732 (26.9) | |||||
| 65+ | 3955 (4.5) | 100 (3.7) | |||||
| Driver sex/gender | NA2 | NA2 | |||||
| Male | 49,580 (52.7) | 2079 (72.3) | |||||
| Female | 44,430 (47.3) | 796 (27.7) | |||||
| Passenger characteristics | |||||||
| Passenger age (in years) | <0.0001 | ||||||
| ≤25 | 4312 (24.5) | 169 (32.5) | 1446 (32.0) | 364 (30.1) | 4474 (24.9) | 2044 (16.1) | |
| 25–44 | 6196 (37.6) | 228 (43.8) | 1689 (37.4) | 525 (43.4) | 6837 (37.0) | 2595 (37.1) | |
| 45–64 | 4101 (24.9) | 85 (16.3) | 958 (21.2) | 247 (20.4) | 4404 (24.5) | 1425 (21.5) | |
| 65+ | 2160 (13.1) | 38 (7.3) | 422 (9.3) | 73 (6.0) | 2289 (12.7) | 567 (25.7) | |
| Passenger sex/gender | 0.1258 | ||||||
| Male | 6022 (36.5) | 258 (49.6) | 1713 (38.0) | 517 (42.8) | 6702 (37.3) | 2538 (38.3) | |
| Female | 10,465 (63.5) | 262 (50.4) | 2796 (62.0) | 691 (57.2) | 11,290 (62.8) | 4086 (61.7) | |
| Injury severity and health care characteristics | |||||||
| Disposition of inpatients | 0.692 | ||||||
| Home, no care | 106,630 (96.2) | 4616 (90.6) | 4353 (96.4) | 1153 (95.0) | 124,975 (95.6) | 6359 (95.8) | |
| Home, home health care | 427 (0.39) | 65 (1.3) | 15 (0.33) | 7 (0.58) | 673 (0.52) | 35 (0.53) | |
| Other acute care facility | 1742 (1.5) | 209 (4.1) | 58 (1.3) | 29 (2.4) | 2388 (1.8) | 119 (1.8) | |
| Skilled nursing facility | 373 (0.34) | 47 (0.92) | 8 (0.18) | 4 (0.33) | 504 (0.39) | 17 (0.26) | |
| Died | 219 (0.20) | 59 (1.2) | 6 (0.13) | 9 (0.74) | 372 (0.28) | 18 (0.27) | |
| Other | 1452 (1.3) | 100 (2.0)) | 75 (1.7) | 12 (0.99) | 1759 (1.4) | 93 (1.4) | |
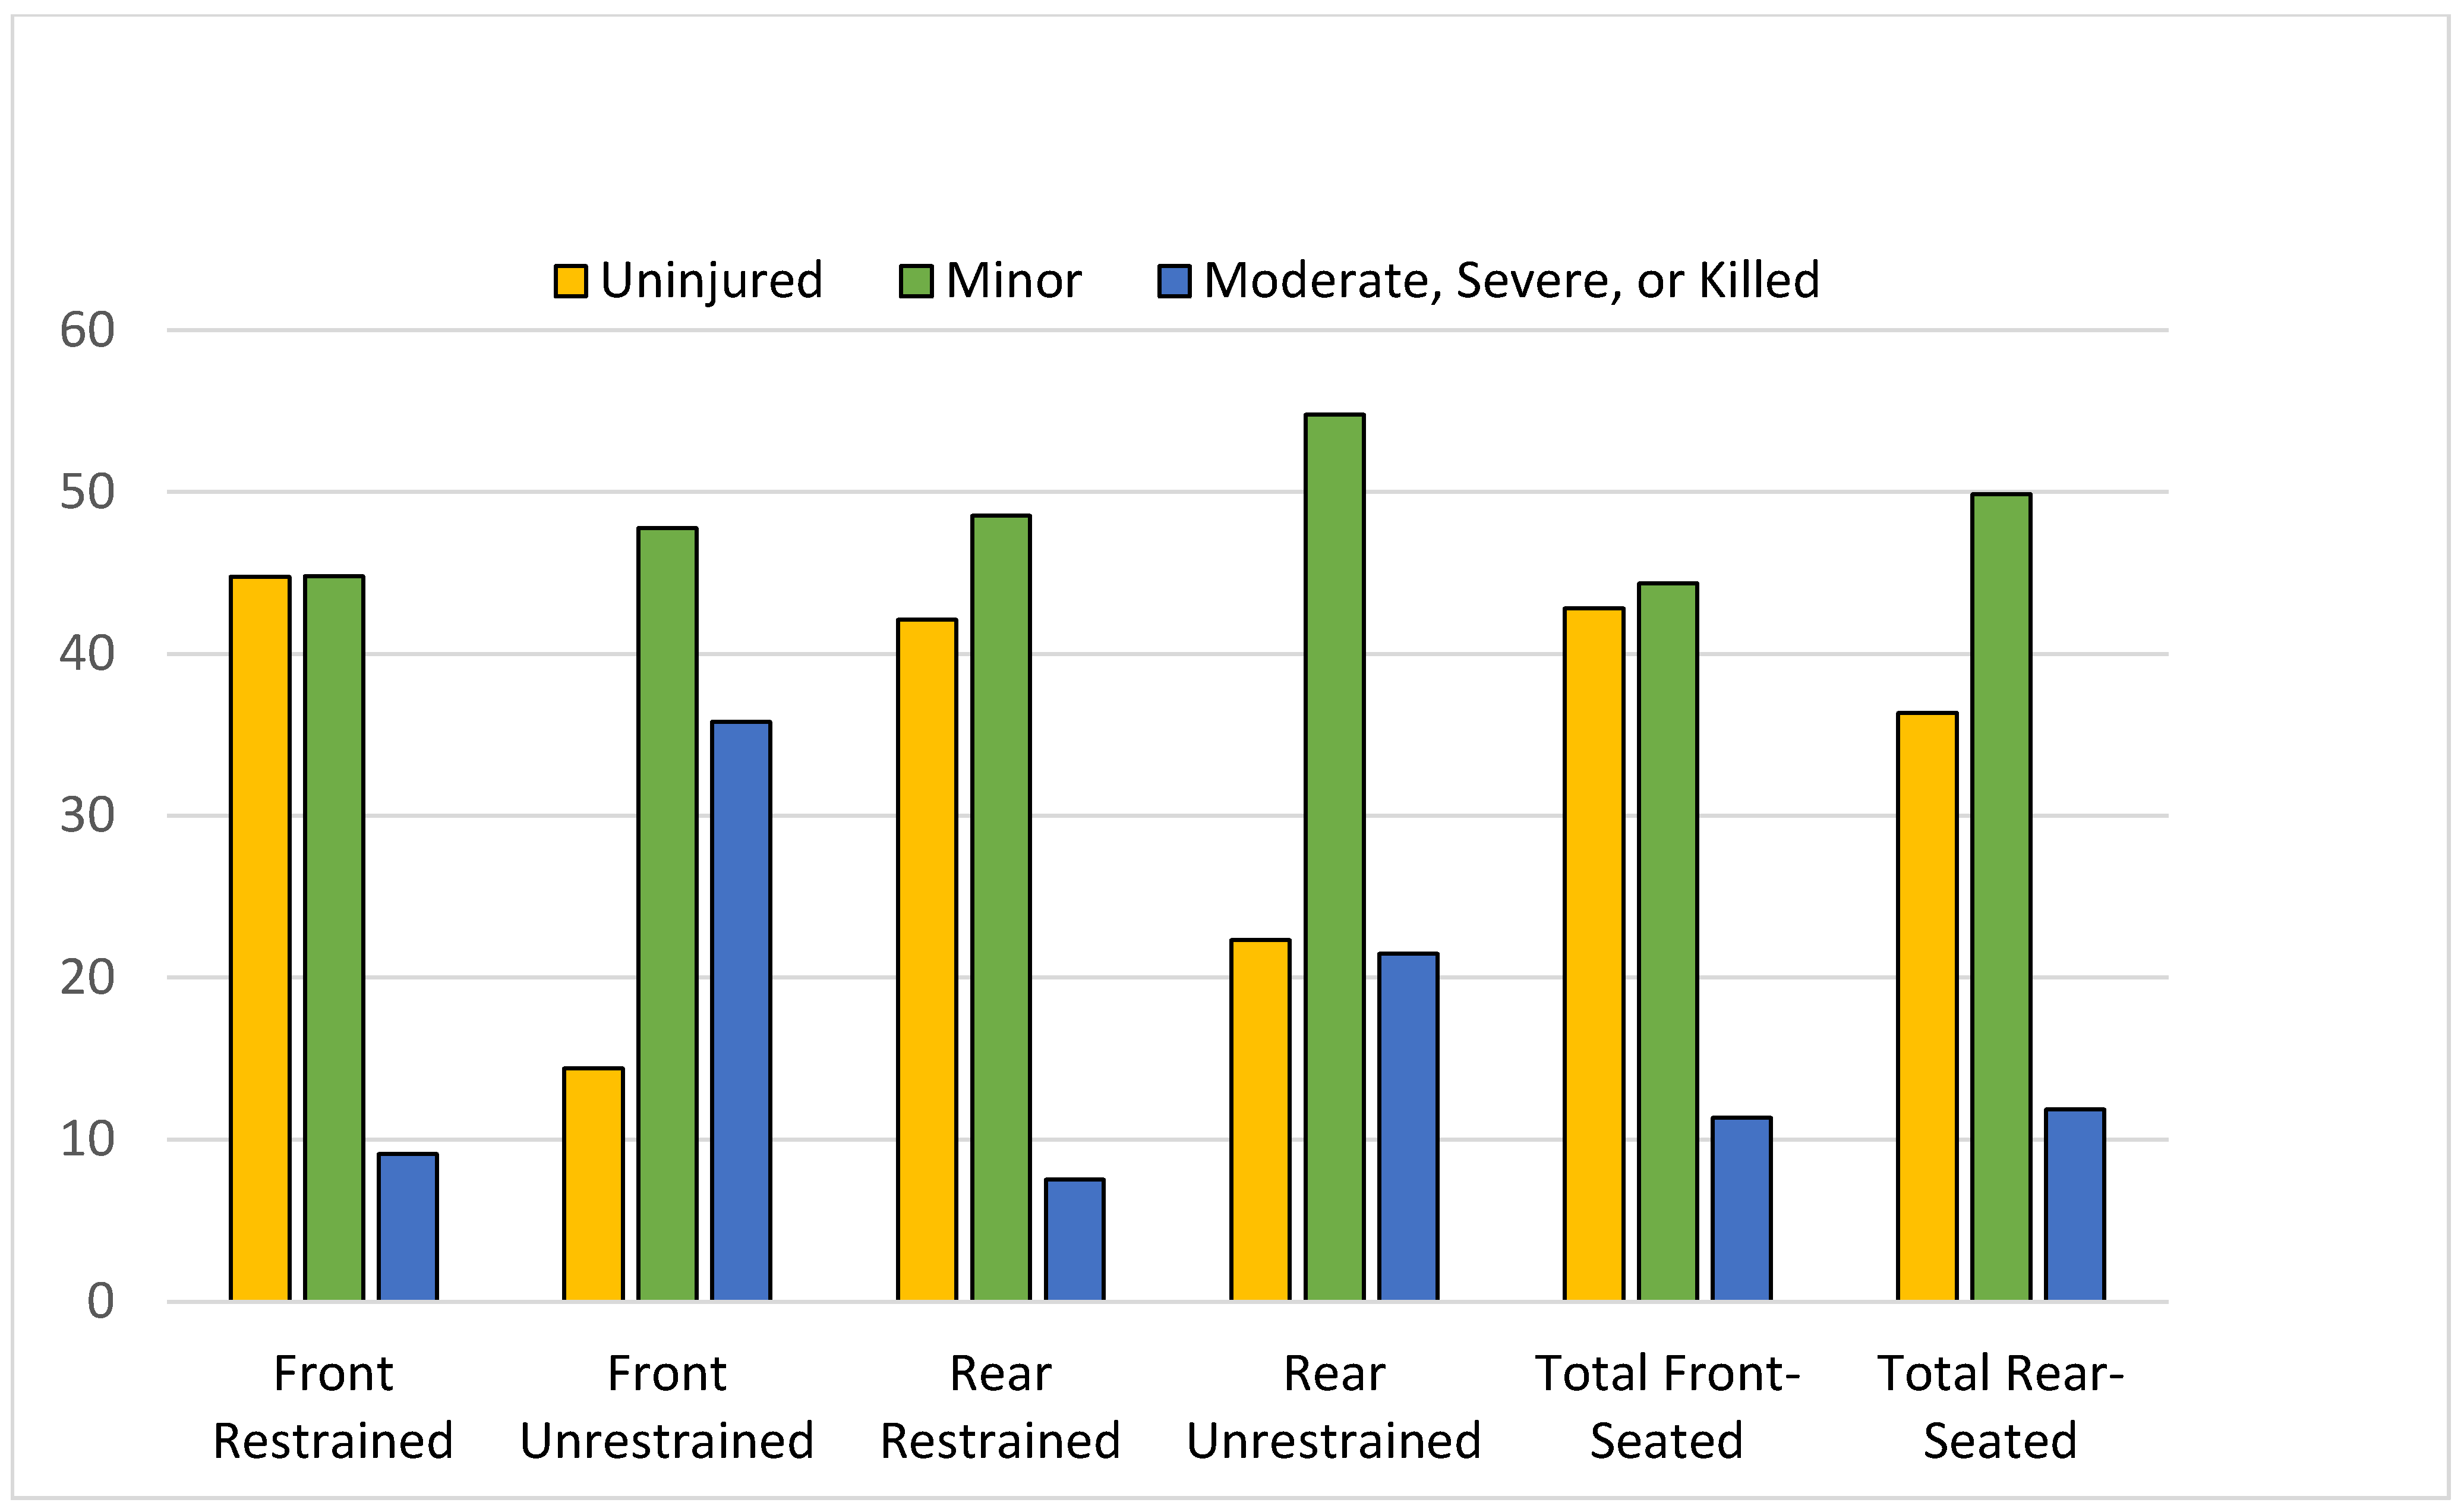
| Injury severity | <0.0001 | ||||||
| Uninjured | 49,609 (44.8) | 733 (14.4) | 1902 (42.1) | 271 (22.3) | 55,972 (42.8) | 2412 (36.3) | |
| Minor | 49,632 (44.8) | 2434 (47.8) | 2192 (48.6) | 665 (54.8) | 57,947 (44.4) | 3312 (49.9) | |
| Moderate | 5783 (5.2) | 983 (19.3) | 218 (4.8) | 146 (12.0) | 8239 (6.3) | 482 (7.3) | |
| Severe | 4153 (3.8) | 762 (15.0) | 120 (2.7) | 106 (8.7) | 6244 (4.8) | 293 (4.4) | |
| Killed | 137 (0.12) | 81 (1.6) | 1 (0.02) | 9 (0.74) | 320 (0.24) | 13 (0.20) | |
| Unknown severity | 1529 (1.4) | 103 (2.0) | 82 (1.8) | 17 (1.4) | 1949 (1.5) | 129 (1.9) | |
| Length of stay (in days) 3 | |||||||
| Mean, SD | 5.19, 7.38 | 7.02, 9.50 | 4.17, 5.07 | 7.55, 10.52 | 5.87, 8.31 | 6.19, 8.25 | 0.18 |
| Payment Characteristics | |||||||
| Source of payment | <0.0001 | ||||||
| Private | 70,229 (65.8) | 2963 (60.3) | 2763 (63.5) | 713 (60.6) | 82,148 (65.2) | 3999 (62.5) | |
| Governmental source | 11,012 (10.3) | 543 (11.1) | 499 (11.5) | 136 (11.6) | 13,196 (10.5) | 744 (11.6) | |
| Workers’ compensation | 5588(5.2) | 240 (4.9) | 210 (4.8) | 62 (5.3) | 6427 (5.1) | 322 (5.0) | |
| Self-pay/uninsured | 14,325 (13.4) | 846 (17.2) | 607 (14.0) | 187 (15.9) | 17,354 (13.8) | 938 (14.7) | |
| Other | 2260 (2.1) | 84 (1.7) | 88 (2.0) | 26 (2.2) | 2629 (2.1) | 123 (1.9) | |
| Unknown | 3381 (3.2) | 235 (4.8) | 183 (4.2) | 53 (4.5) | 4201 (3.3) | 276 (4.3) | |
| Front-Seated Occupants (n,%) | Rear-Seated Occupants (n,%) | Total (n,%) | X2 Front vs. Rear | ||||
|---|---|---|---|---|---|---|---|
| Restrained | Unrestrained | Restrained | Unrestrained | Front-Seated 1 | Rear-Seated 1 | X2 (p-Value) | |
| Study population (N) | 110,843 | 5096 | 4515 | 1214 | 130,671 | 6641 | |
| Vehicle characteristics | |||||||
| Vehicle body type | <0.0001 | ||||||
| Car | 58,971 (54.2) | 1734 (37.5) | 2334 (52.4) | 758 (64.4) | 65,932 (53.2) | 3553 (55.9) | |
| Light Truck | 48,244 (44.3) | 1213 (26.3) | 2109 (47.3) | 416 (35.3) | 53,573 (43.1) | 2776 (43.7) | |
| Large truck | 1586 (1.5) | 48 (1.0) | 14 (0.31) | 1 (0.08) | 1798 (1.5) | 16 (0.25) | |
| Other | 1926 (1.7) | 151 (7.3) | 56 (71.8) | 22 (28.2) | 3051 (2.5) | 10 (0.16) | |
| Vehicle year | <0.0001 | ||||||
| <1994 | 7435 (6.7) | 1863 (36.6) | 377 (8.4) | 101 (8.3) | 12,743 (9.8) | 595 (9.0) | |
| 1994–1997 | 2597 (2.3) | 96 (1.9) | 61 (1.4) | 21 (1.7) | 2977 (2.3) | 97 (1.5) | |
| 1998–2004 | 21,703 (19.6) | 750 (14.7) | 753 (16.7) | 200 (16.5) | 24,786 (19.0) | 1102 (16.6) | |
| 2005–2008 | 22,017 (19.9) | 684 (13.4) | 842 (18.7) | 254 (20.9) | 25,115 (19.2) | 1249 (18.8) | |
| 2009–2011 | 9577 (8.6) | 244 (4.8) | 363 (8.0) | 98 (8.1) | 10,790 (8.3) | 529 (8.0) | |
| 2012 or newer | 47,492 (42.9) | 1246 (24.5) | 2118 (46.9) | 540 (44.5) | 53,913 (41.3) | 3068 (9.0) | |
| Unknown | 22 (0.02) | 213 (4.2) | 1 (0.02) | 0 (0) | 347 (0.27) | 1 (0.02) | |
| Crash characteristics | |||||||
| Ejection | <0.0001 | ||||||
| Not ejected | 109,076 (98.4) | 3798 (74.5) | 4459 (98.8) | 1148 (94.6) | 123,214 (94.3) | 6350 (95.6) | |
| Partially ejected | 87 (0.08) | 219 (4.3) | 6 (0.13) | 9 (0.7) | 734 (0.6) | 37 (0.6) | |
| Ejected | 52 (0.05) | 958 (18.8) | 2 (0.04) | 43 (3.5) | 3201 (2.5) | 172 (2.6) | |
| Unknown | 1628 (1.5) | 121 (2.4) | 48 (1.)1 | 14 (1.2) | 3522 (2.7) | 82 (1.2) | |
| Airbag deployment | <0.0001 | ||||||
| Yes | 13,514 (12.2) | 1177 (23.1) | 144 (3.2) | 37 (3.1) | 14,697 (11.3) | 183 (2.8) | |
| No | 96,996 (87.5) | 1919 (37.7) | 4371 (96.8) | 1160 (95.6) | 98,936 (75.7) | 5561 (83.7) | |
| Unknown | 333 (0.30) | 2000 (39.3) | 0 (0) | 17 (1.4) | 17,038 (13.0) | 897 (13.5) | |
| Vehicle towed | <0.0001 | ||||||
| Yes | 56,009 (50.5) | 2275 (44.6) | 2015 (44.6) | 594 (48.9) | 62,668 (48.0) | 3014 (45.4) | |
| No | 54,834 (49.5) | 1197 (23.5) | 2500 (55.4) | 615 (50.7) | 65,952 (49.7) | 3617 (54.5) | |
| Unknown | 0 (0) | 1624 (31.9) | 0 (0) | 5 (0.4) | 3051 (2.3) | 10 (0.15) | |
| Alcohol involved crash | <0.0001 | ||||||
| Yes | 1670 (1.5) | 342 (6.7) | NA 2 | NA 2 | 2369 (1.8) | 0 (0) | |
| No | 78,888 (71.2) | 3326 (65.3) | 89,792 (68.7) | 6 (0.09) | |||
| Unknown | 30,285 (27.3) | 1428 (28.0) | 38,510 (29.5) | 6635 (99.9) | |||
| Speed involvement | 0.0021 | ||||||
| Yes | 7808 (7.0) | 619 (12.2) | 303 (6.7) | 150 (12.4) | 9431 (7.2) | 546 (8.2) | |
| No | 103,035 (93.0) | 4477 (87.9) | 4212 (93.3) | 1064 (87.6) | 121,240 (92.8) | 6095 (91.8) | |
| Location | <0.0001 | ||||||
| Urban | 29,945 (27.2) | 1061 (20.9) | 1005 (22.3) | 236 (19.5) | 33,989 (26.2) | 5232 (79.0) | |
| Rural | 80,261 (72.8) | 4020 (79.1) | 3496 (77.7) | 972 (80.5) | 95,888 (73.8) | 1389 (21.0) | |
| Evening crash | 0.2365 | ||||||
| Yes | 29,867 (26.9) | 1306 (25.6) | 1310 (81.7) | 293 (18.3) | 34,930 (26.7) | 1819 (27.4) | |
| No | 80,976 (74.4) | 3790 (74.4) | 3205 (77.7) | 921 (22.3) | 95,741 (73.3) | 4822 (72.6) | |
Publisher’s Note: MDPI stays neutral with regard to jurisdictional claims in published maps and institutional affiliations. |
© 2022 by the authors. Licensee MDPI, Basel, Switzerland. This article is an open access article distributed under the terms and conditions of the Creative Commons Attribution (CC BY) license (https://creativecommons.org/licenses/by/4.0/).
Share and Cite
Pressley, J.C.; Pawlowski, E.; Hines, L.M.; Bhatta, S.; Bauer, M.J. Motor Vehicle Crash and Hospital Charges in Front- and Rear-Seated Restrained and Unrestrained Adult Motor Vehicle Occupants. Int. J. Environ. Res. Public Health 2022, 19, 13674. https://doi.org/10.3390/ijerph192013674
Pressley JC, Pawlowski E, Hines LM, Bhatta S, Bauer MJ. Motor Vehicle Crash and Hospital Charges in Front- and Rear-Seated Restrained and Unrestrained Adult Motor Vehicle Occupants. International Journal of Environmental Research and Public Health. 2022; 19(20):13674. https://doi.org/10.3390/ijerph192013674
Chicago/Turabian StylePressley, Joyce C., Emilia Pawlowski, Leah M. Hines, Sabana Bhatta, and Michael J. Bauer. 2022. "Motor Vehicle Crash and Hospital Charges in Front- and Rear-Seated Restrained and Unrestrained Adult Motor Vehicle Occupants" International Journal of Environmental Research and Public Health 19, no. 20: 13674. https://doi.org/10.3390/ijerph192013674