Article

Determination of Hydroxy Polycyclic Aromatic Hydrocarbons in Human Urine Using Automated Microextraction by Packed Sorbent and Gas Chromatography–Mass Spectrometry

by
Samuel García-García
,
Héctor Matilla-González
,
Javier Peña
*,
Miguel del Nogal Sánchez
,
Ana María Casas-Ferreira
and
José Luis Pérez Pavón
Departamento de Química Analítica, Nutrición y Bromatología, Facultad de Ciencias Químicas, Universidad de Salamanca, 37008 Salamanca, Spain
*
Author to whom correspondence should be addressed.
Int. J. Environ. Res. Public Health 2022, 19(20), 13089; https://doi.org/10.3390/ijerph192013089
Submission received: 9 September 2022 / Revised: 5 October 2022 / Accepted: 10 October 2022 / Published: 12 October 2022

Abstract

:
A fast methodology for the determination of monohydroxy polycyclic aromatic hydrocarbons in human urine using a fully automated microextraction by packed sorbent coupled to a gas chromatograph–mass spectrometer is reported. Sample preparation requires simple hydrolysis, centrifugation, filtration, and dilution. The method does not require a derivatization step prior to analysis with gas chromatography and allows the measurement of up to three samples per hour after hydrolysis. Quantitation is carried out by a one-point standard addition allowing the determination of 6 analytes with good limits of detection (10.1–39.6 ng L−1 in water and 0.5–19.4 µg L−1 in urine), accuracy (88–110%) and precision (2.1–23.4% in water and 5.1–19.0% in urine) values. This method has been successfully applied to the analysis of six urine samples (three from smoker and three from non-smoker subjects), finding significant differences between both types of samples. Results were similar to those found in the literature for similar samples, which proves the applicability of the methodology.

Graphical Abstract

1. Introduction

Polycyclic aromatic hydrocarbons (PAHs) are a group of organic pollutants formed by two or more benzene rings fused together. They can be found widespread in the environment, and they are known to produce mutagenic, carcinogenic, or teratogenic effects [1,2]. PAHs can be released into the environment from both natural and anthropogenic sources such as incomplete combustion of fossil fuels, natural gas, wood, coke, and organic waste, and some studies have shown that high concentrations of these compounds can also be found in grilled meat [3]. Once PAHs enter the human body, either by ingestion, dermal contact, or inhalation, they are rapidly metabolized into their corresponding hydroxylated derivatives (OH-PAHs) and conjugated to a sulfate or glucuronide form, which will be excreted via urine or feces, making OH-PAHs good biomarkers of PAHs [4,5]. These OH-PAHs can be even more harmful to human health than their corresponding parent PAHs [6], and they may be bio-transformed to reactive electrophiles, which can bind to DNA [7]. These metabolites have relatively short half-life elimination times (5–35 h), and they are useful for assessing recent exposure to PAHs [8]. On many occasions, a single metabolite, usually 1-hydroxipyrene, has been used to assess PAH exposure levels. However, this strategy cannot fully represent comprehensive exposure levels to PAHs since, in a real situation, the number of analytes is higher. The determination of a wide variety of metabolites has advantages in exposome studies [9].
Gas chromatography (GC) [8,10,11,12] and liquid chromatography (LC) [13,14,15] coupled with mass spectrometry (MS) have been commonly used for the determination of OH-PAHs in urine samples. However, after the corresponding hydrolysis to liberate the OH-PAHs from their conjugate forms [16], typical sample preparation in gas chromatography-based methods requires a derivatization step using organic reagents since OH-PAHs are not volatile enough due to their polarity and molecular weight, making the developed methods so far labor-intensive, more expensive, and less environmentally friendly, compared to the strategy we propose here. To the best of our knowledge, to date, there is only one article with a method based on GC-MS where there is no derivatization of OH-PAHs before chromatographic analysis [10], where solid-phase microextraction (SPME) is used to extract the analytes, which requires more than 45 min per sample. The method we propose takes only 17.5 min per sample, including not only the extraction step but also the chromatographic analysis. Regarding analyte extraction, attention has also been paid to improving sample treatment techniques to separate compounds from the sample matrix and enrich them effectively. In this sense, several solid-phase microextraction techniques have been used for the enrichment of OH-PAHs [10,14,17]. An alternative that has not been extensively explored to date in this field is the use of microextraction by packed sorbent (MEPS), which is based on the miniaturization of conventional solid-phase extraction [18]. Another option to improve sensitivity is the use of a programmed temperature vaporizer (PTV) [18,19] to inject the samples into the gas chromatograph. In this case, the metabolites are retained in the liner by cold trapping, while other matrix components are eliminated through the split valve using the solvent vent mode. Some authors [20] have eliminated the step of chromatographic separation of the metabolites, and the whole sample is introduced directly into the mass spectrometer. In this case, the method was based on SPME coupled to glass-capillary nanoelectrospray ionization mass spectrometry (nanoESI-MS).
In this work, a rapid and sensitive method for the determination of underivatized monohydroxy polycyclic aromatic hydrocarbons in human urine samples is reported. The method is based on a fully automated microextraction by packed sorbent coupled to gas chromatography (including programmable temperature vaporization) and mass spectrometry with no derivatization step, which simplifies laboratory work and reduces analysis time and cost, and it is more environmentally friendly since no organic reagents are used. In addition, this reduces the error related to the sample preparation step prior to chromatographic analysis due to the minimal sample manipulation.

2. Materials and Methods

2.1. Reagents and Standards

Standards of 1-hydroxynaphthalene (1-NAP, C10H8O, 99%), 2-hydroxynaphthalene (2-NAP, C10H8O, 99%), 1-hydroxyacenaphthene (1-ACE, C12H10O, 99%), 2-hydroxyfluorene (2-FLU, C13H10O, 98%), 9-hydroxyfluorene (9-FLU, C13H10O, 96%), 9-hydroxyphenanthrene (9-PHE, C14H10O, tech. grade), enzyme β-Glucuronidase from Helix pomatia (Type H-5, lyophilized powder, ≥400,000 units/g solid), methanol (HPLC grade, 99.9%) and ethyl acetate (HPLC grade, 99.9%) were supplied by Sigma-Aldrich (Steinheim, Germany). For this study, 1-Naphthol β-d-glucuronide sodium salt (C16H15NaO7, 98%) was obtained from Toronto Research Chemicals Inc.
Stock solutions (1000 mg L−1) of each standard were prepared in methanol and stored at −20 °C prior to use. Dilution to working standard concentrations was made using ultra-high-quality water (UHQ, obtained with a Wasserlab Ultramatic water purification system, Noain, Spain). All solutions were stored at 8 °C. Before use, these solutions were left to warm up to room temperature and subsequently diluted to prepare the working solutions for spiking samples.

2.2. Synthetic Urine and Urine Samples

Synthetic urine was prepared following the procedure described by van de Merbel [21]. Human urine samples were obtained from six subjects (three non-smoker and three smoker), in a disposable sterile collection cup and stored at −20 °C until analysis (typically 24–72 h). All subjects were told to collect the first sample in the morning. After thawing at room temperature, samples were vortexed at maximum speed for 1 minute for homogenization prior to use. Informed consent was obtained from all subjects involved in the study prior to analysis.

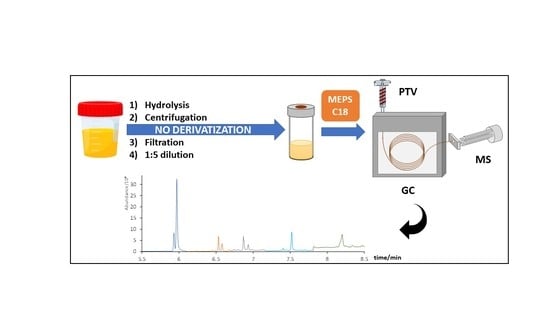
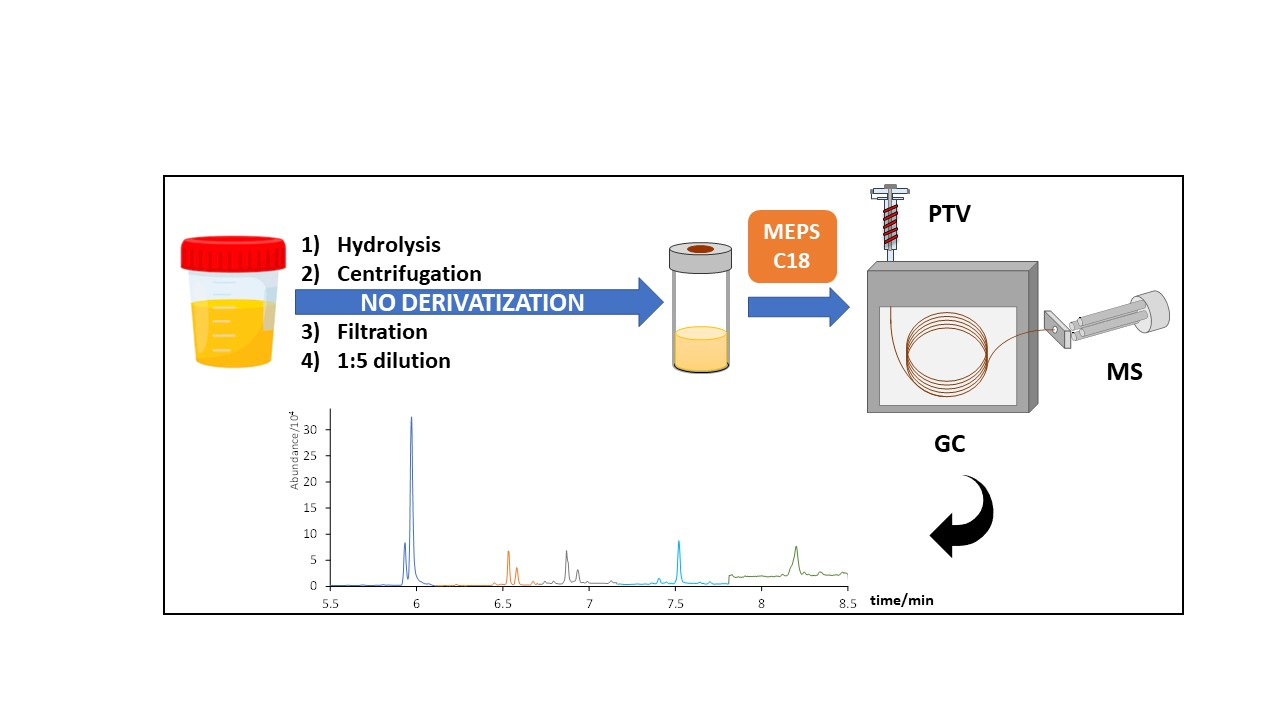
2.3. Hydrolysis, MEPS Extraction Procedure, and Instrumental Conditions

For analysis, urine samples were thawed at room temperature and transferred to a 12-mL polypropylene tube (Scharlab), followed by vortexing for 1 min at room temperature. From the mixture, 800 µL were transferred to a 10 mL headspace vial. Here, 100 µL of enzyme solution (5000 uds/mL in pH 5 buffer) and 100 µL of UHQ water were added. The vial sample was introduced in an oven at 37 °C for 15 hours for hydrolysis. Next, the sample was again transferred to a 12-mL polypropylene tube and centrifuged for 5 min at 4500 rpm (1815 g). The supernatant was filtered using a polytetrafluoroethylene filter (PTFE, 0.45 µm, 17 mm i.d.), and 500 µL of the filtrate were added to a new 10 mL headspace vial, followed by 2000 µL of a pH 7 buffer. The mixture was then subjected to the MEPS extraction procedure.
An MPS2 Multi-Purpose Sampler (Gerstel, Mülheim an der Ruhr, Germany) was used to perform all the next steps automatically from here. Extraction of the analytes was performed using a C18 cartridge (SGE Analytical Science). Optimal conditions for MEPS were found to be as follows: conditioning of the sorbent with 100 µL of ethyl acetate; then, passing 100 µL of UHQ water (flow rate, 25 µL/s). Next came extracting the sample (3 cycles of 100 µL at a flow rate of 5 µL/s using the drawing and discarding mode). The next step was to then wash the sorbent with 100 µL of UHQ water to remove interferences and drying the cartridge by pumping air through it (10 × 100 µL) at a flow rate of 25 µL/s. The compounds were eluted with 30 µL of ethyl acetate and injected into the programmed temperature vaporizer (PTV) filled with an empty deactivated baffled glass liner (71 mm × 2 mm I.D., Gerstel CIS-4) at a flow rate of 5 µL/s.
Solvent vent mode was selected for inlet operation using the following conditions: initial temperature of 80 °C for 0.55 min with a vent flow of 50 mL min−1 (2.00 psi). After venting the solvent, the split valve was closed, and the liner was flash-heated (12 °C/s) up to 270 °C to transfer the analytes into the column. Injection time was set to 2.0 min. The temperature was kept for 5 min after injection with the split valve opened for cleaning, using a split vent purge flow of 50 mL min−1. Finally, liquid CO2 (Air Liquide) was used to reach the initial conditions again.
Analyses of OH-PAHs were performed on a GC-MS instrument (Agilent Technologies, Santa Clara, CA, USA) consisting of a 6890 gas chromatograph interfaced with an HP 5973 N quadrupole mass spectrometer. Chromatographic separation was carried out using an HP-5MS UI capillary column (30 m × 0.25 mm, 0.25 µm; J&W Scientific, Folsom, CA, USA). A flow rate of 1 mL min−1 of Helium N50 (99.9999 % pure, Air Liquid) as the carrier gas was used. The initial oven temperature was set at 80 °C and was held for 1 min. Then, the temperature was increased from 30 °C min−1 to 300 °C and held for 1.5 min. The total chromatographic run time was 8.5 min. The total time needed for analysis per sample was 17.5 min: 9 min for the entire MEPS process (excluding reconditioning since this is automatically overlapped during the GC run; see Figure 1) and 8.5 min for chromatographic separation.
The MS detector was equipped with an inert ion source and operated in electron ionization mode using an ionization voltage of 70 eV. The ion source temperature was 230 °C, the quadrupole was set at 150 °C, and the transfer line temperature was 280 °C. The analyses were performed in a synchronous SIM/Scan mode, acquiring both SIM and Full Scan data in a single run (solvent delay 4.00 min). Full Scan (m/z range: 60–250 amu) was used for identification and SIM for quantification, selecting the characteristic ions in each case (one quantification and two qualifier ions were monitored), with a dwell time of 10 ms. MSD ChemStation, Ver. E.02.00.493 software from Agilent Technologies was used for data acquisition. NIST_98 (NIST/EPA/NIH Mass Spectral Library, version 2.0) database was used for identification.

3. Results and Discussion

Several factors affecting sample preparation, MEPS procedure and PTV-GC-MS analysis were optimized. For the optimization studies, unless otherwise stated, the instrumental conditions used were the ones in Section 2.3.

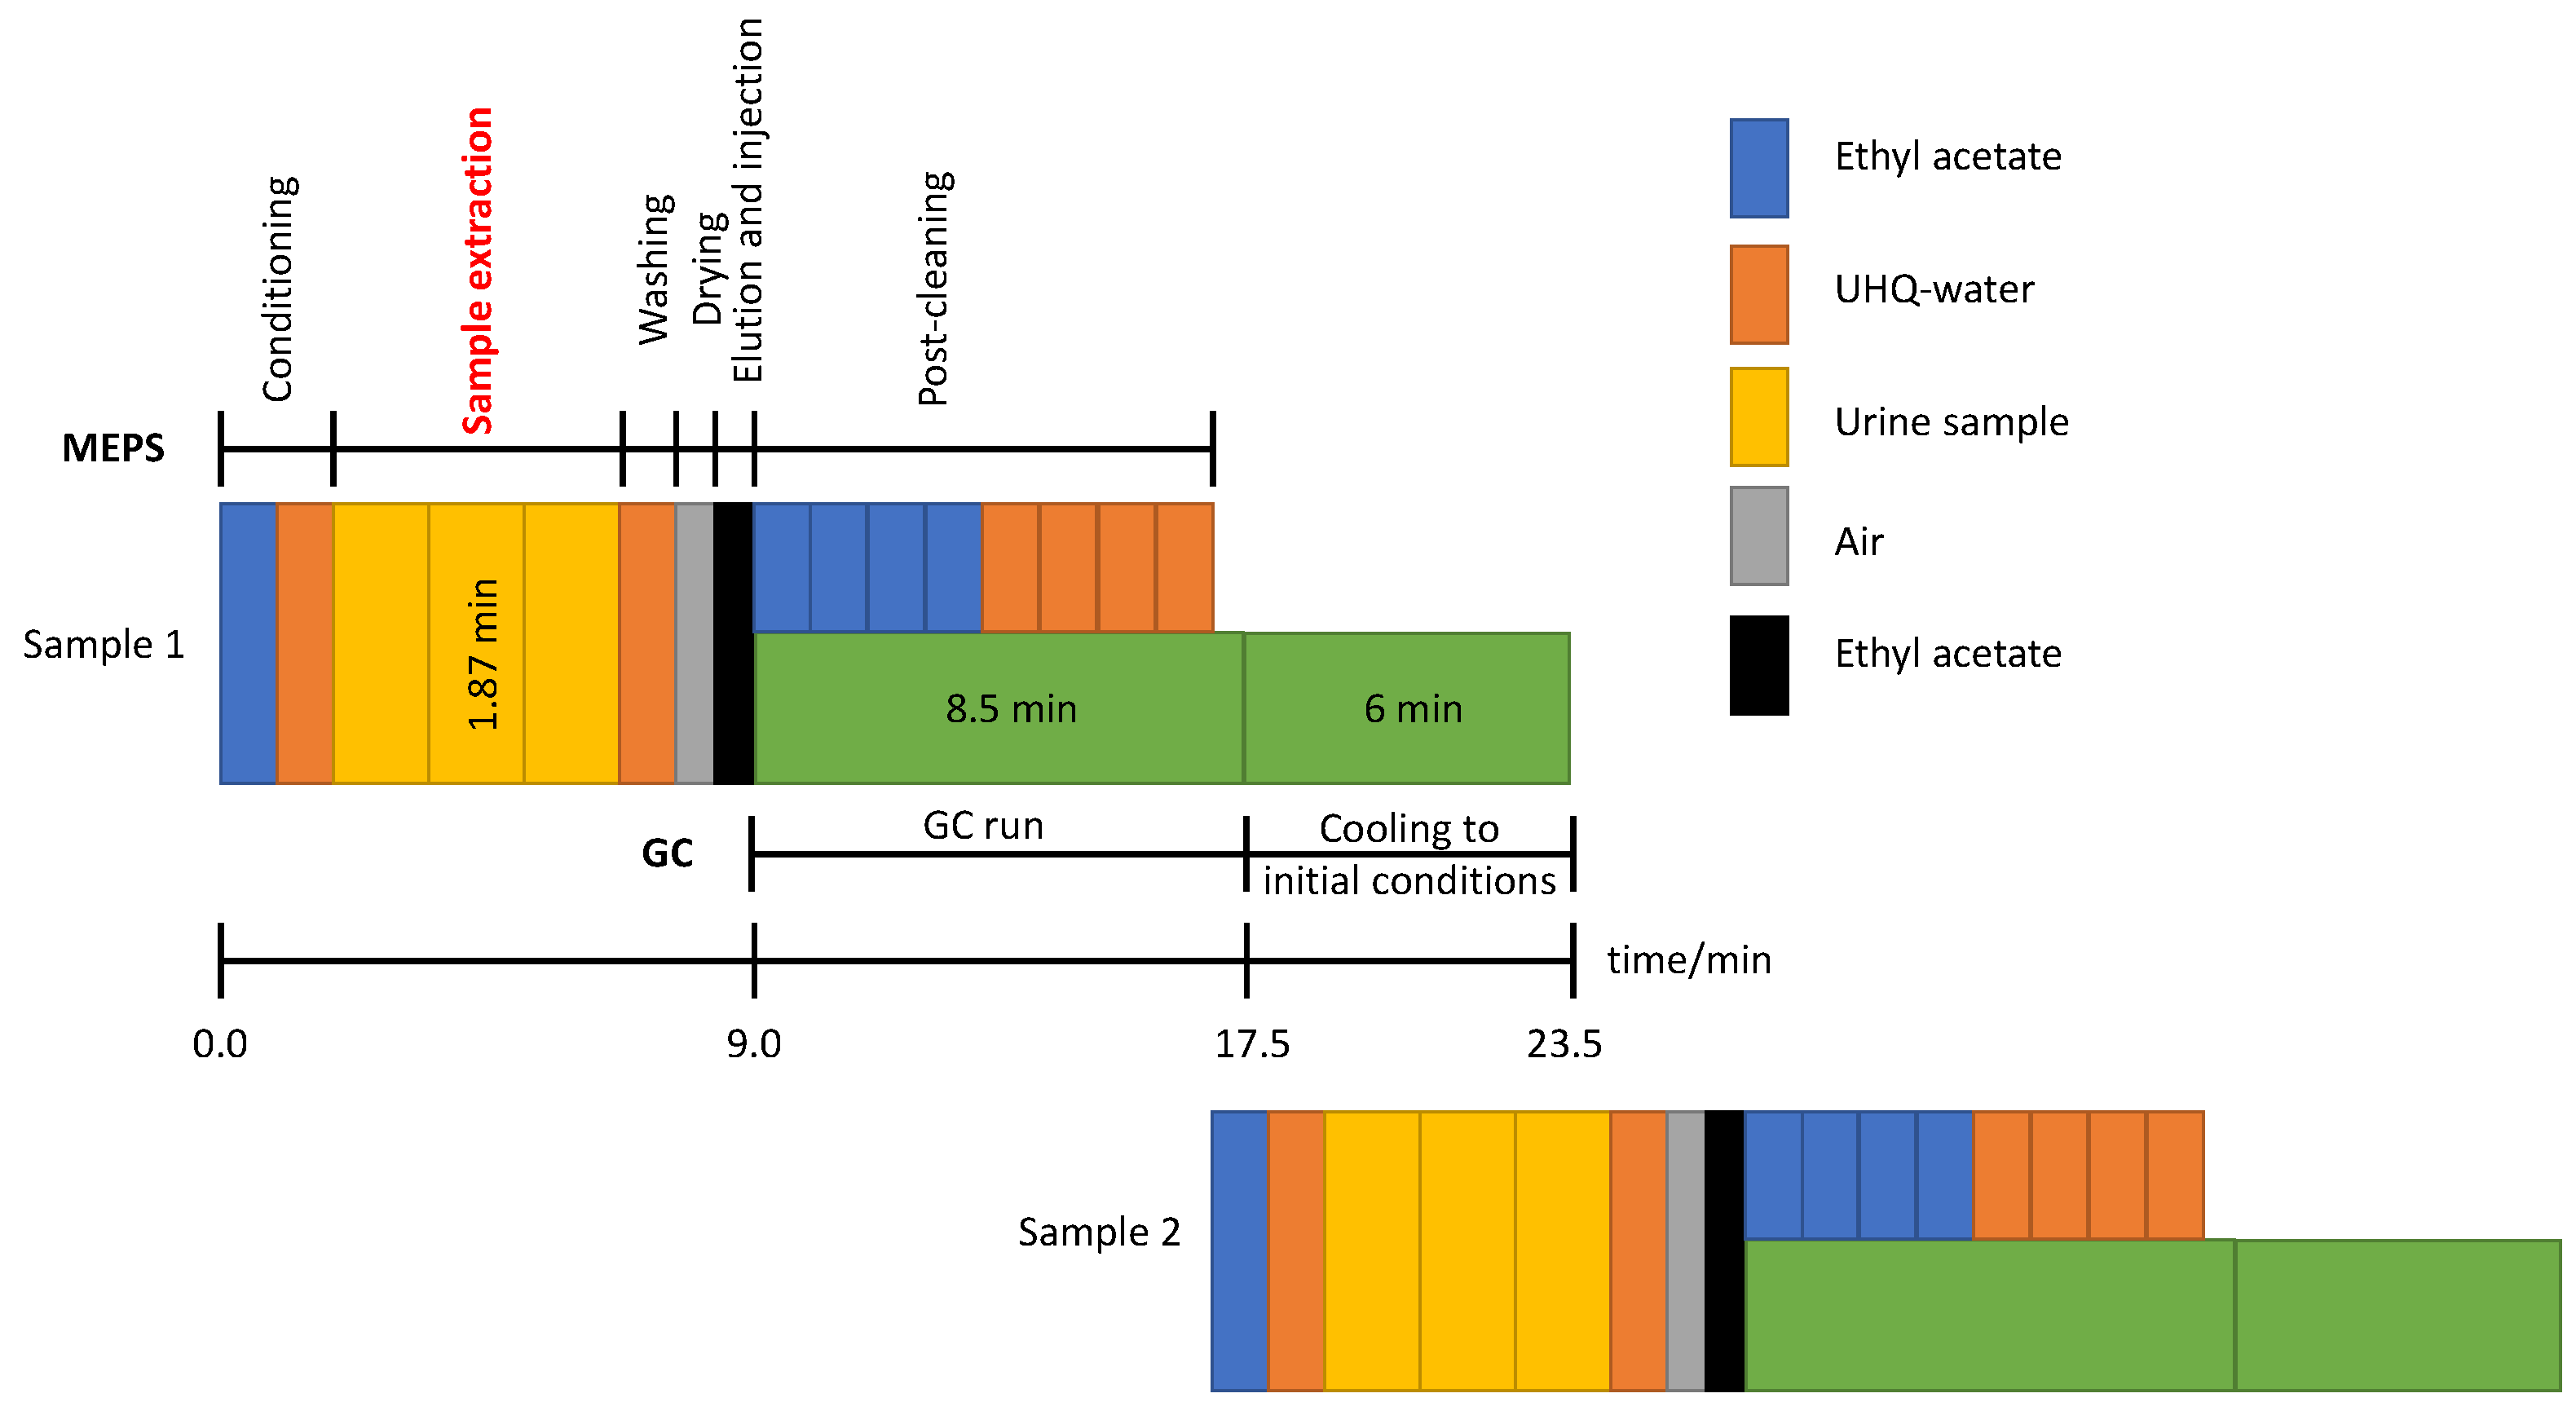
3.1. Optimization of Sample Preparation—Matrix Effect

In order to determine OH-PAHs in urine samples, these must be firstly hydrolyzed to deconjugate the corresponding glucuronide and sulfate conjugates. A procedure similar to the one described by Li et al. was followed [16]. For optimization studies, 800 µL of a urine sample spiked with 50 µL of 1-naphthol β-d-glucuronide (5 mg L−1) was used and diluted to a final volume of 1 mL with different volumes of a β-glucuronidase solution (5000 units mL−1). This way, the corresponding matrix effect from urine is still being taken into account and, due to the considerable amount of 1-NAP conjugate used for spiking, the amount of this analyte already present in the urine sample naturally would not affect the results observed.
After optimization, 0.5 units per microliter of the sample was chosen as the optimal amount of enzyme to be used. The hydrolysis was tested at different times at 37 °C, finding that after 8 hours, the process was completed, and no significant difference with 15 hours (overnight) was observed. However, we decided to keep the hydrolysis overnight to have a more reliable procedure and to ensure that all OH-PAHs conjugates are completely hydrolyzed.
Regarding a centrifugation step, no significant difference was observed between a non-spiked urine sample submitted to a centrifugation step (4500 rpm for 5 min) or not submitted, indicating that most of the analytes are present in the supernatant fraction of the sample. We decided to keep the centrifugation step to remove most of the solid particles of the urine and help with the following steps: filtration and extraction. In addition, solutions with different final pH values were tested since the MEPS cartridge best works between pH 2 and 8. Hence, pH values of 5, 6, 7, and 8 were evaluated in two different urine samples spiked with 1 µg L−1 of OH-PAHs. Depending on the urine sample, similar results are obtained for most of the analytes, but for the most polar ones such as 1-NAP or 2-NAP, smaller signals appear as the pH increases. As a compromise value, pH 7 was selected, where the best signal was obtained for all the analytes.
For filtration, Nylon, polytetrafluoroethylene (PTFE), and polyvinylidene fluoride (PVDF) were tested as filter materials (0.45 µm) using urine spiked with 1 µg L−1 of OH-PAHs. Figure 2 shows a comparison of different filter materials against a non-filtered urine sample, and, as shown, Nylon retains most of the analytes. However, PTFE and PVDF behaved similarly with more polar analytes, although PVDF greatly retained the least polar. Hence, PTFE was chosen as the filter material.
Dilution ratios of 1:2, 1:5, and 1:10 were evaluated, but none of these were able to eliminate the matrix effect. However, considering the following MEPS step, a 1:5 dilution factor was kept for urine preparation to protect the cartridge. The matrix effect was evaluated with a two-level standard addition calibration using a urine sample treated as described in Section 2.3 (that is, including filtration and dilution) and compared to a UHQ-water sample and synthetic urine [21] spiked with the same concentration level and following the same standard procedure. Table 1 shows a comparison between the slopes of the calibrations carried out in the different matrices (in this table, data for urine diluted 1:5 are shown, but similar results are obtained with dilution ratios of 1:2 or 1:10). As shown, there is a significant difference among the different matrices, proving the existence of matrix effect. Hence, a one-level standard addition method was proposed, which has been previously proven to be successful in eliminating the matrix effect [22,23].

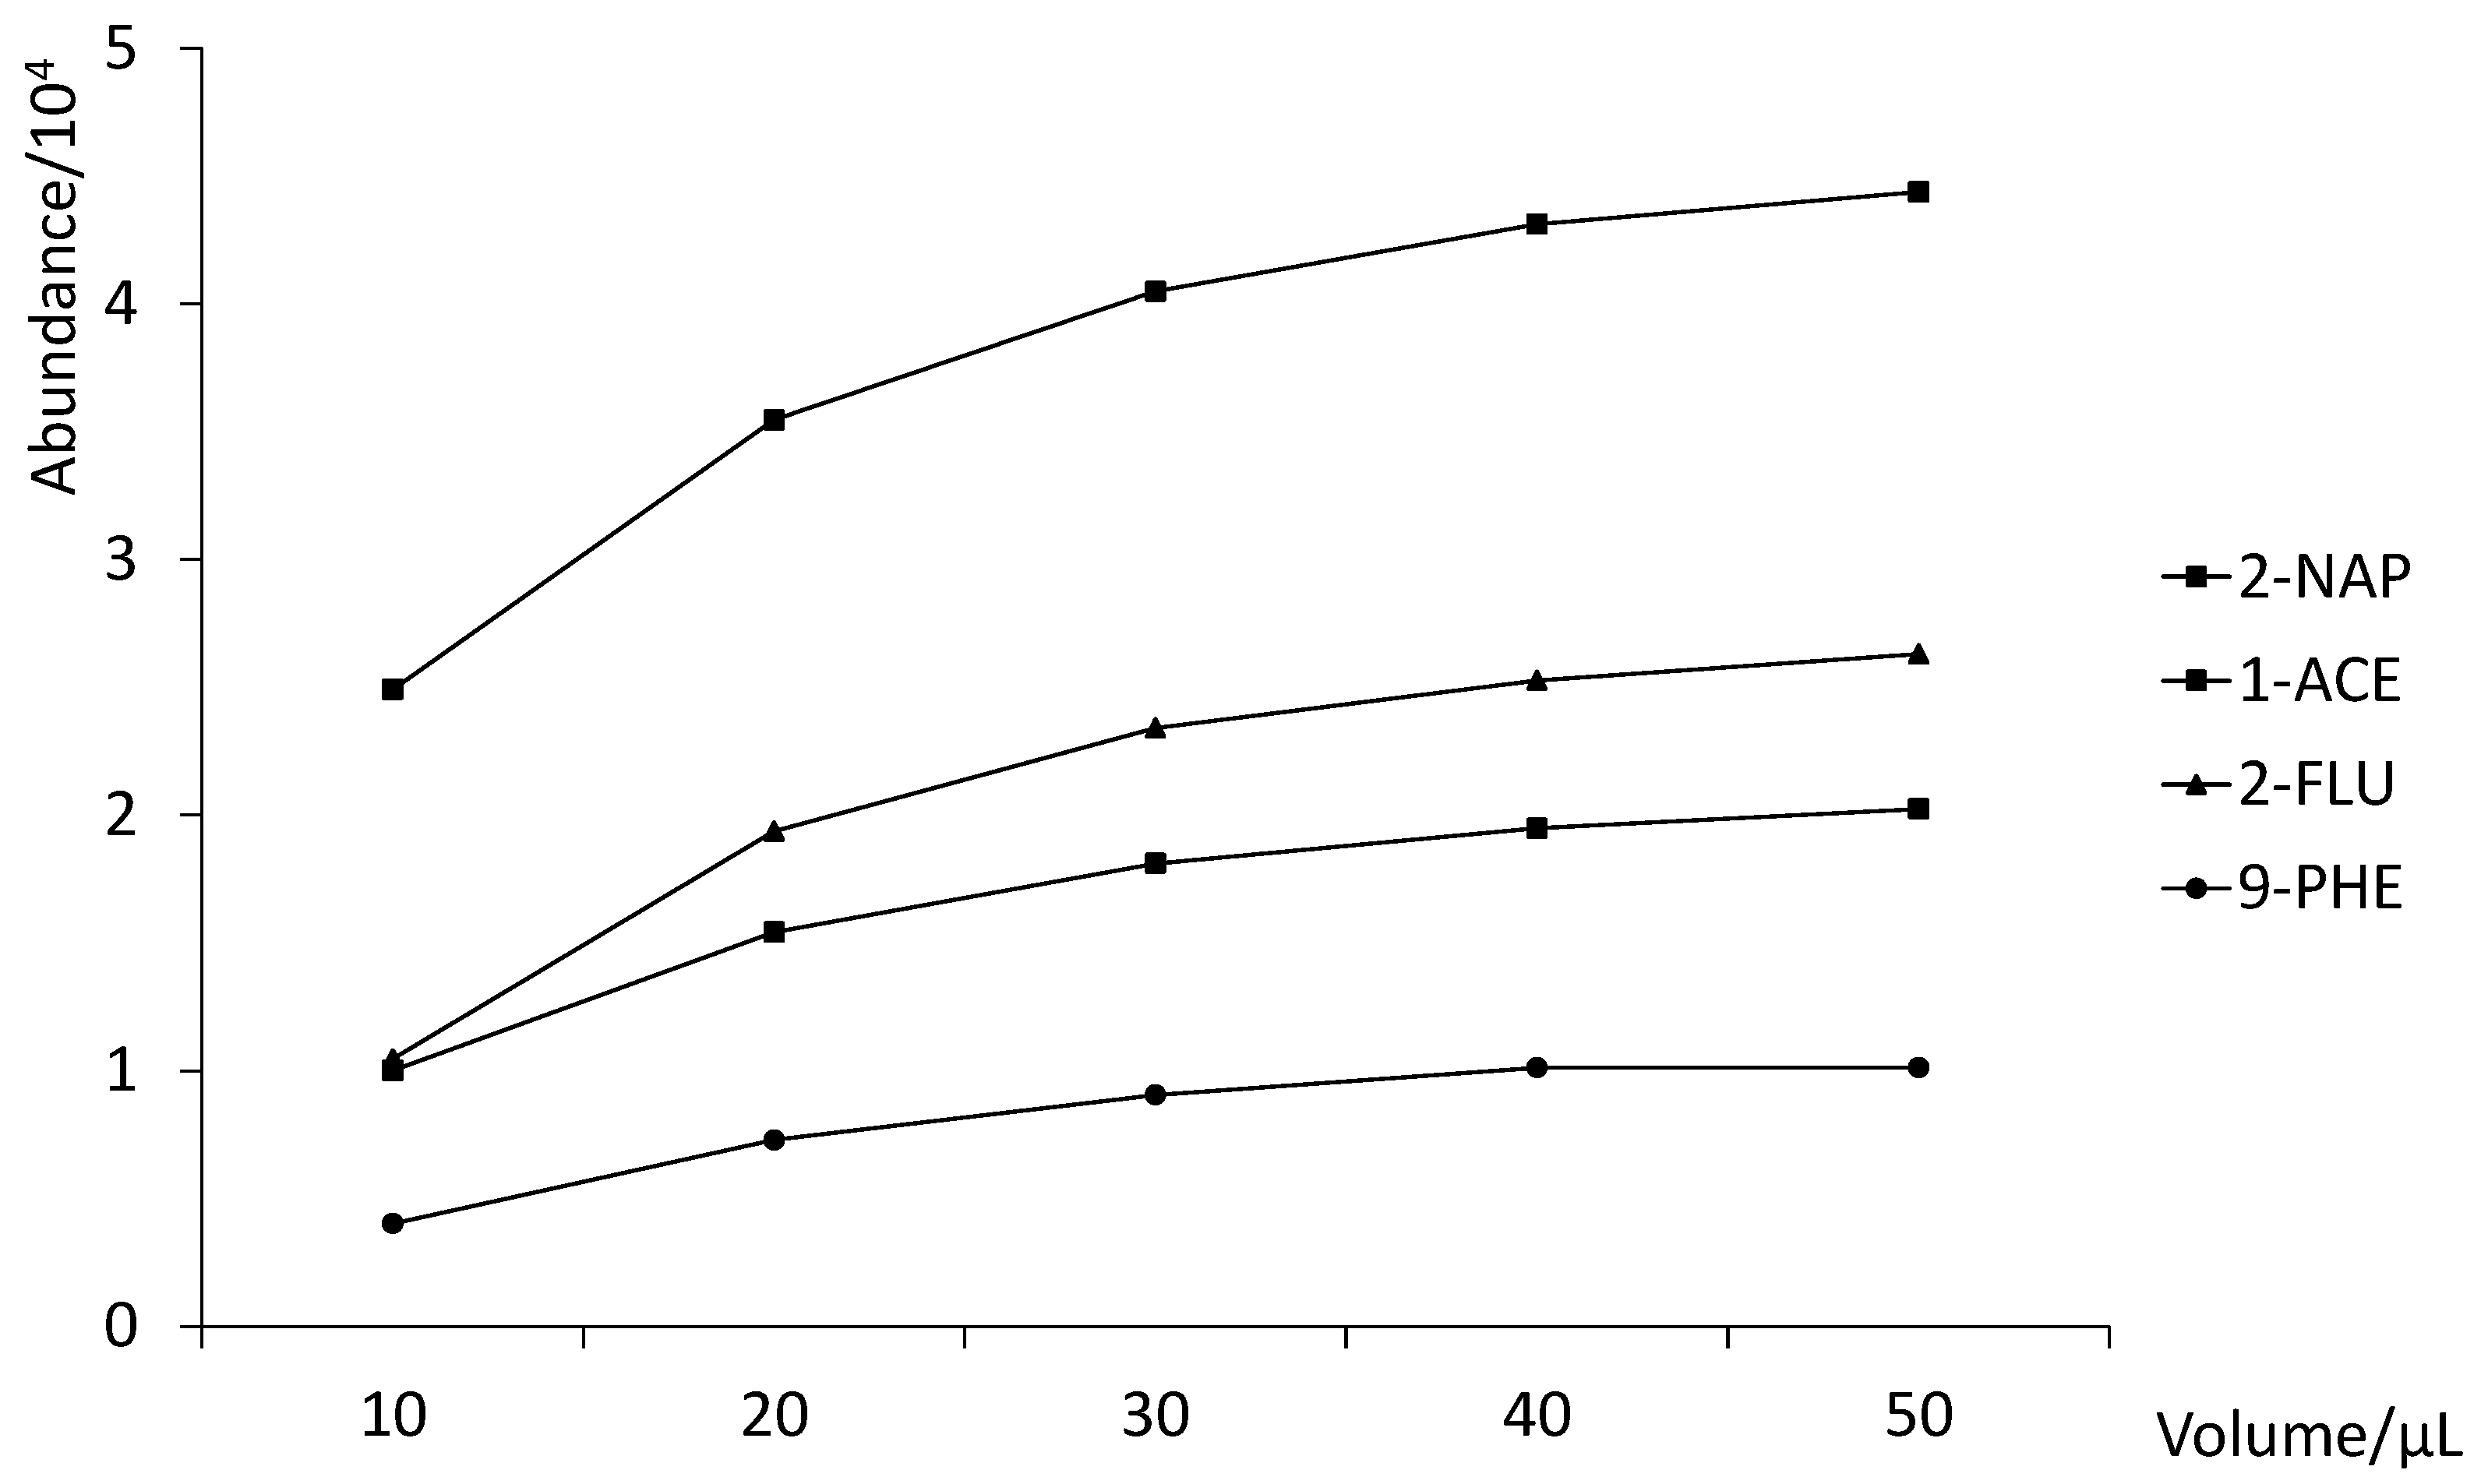
3.2. Optimization of the MEPS Procedure

For the microextraction process, loading, washing, and elution conditions were optimized as well as different dilution ratios since this can considerably affect the extraction due to the nature of the urine sample. For loading, we tested a combination of different dilution factors (1:10, 1:5, 1:2) with different numbers of extraction cycles, from 1 × 100 µL (100 µL total sampling volume) to 10 × 100 µL (1000 µL total sampling volume), using a urine sample spiked with 10 µg L−1 of OH-PAHs. It should be noted that it is expected to find different concentration levels for each analyte in the urine samples. MEPS cartridge was conditioned with 100 µL of EtOAc and 100 µL of UHQ-water using the drawing and discarding mode to load the sample. As expected, as the dilution ratio increases for a fixed number of extraction cycles, the signal for all analytes decreases. Similarly, for a fixed dilution ratio, a better signal is obtained with more extraction cycles. In considering the time needed for every extraction step and reproducibility, optimal conditions were chosen as 1:5 dilution ratio and three extraction cycles. In addition, the sampling flow rate was evaluated, and 5 µL s−1 was selected as optimum.
In order to remove all plausible interferences, a washing step is of remarkable importance. This was evaluated using a synthetic urine spiked with 1 µg L−1 of the analytes, passing different 100 µL mixtures of UHQ-water and methanol, 100:0, 90:10, 80:20, and 70:30 through the C18 cartridge. The best results were obtained with pure UHQ-water since the presence of methanol decreased the signal for most of the OH-PAHs due to higher elution force of the organic solvent. For elution, we decided to use the same solvent used previously for the determination of PAHs [18]. Hence, different volumes of ethyl acetate (10, 20, 30, 40 and 50 µL) were evaluated with an elution flow rate of 5 µL/s. As shown in Figure 3 (1-NAP and 9-FLU are not shown because their results overlap with 2-NAP and 2-FLU), 30 µL is enough to elute more than 90% of the analytes from the C18 sorbent (100% of elution was considered for 50 µL of solvent, where no significant increase of signal was observed, compared to a smaller elution volume tested).
When using MEPS for preconcentration, a common problem is typically carry-over. This was evaluated by washing four times with 100 µL of EtOAc and four times with 100 µL of UHQ-water after the elution of compounds from the C18 cartridge. In comparing chromatograms of a urine sample spiked with 1 µg L−1 of each analyte and a chromatogram from the next elution just after washing, no carry-over was detected for any of the analytes. With the conditions described, the MEPS cartridge could be reused for around 80 extractions.

3.3. PTV-GC-MS Conditions

Due to the use of MEPS for preconcentration, solvent vent injection mode was selected to remove the excess organic solvent used for elution. Vent time and flow, injection time, and PTV initial temperature (vent temperature) were the factors studied. Vent time was evaluated from 0.5 to 1.0 min, vent flow from 50 to 100 mL min−1, injection time from 2.0 to 3.0 min, PTV initial temperature from 70 to 100 °C, keeping PTV final temperature (injection temperature) at the maximum recommended by the liner manufacturer, that is, 270 °C. Optimal conditions, in terms of better signal and reproducibility, were found to be the following: vent time 0.50 min; vent flow 50 mL min−1; injection time 2.0 min; PTV initial temperature 80 °C.
Regarding gas chromatography, previous conditions used for the determination of PAHs were taken as a starting point for optimization [19]. From here, different initial temperatures (80–100 °C) and times (1.00–1.20 min) were evaluated, keeping the final temperature at 300 °C, in order to avoid column degradation since the maximum temperature recommended by the manufacturer is 325 °C. Temperature ramps used were always the maximum permitted by the system. Best results were obtained at a lower temperature, and no significant difference was observed with increasing time, so 80 °C and 1 min were selected.
For MS analysis, SIM/Scan synchronous mode was selected, evaluating different sampling rates (N = 0, 1, 2, and 4) and dwell time values (1, 10, 50, and 100 ms). The best morphology was observed with a value of N = 2. Regarding dwell times, 10 ms was chosen as optimum since it gave the best signal/noise ratio. Table 2 shows the SIM groups with the ions selected for quantitation and identification of all the analytes.

3.4. Method Validation

The proposed method was evaluated in terms of limits of detection (LOD), limits of quantitation (LOQ), linearity, repeatability (intra- and inter-day precision) and accuracy. The study was performed both on UHQ-water and urine samples.
For calibration in UHQ-water, six concentration levels were measured in triplicate, using extracted quantitation ions from SIM chromatograms to integrate areas of each analyte. For urine, a two-point standard addition method was used. As shown in Table 3 and Table 4, good linear behavior (R2 values > 0.99) was obtained. None of the calibrations was a lack of fit. Since the analytical signals were affected by the nature of the sample, both LODs and LOQs values were matrix dependent. Furthermore, none of the samples was fully free from all of the analytes; thus, LODs and LOQs were calculated for the different urine samples analyzed. Signal to noise ratio (S/N = 3 for LOD and S/N = 10 for LOQ) was used following ISO 11843-1 [24]. Table 3 and Table 4 show good LODs and LOQs values both in UHQ-water and urine (expressed as concentration range found in the different samples analyzed), in the ng L−1 or low µg L−1 range, respectively. Intra- and inter-day repeatability studies were done with UHQ-water and urine samples, both equally spiked at low (5–25 µg L−1) and high (30–90 µg L−1) concentrations levels. Intra-day repeatability was assessed by measuring one UHQ-water sample and two urine samples on the same day, four times each, while inter-day repeatability was measured by analyzing one UHQ-water sample and two urine samples, prepared each day, during 2 consecutive days, four times each. As shown, the results expressed as mean %RSD ranged from 2.1% to 23.4% in UHQ-water and from 5.1 to 19.0% in urine, which can be acceptable considering the reproducibility of the MEPS procedure. The use of internal standard did not improve the results in terms of precision. Thus, we decided not to include it in order to have a simpler sample preparation procedure. With these conditions, intra-day repeatability RSD values were kept below 10%. For recovery assessment, one UHQ-water and two urine samples were spiked at two different levels (low: 5–25 µg L−1; high: 30–90 µg L−1), and they were submitted to the standard procedure. Table 5 shows the recoveries for each analyte as percentage values calculated by comparing the areas of each chromatogram to the corresponding ones from ethyl acetate solutions spiked with the same concentrations. Good results are obtained both in UHQ-water and urine matrices.
The accuracy of the method was determined as the ratio of the found concentration to the added concentration (apparent recovery, as a percentage) in four spiked urine samples, subtracting the signals from the non-spiked, hydrolyzed samples in every case. Acceptable mean values were found between 88 and 110% (Table 6), proving the applicability to determine OH-PAHs in urine using the proposed methodology.

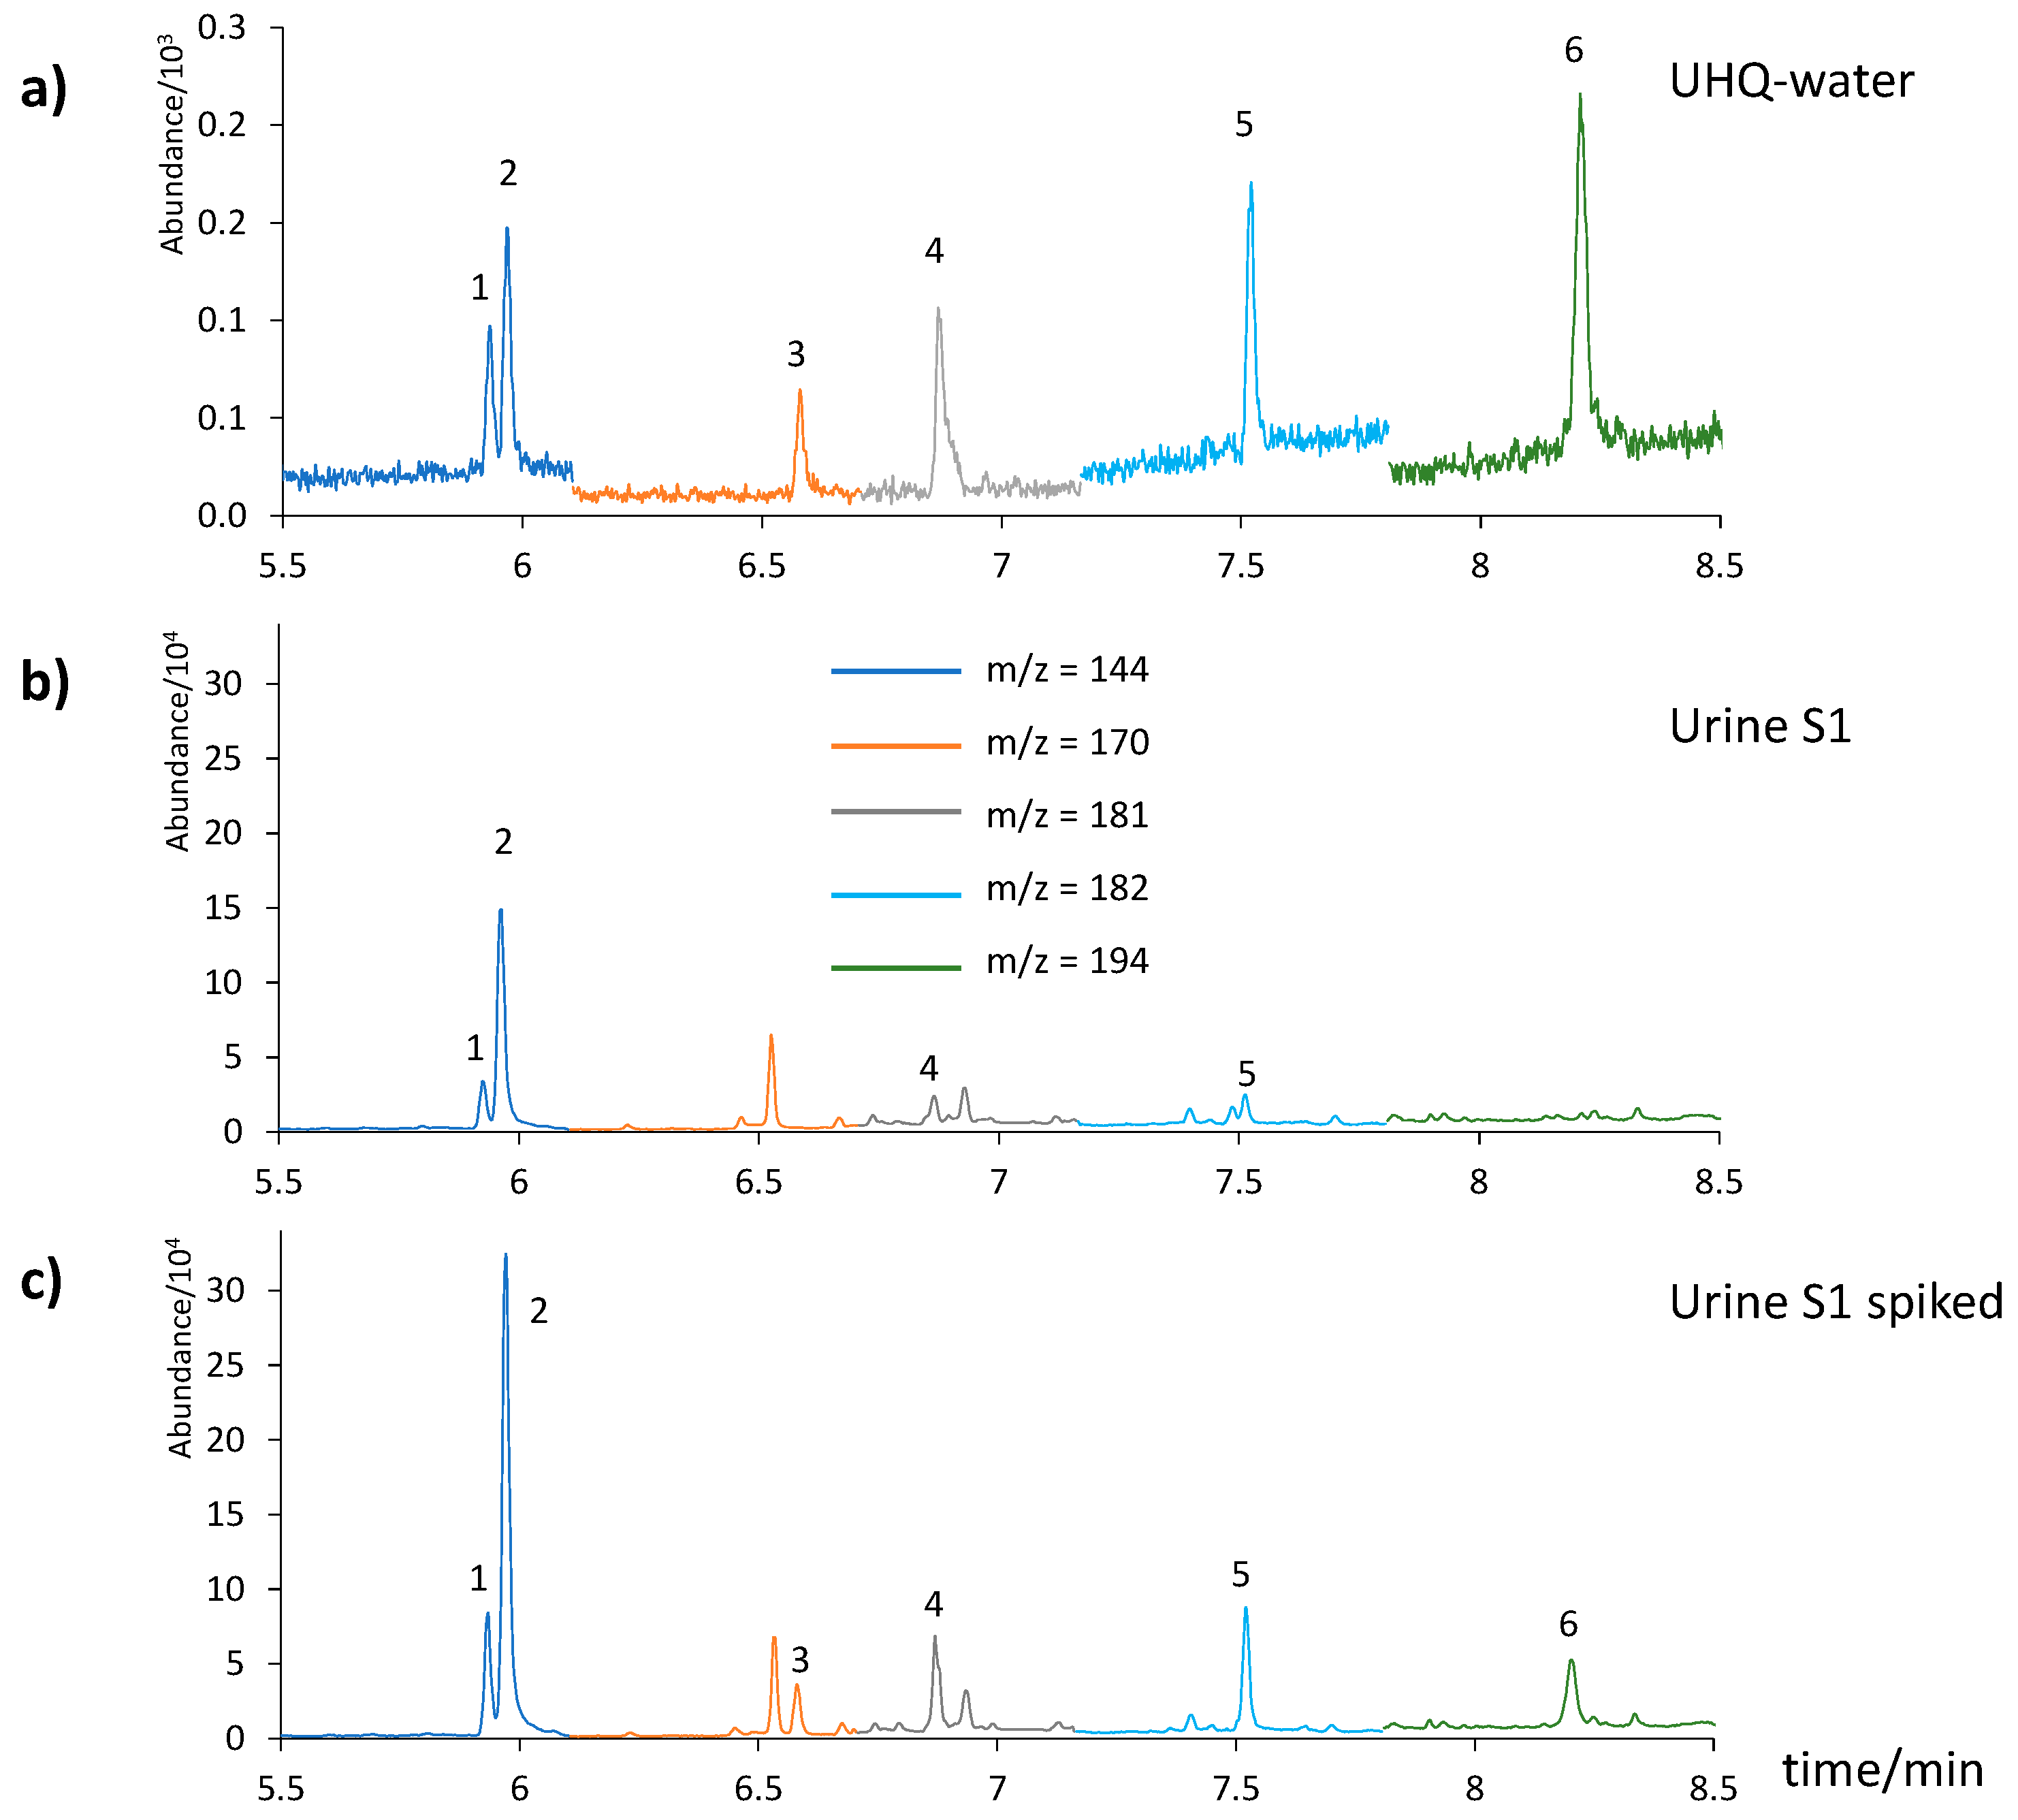
3.5. Analysis of Urine Samples

To prove the viability of our proposed method, we applied it to the analysis of six urine samples (three non-smoker and three smoker). As shown in Table 7, there is a significant difference between the smoker (S1, S2, and S3) and non-smoker subjects (S4, S5, and S6), especially for 1-NAP and 2-NAP. Only 1-NAP, 2-NAP, 2-FLU, and 9-FLU were found in the urine sample analyzed, in concentrations which were in agreement with those reported in the literature [25,26,27,28]. The other OH-PAHs were not found. Figure 4 shows the chromatograms corresponding to UHQ-water at the LOQ level in water (Figure 4a) and urine sample S1, both non-spiked (Figure 4b) and spiked (Figure 4c). Only 1-ACE and 9-PHE were not detected naturally in these urine samples. In relation to the quantitation of 2-FLU, there is an interference next to it due to a natural compound present in most of the urine samples analyzed. In any case, the maximum calculated error when integrating the corresponding area would be 15%. It is noteworthy the correlation between the values previously observed by our group and others for PAHs in saliva and the corresponding metabolites in urine. In this sense, naphthalene and fluorene derivatives were observed again as major components, and acenaphthylene derivative was not detected [29,30].

3.6. Comparison with Other Works

Most methods for the determination of OH-PAHs in urine require a derivatization step prior to analysis with gas chromatography, and only two publications can be found in the literature where this step is avoided [10,20]. In one case, extraction is performed by immersing an SPME fiber in the sample for 45 min plus 3 min more for desorption, with a GC run lasting more than 17 min. Our procedure is short and only takes 9 min for the MEPS procedure (initial conditioning with EtOAc and UHQ-water, 3 extractions, washing off interferents and drying). Thanks to the automatic robot used, it allows performing reconditioning of the cartridge and loading of the next sample while the chromatographic separation is run, saving extra time and allowing to measure three samples per hour, being the fastest method described yet, with no derivatization. The chromatographic run time only takes 8.5 min and allows the determination of up to six different analytes, including isomers such as 1-NAP and 2-NAP or 2-FLU and 9-FLU. In the second literature reference, SPME is also used to extract the analytes, which are introduced into a triple quadrupole/linear ion trap mass spectrometer using electrospray ionization. This work reports the determination of five OH-PAHs, but no structural isomers can be determined since there is no chromatographic separation.
Comparing our method to those based on LC-MS/MS, which are the most sensitive methods found in the present literature [13,17,31], our performance in urine is similar in terms of accuracy, precision, and chromatographic runtime. Although our LODs are not as low, they are still in the range of the ng mL−1, except for 9-PHE. Furthermore, many of the LC-MS/MS methods have a manual sample preparation, which is time consuming. Compared to these, our method is fully automated, making the sample preparation easier and faster.

4. Conclusions

In this work, we present the first method for the determination of 6 hydroxy metabolites of polycyclic aromatic hydrocarbons in urine without derivatization, using a fully automated MEPS procedure coupled with a gas chromatograph-mass spectrometer. This methodology presents good LODs and LOQs, accuracy and precision and allows the analysis of several samples per hour, proving to be the fastest method to determine these analytes in urine compared to other works, to the best of our knowledge. In order to prove its validity, it has been applied to six urine samples from both smokers and non-smokers, showing a significant difference between these subjects, especially for the concentration of naphthalene derivatives. The results are in agreement with those reported previously by our and other research groups and prove the applicability of the proposed methodology.

Author Contributions

Conceptualization, J.P., M.d.N.S., A.M.C.-F. and J.L.P.P.; methodology, J.P., M.d.N.S., A.M.C.-F. and J.L.P.P.; validation, S.G.-G., H.M.-G. and J.P.; formal analysis, S.G.-G., H.M.-G. and J.P.; investigation, S.G.-G., H.M.-G., J.P., M.d.N.S., A.M.C.-F. and J.L.P.P.; writing—original draft preparation, J.P., M.d.N.S. and A.M.C.-F.; writing—review and editing, J.P., M.d.N.S. and A.M.C.-F.; supervision, J.L.P.P.; project administration, J.L.P.P.; funding acquisition, J.P. and J.L.P.P. All authors have read and agreed to the published version of the manuscript.

Funding

This work was supported by the Junta de Castilla y León (Project SA111P20, J.L.P.P.) and the Samuel Solórzano Foundation (FS/1-2021, J.P.).

Institutional Review Board Statement

Not applicable.

Informed Consent Statement

Informed consent was obtained from all subjects involved in the study.

Data Availability Statement

The data presented in this study are available on request from the corresponding author.

Conflicts of Interest

The authors declare no conflict of interest.

References

  1. Kim, K.H.; Jahan, S.A.; Kabir, E.; Brown, R.J. A review of airborne polycyclic aromatic hydrocarbons (PAHs) and their human health effects. Environ. Int. 2013, 60, 71–80. [Google Scholar] [CrossRef] [PubMed]
  2. Abbas, I.; Badran, G.; Verdin, A.; Ledoux, F.; Roumié, M.; Courcot, D.; Garçon, G. Polycyclic aromatic hydrocarbon derivatives in airborne particulate matter: Sources, analysis and toxicity. Environ. Chem. Lett. 2018, 16, 439–475. [Google Scholar] [CrossRef]
  3. Moazzen, M.; Ahmadkhaniha, R.; Gorji, M.E.; Yunesian, M.; Rastkari, N. Magnetic solid-phase extraction based on magnetic multi-walled carbon nanotubes for the determination of polycyclic aromatic hydrocarbons in grilled meat samples. Talanta 2013, 115, 957–965. [Google Scholar] [CrossRef] [PubMed]
  4. Jacob, J.; Seidel, A. Biomonitoring of polycyclic aromatic hydrocarbons in human urine. J. Chromatogr. B Analyt. Technol. Biomed. Life Sci. 2002, 778, 31–47. [Google Scholar] [CrossRef]
  5. Romanoff, L.C.; Li, Z.; Young, K.J.; Blakely, N.C.; Patterson, D.G.; Sandau, C.D. Automated solid-phase extraction method for measuring urinary polycyclic aromatic hydrocarbon metabolites in human biomonitoring using isotope-dilution gas chromatography high-resolution mass spectrometry. J. Chromatogr. B 2006, 835, 47–54. [Google Scholar] [CrossRef]
  6. Gao, Y.; Li, L.; Zhang, X.; Wang, X.; Ji, W.; Zhao, J.; Ozaki, Y. CTAB-triggered Ag aggregates for reproducible SERS analysis of urinary polycyclic aromatic hydrocarbon metabolites. Chem. Commun. 2019, 55, 2146–2149. [Google Scholar] [CrossRef] [PubMed]
  7. Marie-Desvergne, C.; Maitre, A.; Bouchard, M.; Ravanat, J.L.; Viau, C. Evaluation of DNA adducts, DNA and RNA oxidative lesions, and 3-hydroxybenzo(a)pyrene as biomarkers of DNA damage in lung following intravenous injection of the parent compound in rats. Chem. Res. Toxicol. 2010, 23, 1207–1214. [Google Scholar] [CrossRef] [PubMed]
  8. Grova, N.; Fays, F.; Hardy, E.M.; Appenzeller, B.M.R. New insights into urine-based assessment of polycyclic aromatic hydrocarbon-exposure from a rat model: Identification of relevant metabolites and influence of elimination kinetics. Environ. Pollut. 2017, 228, 484–495. [Google Scholar] [CrossRef] [PubMed]
  9. Xue, J.; Lai, Y.; Liu, C.W.; Ru, H. Towards Mass Spectrometry-Based Chemical Exposome: Current Approaches, Challenges, and Future Directions. Toxics 2019, 7, 41. [Google Scholar] [CrossRef] [PubMed] [Green Version]
  10. Liu, L.; Luo, Y.; Bi, J.; Li, H.; Lin, J.-M. Quantification of selected monohydroxy metabolites of polycyclic aromatic hydrocarbons in human urine. Sci. China Chem. 2015, 58, 1579–1584. [Google Scholar] [CrossRef]
  11. Diaz de Leon-Martinez, L.; Flores-Ramirez, R.; Rodriguez-Aguilar, M.; Berumen-Rodriguez, A.; Perez-Vazquez, F.J.; Diaz-Barriga, F. Analysis of urinary metabolites of polycyclic aromatic hydrocarbons in precarious workers of highly exposed occupational scenarios in Mexico. Environ. Sci. Pollut. Res. Int. 2021, 28, 23087–23098. [Google Scholar] [CrossRef] [PubMed]
  12. Woudneh, M.B.; Benskin, J.P.; Grace, R.; Hamilton, M.C.; Magee, B.H.; Hoeger, G.C.; Forsberg, N.D.; Cosgrove, J.R. Quantitative determination of hydroxy polycylic aromatic hydrocarbons as a biomarker of exposure to carcinogenic polycyclic aromatic hydrocarbons. J. Chromatogr. A 2016, 1454, 93–100. [Google Scholar] [CrossRef] [PubMed]
  13. Sun, L.; Zhu, S.; Zheng, Z.; Sun, J.; Zhao, X.E.; Liu, H. 9-Plex ultra high performance liquid chromatography tandem mass spectrometry determination of free hydroxyl polycyclic aromatic hydrocarbons in human plasma and urine. J. Chromatogr. A 2020, 1623, 461182. [Google Scholar] [CrossRef] [PubMed]
  14. Shi, Y.; Huang, S.; Kuang, Y.; Chen, Z.; Guo, J.; Cui, S.; Zheng, J.; Ouyang, G. Facile fabrication of composited solid phase microextraction thin membranes for sensitive detections of trace hydroxylated polycyclic aromatic hydrocarbons in human urine. Anal. Chim. Acta 2021, 1158, 338422. [Google Scholar] [CrossRef]
  15. Luo, K.; Gao, Q.; Hu, J. Derivatization method for sensitive determination of 3-hydroxybenzo[a]pyrene in human urine by liquid chromatography-electrospray tandem mass spectrometry. J. Chromatogr. A 2015, 1379, 51–55. [Google Scholar] [CrossRef]
  16. Li, Z.; Romanoff, L.C.; Trinidad, D.A.; Hussain, N.; Jones, R.S.; Porter, E.N.; Patterson, D.G., Jr.; Sjodin, A. Measurement of urinary monohydroxy polycyclic aromatic hydrocarbons using automated liquid-liquid extraction and gas chromatography/isotope dilution high-resolution mass spectrometry. Anal. Chem. 2006, 78, 5744–5751. [Google Scholar] [CrossRef] [PubMed]
  17. Santos, P.M.; del Nogal Sánchez, M.; Pavón, J.L.P.; Cordero, B.M. Determination of polycyclic aromatic hydrocarbons in human biological samples: A critical review. TrAC Trends Anal. Chem. 2019, 113, 194–209. [Google Scholar] [CrossRef]
  18. Martín Santos, P.; Jiménez Carracedo, C.; del Nogal Sánchez, M.; Pérez Pavón, J.L.; Moreno Cordero, B. A sensitive and automatic method based on microextraction by packed sorbents for the determination of polycyclic aromatic hydrocarbons in saliva samples. Microchem. J. 2020, 152, 104274. [Google Scholar] [CrossRef]
  19. Martín Santos, P.; del Nogal Sánchez, M.; Pérez Pavón, J.L.; Moreno Cordero, B. Quantitative and qualitative analysis of polycyclic aromatic hydrocarbons in urine samples using a non-separative method based on mass spectrometry. Talanta 2018, 181, 373–379. [Google Scholar] [CrossRef]
  20. Yang, B.C.; Fang, S.F.; Wan, X.J.; Luo, Y.; Zhou, J.Y.; Li, Y.; Li, Y.J.; Wang, F.; Huang, O.P. Quantification of monohydroxylated polycyclic aromatic hydrocarbons in human urine samples using solid-phase microextraction coupled with glass-capillary nanoelectrospray ionization mass spectrometry. Anal. Chim. Acta 2017, 973, 68–74. [Google Scholar] [CrossRef]
  21. van de Merbel, N.C. Quantitative determination of endogenous compounds in biological samples using chromatographic techniques. TrAC Trends Anal. Chem. 2008, 27, 924–933. [Google Scholar] [CrossRef]
  22. Gonzalez Paredes, R.M.; Garcia Pinto, C.; Perez Pavon, J.L.; Moreno Cordero, B. Derivatization coupled to headspace programmed-temperature vaporizer gas chromatography with mass spectrometry for the determination of amino acids: Application to urine samples. J. Sep. Sci. 2016, 39, 3375–3383. [Google Scholar] [CrossRef] [PubMed]
  23. Cuadros-Rodriguez, L.; Bagur-Gonzalez, M.G.; Sanchez-Vinas, M.; Gonzalez-Casado, A.; Gomez-Saez, A.M. Principles of analytical calibration/quantification for the separation sciences. J. Chromatogr. A 2007, 1158, 33–46. [Google Scholar] [CrossRef]
  24. Krupcik, J.; Majek, P.; Gorovenko, R.; Blasko, J.; Kubinec, R.; Sandra, P. Considerations on the determination of the limit of detection and the limit of quantification in one-dimensional and comprehensive two-dimensional gas chromatography. J. Chromatogr. A 2015, 1396, 117–130. [Google Scholar] [CrossRef]
  25. Wilhelm, M.; Hardt, J.; Schulz, C.; Angerer, J.; Human Biomonitoring Commission of the German Federal Environment Agency. New reference value and the background exposure for the PAH metabolites 1-hydroxypyrene and 1- and 2-naphthol in urine of the general population in Germany: Basis for validation of human biomonitoring data in environmental medicine. Int. J. Hyg. Environ. Health 2008, 211, 447–453. [Google Scholar] [CrossRef]
  26. Shang, T.; Zhao, L.-J.; Li, P.; Zeng, X.-Y.; Yu, Z.-Q. Determination of Ten Kinds of Monohydroxylated Polycyclic Aromatic Hydrocarbons in Human Urine by Supported Liquid Extraction Followed by Liquid Chromatography-Tandem Mass Spectrometry. Chin. J. Anal. Chem. 2019, 47, 876–882. [Google Scholar] [CrossRef]
  27. Fan, R.; Wang, D.; Ramage, R.; She, J. Fast and simultaneous determination of urinary 8-hydroxy-2’-deoxyguanosine and ten monohydroxylated polycyclic aromatic hydrocarbons by liquid chromatography/tandem mass spectrometry. Chem. Res. Toxicol. 2012, 25, 491–499. [Google Scholar] [CrossRef]
  28. Nguyen, K.; Pitiranggon, M.; Wu, H.C.; John, E.M.; Santella, R.M.; Terry, M.B.; Yan, B. Improvement on recovery and reproducibility for quantifying urinary mono-hydroxylated polycyclic aromatic hydrocarbons (OH-PAHs). J. Chromatogr. B Analyt. Technol. Biomed. Life Sci. 2022, 1192, 123113. [Google Scholar] [CrossRef]
  29. Peña, J.; Fernández Laespada, M.E.; García Pinto, C.; Pérez Pavón, J.L. Multiple headspace sampling coupled to a programmed temperature vaporizer—Gas chromatograph-mass spectrometer for the determination of polycyclic aromatic hydrocarbons in water and saliva. Microchem. J. 2021, 161, 105822. [Google Scholar] [CrossRef]
  30. Martín Santos, P.; Campo, L.; Olgiati, L.; Polledri, E.; del Nogal Sánchez, M.; Fustinoni, S. Development of a method to profile 2- to 4-ring polycyclic aromatic hydrocarbons in saliva samples from smokers and non-smokers by headspace-solid-phase microextraction-gas chromatography-triple quadrupole tandem mass spectrometry. J. Chromatogr. B 2020, 1152, 122273. [Google Scholar] [CrossRef]
  31. Hua, L.; Guo, S.; Wang, Y.; Sun, H.; Zhao, H. Simultaneous determination of multiple isomeric hydroxylated polycyclic aromatic hydrocarbons in urine by using ultra-high performance liquid chromatography tandem mass spectrometry. J. Chromatogr. B 2021, 1184, 122983. [Google Scholar] [CrossRef]
Figure 1. Scheme of the MEPS steps for two consecutive samples.
Ijerph 19 13089 g001
Figure 2. Test of filter materials.
Ijerph 19 13089 g002
Figure 3. Optimization of MEPS elution solvent volume.
Ijerph 19 13089 g003
Figure 4. Chromatograms of UHQ-water spiked at the LOQ level in water (a), compared to a urine sample analyzed (S1), non-spiked (b) and spiked (c). 1= 1-NAP, 2 = 2-NAP, 3 = 1-ACE, 4 = 9-FLU, 5 = 2-FLU, 6 = 9-PHE.
Ijerph 19 13089 g004
Table 1. Comparison of the slopes found for the linear equations obtained with UHQ-water, synthetic urine, and three urine samples from subjects S1, S2, and S6.
AnalyteUHQ-WaterSynthetic UrineS1S2S6
1-NAP42.0 ± 0.835 ± 158 ± 250 ± 227 ± 8
2-NAP75 ± 266 ± 3111 ± 6106 ± 3143 ± 9
1-ACE48 ± 242 ± 267 ± 373 ± 257 ± 6
9-FLU57 ± 248 ± 294 ± 3104 ± 4124 ± 5
2-FLU72 ± 263 ± 394 ± 798 ± 5102 ± 2
9-PHE44 ± 227 ± 116 ± 214 ± 519 ± 3
For concentration ranges in each matrix please, see Section 3.4.
Table 2. Retention times, selected ions for quantification (in bold) and identification of OH-PAHs including internal standard, and SIM groups used.
CompoundtR/minQuantifier and Qualifier IonsSIM Group
1-NAP5.89144, 115, 1161
2-NAP5.93144, 115, 116
1-ACE6.56170, 169, 1522
9-FLU6.85181, 182, 1523
2-FLU7.48182, 181, 152
9-PHE8.16194, 165, 1664
Table 3. Analytical characteristics of the proposed method for OH-PAHs in UHQ-water.
CompoundCalibration Range (ng L−1)Linear EquationR2LOD (ng L−1)LOQ (ng L−1)Intra-Day Repeatability (RSD, %)Inter-Day Repeatability (RSD, %)
Low Level aHigh Level bLow Level aHigh Level b
1-NAPLOQ-800y = (42 ± 1) x + (2 ± 3) 1020.998514.949.79.74.923.48.3
2-NAPLOQ-500y = (75 ± 2) x + (0 ± 6) 1020.995611.638.77.14.313.34.9
1-ACELOQ-1200y = (48 ± 2) x − (0 ± 1) 1030.993014.648.65.72.713.03.3
9-FLULOQ-1200y = (57 ± 2) x + (0 ± 1) 1030.995710.133.65.92.111.96.0
2-FLULOQ-1200y = (72 ± 2) x − (0 ± 1) 1030.995410.836.09.04.512.011.5
9-PHELOQ-18000y = (44 ± 2) x − (0 ± 1) 1040.993239.6132.29.25.710.814.3
a Concentrations in level LOW: 1-NAP, 2-NAP, 1-ACE, 9-FLU, 2-FLU: 5 µg L−1; 9-PHE: 25 µg L−1; b Concentrations in level HIGH: 1-NAP, 2-NAP, 1-ACE, 9-FLU, 2-FLU: 60 µg L−1; 9-PHE: 90 µg L−1.
Table 4. Analytical characteristics of the proposed method for OH-PAHs in urine.
CompoundCalibration Range (µg L−1)R2LOD *
(µg L−1)
LOQ *
(µg L−1)
Intra-Day Repeatability (RSD, %)Inter-Day Repeatability (RSD, %)
Low Level aHigh Level bLow Level aHigh Level b
1-NAPLOQ-620.99770.6–4.42.2–14.77.08.512.77.6
2-NAPLOQ-3750.99890.7–2.62.3–8.56.34.811.19.4
1-ACELOQ-620.99470.7–7.32.2–24.06.05.110.69.6
9-FLULOQ-750.99550.7–5.42.2–18.35.83.711.810.3
2-FLULOQ-600.99900.5–2.11.5–7.05.76.319.014.9
9-PHELOQ-1250.99396.1–19.420.6–65.67.96.514.78.9
* LOD and LOQ values expressed as concentration range found in the different samples analyzed; a Concentrations in level LOW: 1-NAP, 2-NAP, 1-ACE, 9-FLU, 2-FLU: 5 µg L−1; 9-PHE: 25 µg L−1; b Concentrations in level HIGH: 1-NAP, 2-NAP, 1-ACE, 9-FLU, 2-FLU: 60 µg L−1; 9-PHE: 90 µg L−1.
Table 5. Mean recovery values (%) obtained in UHQ-water and two different spiked urine samples (S4 and S6).
CompoundUHQ-WaterS4S6
Low Level aHigh Level b Low Level aHigh Level bLow Level aHigh Level b
1-NAP978979786864
2-NAP787452604952
1-ACE525943523641
9-FLU666457635153
2-FLU688157755162
9-PHE487015171115
a Concentrations in level LOW: 1-NAP, 2-NAP, 1-ACE, 9-FLU, 2-FLU: 5 µg L−1; 9-PHE: 25 µg L−1; b Concentrations in level HIGH: 1-NAP, 2-NAP, 1-ACE, 9-FLU, 2-FLU: 60 µg L−1; 9-PHE: 90 µg L−1.
Table 6. Mean accuracy values (%) obtained for four different spiked urine samples.
CompoundAdded Concentration (µg L−1)Found Concentration (µg L−1)Accuracy (%)
1-NAP3.23.1 ± 0.297
2-NAP9.99 ± 191
1-ACE3.22.8 ± 0.288
9-FLU21.8 ± 0.190
2-FLU2.12.1 ± 0.1100
9-PHE10.011 ± 3110
Table 7. Found concentrations in µg L−1 of four of the six OH-PAHs in six urine samples collected from exposed (S1, S2, and S3) and non-exposed volunteers (S4, S5, and S6). 1-ACE and 9-PHE were found below of detection limits of the method in all samples.
Subject1-NAP2-NAP9-FLU2-FLU
S117.7 ± 0.956 ± 53.8 ± 0.74.2 ± 0.5
S26 ± 237 ± 6ND4.3 ± 0.4
S313 ± 352 ± 97 ± 23 ± 2
S47 ± 19 ± 2ND<LOQ
S5<LOQ14 ± 33.2 ± 0.5ND
S6ND20 ± 3NDND
ND = Not detected.
Publisher’s Note: MDPI stays neutral with regard to jurisdictional claims in published maps and institutional affiliations.

