
Using Decision Trees to Examine Environmental and Behavioural Factors Associated with Youth Anxiety, Depression, and Flourishing
 , ,
, ,
Abstract
:1. Introduction
2. Materials and Methods
2.1. Study Design and Sample
2.2. Measures
2.2.1. Compass Student Questionnaire
2.2.2. Mental Health Outcome Measures
2.2.3. Predictor Measures
Demographics
Weight Status and Perception
Diet and Eating Behaviours
Movement Behaviours
Substance Use
Bullying and Academics
School Connectedness
Social Support
2.2.4. School-Level Census Data
2.3. Analysis
3. Results
3.1. Sample Characteristics
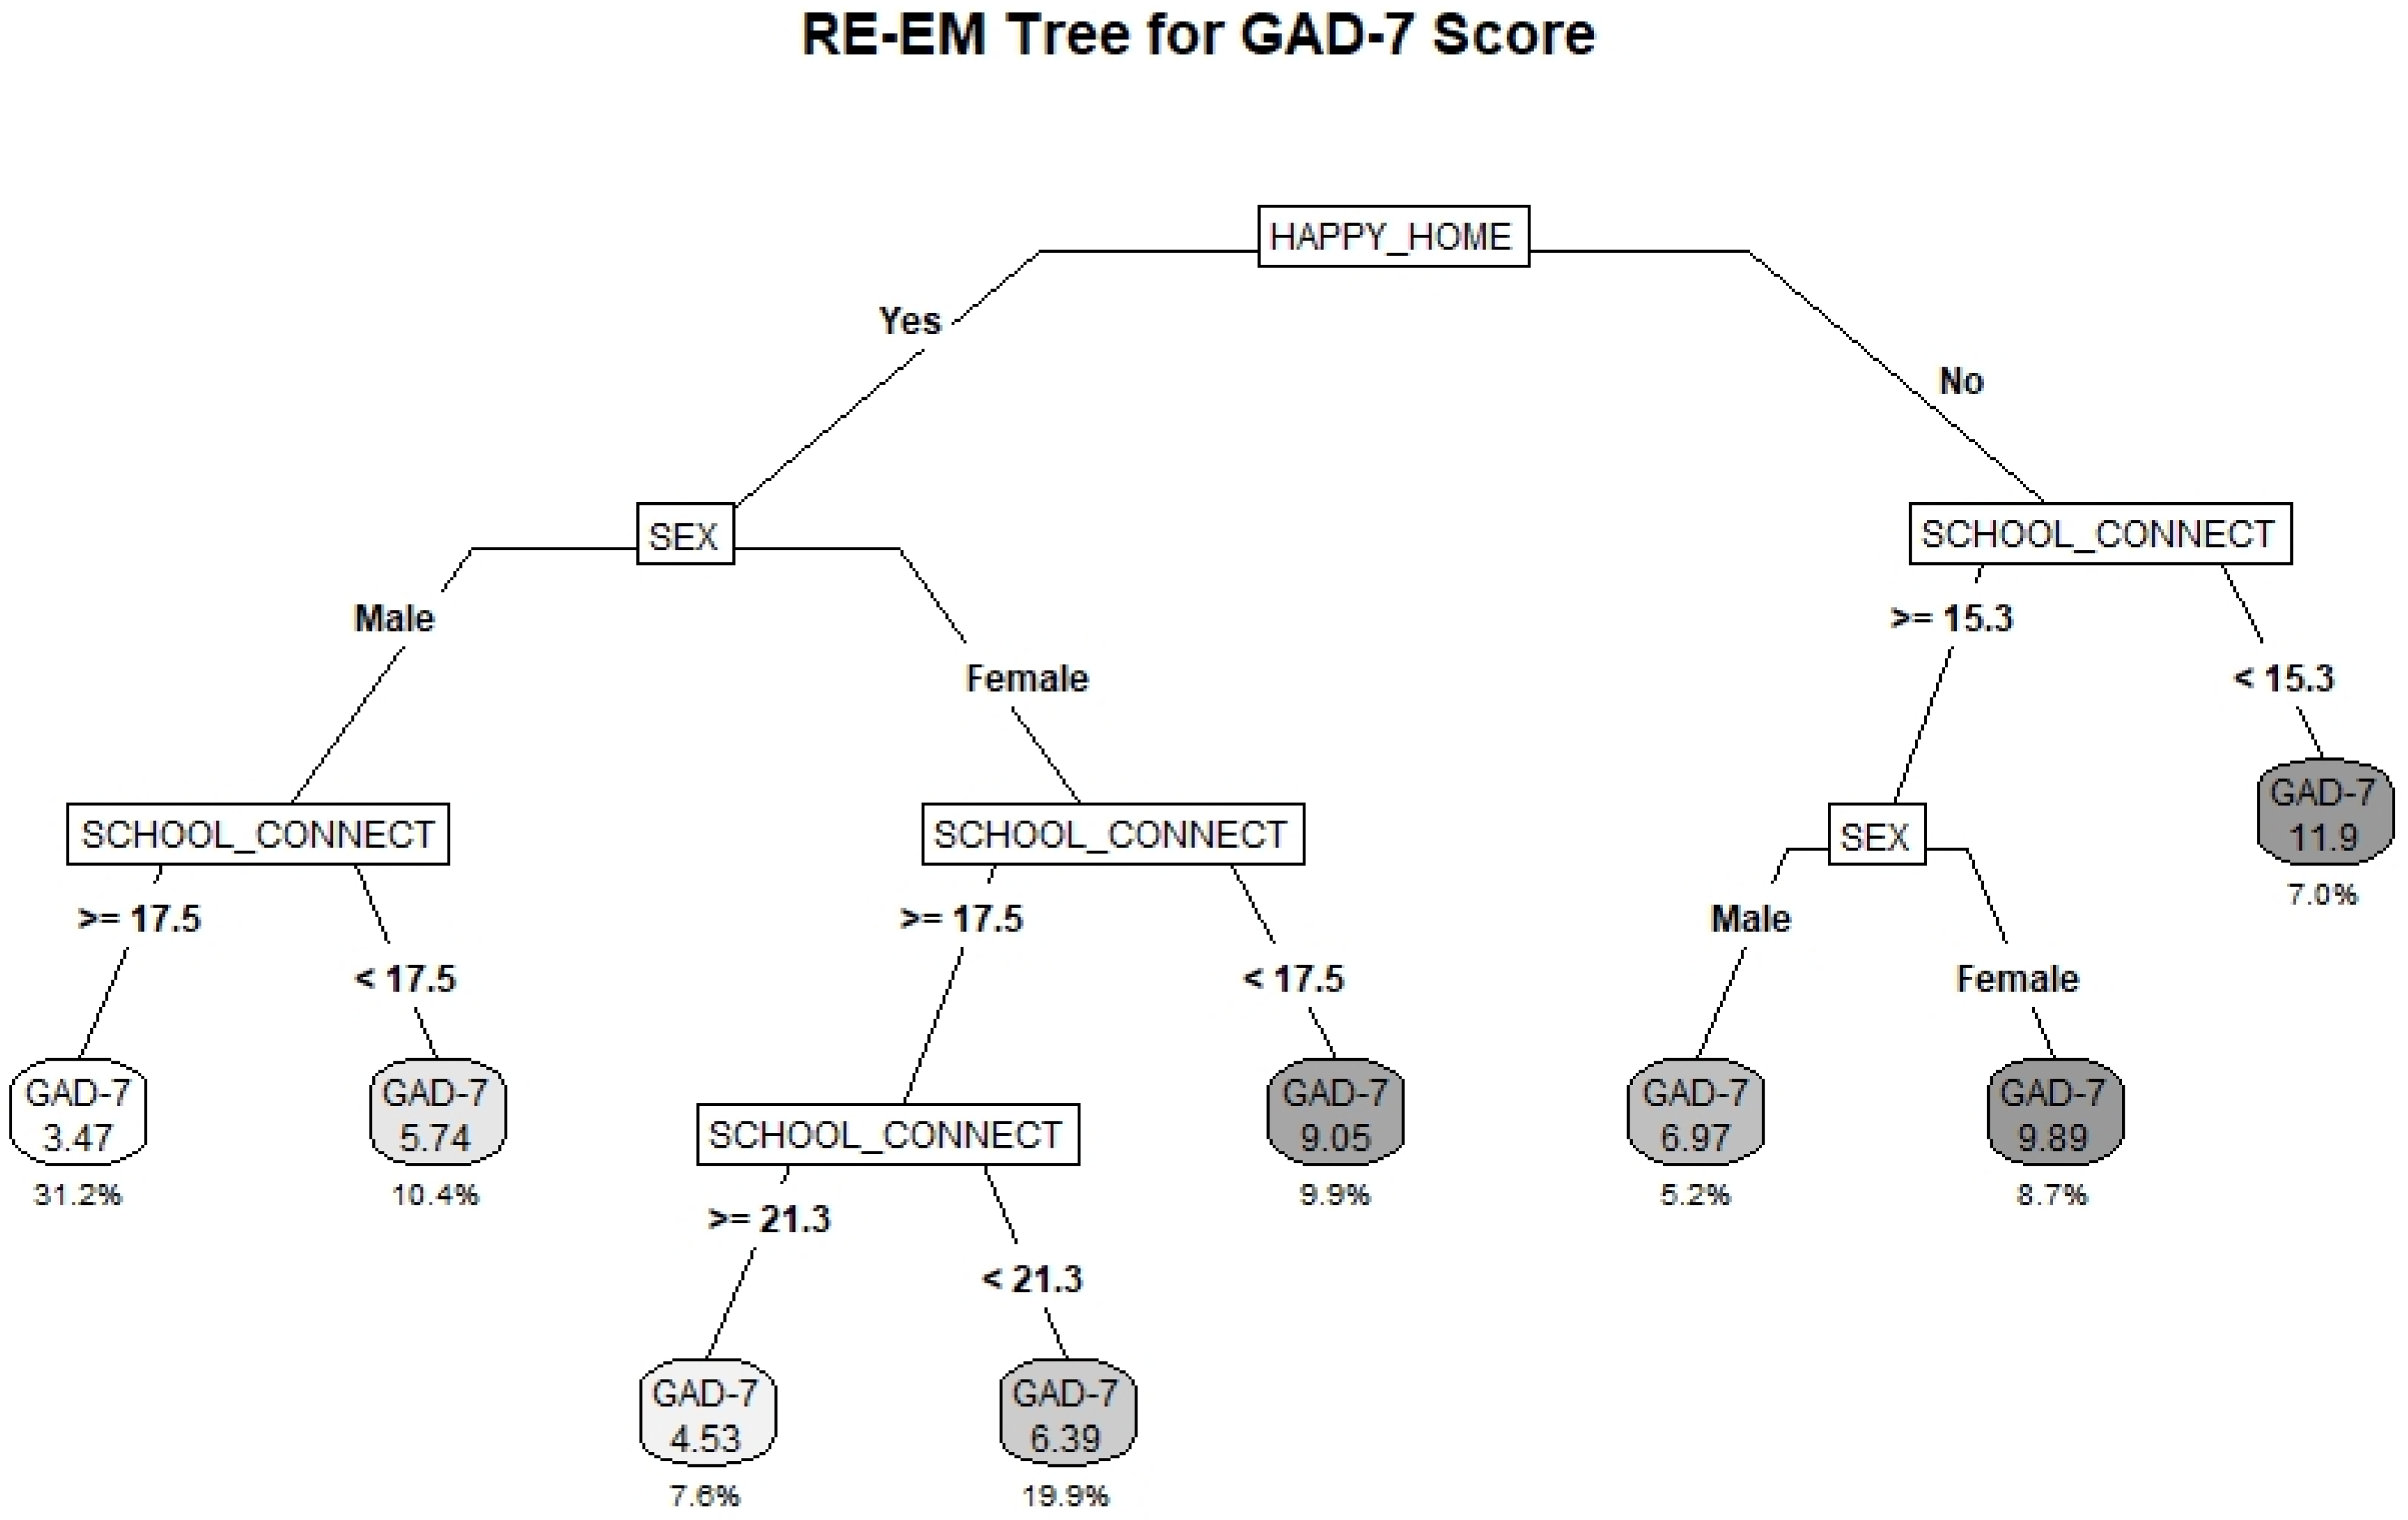
3.2. GAD-7
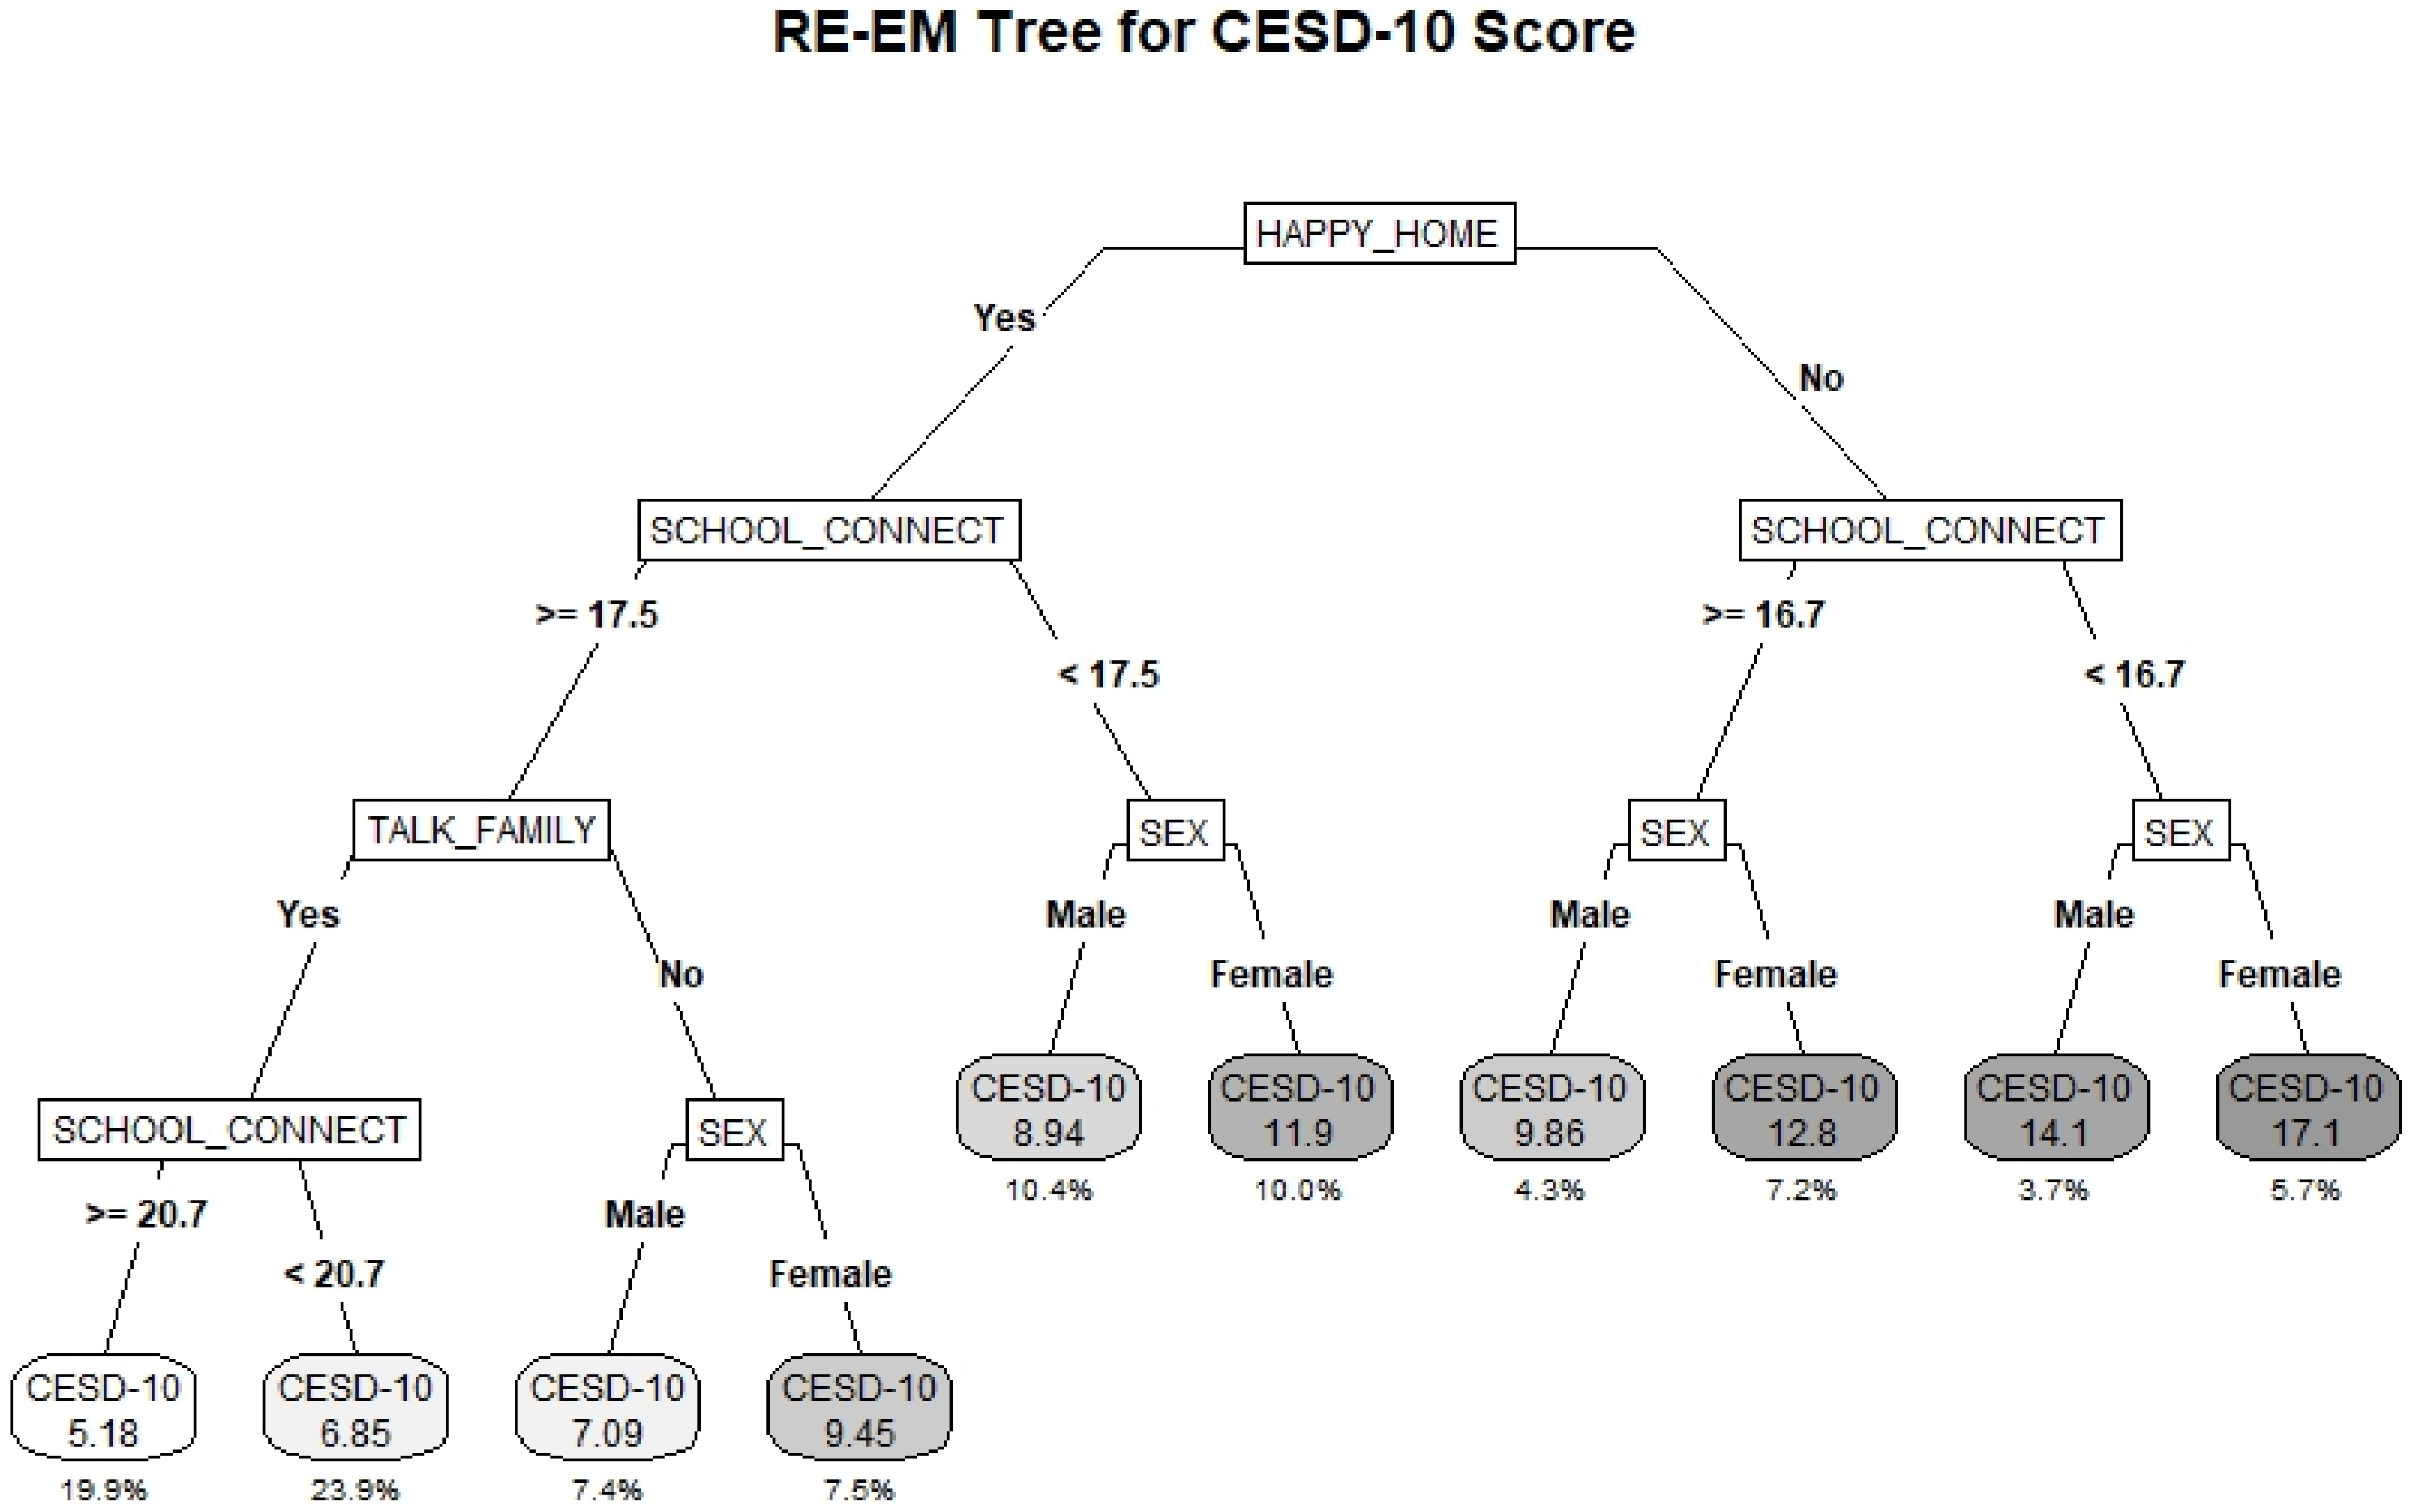
3.3. CESD-10
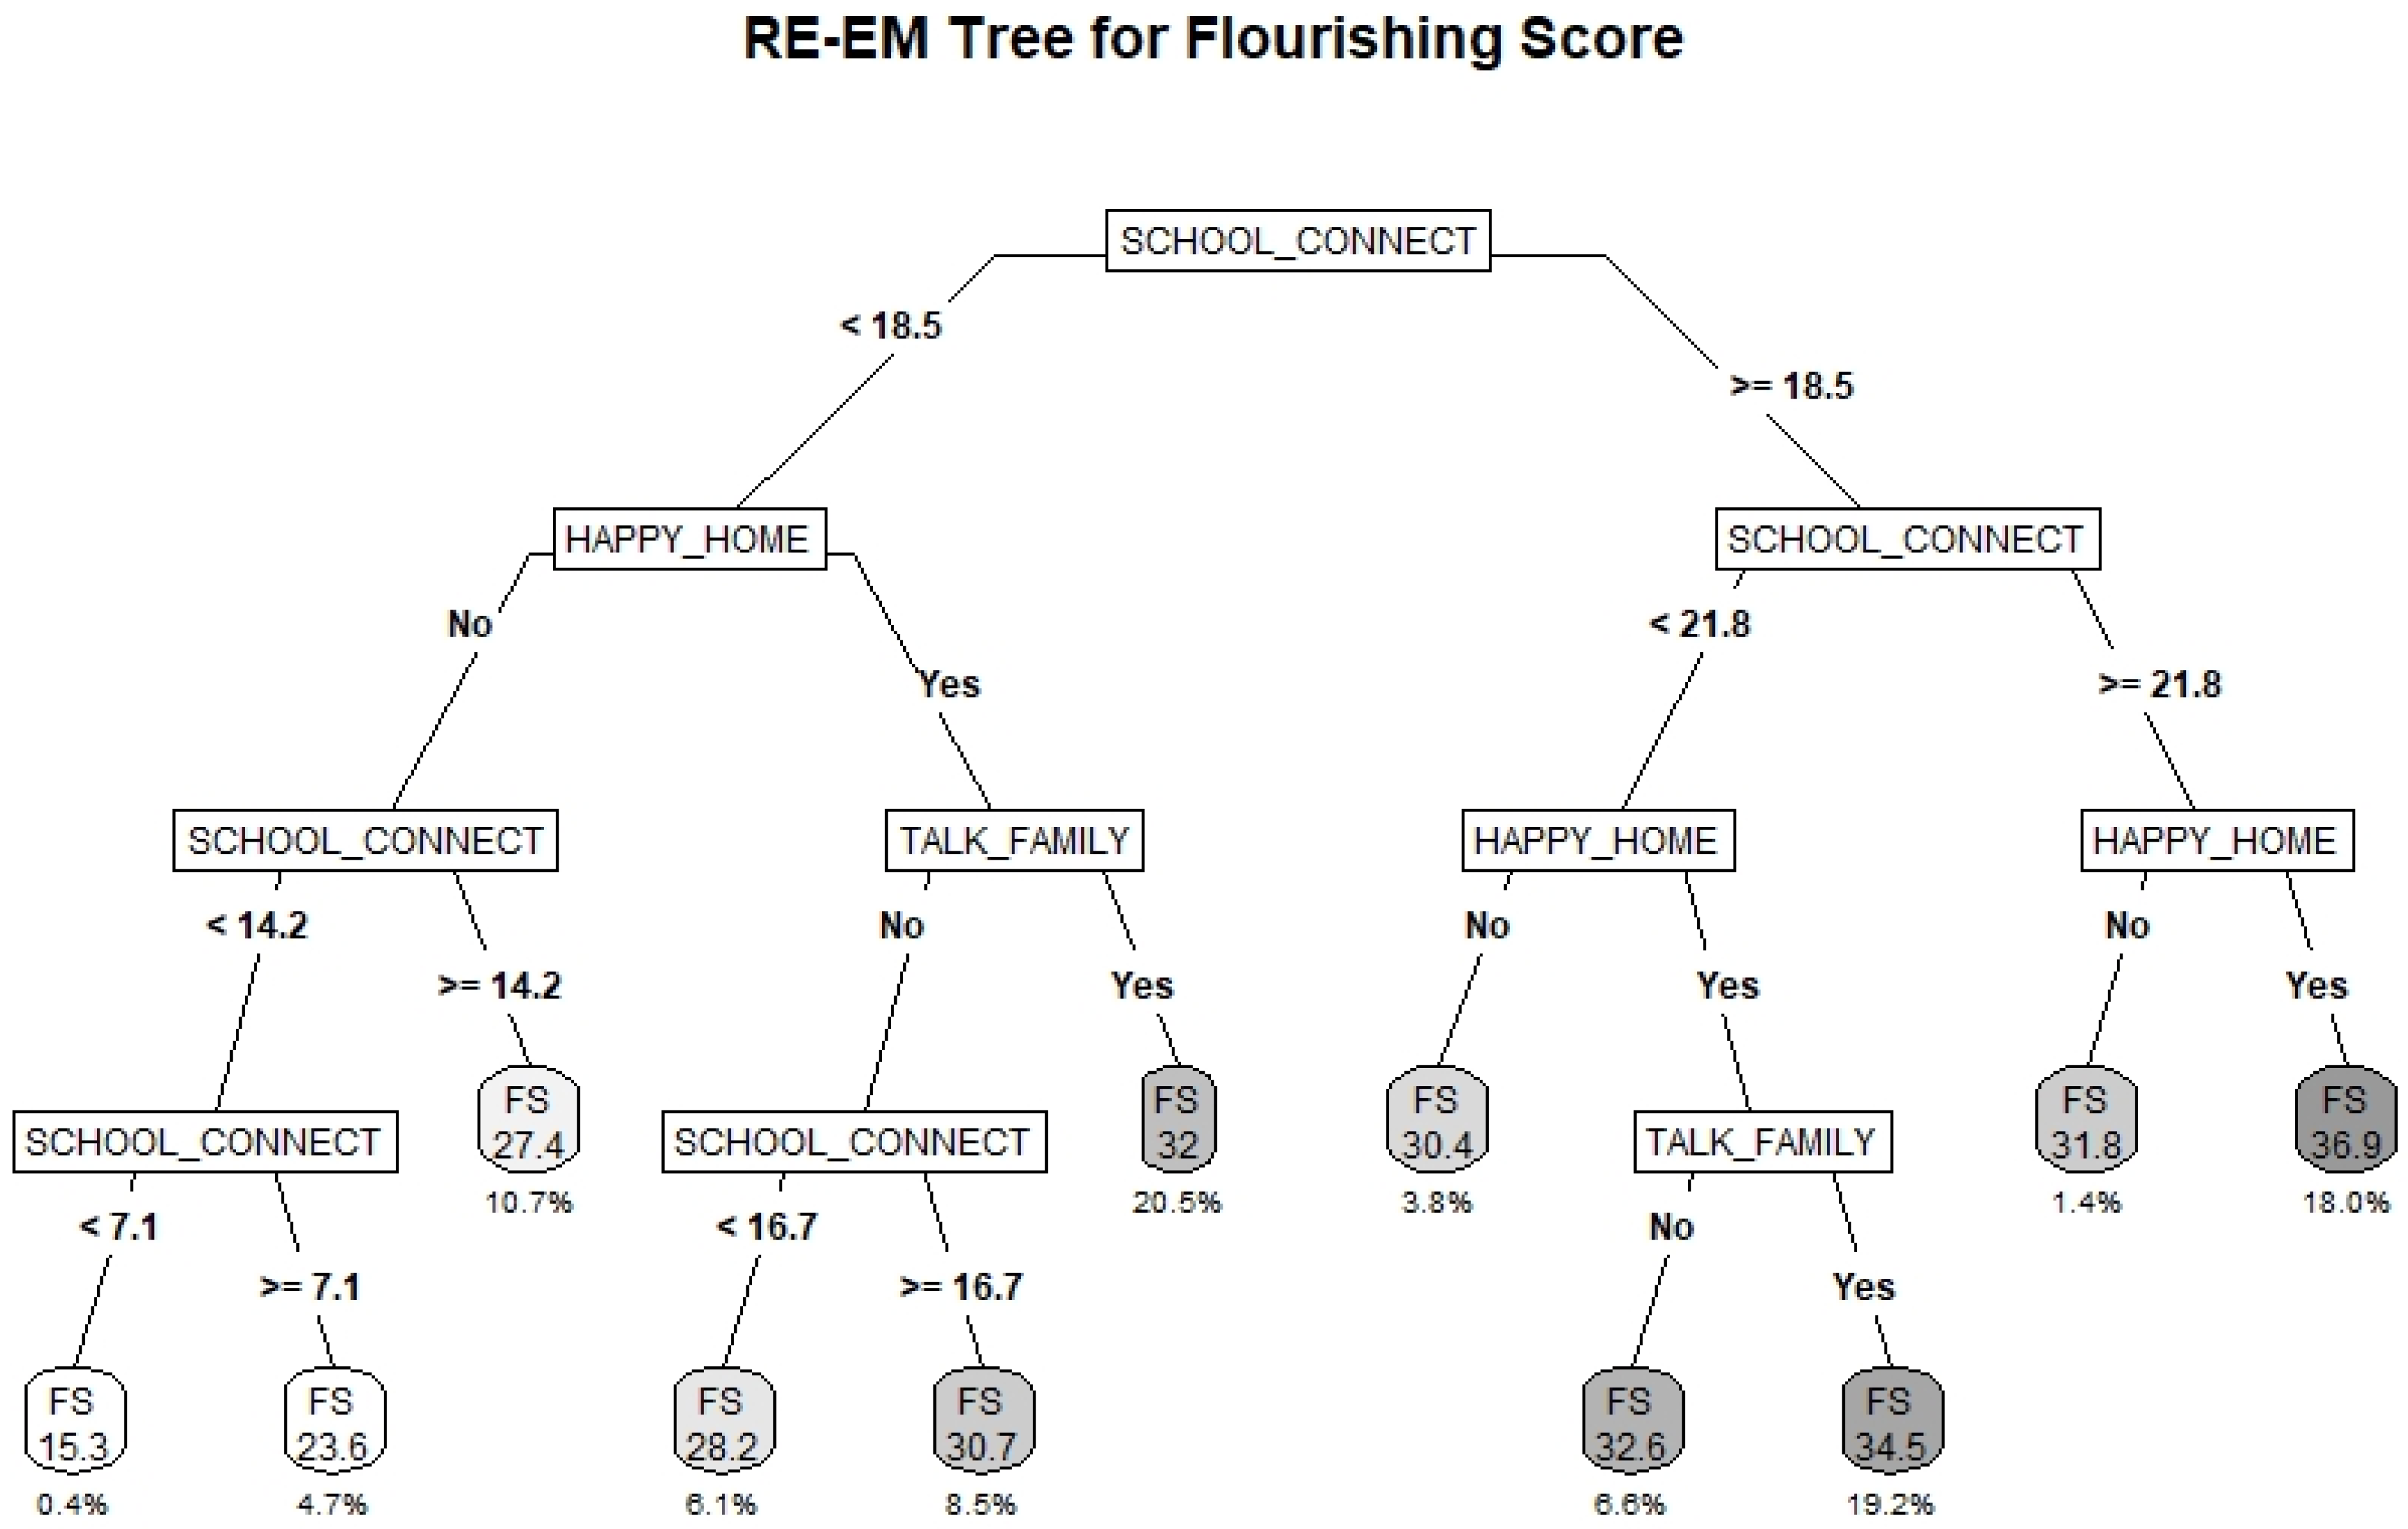
3.4. Flourishing Scale
4. Discussion
Strengths and Limitations
5. Conclusions
Author Contributions
Funding
Institutional Review Board Statement
Informed Consent Statement
Data Availability Statement
Conflicts of Interest
References
- Campbell, O.L.K.; Bann, D.; Patalay, P. The Gender Gap in Adolescent Mental Health: A Cross-National Investigation of 566,829 Adolescents across 73 Countries. SSM Popul. Health 2021, 13, 100742. [Google Scholar] [CrossRef] [PubMed]
- Walker, E.R.; McGee, R.E.; Druss, B.G. Mortality in Mental Disorders and Global Disease Burden Implications a Systematic Review and Meta-Analysis. JAMA Psychiatry 2015, 72, 334–341. [Google Scholar] [CrossRef] [PubMed]
- World Health Organization. Mental Health Action Plan 2013–2020; WHO Document Production Services: Geneva, Switzerland, 2013; ISBN 9789241506021. [Google Scholar]
- Joshi, P.T. Editorial: Global Mental Health: Challenges & Opportunities. Child Adolesc. Ment. Health 2018, 23, 301–302. [Google Scholar]
- Kessler, R.C.; Berglund, P.; Demler, O.; Jin, R.; Merikangas, K.R.; Walters, E.E. Lifetime Prevalence and Age-of-Onset Distributions of DSM-IV Disorders in the National Comorbidity Survey Replication. Arch. Gen. Psychiatry 2005, 62, 593–602. [Google Scholar] [CrossRef]
- Choi, K.R.; Easterlin, M.C. Intervention Models for Increasing Access to Behavioral Health Services among Youth: A Systematic Review. J. Dev. Behav. Pediatr. 2018, 39, 754–762. [Google Scholar] [CrossRef]
- Chesney, E.; Goodwin, G.M.; Fazel, S. Risks of All-Cause and Suicide Mortality in Mental Disorders: A Meta-Review. World Psychiatry 2014, 13, 153–160. [Google Scholar] [CrossRef]
- Butler, A.; Romano, I.; Patte, K.; Ferro, M.A.; De Groh, M.; Jiang, Y.; Leatherdale, S.T. Psychological Correlates and Binge Drinking Behaviours among Canadian Youth: A Cross-Sectional Analysis of the Mental Health Pilot Data from the COMPASS Study. BMJ Open 2019, 9, e028558. [Google Scholar] [CrossRef] [PubMed]
- Romano, I.; Williams, G.; Butler, A.; Aleyan, S.; Patte, K.A.; Leatherdale, S.T. Psychological and Behavioural Correlates of Cannabis Use among Canadian Secondary School Students: Findings from the COMPASS Study. Can. J. Addict. 2019, 10, 10–21. [Google Scholar] [CrossRef]
- World Health Organization. Promoting Mental Health: Concepts, Emerging Evidence, Practice; WHO: Geneva, Switzerland, 2004. [Google Scholar]
- Canadian Institute for Health Information. Exploring Positive Mental Health; Canadian Institute for Health Information: Ottawa, ON, Canada, 2009; ISBN 9781554654895. [Google Scholar]
- Morrison, W.; Peterson, P. Schools as a Setting for Promoting Positive Mental Health: Better Practices and Perspectives, 2nd ed.; Pan-Canadian Joint Consortium for School Health: Summerside, PE, Canada, 2013. [Google Scholar]
- Keyes, C.L.M.; Simoes, E.J. To Flourish or Not: Positive Mental Health and All-Cause Mortality. Am. J. Public Health 2012, 102, 2164–2172. [Google Scholar] [CrossRef]
- Butler, A.; Patte, K.A.; Ferro, M.A.; Leatherdale, S.T. Interrelationships among Depression, Anxiety, Flourishing, and Cannabis Use in Youth. Addict. Behav. 2019, 89, 206–215. [Google Scholar] [CrossRef]
- Holligan, S.D.; Qian, W.; De Groh, M.; Jiang, Y.; Patte, K.A.; Battista, K.; Leatherdale, S.T. Binge Drinking and Educational Participation among Youth in the COMPASS Host Study (Year 5: 2016/2017): School Connectedness and Flourishing as Compensatory Factors. Can. J. Fam. Youth 2020, 12, 55–77. [Google Scholar] [CrossRef]
- Duncan, M.J.; Patte, K.A.; Leatherdale, S.T. Mental Health Associations with Academic Performance and Education Behaviors in Canadian Secondary School Students. Can. J. Sch. Psychol. 2021, 36, 335–357. [Google Scholar] [CrossRef]
- Suldo, S.; Thalji, A.; Ferron, J. Longitudinal Academic Outcomes Predicted by Early Adolescents’ Subjective Well-Being, Psychopathology, and Mental Health Status Yielded from a Dual Factor Model. J. Posit. Psychol. 2011, 6, 17–30. [Google Scholar] [CrossRef]
- Bronfenbrenner, U. The Ecology of Human Development: Experiments by Nature and Design; Harvard University Press: Cambridge, MA, USA, 1979; ISBN 9780674224575. [Google Scholar]
- Rice, F.; Harold, G.; Thapar, A. The Genetic Aetiology of Childhood Depression: A Review. J. Child Psychol. Psychiatry 2002, 43, 65–79. [Google Scholar] [CrossRef]
- Sawyers, C.; Ollendick, T.; Brotman, M.A.; Pine, D.S.; Leibenluft, E.; Carney, D.M.; Roberson-Nay, R.; Hettema, J.M. The Genetic and Environmental Structure of Fear and Anxiety in Juvenile Twins. Am. J. Med. Genet. Part B Neuropsychiatr. Genet. 2019, 180, 204–212. [Google Scholar] [CrossRef]
- Haworth, C.M.A.; Carter, K.; Eley, T.C.; Plomin, R. Understanding the Genetic and Environmental Specificity and Overlap between Well-Being and Internalizing Symptoms in Adolescence. Dev. Sci. 2017, 20, e12376. [Google Scholar] [CrossRef]
- Mental Health Commission of Canada. Changing Directions, Changing Lives: The Mental Health Strategy for Canada; Mental Health Commission of Canada: Calgary, AB, Canada, 2012. [Google Scholar]
- Wilkinson-Lee, A.M.; Zhang, Q.; Nuno, V.L.; Wilhelm, M.S. Adolescent Emotional Distress: The Role of Family Obligations and School Connectedness. J. Youth Adolesc. 2011, 40, 221–230. [Google Scholar] [CrossRef] [PubMed]
- Yap, M.B.H.; Pilkington, P.D.; Ryan, S.M.; Jorm, A.F. Parental Factors Associated with Depression and Anxiety in Young People: A Systematic Review and Meta-Analysis. J. Affect. Disord. 2014, 156, 8–23. [Google Scholar] [CrossRef] [PubMed]
- Gariépy, G.; Honkaniemi, H.; Quesnel-Vallée, A. Social Support and Protection from Depression: Systematic Review of Current Findings in Western Countries. Br. J. Psychiatry 2016, 209, 284–293. [Google Scholar] [CrossRef]
- Roach, A. Supportive Peer Relationships and Mental Health in Adolescence: An Integrative Review. Issues Ment. Health Nurs. 2018, 39, 723–737. [Google Scholar] [CrossRef] [PubMed]
- Millings, A.; Buck, R.; Montgomery, A.; Spears, M.; Stallard, P. School Connectedness, Peer Attachment, and Self-Esteem as Predictors of Adolescent Depression. J. Adolesc. 2012, 35, 1061–1067. [Google Scholar] [CrossRef] [PubMed]
- Holt, M.K.; Vivolo-Kantor, A.M.; Polanin, J.R.; Holland, K.M.; DeGue, S.; Matjasko, J.L.; Wolfe, M.; Reid, G. Bullying and Suicidal Ideation and Behaviors: A Meta-Analysis. Pediatrics 2015, 135, e496–e509. [Google Scholar] [CrossRef] [PubMed]
- Bond, L.; Butler, H.; Thomas, L.; Carlin, J.; Glover, S.; Bowes, G.; Patton, G. Social and School Connectedness in Early Secondary School as Predictors of Late Teenage Substance Use, Mental Health, and Academic Outcomes. J. Adolesc. Health 2007, 40, 357.e9–357.e18. [Google Scholar] [CrossRef] [PubMed]
- O’Neil, A.; Quirk, S.E.; Housden, S.; Brennan, S.L.; Williams, L.J.; Pasco, J.A.; Berk, M.; Jacka, F.N. Relationship between Diet and Mental Health in Children and Adolescents: A Systematic Review. Am. J. Public Health 2014, 104, e31–e42. [Google Scholar] [CrossRef]
- Biddle, S.J.H.; Asare, M. Physical Activity and Mental Health in Children and Adolescents: A Review of Reviews. Br. J. Sports Med. 2011, 45, 886–895. [Google Scholar] [CrossRef]
- Hoare, E.; Milton, K.; Foster, C.; Allender, S. The Associations between Sedentary Behaviour and Mental Health among Adolescents: A Systematic Review. Int. J. Behav. Nutr. Phys. Act. 2016, 13, 108. [Google Scholar] [CrossRef]
- Zhang, J.; Paksarian, D.; Lamers, F.; Hickie, I.B.; He, J.; Merikangas, K.R. Sleep Patterns and Mental Health Correlates in US Adolescents. J. Pediatr. 2017, 182, 137–143. [Google Scholar] [CrossRef]
- Leadbeater, B.J.; Ames, M.E.; Linden-Carmichael, A.N. Age-Varying Effects of Cannabis Use Frequency and Disorder on Symptoms of Psychosis, Depression and Anxiety in Adolescents and Adults. Addiction 2019, 114, 278–293. [Google Scholar] [CrossRef]
- Loh, W.-Y. Fifty Years of Classification and Regression Trees. Int. Stat. Rev. 2014, 82, 329–348. [Google Scholar] [CrossRef]
- Lemon, S.; Roy, M.; Clark, M.; Friedmann, P.; Rakowski, W. Classification and Regression Tree Analysis in Public Health: Methodological Review and Comparison with Logistic Regression. Ann. Behav. Med. 2003, 26, 172–181. [Google Scholar] [CrossRef]
- Bai, Z.; Xu, Z.; Xu, X.; Qin, X.; Hu, W.; Hu, Z. Association between social capital and depression among older people: Evidence from Anhui Province, China. BMC Public Health 2020, 20, 1560. [Google Scholar] [CrossRef] [PubMed]
- Batterham, P.J.; Christensen, H.; Mackinnon, A.J. Modifiable risk factors predicting major depressive disorder at four year follow-up: A decision tree approach. BMC Psychiatry 2009, 9, 75. [Google Scholar] [CrossRef] [PubMed]
- Seeley, J.R.; Stice, E.; Rohde, P. Screening for Depression Prevention: Identifying Adolescent Girls at High Risk for Future Depression. J. Abnorm. Psychol. 2009, 118, 161–170. [Google Scholar] [CrossRef] [PubMed]
- Hill, R.M.; Pettit, J.W.; Lewinsohn, P.M.; Seeley, J.R.; Klein, D.N. Escalation to Major Depressive Disorder among Adolescents with Subthreshold Depressive Symptoms: Evidence of Distinct Subgroups at Risk. J. Affect. Disord. 2014, 158, 133–138. [Google Scholar] [CrossRef]
- Leatherdale, S.T.; Brown, K.S.; Carson, V.; Childs, R.A.; Dubin, J.A.; Elliott, S.J.; Faulkner, G.; Hammond, D.; Manske, S.; Sabiston, C.M.; et al. The COMPASS Study: A Longitudinal Hierarchical Research Platform for Evaluating Natural Experiments Related to Changes in School-Level Programs, Policies and Built Environment Resources. BMC Public Health 2014, 14, 331. [Google Scholar] [CrossRef]
- Thompson-Haile, A.; Bredin, C.; Leatherdale, S.T. Rationale for Using an Active-Information Passive-Consent Permission Protocol in COMPASS; University of Waterloo: Waterloo, ON, Canada, 2013. [Google Scholar]
- Thompson-Haile, A.; Leatherdale, S.T. School Board and School Recruitment Procedures; University of Waterloo: Waterloo, ON, Canada, 2013. [Google Scholar]
- Reel, B.; Battista, K.; Leatherdale, S.T. COMPASS Year 7 and 8 Recruitment and Retention; University of Waterloo: Waterloo, ON, Canada, 2021. [Google Scholar]
- Thompson-Haile, A.; Leatherdale, S.T. Student-level Data Collection Procedures; University of Waterloo: Waterloo, ON, Canada, 2013. [Google Scholar]
- Van Dam, N.T.; Earleywine, M. Validation of the Center for Epidemiologic Studies Depression Scale-Revised (CESD-R): Pragmatic Depression Assessment in the General Population. Psychiatry Res. 2011, 186, 128–132. [Google Scholar] [CrossRef]
- Radloff, L.S. The CES-D Scale: A Self-Report Depression Scale for Research in the General Population. Appl. Psychol. Meas. 1977, 1, 385–401. [Google Scholar] [CrossRef]
- Spitzer, R.L.; Kroenke, K.; Williams, J.W.; Löwe, B. A Brief Measure for Assessing Generalized Anxiety Disorder: The Gad-7. Arch. Intern. Med. 2006, 166, 1092–1097. [Google Scholar] [CrossRef]
- Hone, L.; Jarden, A.; Schofield, G. Psychometric Properties of the Flourishing Scale in a New Zealand Sample. Soc. Indic. Res. 2014, 119, 1031–1045. [Google Scholar] [CrossRef]
- Downey, R.G.; King, C.V. Missing Data in Likert Ratings: A Comparison of Replacement Methods. J. Gen. Psychol. 1998, 125, 175–191. [Google Scholar] [CrossRef]
- Bono, C.; Ried, L.D.; Kimberlin, C.; Vogel, B. Missing Data on the Center for Epidemiologic Studies Depression Scale: A Comparison of 4 Imputation Techniques. Res. Soc. Adm. Pharm. 2007, 3, 1–27. [Google Scholar] [CrossRef]
- Arbour-Nicitopoulos, K.P.; Faulkner, G.E.; Leatherdale, S.T. Learning from Non-Reported Data: Interpreting Missing Body Mass Index Values in Young Children. Meas. Phys. Educ. Exerc. Sci. 2010, 14, 241–251. [Google Scholar] [CrossRef]
- Leatherdale, S.T.; Laxer, R.E.; Faulkner, G. Reliability and Validity of the Physical Activity and Sedentary Behaviour Measures in the COMPASS Study; University of Waterloo: Waterloo, ON, Canada, 2014. [Google Scholar]
- McNeely, C.A.; Nonnemaker, J.M.; Blum, R.W. Promoting School Connectedness: Evidence from the National Longitudinal Study of Adolescent Health. J. Sch. Health 2002, 72, 138–146. [Google Scholar] [CrossRef] [PubMed]
- Zimet, G.D.; Powell, S.S.; Farley, G.K.; Werkman, S.; Berkoff, K.A. Psychometric Characteristics of the Multidimensional Scale of Perceived Social Support. J. Pers. Assess. 1990, 55, 610–617. [Google Scholar] [CrossRef] [PubMed]
- Statistics Canada. GeoSearch. Available online: https://www12.statcan.gc.ca/census-recensement/2016/geo/geosearch-georecherche/index-eng.cfm (accessed on 2 October 2019).
- Statistics Canada. Download, Census Profile, 2016 Census. Available online: https://www12.statcan.gc.ca/census-recensement/2016/dp-pd/prof/details/download-telecharger/comp/page_dl-tc.cfm?Lang=E (accessed on 2 October 2019).
- Sela, R.J.; Simonoff, J.S. RE-EM Trees: A Data Mining Approach for Longitudinal and Clustered Data. Mach. Learn. 2012, 86, 169–207. [Google Scholar] [CrossRef]
- Hajjem, A.; Bellavance, F.; Larocque, D. Mixed Effects Regression Trees for Clustered Data. Stat. Probab. Lett. 2011, 81, 451–459. [Google Scholar] [CrossRef]
- R Core Team. R: A Language and Environment for Statistical Computing; R Foundation for Statistical Computing: Vienna, Austria, 2020. [Google Scholar]
- Sela, R.J.; Simonoff, J.S.; Jing, W. Package “REEMtree”: Regression Trees with Random Effects for Longitudinal (Panel) Data; R Foundation for Statistical Computing: Vienna, Austria, 2021. [Google Scholar]
- Milborrow, S. Package “Rpart.Plot”: Plot rpart Models: An Enhanced Version of “Plot.Rpart”; R Foundation for Statistical Computing: Vienna, Austria, 2020. [Google Scholar]
- Pinheiro, J.; Bates, D.; DebRoy, S.; Sarkar, D.; EISPACK; Heisterkamp, S.; Van Willigen, B. R-Core Package “Nlme”: Linear and Nonlinear Mixed Effects Models; R Foundation for Statistical Computing: Vienna, Austria, 2020. [Google Scholar]
- Gorostiaga, A.; Aliri, J.; Balluerka, N.; Lameirinhas, J. Parenting Styles and Internalizing Symptoms in Adolescence: A Systematic Literature Review. Int. J. Environ. Res. Public Health 2019, 16, 3192. [Google Scholar] [CrossRef]
- Ran, G.; Niu, X.; Zhang, Q.; Li, S.; Liu, J.; Chen, X.; Wu, J. The Association between Interparental Conflict and Youth Anxiety: A Three-Level Meta-Analysis. J. Youth Adolesc. 2021, 50, 599–612. [Google Scholar] [CrossRef]
- LeMoult, J.; Humphreys, K.L.; Tracy, A.; Hoffmeister, J.-A.; Ip, E.; Gotlib, I.H. Meta-Analysis: Exposure to Early Life Stress and Risk for Depression in Childhood and Adolescence. J. Am. Acad. Child Adolesc. Psychiatry 2020, 59, 842–855. [Google Scholar] [CrossRef]
- Bethell, C.D.; Gombojav, N.; Whitaker, R.C. Family Resilience and Connection Promote Flourishing among US Children, Even amid Adversity. Health Aff. 2019, 38, 729–737. [Google Scholar] [CrossRef]
- Kwong, T.Y.; Hayes, D.K. Adverse Family Experiences and Flourishing amongst Children Ages 6–17 Years: 2011/12 National Survey of Children’s Health. Child Abus. Negl. 2017, 70, 240–246. [Google Scholar] [CrossRef] [PubMed]
- Prati, G.; Cicognani, E.; Albanesi, C. The Influence of School Sense of Community on Students’ Well-Being: A Multilevel Analysis. J. Community Psychol. 2018, 46, 917–924. [Google Scholar] [CrossRef] [PubMed]
- Lester, L.; Cross, D. The Relationship Between School Climate and Mental and Emotional Wellbeing Over the Transition from Primary to Secondary School. Psychol. Well-Being 2015, 5, 9. [Google Scholar] [CrossRef] [PubMed]
- Van Droogenbroeck, F.; Spruyt, B.; Keppens, G. Gender differences in mental health problems among adolescents and the role of social support: Results from the Belgian health interview surveys 2008 and 2013. BMC Psychiatry 2018, 18, 6. [Google Scholar] [CrossRef] [PubMed]
- Romano, I.; Ferro, M.A.; Patte, K.A.; Leatherdale, S.T. Measurement Invariance of the GAD-7 and CESD-R-10 Among Adolescents in Canada. J. Pediatr. Psychol. 2022, 47, 585–594. [Google Scholar] [CrossRef]
- Eugene, D.R.; Crutchfield, J.; Robinson, E.D. An Examination of Peer Victimization and Internalizing Problems through a Racial Equity Lens: Does School Connectedness Matter? Int. J. Environ. Res. Public Health 2021, 18, 1085. [Google Scholar] [CrossRef]
- Liu, Y.; Carney, J.L.V.; Kim, H.; Hazler, R.J.; Guo, X. Victimization and Students’ Psychological Well-Being: The Mediating Roles of Hope and School Connectedness. Child. Youth Serv. Rev. 2020, 108, 104674. [Google Scholar] [CrossRef]
- Resseguier, N.; Verdoux, H.; Giorgi, R.; Clavel-Chapelon, F.; Paoletti, X. Dealing with Missing Data in the Center for Epidemiologic Studies Depression Self-Report Scale: A Study Based on the French E3N Cohort. BMC Med. Res. Methodol. 2013, 13, 28. [Google Scholar] [CrossRef] [Green Version]


| Continuous Variables | Mean (s.d.) |
|---|---|
| CESD-10 [N = 70,610] | 8.82 (6.05) |
| GAD-7 [N = 71,736] | 6.2 (5.56) |
| FS [N = 72,415] | 32.16 (5.73) |
| Age [N = 73,960] | 15.15 (1.49) |
| School Area Median Income (‘000s) [N = 74,501] | 67.59 (17.45) |
| School Size (‘00s) [N = 74,501] | 8.41 (3.52) |
| Servings of Fruits and Vegetables [N = 71,679] | 2.98 (2.01) |
| Average Daily Physical Activity (h) [N = 66,007] | 1.6 (1.05) |
| Screen Time (h) [N = 67,181] | 5.87 (3.04) |
| Sleep Time (h) [N = 69,630] | 7.52 (1.28) |
| School Connectedness Score [N = 71,413] | 18.5 (3.36) |
| Binary Variables | % (n) |
| Eat Breakfast Daily [N = 74,501] | 0.49 (36,197) |
| Tobacco Use [N = 73,852] | 0.07 (5532) |
| E-cigarette Use [N = 73,466] | 0.28 (20,852) |
| Binge Drinking [N = 74,254] | 0.17 (12,884) |
| Cannabis Use [N = 73,299] | 0.13 (9662) |
| Was Bullied [N = 70,753] | 0.88 (61,940) |
| Bullied Others [N = 71,063] | 0.06 (4339) |
| Expect to Attend Post Secondary Education [N = 70,753] | 0.06 (4339) |
| Happy Home Life [N = 72,830] | 0.79 (57,444) |
| Talk About Problems with Family [N = 72,234] | 0.59 (42,833) |
| Talk About Problems with Friends [N = 72,622] | 0.75 (54,246) |
| Categorical Variables | % (n) |
| Sex [N = 73,672] | |
| Female | 0.5 (36,546) |
| Male | 0.5 (37,126) |
| Ethnicity [N = 73,839] | |
| White | 0.69 (51,017) |
| Black | 0.04 (2951) |
| Asian | 0.1 (7465) |
| Hispanic | 0.03 (1886) |
| Other/Mixed | 0.14 (10,520) |
| Spending Money [N = 73,422] | |
| $0 | 0.16 (11,684) |
| $1–$20 | 0.24 (17,744) |
| $21–$40 | 0.11 (8071) |
| $41–$100 | 0.12 (8722) |
| More than$100 | 0.19 (14,216) |
| Don’t Know | 0.18 (12,985) |
| Province [N = 74,501] | |
| AB | 0.04 (3301) |
| BC | 0.14 (10,402) |
| ON | 0.41 (30,675) |
| QC | 0.4 (30,123) |
| Urbanicity [N = 74,501] | |
| Large Urban | 0.54 (40,421) |
| Medium Urban | 0.1 (7573) |
| Small Urban/Rural | 0.36 (26,507) |
| Weight Perception [N = 73,071] | |
| Underweight | 0.17 (12,140) |
| About the right weight | 0.6 (43,893) |
| Overweight/Obese | 0.23 (17,038) |
| BMI Classification [N = 74,501] | |
| Underweight | 0.02 (1397) |
| Normal Weight | 0.53 (39,388) |
| Overweight | 0.12 (8682) |
| Obese | 0.05 (4027) |
| Not Stated | 0.28 (21,007) |
| Classes Skipped in Past 4 Weeks [N = 71,571] | |
| 0 classes | 0.65 (46,785) |
| 1 or 2 classes | 0.2 (14,555) |
| 3 to 5 classes | 0.08 (5988) |
| 6 or more classes | 0.06 (4243) |
| [Estimate (95% Confidence Interval)] | GAD-7 (N = 52,875) | CESD-10 (N = 52,591) | FS (N = 52,997) | |
|---|---|---|---|---|
| Male Sex | −2.57 (−2.65,−2.49) *** | −2.11 (−2.19,−2.03) *** | 0.1 (0.04,0.17) ** | |
| Age | 0.09 (0.06,0.12) *** | 0.06 (0.02,0.09) *** | −0.06 (−0.09,−0.03) *** | |
| Ethnicity (ref = White) | Black | −1.54 (−1.77,−1.31) *** | −1 (−1.24,−0.76) *** | 1.1 (0.91,1.3) *** |
| Asian | −0.69 (−0.84,−0.53) *** | 0.15 (−0.01,0.3) | −0.43 (−0.56,−0.3) *** | |
| Hispanic | −0.4 (−0.65,−0.15) ** | −0.08 (−0.34,0.19) | 0.6 (0.38,0.81) *** | |
| Other/Mixed | −0.02 (−0.14,0.09) | 0.17 (0.04,0.29) ** | 0.19 (0.09,0.29) *** | |
| Spending Money (ref = $0) | $1–$20 | −0.05 (−0.17,0.07) | 0 (−0.13,0.13) | 0.35 (0.24,0.45) *** |
| $21–$40 | −0.29 (−0.44,−0.14) *** | −0.2 (−0.36,−0.05) * | 0.58 (0.45,0.71) *** | |
| $41–$100 | −0.16 (−0.31,−0.01) * | −0.19 (−0.34,−0.03) * | 0.66 (0.53,0.79) *** | |
| More than $100 | −0.08 (−0.22,0.06) | −0.35 (−0.49,−0.2) *** | 0.87 (0.75,0.99) *** | |
| Don’t Know | −0.22 (−0.36,−0.09) *** | −0.25 (−0.39,−0.11) *** | 0.37 (0.26,0.49) *** | |
| Province (ref = AB) | BC | −0.11 (−0.48,0.26) | NI | −0.56 (−0.91,−0.21) ** |
| ON | −0.07 (−0.38,0.24) | NI | −0.29 (−0.59,0.01) | |
| QC | −0.61 (−0.93,−0.29) *** | NI | 0.21 (−0.1,0.52) | |
| Urbanicity (ref = Large Urban) | Medium Urban | −0.02 (−0.26,0.22) | −0.23 (−0.47,0.02) | NI |
| Small Urban/Rural | −0.29 (−0.44,−0.14) *** | −0.26 (−0.41,−0.1) ** | NI | |
| School Size (‘00s) | NI | NI | 0.03 (0.01,0.05) ** | |
| Weight Perception (ref = Underweight) | About the right weight | −0.57 (−0.68,−0.46) *** | −0.6 (−0.72,−0.49) *** | 0.37 (0.27,0.46) *** |
| Overweight/Obese | 0.23 (0.09,0.36) ** | 0.34 (0.2,0.48) *** | −0.6 (−0.71,−0.48) *** | |
| BMI Classification (ref = Underweight) | Normal Weight | −0.02 (−0.31,0.26) | 0.13 (−0.17,0.42) | −0.22 (−0.46,0.02) |
| Overweight | −0.29 (−0.6,0.01) | −0.05 (−0.37,0.27) | 0.08 (−0.18,0.35) | |
| Obese | −0.17 (−0.5,0.17) | 0.09 (−0.26,0.43) | 0.09 (−0.19,0.38) | |
| Not Stated | −0.13 (−0.42,0.16) | 0.03 (−0.28,0.33) | −0.39 (−0.64,−0.15) ** | |
| Eat Breakfast Daily | −0.57 (−0.65,−0.48) *** | −0.77 (−0.86,−0.69) *** | 0.31 (0.24,0.38) *** | |
| Servings of Fruits and Vegetables | 0.06 (0.04,0.08) *** | 0.04 (0.01,0.06) *** | 0.14 (0.12,0.15) *** | |
| Average Daily Physical Activity (h) | 0.05 (0.01,0.08) * | NI | 0.43 (0.4,0.47) *** | |
| Screen Time (h) | 0.1 (0.09,0.12) *** | 0.11 (0.1,0.13) *** | −0.07 (−0.08,−0.06) *** | |
| Sleep Time (h) | −0.43 (−0.47,−0.4) *** | −0.6 (−0.64,−0.56) *** | 0.31 (0.28,0.34) *** | |
| Tobacco Use | 0.2 (0.02,0.39) * | 0.46 (0.27,0.65) *** | −0.12 (−0.27,0.03) | |
| E-cigarette Use | 0.2 (0.1,0.3) *** | 0.39 (0.29,0.5) *** | NI | |
| Binge Drinking | NI | NI | 0.25 (0.15,0.35) *** | |
| Cannabis Use | 0.15 (0,0.29) * | 0.16 (0.01,0.31) * | NI | |
| Was Bullied | 1.92 (1.79,2.05) *** | 2.05 (1.93,2.18) *** | −0.47 (−0.58,−0.36) *** | |
| Bullied Others | 0.19 (0.01,0.37) * | NI | −0.56 (−0.71,−0.4) *** | |
| Expect to Attend Post-Secondary Education | 0.41 (0.32,0.51) *** | −0.18 (−0.28,−0.08) *** | 0.63 (0.55,0.71) *** | |
| Classes Skipped in Past 4 Weeks (ref = 0 classes) | 1 or 2 classes | 0.26 (0.16,0.36) *** | 0.36 (0.25,0.46) *** | −0.09 (−0.18,−0.01) * |
| 3 to 5 classes | 0.48 (0.34,0.63) *** | 0.6 (0.44,0.75) *** | −0.18 (−0.3,−0.05) ** | |
| 6 or more classes | 0.72 (0.54,0.91) *** | 0.95 (0.76,1.14) *** | −0.24 (−0.4,−0.09) ** | |
| School Connectedness Score | −0.32 (−0.33,−0.3) *** | −0.45 (−0.46,−0.43) *** | 0.68 (0.67,0.69) *** | |
| Happy Home Life | −1.96 (−2.07,−1.85) *** | −2.75 (−2.86,−2.64) *** | 2.59 (2.5,2.68) *** | |
| Talk about Problems with Family | −0.84 (−0.92,−0.75) *** | −1.31 (−1.4,−1.22) *** | 1.49 (1.41,1.56) *** | |
| Talk about Problems with Friends | −0.6 (−0.69,−0.51) *** | −0.85 (−0.95,−0.76) *** | 1.63 (1.55,1.71) *** | |
Publisher’s Note: MDPI stays neutral with regard to jurisdictional claims in published maps and institutional affiliations. |
© 2022 by the authors. Licensee MDPI, Basel, Switzerland. This article is an open access article distributed under the terms and conditions of the Creative Commons Attribution (CC BY) license (https://creativecommons.org/licenses/by/4.0/).
Share and Cite
Battista, K.; Patte, K.A.; Diao, L.; Dubin, J.A.; Leatherdale, S.T. Using Decision Trees to Examine Environmental and Behavioural Factors Associated with Youth Anxiety, Depression, and Flourishing. Int. J. Environ. Res. Public Health 2022, 19, 10873. https://doi.org/10.3390/ijerph191710873
Battista K, Patte KA, Diao L, Dubin JA, Leatherdale ST. Using Decision Trees to Examine Environmental and Behavioural Factors Associated with Youth Anxiety, Depression, and Flourishing. International Journal of Environmental Research and Public Health. 2022; 19(17):10873. https://doi.org/10.3390/ijerph191710873
Chicago/Turabian StyleBattista, Katelyn, Karen A. Patte, Liqun Diao, Joel A. Dubin, and Scott T. Leatherdale. 2022. "Using Decision Trees to Examine Environmental and Behavioural Factors Associated with Youth Anxiety, Depression, and Flourishing" International Journal of Environmental Research and Public Health 19, no. 17: 10873. https://doi.org/10.3390/ijerph191710873