
Associations between Leisure Preferences, Mindfulness, Psychological Capital, and Life Satisfaction


Abstract
:1. Introduction
1.1. Leisure Preferences
- (1)
- Time spent with family. As a leisure preference, time spent with family indicates several user attributes. Firstly, for the user, family is a value. Research indicates that family and leisure values are positively linked to life satisfaction in all five regions: the West, Latin America, the Asian-Confucian region, ex-Communist Eastern Europe, and the Communist countries of China and Vietnam [19]. However, not every user prefers family for leisure purposes [31,32,33,34,35,36]. If the time spent with family is preferred as a leisure choice, it suggests that being with family can satisfy the user’s basic psychological needs of autonomy, competence, and relatedness [11,37]. From a Hsiao Yao (逍遙) perspective, which stems from Taoism’s Chuang Tzu’s philosophy, leisure is a carefree state of being or happiness [38]. It means that for some people, spending time with family can satisfy needs for relaxation, safety [39,40], or affiliation [4]. Next, research suggests that family leisure satisfaction is the strongest predictor of family functioning and satisfaction with family life [32,41]. Consequently, family as a leisure preference might significantly predict overall life satisfaction.
- (2)
- Time spent with friends. If a user enjoys leisure with friends, it can be assumed that one also scores high on extraversion and can establish and maintain strong social bonds based on mutual trust, compassion, and understanding. In conceptual research on “The social nature of leisure involvement”, Kyle and Chick proposed that leisure is a group phenomenon, and social circles, including friends, highly influence participation in recreation [42]. Next, they noted that the social organization of leisure is characterized by people interacting with others due to mutual tastes and a sense of belonging: “building memories of past experiences shared with family and friends were littered throughout all interviews. The central characters in these stories were always family and friends. Perhaps embellished over the years, these stories were retold during gatherings” [42], p. 438. Furthermore, several studies suggested that friends share unique meanings, and leisure time with friends strengthens interpersonal relationships [42,43]. Based on this perspective, it can be presumed that time spent with friends strengthens satisfaction with interpersonal relationships and, consequently, life satisfaction.
- (3)
- Time spent in nature. Outdoor leisure activities are preferred by users of different ages [28,39,44], genders [13], and cultural backgrounds [29,45,46]. Time spent in nature might encompass a wide range of leisure preferences, from leisure gardening, which evidenced contributing to life satisfaction of older adults [24], to outdoor activities, including enjoyment in walking or outdoor sports [34,35,47], or fishing and hunting [45,48,49]. Outdoor leisure preferences might reflect users’ connectedness to nature and environmental intelligence [49,50,51]. Based on previous research linking nature-based recreational activities and psychological wellbeing, it can be presumed that time spent in nature as a leisure preference significantly contributes to life satisfaction.
- (4)
- Participation in events. Recreational activities such as participating in festivals or visiting museums, theaters, cinemas, or other events, are attracting the increased attention of researchers [12,18,52,53,54,55]. Research suggests that women are more likely than men to participate in highbrow leisure activities, but there is little evidence that highbrow leisure participation is related to family background or socioeconomic status [12]. Furthermore, research indicates that cultural participation is associated with personality trait openness to experience, as open users favor visiting art and historical museums and attending classical and pop concerts [54]. Participation in events, bringing recreational enjoyment and excitement, as a leisure preference, implies users’ openness and novelty-seeking, indicating possible links to life satisfaction.
- (5)
- Watching television. There is a decades-long debate over the links between watching television (TV) and wellbeing. Some researchers established the benefits of TV watching, as, after a loss in the interpersonal sphere, television viewing can play a valuable role in adaptation processes [56]. Despite recognized temporal enjoyments in viewing, several studies pointed to its potential harms, including links to the “bedroom culture” phenomenon, lower physical activity, and self-control [6,25,44,57,58,59,60]. However, some research indicates that television as a leisure preference, especially for shared viewing with the family, can be a good tool for socializing and relaxation [7]. Consequently, it can also be linked to life satisfaction.
- (6)
- Book reading. Book reading as a leisure activity plays a vital role in school-age years for lexical development [5], resulting in better verbal fluency, nonverbal problem-solving ability, and general knowledge [61]. There is also evidence on links between book reading and life quality in adulthood, as reading preferences expand a reader’s knowledge and reflect social differentiation [62]. Furthermore, research indicates that frequent readers achieve more and demonstrate higher IQ [63], and personality trait openness to experiences is a relevant indicator of reading preferences [54]. Based on previous research linking book reading with openness and numerous advantageous outcomes, it can be presumed that leisure book reading could also be linked to life satisfaction.
1.2. Mindfulness
1.3. Psychological Capital
1.4. Life Satisfaction
2. Materials and Methods
2.1. Sample
2.2. Instruments
2.2.1. The SWLS
2.2.2. The PCQ-12
2.2.3. The MAAS
2.2.4. Leisure Preferences
2.3. Statistical Analyses
3. Results
4. Discussion
5. Limitations
6. Conclusions
Author Contributions
Funding
Institutional Review Board Statement
Informed Consent Statement
Data Availability Statement
Conflicts of Interest
References
- Gammon, S.; Ramshaw, G. Distancing from the Present: Nostalgia and Leisure in Lockdown. Leis. Sci. 2021, 43, 131–137. [Google Scholar] [CrossRef]
- Cho, H. The Impacts of Leisure Nostalgia on Well-Being and Turnover Intention: The Mediating Roles of Leisure Satisfaction and Work Commitment. Leis. Sci. 2021, 1–21. [Google Scholar] [CrossRef]
- De Bloom, J.; Geurts, S.A.E.; Kompier, M.A.J. Vacation (after-) effects on employee health and well-being, and the role of vacation activities, experiences and sleep. J. Happiness Stud. 2013, 14, 613–633. [Google Scholar] [CrossRef] [Green Version]
- Newman, D.B.; Tay, L.; Diener, E. Leisure and Subjective Well-Being: A Model of Psychological Mechanisms as Mediating Factors. J. Happiness Stud. 2014, 15, 555–578. [Google Scholar] [CrossRef]
- Nippold, M.A.; Duthie, J.K.; Larsen, J. Literacy as a leisure activity: Free-time preferences of older children and young adolescents. Lang. Speech Heart Serv. Sch. 2005, 36, 93–102. [Google Scholar] [CrossRef]
- Kleiber, D.; McGuire, F.A.; Aybar-Damali, B.; Norman, W. Having more by doing less: The paradox of leisure constraints in later life. J. Leis. Res. 2008, 40, 343–359. [Google Scholar] [CrossRef]
- Fedele, M.; García-Muñoz, N.; Prado, E. Catalan adolescents’ media uses and leisure preferences related to new media and television. Catalan J. Commun. Cult. Stud. 2015, 7, 51–70. [Google Scholar] [CrossRef] [Green Version]
- Conine, D.E.; Vollmer, T.R. Relative preferences for edible and leisure stimuli in children with autism. J. Appl. Behav. Anal. 2019, 52, 557–573. [Google Scholar] [CrossRef]
- Jiang, T.; Hou, J.; Sun, R.; Dai, L.; Wang, W.; Wu, H.; Zhang, T.; Su, B. Immunological and Psychological Efficacy of Meditation/Yoga Intervention among People Living with HIV (PLWH): A Systematic Review and Meta-analyses of 19 Randomized Controlled Trials. Ann. Behav. Med. 2021, 55, 505–519. [Google Scholar] [CrossRef]
- Lancioni, G.E.; Singh, N.N.; O’Reilly, M.F.; Sigafoos, J.; Chiapparino, C.; Stasolla, F.; Bosco, A.; De Pace, C.; Oliva, D. Enabling a young man with minimal motor behavior to manage independently his leisure television engagement. Percept. Mot. Skills 2007, 105, 47–54. [Google Scholar] [CrossRef] [PubMed]
- Sirgy, M.J.; Uysal, M.; Kruger, S. Towards a Benefits Theory of Leisure Well-Being. Appl. Res. Qual. Life 2017, 12, 205–228. [Google Scholar] [CrossRef]
- Katz-Gerro, T.; Meier Jæger, M. Does Women’s Preference for Highbrow Leisure Begin in the Family? Comparing Leisure Participation among Brothers and Sisters. Leis. Sci. 2015, 37, 415–430. [Google Scholar] [CrossRef]
- Rosa, C.D.; Larson, L.R.; Collado, S.; Cloutier, S.; Profice, C.C. Gender Differences in Connection to Nature, Outdoor Preferences, and Nature-Based Recreation Among College Students in Brazil and the United States. Leis. Sci. 2020, 1–21. [Google Scholar] [CrossRef]
- Xiao, X.; Lee, K.J.J.; Larson, L.R. Who visits U.S. national parks (and who doesn’t)? A national study of perceived constraints and vacation preferences across diverse populations. J. Leis. Res. 2021, 53, 1–22. [Google Scholar] [CrossRef]
- Wright Wendel, H.E.; Zarger, R.K.; Mihelcic, J.R. Accessibility and usability: Green space preferences, perceptions, and barriers in a rapidly urbanizing city in Latin America. Landsc. Urban Plan. 2012, 107, 272–282. [Google Scholar] [CrossRef]
- Shinew, K.J.; Floyd, M.F.; McGuire, F.A.; Noe, F.P. Class polarization and leisure activity preferences of African Americans: Intragroup comparisons. J. Leis. Res. 1996, 28, 219–232. [Google Scholar] [CrossRef]
- Mitchell, B.A.; Wister, A.V.; Fyffe, I.A. Leisure Time Satisfaction and Activity Preferences Among Ethnically Diverse Aging Parents in Metro Vancouver. J. Cross-Cult. Gerontol. 2021, 36, 387–406. [Google Scholar] [CrossRef]
- Floyd, M.F.; Shinew, K.J.; McGuire, F.A.; Noe, F.P. Race, Class, and Leisure Activity Preferences: Marginality and Ethnicity Revisited. J. Leis. Res. 1994, 26, 158–173. [Google Scholar] [CrossRef]
- Headey, B.; Trommsdorff, G.; Wagner, G.G. Alternative Recipes for Life Satisfaction: Evidence from Five World Regions. Appl. Res. Qual. Life 2021. [Google Scholar] [CrossRef]
- Kim, J.; Lee, S.; Chun, S.; Han, A.; Heo, J. The effects of leisure-time physical activity for optimism, life satisfaction, psychological well-being, and positive affect among older adults with loneliness. Ann. Leis. Res. 2017, 20, 406–415. [Google Scholar] [CrossRef]
- Lepp, A. Correlating leisure and happiness: The relationship between the leisure experience battery and the Satisfaction With Life Scale. Ann. Leis. Res. 2018, 21, 246–252. [Google Scholar] [CrossRef]
- Barnett, L.A. Accounting for leisure preferences from within: The relative contributions of gender, race or ethnicity, personality, affective style, and motivational orientation. J. Leis. Res. 2006, 38, 445–474. [Google Scholar] [CrossRef]
- An, B.; Sato, M.; Harada, M. Grit, Leisure Involvement, and Life Satisfaction: A Case of Amateur Triathletes in Japan. Leis. Sci. 2021, 1–17. [Google Scholar] [CrossRef]
- Cheng, E.H.P.; Patterson, I.; Packer, J.; Pegg, S. Identifying the satisfactions derived from leisure gardening by older adults. Ann. Leis. Res. 2010, 13, 395–419. [Google Scholar] [CrossRef]
- Gould, J.; Donnelly, R.; Innacchione, B. Turning over a new leaf in Colorado: An exploration of legalized recreational marijuana preferences, leisure interests, and leisure motivations in a sample of young adults. World Leis. J. 2019, 61, 113–130. [Google Scholar] [CrossRef]
- Izquierdo Sanchez, S.; Elliott, C.; Simmons, R. Substitution between leisure activities: A quasi-natural experiment using sports viewing and cinema attendance. Appl. Econ. 2016, 48, 3848–3860. [Google Scholar] [CrossRef] [Green Version]
- Zhou, J.; Wang, H.; Rajaram, S.S.; Britigan, D.H.; Su, D. Changes in leisure time physical activity preferences and hypertension risk. Am. J. Health Behav. 2019, 43, 145–157. [Google Scholar] [CrossRef] [PubMed]
- Houge Mackenzie, S.; Brymer, E. Conceptualizing adventurous nature sport: A positive psychology perspective. Ann. Leis. Res. 2020, 23, 79–91. [Google Scholar] [CrossRef] [Green Version]
- Marques, C.; Reis, E.; Menezes, J.; de Fátima Salgueiro, M. Modelling preferences for nature-based recreation activities. Leis. Stud. 2017, 36, 89–107. [Google Scholar] [CrossRef]
- Bo Andersen, L.; Schnohr, P.; Schroll, M.; Ole Hein, H. All-cause mortality associated with physical activity during leisure time, work, sports, and cycling to work. Arch. Intern. Med. 2000, 160, 1621–1628. [Google Scholar] [CrossRef]
- Schmiedeberg, C.; Schröder, J. Leisure Activities and Life Satisfaction: An Analysis with German Panel Data. Appl. Res. Qual. Life 2017, 12, 137–151. [Google Scholar] [CrossRef]
- Pinquart, M.; Silbereisen, R.K. Patterns of fulfilment in the domains of work, intimate relationship, and leisure. Appl. Res. Qual. Life 2010, 5, 147–164. [Google Scholar] [CrossRef]
- Kekäläinen, T.; Freund, A.M.; Sipilä, S.; Kokko, K. Cross-Sectional and Longitudinal Associations between Leisure Time Physical Activity, Mental Well-Being and Subjective Health in Middle Adulthood. Appl. Res. Qual. Life 2020, 15, 1099–1116. [Google Scholar] [CrossRef] [Green Version]
- Hakoköngäs, E.; Puhakka, R. Happiness from Nature? Adolescents’ Conceptions of the Relation between Happiness and Nature in Finland. Leis. Sci. 2021, 1–20. [Google Scholar] [CrossRef]
- Kim, J.; Heo, J.; Dvorak, R.; Ryu, J.; Han, A. Benefits of leisure activities for health and life satisfaction among Western migrants. Ann. Leis. Res. 2018, 21, 47–57. [Google Scholar] [CrossRef]
- Chick, G.; Hsu, Y.C.; Yeh, C.K.; Hsieh, C.M.; Bae, S.Y.; Iarmolenko, S. Cultural Consonance in Leisure, Leisure Satisfaction, Life Satisfaction, and Self-Rated Health in Urban Taiwan. Leis. Sci. 2016, 38, 402–423. [Google Scholar] [CrossRef]
- Pagán, R. How Do Leisure Activities Impact on Life Satisfaction? Evidence for German People with Disabilities. Appl. Res. Qual. Life 2015, 10, 557–572. [Google Scholar] [CrossRef]
- Yeh, C.K.; Chick, G. Hsiao Yao: A Chinese Analog of the Classical Western Idea of Leisure. Leis. Sci. 2021, 1–15. [Google Scholar] [CrossRef]
- Izenstark, D.; Middaugh, E. Patterns of family-based nature activities across the early life course and their association with adulthood outdoor participation and preference. J. Leis. Res. 2021, 1–23. [Google Scholar] [CrossRef]
- Crawford, D.W.; Houts, R.M.; Huston, T.L.; George, L.J. Compatibility, leisure, and satisfaction in marital relationships. J. Marriage Fam. 2002, 64, 433–449. [Google Scholar] [CrossRef]
- Williamson, M.; Zabriskie, R.; Townsend, J.; Ward, P.; Fellingham, G.; Kuznetsova, I. The contribution of family leisure to family functioning and family satisfaction among urban Russian families. Ann. Leis. Res. 2019, 22, 607–628. [Google Scholar] [CrossRef]
- Kyle, G.; Chick, G. The social nature of leisure involvement. J. Leis. Res. 2002, 34, 426–448. [Google Scholar] [CrossRef]
- Harmon, J.; Kyle, G.T. Positive emotions and passionate leisure involvement. Ann. Leis. Res. 2016, 19, 62–79. [Google Scholar] [CrossRef] [Green Version]
- Baranov, V.V.; Savinov, A.M.; Ashrafullina, G.S.; Makarov, A.L.; Korzhanova, A.A.; Dzhamalova, B.B.; Magomedrasulov, M.N. Youth Leisure in Cultural Space of Modern City: State and Prospects of Development. Propósitos Represent. 2020, 8. [Google Scholar] [CrossRef]
- Schroeder, S.A.; Cornicelli, L.; Fulton, D.C.; Merchant, S.S. The influence of motivation versus experience on recreation satisfaction: How appreciative- versus achievement-oriented recreation experience preferences relate to hunter satisfaction. J. Leis. Res. 2019, 50, 107–131. [Google Scholar] [CrossRef]
- Sari, D. A study on the qualities that affect preference of rural recreation areas. Appl. Ecol. Environ. Res. 2019, 17, 11509–11523. [Google Scholar] [CrossRef]
- Bailey, A.W.; Anderson, M.; Cox, G. The Cortex in Context: Investigating the Influence of Activity and Space on Psychological Well-Being. Leis. Sci. 2021, 1–18. [Google Scholar] [CrossRef]
- Finucane, M.L.; Fox, J.; Saksena, S.; Spencer, J.H. Understanding Society and Natural Resources; Springer: Dordrecht, The Netherlands, 2014; ISBN 978-94-017-8958-5. [Google Scholar]
- Rosa, C.D.; Profice, C.C.; Collado, S. Nature experiences and adults’ self-reported pro-environmental behaviors: The role of connectedness to nature and childhood nature experiences. Front. Psychol. 2018, 9, 1–10. [Google Scholar] [CrossRef]
- Brügger, A.; Kaiser, F.G.; Roczen, N. One for all?: Connectedness to nature, inclusion of nature, environmental identity, and implicit association with nature. Eur. Psychol. 2011, 16, 324–333. [Google Scholar] [CrossRef]
- Van Doorn, J.R.; Hortman, J.W. Environmental Intelligence and Relationships with Conservation, Nature Sensitivity and Exercise. Ph.D. Thesis, Troy University, Triy, AL, USA, 2012. [Google Scholar]
- O’Brien, E.; Roney, E. Worth the Wait? Leisure Can Be Just as Enjoyable With Work Left Undone. Psychol. Sci. 2017, 28, 1000–1015. [Google Scholar] [CrossRef] [PubMed]
- Karlis, G.; Stratas, A.; Webb, E. Canada-based peer-reviewed leisure studies research: From the 1970s to today. Loisir Soc. 2018, 41, 9–26. [Google Scholar] [CrossRef]
- Kraaykamp, G.; van Eijck, K. Personality, media preferences, and cultural participation. Pers. Individ. Dif. 2005, 38, 1675–1688. [Google Scholar] [CrossRef] [Green Version]
- Chidambaram, B.; Scheiner, J. Leisure quality among german parents—exploring urbanity, mobility, and partner interaction as determinants. Sustainability 2021, 13, 5883. [Google Scholar] [CrossRef]
- Van Der Goot, M.; Beentjes, J.W.J.; Van Selm, M. Meanings of television in older adults’ lives: An analysis of change and continuity in television viewing. Ageing Soc. 2012, 32, 147–168. [Google Scholar] [CrossRef]
- Pritchard, A.; Kharouf, H. Leisure consumption in cricket: Devising a model to contrast forms and time preferences. Leis. Stud. 2016, 35, 438–453. [Google Scholar] [CrossRef]
- Voigt, C.; Howat, G.; Brown, G. Hedonic and eudaimonic experiences among wellness tourists: An exploratory enquiry. Ann. Leis. Res. 2010, 13, 541–562. [Google Scholar] [CrossRef]
- Hanley, G.P.; Iwata, B.A.; Roscoe, E.M.; Thompson, R.H.; Lindberg, J.S. Response-Restriction Analysis: Ii. Alteration of Activity Preferences. J. Appl. Behav. Anal. 2003, 36, 59–76. [Google Scholar] [CrossRef] [Green Version]
- Teychenne, M.; Ball, K.; Salmon, J. Correlates of socio-economic inequalities in women’s television viewing: A study of intrapersonal, social and environmental mediators. Int. J. Behav. Nutr. Phys. Act. 2012, 9, 3–9. [Google Scholar] [CrossRef] [Green Version]
- Torppa, M.; Niemi, P.; Vasalampi, K.; Lerkkanen, M.K.; Tolvanen, A.; Poikkeus, A.M. Leisure Reading (But Not Any Kind) and Reading Comprehension Support Each Other—A Longitudinal Study Across Grades 1 and 9. Child Dev. 2020, 91, 876–900. [Google Scholar] [CrossRef]
- Kraaykamp, G.; Dijkstra, K. Preferences in leisure time book reading: A study on the social differentiation in book reading for the Netherlands. Poetics 1999, 26, 203–234. [Google Scholar] [CrossRef]
- Mol, S.E.; Bus, A.G. To Read or Not to Read: A Meta-Analysis of Print Exposure From Infancy to Early Adulthood. Psychol. Bull. 2011, 137, 267–296. [Google Scholar] [CrossRef] [PubMed] [Green Version]
- Brown, K.W.; Ryan, R.M. The Benefits of Being Present: Mindfulness and Its Role in Psychological Well-Being. J. Personal. Soc. Psychol. 2003, 84, 822–848. [Google Scholar] [CrossRef] [PubMed] [Green Version]
- Kabat-Zinn, J. Mindfulness-based interventions in context: Past, present, and future. Clin. Psychol. Sci. Pract. 2003, 10, 144–156. [Google Scholar] [CrossRef]
- Méndez Prado, S.M.; Rosado Anastacio, J.A. An assessment of mindfulness intervention as a regular subject in Ecuadorian higher education. Int. J. Adolesc. Youth 2018, 23, 520–529. [Google Scholar] [CrossRef] [Green Version]
- Koszycki, D.; Raab, K.; Aldosary, F.; Bradwejn, J. A multifaith spiritually based intervention for generalized anxiety disorder: A pilot randomized trial. J. Clin. Psychol. 2010, 66, 430–441. [Google Scholar] [CrossRef]
- Trammel, R. Effectiveness of an MP3 Christian mindfulness intervention on mindfulness and perceived stress. Ment. Health Relig. Cult. 2018, 21, 500–514. [Google Scholar] [CrossRef]
- Trammel, R.C.; Park, G.; Karlsson, I. Religiously oriented mindfulness for social workers: Effects on mindfulness, heart rate variability, and personal burnout. J. Relig. Spiritual. Soc. Work 2021, 40, 19–38. [Google Scholar] [CrossRef]
- Baltruschat, S.; Cándido, A.; Maldonado, A.; Verdejo-Lucas, C.; Catena-Verdejo, E.; Catena, A. There Is More to Mindfulness Than Emotion Regulation: A Study on Brain Structural Networks. Front. Psychol. 2021, 12, 1–10. [Google Scholar] [CrossRef] [PubMed]
- Sajjad, A.; Shahbaz, W. Mindfulness and Social Sustainability: An Integrative Review. Soc. Indic. Res. 2020, 150, 73–94. [Google Scholar] [CrossRef]
- Kotzé, M. The influence of psychological capital, self-leadership, and mindfulness on work engagement. S. Afr. J. Psychol. 2018, 48, 279–292. [Google Scholar] [CrossRef] [Green Version]
- Dong, X.; Xiang, Y.; Zhao, J.; Li, Q.; Zhao, J.; Zhang, W. How mindfulness affects benign and malicious envy from the perspective of the mindfulness reperceiving model. Scand. J. Psychol. 2020, 61, 436–442. [Google Scholar] [CrossRef]
- Mu, L. Effects of mindfulness training on psychological capital, depression, and procrastination of the youth demographic. Iran J. Public Health 2020, 49, 1692–1700. [Google Scholar]
- De Barros, V.V.; Kozasa, E.H.; De Souza, I.C.W.; Ronzani, T.M. Validity evidence of the Brazilian version of the mindful attention awareness scale (MAAS). Psicol. Reflex. Crit. 2015, 28, 87–95. [Google Scholar] [CrossRef] [Green Version]
- Roche, M.; Haar, J.M.; Luthans, F. The role of mindfulness and psychological capital on the well-being of leaders. J. Occup. Health Psychol. 2014, 19, 476–489. [Google Scholar] [CrossRef] [PubMed] [Green Version]
- Ahmed, S.K.; Khan, M.M.; Khan, R.A.; Mujtaba, B.G. The Relationship Between Social Capital and Psychological Well-Being: The Mediating Role of Internet Marketing. Mark. Manag. Innov. 2020, 1, 40–53. [Google Scholar] [CrossRef]
- Arnold, M.; Rigotti, T. Is it Getting Better or Worse? Health-Oriented Leadership and Psychological Capital as Resources for Sustained Health in Newcomers. Appl. Psychol. 2020, 70, 709–737. [Google Scholar] [CrossRef]
- Avey, J.B.; Luthans, F.; Youssef, C.M. The Additive Value of Positive Psychological Capital in Predicting Work Attitudes and Behaviors. J. Manag. 2010, 36, 430–452. [Google Scholar] [CrossRef] [Green Version]
- Avey, J.B.; Wernsing, T.S.; Luthans, F. Can Positive Employees Help Positive Organizational Change? Impact of Psychological Capital and Emotions on Relevant Attitudes and Behaviors. J. Appl. Behav. Sci. 2008, 44, 48–70. [Google Scholar] [CrossRef] [Green Version]
- Avey, J.B.; Luthans, F.; Jensen, S.M. Psychological Capital: A Positive resource for combating employees stress and turnover. Hum. Resour. Manag. 2009, 48, 677–693. [Google Scholar] [CrossRef]
- Avey, J.B.; Luthans, F.; Smith, R.M.; Palmer, N.F. Impact of positive psychological capital on employee well-being over time. J. Occup. Health Psychol. 2010, 15, 17–28. [Google Scholar] [CrossRef] [PubMed] [Green Version]
- Luthans, F.; Avolio, B.J.; Avey, J.B.; Norman, S.M. Positive Psychological Capital: Measurement and Relationship with Performance and Satisfaction Positive Psychological Capital: Measurement and Relationship with performance and satisfaction. Pers. Psychol. 2007, 60, 541–572. [Google Scholar] [CrossRef] [Green Version]
- Luthans, F.; Norman, S.M.; Avolio, B.J.; Avey, J.B. The mediating role of psychological capital in the supportive organizational climate—employee performance relationship. J. Organ. Behav. 2008, 29, 219–238. [Google Scholar] [CrossRef] [Green Version]
- Luthans, F.; Youssef, C.M.; Rawski, S.L. A Tale of Two Paradigms: The Impact of Psychological Capital and Reinforcing Feedback on Problem Solving and Innovation. J. Organ. Behav. Manag. 2011, 31, 333–350. [Google Scholar] [CrossRef] [Green Version]
- Luthans, F. Developing the Psychological Capital of Resiliency. Hum. Resour. Dev. Rev. 2006, 5, 25–44. [Google Scholar] [CrossRef] [Green Version]
- Manzano-García, G.; Ayala, J.C. Relationship between psychological capital and psychological well-being of direct support staff of specialist autism services. The mediator role of burnout. Front. Psychol. 2017, 8, 2277. [Google Scholar] [CrossRef] [PubMed] [Green Version]
- Maykrantz, S.A.; Langlinais, L.A.; Houghton, J.D.; Neck, C.P. Self-Leadership and Psychological Capital as Key Cognitive Resources for Shaping Health-Protective Behaviors during the COVID-19 Pandemic. Adm. Sci. 2021, 11, 41. [Google Scholar] [CrossRef]
- Datu, J.A.D.; Valdez, J.P.M. Psychological capital is associated with higher levels of life satisfaction and school belongingness. Sch. Psychol. Int. 2019, 40, 331–346. [Google Scholar] [CrossRef]
- Pathak, D.; Joshi, G. Impact of psychological capital and life satisfaction on organizational resilience during COVID-19: Indian tourism insights. Curr. Issues Tour. 2021, 24, 2398–2415. [Google Scholar] [CrossRef]
- Santisi, G.; Lodi, E.; Magnano, P.; Zarbo, R.; Zammitti, A. Relationship between psychological capital and quality of life: The role of courage. Sustainability 2020, 12, 5238. [Google Scholar] [CrossRef]
- Luthans, F.; Youssef, C.M.; Sweetman, D.S.; Harms, P.D. Meeting the leadership challenge of employee well-being through relationship Psycap and health PsyCap. J. Leadersh. Organ. Stud. 2013, 20, 118–133. [Google Scholar] [CrossRef]
- Lorenz, T.; Beer, C.; Pütz, J.; Heinitz, K. Measuring Psychological Capital: Construction and Validation of the Compound PsyCap Scale (CPC-12). PLoS ONE 2016, 11, e0152892. [Google Scholar] [CrossRef] [PubMed] [Green Version]
- Diener, E.; Inglehart, R.; Tay, L. Theory and Validity of Life Satisfaction Scales. Soc. Indic. Res. 2013, 112, 497–527. [Google Scholar] [CrossRef]
- Diener, E.; Tay, L.; Oishi, S. Rising Income and the Subjective Well-Being of Nations. J. Personal. Soc. Psychol. 2013, 104, 267–276. [Google Scholar] [CrossRef] [PubMed]
- Sato, M.; Jordan, J.S.; Funk, D.C.; Sachs, M.L. Running involvement and life satisfaction: The role of personality. J. Leis. Res. 2018, 49, 1–18. [Google Scholar] [CrossRef]
- Heo, J.; Stebbins, R.A.; Kim, J.; Lee, I. Serious Leisure, Life Satisfaction, and Health of Older Adults. Leis. Sci. 2013, 35, 16–32. [Google Scholar] [CrossRef]
- Kim, B.; Lee, Y.; Chun, S. An exploratory study examining the relationships between the leisure- related variables and subjective well-being of community residents. Ann. Leis. Res. 2010, 13, 613–629. [Google Scholar] [CrossRef]
- Kim, M.; Jasper, A.D.; Lee, J.; Won, H. Work, Leisure, and Life Satisfaction for Employees with Physical Disabilities in South Korea. Appl. Res. Qual. Life 2021. [Google Scholar] [CrossRef]
- Diener, E.; Emmons, R.A.; Larsem, R.J.; Griffin, S. The Satisfaction With Life Scale. J. Personal. Assess. 1985, 49, 71–75. [Google Scholar] [CrossRef] [PubMed]
- Dirzyte, A.; Perminas, A.; Biliuniene, E. Psychometric properties of satisfaction with life scale (Swls) and psychological capital questionnaire (pcq-24) in the lithuanian population. Int. J. Environ. Res. Public Health 2021, 18, 2608. [Google Scholar] [CrossRef]
- Gouveia, V.V.; Milfont, T.L.; da Fonseca, P.N.; de Miranda Coelho, J.A.P. Life satisfaction in Brazil: Testing the psychometric properties of the Satisfaction With Life Scale (SWLS) in five Brazilian samples. Soc. Indic. Res. 2009, 90, 267–277. [Google Scholar] [CrossRef]
- Jovanović, V.; Lazić, M.; Gavrilov-Jerković, V. Measuring life satisfaction among psychiatric patients: Measurement invariance and validity of the Satisfaction with Life Scale. Clin. Psychol. Psychother. 2020, 27, 378–383. [Google Scholar] [CrossRef] [PubMed]
- Kamei, H.; Ferreira, M.C.; Valentini, F.; Peres, M.F.P.; Kamei, P.T.; Damásio, B.F. Psychological capital questionnaire—short version (PCQ-12): Evidence of validity of the Brazilian version. Psico-USF 2018, 23, 203–214. [Google Scholar] [CrossRef] [Green Version]
- Murgić, D.; Rijavec, M.; Miljković, D. Initial validation of the shortened psychological capital uestionnaire (PCQ-12) on Croatian sample. Ekon. Pregl. 2019, 70, 3–21. [Google Scholar] [CrossRef]
- Santana-Cárdenas, S.; Viseu, J.; Inmaculada López Núñez, M.; Neves, S.; Jesús, D. Validity and reliability evidence of the Psychological Capital Questionnaire-12 in a sample of Mexican workers. Ann. Psychol. 2018, 34, 562–570. [Google Scholar] [CrossRef]
- León-Pérez, J.M.; Antino, M.; León-Rubio, J.M. Adaptation of the short version of the Psychological Capital Questionnaire (PCQ-12) into Spanish/Adaptación al español de la versión reducida del Cuestionario de Capital Psicológico (PCQ-12). Rev. Psicol. Soc. 2017, 32, 196–213. [Google Scholar] [CrossRef]
- Brown, K.W.; Ryan, R.M. Mindful Attention Awareness Scale. Mindful Atten. Aware. Scale 2003, 4–5. [Google Scholar] [CrossRef]
- Seema, R.; Quaglia, J.T.; Brown, K.W.; Sircova, A.; Konstabel, K.; Baltin, A. The Estonian Mindful Attention Awareness Scale: Assessing Mindfulness Without a Distinct Linguistic Present Tense. Mindfulness 2015, 6, 759–766. [Google Scholar] [CrossRef]
- Buz, J.; Gómez-Martínez, Á.M.; Crego, A.; Yela, J.R.; Sánchez-Zaballos, E. Validity Evidence of the Spanish Version of the Mindful Attention Awareness Scale Using the Rasch Measurement Model. Assessment 2021. [Google Scholar] [CrossRef] [PubMed]
- Deng, Y.Q.; Li, S.; Tang, Y.Y.; Zhu, L.H.; Ryan, R.; Brown, K. Psychometric properties of the Chinese translation of the mindful attention awareness scale (MAAS). Mindfulness 2012, 3, 10–14. [Google Scholar] [CrossRef]
- Nooripour, R.; Ghanbari, N.; Hoseinian, S.; Vakili, Y.; Dobkins, K. Psychometric Validation of the Farsi Version of the Mindful Attention Awareness Scale (MAAS) in a Sample of Iranian Students in the USA. Int. J. Ment. Health Addict. 2021. [Google Scholar] [CrossRef]
- Michalak, J.; Heidenreich, T.; Ströhle, G.; Nachtigall, C. Die deutsche version der Mindful Attention and Awareness Scale (MAAS) Psychometrische befunde zu einem achtsamkeitsfragebogen. Z. Klin. Psychol. Psychother. 2008, 37, 200–208. [Google Scholar] [CrossRef]
- Jermann, F.; Billieux, J.; Larøi, F.; d’Argembeau, A.; Bondolfi, G.; Zermatten, A.; Van der Linden, M. Mindful Attention Awareness Scale (MAAS): Psychometric Properties of the French Translation and Exploration of Its Relations With Emotion Regulation Strategies. Psychol. Assess. 2009, 21, 506–514. [Google Scholar] [CrossRef]
- Şimşek, G.G.; Noyan, F. McDonald’s ω t, Cronbach’s α, and Generalized θ for Composite Reliability of Common Factors Structures. Commun. Stat.—Simul. Comput. 2013, 42, 2008–2025. [Google Scholar] [CrossRef]
- Byrne, B.M. Structural Equation Modeling With AMOS; Routledge: New York, NY, USA, 2013; ISBN 9781138797031. [Google Scholar]
- Kline, R.B. Principles and Practices of Structural Equation Modelling, 4th ed.; The Guilford Press: New York, NY, USA, 2016; ISBN 9781609182304. [Google Scholar]
- Murtaugh, P.A. In defense of P values. Ecology 2014, 95, 811–817. [Google Scholar] [CrossRef] [Green Version]
- Richter, N.F.; Sinkovics, R.R.; Ringle, C.M.; Schlägel, C. A critical look at the use of SEM in international business research. Int. Mark. Rev. 2016, 33, 376–404. [Google Scholar] [CrossRef]
- Bagozzi, R.P.; Yi, Y. Specification, evaluation, and interpretation of structural equation models. J. Acad. Mark. Sci. 2012, 40, 8–34. [Google Scholar] [CrossRef]
- Tabachnick, B.G.; Fidell, L.S. Using Multivariate Statistics; Pearson Education Limited: New York, NY, USA, 2014. [Google Scholar]
- Delacre, M.; Lakens, D.; Leys, C. Why psychologists should by default use welch’s t-Test instead of student’s t-Test. Int. Rev. Soc. Psychol. 2017, 30, 92–101. [Google Scholar] [CrossRef] [Green Version]
- Sardeshmukh, S.R.; Vandenberg, R.J. Integrating Moderation and Mediation: A Structural Equation Modeling Approach. Organ. Res. Methods 2017, 20, 721–745. [Google Scholar] [CrossRef]
- Jose, P. Doing Stats Mediation and Moderation; The Guilford Press: New York, NY, USA; London, UK, 2013; ISBN 9781462508150. [Google Scholar]
- Dirzyte, A.; Patapas, A. Positive Organizational Practices, Life Satisfaction, and Psychological Capital in the Public and Private Sectors. Sustainability 2022, 14, 488. [Google Scholar] [CrossRef]
- Bajwa, J.; Abai, M.; Couto, S.; Kidd, S.; Dibavar, A.; McKenzie, K. Psychological capital and life satisfaction of refugees in Canada: Evidence from a community-based educational support program. J. Community Psychol. 2019, 47, 504–516. [Google Scholar] [CrossRef]
- Bockorny, K.; Youssef-Morgan, C.M. Entrepreneurs’ courage, psychological capital, and life satisfaction. Front. Psychol. 2019, 10, 789. [Google Scholar] [CrossRef] [Green Version]
- Zhang, R.; Ewalds-Kvist, B.M.; Li, D.; Jiang, J. Chinese Students’ Satisfaction with Life Relative to Psychological Capital and Mediated by Purpose in Life. Curr. Psychol. 2019, 38, 260–271. [Google Scholar] [CrossRef]
- Cheung, R.Y.M.; Lau, E.N.S. Is Mindfulness Linked to Life Satisfaction? Testing Savoring Positive Experiences and Gratitude as Mediators. Front. Psychol. 2021, 12, 591103. [Google Scholar] [CrossRef] [PubMed]
- Liang, S.; Dong, M.; Zhao, H.; Song, Y.; Yang, A. Mindfulness and life satisfaction: The moderating effect of self-control and the moderated moderating effect of resilience. Personal. Individ. Dif. 2022, 185, 111241. [Google Scholar] [CrossRef]
- Ali, M.; Khan, A.N.; Khan, M.M.; Butt, A.S.; Shah, S.H.H. Mindfulness and study engagement: Mediating role of psychological capital and intrinsic motivation. J. Prof. Cap. Community 2021. [Google Scholar] [CrossRef]
- Tu, H.M. Does active leisure participation promote psychological capital through peer support in economically disadvantaged children? PLoS ONE 2020, 15, e0234143. [Google Scholar] [CrossRef]
- Kim, A.C.H.; Ryu, J.; Lee, C.; Kim, K.M.; Heo, J. Sport Participation and Happiness Among Older Adults: A Mediating Role of Social Capital. J. Happiness Stud. 2021, 22, 1623–1641. [Google Scholar] [CrossRef]
- Chang, W.H.; Chang, J.H.; Chen, L.H. Mindfulness Enhances Change in Athletes’ Well-being: The Mediating Role of Basic Psychological Needs Fulfillment. Mindfulness 2018, 9, 815–823. [Google Scholar] [CrossRef]
- Chen, L.H.; Wu, C.H.; Chang, J.H. Gratitude and Athletes’ Life Satisfaction: The Moderating Role of Mindfulness. J. Happiness Stud. 2017, 18, 1147–1159. [Google Scholar] [CrossRef] [Green Version]
- Luthans, F.; Youssef-Morgan, C.M. Psychological Capital: An Evidence-Based Positive Approach. Annu. Rev. Organ. Psychol. Organ. Behav. 2017, 4, 339–366. [Google Scholar] [CrossRef] [Green Version]
- Tomczyk, S.; Altweck, L.; Schmidt, S. How is the way we spend our time related to psychological wellbeing? A cross-sectional analysis of time-use patterns in the general population and their associations with wellbeing and life satisfaction. BMC Public Health 2021, 21, 1858. [Google Scholar] [CrossRef] [PubMed]
- Arránz Becker, O.; Lois, D. Competing Pleasures? The Impact of Leisure Time Use on the Transition to Parenthood. J. Fam. Issues 2013, 34, 661–688. [Google Scholar] [CrossRef]
- Frederick, D.A.; Sandhu, G.; Morse, P.J.; Swami, V. Correlates of appearance and weight satisfaction in a U.S. National Sample: Personality, attachment style, television viewing, self-esteem, and life satisfaction. Body Image 2016, 17, 191–203. [Google Scholar] [CrossRef] [PubMed]
- Wiese, C.W.; Kuykendall, L.; Tay, L. Get active? A meta-analysis of leisure-time physical activity and subjective well-being. J. Posit. Psychol. 2018, 13, 57–66. [Google Scholar] [CrossRef]
- Yoon, H.; Lee, W.S.; Kim, K.B.; Moon, J. Effects of leisure participation on life satisfaction in older korean adults: A panel analysis. Int. J. Environ. Res. Public Health 2020, 17, 4402. [Google Scholar] [CrossRef] [PubMed]
- Gatersleben, B.; Jackson, T.; Meadows, J.; Soto, E.; Yan, Y.L. Leisure, materialism, well-being and the environment. Rev. Eur. Psychol. Appl. 2018, 68, 131–139. [Google Scholar] [CrossRef]
- Lee, H.; Heo, S. Arts and Cultural Activities and Happiness: Evidence from Korea. Appl. Res. Qual. Life 2021, 16, 1637–1651. [Google Scholar] [CrossRef]
- Ateca-Amestoy, V.; Ugidos, A. Gender differences in cultural and sports activities attendance: An intra-couple analysis. Appl. Econ. 2021, 53, 6426–6438. [Google Scholar] [CrossRef]
- Sharma, B.; Nam, E.W.; Kim, D.; Yoon, Y.M.; Kim, Y.; Kim, H.Y. Role of gender, family, lifestyle and psychological factors in self-rated health among urban adolescents in Peru: A school-based cross-sectional survey. BMJ Open 2016, 6, 1–8. [Google Scholar] [CrossRef] [Green Version]
- Hwang, H.; Lee, Y. Effects of Relative Leisure Deprivation between Regions on Life Satisfaction in Koreans: Focusing on Baby Boomers. Int. J. Environ. Res. Public Health 2021, 18, 12905. [Google Scholar] [CrossRef]
- Bum, C.H.; Hums, M.A.; Picklesimer, A.; Choi, C. Comparison of the influence of participation in screen golf on self-esteem, loneliness, depression, social isolation, and life satisfaction between people with and without disabilities in Republic of Korea. Phys. Cult. Sport. Stud. Res. 2021, 89, 11–21. [Google Scholar] [CrossRef]
- Van der Zwan, P.; Hessels, J.; Rietveld, C.A. Self-employment and satisfaction with life, work, and leisure. J. Econ. Psychol. 2018, 64, 73–88. [Google Scholar] [CrossRef] [Green Version]
- Jia, S. Leisure motivation and satisfaction: A text mining of yoga centres, yoga consumers, and their interactions. Sustainability 2018, 10, 4458. [Google Scholar] [CrossRef] [Green Version]
- Ahn, B.W.; Song, W.I. A study of differences in leisure satisfaction of leisure activity patterns for South Korean adults. Int. J. Environ. Res. Public Health 2021, 18, 10790. [Google Scholar] [CrossRef]
- Hartanto, A.; Lua, V.Y.; Quek, F.Y.; Yong, J.C.; Ng, M.H. A critical review on the moderating role of contextual factors in the associations between video gaming and well-being. Comput. Hum. Behav. Rep. 2021, 4, 100135. [Google Scholar] [CrossRef]
- Tooth, L.R.; Moss, K.M.; Mishra, G.D. Screen time and child behaviour and health-related quality of life: Effect of family context. Prev. Med. 2021, 153, 106795. [Google Scholar] [CrossRef]
- Chen, N.; Tsai, C.T.L. Rural-Urban Divide and the Social Stratification in Leisure Participation in China: Application of Multiple Hierarchy Stratification Perspective. Appl. Res. Qual. Life 2020, 15, 1535–1548. [Google Scholar] [CrossRef]
- Nawijn, J. Determinants of Daily Happiness on Vacation. J. Travel Res. 2011, 50, 559–566. [Google Scholar] [CrossRef]
- Vacchiano, M.; Bolano, D. Online and offline leisure, relatedness and psychological distress: A study of young people in Switzerland. Leis. Stud. 2021, 40, 338–351. [Google Scholar] [CrossRef]
- Vacchiano, M.; Valente, R. Did the screens win? An autoregressive model linking leisure, relatedness and mental health. Comput. Hum. Behav. 2021, 120, 106755. [Google Scholar] [CrossRef]


| Scales | McDonald’s ω | Cronbach’s α |
|---|---|---|
| Psychological Capital, overall | 0.890 | 0.889 |
| Psychological Capital, work | 0.893 | 0.892 |
| Psychological Capital, relationship | 0.891 | 0.890 |
| Psychological Capital, health | 0.884 | 0.882 |
| Mindful Attention Awareness | 0.862 | 0.859 |
| Satisfaction with Life | 0.882 | 0.881 |
| Scales | Shapiro-Wilk | p | Skewness | SE | Kurtosis | SE |
|---|---|---|---|---|---|---|
| Psychological Capital, overall | 0.987 | >0.001 | −0.352 | 0.117 | 0.318 | 0.234 |
| Psychological Capital, work | 0.991 | 0.008 | −0.254 | 0.117 | −0.114 | 0.234 |
| Psychological Capital, relationship | 0.986 | >0.001 | −0.368 | 0.118 | 0.024 | 0.235 |
| Psychological Capital, health | 0.990 | 0.004 | −0.318 | 0.118 | 0.234 | 0.235 |
| Mindful Attention Awareness | 0.984 | 0.001 | −0.465 | 0.134 | 0.286 | 0.267 |
| Satisfaction with Life | 0.987 | >0.001 | −0.122 | 0.103 | −0.548 | 0.206 |
| Types of Leisure Preferences | Total, % | Total, n | Female, n | Male, n |
|---|---|---|---|---|
| Spending time in nature | 51.87 | 305 | 249 | 52 |
| Spending time with family | 67.57 | 398 | 326 | 68 |
| Spending time with friends | 40.23 | 237 | 183 | 51 |
| Reading books | 59.35 | 349 | 311 | 35 |
| Watching TV | 44.14 | 260 | 205 | 51 |
| Participating in events | 38.71 | 228 | 197 | 27 |
| Types of Leisure Preferences | Nature | Family | Friends | Books | TV | Age |
|---|---|---|---|---|---|---|
| Spending time in nature | - | 0.017 | ||||
| Spending time with family | 0.034 | - | −0.092 * | |||
| Spending time with friends | 0.069 | −0.048 | - | −0.306 ** | ||
| Reading books | 0.018 | −0.129 ** | 0.008 | - | 0.239 ** | |
| Watching TV | 0.016 | −0.038 | 0.083 * | 0.224 *** | − | 0.216 ** |
| Participating in events | 0.036 | −0.059 | 0.153 *** | 0.240 *** | 0.103 * | 0.117 ** |
| Factor Model | χ2 | Df | GFI | CFI | TLI | NFI | RMSEA [90% CI] | SRMR |
|---|---|---|---|---|---|---|---|---|
| Psychological capital, overall | 320.848 | 44 | 0.985 | 0.978 | 0.972 | 0.974 | 0.120 [0.108–0.133] | 0.067 |
| Psychological capital, work | 255.238 | 54 | 0.989 | 0.986 | 0.983 | 0.983 | 0.093 [0.082–0.105] | 0.056 |
| Psychological capital, relationship | 124.316 | 35 | 0.990 | 0.987 | 0.984 | 0.984 | 0.091 [0.078–0.104] | 0.054 |
| Psychological capital, health | 506.283 | 54 | 0.975 | 0.964 | 0.956 | 0.960 | 0.140 [0.129–0.151] | 0.083 |
| Mindful Attention Awareness | 156.282 | 90 | 0.991 | 0.993 | 0.991 | 0.983 | 0.047 [0.034–0.059] | 0.051 |
| Satisfaction with Life | 6406.246 | 5 | 0.999 | 0.999 | 0.999 | 0.999 | 0.022 [0.000–0.066] | 0.014 |
| Scales | Mean | SD | 1 | 2 | 3 | 4 | 5 |
|---|---|---|---|---|---|---|---|
| 1. Psychological Capital, overall | 4.406 | 0.792 | - | ||||
| 2. Psychological Capital, work | 4.398 | 0.779 | 0.786 *** | - | |||
| 3. Psychological Capital, relationship | 4.339 | 0.834 | 0.802 *** | 0.689 *** | - | ||
| 4. Psychological Capital, health | 4.220 | 0.809 | 0.729 *** | 0.666 *** | 0.721 *** | - | |
| 5. Mindful Attention Awareness | 4.189 | 0.766 | 0.321 *** | 0.270 *** | 0.348 *** | 0.323 *** | - |
| 6. Satisfaction with Life | 4.276 | 1.315 | 0.469 *** | 0.387 *** | 0.470 *** | 0.422 *** | 0.199 *** |
| Scales | Nature | Family | Friends | Books | TV | Events |
|---|---|---|---|---|---|---|
| 1. Psychological Capital, overall | 0.100 * | 0.182 *** | 0.026 | −0.038 | −0.189 *** | 0.107 * |
| 2. Psychological Capital, work | 0.090 | 0.173 *** | −0.057 | 0.019 | −0.090 | 0.117 * |
| 3. Psychological Capital, relationship | 0.106 * | 0.239 *** | 0.006 | −0.077 | −0.158 ** | 0.063 |
| 4. Psychological Capital, health | 0.118 * | 0.133 ** | −0.003 | −0.051 | −0.140 ** | 0.056 |
| 5. Mindful Attention Awareness | 0.027 | 0.064 | −0.026 | −0.027 | −0.147 ** | 0.013 |
| 6. Satisfaction with Life | 0.014 | 0.185 *** | 0.059 | −0.007 | −0.081 | 0.108 * |
| Variables | Leisure Types | Mean | SD | t | df | p | Mean Difference | SE Difference | Cohen’s d |
|---|---|---|---|---|---|---|---|---|---|
| Life satisfaction | No TV | 4.393 | 1.245 | 2.367 | 484.597 | 0.018 | 0.269 | 0.114 | 0.204 |
| TV | 4.124 | 1.393 | |||||||
| Mindfulness | No TV | 4.303 | 0.724 | 3.115 | 294.607 | 0.002 | 0.264 | 0.085 | 0.348 |
| TV | 4.038 | 0.795 | |||||||
| PsyCap overall | No TV | 4.545 | 0.751 | 4.187 | 375.429 | <0.001 | 0.322 | 0.077 | 0.411 |
| TV | 4.223 | 0.817 | |||||||
| PsyCap work | No TV | 4.466 | 0.761 | 2.042 | 379.902 | 0.042 | 0.157 | 0.077 | 0.201 |
| TV | 4.309 | 0.805 | |||||||
| PsyCap relationship | No TV | 4.459 | 0.786 | 3.334 | 366.978 | <0.001 | 0.272 | 0.082 | 0.329 |
| TV | 4.187 | 0.869 | |||||||
| PsyCap health | No TV | 4.334 | 0.820 | 3.430 | 401.235 | <0.001 | 0.267 | 0.078 | 0.335 |
| TV | 4.067 | 0.774 |
| Variables | Leisure Types | Mean | SD | t | df | p | Mean Difference | SE Difference | Cohen’s d |
|---|---|---|---|---|---|---|---|---|---|
| Life satisfaction | Not Events | 4.171 | 1.311 | −2.443 | 443.701 | 0.015 | −0.280 | 0.114 | −0.213 |
| Events | 4.450 | 1.311 | |||||||
| Mindfulness | Not Events | 4.176 | 0.741 | −0.303 | 230.294 | 0.762 | −0.027 | 0.090 | −0.035 |
| Events | 4.203 | 0.810 | |||||||
| PsyCap overall | Not Events | 4.337 | 0.801 | −2.397 | 346.422 | 0.017 | −0.187 | 0.078 | −0.238 |
| Events | 4.524 | 0.773 | |||||||
| PsyCap work | Not Events | 4.323 | 0.789 | −2.620 | 348.586 | 0.009 | −0.201 | 0.077 | −0.260 |
| Events | 4.524 | 0.757 | |||||||
| PsyCap relationship | Not Events | 4.292 | 0.849 | −1.634 | 356.069 | 0.103 | −0.133 | 0.082 | −0.162 |
| Events | 4.426 | 0.800 | |||||||
| PsyCap health | Not Events | 4.172 | 0.834 | −1.596 | 360.574 | 0.111 | −0.126 | 0.079 | −0.158 |
| Events | 4.299 | 0.765 |
| Variables | Leisure Types | Mean | SD | t | df | p | Mean Difference | SE Difference | Cohen’s d |
|---|---|---|---|---|---|---|---|---|---|
| Life satisfaction | Not nature | 4.254 | 1.336 | −0.350 | 549.266 | 0.727 | −0.039 | 0.112 | −0.030 |
| Nature | 4.293 | 1.299 | |||||||
| Mindfulness | Not nature | 4.131 | 0.809 | −1.140 | 291.378 | 0.255 | −0.098 | 0.086 | −0.128 |
| Nature | 4.229 | 0.732 | |||||||
| PsyCap overall | Not nature | 4.297 | 0.799 | −2.669 | 415.595 | 0.008 | −0.205 | 0.077 | −0.259 |
| Nature | 4.501 | 0.783 | |||||||
| PsyCap work | Not nature | 4.327 | 0.792 | −1.765 | 412.711 | 0.078 | −0.134 | 0.076 | −0.172 |
| Nature | 4.461 | 0.773 | |||||||
| PsyCap relationship | Not nature | 4.236 | 0.832 | −2.445 | 413.661 | 0.015 | −0.197 | 0.081 | −0.238 |
| Nature | 4.433 | 0.826 | |||||||
| PsyCap health | Not nature | 4.101 | 0.789 | −2.827 | 417.945 | 0.005 | −0.221 | 0.078 | −0.275 |
| Nature | 4.321 | 0.818 |
| Variables | Leisure Types | Mean | SD | t | df | p | Mean Difference | SE Difference | Cohen’s d |
|---|---|---|---|---|---|---|---|---|---|
| Life satisfaction | Not family | 3.851 | 1.381 | −5.154 | 314.770 | <0.001 | −0.626 | 0.121 | −0.477 |
| Family | 4.477 | 1.237 | |||||||
| Mindfulness | Not family | 4.107 | 0.795 | −1.111 | 150.462 | 0.268 | −0.108 | 0.097 | −0.140 |
| Family | 4.215 | 0.755 | |||||||
| PsyCap overall | Not family | 4.193 | 0.846 | −3.647 | 232.232 | <0.001 | −0.311 | 0.085 | −0.388 |
| Family | 4.504 | 0.753 | |||||||
| PsyCap work | Not family | 4.200 | 0.783 | −3.518 | 244.616 | <0.001 | −0.287 | 0.082 | −0.371 |
| Family | 4.487 | 0.768 | |||||||
| PsyCap relationship | Not family | 4.064 | 0.843 | −4.632 | 237.296 | <0.001 | −0.403 | 0.087 | −0.491 |
| Family | 4.467 | 0.798 | |||||||
| PsyCap health | Not family | 4.076 | 0.908 | −2.311 | 215.592 | 0.022 | −0.209 | 0.090 | −0.250 |
| Family | 4.285 | 0.755 |
| Dependent Variable | Predictors/ Models | Unstandardized Coefficients | Standardized Coefficients | t | Sig. | R | R2 | Adjusted R2 | F | Sig. | |
|---|---|---|---|---|---|---|---|---|---|---|---|
| B | Std. Error | Beta | |||||||||
| Life Satisfaction | 1 (Constant) | 3.862 | 0.096 | 40.344 | 0.000 | 0.217 | 0.047 | 0.045 | 27.433 (1,555) | <0.001 | |
| Spend time with family | 0.104 | 0.020 | 0.217 | 5.238 | 0.000 | ||||||
| 2 (Constant) | 3.719 | 0.107 | 34.802 | 0.000 | 0.249 | 0.062 | 0.058 | 18.205 (2,555) | <0.001 | ||
| Spend time with family | 0.110 | 0.020 | 0.229 | 5.537 | 0.000 | ||||||
| Participate in events | 0.062 | 0.021 | 0.121 | 2.933 | 0.003 | ||||||
| 3 (Constant) | 3.819 | 0.116 | 32.814 | 0.000 | 0.263 | 0.069 | 0.064 | 13.728 (3,555) | <0.001 | ||
| Spend time with family | 0.108 | 0.020 | 0.225 | 5.458 | 0.000 | ||||||
| Participate in events | 0.065 | 0.021 | 0.127 | 3.071 | 0.002 | ||||||
| Watch TV | −0.043 | 0.020 | −0.088 | −2.131 | 0.034 | ||||||
| Mindfulness | 1 (Constant) | 4.294 | 0.055 | 77.383 | 0.000 | 0.162 | 0.026 | 0.023 | 8.775 (1,327) | 0.003 | |
| Watch TV | −0.045 | 0.015 | −0.162 | −2.962 | 0.003 | ||||||
| PsyCap overall | 1 (Constant) | 4.534 | 0.049 | 91.718 | 0.000 | 0.190 | 0.036 | 0.034 | 16.072 (1,428) | <0.001 | |
| Watch TV | −0.057 | 0.014 | −0.190 | −4.009 | 0.000 | ||||||
| 2 (Constant) | 4.323 | 0.073 | 59.228 | 0.000 | 0.263 | 0.069 | 0.065 | 15.878 (2,428) | <0.001 | ||
| Watch TV | −0.057 | 0.014 | −0.192 | −4.102 | 0.000 | ||||||
| Spend time with family | 0.053 | 0.014 | 0.182 | 3.892 | 0.000 | ||||||
| 3 (Constant) | 4.236 | 0.079 | 53.668 | 0.000 | 0.293 | 0.086 | 0.079 | 13.309 (3,428) | <0.001 | ||
| Watch TV | −0.058 | 0.014 | −0.195 | −4.203 | 0.000 | ||||||
| Spend time with family | 0.056 | 0.014 | 0.193 | 4.141 | 0.000 | ||||||
| Participate in events | 0.041 | 0.015 | 0.129 | 2.770 | 0.006 | ||||||
| 4 (Constant) | 4.132 | 0.087 | 47.343 | 0.000 | 0.318 | 0.101 | 0.093 | 11.932 (4,428) | <0.001 | ||
| Watch TV | −0.058 | 0.014 | −0.195 | −4.235 | 0.000 | ||||||
| Spend time with family | 0.055 | 0.013 | 0.189 | 4.083 | 0.000 | ||||||
| Participate in events | 0.043 | 0.015 | 0.137 | 2.955 | 0.003 | ||||||
| Spend time in nature | 0.037 | 0.014 | 0.124 | 2.686 | 0.008 | ||||||
| Dependent Variable | Predictors/ Models | Unstandardized Coefficients | Standardized Coefficients | t | Sig. | R | R2 | Adjusted R2 | F | Sig. | |
|---|---|---|---|---|---|---|---|---|---|---|---|
| B | Std. Error | Beta | |||||||||
| Life Satisfaction | Males | ||||||||||
| 1 (Constant) | 4.061 | 0.194 | 20.981 | 0.000 | 0.209 | 0.044 | 0.034 | 4.336 (1,96) | 0.040 | ||
| Spend time in nature | 0.106 | 0.051 | 0.209 | 2.082 | 0.040 | ||||||
| Females | |||||||||||
| 1 (Constant) | 3.834 | 0.105 | 36.389 | 0.000 | 0.230 | 0.053 | 0.051 | 25.229 (1,451) | 0.000 | ||
| Spend time with family | 0.109 | 0.022 | 0.230 | 5.023 | 0.000 | ||||||
| 2 (Constant) | 3.663 | 0.118 | 31.082 | 0.000 | 0.271 | 0.073 | 0.069 | 17.736 (2,451) | 0.000 | ||
| Spend time with family | 0.115 | 0.022 | 0.243 | 5.331 | 0.000 | ||||||
| Participate in events | 0.072 | 0.023 | 0.142 | 3.123 | 0.002 | ||||||
| Mindfulness | Males | ||||||||||
| 1 (Constant) | 3.802 | 0.145 | 26.203 | 0.000 | 0.330 | 0.109 | 0.093 | 6.722 (1,56) | 0.012 | ||
| Read books | 0.107 | 0.041 | 0.330 | 2.593 | 0.012 | ||||||
| Females | |||||||||||
| 1 (Constant) | 4.315 | 0.058 | 74.337 | 0.000 | 0.154 | 0.024 | 0.020 | 6.397 (1,265) | 0.012 | ||
| Watch TV | −0.042 | 0.016 | −0.154 | −2.529 | 0.012 | ||||||
| PsyCap overall | Males | ||||||||||
| 1 (Constant) | 4.101 | 0.190 | 21.539 | 0.000 | 0.265 | 0.070 | 0.058 | 5.902 (1,79) | 0.017 | ||
| Spend time with family | 0.096 | 0.039 | 0.265 | 2.429 | 0.017 | ||||||
| 2 (Constant) | 3.870 | 0.214 | 18.090 | 0.000 | 0.353 | 0.124 | 0.102 | 5.466 (2,79) | 0.006 | ||
| Spend time with family | 0.115 | 0.039 | 0.319 | 2.912 | 0.005 | ||||||
| Read books | 0.088 | 0.040 | 0.238 | 2.179 | 0.032 | ||||||
| Females | |||||||||||
| 1 (Constant) | 4.525 | 0.051 | 88.150 | 0.000 | 0.212 | 0.045 | 0.042 | 16.099 (1,343) | 0.000 | ||
| Watch TV | −0.059 | 0.015 | −0.212 | −4.012 | 0.000 | ||||||
| 2 (Constant) | 4.440 | 0.059 | 75.542 | 0.000 | |||||||
| Watch TV | −0.061 | 0.015 | −0.217 | −4.148 | 0.000 | 0.260 | 0.068 | 0.062 | 12.401 (2,343) | 0.000 | |
| Participate in events | 0.044 | 0.015 | 0.151 | 2.891 | 0.004 | ||||||
| 3 (Constant) | 4.254 | 0.083 | 51.249 | 0.000 | 0.306 | 0.094 | 0.086 | 11.731 (3,343) | 0.000 | ||
| Watch TV | −0.060 | 0.014 | −0.214 | −4.144 | 0.000 | ||||||
| Participate in events | 0.048 | 0.015 | 0.163 | 3.139 | 0.002 | ||||||
| Spend time with family | 0.044 | 0.014 | 0.162 | 3.123 | 0.002 | ||||||
| 4 (Constant) | 4.161 | 0.093 | 44.811 | 0.000 | 0.326 | 0.106 | 0.096 | 10.087 (4,343) | 0.000 | ||
| Watch TV | −0.060 | 0.014 | −0.213 | −4.147 | 0.000 | ||||||
| Participate in events | 0.050 | 0.015 | 0.170 | 3.299 | 0.001 | ||||||
| Spend time with family | 0.044 | 0.014 | 0.160 | 3.109 | 0.002 | ||||||
| Spend time in nature | 0.031 | 0.014 | 0.112 | 2.183 | 0.030 | ||||||
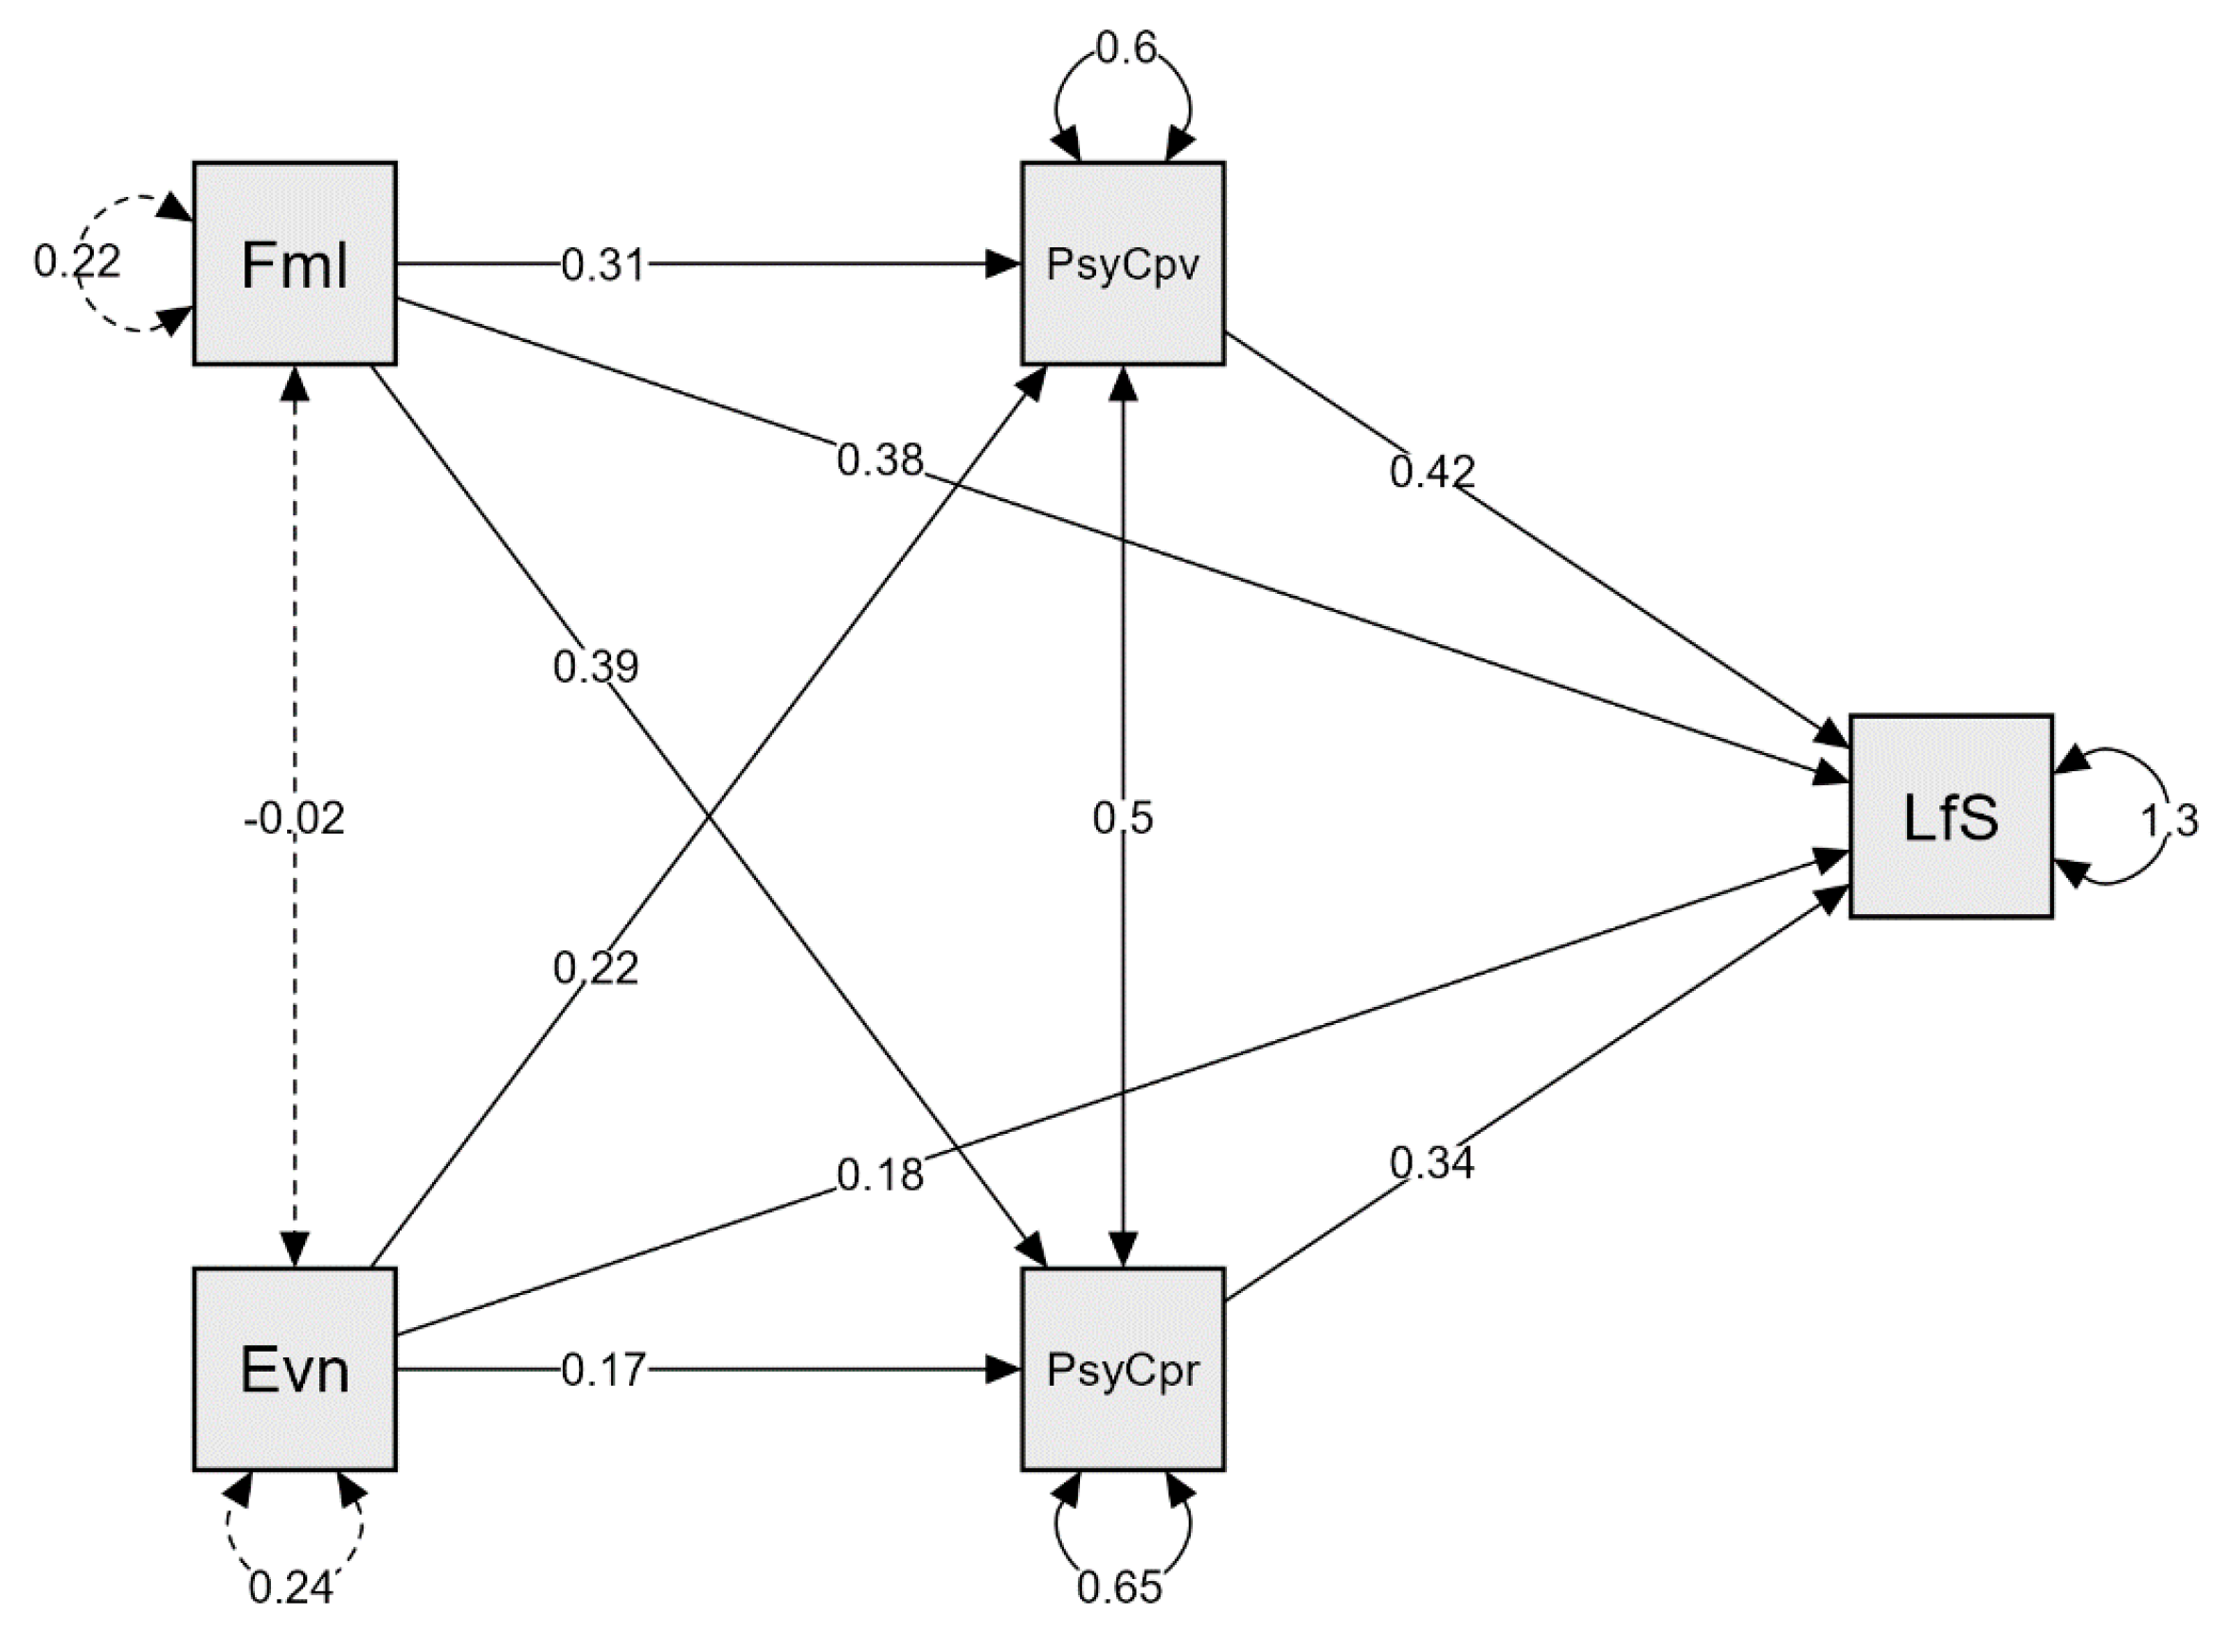
| Paths | Coeff. | Std. Error | z-Value | p | 95% CI Lower Upper | |||
|---|---|---|---|---|---|---|---|---|
| Direct effects | ||||||||
| Family → | Life Satisfaction | 0.375 | 0.110 | 3.405 | <0.001 | 0.159 | 0.592 | |
| Events → | Life Satisfaction | 0.180 | 0.104 | 1.734 | 0.083 | 0.024 | 0.384 | |
| Indirect effects | ||||||||
| Family → | PsyCap overall → | Life Satisfaction | 0.132 | 0.050 | 2.646 | 0.008 | 0.034 | 0.230 |
| Family → | PsyCap relationship → | Life Satisfaction | 0.134 | 0.053 | 2.542 | 0.011 | 0.031 | 0.237 |
| Events → | PsyCap overall → | Life Satisfaction | 0.093 | 0.041 | 2.244 | 0.025 | 0.012 | 0.174 |
| Events → | PsyCap relationship → | Life Satisfaction | 0.058 | 0.033 | 1.736 | 0.083 | 0.007 | 0.123 |
| Total effects | ||||||||
| Family → | Life Satisfaction | 0.642 | 0.116 | 5.544 | <0.001 | 0.415 | 0.869 | |
| Events → | Life Satisfaction | 0.331 | 0.111 | 2.980 | 0.003 | 0.113 | 0.549 | |
| Total indirect effects | ||||||||
| Family → | Life Satisfaction | 0.266 | 0.064 | 4.191 | <0.001 | 0.142 | 0.391 | |
| Events → | Life Satisfaction | 0.151 | 0.058 | 2.605 | 0.009 | 0.037 | 0.265 | |
| Residual covariances | ||||||||
| PsyCap overall <-> PsyCap relationship | 0.501 | 0.038 | 13.111 | 0.000 | 0.426 | 0.576 | ||
| Life satisfaction R2 = 0.254; PsyCap overall R2 = 0.049; PsyCap relationship R2 = 0.055. | ||||||||
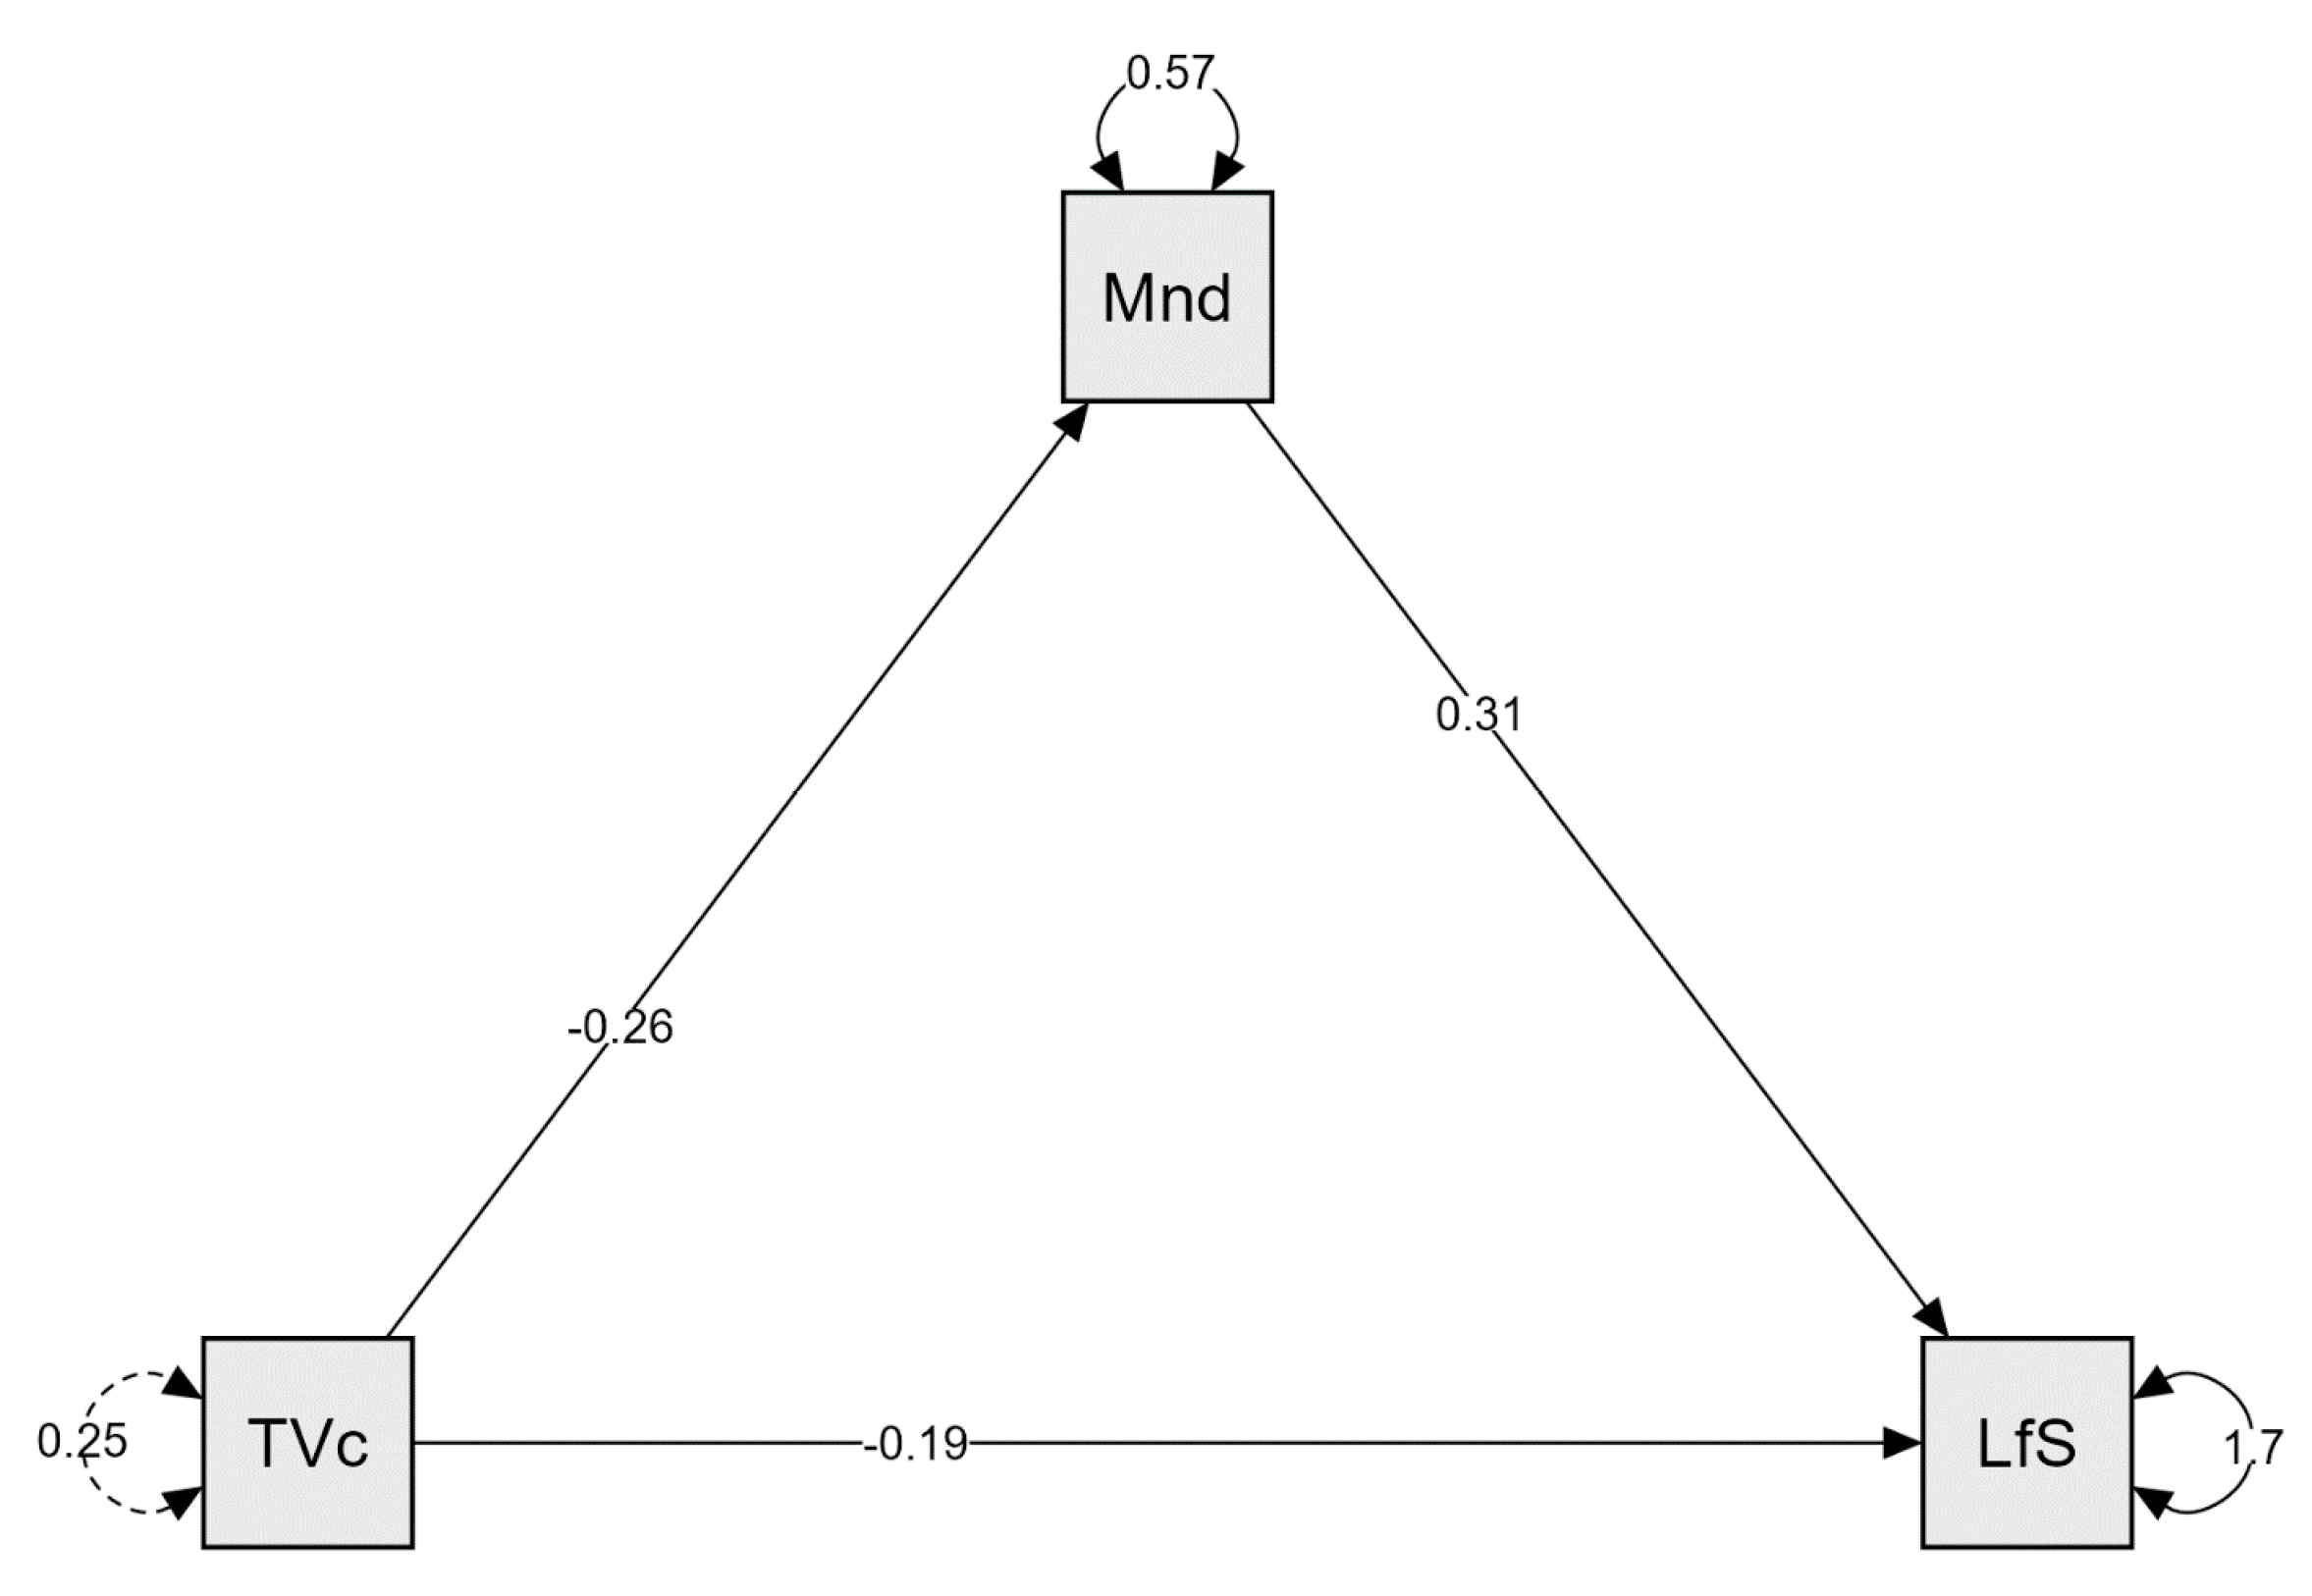
| Paths | Coeff. | Std. Error | z-Value | p | 95% CI | |||
|---|---|---|---|---|---|---|---|---|
| Lower | Upper | |||||||
| Direct effects | ||||||||
| TV → | Life Satisfaction | −0.190 | 0.114 | −1.671 | 0.095 | −0.413 | −0.033 | |
| Indirect effects | ||||||||
| TV → | Mindfulness → | Life Satisfaction | −0.081 | 0.035 | −2.299 | 0.022 | −0.150 | −0.012 |
| Total effects | ||||||||
| TV → | Life Satisfaction | −0.271 | 0.112 | −2.420 | 0.016 | −0.490 | −0.052 | |
| Life satisfaction R2 = 0.043; Mindfulness R2 = 0.028. | ||||||||
| Dependent Variable | Predictors/ Models | Unstandardized Coefficients | Standardized Coefficients | t | Sig. | R | R2 | Adjusted R2 | F | Sig. | |
|---|---|---|---|---|---|---|---|---|---|---|---|
| B | Std. Error | Beta | |||||||||
| Spending time with Family | 1 (Constant) | 2.193 | 0.527 | 4.165 | 0.000 | 0.245 | 0.060 | 0.057 | 16.510 (1,259) | <0.001 | |
| Life satisfaction | 0.469 | 0.116 | 0.245 | 4.063 | 0.000 | ||||||
| Watching Television | 1 (Constant) | 5.095 | 0.958 | 5.321 | 0.000 | 0.178 | 0.032 | 0.028 | 8.428 (1,258) | 0.004 | |
| PsyCap relationship | −0.622 | 0.214 | −0.178 | −2.903 | 0.004 | ||||||
| Participating in Events | 1 (Constant) | −0.385 | 0.961 | −0.401 | 0.689 | 0.139 | 0.019 | 0.015 | 5.066 (1,259) | 0.025 | |
| PsyCap overall | 0.480 | 0.213 | 0.139 | 2.251 | 0.025 | ||||||
Publisher’s Note: MDPI stays neutral with regard to jurisdictional claims in published maps and institutional affiliations. |
© 2022 by the authors. Licensee MDPI, Basel, Switzerland. This article is an open access article distributed under the terms and conditions of the Creative Commons Attribution (CC BY) license (https://creativecommons.org/licenses/by/4.0/).
Share and Cite
Dirzyte, A.; Patapas, A.; Perminas, A. Associations between Leisure Preferences, Mindfulness, Psychological Capital, and Life Satisfaction. Int. J. Environ. Res. Public Health 2022, 19, 4121. https://doi.org/10.3390/ijerph19074121
Dirzyte A, Patapas A, Perminas A. Associations between Leisure Preferences, Mindfulness, Psychological Capital, and Life Satisfaction. International Journal of Environmental Research and Public Health. 2022; 19(7):4121. https://doi.org/10.3390/ijerph19074121
Chicago/Turabian StyleDirzyte, Aiste, Aleksandras Patapas, and Aidas Perminas. 2022. "Associations between Leisure Preferences, Mindfulness, Psychological Capital, and Life Satisfaction" International Journal of Environmental Research and Public Health 19, no. 7: 4121. https://doi.org/10.3390/ijerph19074121