Article

Development of a Nutrition Environment Assessment Tool for Latino Ethnic Stores

1
Mercy Hospital, Joplin, MO 64804, USA
2
Department of Food Science & Human Nutrition, University of Illinois at Urbana-Champaign, Champaign, IL 61801, USA
3
Department of Food Science & Human Nutrition, Iowa State University, Ames, IA 50010, USA
4
Departments of Political Science and Statistics, Iowa State University, Ames, IA 50010, USA
*
Author to whom correspondence should be addressed.
Int. J. Environ. Res. Public Health 2022, 19(3), 1860; https://doi.org/10.3390/ijerph19031860
Submission received: 30 December 2021 / Revised: 4 February 2022 / Accepted: 6 February 2022 / Published: 7 February 2022

Abstract

:
The objectives were to: (1) adapt the Nutrition Environment Measures Survey for Stores (NEMS-S) to better culturally fit small Latino grocery stores (tiendas) in Iowa; (2) assess the newly adapted Latino NEMS-S for inter-rater and test-retest reliability; and (3) compare Latino and original NEMS-S summary scores. This pilot instrument, containing culturally appropriate foods from the original NEMS-S and 2015 US Dietary Guidelines for Americans, underwent two rounds of formative evaluation. The new instrument and scoring protocol were applied to a random sample of 42 of 81 possible tiendas in Iowa. Cohen’s kappa was used to assess inter-rater and test-retest reliability for availability and quality of indicator food items (total scores and food category sub scores). There were no differences in summary scores for inter-rater or test-retest reliability using paired t-tests. Inter-rater agreement was high (range 0.82–1.00; p < 0.001). Tiendas averaged 42.0 ± 7.5 of 57 possible points on the Latino NEMS-S, but only 12.0 ± 4.6 of 54 points on the original NEMS-S (p < 0.001). The Latino NEMS-S is a reliable tool for assessing the food environment within Iowa tiendas. Culturally specific instruments can describe diverse food environments more accurately and guide public health nutrition interventions within communities.

1. Introduction

Access to healthy foods has a primary role in shaping individuals’ diets, which can positively affect life-long health outcomes. The term ‘nutrition environment’ describes the characteristics of food outlets and food items available to consumers in a community [1]. While it is only one element of the complex network governing health and food choices, the nutrition environment enables or restricts eating behaviors. A lack of healthy, quality, and affordable foods accessible to consumers can contribute to chronic disease risk [1]. If healthy, affordable foods of suitable quality are not readily available in grocery stores, then shoppers, regardless of their intentions, are unable to obtain them. In fact, greater fruit and vegetable availability in stores may increase the likelihood of purchase [2].
The Nutrition Environment Measures Survey for Stores (NEMS-S) was developed to estimate characteristics of food items within retail grocery stores [1,3]. It is an observational tool used to assess availability, quality, and pricing for 11 food types (fruits, vegetables, milk, ground beef, hot dogs, frozen dinners, beverages, baked goods, bread, chips, and cereal) [1]. Except for fruits and vegetables, items were chosen based on common foods that contribute the highest amount of fat and calories in the American diet and their healthier alternatives [1,4,5]. Stores received higher NEMS-S scores if healthier versions of the high fat, high calorie foods are present (e.g., milk), if the healthier foods are lower or equal to the price of the less healthy items, and if fresh produce is of ‘acceptable quality’ (defined as peak condition, good color, fresh, firm, and clean) [1].
While the NEMS-S is the most widely used nutrition environment evaluation tool, it may not capture the diversity of healthy foods eaten by all US population groups due to the measurement options provided on the instrument [3]. The NEMS-S does not reflect foods commonly eaten by other ethnic groups such as Hispanics, nor does it consider food items that may be less healthy beyond dietary fat and calories, (e.g., added salt, added sugars, type of fat). Thus, the NEMS-S may only partially describe the nutrition environment of ethnic enclaves. Food deserts, usually found in low-income areas, are classified as zones without access to supermarkets, supercenters, or large grocery stores [6]. Accessibility to quality healthy foods that meet dietary needs and preferences can be a challenge, especially for those living in rural areas that may also be food deserts [7]. Unfortunately, ethnic markets or other stores unauthorized to accept Supplemental Nutrition Assistance Program (SNAP) benefits are not considered in the evaluation criteria for the purpose of defining food deserts [6].
Hispanics, defined as people with origins from Spanish-speaking countries, comprise 18.7% of the US population, and are the largest minority group at 62.1 million people [8]. ‘Latinos’ are people who have ancestral origins from Latin America, including Brazilians and Haitians whose native language is not Spanish. Most US Hispanics are of Latin American origin (Mexican 61.4%, Central American 9.8%, Puerto Rican 9.6%) [9]. US federal agencies report data using the ‘Hispanic’ classification. Although the two definitions overlap, this manuscript uses Latino, or the original source term as appropriate.
As of July 2019, Latinos comprised about 6.3% of the population in Iowa, or approximately 198,550 individuals. Of these, 74.8% were of Mexican ancestry and 29.7% were foreign-born. Latinos are projected to be 12.1% of Iowa’s population by 2050 [10]. Not all Hispanics identify with their ancestral cultures, but for many with Latin American roots, traditional foods are central to family and social life. Latino foods, such as beans, corn tortillas, lean meats, and fresh fruits and vegetables, are considered healthy and recommended by the 2015–2020 Dietary Guidelines for Americans (DGA) [11]. The inclusion of these foods in an adapted NEMS-S may more accurately describe Latino markets and food environments [12,13,14,15].
Food habits are one of the last characteristics to change during acculturation and often persist generations after immigration [12,13]. Retention of positive dietary habits depends on food availability. Dietary acculturation, the change in food habits to those of the host country, can lead to a decline in fruit, vegetable, and pulse (dry beans, dry peas, lentils, chickpeas) consumption and an increase in higher-fat convenience foods, sugar-sweetened beverages, and fast foods [12,13,14,15]. Hispanics in the US historically have had a higher prevalence of type 2 diabetes (14.0%) in comparison with non-Hispanic Whites (NHW) (6.0%) [16]. Obesity rates are also higher among Hispanics than for NHW (39.9% vs. 32.4%) [16]. More Hispanics met fruit (15.7%) and vegetable (10.5%) intake recommendations than NHW (12.2% and 9.3%, respectively) [17]. For pulses, 77% of Hispanics reported consuming them at least once per week in contrast to 63% of NHW and 52% of non-Hispanic Blacks [18].
Tiendas (i.e., small Latino grocery stores) and their culturally relevant food products within communities reinforce social acceptability and preservation of cultural traditions [19]. In addition, tiendas serve a social purpose by providing familiar foods, language, and community interaction for Latino cultures [19,20]. Thus, documentation of food availability at tiendas, due to their influence, would greatly contribute to knowledge of the nutritional environment for Latino populations. However, there is little information about the specific food options available in Latino food stores [13,19,20,21]. Tiendas may be the only accessible market in some locations and a preferred shopping venue for less acculturated Latinos. Many tiendas are independently owned, do not have electronic tracking of sales, and order from specialty grocers in larger cities. Unlike with mainstream supermarket chains, there are few ways to track food content or availability [19,21].
Prior to the current study, several NEMS-S adaptations for Latino neighborhoods or nutrition environments were created in the US. Emond et al. examined differences in Latino and non-Latino grocery stores to compare prices but used a different audit tool than the NEMS-S [21]. The Texas Nutrition Environment Assessment for Stores (TxNEA-S) modified the original NEMS-S to incorporate foods specific to Texas, including its Latino heritage, based on input from an expert panel [22]. For example, the presence of mangoes, tortillas, rice, beans, and other legumes were evaluated at grocery stores and convenience markets, but not specifically at Latino tiendas. TxNEA-S is unique in assessing canned and frozen produce, and beans [22]. A Guatemalan NEMS-S adaptation was compared to the NEMS-S for healthy food evaluation among Latino stores in Boston Massachusetts [23]. Healthy food availability within Latino stores was assessed with the addition of Guatemalan specific fruits, vegetables, canned beans, and ultra-high temperature pasteurized (UHT) boxed milk in the Guatemalan NEMS-S, items not present in the original instrument [23]. These other adaptations mainly focused on culturally specific fruits and vegetables. Despite these advancements, instruments that go beyond fresh produce and include a range of healthy cultural foods in other categories are still needed [3]. We developed and evaluated a comprehensive nutrition environment assessment suitable for Latino tiendas in Iowa. This instrument can provide data needed to formulate public health outreach interventions with this vulnerable emerging population [10,19,20].
The objectives of the study were to: (1) adapt the NEMS-S for use in tiendas in Iowa; (2) quantify the inter-rater and test-retest reliability of the resulting Latino NEMS-S; and (3) compare scores of the Latino NEMS-S to the original NEMS-S to document differences in healthy food assessment by tool choice.

2. Materials and Methods

2.1. Instrument Origins

The Latino NEMS-S represents an evolution and revision of the Mexican/Mexican-American NEMS-S (NEMS-S Mex) instrument protocol developed by Szkupinski Quiroga and the principal investigator (PI; D.M.W.) [24]. The NEMS-S Mex was pilot tested in metropolitan Phoenix, Arizona, with 32 Latino stores ranging from large supermarkets to medium and small tiendas [24]. Diversity in the store sample resulted in too few stores similar enough in size and store type for adequate inter-rater and test-retest rater reliability comparisons. The PI was invited to collaborate with the Iowa Department of Public Health “Shop Healthy Iowa” program. This intervention provided small Hispanic retail stores with promotional materials and product placement guidance to increase sales of fruit and vegetable varieties [25]. “Shop Healthy Iowa” needed a suitable nutrition environment measure to track pre- and post-intervention changes in stores. The researchers planned to test the NEMS-S Mex instrument with a larger sample of Latino stores in Central Iowa [24]. To ensure no major changes had occurred that would require adjustment of the NEM-S Mex food items, the researchers reviewed the 2009–2012 National Health and Nutrition Examination Survey (NHANES) frequency consumptions for Hispanics, and examined Latino food market trends [12,19,20,26]. No changes in national consumption patterns were observed from the NEMS-S Mex. Between February and June 2015, 22 tiendas in Central Iowa were evaluated with the NEMS-S Mex instrument to confirm if it would meet the needs of “Shop Healthy Iowa.”
After viewing the stores and analyzing these pilot data, the formative evaluation revealed that the Latino store structure, items stocked, and food quality were markedly different in Iowa compared to Arizona. With fewer food items, less variety, and smaller size, neither the original NEMS-S nor the NEMS-S Mex were suitable for the Iowa tiendas.

2.2. Development of Latino NEMS-S Iowa

To tailor and update a new Latino store instrument to Iowa, the NEM-S Mex data from the 22 tiendas were examined in light of the 2015–2020 DGA’s MyPlate healthy food group guidance regarding fruits, vegetables, grains, protein foods, and dairy [11,27]. The 2009–2012 NHANES Hispanic consumption data were used to inform food choices. Instrument content validity is thus supported by not only US national food group recommendations, but also national consumption data, and in-person store observations [1,26]. Categories for vegetables (green, orange, red, legumes, starchy), fruits, and fat-free or low-fat dairy were expanded on the draft instrument. Additional measures were added for whole grains (brown rice, whole wheat, and corn tortillas), varied protein sources (eggs, beans, beef, chicken, fish), solid fats and oils, reduced added sugars (light syrup for canned fruit, 100% juice), reduced saturated fats (chicken, lean beef), and reduced sodium intake (low-sodium canned vegetables and beans). The 2015–2020 DGA emphasized consumption of 100% juice and advocated for decreasing foods with added sugar [11]. Based on known high-consumption patterns of fruit nectars and canned fruits among US Latinos, fruit nectars and canned fruit packaged in light syrup and 100% juice were added to the Iowa instrument to evaluate availability of these products and healthier alternatives. DGA guidelines also highlighted the importance of limiting saturated fats to <10% of kilocalories per day and choosing lower-fat versions of foods (e.g., milk, meat cuts) [11]. The 2015–2020 DGA specifically recommended consuming foods rich in shortfall nutrients of concern, including dietary fiber, potassium, calcium, and vitamin D [11]. These nutrients are found in healthful foods on the Latino NEMS-S (Table 1). In a separate nutrition knowledge survey of Midwestern consumers, most Latino respondents identified the ‘healthier’ food options included on the Latino NEMS-S which further contributes to the face validity of the instrument [20].

2.3. Pilot Testing of Latino NEMS-S Instrument

Pilot testing of 24 tiendas using the preliminary version of the Latino NEMS-S was conducted to gain insight into the instrument’s efficacy. The original NEMS-S included referent food items within its categories. Documentation of the typical foods, brands, and item packaging available in tiendas was needed to guide standardization of referent food items on the Latino NEMS-S. Data were also collected using the original NEMS-S at these same stores. Cheeses, pan dulce, frozen fruits and vegetables, and organic foods (eggs, fruit, and vegetables), Latino culture equivalents for frozen dinners, bread, baked chips, and cereal were included. These were later dropped due to inconsistent availability during pilot testing (Table 2).
Beefsteak categories were rarely labeled and difficult to distinguish without asking the butcher. Interviews with store employees about available items were not routinely feasible during evaluations because most stores were staffed by only one worker. Due to these limitations, the survey was simplified to ask if lean (≤10%) and regular (>10% fat) beef were available rather than requiring raters to identify a specific cut as the referent item at all stores. Chicken was added to the final Latino NEMS-S as it is a frequently consumed source of lean protein by Hispanics according to NHANES [26]. The instrument compares the lean option of chicken breast with the regular higher fat version of legs and thighs. Eggs were added because they are a low-cost protein source with wide availability.
The final Latino NEMS-S contains 13 categories. These include dairy (milk, UHT milk), fruits (fresh and canned), vegetables (fresh and canned), grains (tortillas, rice), and protein (beefsteak, chicken, fish, eggs, and canned and dry beans—which were also considered vegetables). Beverages (water, fruit nectar) and fats (cooking oils, solid fats) were added. Table 2 shows the comparison of food categories within the original NEMS-S, the pilot Latino NEMS-S, and the final Latino NEMS-S for Iowa tiendas. Further details regarding the rationale for different foods tested in the Iowa formative surveys are available in Baier [28]. This information is useful for regional refinement of the instrument or other ethnic adaptations. The Latino NEMS-S instrument is available in the Supplementary Materials.

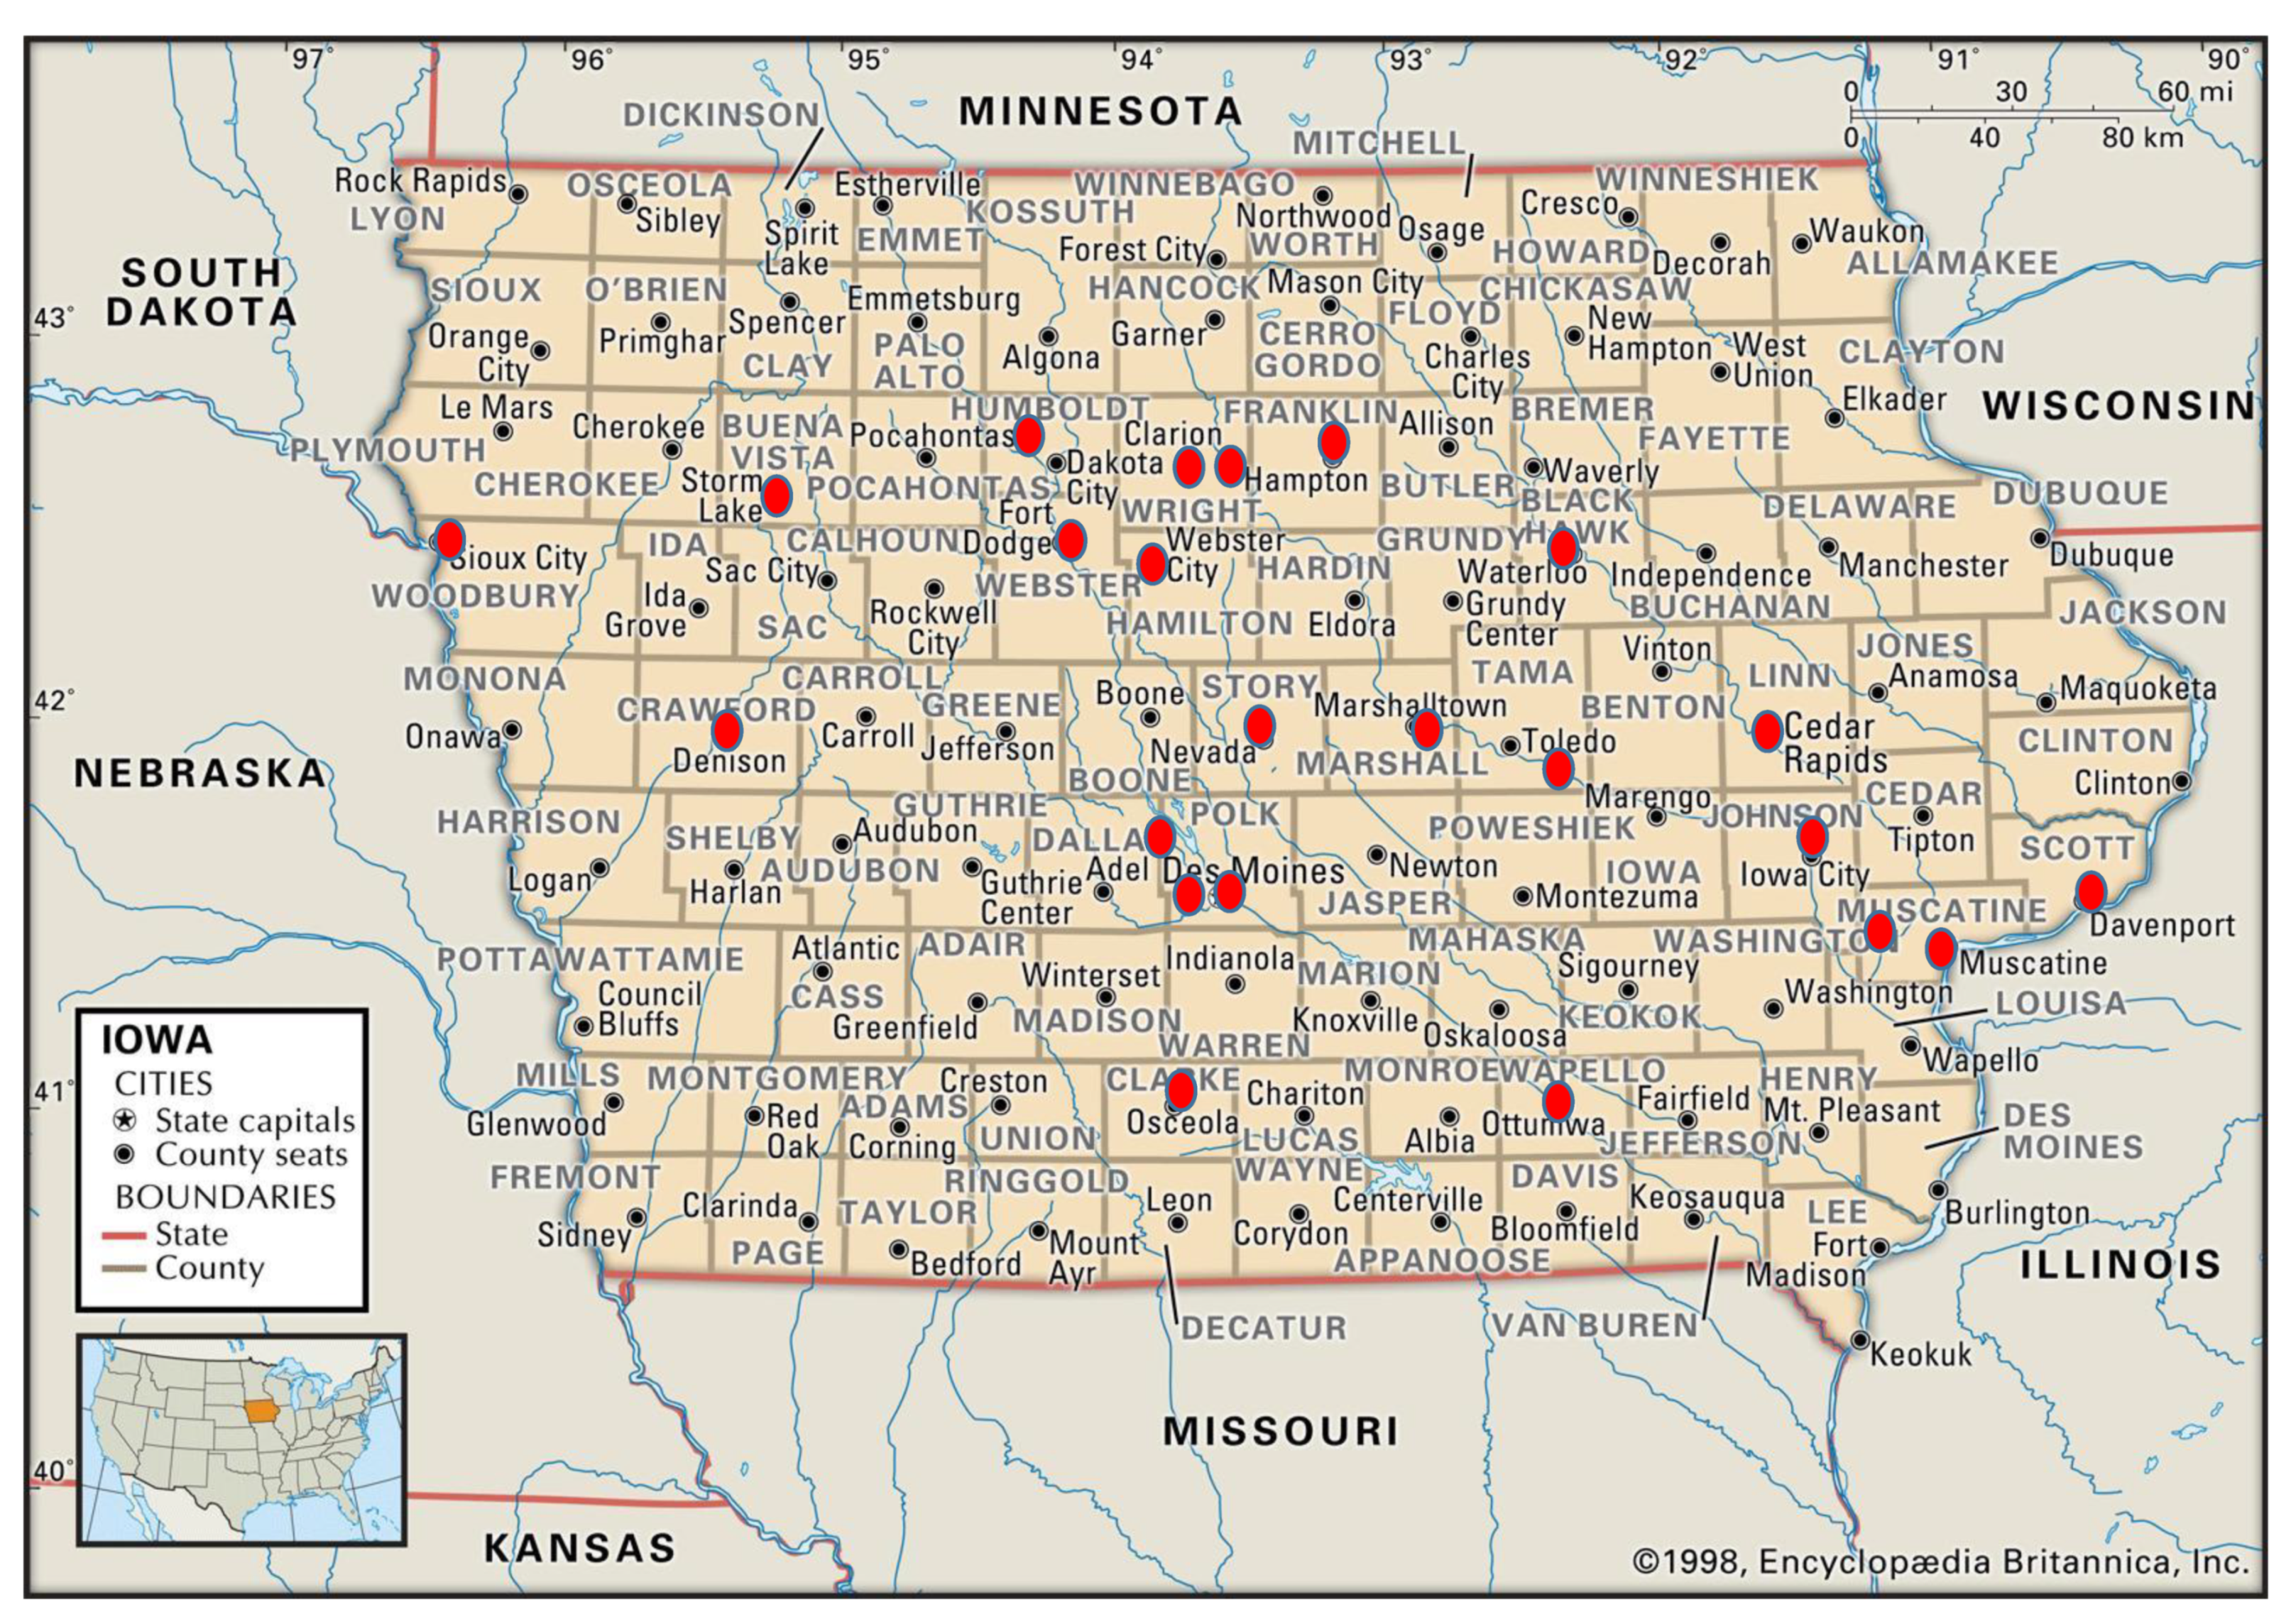
2.4. Identification, Selection, and Consent of Stores

Prior to formal evaluation of the Latino NEMS-S, a working list of known Latino food markets was developed based on field work, internet searches, telephone calls to prospective businesses, and the assistance of the Iowa State Extension & Outreach, Community and Economic Development office. The list of Latino food markets was verified and expanded by the research field team through direct observation and inquiry when in communities. A total of 81 Latino stores were located across Iowa. Most of these tiendas fit the classification of ‘corner stores’ defined as less than 2000 square feet, four aisles or less, and one cash register [29]. Several Latino stores were also home to a restaurant or other small business. The restaurant/small business was included in our evaluation if they had a separate cash register from the grocery store used within the restaurant/small business and if they met our other inclusion criteria.
Prior to data collection, all 81 eligible stores were mailed a letter of introduction in English and Spanish. The letter was intended to introduce the researchers and explain the study purpose. Store owners were asked to contact the researchers with questions or to state that they did not wish to participate. Two store owners called to ask for more information. No storeowners declined participation at that time. From the list of 81 stores, 47 were randomly selected for inter-rater reliability and test-retest reliability data collection using the random number function in Excel (Microsoft, Redmond, WA). Three tiendas in Southwest Iowa (Council Bluffs region) were subsequently excluded from sampling due to excessive geographic distance from other stores and researcher resource constraints. The geographic distribution of the sample is shown in Figure 1.

2.5. Latino NEMS-S Test Protocol

The eight-member research team trained on the original NEMS-S data collection protocol and methods prior to data collection as described in Section 2.2 and Section 2.3 [30]. Researchers (raters) completed the NEMS-S online training module and practiced evaluating three chain grocery stores. Questions and administration procedures were clarified for the original instrument during group debriefing and review sessions. Field training with the Latino NEMS-S was conducted at the same three local chain grocery stores used during rater practice and at the only large Latino supermarket in Iowa at the time. Inter-rater and test-retest reliability data were collected for the revised Latino NEMS-S from June to December 2016. Teams of two raters visited each store on two occasions approximately one week apart. Raters were randomized to their roles and stores by the PI in advance to reduce potential bias. Data collection proceeded as described below.
First Store Visit—Time 1 (T1): Inter-Rater Reliability. On the first visit (T1), a bilingual researcher described the study purpose to the store clerk or manager and provided a copy of the English-Spanish introduction letter. With permission, two raters independently completed the Latino NEMS-S. On exit, the team asked permission to return within two weeks to complete a second evaluation.
Second Store Visit—Time 2 (T2): Test-Retest. The T2 evaluation was completed within two weeks after T1. The same two raters visited each store for a second time. One of the two raters who had initially surveyed the store for T1 was randomly chosen to repeat the Latino NEMS-S. The second rater completed the original NEMS-S instrument. Mean instrument completion time was approximately 45 min for the Latino NEMS-S and 20 min for the original NEMS-S. Survey responses were subsequently entered into an Excel spreadsheet by a separate team member who was not at that specific store and entered a second time and cleaned by other research team members prior to analysis.

2.6. Development of Scoring System

A Latino NEMS-S scoring guide was modeled from the original NEMS-S to adjust for modified and added categories. The scoring system awarded points for availability of nutritious items and for fresh fruit and vegetable quality. Unlike the original NEMS-S scoring, no points were assigned based on food prices [1]. Most Iowa tiendas either did not label food prices or the listed price was inconsistent with the charged price [19]. The total maximum points possible is 57 for the Latino NEMS-S and 54 for the original NEM-S. Summary scores indicating overall food availability at each store were tallied and compared for each survey. The scoring guide is available in the Supplementary Materials.

2.7. Analysis of Data

Data entry and analyses were completed using SPSS (IBM, v. 26, Armonk, New York, NY, USA). Cohen’s kappa was used to determine inter-rater reliability between rater 1 and rater 2 with the Latino NEMS-S at each store for T1. This value was calculated for each of the food item variable measures to determine differences between raters. Kappa scores were also used to determine if the same items were available between T1 and T2 as a measure of test-retest reliability. Paired t-tests were completed assessing variation in scores between the Latino NEMS-S and original NEMS-S for each store.

3. Results

3.1. Characteristics of Sample Latino Grocery Stores

Of the 44 eligible Latino stores randomly selected for data collection, two were subsequently excluded from analysis. One store was not open on the second visit, and a second declined further participation. Figure 1 illustrates the geographic location of the 42 surveyed stores. The highest percentage of tiendas were in Northwest Iowa (31%), followed by the Southeast (29%), Central (21%), and Northeast (19%) regions. Eighty-three percent of the stores had a meat counter and 76% had a frozen food section. While 69% sold alcoholic beverages, only 12% sold tobacco products. Almost half of the tiendas sold hot made-to-order foods, and one had an attached Mexican restaurant. Eighty-one percent (n = 34) of the stores were in an area classified as low-income and with low-access to healthy foods, or food desert, by the United States Department of Agriculture’s (USDA) Food Access Research Atlas. Three of the stores were located in close proximity to a food desert area, and five were in rural areas not classified by the USDA because of low population density [6].

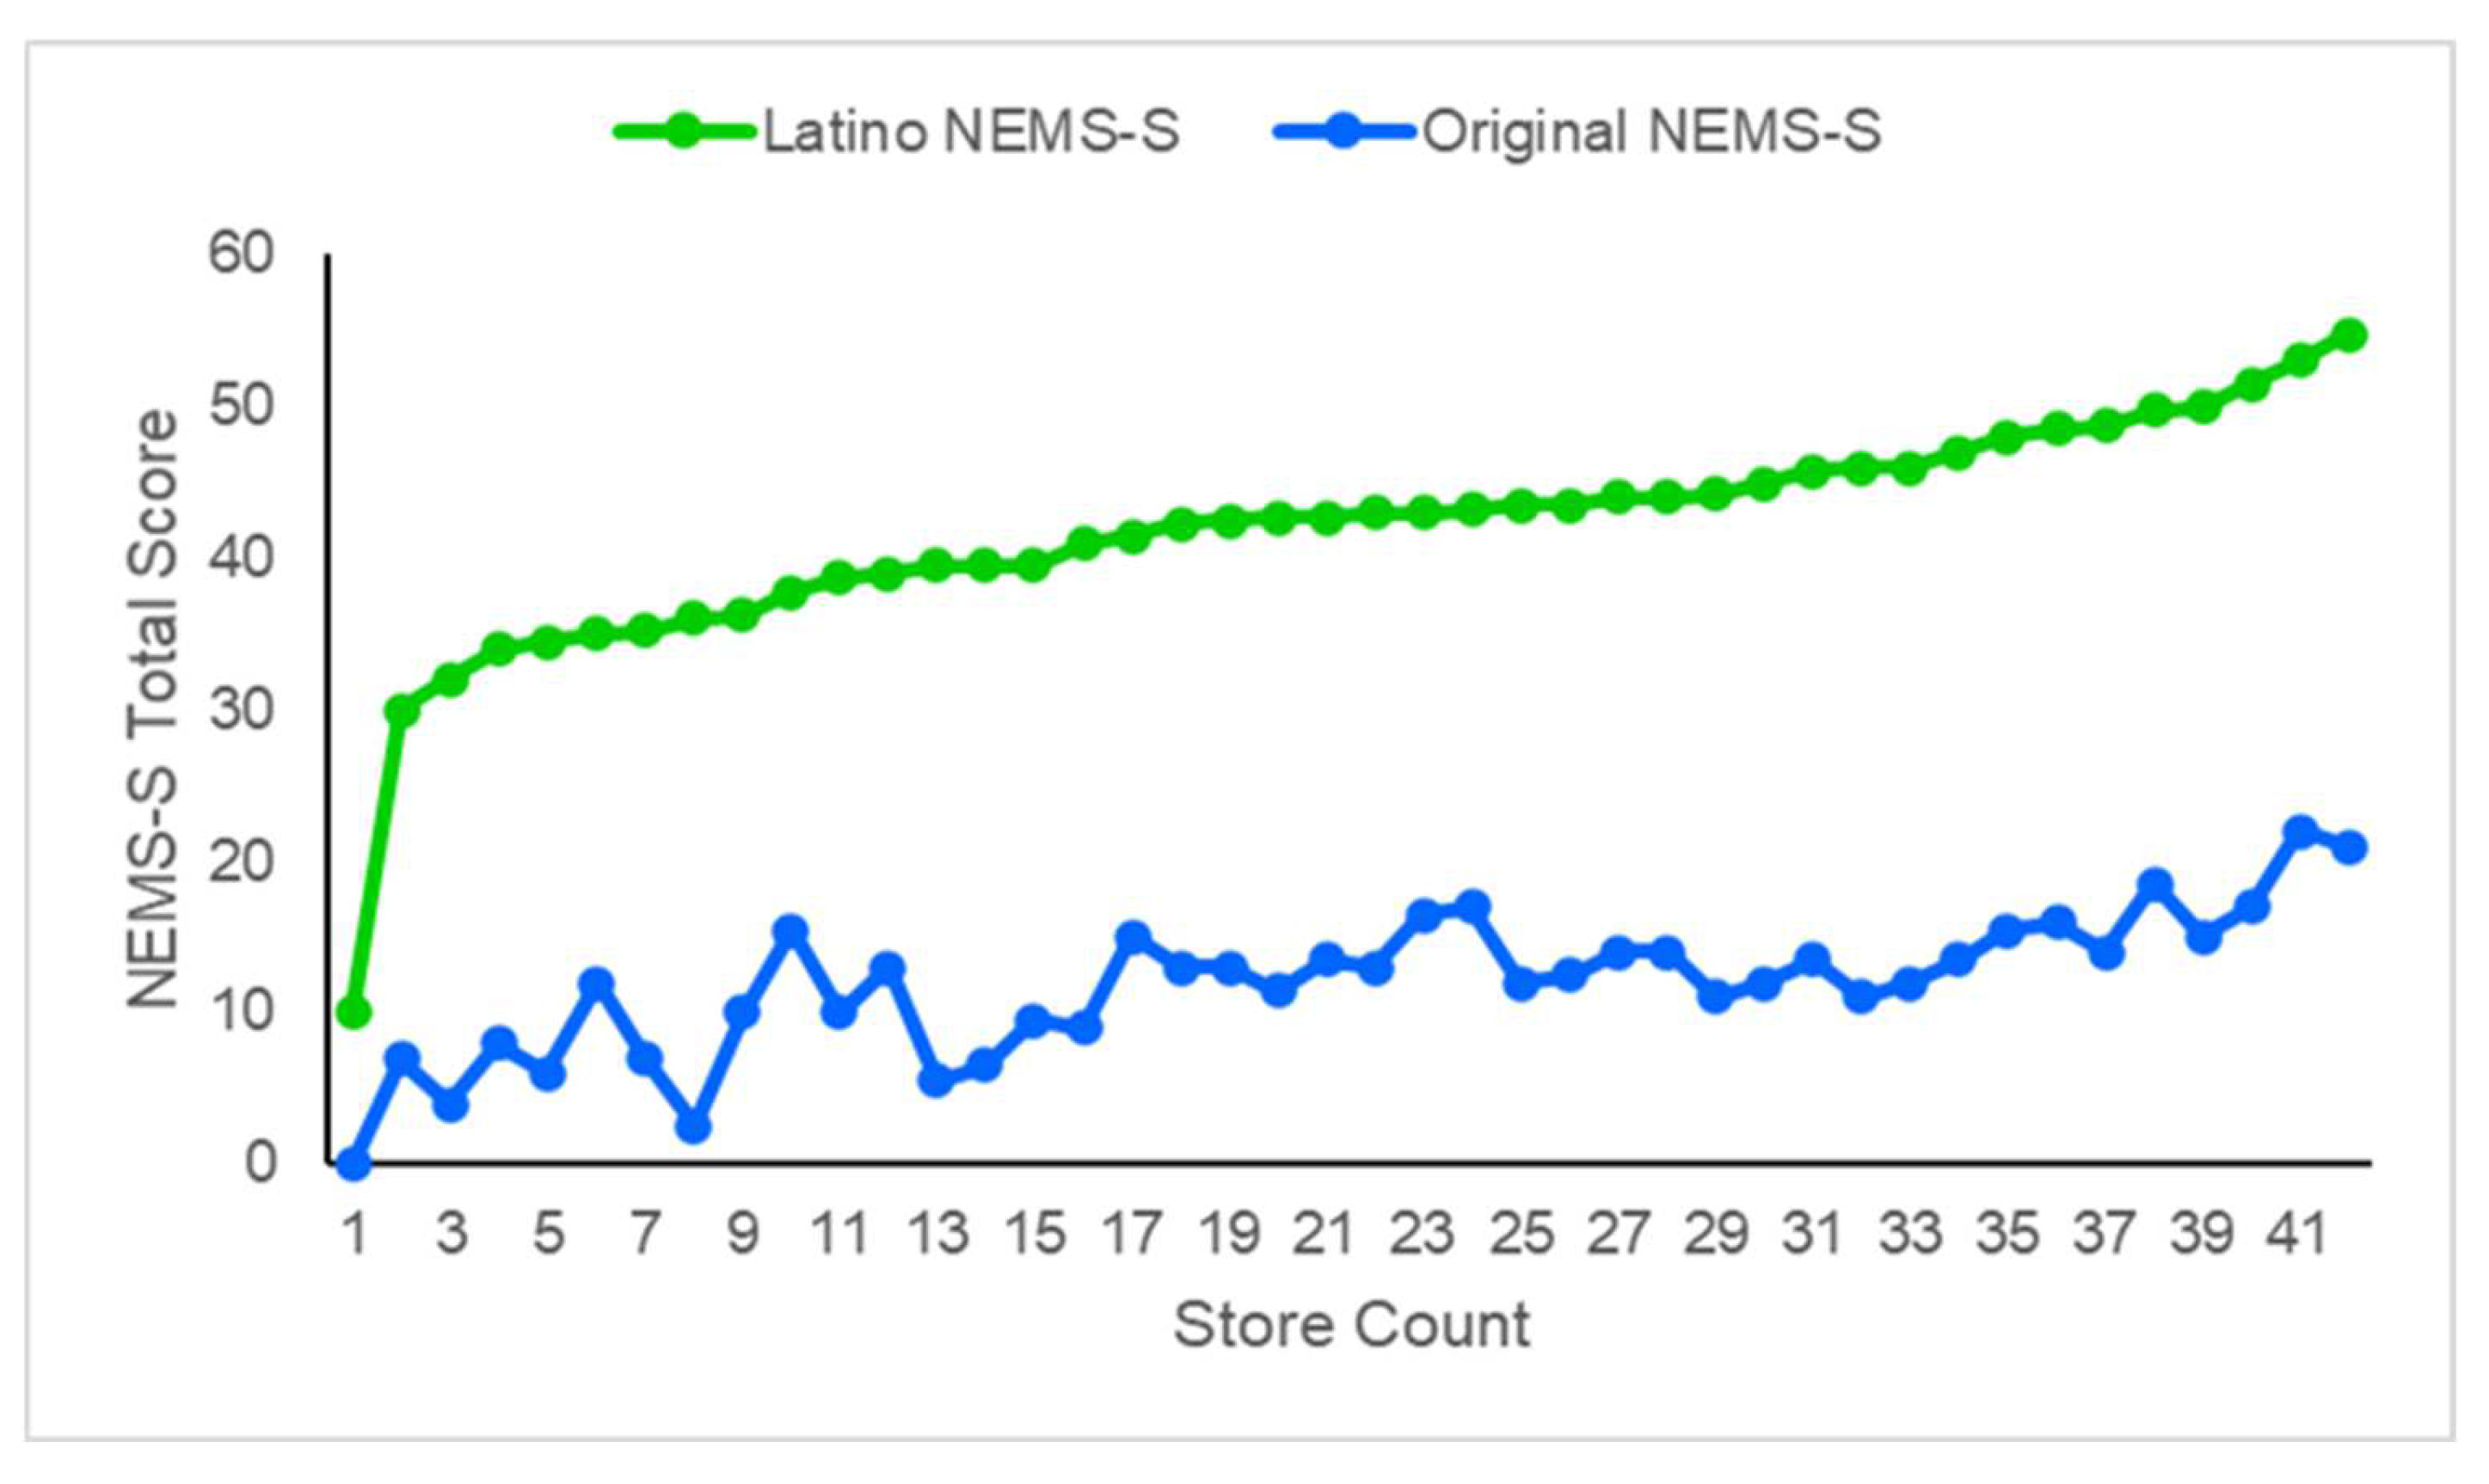
3.2. Scoring Results

Mean summary scores during T1 were 41.8 ± 7.6 for rater 1 and 41.6 ± 7.6 for rater 2 (correlation coefficient = 0.962). The test-retest summary scores were similar for T1 (41.8 ± 7.6) and T2 (41.9 ± 7.5) (correlation coefficient = 0.951). No significant differences were observed by paired t-tests for the inter-rater or test-retest overall scores.
The average T2 score for the Latino NEMS-S was 41.9 ± 7.5, while the original NEMS-S was 12.0 ± 4.6. Latino NEMS-S scores ranged from 10 to 55 points, and original NEMS-S scores varied from 0 to 18.5 points. Higher scores on both instruments indicate greater availability of healthful food choices as compared to regular options, better availability and quality of fresh fruits and vegetables, as well as equal or lower price for the healthier option in the original NEMS-S. Figure 2 displays the Latino NEMS-S and original NEMS-S scores for each of the 42 tiendas evaluated.

3.3. Reliability

Table 3 includes kappa values for the individual healthy food options available. Inter-rater reliability values ranged from 0.90 to 1.00, and test-retest values ranged from 0.90 to 1.00 (average p value < 0.001).
Table 4 shows inter-rater reliability and test-retest kappa scores for fresh fruits and vegetables. Values ranged from 0.90 to 1.00 for inter-rater reliability and 0.80 to 1.00 for test-retest (average p value < 0.001). Agreement for raters was high, as was consistency in identification of products available between T1 and T2. These results indicate the Latino NEMS-S is reliable in assessing the food environment within Iowa tiendas.

4. Discussion

The main purpose of this study was to develop and test the reliability of a Latino NEMS-S instrument to determine food availability and accessibility in Iowa tiendas. As expected, when comparing scores between the Latino NEMS-S and original NEMS-S instruments, tiendas scored much higher with the culturally adapted instrument. This study fills an important research gap by providing a tool that more accurately describes food options in Latino tiendas. Prior to this instrument’s development, areas where Latino grocery stores were located may have been considered food deserts due to a lack of information about the culturally specific food items present.
Inter-rater and test-retest reliability on the Latino NEMS-S was high with Cohen’s kappa scores of almost perfect agreement [31]. These results are consistent with the original NEMS-S when the instrument was developed and tested in 85 stores [1]. High reliability measures with multiple raters suggest that consistent results will also be obtained by users with limited previous knowledge of the instrument.
Score consistency among raters may be attributed to a variety of factors. These include the training received in the survey directions, gaining familiarity with different packaging of foods and fruits and vegetables seen in the tiendas, and perhaps issues with the survey itself. While detailed, the survey is straightforward in describing what products to look for during the rating process and in differentiating which product receives precedence over another if variations are present.
In comparison to other ethnic store adaptations, three iterations of the survey were tested and analyzed to identify areas needing improvement. Like the original NEMS-S, food selections included in the instrument were drawn from national Hispanic food consumption data, based on the DGA, and availability of products in tiendas. These characteristics support the content validity of the Latino NEMS-S [1,3]. A separate survey with Midwest Latinos found high recognition of the healthy vs. less healthy food options which also supports the instrument’s face validity [20].
A large number of tiendas were surveyed in both urban and rural areas across the state. Thus, the Latino NEMS-S has been broadly tested in a variety of conditions and locations. Not only was there an increase in the amount of healthy foods documented in comparison to the original NEMS-S, food availability within the stores included all five food groups from MyPlate and would allow customers to meet 2015–2020 DGA nutrition recommendations [11,27]. As healthy foods can and do exist at tiendas in some of these supposed food deserts, our findings show that high-risk (low access/low income) people can find desired foods. In turn, these markets can promote retention of positive dietary habits [18,19]. Furthermore, many counties with Latino stores have high levels of poverty (Crawford 15.8%, Johnston 17.8%; Black Hawk 15.8%) [32]. The tienda can serve as a food environment resource for all members in a community beyond Latinos [19,20,21].
Given the findings of this study, it stands to reason that other researchers interested in creating a new modification of the original NEMS could model aspects of the survey and testing procedures completed during development of the Latino NEMS-S. There are numerous varieties of ethnic food stores serving the growing diverse US population that could benefit from such an analysis. A survey could measure healthy food options available, and once this is determined, research groups could go a step further by implementing strategies to educate and partner with store owners if there are any gaps present in the availability of healthy cultural foods [25].

Study Limitations

Despite its strengths, the Latino NEMS-S instrument is not without limitations. The survey may favor foods from a Mexican-ancestry Latino subculture or region more than others. Seasonality and the time of year when the raters visited each tienda may also be a factor in assessing fruit and vegetable availability at a given timepoint for each store. Additionally, we cannot extrapolate findings for the Latino NEMS-S to other geographic areas outside of Iowa. Hence, the need for the variations of the NEMS-S to accommodate for the diversity of store types and the populations they serve.
Another study limitation comes from our inability to obtain one of the most important aspects in retail: the price. As previously noted, pricing at tiendas was not measured due to inconsistent usage of signage in the tiendas. Had this been available, pricing information would have provided researchers the ability to compare healthy and less healthy items, different Latino stores, geographical areas, and Latino stores versus mainstream grocery retailers.

5. Conclusions

An opportunity for creating sustainable nutrition changes in a community may be through targeting the nutrition environment [29,33]. This study provides examples of evaluating ethnic stores through direct comparison of food availability based on what is considered healthy by the US Dietary Guidelines. Culturally accurate assessments like the Latino NEMS-S can better inform relationships between the nutrition environment and healthy eating habits among vulnerable populations. Tiendas have the ability to provide access to high quality, affordable foods for all residents in underserved communities, not just Latinos. Recognition of their substantial contributions to food access in purported food desert regions is essential in developing guidance for nutrition and reducing health disparities. Increased recognition of ethnic food stores in communities may encourage families to retain positive dietary habits along the acculturation spectrum [12,13,14,15].

Supplementary Materials

The following are available online at https://www.mdpi.com/article/10.3390/ijerph19031860/s1, S1: Latino NEMS-S instrument, S2: Latino NEMS-S protocol guide; S3: Latino NEMS-S Scoring Guide; S4: Latino NEMS-S Glossary of Foods.

Author Contributions

Conceptualization, J.L.B., D.M.W. and S.M.P.; methodology, J.L.B., D.M.W., S.M.P.; formal analysis, J.L.B., M.C.S.; investigation, J.L.B., D.M.W. and S.M.P.; resources, D.M.W.; data curation, D.M.W.; writing—original draft preparation, J.L.B.; writing—review and editing, D.M.W., S.M.P. and M.C.S.; supervision, D.M.W.; project administration, D.M.W.; funding acquisition, D.M.W. All authors have read and agreed to the published version of the manuscript.

Funding

This study was supported in part by award number 478-4018-36-3802 to D.M.W. from the Iowa Department of Public Health as part of the Cooperative Agreement Number, DP004807, funded by the Centers for Disease Control. Its contents are solely the responsibility of the authors and do not necessarily represent the official view of the Centers for Disease Control and Prevention or the Iowa Department of Public Health.

Institutional Review Board Statement

The Institutional Review Board of Iowa State University deemed the study exempt (14-573-00).

Informed Consent Statement

Not applicable.

Data Availability Statement

Data will be made available by request to the PI.

Acknowledgments

We thank those at Iowa State University who helped with data collection, including David Mena, Samuel Yarrow, Taylor Roe, and Jon Wolseth. A special thank you to Seline Szkupinski Quiroga, Arizona State University, and Carol Voss, MEd, RD, Iowa Department of Public Health for their contributions to the study concept.

Conflicts of Interest

The authors declare no conflict of interest. The funders had no role in the study design, in the collection, analyses, or interpretation of data, in the writing of the manuscript, or in the decision to publish the results.

References

  1. Glanz, K.; Sallis, J.F.; Saelens, B.E.; Frank, L.D. Nutrition environment measures survey in stores (NEMS-S): Development and evaluation. Am. J. Prev. Med. 2007, 32, 282–289. [Google Scholar] [CrossRef] [PubMed]
  2. Martin, K.S.; Havens, E.; Boyle, K.E.; Matthews, G.; Schilling, E.A.; Harel, O.; Ferris, A.M. If you stock it, will they buy it? Healthy food availability and customer purchasing behavior within corner stores in Hartford, CT, USA. Public Health Nutr. 2012, 15, 1973–1978. [Google Scholar] [CrossRef] [PubMed] [Green Version]
  3. Glanz, K.; Johnson, L.; Yaroch, A.L.; Phillips, M.; Ayala, G.X.; Davis, E.L. Measures of retail food store environments and sales: Review and implications for healthy eating initiatives. J. Nutr. Educ. Behav. 2016, 48, 280–288. [Google Scholar] [CrossRef] [PubMed]
  4. Nielsen, S.; Popkin, B. Patterns and trends in food portion sizes, 1977–1998. JAMA 2003, 289, 450–453. [Google Scholar] [CrossRef] [PubMed] [Green Version]
  5. U.S. Department of Health and Human Services; U.S. Department of Agriculture. Dietary Guidelines for Americans, 6th ed.; U.S. Government Printing Office: Washington, DC, USA, 2005.
  6. United States Department of Agriculture. Food Access Research Atlas. Available online: https://www.ers.usda.gov/data-products/food-access-research-atlas/documentation/ (accessed on 24 June 2019).
  7. Bell, J.; Mora, G.; Hagan, E.; Rubin, V.; Karpyn, A. Access to Healthy Food and Why It Matters: A Review of the Research. The Food Trust: Philadelphia, PA, USA. Available online: http://thefoodtrust.org/uploads/media_items/access-to-healthy-food.original.pdf (accessed on 5 July 2020).
  8. Jones, N.; Marks, R.; Ramirez, R.; Rios-Vargas, M. 2020 Census Illuminates Racial and Ethnic Composition of the Country. Available online: https://www.census.gov/library/stories/2021/08/improved-race-ethnicity-measures-reveal-united-states-population-much-more-multiracial.html (accessed on 20 September 2021).
  9. U.S. Department of Health and Human Services. Office of Minority Health Profile: Hispanic/Latino Americans. Available online: https://minorityhealth.hhs.gov/omh/browse.aspx?lvl=3&lvlid=64 (accessed on 29 December 2021).
  10. State Data Center of Iowa. Latinos in Iowa. 2020. Available online: https://www.iowadatacenter.org/Publications/latinos2020.pdf (accessed on 24 December 2021).
  11. U.S. Department of Health and Human Services; U.S. Department of Agriculture. 2015–2020 Dietary Guidelines for Americans. 8th ed. 2015. Available online: http://health.gov/dietaryguidelines/2015/ (accessed on 8 August 2020).
  12. Kerber, C.; Kessler, L.; Wallace, S.; Burns-Whitmore, B. Cultural and dietary factors influencing traditional Latino meal patterns: Findings from focus group discussion. Calif. J. Health Promot. 2014, 12, 42–54. [Google Scholar] [CrossRef]
  13. Winham, D.M. Culturally tailored foods and cardiovascular disease prevention. Am. J. Lifestyle Med. 2009, 3 (Suppl. S1), 64S–68S. [Google Scholar] [CrossRef] [PubMed] [Green Version]
  14. Ayala, G.X.; Baquero, B.; Klinger, S. A systematic review of the relationship between acculturation and diet among Latinos in the United States: Implications for future research. J. Am. Diet. Assoc. 2008, 108, 1330–1344. [Google Scholar] [CrossRef] [PubMed] [Green Version]
  15. Heer, M.M.; Winham, D.M. Bean preferences vary by acculturation level among Latinas and by ethnicity with Non-Hispanic White women. Int. J. Environ. Res. Public Health 2020, 17, 2100. [Google Scholar] [CrossRef] [Green Version]
  16. Dominguez, K.; Penman-Aguilar, A.; Chang, M.H.; Moonesinghe, R.; Castellanos, T.; Rodriguez-Lainz, A. Centers for Disease Control and Prevention (CDC). Vital signs: Leading causes of death, prevalence of diseases and risk factors, and use of health services among Hispanics in the United States—2009–2013. MMWR Morb. Mortal. Wkly. Rep. 2015, 64, 469–478. [Google Scholar] [PubMed]
  17. Lee-Kwan, S.H.; Moore, L.V.; Blanck, H.M.; Harris, D.M.; Galuska, D. Disparities in state-specific adult fruit and vegetable consumption—United States, 2015. MMWR Morb. Mortal. Wkly. Rep. 2017, 66, 1241. [Google Scholar] [CrossRef] [PubMed]
  18. Tichenor, N.; Conrad, Z. Inter-and independent effects of region and race/ethnicity on variety of fruit and vegetable consumption in the USA: 2011 Behavioral Risk Factor Surveillance System (BRFSS). Public Health Nutr. 2016, 19, 104–113. [Google Scholar] [CrossRef] [PubMed] [Green Version]
  19. Bates, L. Latino groceries in the rural Midwest: An examination of food security, cultural identity, and economics. Leopold Cent. Complet. Grant Rep. 2017, 529. Available online: https://dr.lib.iastate.edu/server/api/core/bitstreams/cf435fac-6fd6-48a0-a5b0-bc2e07280e86/content (accessed on 24 December 2021).
  20. Palmer, S.M.; Winham, D.M. Midwest consumer shopping habits, nutrition knowledge, and Latino tienda use. Health Behav. Policy Rev. 2020, 7, 79–91. [Google Scholar]
  21. Emond, J.; Madanat, H.; Ayala, G. Do Latino and non-Latino grocery stores differ in the availability and affordability of healthy food items in a low-income, metropolitan region? Public Health Nutr. 2012, 15, 360–369. [Google Scholar] [CrossRef] [PubMed]
  22. Gloria, C.; Steinhardt, M. Texas nutrition environment assessment of retail food stores (TxNEA-S): Development and evaluation. Public Health Nutr. 2010, 13, 1764–1772. [Google Scholar] [CrossRef] [PubMed] [Green Version]
  23. Caplan, E.; Kanter, R.; Bearup, R.; Solomons, N.W.; Bermudez, O.I. Comparative performance of NEMS-S Surveys in Latino food stores in the greater Boston area. Arch. Latinoam. Nutr. 2017, 67, 98–105. [Google Scholar]
  24. Winham, D.M.; Szkupinski Quiroga, S. Adaptation of the Nutrition Environment Measures Survey-Stores (NEMS-S) to assess a Mexican/Mexican-American nutrition environment. FASEB J. 2013, 27 (Suppl. S1), 221–226. [Google Scholar] [CrossRef]
  25. Compre Saludable/Shop Health Iowa. Available online: https://idph.iowa.gov/inn/compre-saludable (accessed on 25 June 2019).
  26. Food Surveys Research Group; U.S. Department of Agriculture, Agricultural Research Service. Nutrient Intakes from Food and Beverages: Mean Amounts Consumed per Individual, by Gender and Age, What We Eat in America, NHANES 2001–2012. Available online: http://www.ars.usda.gov/Services/docs.htm?docid=18349 (accessed on 13 June 2019).
  27. United States Department of Agriculture. Choose MyPlate. Available online: https://www.choosemyplate.gov/ (accessed on 24 June 2019).
  28. Baier, J.L. Development of Tool to Measure the Latino Market an Assessment Nutrition Environment. Master’s Thesis, Iowa State University, Ames, IA, USA, 2017. [Google Scholar]
  29. The Food Trust. Philadelphia’s Healthy Corner Store Initiative: 2010–2012. Available online: http://thefoodtrust.org/uploads/media_items/hcsi-y2report-final.original.pdf (accessed on 31 May 2017).
  30. Nutritional Environment Measures Survey. Available online: https://nems-upenn.org/ (accessed on 15 August 2020).
  31. Viera, A.J.; Garrett, J.M. Understanding interobserver agreement: The kappa statistic. Fam. Med. 2005, 37, 360–363. [Google Scholar] [PubMed]
  32. Iowa State Data Center. Iowa County Poverty Rates. Available online: https://www.iowadatacenter.org/data/acs/econ/poverty/couty-poverty-map (accessed on 15 August 2020).
  33. Grigsby-Toussaint, D.; Zenk, S.; Odoms-Young, A.; Ruggiero, L.; Moise, I. Availability of commonly consumed and culturally specific fruits and vegetables in African-American and Latino neighborhoods. J. Am. Diet. Assoc. 2010, 110, 746–752. [Google Scholar] [CrossRef] [PubMed] [Green Version]
Figure 1. Location of tiendas in Iowa evaluated by the Latino NEMS-S.
Ijerph 19 01860 g001
Figure 2. Latino NEMS-S and original NEMS-S total scores for each tienda (n = 42).
Ijerph 19 01860 g002
Table 1. Latino NEMS-S survey items and relevance to the Dietary Guidelines for Americans [11].
NEMS-S Latino CategoriesHealthier OptionRegular Option2015 Dietary Guidelines Healthy Eating Pattern
Milk + UHT 1 milkSkim or 1%Whole; 2%Fat-free or low-fat dairy
EggsWhite eggs, brown eggsNoneVariety of protein foods
Fresh fruitsBananas, apples, oranges, grapes, cantaloupe, watermelon, pears, peaches, strawberries, honeydew NoneFruits, especially whole fruits
Latino fresh fruitsPapaya, mango, pineapple, guava, plums, grapefruit, other banana plantains NoneFruits, especially whole fruits
Canned fruitsWater, light syrup, 100% juice
Pineapple, guava, cherries, mango, fruit cocktail, peaches
Heavy syrupFruits, especially unsweetened or no-sugar-added versions
Fresh vegetablesTomatoes, lettuce, carrots, cabbage, cucumber, sweet peppers, corn, celery, broccoli, cauliflowerNoneVariety from all subgroups
Dark green/red/orange broccoli, carrots, tomatoes
Latino fresh vegetablesTomatillo, onion, chilies, white potato, squash, avocado, radishes, jicama, cactus pad, spinach, sweet potato, plantainsNoneVariety from all subgroups
Dark green/red/orange: spinach, tomatillos;
Starchy: Potato, corn, jicama
Canned vegetablesLow sodium
Corn, green peas, cactus, mixed vegetables, green beans
Regular packagingVariety from all subgroups
Dark green/red/orange: mixed vegetables, cactus, green beans;
Starchy: corn, peas
Juice +
Juice nectars + water
Water, 100% juice,
Healthy: Fruit Nectars
Alternate: Mineral Water
Coca Cola
Alternate: Sugared soda
Limit added sugar consumption to <10% of kcals
BeefsteakSirloin Tip
Alternate: top round, flank steak, lean ground beef (≤10% fat)
Bottom Round
Alternate: short ribs, regular ground beef (>10% fat)
Variety of protein foods
ChickenFresh chicken breast or white meat
Alternate: frozen
Fresh legs and thighs (dark meat)
Alternate: frozen
Variety of protein foods
Fresh and frozen fishFresh tilapia, cod, salmon, catfish, mojarra, other fish
Alternate: frozen
NoneVariety of protein foods
Canned fishSardines in tomato sauce; tuna and sardines in oil; tuna and sardines in waterNoneVariety of protein foods
TortillasHealthiest: yellow and white corn
Healthy:100% whole wheat or whole grain
Flour tortillasGrains, at least half of which are whole grains
Canned beansHealthiest: Low sodium whole canned beans
Healthy: Whole canned beans
Refried beansVariety of vegetable and protein foods: Legumes
Dry beansPinto, black, mayocoba, redNoneVariety of vegetable and protein foods: Legumes
RiceBrown rice, white parboiled rice White long grain rice; Alternate: Jasmine riceGrains, at least half of which are whole grains
Cooking oilsExtra virgin olive oil, olive oil, canola oil, vegetable oil, corn oilLardOils; limit saturated (<10% calories) and trans fats
1 UHT = ultra-high temperature pasteurized milk.
Table 2. Original NEMS-S food categories compared to those of the Latino NEMS-S adaption.
Original NEMS-SPilot Latino NEMS-S (n = 24)Final Latino NEMS-S (n = 42)
MilkMilk + UHT 1 MilkMilk + UHT Milk
-EggsEggs
FruitsFresh fruitsFresh fruits
-Latino fresh fruitsLatino fresh fruits
-Canned fruitsCanned fruits
-Frozen fruits-
VegetablesFresh vegetables Fresh vegetables
-Latino fresh vegetablesLatino fresh vegetables
-Canned vegetablesCanned vegetables
-Frozen vegetables-
Ground BeefBeefsteak and ground beefBeefsteak and ground beef
-Fresh and frozen chickenFresh and frozen chicken
-Fresh and frozen fishFresh and frozen fish
-Canned fishCanned fish
Hot dogsHot dogs-
Frozen dinnersFrozen dinners + Latino frozen dinners-
Baked goodsBaked goods + Mexican sweet bread-
BeveragesBeverages + juice nectars + waterBeverages + juice nectars + water
Soda: Coca-ColaSoda: Coca-ColaSoda: Coca-Cola
BreadBread-
-TortillasTortillas
Baked ChipsChips-
CerealCereal-
-Canned beansCanned beans
-Dry beansDry beans
-RiceRice
-Cooking oilsCooking oils
-Solid fatsSolid fats
1 UHT = ultra-high temperature pasteurized milk.
Table 3. Inter-rater and test-retest reliability values for Latino NEMS-S dairy, meat, juice, and grains (n = 42).
Inter-Rater ReliabilityTest-Retest Reliability
Type of Food% AgreementKappa% AgreementKappa
Milk100.001.0092.860.95
UHT milk 90.240.9592.680.95
Eggs 97.620.9878.570.85
Meat/Fish
Lean beef100.001.0090.480.95
Chicken100.001.0090.480.93
Fresh fish95.240.9888.100.92
Frozen fish95.240.9888.100.92
Beverages
100% juice88.100.9288.100.92
Nectar juice92.860.9695.240.98
Tortillas
Corn tortillas 100.001.00100.001.00
Whole wheat tortillas 95.240.9790.480.95
Beans
Low sodium canned beans 95.240.9895.240.98
98–100% fat-free refried beans 95.240.9795.240.98
Dry beans 100.001.00100.001.00
Rice
Brown rice 95.240.9795.240.98
Parboiled rice 90.480.9490.480.95
Canned fish 1001.001001.00
Mean of 41 stores. UHT = ultra-high temperature pasteurized milk.
Table 4. Inter-rater and test-retest reliability values for Latino NEMS-S fruit and vegetable assessment (n = 42).
Inter-Rater ReliabilityTest-Retest Reliability
Type of Food% AgreementKappa% AgreementKappa
Fresh Fruit
Bananas90.480.9478.570.86
Apples100.001.0090.480.94
Oranges95.240.9888.100.92
Grapes95.240.9892.860.96
Cantaloupe95.240.9885.710.90
Peaches95.240.9895.240.97
Honeydew melon100.001.00100.001.00
Watermelon100.001.0078.570.83
Pears95.240.9895.240.97
Plantains90.480.9595.240.97
Papaya90.480.9578.570.85
Mango95.240.9880.950.87
Pineapple90.480.9485.710.90
Guava y87.800.9185.370.90
Grapefruit95.240.9895.240.97
Fresh Vegetables
Tomatoes100.001.00100.001.00
Lettuce85.710.9088.100.92
Carrots95.240.9890.480.93
Cabbage85.710.9090.480.93
Cucumber95.240.9885.710.89
Sweet peppers88.100.9285.710.89
Corn95.240.9785.710.90
Celery90.480.9595.240.98
Tomatillos95.240.97100.001.00
Onion 100.001.0095.240.98
Chiles 95.240.9890.480.95
Potatoes 90.480.9580.950.87
Squash 95.240.9890.480.95
Avocado x90.000.9272.500.82
Radishes 95.240.9776.190.86
Jicama y92.680.9582.930.90
Cactus pad85.710.9080.950.87
Sweet potato 95.240.9790.480.93
x Mean of 40 stores. y Mean of 41 stores.
Publisher’s Note: MDPI stays neutral with regard to jurisdictional claims in published maps and institutional affiliations.

