Article

Applying the Moving Epidemic Method to Establish the Influenza Epidemic Thresholds and Intensity Levels for Age-Specific Groups in Hubei Province, China

1
State Key Laboratory of Virology, School of Public Health, Wuhan University, Wuhan 430071, China
2
Hubei Provincial Center for Disease Control and Prevention, Wuhan 430079, China
*
Author to whom correspondence should be addressed.
Int. J. Environ. Res. Public Health 2022, 19(3), 1677; https://doi.org/10.3390/ijerph19031677
Submission received: 11 December 2021 / Revised: 28 January 2022 / Accepted: 28 January 2022 / Published: 1 February 2022
(This article belongs to the Section Disease Prevention)

Abstract

:
Background: School-aged children were reported to act as the main transmitter during influenza epidemic seasons. It is vital to set up an early detection method to help with the vaccination program in such a high-risk population. However, most relative studies only focused on the general population. Our study aims to describe the influenza epidemiology characteristics in Hubei Province and to introduce the moving epidemic method to establish the epidemic thresholds for age-specific groups. Methods: We divided the whole population into pre-school, school-aged and adult groups. The virology data from 2010/2011 to 2017/2018 were applied to the moving epidemic method to establish the epidemic thresholds for the general population and age-specific groups for the detection of influenza in 2018/2019. The performances of the model were compared by the cross-validation process. Results: The epidemic threshold for school-aged children in the 2018/2019 season was 15.42%. The epidemic thresholds for influenza A virus subtypes H1N1 and H3N2 and influenza B were determined as 5.68%, 6.12% and 10.48%, respectively. The median start weeks of the school-aged children were similar to the general population. The cross-validation process showed that the sensitivity of the model established with school-aged children was higher than those established with the other age groups in total influenza, H1N1 and influenza B, while it was only lower than the general population group in H3N2. Conclusions: This study proved the feasibility of applying the moving epidemic method in Hubei Province. Additional influenza surveillance and vaccination strategies should be well-organized for school-aged children to reduce the disease burden of influenza in China.

1. Introduction

Human influenza has become a severe global health problem in recent years. According to the World Health Organization estimation, influenza can cause 3–5 million severe illnesses and approximately 300,000 deaths each year [1]. The World Health Organization re-emphasizes the importance of influenza monitoring and has established a set of standards for sentinel surveillance after suffering great losses in both the economy and people’s health during the influenza A (H1N1) pandemic in 2009 [2]. Influenza surveillance networks for monitoring different indicators or targeting different populations are being set up worldwide [3,4]. The sanitation department collects and processes these data to provide policymakers with feasible prevention and control strategies.
The influenza vaccination program was considered a cost-effective measure and was recommended as the priority method against influenza. However, the accurate prediction of the start of the epidemic was correlated with the protective effect of the vaccine [5,6]. Setting up the epidemic threshold is one of the methods for disease prediction [7]. Several studies have provided empirical or statistical methods to establish the epidemic threshold, such as the Serfling regression model [8] and the moving logistic regression method [9], or defined the epidemic threshold as 10% of the influenza detection rate [10]. However, these methods cannot evaluate the intensity levels between seasons and have requirements for the form of data. In addition, the changes of epidemic patterns in different seasons led to the invalidity of a fixed proportion of the influenza detection rate. The moving epidemic method (MEM) was first put forward in Spain [11] and has been adopted as a routine surveillance program to establish the epidemic threshold and intensity levels in some temperate countries [12,13]. Increasing studies in other climate zones have also demonstrated the high goodness of fit of the threshold established by the MEM [14,15,16,17]. In China, there is no standard method for setting epidemic thresholds, so introducing a practical method for early influenza detection will be helpful to reduce the disease burden for Chinese people.
Children are considered to be one of the high-risk populations for influenza. A previous study demonstrated that the school-aged children had a higher incidence rate than adults [18], and school-aged children might have acted as the primary transmitter during the epidemic [19]. A contact mode study in eight European countries indicated that it might be due to the high contact frequency in this age group [20]. Offering the start time of the influenza epidemic in school-aged children can help the sanitation department take early and proper measures and reduce the disease burden in the whole population. However, most MEM studies have only concentrated on the general population. The epidemic threshold of school-aged children has not been discussed.
In this study, we analyzed the characteristics of influenza in Hubei Province from the season 2010/2011 to 2018/2019. Subsequently, we established the epidemic thresholds and intensity levels for the school-aged populations and compared the goodness of fit between the models established by different age group data. The feasibility of the moving epidemic method was evaluated by the cross-validation process.

2. Materials and Methods

2.1. Case Identification

Influenza-like illness (ILI) was described as a patient whose body temperature was above 38 °C with either cough or sore throat, with the lack of other experimental diagnoses. A period of high body temperature should happen in the course of the acute fever.

2.2. Sample Source

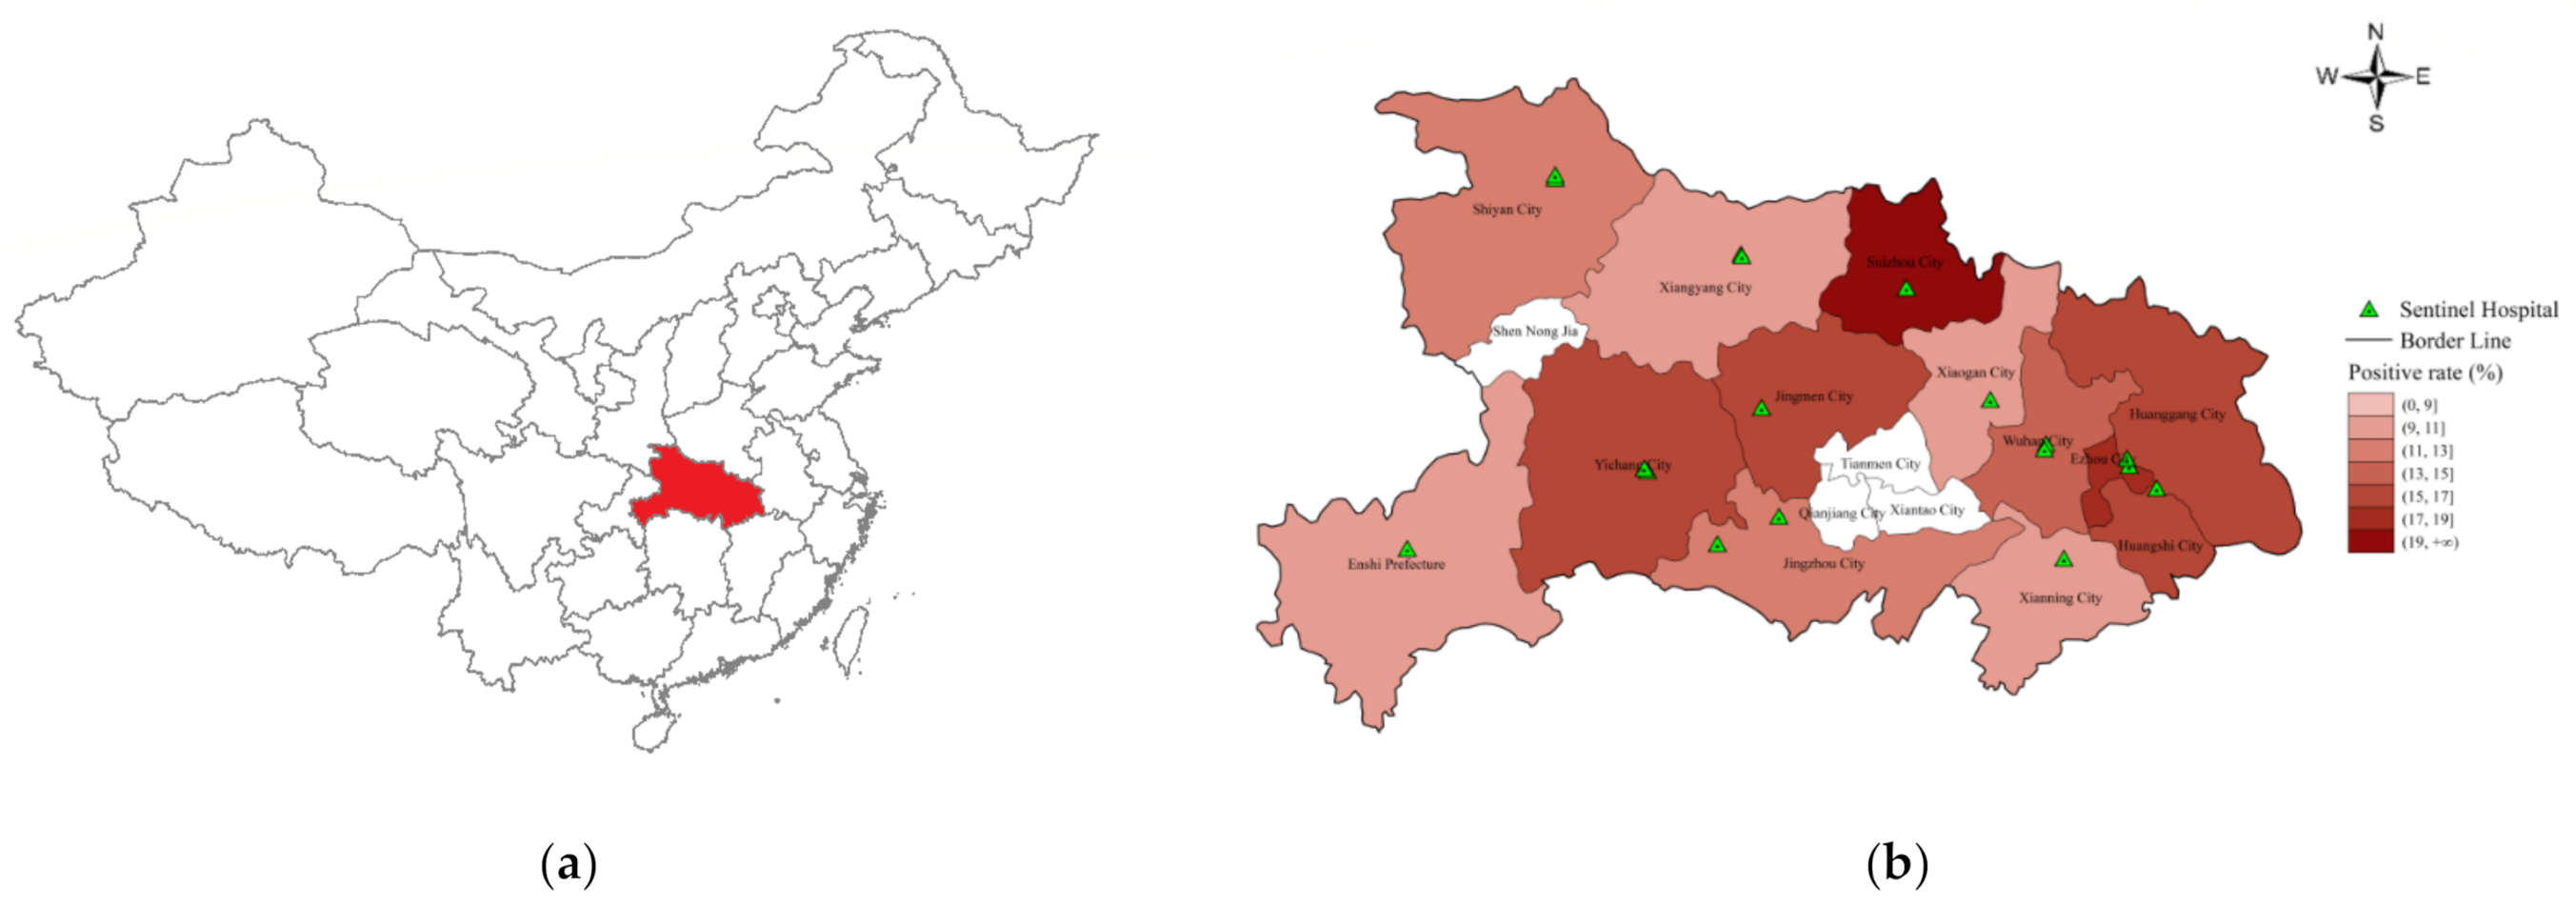
Hubei Province is a subtropical area located in Central China (108°21′–116°07′ E, 29°01′–33°6′ N), including twelve cities, one prefecture and four administrative cities directly under the jurisdiction of the province. It covers an area of 185,900 km2, with 55,750,000 permanent residents, including more than 8,610,000 school-aged children.
Sentinel hospitals were set up in 2000 to collect influenza-like illness visitors’ information, and the locations of the national sentinel hospitals are shown in Figure 1. The absence of a sentinel hospital in some cities was due to the small size of the population (Shen Nong Jia) or that they were directly under the governance of Hubei Province (Qianjiang City, Tianmen City and Xiantao City). Each sentinel hospital was asked to collect 20 swab samples (including throat swabs, nasal swabs and nasopharyngeal swabs) per surveillance week from ILI patients. The swab samples were collected in sampling tubes and stored at 2–8 °C and then transported to the laboratory of a local municipal center for disease control and prevention (CDC) for further testing. Real-time reverse transcription-polymerase chain reaction (RT-PCR) was used to identify the subtypes of the influenza virus, and the results were submitted to the national influenza surveillance network. The quality of the test results of each city was reviewed by the influenza reference laboratory of Hubei CDC.

2.3. Data Collection

In mainland China, children above three years old are able to attend kindergarten. According to the living environment and social contact mode, we roughly divided the whole population into three age groups. We defined the population below three years old as pre-school children and the population above eighteen years old as adults, while the rest were defined as school-aged children, who spent most of the time in a classroom and had more opportunities to interact with others.
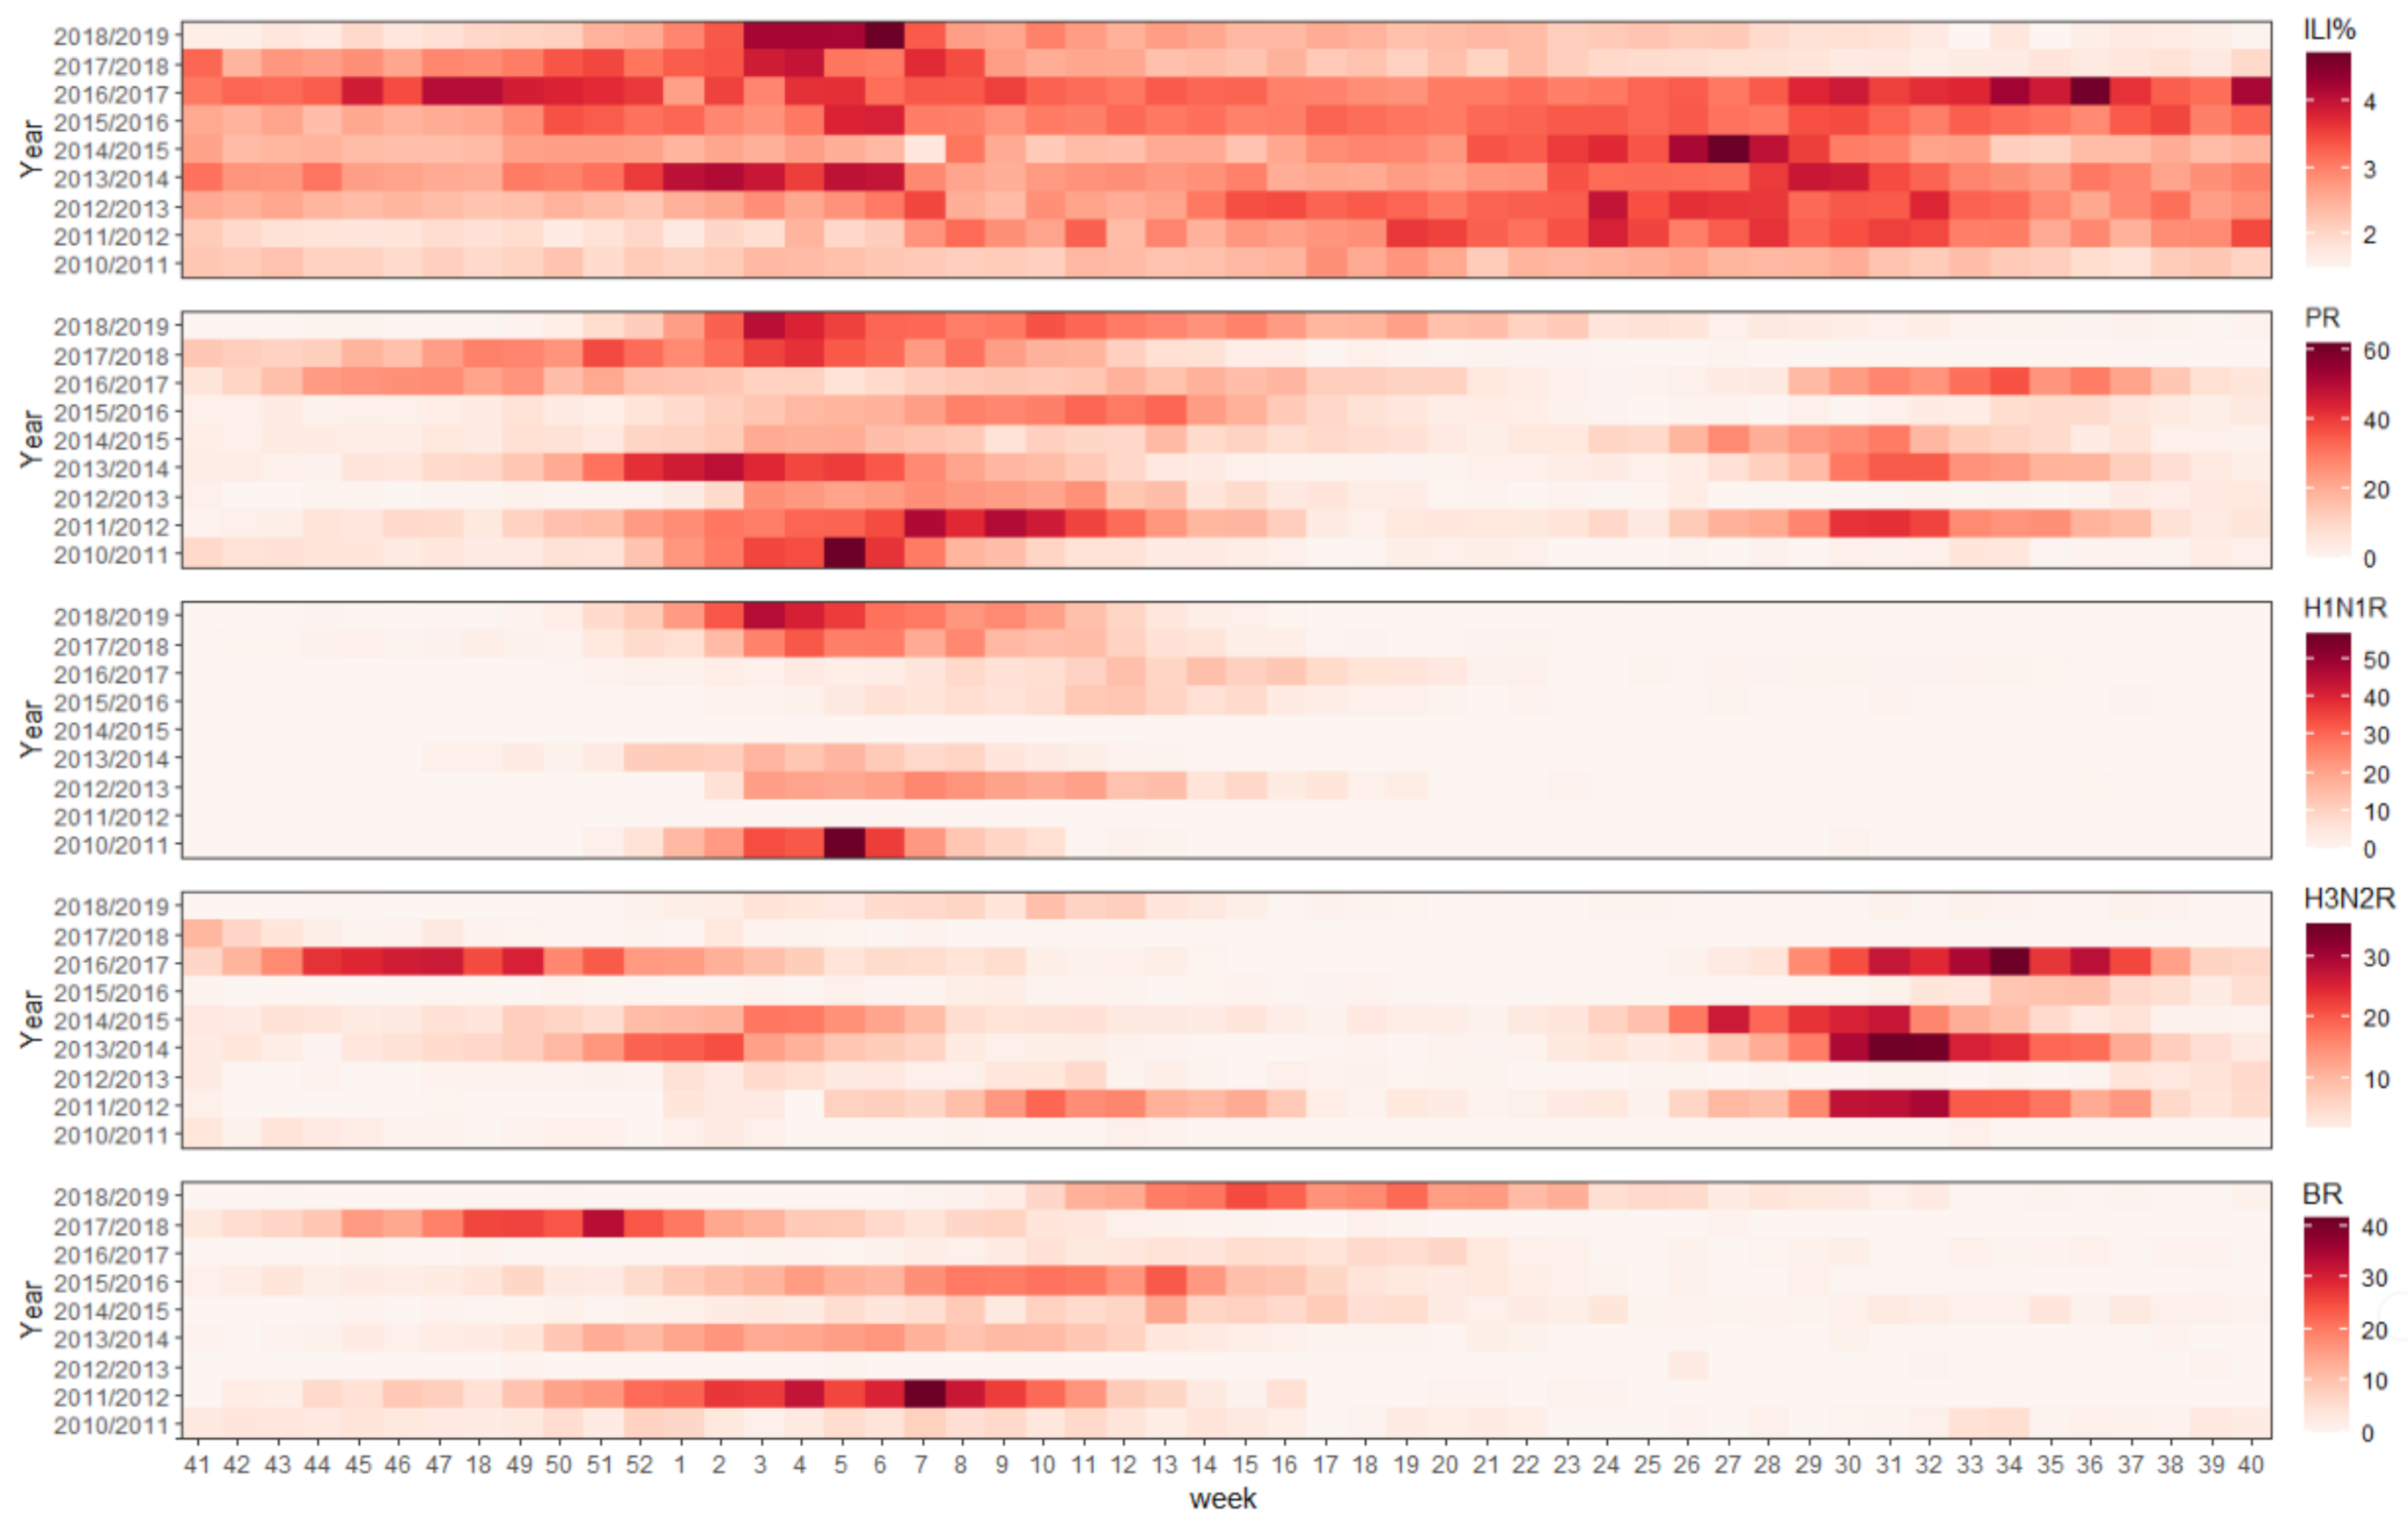
In Hubei Province, all three influenza strains occurred in the winter, while influenza A(H3N2) intermittently occurred in the summer. To include the entire prevalence curve of each strain, we defined the epidemic surveillance period of Hubei Province as week 40 to week 41 of the following calendar year. This study obtained the surveillance data from season 2010/2011 to 2018/2019, with 468 epidemic weeks. Due to the technical limitations, the influenza A strains in the first several surveillance seasons contained many untyped samples. We did not further divide these data like in another study [21] to avoid potential confounding factors.

2.4. Moving Epidemic Method

The MEM procedure could be divided into three steps: The first step was to define the epidemic period. The maximum accumulated rates percentage method (MAP) was applied to divide the season into the pre-epidemic, epidemic, and post-epidemic periods. The epidemic period defined by this algorithm was the real epidemic period. The details can be found in a previous study [
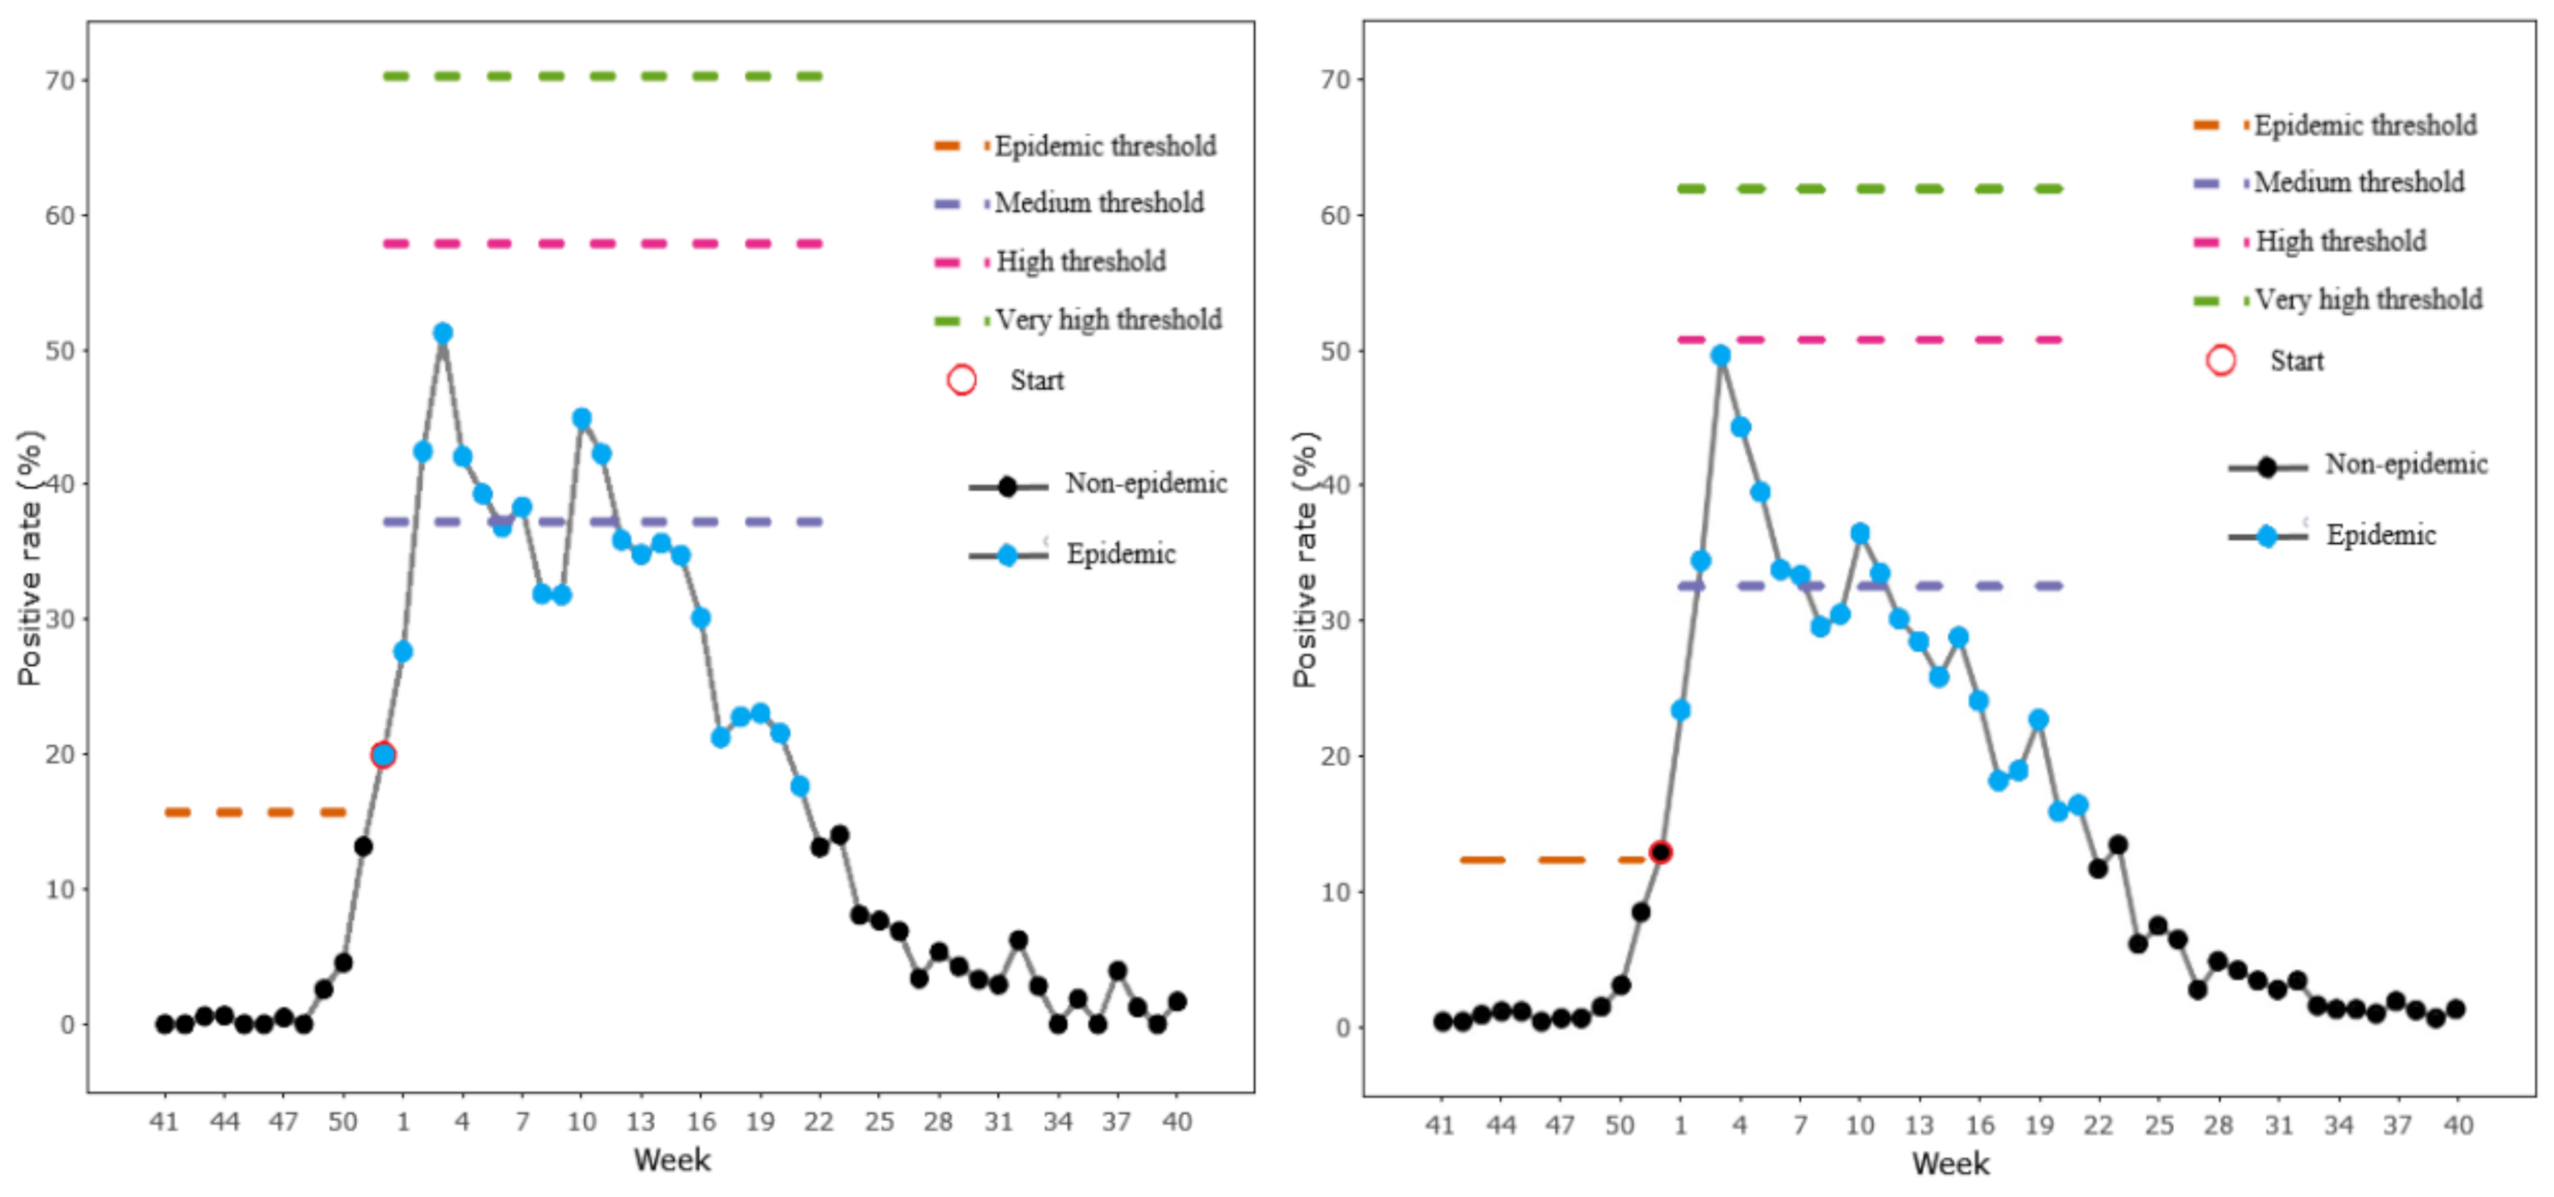
11]. Parameter δ plays a vital role in this step, as this is a pre-defined parameter recommended to range from 2.0% to 4.0%, and the proper value was chosen by the criteria of the highest Youden’s Index (YI). The second step was to establish the epidemic and the intensity thresholds. The epidemic thresholds were calculated as the upper limits of the 95% one-sided confidence interval of the arithmetic mean of the 30 highest weekly values of the pre-epidemic and post-epidemic periods. The epidemic intensity thresholds were calculated as the upper limits of the 40%, 90% and 97.5% one-sided confidence intervals of the geometric mean of the 30 highest weekly values of the epidemic period. The medium intensity, the high intensity and the very high intensity were defined as 40%, 90% and 97.5%, respectively. The final step was to assess the performance of the model. The MEM adopted a cross-validation procedure to estimate the epidemic thresholds and assess the goodness of fit. This cross-validation procedure was performed by extracting every epidemic season from the historical data and using the remaining seasons to calculate the threshold of the extracted one. When the weekly positive rate exceeded the epidemic threshold for two consecutive weeks, the first week was defined as the alert week. The timeliness was the number of weeks between the alert week and the first week of the epidemic period defined in the first step. If the alert week was after the real start week, it was defined as the detection lag. Sensitivity (Se) was calculated as the number of weeks above the epidemic and post-epidemic thresholds divided by the number of real epidemic weeks, and specificity (Sp) was defined as the number of weeks below the epidemic and post-epidemic thresholds divided by the number of real nonepidemic weeks. Similar indicators, such as the positive predictive value (PPV), negative predictive value (NPV) and Youden’s Index (YI = Sp + Se − 1), were further developed to assess the performance of the model.
Influenza epidemics occur twice per season in Hubei Province. We applied the two-wave transformation tool offered by the R package “memapp” [22] to separate these double-peak data. However, a three-peak epidemic pattern was observed in season 2016/2017. We excluded this season from calculating the total influenza thresholds, because the transformation tool could not separate this season. For the type-specific strain, we followed the examples of the study in Guangdong Province and Scotland [17,23], and the epidemic threshold was calculated using weekly data in the seasons when the proportion of the strain exceeded 20%. We defined the last season as the test set for each influenza strain, while the other was the training data. The MEM package version 2.16 of R language software performed the procedure.

2.5. Statistical Method

The influenza positive rates and the proportions of the different age groups were compared using the Pearson chi-square test. The intensity levels, the average start week and the duration were compared by the Mann–Whitney U test. These procedures were conducted by IBM SPSS Statistics 25 (SPSS Inc., Chicago, IL, USA).

3. Results

3.1. Description of Influenza Activity in Hubei Province

From season 2010/2011 to 2018/2019, the sentinel hospitals identified 927,585 ILI patients, and 139,745 of them were tested by the laboratory. The Pearson correlation test provided a poor correlation between the weekly ILI proportion and positive rate, with a coefficient of 0.39 (p < 0.001). The pre-school, school-aged children and adults respectively accounted for 30.5%, 40.7% and 28.8% of all the samples sent for testing. Among all the laboratory-tested samples, 18,666 samples were positive (13.4%), and the positive rates of the three age groups were 8.8%, 17.4% and 12.5%, respectively. Gender did not affect the opportunity to become infected (chi-square test, p > 0.05). Suizhou City had the highest positive proportion, and the chi-square test for pairwise comparison showed that the positive rates of Suizhou, Ezhou, Huangshi, Yichang, Jingmen and Huanggang City were significantly higher than those of the other cities in Hubei Province (Table 1). The chi-square test also demonstrated that the positive rate increased when the children became older, starting from one year old and reaching the highest level at 6–12 years old, while no significant difference was found between age groups above 18 years old (Figure 2). H3N2 was the main-type influenza in pre-school children (45.0%) and adults (42.1%), this proportion was significantly higher in pre-school children (p = 0.008). Most of the school-aged children were infected by influenza B (42.5%), higher than the other two age groups (p < 0.001). The proportion of H1N1 had no significant difference among the three age groups (p = 0.60).
Fourteen epidemic peaks were observed during all the surveillance seasons. Four of the nine seasons presented more than one peak. Notably, most of the seasons with multiple peaks were due to cocirculated influenza (Figure 3). H1N1 and influenza B provided one peak per season, while seasonal H3N2 in Hubei Province had two peaks, and the activity in the winter was milder than in the summer. The epidemic onset time and the length of H1N1 and the summer peak of H3N2 between the different seasons were less varied than influenza B and the winter peak of H3N2.

3.2. Epidemic Thresholds and Intensity Levels Established by the MEM Model

Table 2 summarized the laboratory results for school-aged children in different seasons, and Table 3 presented the epidemic thresholds for school-aged children. According to the maximum Youden’s Index, the best parameters δ for total influenza, H1N1, H3N2 and influenza B were defined as 2.0, 3.1, 2.5 and 2.0, respectively. The epidemic threshold for total influenza in season 2018/2019 was 15.74%, and the alert week was defined as week 52, the same week as the start of the epidemic period defined by the MAP method, indicating that the epidemic detection timeliness was 0 (Figure 4). During the threshold establishment, the epidemic threshold of influenza B was significantly higher than influenza H1N1 and H3N2 (p < 0.001), while H1N1 and H3N2 had similar thresholds (p = 0.184). For the total strain, influenza typically started (median start week) at week 50 in the winter and week 26 in the summer. For the type-specific strain, typical H1N1 started at week 2, influenza B started at week 49 and H3N2 started at week 47 in the winter and 27 in the summer. Influenza B had the most prolonged epidemic duration (influenza B versus H1N1, p = 0.004; influenza B versus H3N2, p = 0.001), and the durations of H1N1 and H3N2 were similar (p = 0.599). We observed that the median duration of summer H3N2 was 2 weeks longer than that in the winter, but this difference was not significant (p = 0.072).
We also established the epidemic and intensity thresholds of the general population and other age-specific groups. The laboratory results are shown in Appendix A, while the intensity levels and other epidemic details are shown in Appendix B. For the general population, the alert week was one week earlier in season 2018/2019. In order to compare the differences in the timing of the onset of influenza among the different age groups, we selected and compared the common epidemic seasons of the three age groups. We observed that the epidemic descriptions of the same season between the different age groups were varied. In addition, by comparing the median start week, we found H1N1 and H3N2 struck first among adults, while influenza B started first among school-aged children. Pre-school children were the last to get infected and had a relatively shorter epidemic duration than the other two age groups in all three strains. However, the differences of the start week and the duration between the age groups were not statistically significant (p > 0.05).

3.3. MEM Goodness of Fit

In Table 4, we present the goodness of fit of the MEM model established for different age groups. All groups performed well, with high sensitivity and specificity. In most cases, school-aged children had the highest Youden’s Index. However, pre-school children and adults seemed to have worse performances than the general population.
For the type-specific strains, we observed that the performance of influenza B was relatively worse. By inspecting the goodness of fit of each season, we found that the inclusion of the season with low influenza activity led to a poor outcome. Therefore, we attempted to remove the 2010/2011 data from the training set of influenza B and compared the model performance before and after the exclusion (Appendix C). The results indicated that the start week and duration of influenza of the remaining seasons did not change after excluding the low influenza activity seasons, while the performance of influenza B was significantly improved.

4. Discussion

This study described the influenza epidemiology characteristics in Hubei Province from season 2010/2011 to 2018/2019, established the epidemic thresholds for the general and age-specific groups and assessed the MEM performance between these groups. Our study proved the feasibility of applying the MEM in Hubei Province and proposed that the school-aged children could replace the general population for influenza routine surveillance. To our knowledge, this study is one of the first attempts in applying the MEM to establish the thresholds for age-specific groups in the subtropical region.
Choosing proper indicators can help with improving the effectiveness of the model. This study applied the virology data rather than the ILI incidence rate to fit the MEM. Previous studies have proved the feasibility of a series of indicators to establish the influenza prediction model, including the ILI incidence rate or cases [24], virology data [21], excess mortality rate [25] and school absenteeism rate [26]. In Hubei Province, a poor correlation was found between the positive and ILI incidence rates, and the ILI seemed to provide less seasonality. ILI could be affected by multiple factors, such as the coinfection of other respiratory viruses with similar symptoms, the willingness of parents to send their children to medical care and the criteria used to define ILI. These findings suggested that the ILI incidence rate may not be a suitable indicator for establishing the influenza model in tropical and subtropical areas, which was in line with other studies. [27,28].
For the general population, the influenza epidemic threshold in season 2018/2019 was defined as 12.10%, lower than the thresholds established for all subtropical cities in China [29]. A difference was also found between the epidemic thresholds for Guangdong Province and its climate zone [17]. These results may be attributed to the large territory in China, which leads to climate and economic differences among provinces, finally resulting in various influenza epidemic patterns of regions even in the same climate zones. However, we found that, when there was a double-peak influenza pattern in Hubei Province, a similar phenomenon could also be observed in all studied cities of Hubei Province, implying that the epidemiological differences between cities may not be as great as the differences at the provincial level. This assumption was also supported by Yu and his colleagues [
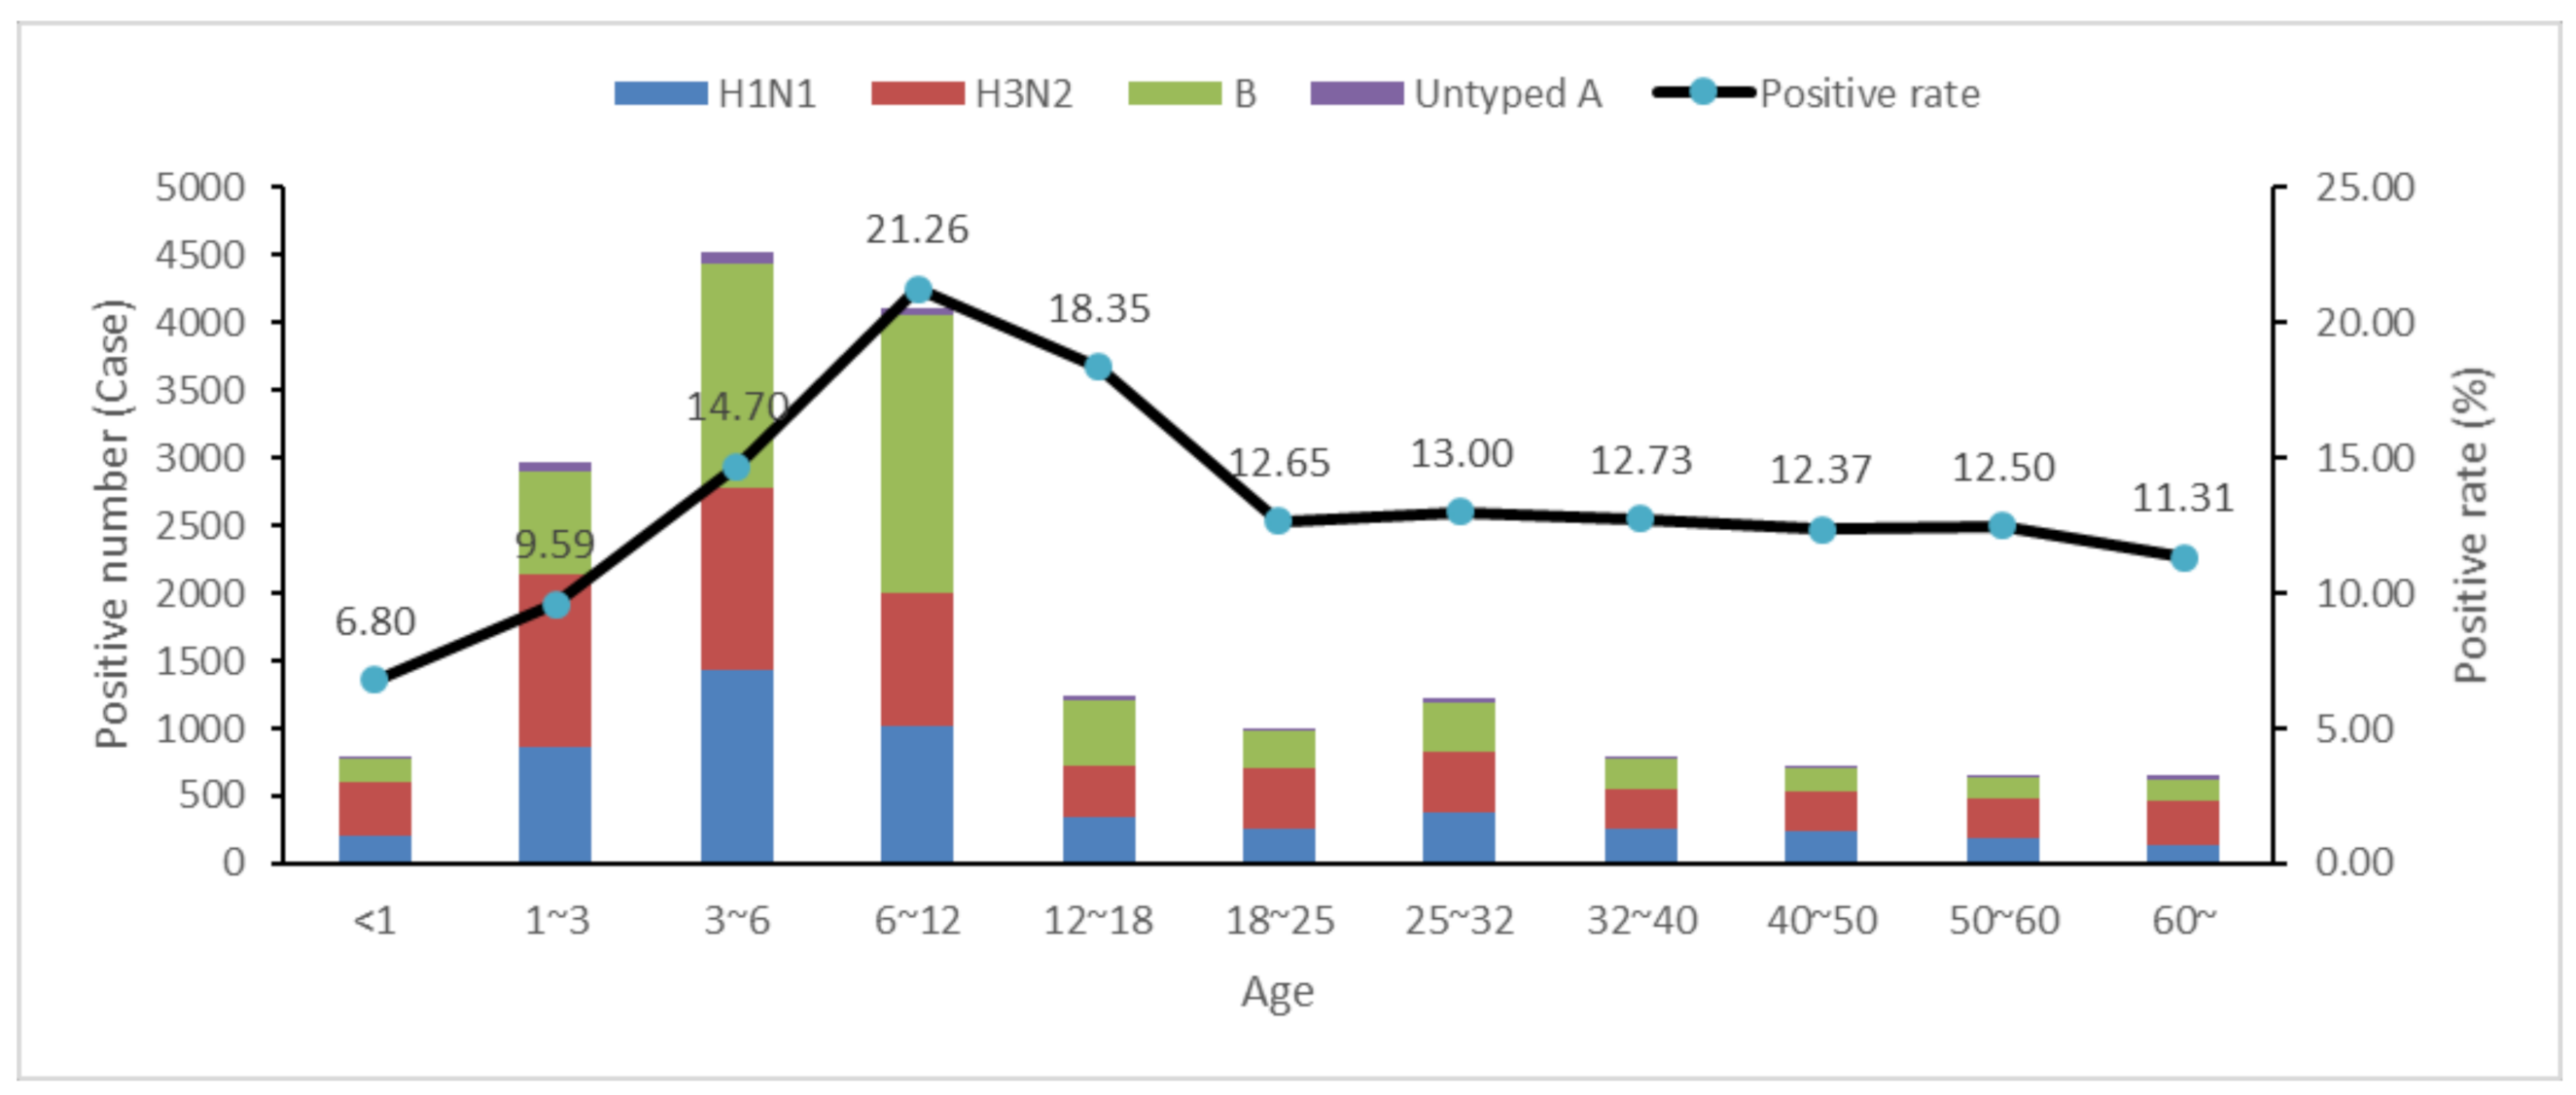
30], which made it possible to establish the influenza thresholds at the provincial level. Nevertheless, we also observed that the positive rate of influenza among cities in Hubei Province was varied, ranging from 9.18% to 19.06%. Nevertheless, using virology data to establish the epidemic thresholds for each city was not feasible due to the lack of ILI samples sent for laboratory testing per week. If we want to establish more accurate thresholds for influenza detection, we will have to increase the number of test samples, which requires a higher laboratory testing capacity. In the current situation, where the laboratory testing capacity was relatively fixed, adapting a specific population for testing may be one of the solutions. According to our observations, most test samples came from 1–6 year old, but the 6–12 age group had the highest infection rate. A similar phenomenon was also observed in Niger [31] and several states of the United States [24]. Moreover, the cross-validation analysis showed that school-aged children performed better in MEM. These findings suggest that school-aged children might be a worthy and suitable population to study the influenza prevalence. In Hubei Province, the comparison of the start week provided slight differences among the different age groups. This phenomenon was also observed in Canada and Korea [32,33], making it possible for countries that do not have enough laboratory testing capacity to substitute school-aged children for the whole population surveillance.
The concept of a school-based surveillance system was proposed 20 years ago [34], and its effectiveness has been proven in studies in different countries [26,35,36]. In China, school-based surveillance has been incorporated into community influenza surveillance. However, the current school-based surveillance system only concentrates on syndromic indicators such as absenteeism and ILI rates. Compared with other age groups, the student samples were easier to obtain and manage. Establishing a school-based virology surveillance system could help to quickly identify the circulating strain and utilize relatively small samples for influenza monitoring.
A vaccination program among school-aged children was recommended in the United States [18,37] and Europe [38]. In China, the health insurance system does not cover the influenza vaccination [39], partly responsible for the low levels of vaccine coverage. Our study revealed that influenza B was most prevalent in school-aged children. Quadrivalent influenza vaccination among this age group might have considerable efficacy. However, the timings of influenza B epidemics are highly variable, so accurate predictions of the onset of an epidemic is crucial for vaccination.
The MEM provided a simple approach for establishing the epidemic threshold to detect the epidemic start week and has a relatively low data requirement. A study in England suggested that the MEM was more suitable than the empirical percentile methods for monitoring the onset of an epidemic [40] and has been utilized for influenza routine surveillance in Europe. However, we found that seasons with low intensities could affect the MEM performance. Taking influenza B as an example, after excluding season 2010/2011 from the training set, all the indexes reflecting a goodness of fit increased significantly. These results suggested that the historical data should be filtered before applying it to the MEM model. The robustness of the MEM will be increased while using relatively stable historical data. However, no study has provided a formal method for season selection. Further research on the inclusion criteria should be conducted in the future.
This study had several limitations. First, the virology data of Hubei Province did not divide the B lineages into influenza B (Yamagata) and influenza B (Victoria), which have different timings of the onset and epidemic periods [41] and may lead to the false identification of the long and low intensities of influenza B activity. With the reduction in the cost of laboratory tests [42], more specific data was enabled to be well-documented. Second, establishing the epidemic thresholds by the MEM requires the training set to include enough seasons. However, while we applied the virology data of the type-specific strain, the seasons included in the training set of each strain were less than five seasons [11], which may have decreased the robustness of the model.

5. Conclusions

This study proved the feasibility of applying the MEM for influenza routine surveillance in Hubei Province, a subtropical region with a complex epidemic pattern. Compared with other age groups, the MEM model established with school-aged children’s data was more accurate in detecting the onset of the influenza epidemic. The importance of establishing a school-based influenza surveillance system should be noted by the sanitation department and the government.

Author Contributions

Conceptualization, Y.J.; methodology, Y.J.; formal analysis, Y.J. and B.F.; resources, B.F. and Y.-q.T.; writing—original draft preparation, Y.J.; writing—review and editing, Y.-q.T. and X.-j.Y.; visualization, Y.J. and W.-k.Z. and funding acquisition, X.-j.Y. All authors have read and agreed to the published version of the manuscript.

Funding

This study was supported by the Fundamental Research Funds for the Central Universities (2042021kf0046).

Institutional Review Board Statement

This research was based on the Chinese National Influenza Surveillance System. All the data of the cases used in our study were anonymous. No ethics approval or informed consent was needed, which was granted by the National Health Commission of China as part of public health surveillance of the infectious disease.

Informed Consent Statement

Patient consent was waived due to all the data of the cases used in our study were anonymous.

Data Availability Statement

The data presented in this study are available on request from authors affiliated with Hubei Provincial Center for Disease Control and Prevention. The data are not publicly available due to these data were archived by the CDC for internal use.

Conflicts of Interest

The authors declare no conflict of interest. The funders had no role in the study design, data collection and analysis, decision to publish or the preparation of the manuscript.

Appendix A

Table A1. Laboratory results of influenza A and B in different age groups from season 2010/2011 to 2018/2019 in Hubei Province.
AgeSeasonTest 1PositiveIdentified 2H1N14H3N2Influenza B
CaseProp (%) 3CaseProp (%)CaseProp (%)
General2010/2011876276171741958.4425.925635.7
2011/201289952034166800.072743.694156.4
2012/20131115578578462179.215219.4111.4
2013/2014168082815281552618.7146652.182329.2
2014/2015170561834183410.1131671.851728.2
2015/2016179211804180440922.720811.5118765.8
2016/2017198053106310660119.3219070.531510.1
2017/20181931825732573113244.01274.9131451.1
2018/20191992529542953160354.330310.3104735.5
Pre2010/201127251331227259.01713.93327.0
2011/2012254442633700.023670.010130.0
2012/2013347816216112376.43521.731.9
2013/2014568967367313019.339959.314421.4
2014/2015619247847810.237879.19920.7
2015/2016556136136110027.76718.619453.7
2016/2017528262362310216.449178.8304.8
2017/2018559042442420849.1286.618844.3
2018/2019552149048932566.5469.411824.1
Adult2010/2011240029727319069.693.37427.1
2011/2012259849938000.019050.019050.0
2012/2013341321121117382.03315.652.4
2013/2014482185085019222.649458.116419.3
2014/2015450948448400.037076.411423.6
2015/2016540237337310127.16116.421156.6
2016/201768941086108615214.084577.8898.2
2017/2018545256056023942.7498.827248.6
2018/2019482967767741461.27110.519228.4
1 Test: the number of samples test by the laboratories. 2 Identified: the number of positive samples after excluding the untyped influenza A. 3 Prop: proportion. 4 H1N1 and H3N2: influenza A (H1N1) and influenza A (H3N2).

Appendix B

Table A2. Start week, duration and the intensity levels of influenza A and B among the general population in Hubei Province, China.
SubtypeSeasonStart 1DurationE 2MHVTDescription
H1N1 52010/20111104.3416.6537.9254.56−1Very high
2012/20133134.3117.2843.3565.08−1Medium
2015/20165124.8323.1738.4648.121Low
2017/201852134.3717.0741.8062.09−1Medium
2018/201952133.9215.9136.0551.75−1High
H3N2 32011/2012(W)5124.8422.3933.9440.790Low
2011/2012(S)26124.8020.7232.8440.250Medium
2013/2014(W)47134.7321.8134.1841.690Low
2013/2014(S)27114.7920.3331.2537.790High
2014/2015(W)49124.5122.5833.6540.130Low
2014/2015(S)24114.8220.7333.1740.830Medium
2016/2017(W)42144.3920.7233.1840.85−1Medium
2016/2017(S)29114.7120.3831.6838.500High
B2010/201141267.3317.6234.1745.80NA 4Low
2011/201249165.5513.3829.2441.31−3Very high
2013/201449167.9014.8236.4954.331Medium
2014/20155167.8816.4536.2251.34NALow
2015/20161177.1214.1134.3650.930Medium
2017/201843167.3413.6831.8846.341High
2018/201910167.7114.0133.9050.091Medium
Total2010/2011521112.5132.4950.1160.690Very high
2011/2012(W)501812.1132.2849.8160.340High
2011/2012(S)241412.5032.7551.8863.572Medium
2012/201321412.5434.4053.2164.521Low
2013/2014(W)491512.4432.4450.6561.670Medium
2013/2014(S)271212.7133.3953.0765.132Medium
2014/2015(W)492212.7735.7751.1559.915Low
2014/2015(S)241412.6634.1053.3364.982Low
2015/201621512.6133.5253.2165.271Medium
2017/2018442011.0932.8552.1463.96−3Medium
2018/201912112.1032.5551.0462.26−1Medium
1 Start: the start week defined by the MEM algorithm. 2 E: epidemic threshold. M: medium intensity. H: high intensity. VH: very high intensity. T: timeliness 3 H3N2S: the summer wave of H3N2. H3N2W: the winter wave of H3N2. 4 NA: the positive rate does not exceed the threshold for two consecutive weeks in this epidemic period, and the alert week cannot be determined. 5 H1N1 and H3N2: influenza A (H1N1) and influenza A (H3N2) and B: influenza B.
Table A3. Start week, duration and the intensity levels of influenza A and B among pre-school children in Hubei Province, China.
SubtypeSeasonStart 1DurationE 2MHVTDescription
H1N1 52010/2011273.1814.1629.6741.140High
2012/20134103.1313.7434.3351.460Medium
2015/20165123.5417.2634.9247.670Low
2017/20181113.5013.8034.3351.360Medium
2018/20191132.9212.7529.5842.90−2High
H3N2 32011/2012(W)5124.9714.8537.5456.560Medium
2011/2012(S)28115.3414.5035.3452.390High
2012/201352125.2718.8333.7443.66NA 4Low
2013/2014(W)48125.2815.6839.5559.532Medium
2013/2014(S)28115.3614.6036.2854.260Medium
2014/2015(W)47175.1316.5339.8658.816Low
2014/2015(S)25115.2114.7436.7455.021Medium
2016/2017(W)42155.0115.1338.6558.51−1Medium
2016/2017(S)29115.3514.5135.6753.090Medium
B2010/2011494.4511.4024.2833.921Medium
2011/201251143.638.7621.5632.10−1Very high
2013/201451144.599.4225.7340.110Medium
2014/20155154.6110.9426.3338.827Low
2015/20162174.439.1724.8138.522Medium
2017/201846164.338.8422.8034.651High
2018/201910174.539.3725.5739.852Medium
Total2010/2011188.8626.5047.3261.152High
2011/2012(W)1169.1826.4947.8162.060Medium
2011/2012(S)22169.1426.4147.3961.370Medium
2012/20133119.4227.4550.2165.581Medium
2013/2014(W)51138.2226.3746.9960.67−1High
2013/2014(S)28119.4127.3550.0765.422Medium
2014/2015(W)52189.4331.2443.7950.852Low
2014/2015(S)24129.2427.2049.7364.933Medium
2015/20163149.4227.8150.4165.561Low
2017/201847178.8226.9949.4964.700Medium
2018/20191209.2926.8148.8963.760Medium
1 Start: the start week defined by the MEM algorithm. 2 E: epidemic threshold. M: medium intensity. H: high intensity. VH: very high intensity. T: timeliness. 3 H3N2S: the summer wave of H3N2. H3N2W: the winter wave of H3N2. 4 NA: the positive rate does not exceed the threshold for two consecutive weeks in this epidemic period, and the alert week cannot be determined. 5 H1N1 and H3N2: influenza A (H1N1) and influenza A (H3N2) and B: influenza B.
Table A4. Start week, duration and the intensity levels of influenza A and B among adults in Hubei Province, China.
SubtypeSeasonStart 1DurationE 2MHVLevelDescription
H1N1 42010/201152113.4315.2237.1855.18−1Very high
2012/20132144.2117.0649.8380.030Medium
2013/201451123.9318.4452.3382.990Medium
2015/20165144.1822.0546.6664.994Low
2017/201850173.5117.6751.2682.081Medium
2018/201952123.8515.3539.1359.160High
H3N2 32011/2012(W)5125.6923.2541.8754.302Low
2011/2012(S)25135.4720.3441.7057.281Medium
2013/2014(W)46135.8421.5143.1358.653Medium
2013/2014(S)24155.0219.3636.2247.76−1Very high
2014/2015(W)47145.6822.4543.3858.053Low
2014/2015(S)23115.8620.2441.3956.791Medium
2016/2017(W)42155.4819.9940.8355.990Medium
2016/2017(S)29115.5919.8039.8954.360Medium
B2010/20114954.5014.7130.0741.24−7Low
2011/201252156.7310.5026.2439.340High
2014/20153177.2013.1536.2356.724Low
2015/20162176.9312.1835.3156.512Medium
2017/201845186.7911.0230.3447.473High
2018/201911167.2111.2231.9850.821Medium
Total2010/2011511210.9732.0955.4370.58−1High
2011/2012(W)521512.6532.6558.5875.851Medium
2011/2012(S)231512.4932.9659.5077.243Medium
2012/201311312.5034.4761.5979.601Low
2013/2014(W)491412.4432.8259.1376.712Medium
2013/2014(S)271212.1432.7258.8776.310Medium
2014/2015(W)492312.6535.8359.9575.267Low
2014/2015(S)231212.5834.1661.3179.391Medium
2015/201621512.6435.8060.1875.712Low
2017/2018481610.8233.3760.6478.970Medium
2018/201912212.5932.3056.9473.160Medium
1 Start: the start week defined by the MEM algorithm. 2 E: epidemic threshold. M: medium intensity. H: high intensity. VH: very high intensity. 3 H3N2S: the summer wave of H3N2. H3N2W: the winter wave of H3N2. 4 H1N1 and H3N2: influenza A (H1N1) and influenza A (H3N2) and B: influenza B.

Appendix C

Table A5. Thresholds of influenza B of school-aged children, including and excluding the 2010/2011 season, in Hubei Province, China.
StatusSeasonStart 1DurationE 2MHVHTDescription
Pre 32010/2011412610.1125.7943.7155.18NALow
2011/201246199.3919.6738.9852.730High
2013/2014491610.8421.447.6967.961Medium
2014/201551510.8823.0948.567.335Low
2015/20161178.3120.3544.1262.1−5Medium
2017/2018421610.120.4544.5362.80Medium
2018/2019101510.6620.8646.1765.61Medium
After2011/201246198.9923.0036.7345.160Very high
2013/2014491610.4725.5245.3458.451Medium
2014/201551510.5228.7241.5848.975Low
2015/20161177.9223.9442.4554.68−5Medium
2017/201842169.7024.1142.8855.300Medium
2018/2019101510.3324.7444.3557.411Medium
1 Start: the start week defined by the MAP method. 2 E: epidemic threshold. M: medium intensity. H: high intensity. VH: very high intensity. T: timeliness. 3 Pre: before excluding season 2010/2011. After: after excluding season 2010/2011.
Table A6. Goodness of fit for influenza B, including and excluding the 2010/2011 season, in Hubei Province, China.
SubtypeAge GroupSe 2SpPPVNPVYIMT 3
Pre 4General 10.70.980.930.860.671
Pre-school0.690.980.920.890.661
School-aged0.770.960.910.890.730.5
Adult0.650.980.920.880.631.5
AfterGeneral0.860.970.920.940.821
Pre-school0.760.970.910.910.731.5
School-aged0.920.960.920.960.880.5
Adult0.820.950.890.920.770
1 General: general population. 2 Se: sensitivity. Sp: specificity. PPV: positive predictive value. NPV: negative predictive value. YI: Youden’s Index. 3 MT: median timeliness of the available seasons, including the training set and the test set, and negative numbers represented the early detection weeks, while positive numbers represented the detection lag. 4 Pre: before excluding season 2010/2011. After: after excluding season 2010/2011.

References

  1. Nicholson, K.G.; Wood, J.M.; Zambon, M. Influenza. Lancet 2003, 362, 1733–1745. [Google Scholar] [CrossRef]
  2. Ortiz, J.R.; Sotomayor, V.; Uez, O.C.; Oliva, O.; Bettels, D.; McCarron, M.; Bresee, J.S.; Mounts, A.W. Strategy to enhance influenza surveillance worldwide. Emerg. Infect. Dis. 2009, 15, 1271–1278. [Google Scholar] [CrossRef] [PubMed]
  3. Ziegler, T.; Mamahit, A.; Cox, N.J. 65 years of influenza surveillance by a World Health Organization-coordinated global network. Influenza Other Respir. Viruses 2018, 12, 558–565. [Google Scholar] [CrossRef] [PubMed]
  4. Hay, A.J.; McCauley, J.W. The WHO global influenza surveillance and response system (GISRS)-A future perspective. Influenza Other Respir. Viruses 2018, 12, 551–557. [Google Scholar] [CrossRef]
  5. Pebody, R.; Andrews, N.; McMenamin, J.; Durnall, H.; Ellis, J.; Thompson, C.I.; Robertson, C.; Cottrell, S.; Smyth, B.; Zambon, M.; et al. Vaccine effectiveness of 2011/12 trivalent seasonal influenza vaccine in preventing laboratory-confirmed influenza in primary care in the United Kingdom: Evidence of waning intra-seasonal protection. Eurosurveillance 2013, 18, 20389. [Google Scholar] [CrossRef] [Green Version]
  6. Costantino, V.; Trent, M.; MacIntyre, C.R. Modelling of optimal timing for influenza vaccination as a function of intraseasonal waning of immunity and vaccine coverage. Vaccine 2019, 37, 6768–6775. [Google Scholar] [CrossRef]
  7. Cooper, D.L.; Verlander, N.Q.; Elliot, A.J.; Joseph, C.A.; Smith, G.E. Can syndromic thresholds provide early warning of national influenza outbreaks? J. Public Health 2009, 31, 17–25. [Google Scholar] [CrossRef] [Green Version]
  8. Wang, X.; Wu, S.; MacIntyre, C.R.; Zhang, H.; Shi, W.; Peng, X.; Duan, W.; Yang, P.; Zhang, Y.; Wang, Q. Using an adjusted Serfling regression model to improve the early warning at the arrival of peak timing of influenza in Beijing. PLoS ONE 2015, 10, e0119923. [Google Scholar] [CrossRef]
  9. Cheng, X.; Chen, T.; Yang, Y.; Yang, J.; Wang, D.; Hu, G.; Shu, Y. Using an innovative method to develop the threshold of seasonal influenza epidemic in China. PLoS ONE 2018, 13, e0202880. [Google Scholar] [CrossRef]
  10. Budgell, E.; Cohen, A.L.; McAnerney, J.; Walaza, S.; Madhi, S.A.; Blumberg, L.; Dawood, H.; Kahn, K.; Tempia, S.; Venter, M.; et al. Evaluation of two influenza surveillance systems in South Africa. PLoS ONE 2015, 10, e0120226. [Google Scholar] [CrossRef] [Green Version]
  11. Vega, T.; Lozano, J.E.; Meerhoff, T.; Snacken, R.; Mott, J.; Ortiz de Lejarazu, R.; Nunes, B. Influenza surveillance in Europe: Establishing epidemic thresholds by the moving epidemic method. Influenza Other Respir. Viruses 2013, 7, 546–558. [Google Scholar] [CrossRef] [PubMed] [Green Version]
  12. Rakocevic, B.; Grgurevic, A.; Trajkovic, G.; Mugosa, B.; Sipetic Grujicic, S.; Medenica, S.; Bojovic, O.; Lozano Alonso, J.E.; Vega, T. Influenza surveillance: Determining the epidemic threshold for influenza by using the Moving Epidemic Method (MEM), Montenegro, 2010/11 to 2017/18 influenza seasons. Eurosurveillance 2019, 24, 1800042. [Google Scholar] [CrossRef] [PubMed]
  13. Vega, T.; Lozano, J.E.; Meerhoff, T.; Snacken, R.; Beaute, J.; Jorgensen, P.; Ortiz de Lejarazu, R.; Domegan, L.; Mossong, J.; Nielsen, J.; et al. Influenza surveillance in Europe: Comparing intensity levels calculated using the moving epidemic method. Influenza Other Respir. Viruses 2015, 9, 234–246. [Google Scholar] [CrossRef] [PubMed] [Green Version]
  14. Bouguerra, H.; Boutouria, E.; Zorraga, M.; Cherif, A.; Yazidi, R.; Abdeddaiem, N.; Maazaoui, L.; ElMoussi, A.; Abid, S.; Amine, S.; et al. Applying the moving epidemic method to determine influenza epidemic and intensity thresholds using influenza-like illness surveillance data 2009–2018 in Tunisia. Influenza Other Respir. Viruses 2020, 14, 507–514. [Google Scholar] [CrossRef] [PubMed]
  15. Ly, S.; Arashiro, T.; Ieng, V.; Tsuyuoka, R.; Parry, A.; Horwood, P.; Heng, S.; Hamid, S.; Vandemaele, K.; Chin, S.; et al. Establishing seasonal and alert influenza thresholds in Cambodia using the WHO method: Implications for effective utilization of influenza surveillance in the tropics and subtropics. West. Pac. Surveill. Response J. 2017, 8, 22–32. [Google Scholar] [CrossRef] [Green Version]
  16. Teeluck, M.; Samura, A. Assessing the appropriateness of the Moving Epidemic Method and WHO Average Curve Method for the syndromic surveillance of acute respiratory infection in Mauritius. PLoS ONE 2021, 16, e0252703. [Google Scholar] [CrossRef]
  17. Kang, M.; Tan, X.; Ye, M.; Liao, Y.; Song, T.; Tang, S. The moving epidemic method applied to influenza surveillance in Guangdong, China. Int. J. Infect. Dis. 2021, 104, 594–600. [Google Scholar] [CrossRef]
  18. Committee on Infectious Diseases. Recommendations for Prevention and Control of Influenza in Children, 2020–2021. Pediatrics 2020, 146, e2020024588. [Google Scholar] [CrossRef]
  19. Kissler, S.M.; Viboud, C.; Grenfell, B.T.; Gog, J.R. Symbolic transfer entropy reveals the age structure of pandemic influenza transmission from high-volume influenza-like illness data. J. R. Soc. Interface 2020, 17, 20190628. [Google Scholar] [CrossRef] [Green Version]
  20. Mossong, J.; Hens, N.; Jit, M.; Beutels, P.; Auranen, K.; Mikolajczyk, R.; Massari, M.; Salmaso, S.; Tomba, G.S.; Wallinga, J.; et al. Social contacts and mixing patterns relevant to the spread of infectious diseases. PLoS Med. 2008, 5, e74. [Google Scholar] [CrossRef]
  21. Kandula, S.; Yang, W.; Shaman, J. Type- and Subtype-Specific Influenza Forecast. Am. J. Epidemiol. 2017, 185, 395–402. [Google Scholar] [CrossRef] [PubMed] [Green Version]
  22. AbdElGawad, B.; Vega, T.; El Houssinie, M.; Mohsen, A.; Fahim, M.; Abu ElSood, H.; Jabbour, J.; Eid, A.; Refaey, S. Evaluating tools to define influenza baseline and threshold values using surveillance data, Egypt, season 2016/17. J. Infect. Public Health 2020, 13, 430–437. [Google Scholar] [CrossRef] [PubMed]
  23. Murray, J.L.K.; Marques, D.F.P.; Cameron, R.L.; Potts, A.; Bishop, J.; von Wissmann, B.; William, N.; Reynolds, A.J.; Robertson, C.; McMenamin, J. Moving epidemic method (MEM) applied to virology data as a novel real time tool to predict peak in seasonal influenza healthcare utilisation. The Scottish experience of the 2017/18 season to date. Eurosurveillance 2018, 23, 18-00079. [Google Scholar] [CrossRef] [PubMed] [Green Version]
  24. Fowlkes, A.; Dasgupta, S.; Chao, E.; Lemmings, J.; Goodin, K.; Harris, M.; Martin, K.; Feist, M.; Wu, W.; Boulton, R.; et al. Estimating influenza incidence and rates of influenza-like illness in the outpatient setting. Influenza Other Respir. Viruses 2013, 7, 694–700. [Google Scholar] [CrossRef] [Green Version]
  25. Goldstein, E.; Viboud, C.; Charu, V.; Lipsitch, M. Improving the estimation of influenza-related mortality over a seasonal baseline. Epidemiology 2012, 23, 829–838. [Google Scholar] [CrossRef] [Green Version]
  26. Ashton, R.A.; Kefyalew, T.; Batisso, E.; Awano, T.; Kebede, Z.; Tesfaye, G.; Mesele, T.; Chibsa, S.; Reithinger, R.; Brooker, S.J. The usefulness of school-based syndromic surveillance for detecting malaria epidemics: Experiences from a pilot project in Ethiopia. BMC Public Health 2016, 16, 20. [Google Scholar] [CrossRef] [Green Version]
  27. Thomas, R.E. Is influenza-like illness a useful concept and an appropriate test of influenza vaccine effectiveness? Vaccine 2014, 32, 2143–2149. [Google Scholar] [CrossRef]
  28. Otomaru, H.; Kamigaki, T.; Tamaki, R.; Opinion, J.; Santo, A.; Daya, E.; Okamoto, M.; Saito, M.; Tallo, V.; Lupisan, S.; et al. Influenza and other respiratory viruses detected by influenza-like illness surveillance in Leyte Island, the Philippines, 2010–2013. PLoS ONE 2015, 10, e0123755. [Google Scholar] [CrossRef] [Green Version]
  29. Tan, Y.Y.; Zeng, L.J.; Qin, Y.; Zheng, J.D.; Li, Z.J.; Wang, D.Y.; Chen, T.; Feng, L.Z.; Peng, Z.B. Evaluation of the application of moving epidemic method on making influenza epidemic thresholds in the 7 climate zones in China. Zhonghua Yu Fang Yi Xue Za Zhi 2019, 53, 1007–1011. [Google Scholar] [CrossRef]
  30. Yu, H.; Alonso, W.J.; Feng, L.; Tan, Y.; Shu, Y.; Yang, W.; Viboud, C. Characterization of regional influenza seasonality patterns in China and implications for vaccination strategies: Spatio-temporal modeling of surveillance data. PLoS Med. 2013, 10, e1001552. [Google Scholar] [CrossRef]
  31. Maïnassara, H.B.; Lagare, A.; Tempia, S.; Sidiki, A.; Issaka, B.; Abdou Sidikou, B.; Oukem-Boyer, O.O. Influenza Sentinel Surveillance among Patients with Influenza-Like-Illness and Severe Acute Respiratory Illness within the Framework of the National Reference Laboratory, Niger, 2009–2013. PLoS ONE 2015, 10, e0133178. [Google Scholar] [CrossRef] [PubMed]
  32. Schanzer, D.; Vachon, J.; Pelletier, L. Age-specific differences in influenza A epidemic curves: Do children drive the spread of influenza epidemics? Am. J. Epidemiol. 2011, 174, 109–117. [Google Scholar] [CrossRef] [PubMed] [Green Version]
  33. Son, W.S.; Park, J.E.; Kwon, O. Early detection of influenza outbreak using time derivative of incidence. EPJ Data Sci. 2020, 9, 28. [Google Scholar] [CrossRef] [PubMed]
  34. Lenaway, D.D.; Ambler, A. Evaluation of a school-based influenza surveillance system. Public Health Rep. 1995, 110, 333–337. [Google Scholar]
  35. Ward, M.A.; Stanley, A.; Deeth, L.E.; Deardon, R.; Feng, Z.; Trotz-Williams, L.A. Methods for detecting seasonal influenza epidemics using a school absenteeism surveillance system. BMC Public Health 2019, 19, 1232. [Google Scholar] [CrossRef] [PubMed] [Green Version]
  36. Xu, W.; Chen, T.; Dong, X.; Kong, M.; Lv, X.; Li, L. Outbreak detection and evaluation of a school-based influenza-like-illness syndromic surveillance in Tianjin, China. PLoS ONE 2017, 12, e0184527. [Google Scholar] [CrossRef] [Green Version]
  37. Fiore, A.E.; Epperson, S.; Perrotta, D.; Bernstein, H.; Neuzil, K. Expanding the recommendations for annual influenza vaccination to school-age children in the United States. Pediatrics 2012, 129 (Suppl. 2), S54–S62. [Google Scholar] [CrossRef] [Green Version]
  38. Rizzo, C.; Rezza, G.; Ricciardi, W. Strategies in recommending influenza vaccination in Europe and US. Hum. Vaccines Immunother. 2018, 14, 693–698. [Google Scholar] [CrossRef] [Green Version]
  39. National Immunization Advisory Committee (NIAC) Technical Working Group (TWG) Influenza Vaccination TWG. Technical guidelines for seasonal influenza vaccination in China (2021–2022). Zhonghua Liu Xing Bing Xue Za Zhi = Zhonghua Liuxingbingxue Zazhi 2021, 42, 1722–1749. [Google Scholar] [CrossRef]
  40. Green, H.K.; Charlett, A.; Moran-Gilad, J.; Fleming, D.; Durnall, H.; Thomas, D.R.; Cottrell, S.; Smyth, B.; Kearns, C.; Reynolds, A.J.; et al. Harmonizing influenza primary-care surveillance in the United Kingdom: Piloting two methods to assess the timing and intensity of the seasonal epidemic across several general practice-based surveillance schemes. Epidemiol. Infect. 2015, 143, 1–12. [Google Scholar] [CrossRef] [Green Version]
  41. Glezen, W.P.; Schmier, J.K.; Kuehn, C.M.; Ryan, K.J.; Oxford, J. The burden of influenza B: A structured literature review. Am. J. Public Health 2013, 103, e43–e51. [Google Scholar] [CrossRef] [PubMed]
  42. Diel, R.; Nienhaus, A. Cost-Benefit Analysis of Real-Time Influenza Testing for Patients in German Emergency Rooms. Int. J. Environ. Res. Public Health 2019, 16, 2368. [Google Scholar] [CrossRef] [PubMed] [Green Version]
Figure 1. (a) The geographic location of Hubei Province in China. (b) The locations of influenza sentinel hospitals and positive rates of influenza in the sentinel hospitals in Hubei Province.
Ijerph 19 01677 g001
Figure 2. The case number and positive rate of the influenza subtypes in different age groups in Hubei Province, China (n = 18,666 cases). H1N1 and H3N2: influenza A (H1N1) and influenza A (H3N2) and B: influenza B.
Ijerph 19 01677 g002
Figure 3. Influenza surveillance results from season 2010/2011 to 2018/2019. ILI%: weekly influenza-like illness patients’ proportion among all outpatient visitors. PR: weekly laboratory testing positive samples among all samples delivered by sentinel hospitals. H1N1R, H3N2R and BR: weekly laboratory testing positive rate for H1N1, H3N2 and influenza B. The color represented the value of the surveillance week.
Ijerph 19 01677 g003
Figure 4. The positive rate, epidemic and intensity levels of school-aged children (left) and general population (right) in season 2018/2019 in Hubei Province, China.
Ijerph 19 01677 g004
Table 1. Gender, subtypes and positive rate of influenza in Hubei Province, China from 2010/2011 to 2018/2019.
CharacteristicSpecimen No.Positive No.Positive Rate (%)H1N1 No.H3N2 No.B No.Untyped A No.
Gender
Male75,73810,23113.51294835483502233
Female64,007843513.18236429832909179
Season
2010/201187627618.694194225644
2011/20128995203422.610727941366
2012/201311,1557857.04621152111
2013/201416,808281516.7552614668230
2014/201517,056183410.75113165170
2015/201617,921180410.0740920811870
2016/201719,805310615.6860121903150
2017/201819,318257313.32113212713140
2018/201919,925295414.83160330310471
City
Suizhou8275157719.063724717331
Ezhou8269143217.3254032555413
Huangshi8250132616.072485824879
Yichang10,723167715.6449651160367
Jingmen7783120315.4629645543814
Huanggang8094125115.463375044073
Wuhan20,698270413.067351188596185
Shiyan17,408216812.4564777471730
Jingzhou16,975206712.184997857794
Xianning812188010.842962843000
Xiaogan706871910.1729621318822
Xiangyang10,5549719.2031925035349
Enshi75276919.1823118925615
Total139,74518,66613.36531265316411412
Table 2. Laboratory results of influenza in school-aged children in Hubei Province, China.
SeasonTest 1PositiveIdentified 2H1N1 4H3N2Influenza B
CaseProp (%) 3CaseProp (%)CaseProp (%)
2010/2011367134032815747.9226.714945.4
2011/20123845110895000.030031.665068.4
2012/2013417540740732579.98119.930.7
2013/201463161297129720415.757544.351539.7
2014/2015631987287200.056965.330334.7
2015/201669241070107020819.4807.578373.2
2016/201776611389138934725.085061.219614.1
2017/201882361600160068542.8553.485453.4
2018/201995921785178586448.418610.473741.3
1 Test: the number of samples tested by the laboratory. 2 Identified: the number of positive samples after excluding untyped influenza A. 3 Prop: proportion. 4 H1N1 and H3N2: influenza A (H1N1) and influenza A (H3N2).
Table 3. Start week, duration and the intensity levels of influenza A and B among school-aged children in Hubei Province, China.
SubtypeSeasonStart 1DurationE 2MHVHTDescription
H1N1 52010/2011196.1123.7339.5549.560Very high
2012/20133136.0522.5142.4956.270Medium
2016/20178115.7126.0442.7453.210Low
2017/20182123.7422.0240.2552.54−3Medium
2018/201951136.0521.5638.1149.030High
H3N2 32011/2012(W)5126.6124.2932.8037.460Medium
2011/2012(S)26136.2722.8933.2839.260Medium
2013/2014(W)46145.9823.5133.7139.531Medium
2013/2014(S)28116.4122.5032.3938.050Medium
2014/2015(W)48126.0723.5933.2038.611Medium
2014/2015(S)25116.4622.7432.7738.520Medium
2016/2017(W)42145.9222.6032.7338.55−1Medium
2016/2017(S)29116.3822.3931.3736.420Very high
B2010/2011412610.1125.7943.7155.18NA 4Low
2011/201246199.3919.6738.9852.730High
2013/2014491610.8421.4047.6967.961Medium
2014/201551510.8823.0948.5067.335Low
2015/20161178.3120.3544.1262.10−5Medium
2017/2018421610.1020.4544.5362.800Medium
2018/2019101510.6620.8646.1765.601Medium
Total2010/2011521215.9337.4956.9568.510High
2011/2012(W)491914.0436.7355.2866.23−3High
2011/2012(S)261316.0137.5958.3570.863Medium
2012/201321616.0438.6159.5772.171Low
2013/2014(W)481715.7736.8956.3267.901Medium
2013/2014(S)281215.9839.2059.3071.202Low
2014/2015(W)522015.8339.4658.9570.392Low
2014/2015(S)241415.6539.3258.8570.322Low
2015/201611715.8937.2457.6869.990Medium
2017/2018422315.0337.2657.7270.04−1Medium
2018/2019522215.7437.3357.9370.360Medium
1 Start: the start week defined by the MAP method. 2 E: epidemic threshold. M: medium intensity. H: high intensity. VH: very high intensity. T: timeliness 3 S: the summer wave of H3N2. W: the winter wave of H3N2. 4 NA: the positive rate does not exceed the threshold for two consecutive weeks in this epidemic period, and the alert week cannot be determined. 5 H1N1 and H3N2: influenza A (H1N1) and influenza A (H3N2) and B: influenza B.
Table 4. Indicators to assess the model performance, stratified by the age groups.
SubtypeAge groupSe 2SpPPVNPVYIMT 3
Total 4General 10.830.970.950.890.801
Pre-school0.820.970.950.900.791
School-aged0.880.970.960.910.851
Adult0.800.980.960.880.781
H1N1 5General0.970.960.880.990.93−1
Pre-school0.960.960.850.990.92−1
School-aged1.000.960.881.000.960
Adult0.880.980.930.950.850
H3N2General0.970.970.970.970.940
Pre-school0.790.970.960.860.760
School-aged0.890.970.960.910.850
Adult0.840.950.950.850.791
BGeneral0.700.980.930.860.671
Pre-school0.690.980.920.890.661
School-aged0.770.960.910.890.730.5
Adult0.650.980.920.880.631.5
1 General: general population. 2 Se: sensitivity. Sp: specificity. PPV: positive predictive value. NPV: negative predictive value. YI: Youden’s Index. 3 MT: median timeliness of the available seasons, including the training set and the test set; negative numbers represented the early detection weeks, while positive numbers represented the detection lag. 4 Total: total influenza strain. 5 H1N1 and H3N2: influenza A (H1N1) and influenza A (H3N2) and B: influenza B.
Publisher’s Note: MDPI stays neutral with regard to jurisdictional claims in published maps and institutional affiliations.

