Article

Identifying the Major Hydrogeochemical Factors Governing Groundwater Chemistry in the Coastal Aquifers of Southwest Bangladesh Using Statistical Analysis

1
Laboratory for Applied Geology and Hydrogeology, Department of Geology, Ghent University, 9000 Ghent, Belgium
2
Department of Geological Sciences, Jahangirnagar University, Savar, Dhaka 1342, Bangladesh
3
Isotope Hydrology Division, Bangladesh Atomic Energy Commission, Dhaka 1349, Bangladesh
*
Author to whom correspondence should be addressed.
Hydrology 2022, 9(2), 20; https://doi.org/10.3390/hydrology9020020
Submission received: 31 December 2021 / Revised: 19 January 2022 / Accepted: 29 January 2022 / Published: 1 February 2022
(This article belongs to the Section Marine Environment and Hydrology Interactions)

Abstract

:
People in the southwestern (SW) coastal part of Bangladesh are suffering from a severe freshwater crisis due to saline groundwater at a shallow depth. Fresh groundwater below a 200 m depth is an option, but it is costly to construct deep tubewells for the local inhabitants. The processes of salinization and freshening were previously identified using conventional methods. In this study, we brought new insight into these processes by analyzing existing datasets using multivariate statistics to identify the factors affecting groundwater chemistry. Cluster analysis (CA) revealed three major clusters. Cluster A corresponded to saline (NaCl-type) water. Cluster B was also saline (NaCl-type) water but showed mixing effects. Cluster C was fresh groundwater (NaHCO3-type) and isolated. The hydrochemical characteristics of clusters A, B and C compared remarkably well with the groundwaters from the upper shallow aquifer (USA), lower shallow aquifer (LSA) and deep aquifer (DA), respectively. Factor analysis (FA) showed that 75% of the total variance was influenced by evaporate dissolution, carbonate dissolution/precipitation, cation exchange and anthropogenic pollution to some extent. Therefore, the integrated approach showed the validity of applying multivariate statistical techniques to infer the dominant hydrochemistry and to characterize and understand a complicated hydrogeological system.

1. Introduction

The sustainability of water resources availability has a major role in the socioeconomic development of each community [1]. In 2013, more than 97% of the population had access to upgraded water sources in Bangladesh, but potable water was accessible by less than 35% of the total population [2]. The life and livelihood of the people in coastal areas have been affected by natural and anthropogenic activities, such as salinization, land erosion, waterlogging and risks from climate change [3,4]. Nineteen coastal districts out of 64 districts of Bangladesh are being affected by saltwater intrusion, tidal rivers and storm surges [5]. Global warming due to climate change [6,7] and gradually reducing water flow from upstream during the dry season are the reasons for increased salinity in the coastal part of Bangladesh.
The coastal plain of SW Bangladesh is severely affected by salinization in the shallow aquifers and is usually characterized by fresh groundwater in the deep aquifer (DA). Salinization and freshening processes in coastal aquifers are very complex owing to hydrogeochemical differentiations. The variability of hydrogeochemistry occurs due to the repetition of various processes, such as salt leaching, seawater intrusion, marine-induced floodwater mixing and pollution phenomena [8]. Salinization due to salt leaching and tidal floodwater mixing with fresh water in the shallow aquifers is well documented in the study area. Freshwater infiltration from the recharge areas in the northwest of the country freshens the deep aquifer [9,10].
Multivariate statistics could be an effective tool to verify and differentiate the influencing factors of salinization and freshening, as well as decipher the groundwater composition [11,12,13]. Graphical approaches, such as piper plots, hydrochemical facies evolution and bivariate diagrams with univariate statistical analysis, were used for the interpretation of the physico-chemical composition of groundwater in some studies [9,10]. The flow of seawater, as well as the freshwater–saltwater interface, were characterized using water chemistry, borehole logs and geophysical investigation [14]. Hydrochemistry of this area signifies a good opportunity to apply multivariate statistics. It is a quantifiable approach that permits grouping the samples into different classes, studying the correlation between the hydrochemical constituents/variables and evaluating the similarities between water sampling points. This is an unbiased method that can indicate the natural association between variables and/or samples, which might be difficult to do at first glance [15].
Many researchers recently used multivariate statistics, for example, cluster analysis (CA) and factor analysis (FA), for the identification of factors controlling groundwater quality [8,16,17,18,19,20,21]. Melloul and Collin [20] used FA as a complemental method to hydrogeochemical techniques, such as Piper and Schoeller diagrams, as well as other traditional methods to distinguish the factors controlling water quality for a coastal plain aquifer. Schot and Van der Wal [22] found the influence of human activities on groundwater composition by applying CA and FA. Steinhorst and Williams [23] carried out two field experiments to determine the groundwater sources using multivariate statistics of hydrochemistry data. Farnham et al. [24] and Eang et al. [25] identified rock–water process and groundwater redox environments with the help of multivariate statistics. The present study used these two multivariate statistical techniques to analyze the existing hydrochemical data to categorize groundwaters, identify the major hydrogeochemical processes and explain the main factors affecting the chemistry of groundwater in the coastal aquifers of SW Bangladesh.

2. Description of the Study Area
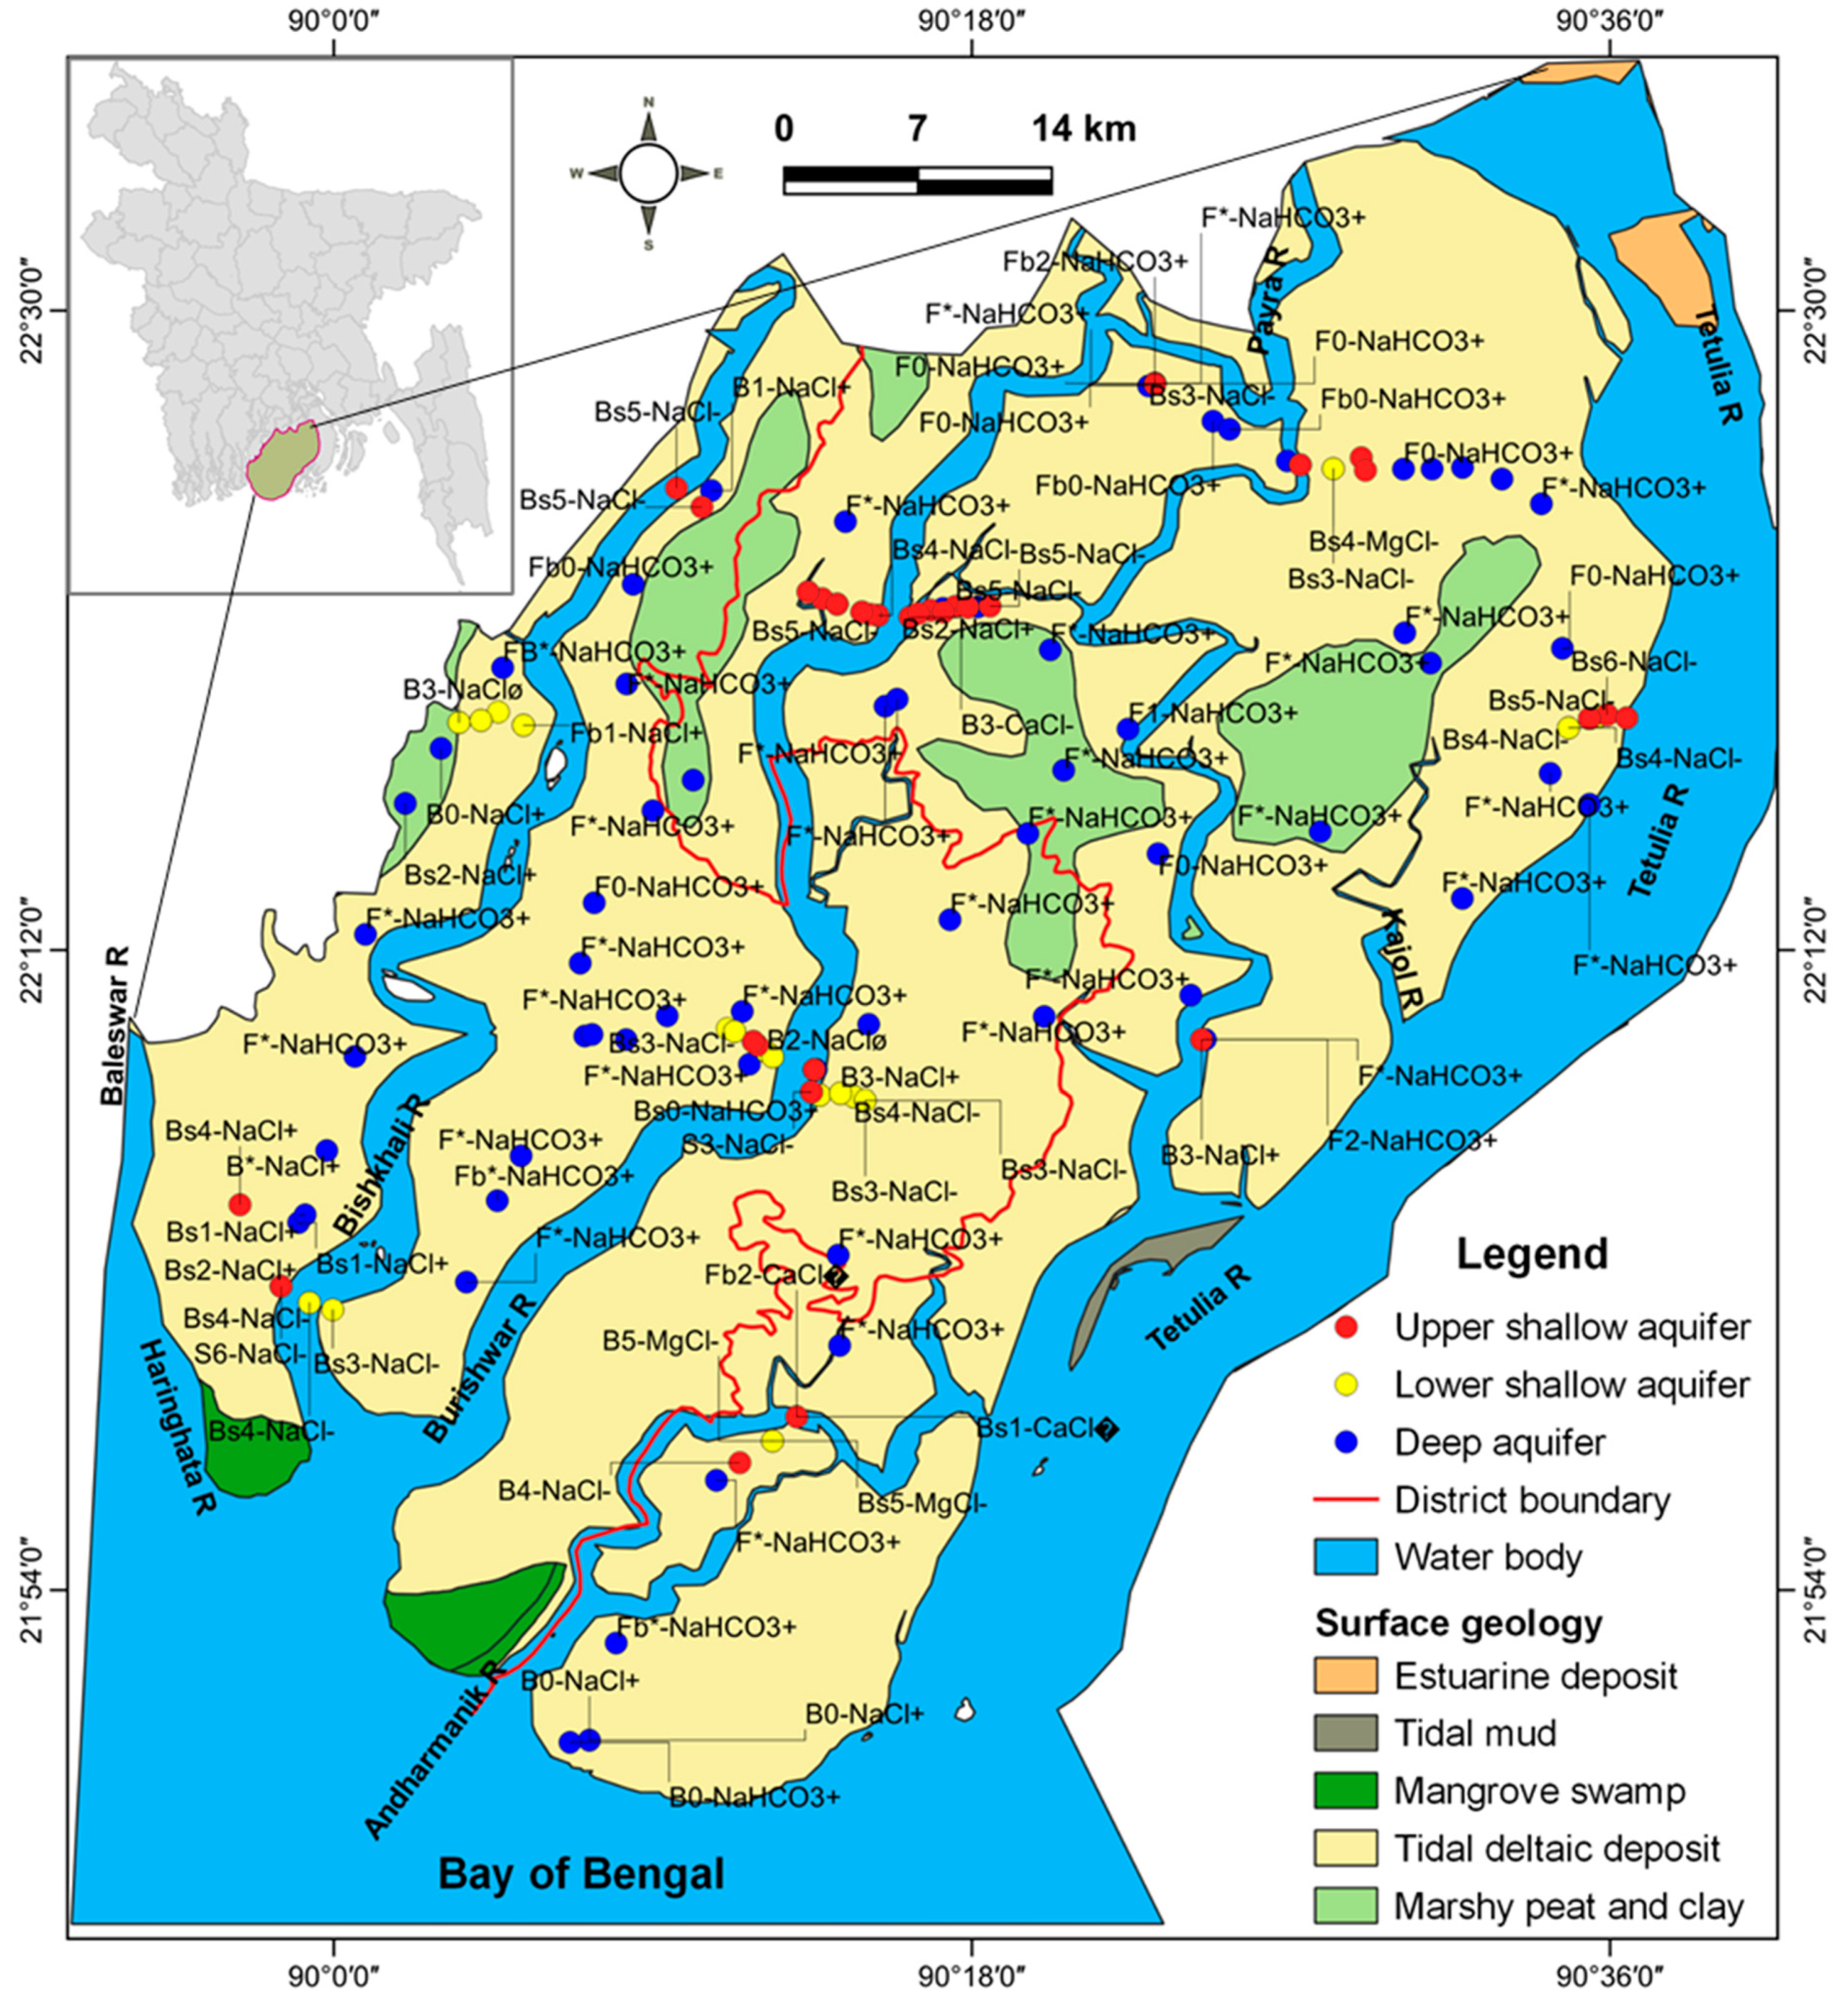
2.1. Study Area

The study area was in the southwestern coastal deltaic part of the Ganges–Brahmaputra–Meghna (GBM) delta (Figure 1). The origin of the Ganges and Brahmaputra rivers is in the Himalayas [26]. The area of study is comprised of Patuakhali and Barguna districts. The southern part is enclosed by the Bay of Bengal, the Tetulia river in the east and by the Baleswar River in the west. Other rivers in the investigated area include Burirshwar, Bishkhali, Galachipa, Gopaldi, Andharmanick and Phalla. The study area slopes gently from the north (ca. 13 m above mean sea level (amsl)) to south (ca. 1 amsl). The floodplain and delta plain have been formed by some 1500 × 109 m3 of sediments in the last 7000 years [27]. The deltaic plain is separated by the tidal channels network with elevations of 0.9 to 2.1 m amsl [26]. The coastal areas are sinking at a rate of 3 mm/year [28]. On the other hand, the average annual accretion rate was 4.8 km2/y [29]. Seawater intrusion from the sea has not been reported yet in our study area due to excessive groundwater abstraction.

2.2. Climate

A tropical climate occurs in the area with a mean temperature (T) of 26 °C. Plenty of precipitation occurs during the monsoon months (May to October). The mean annual precipitation is 2530 mm. The humidity varies from 90% in summer to 76% in the winter season. The mean monthly maximum evaporation is 80 mm [9]. The study area is affected by natural calamities, such as floods, cyclones and tornadoes, almost every year.

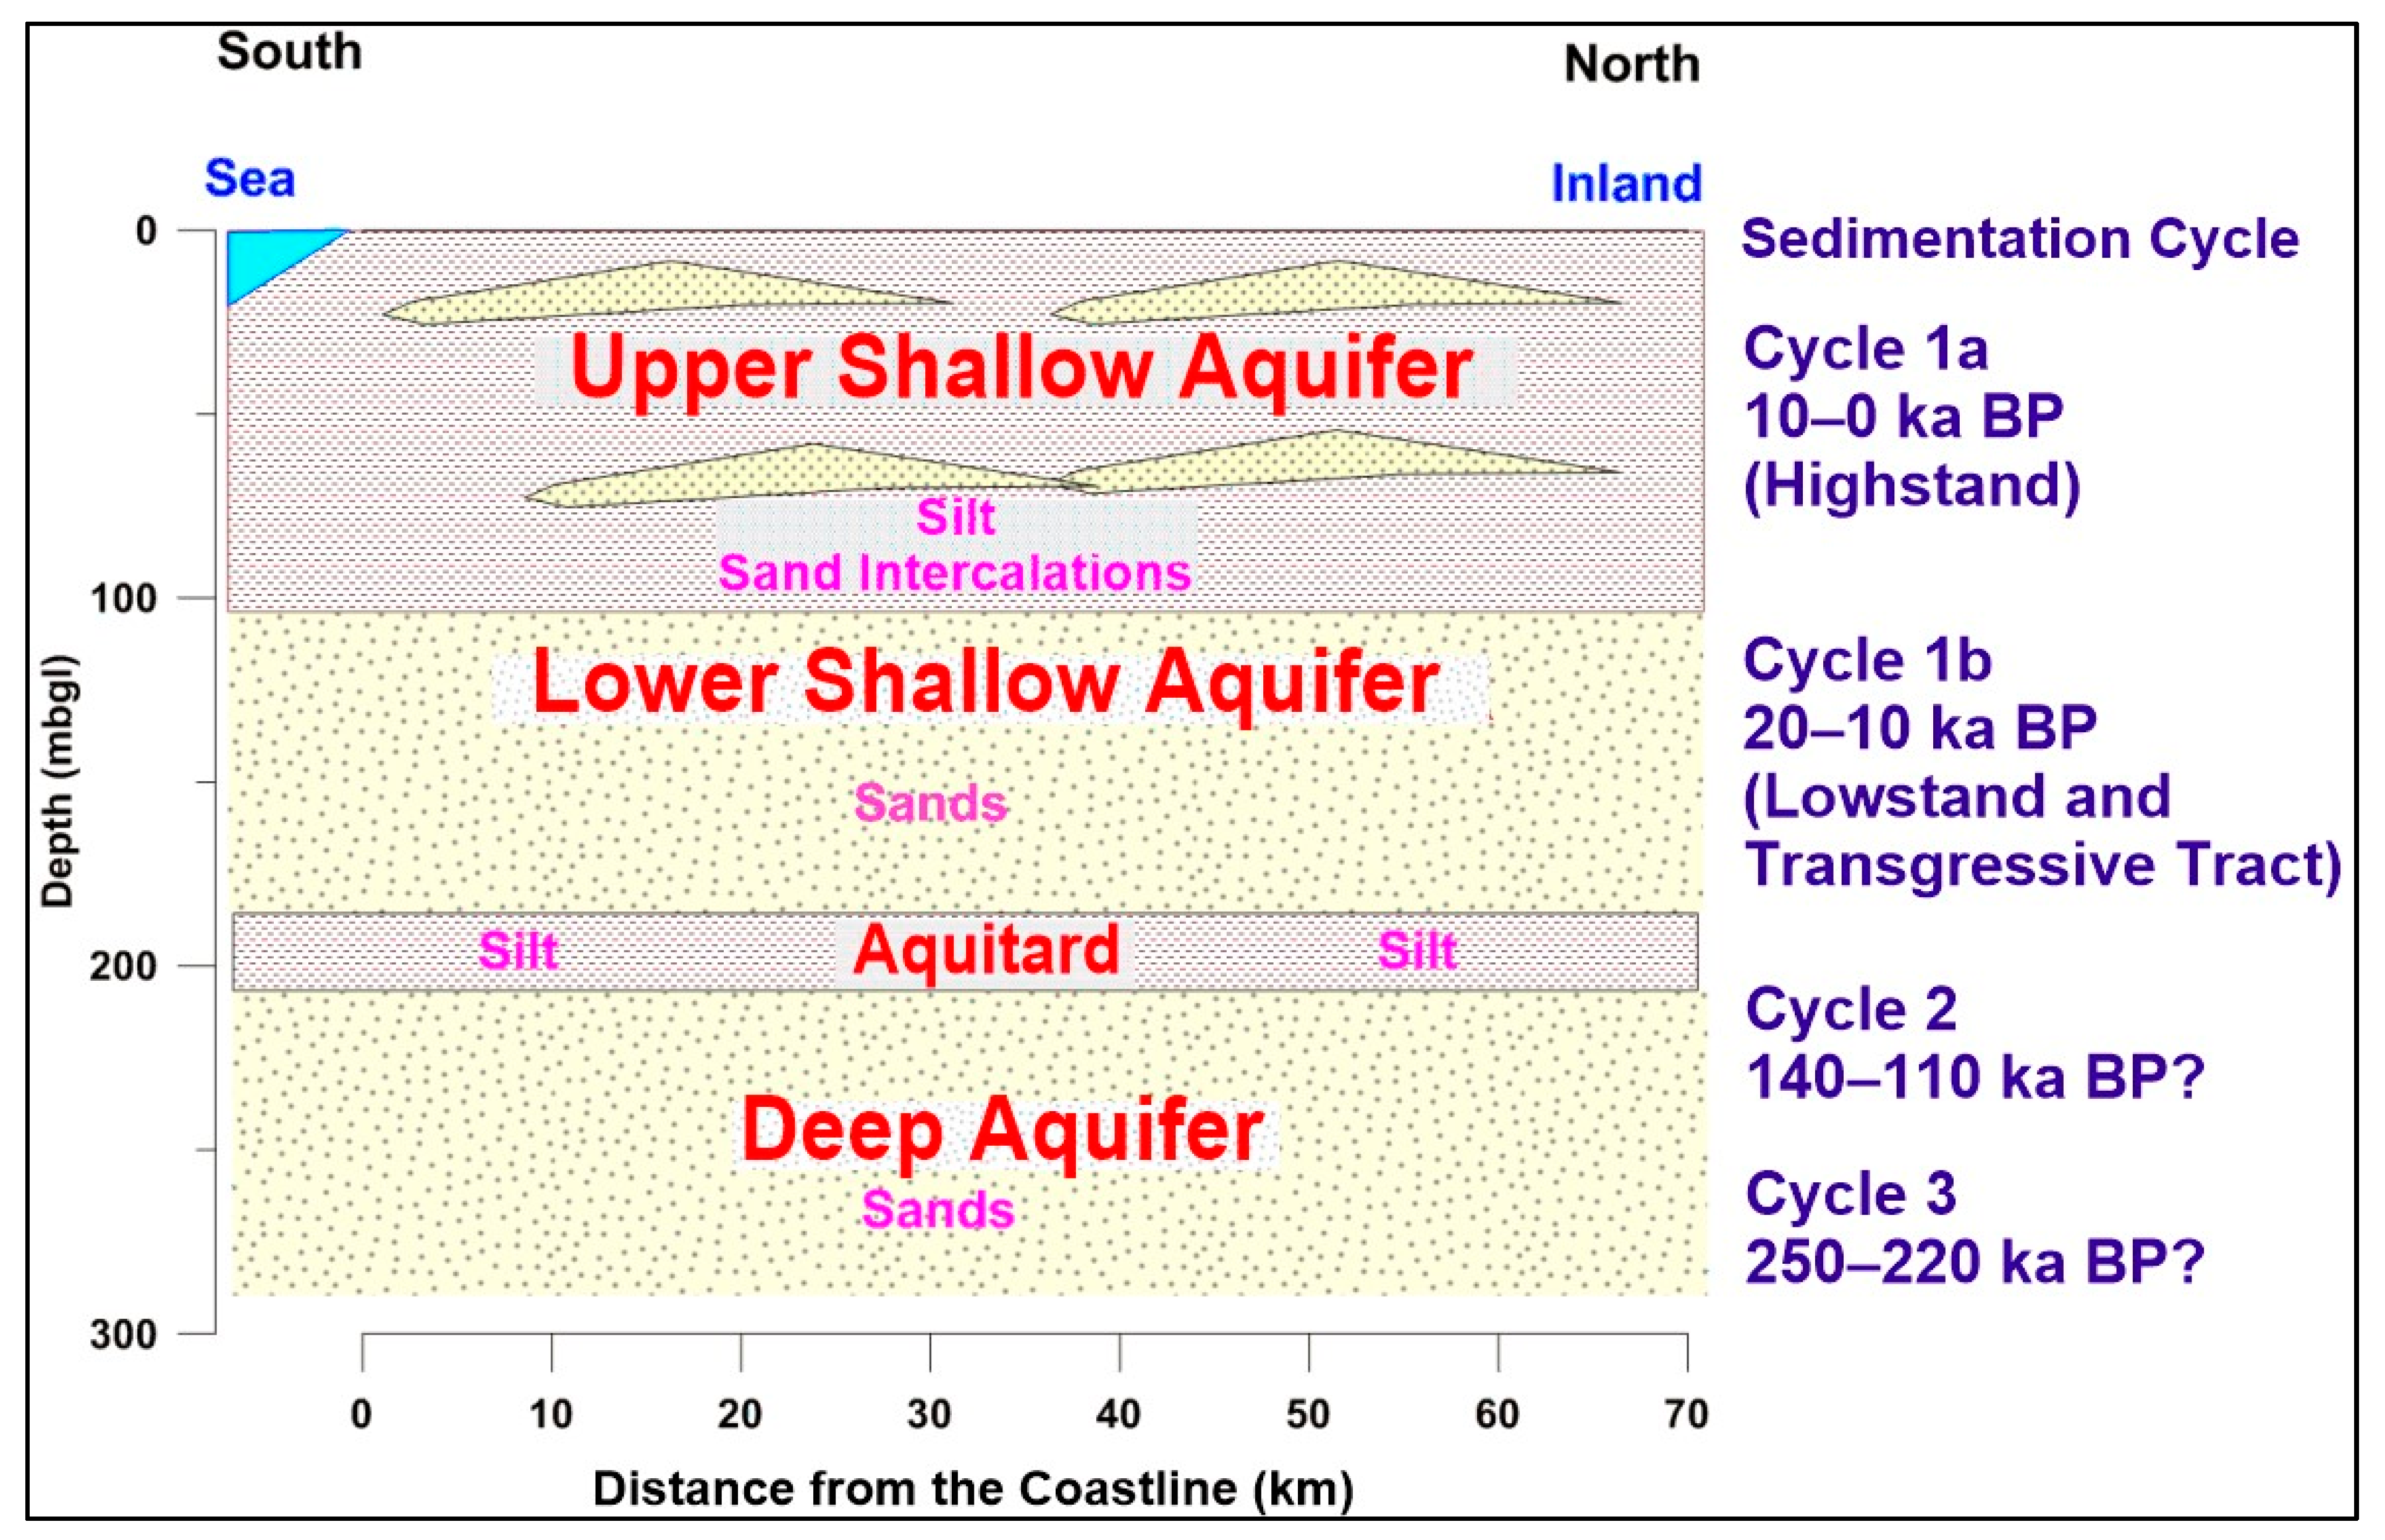
2.3. Geology and Hydrogeology

The study area is situated in the southwestern portion of the Bengal Basin. Tectonically, the investigated area is situated in the Barishal–Chandpur gravity high [30]. The investigated area is mostly covered by fluvio-tidal deltaic and marshy peat and clay deposits. A complex mixture of clay and very fine to coarse sediments characterize the subsurface geology. They were deposited due to sea-level fluctuations [31]. The Holocene deposits in the coastal region are predominantly grey micaceous silt and clay with occasional peat, and have organic matter (OM) content [28]. The deltaic and fluvial deposits in the SW coastal region of Bangladesh are calcareous rich [32]. The deep aquifer (DA) in the southern coast of Bangladesh contains calcite and dolomite [33]. Three aquifer systems were defined [9,10] on the basis of their sedimentation type (Figure 2): the upper shallow aquifer (USA), lower shallow aquifer (LSA) and deep aquifer (DA). The USA sediments were deposited during the highstand condition in the Holocene (10–0 ka BP). The USA sediments are grey silts and clay, with fine to medium sand. The absence of continuous silts and a clay layer, as well as hydraulic connection to the rivers, make the USA unconfined. The lowstand and transgressive tract sediments (20–10 ka BP) of the LAS comprise medium sand to gravel. The LSA has hydraulic connections with the USA and is a semiconfined type. The sediments in the DA were deposited during the interglacial period (250–110 ka BP). The DA consists of coarse-to-medium sands and gravels. The DA is semi-confined. A conceptualized hydrogeological cross-section based on 125 borehole logs is given in Figure 2. The groundwater level varies from 0.46 below msl to a maximum of 1.54 amsl [9].

3. Methods and Methodology

3.1. Water Sampling and Hydrochemical Analysis

Water samples were collected from existing wells used for domestic purposes and observation wells. The screen depth of these wells ranged from 6 m to a maximum of 381 m below ground level (mbgl). A total of 162 samples were collected and processed; among them, 51 water samples were from the USA, 41 from the LSA and 70 from the DA for this study. The groundwater sampling was done following the USGS methods [34]. Physico-chemical parameters were determined at the time of water sampling using calibrated portable instruments. Calibration of the field instruments was done at least once a day prior to sampling. A portable pH meter Sension 1 was used to measure the pH and T. Electrical conductivity (EC) was measured using an EC meter Sension 5. High-density polypropylene (HDPP) bottles were used to store the sampled waters. A flowthrough cell was used to collect water until the temperature (T), pH and electrical conductivity (EC) become stable. A hand pump using 0.45 µm pore size filter paper was used to filter the water. Concentrated HNO3 was added to the cation samples to maintain the pH below 2 and to avoid any precipitation. Alkalinity was measured by using the digital titrator, model no. 16900, from the HACH company. The concentrations of the cations Na+, K+, Ca2+, Mg2+, FeTotal and MnTotal were determined using atomic absorption spectrometry. The concentrations of the anions Cl, NO3, SO42− and PO43− were measured using molecular absorption spectrophotometry and Br was measured with an ion-specific electrode. A total of 75 water samples were analyzed following the standard methods for the examination of water and wastewater [35] in the Laboratory for Applied Geology and Hydrogeology, Department of Geology, Ghent University. The ionic balance errors for these samples were kept within ±5%. Among the 75 groundwater samples, 25 were collected during the wet period of 2015 and 50 in 2018. The rest of the analytical results were obtained from Bangladesh Water Development Board [36], where the ionic balance was <20%. The groundwater samples from the Bangladesh Water Development Board were collected during the wet period of 2012.

3.2. Statistical Analysis

A multivariate statistical analysis was applied to reduce and categorize large-scale data sets for identifying the linkage among the variables in hydrogeochemical studies. The hydrogeochemical dataset consisting of 162 groundwater samples and 16 physico-chemical parameters, as presented in Sarker et al. [9,10], was used for this analysis. The variables used in this research included the major constituents Na+, K+, Ca2+, Mg2+, HCO3, Cl and SO42−, as well as the minor and trace constituents NO3, FeTotal, MnTotal, PO43− and Br. The pH, T, EC and total dissolved solids (TDS) were also used in the statistical analysis in this research. Statistical parameters, such as range, mean, median and standard deviation for the water chemistry parameters, were calculated using parametric statistical methods. The relationships between the pairs of water parameters were determined using Pearson’s correlation. Standardization was applied to confirm that each parameter was weighted equally to prevent misclassifications. The standardization of the data was obtained using Equation (1) [37]:
Z i = X i μ i σ i
where Z i is the normalized variable, X i the original variable, μ i the mean of the distribution and σ i is the standard deviation.

3.2.1. Cluster Analysis (CA)

CA is a data classification technique. Many clustering techniques exist, for example, connectivity, distribution and centroid models, but hierarchical clustering is the most extensively used clustering method in Earth sciences [11,37]. In hierarchical clustering, the samples are clustered mainly based on their identical chemical characteristics within a group and differences between various groups [37]. First, the samples with higher likeness are grouped. Later on, samples are grouped with a linkage rule. This process repeats until all observations have been classified. Finally, a dendrogram (a tree-like diagram) is observed based on the results of the hierarchical cluster analysis [37], whose roots are all the water samples. CA was performed by means of Ward’s linkage method [38] with squared Euclidean distances between the normalized variables as a measure of closeness between two samples. Ward’s linkage uses an analysis of variance (ANOVA) approach to assess the spaces between groups and creates smaller distinctive groups than other linkage rules. The produced groups in a cluster are more similar to other samples of the group than to any other samples from a different cluster, which makes Ward’s method distinctive from other linkage rules [11,18], such as K-means clustering, where a sample is closer to the centroid of the cluster it belongs to than any other centroids, but not necessary to other samples. The visualization of CA was executed using the factoextra package of R programming.

3.2.2. Factor Analysis (FA)

FA is a data reduction technique that was explained mathematically by Lawley and Maxwell [39]. FA reduces many inter-dependable variables into a smaller number of new variables without losing their original characteristics. R-mode FA [37], which investigates the relationship between the variables inside the samples, including principal component analysis (PCA), was conducted on standardized data to reveal the interactions between the 16 variables. The components with eigenvalues higher than and very close to 1 were kept for the present study (Figure 3). The variance of the first four principal components was maximized by applying the varimax normalized rotation. Factor loading values >0.7 are considered as a significant contribution toward the components of this study. FA was performed by using the pschy package of R programming in this study.

4. Results and Discussion

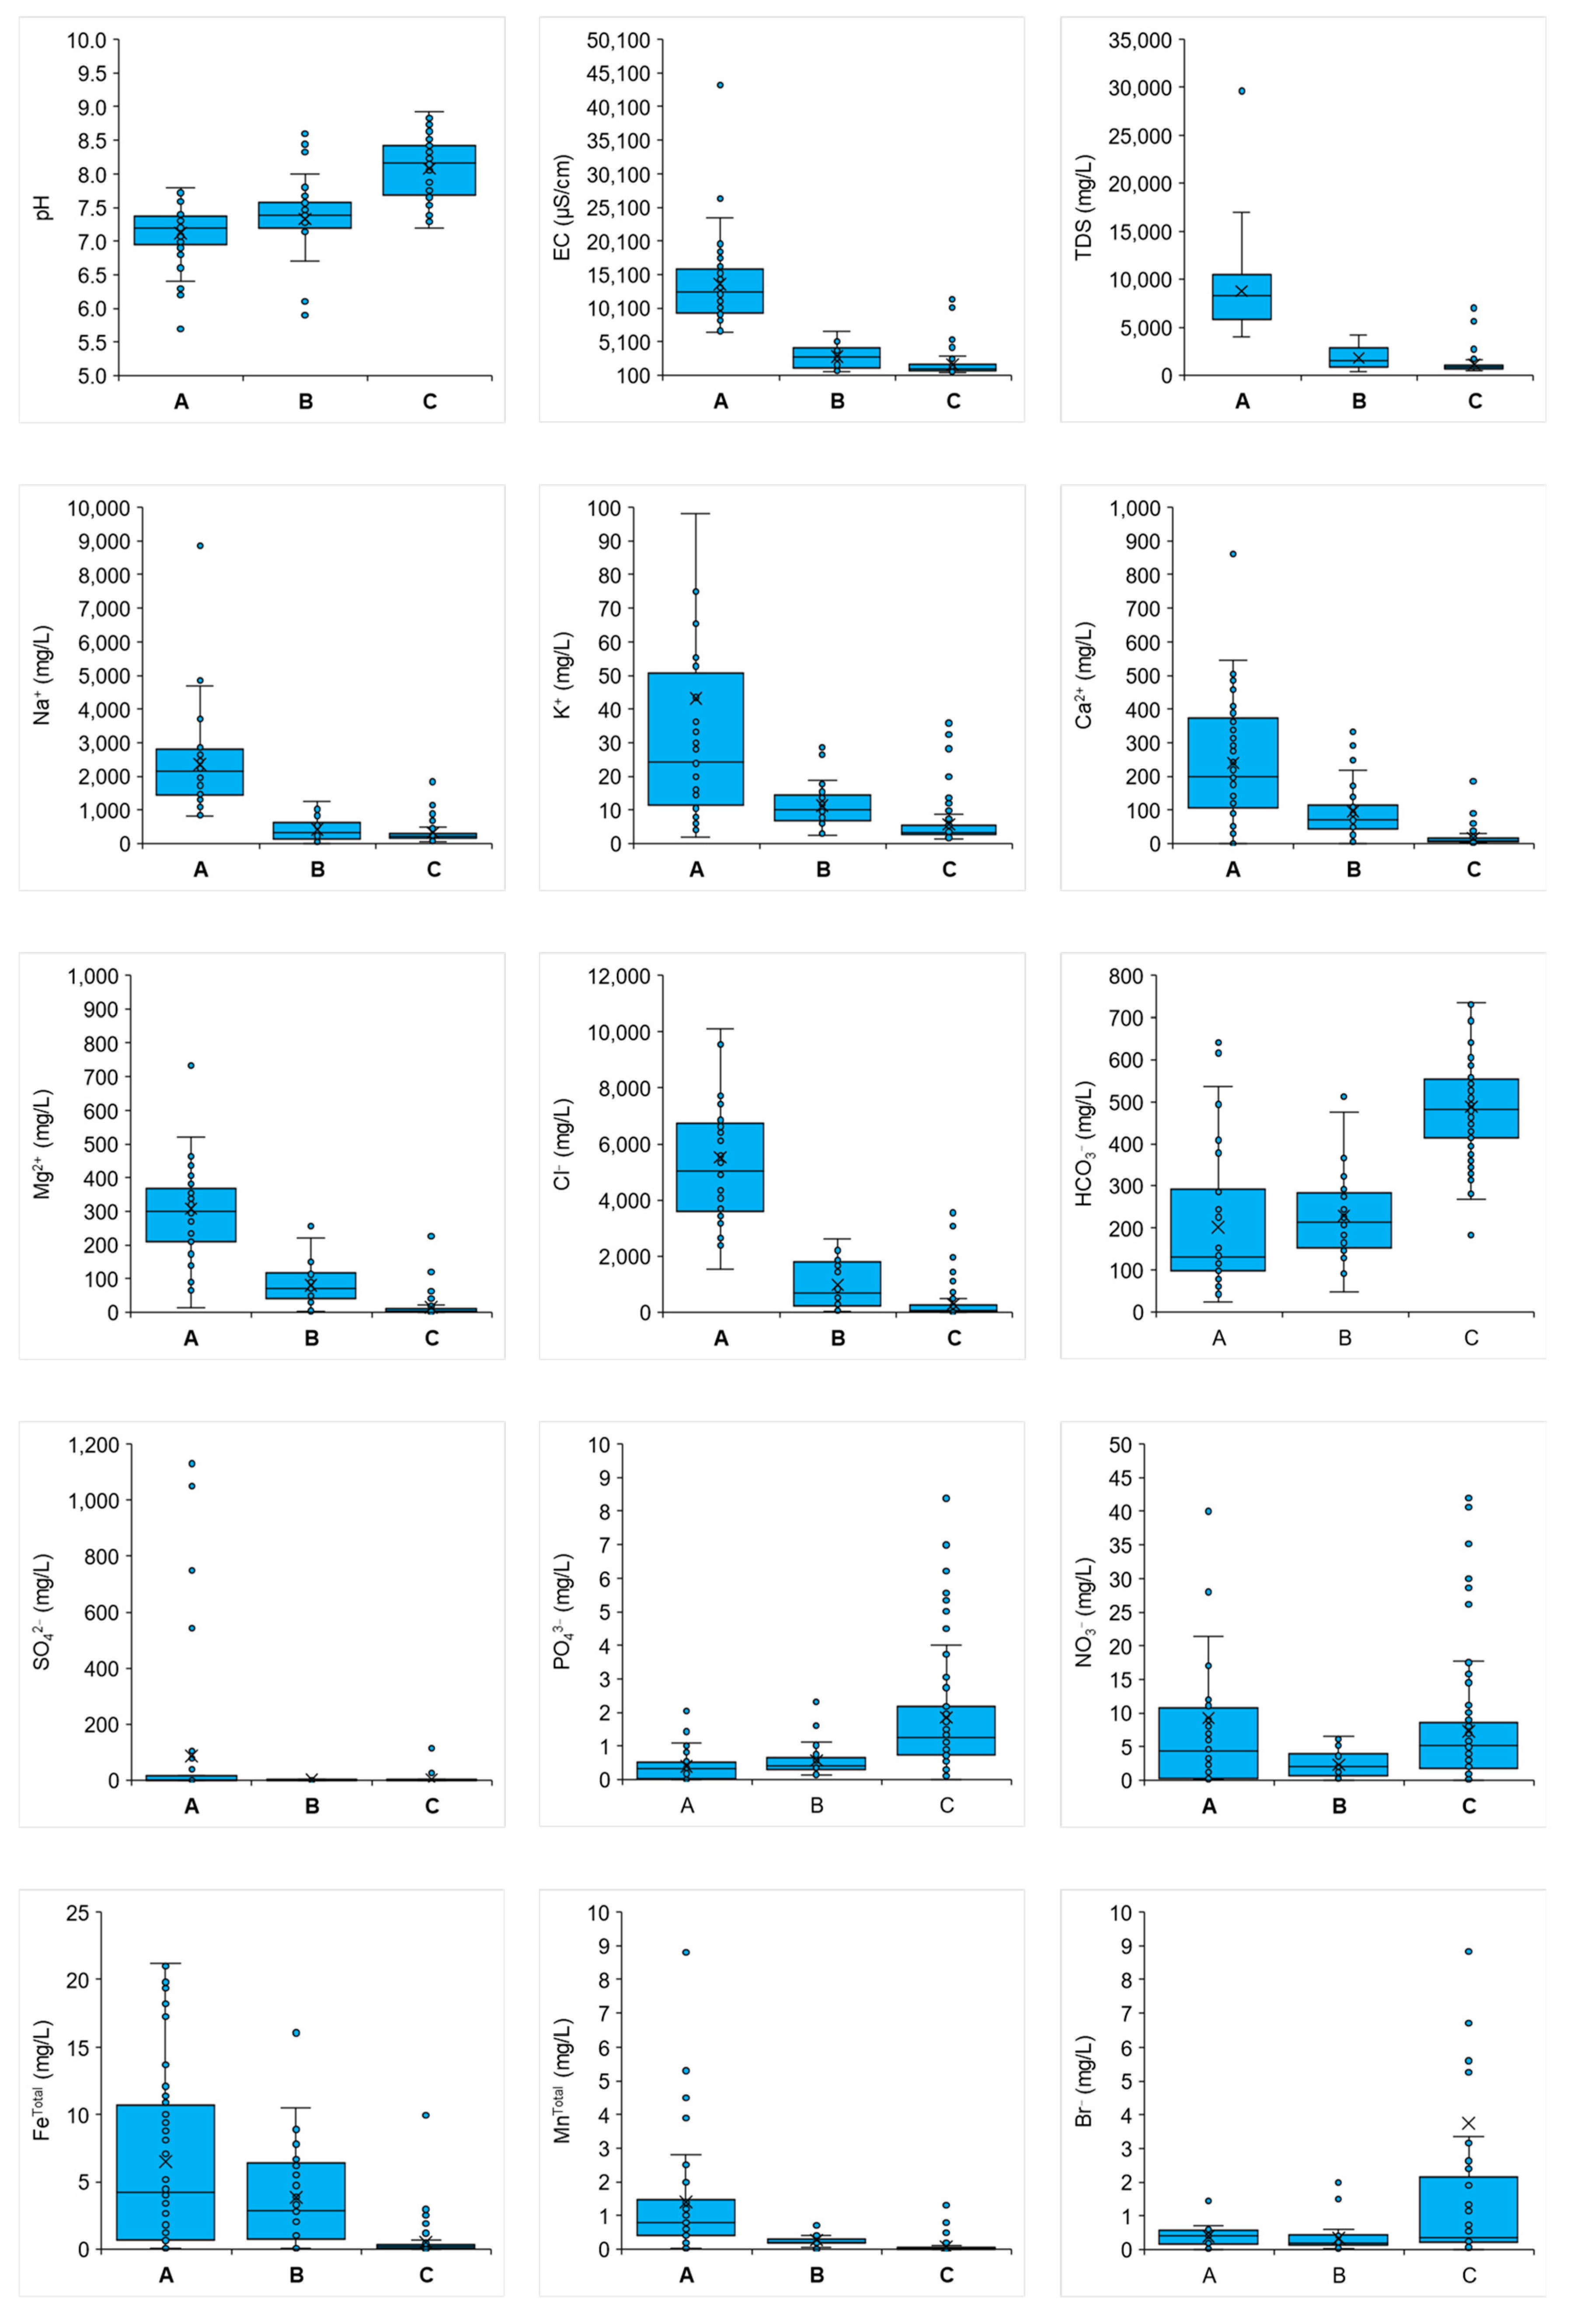
4.1. Physico-Chemical Parameters

Basic descriptive statistics of all the physico-chemical data of the analyzed groundwater samples are presented in Table 1. The pH of the groundwater ranged from 5.70 to 8.92; the shallow (USA and LSA) groundwater was acidic, whereas the DA groundwater is basic. Low pH and low alkalinity (compared to DA) indicated less advanced calcite dissolution. Yet, the shallow aquifers had relatively high Ca2+ and Mg2+ compared with HCO3. The high Ca2+ and Mg2+ concentrations indicated the release of these elements and uptake of Na+ onto the aquifer matrix by reverse cation exchange, which indicated salinization. The high alkalinity observed in the DA was due to the second stage of calcite dissolution because of cation exchange upon freshening. The EC values of the groundwater ranged from 565 to 43,300 µS/cm, showing high values at a shallow sampling depth and vice versa. Most of the physico-chemical parameters behaved like EC. The concentrations of FeTotal and MnTotal were higher in shallow aquifers and low in the DA, while NO3 was low in the shallow aquifers and higher in DA, indicating suboxic/anoxic conditions in shallow aquifers and oxic conditions in the DA.
More than 65% of groundwater samples from DA showed oversaturation relative to calcite and dolomite, while 35% of samples may have come from a calcite- and dolomite-impoverished environment [9] or calcite and dolomite not having reached equilibrium due to the short residence time. The cation exchange due to freshening may have also triggered calcite undersaturation [40]. The hydrochemical evolution of groundwaters in the DA was dominated via direct cation exchange (Equation (2)) and carbonate dissolution (Equations (4) and (5)):
N a X + 1 2 C a 2 + N a + + 1 2 C a X 2
N a + + 1 2 C a X 2 1 2 C a 2 + + N a X
C a C O 3 + C O 2 + H 2 O C a 2 + + 2 H C O 3
C a M g ( C O 3 ) 2 + C O 2 + H 2 O M g 2 + + 2 H C O 3 + C a C O 3
On the other hand, only 35% of the sampled groundwaters of the USA and LSA showed oversaturation relative to calcite, which may have been accelerated by the reverse cation exchange process due to salinization (Equation (3)).

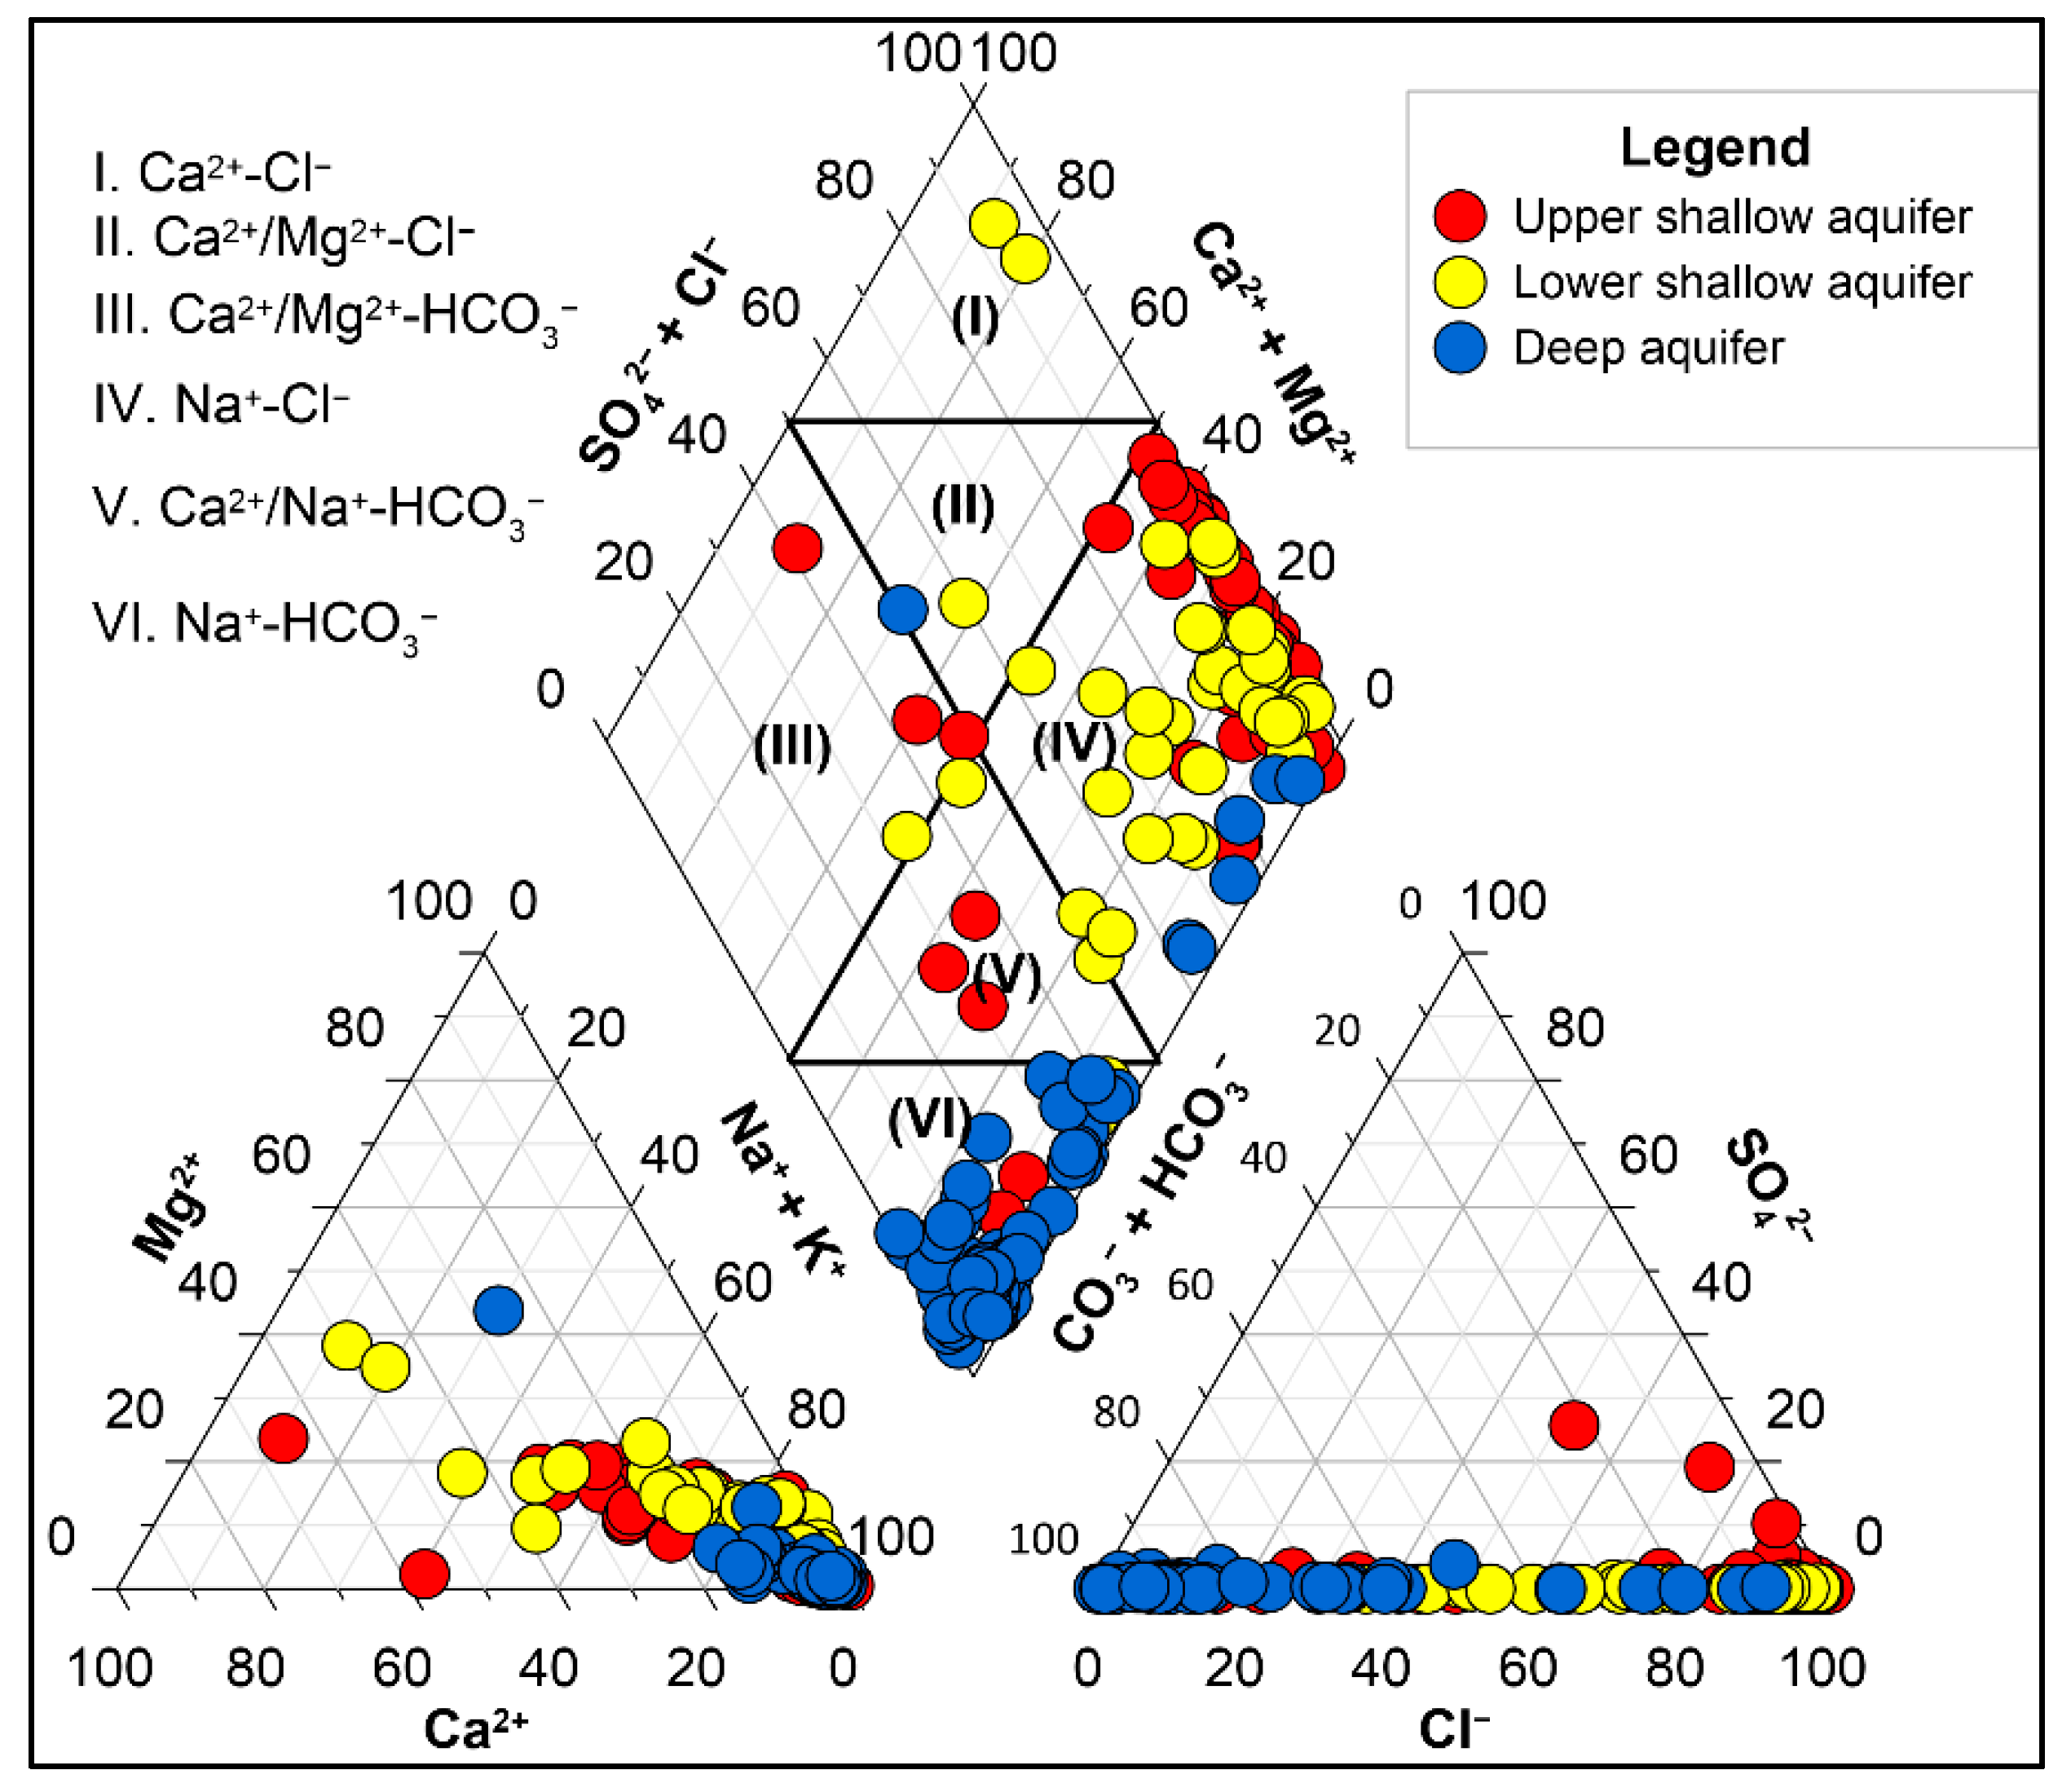
4.2. Groundwater Classification

The hydrochemical characteristics of the water samples were first identified by plotting a Piper [41] diagram. Two main types of groundwater were recognized from this diagram: NaCl and NaHCO3 types (Figure 4). Some CaCl and CaMix types of groundwaters were also present in the Piper plot. Stuyfzand’s [42] water classification system indicated that >75% of waters in the DA had a positive cation exchange code (surplus of marine cations due to cation exchange related to freshening) and around 85% of waters in the shallow aquifers had a negative cation exchange code (deficit of marine cation resulting from inverse cation exchange related to salinization). The USA and LSA had the concentration trends of major cations and anions Na+ > Mg2+ > Ca2+ > K+ and Cl > HCO3 > NO3 > SO42−, respectively. The relative concentrations of cations and anions in the DA are Na+ > Ca2+ > Mg2+ > K+ and HCO3 > Cl > NO3 > SO42−, respectively. The groundwater of the aquifers was characterized as follows.
The USA was characterized by a sodium chloride (NaCl) water type with a negative cation exchange code, with very few Ca/Mg-HCO3 waters representing mixing with surface water; TDS varied between 423 and 29,616 mg/L. The unconfined aquifer showed salinization due to the dissolution of seasonally precipitated salts (formed by evapoconcentration) at the ground surface by monsoon rainfall, as groundwater level at that time was low. Reverse cation exchange produced CaCl and CaMix type waters by replacing dissolved Na+ with Ca2+ during salinization. These groundwaters infiltrated into the LSA.
The LSA contained mostly sodium chloride and some calcium chloride water types with negative cation exchange code. The presence of calcium-chloride-type waters in this aquifer indicates ongoing salinization. The waters were from a semi-confined/leaky aquifer. The salinity was moderate, with TDS varying from 787 to 10,209 mg/L.
The DA has a majority of water samples of the sodium bicarbonate type, which was due to freshwater encroachment from the northwestern part of the country, where the groundwater was mostly fresh calcium bicarbonate, which had evolved via cation exchange between sodium and calcium. There were some sodium-chloride-type waters at a depth below 350 mbgl that was considered to be paleo-seawater. The aquifer was a deep semi-confined one, with water having less salinity compared with the USA and LSA (TDS ranged from 787 to 7592 mg/L).

4.3. Correlation

The correlation matrix was computed during the FA analysis (Table 2). Correlations with r ≥ 0.75 were considered significant. EC, TDS, Na+, K+, Mg2+ and Cl had correlation coefficients above 0.75 between themselves, suggesting that these variables were strongly influenced by the same factor. The ECs of the samples had strong positive correlations with Na+ and Cl, indicating saline water. Ca2+ and Mg2+ had a moderate relation, indicating their similar source, but their negative relation with pH and HCO3 was due to the cation exchange reaction. Cl had a strong positive correlation with Mg2+ due to the saline end member, but a moderate correlation with Ca2+, indicating a degree of Ca2+ removal from the aquifer sediments with salinization due to reverse cation exchange or calcite dissolution in freshwater. The very poor correlation that existed between Na+ and Ca2+ suggested that next to cation exchange, other processes influenced these individual cations; calcite dissolution is a plausible candidate, only affecting Ca2+. Ca2+ had a moderate correlation (0.53) with iron, indicating Ca2+ desorption from the aquifer sediments via reverse cation exchange upon salinization and iron reduction due to the presence of OM, where both processes occurred predominantly in the shallow aquifers. The moderate positive correlations of Ca2+ with Cl and strong positive correlation of Mg2+ with Cl indicated the ongoing salinization of the shallow aquifers. The moderate negative correlations of Ca2+ and Mg2+ with pH and HCO3 indicated mineral dissolution and cation exchange. Br had no correlation with Cl, suggesting that the source of Cl in the groundwater was something other than a direct inflow of saltwater from the Bay of Bengal.

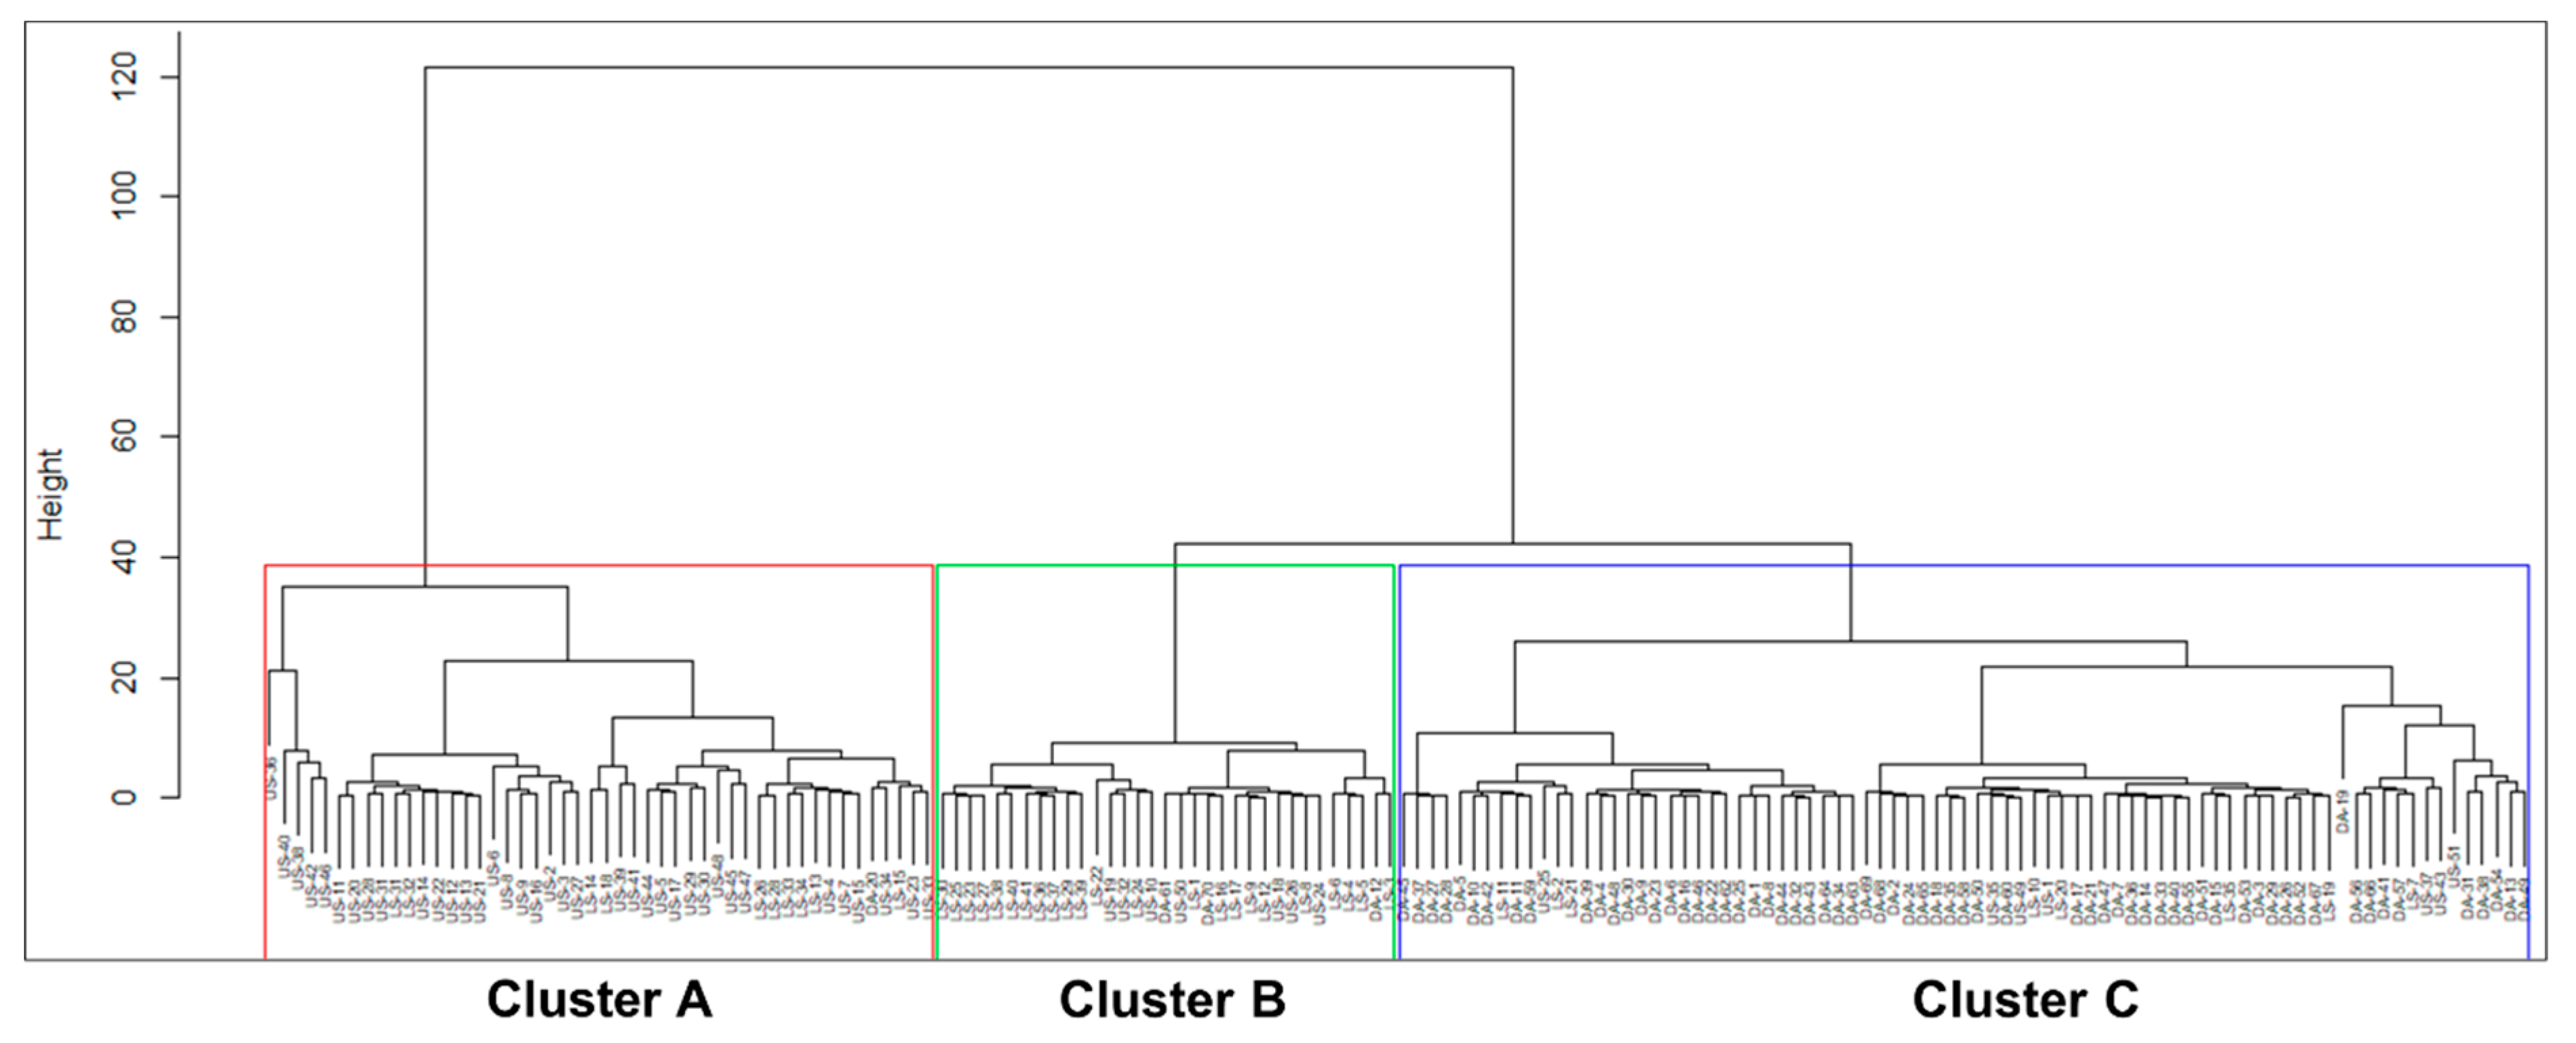
4.4. Cluster Analysis

Three clusters were defined based on the visual inspection of the produced dendrogram. The phenon line was drawn at a linkage distance of around 40 in this study to obtain the most desirable clusters. Thus, the samples having a linkage distance <40 were grouped within the same cluster. Three major clusters, named cluster A, cluster B and cluster C, were defined based on the position of the dendrogram of the groundwater samples. The number of clusters on the dendrogram could be lessened or enhanced by shifting the phenon line up and down [43]. In this study, grouping the groundwater samples into three major clusters was the optimal threshold for forming geochemically distinct clusters.
The resultant cluster dendrogram of the sampled groundwaters is presented in Figure 5. The screen depth of the water sampling wells was not included in the CA analysis to see how the water quality parameters correlated with the aquifer types. The cluster groups were mostly correlated with the aquifer types. The groundwater samples distribution and percentage in different clusters are presented in Table 3. The statistical synopsis of the hydrochemical characteristics of the sampled waters in the clusters is presented in Table 4.
However, a limitation of CA was observed in our study. The CA failed to distinguish the water samples that were paleo-seawater in the SW part of the study area. Discrimination and characterization of aquifer types and hydrogeochemical processes within the aquifers are well interpreted based on the hydrogeology of the site and our understanding of the system and field experiences. Therefore, it was important to know the detailed hydrogeological and hydrochemical conditions of the area before applying CA.
Box and whisker plots of individual variables were plotted to see the variation in chemistry in the different clusters (Figure 6). These plots revealed that the three clusters were also geochemically different. The EC and concentrations of Na+, K+, Mg2+, Cl, SO42− and NO3 decreased from clusters A to C. In contrast, the pH and concentrations of HCO3, NO3, PO43− and Br increased from clusters A to C. EC in groundwater exceeding 1000 µS/cm is generally considered as an indication of seawater invasion [44]. In this sense, clusters A and B, having median ECs of 12,531 µS/cm and 2790 µS/cm, respectively, would indicate the presence of seawater, but the high salinity in these waters was due to the infiltration of dissolved evaporate salts at the ground surface by monsoon precipitations when the groundwater level is low. Cluster C with a median EC of 1000 µS/cm indicated fresh groundwater. High pH and HCO3 in cluster C compared with clusters A and B indicated carbonate minerals (mainly calcite) dissolution that enhanced both the Ca2+ and HCO3 concentrations in the groundwater. However, Ca2+ was replaced by Na+ due to the cation exchange reaction when CaHCO3-type water intruded in a saline water body by freshening, as explained in previous studies by Sarker et al. [9,10]. For this reason, the water type in cluster C was dominantly NaHCO3. On the other hand, the relatively high Ca2+ and Mg2+ and low pH and HCO3 were due to the infiltration of dissolved salt crests in a previously fresh aquifer and reverse cation exchange reaction. The existence of some CaCl- and CaMix-type waters in the LSA supported the argument and shallow waters were also mostly coded as negative cation exchange. High NO3 and low FeTotal and MnTotal in cluster C (compared with clusters A and B) indicated an oxidizing redox environment. Cluster C contained water mostly from the DA. The recharge of the DA was completely different from that of the shallow aquifers. DA was recharged in the northwestern part of Bangladesh. Relatively high MnTotal and FeTotal and low nitrate in the groundwater samples from clusters A and B indicated reducing conditions. The shallow aquifers were locally recharged, where the oxidation of OM lowered the redox potential. This explained the high contents of FeTotal and MnTotal in clusters A and B. Therefore, the FeTotal and MnTotal enrichment in the groundwaters from clusters A and B could be explained by the following reactions (Equations (6) and (7)), where ferric oxyhydroxides and manganese oxide can be reductively dissolved via the oxidation of OM:
F e ( O H ) 3 + C H 3 C O O H F e 2 + + 2 C O 2 + H 2 O + 6 H +
2 M n O 2 + C H 2 O + 4 H +   2 M n 2 + + C O 2 + 3 H 2 O
A high Br content in a few DA waters in the SW part was anticipated in the case of more saline water because of seawater that was entrapped in the back-barrier ridge/dune and lagoonal settings during the Holocene marine interglacial phase. However, a low Br content in the highly saline groundwaters of clusters A and B indicated evaporate dissolution rather than direct saltwater intrusion. A detailed description is given in Section 4.7.

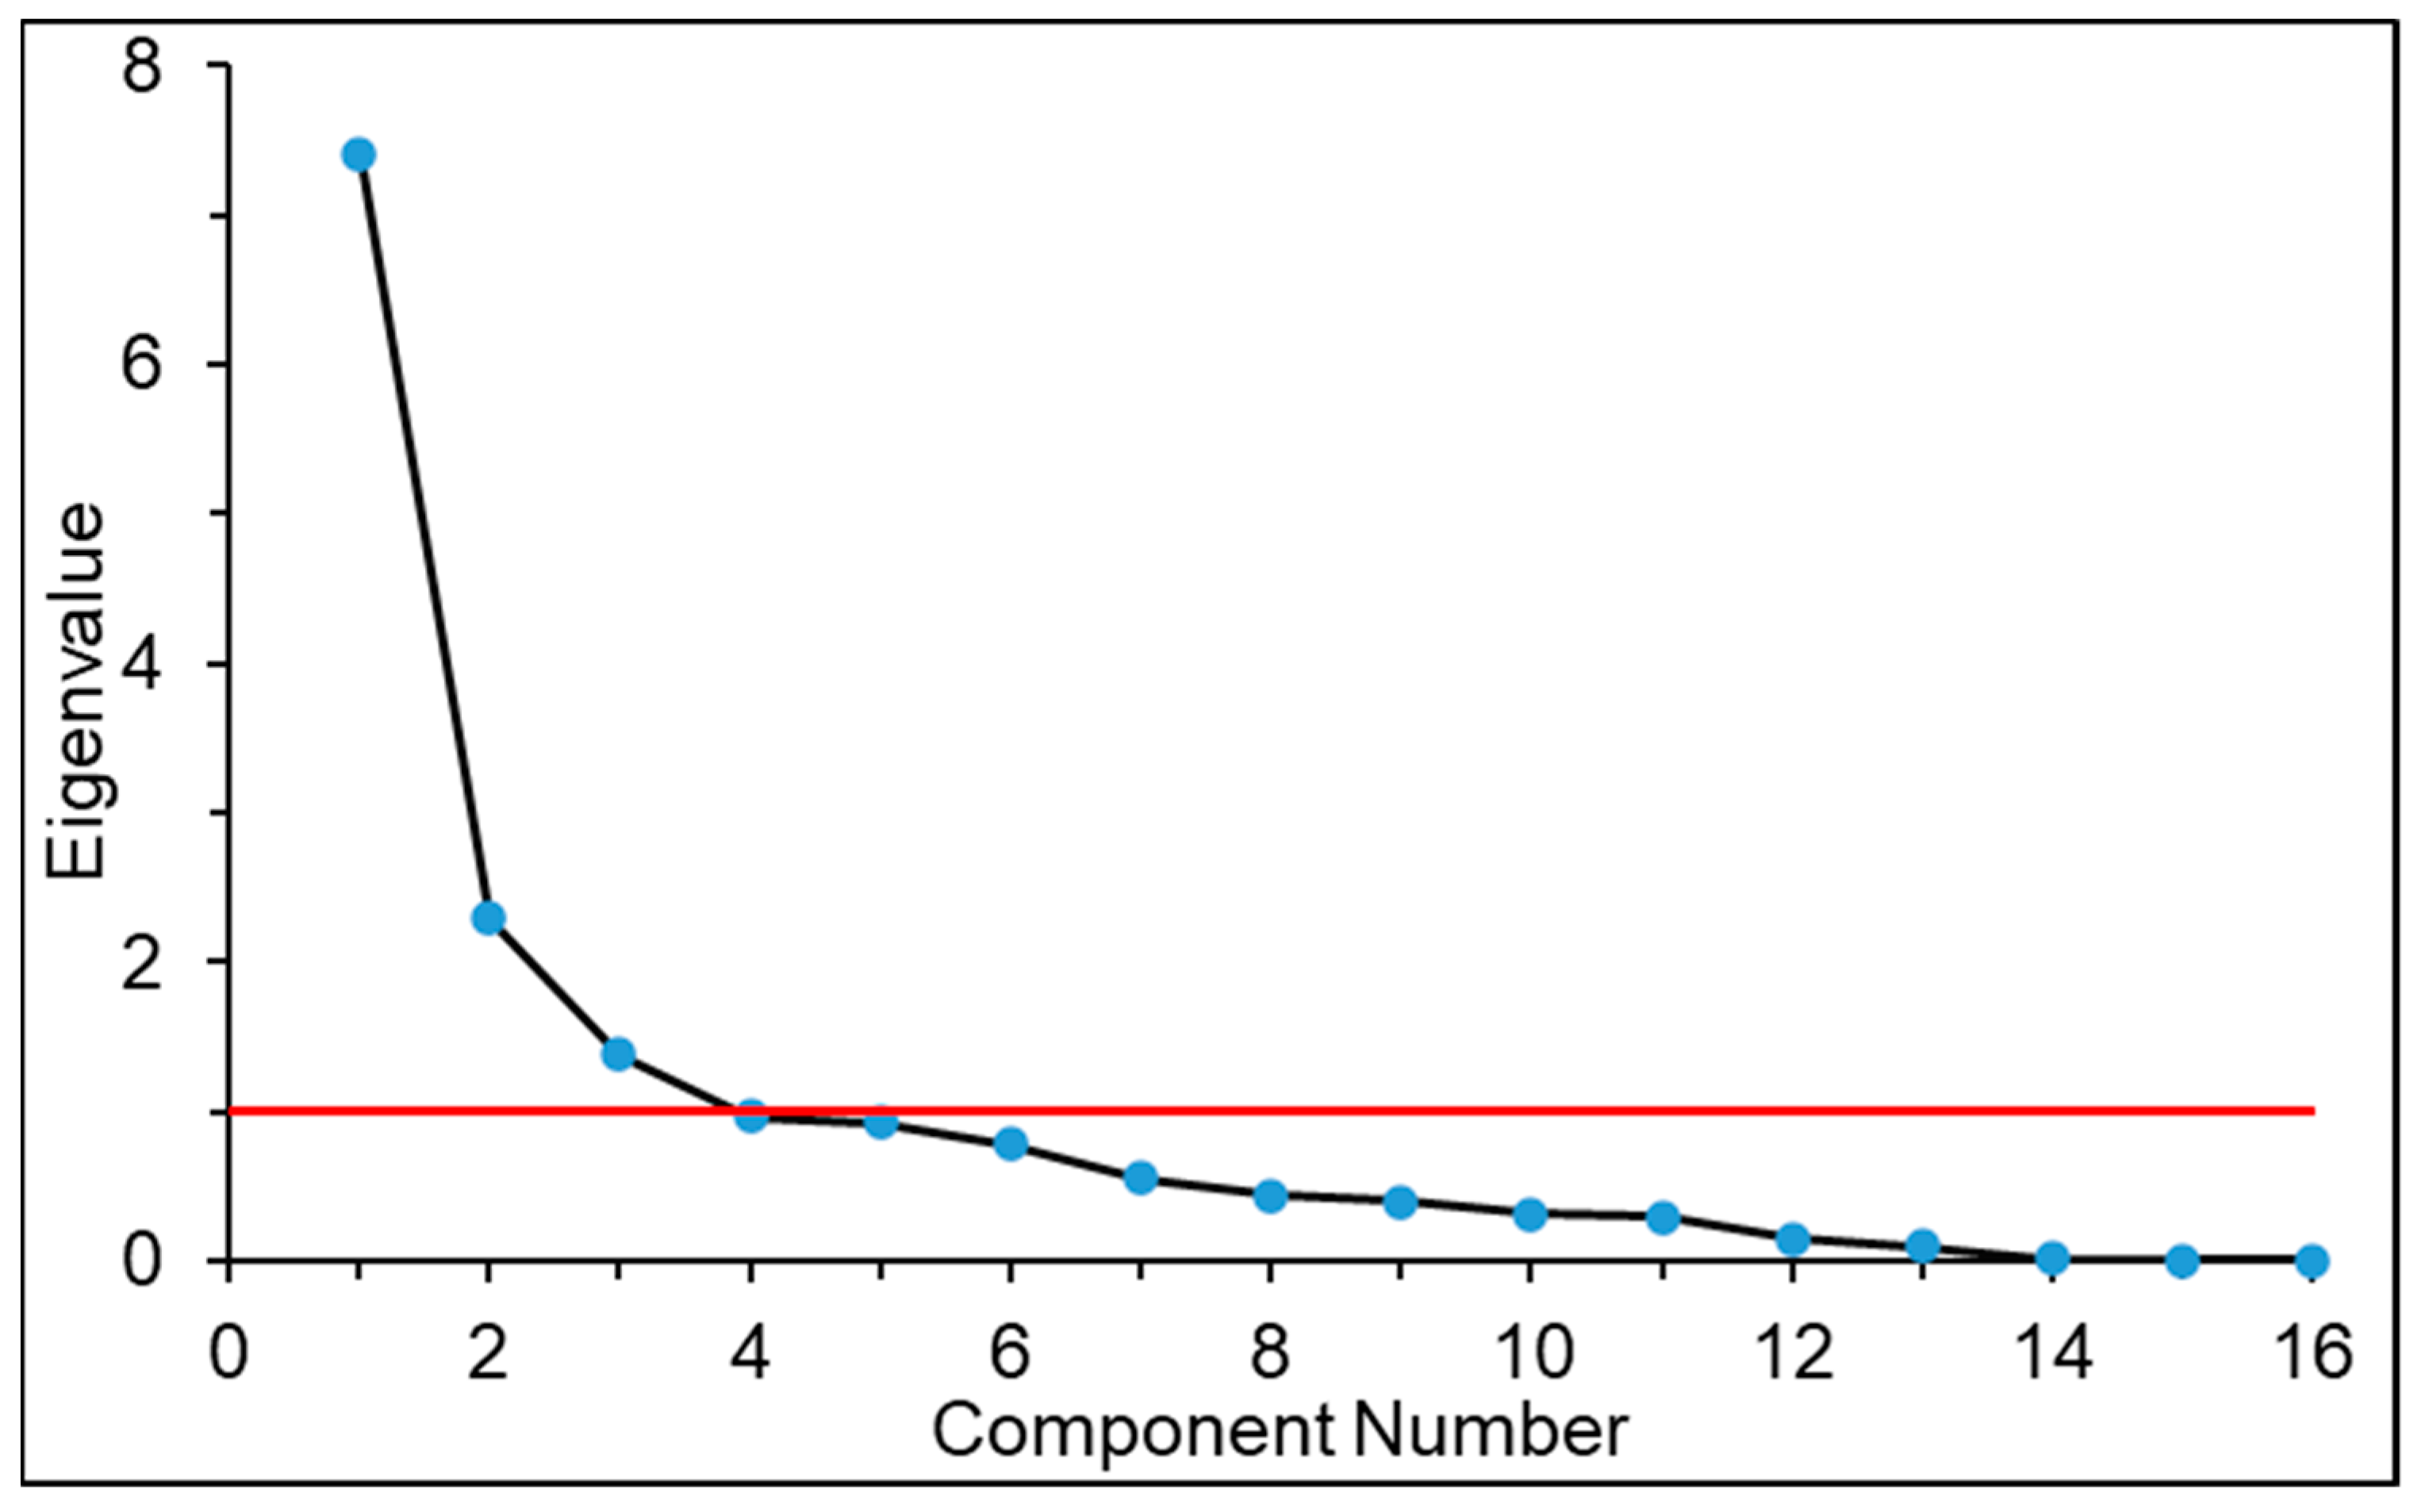
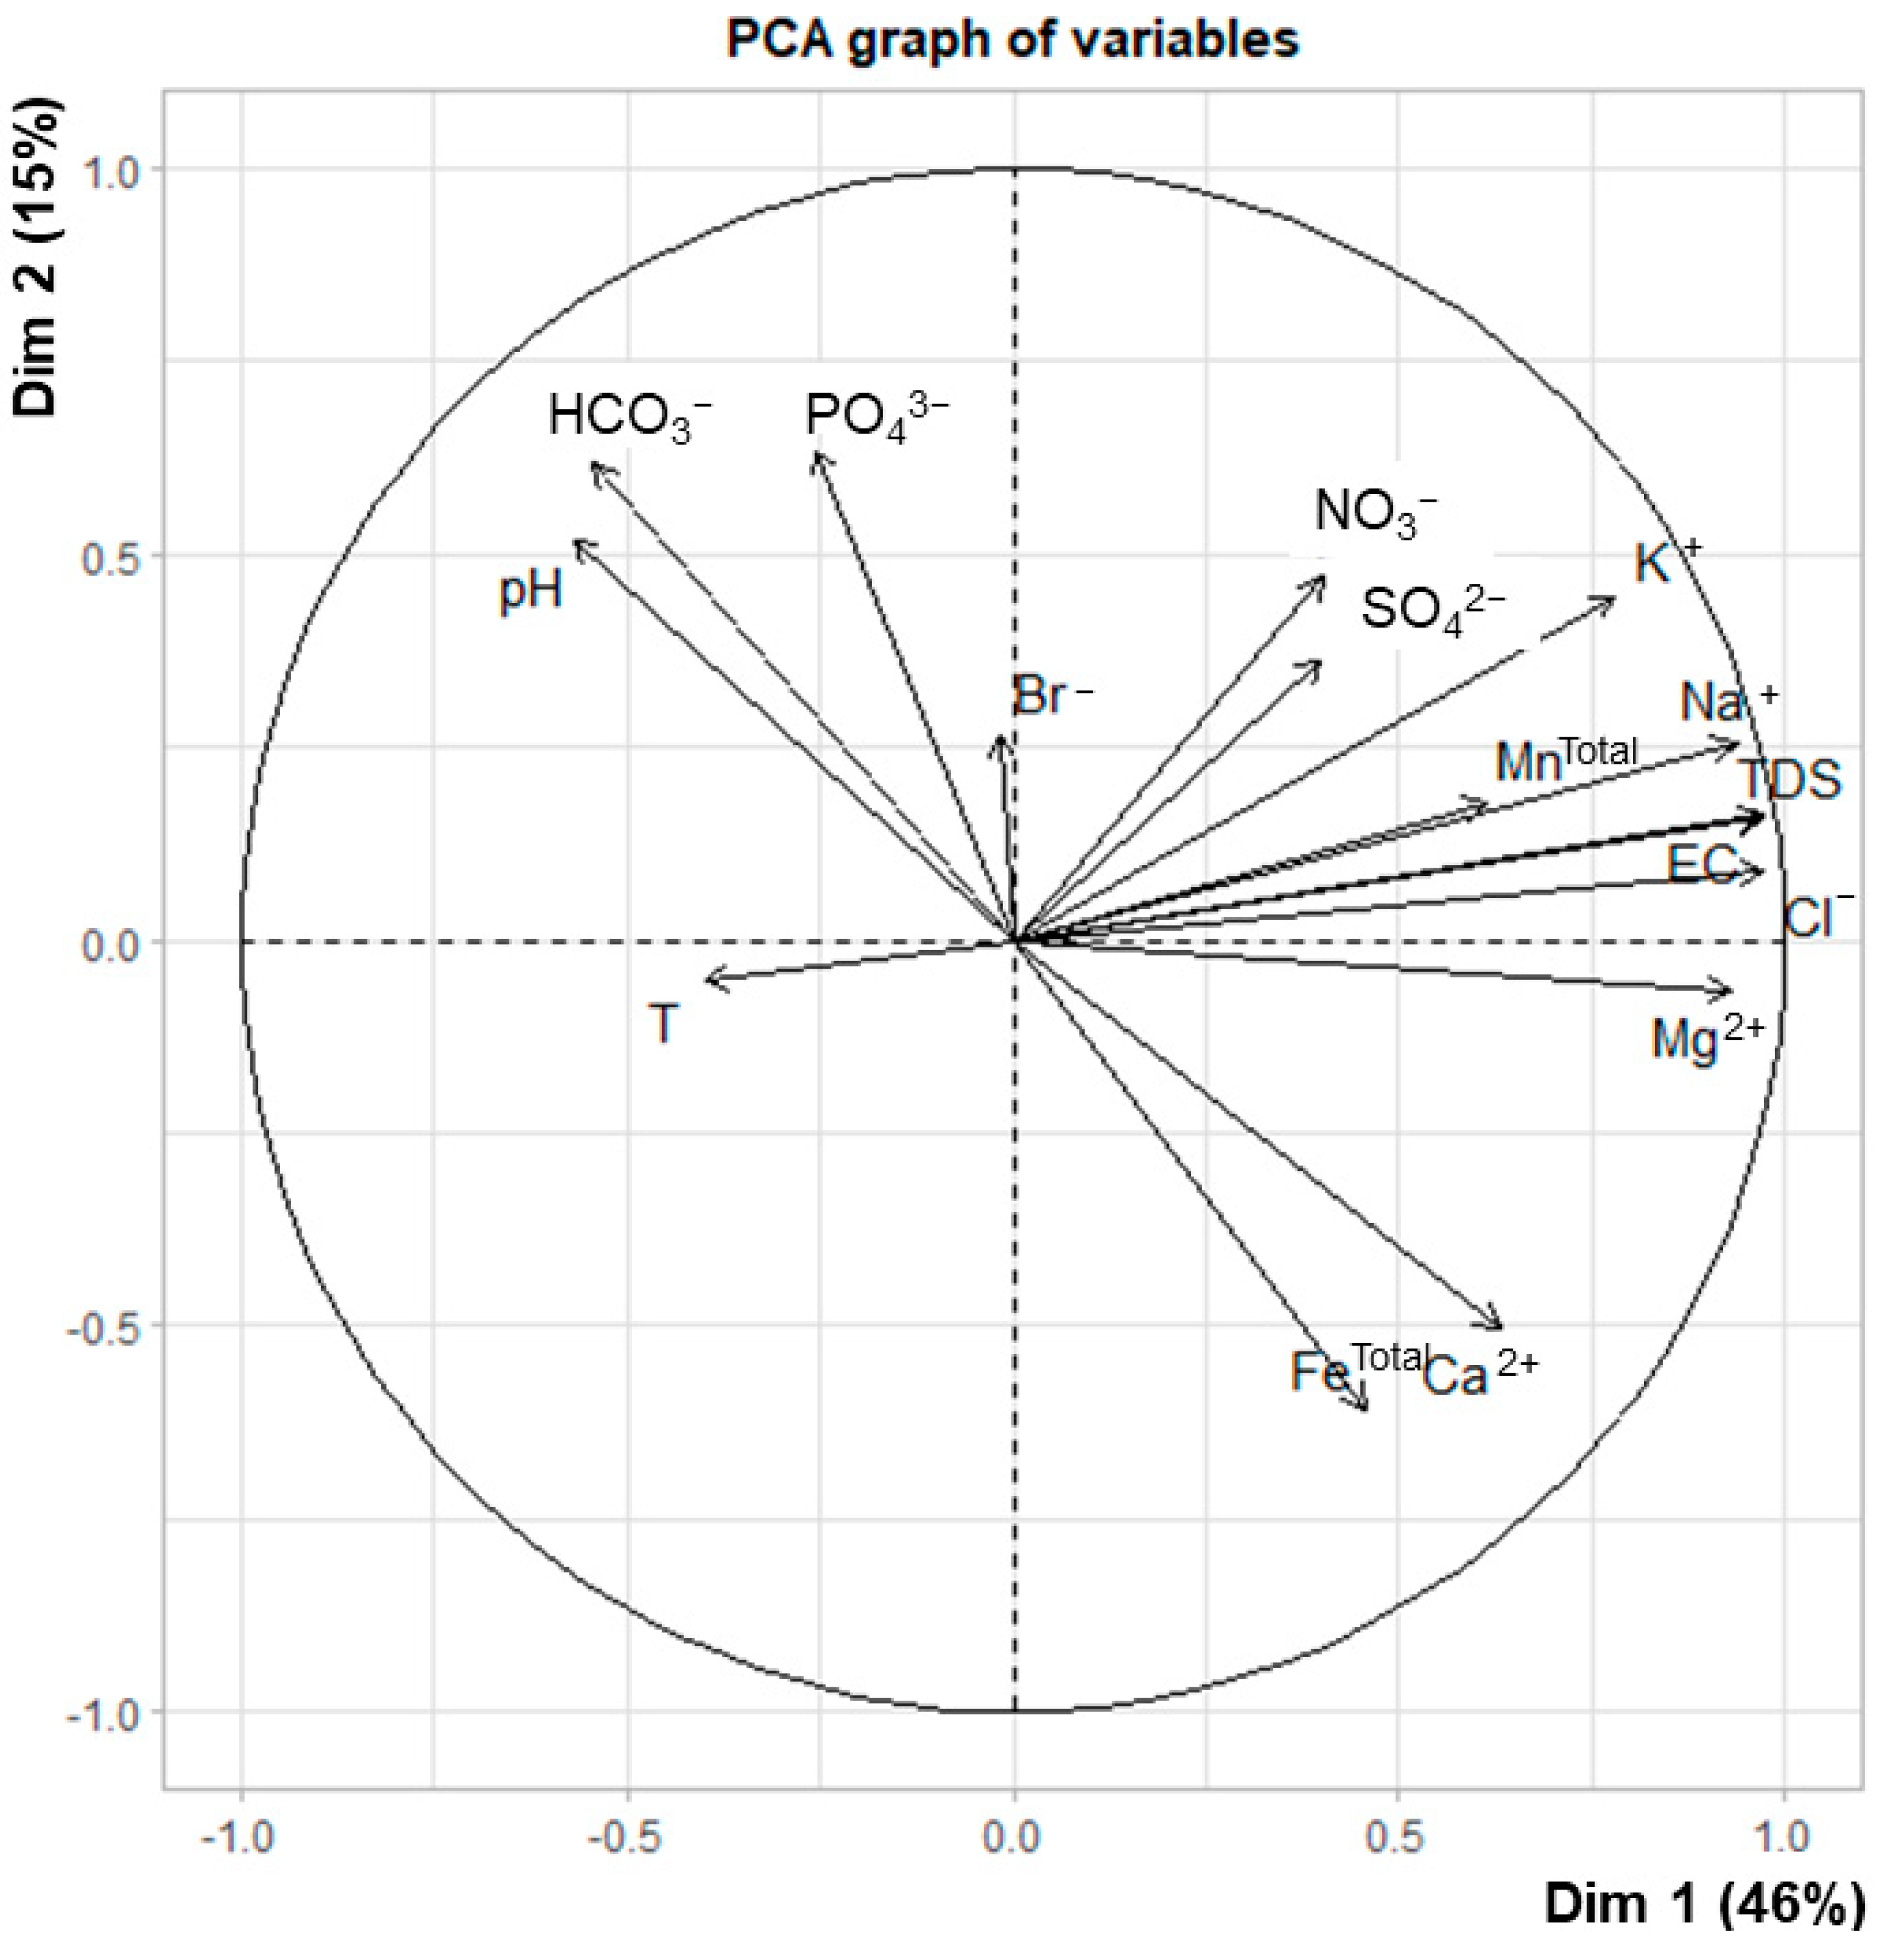
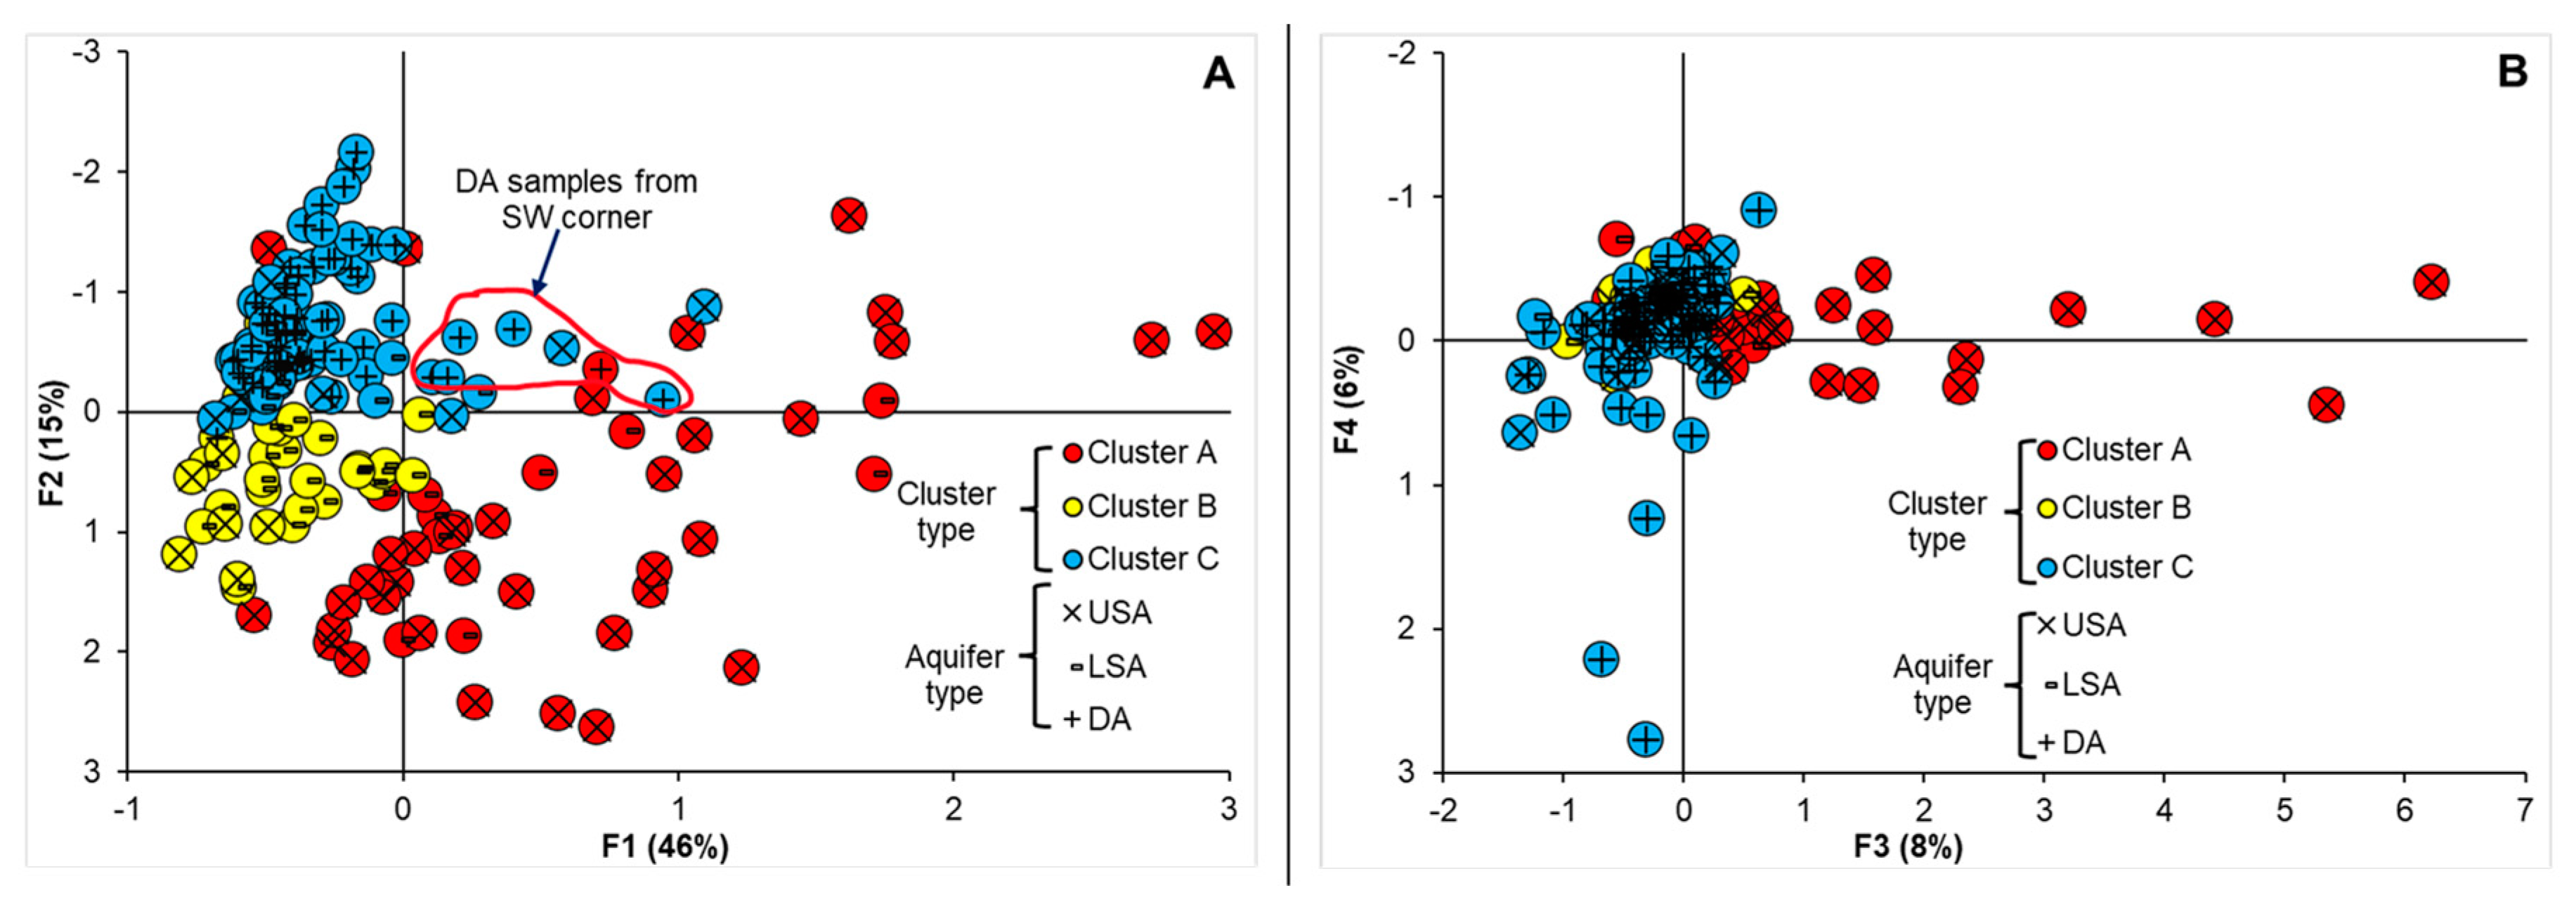
4.5. Factor Analysis

Table 5 presents the results of the sum of loadings of the extracted factors, eigenvalue, percentage of variance and cumulative variance of the four factors generated using PCA. The positions of the loadings of chemical parameters in the plane defined by the axes of components 1 and 2 is summarized in Figure 7. The box and whisker plots of the chosen factors are illustrated in Figure 8. Here, the first four factors were considered since they had a factor sum of square loadings greater than or around 1. They together explained 75% (F1–F4) of the variability in the primary data set. The factors of loadings of F1 and F2 (61%) for 16 variables are shown in Figure 7.
Factor 1 described 46% of the total variance. It was distinguished by high positive loadings for EC, TDS, Na+, K+, Mg2+, Cl and NO3. The increased concentration of TDS in the groundwater indicated salinity and could frequently be identified by an elevated Cl concentration, which was proportionally correlated to cations, such as Na+, K+ and Mg2+. Thus, factor 1 could be defined as the salinity component in reference to the dissolved salts, mainly the chloride salts of Na+, K+ and Mg2+.
Factor 2 accounted for 15% of the total variance and was mainly associated with very high positive loadings of Ca2+, Mg2+ and FeTotal, and strong negative loadings for pH, HCO3 and PO43−. This factor was related to carbonate dissolution: the lesser the carbonate dissolution, the lower the pH and HCO3 remained or the opposite: the more carbonate dissolution, the higher pH and HCO3; the expected increase in Ca2+ and Mg2+ was counteracted by cation exchange upon freshening. This factor was thus characteristic for the DA, or cluster C, but with negative factor scores. In contrast, the shallow aquifer samples (clusters A and B) had positive factor scores. The loading of Fe was coincidental: the shallow aquifers had more reducing conditions compared with the oxic deep aquifer.
Factor 3 accounted for 8% of the total variance. This factor was explained by high loadings of SO42− and MnTotal. The strong positive loadings of these two parameters may indicate mildly reducing conditions in which manganese and sulfate were stable (no sulfate reduction).
Factor 4 accounted for 6% of the total variance. Only Br had a high positive loading on this factor, indicating a different origin of Br other than seawater intrusion; no other parameters provided any significant contribution.
The projection of sampled wells on the factorial (F1–F2) plane (Figure 8A) revealed that the F1 axis showed the opposite behaviour between the fresh (cluster C) and highly to moderately mineralized waters (cluster A and B). Most of the highly mineralized groundwaters belonged to cluster A on the positive side of factorial plane 1. The groundwaters from cluster B appeared to have moderately mineralized groundwaters on the negative side of factorial plane 1 and the positive side of factorial plane 2, indicating a mixing environment. Cluster C, which contained mostly fresh groundwaters, was on the negative side of F1, F2, F3 and F4 (Figure 8A,B). Some of the water samples from the DA in cluster C fell on the positive side of F1 and the negative side of F2. These water samples in the SW corner of the investigated area were paleo-seawater samples.

4.6. Distribution of the Scores of Factors F1 and F2 with Depth

The distribution of water samples with depth against the factor scores of the three different clusters of groundwater related to factors 1 and 2 is shown in Figure 9. Note that depth is not included as one of the variables. The distribution diagrams show that almost all the groundwaters from cluster A down to 125 m in depth had positive factor scores. The majority of the groundwaters from cluster B around 95 m to 200 m in depth for factors 1 and 2 had negative and positive scores, respectively. The majority of groundwaters of cluster C were of fresh sodium bicarbonate type. This group of water was characterized by relatively low mineralized water with high pH and HCO3. These groundwater samples had negative scores for factors 1 and 2 and were dominating at larger depths. Some of the groundwaters in between 250 and 300 m in depth from cluster C had positive scores for factor 1, suggesting the existence of highly mineralized water. Highly mineralized waters below 250 to 300 m depth at the SW corner of the investigated area indicate paleo-seawater [45].

4.7. Hydrogeochemical Processes

The Na+/Cl ratio is one of the important ratios to determine the seawater intrusion and the degree of cation exchange processes in coastal aquifers, with a value close to 1 indicating halite dissolution being the source of these ions in groundwater. This ratio of the groundwater samples in the present study ranged from 0.06 to 131.7, increasing from clusters A to C (Table 4). The analyzed groundwater samples from cluster A (median: 0.5) and cluster B (median: 0.6) had molar ratios of less than 1, whereas cluster C (median: 5.41) had a molar ratio higher than unity. The deficit of Na+ and K+ in the groundwater samples in clusters A and B, and the excess of Na+ in cluster C compared with Ca2+ and Mg2+, indicated that reverse and direct cation exchange processes occurred in these aquifers.
The Cl content, in association with the Br content, is used as a conservative tracer to determine saltwater intrusion. Normally, seawater maintains a Cl/Br molar ratio of 655 ± 4 [46,47,48]. A Cl/Br molar ratio of several thousand in groundwater usually indicates salt dissolution [48]. No strong association of Cl with Br, as observed in the loadings, indicated sources of Cl other than seawater intrusion. A very high Cl/Br molar ratio in groundwaters from cluster A (median: 12,349) and cluster B (median: 3964) (with very high Cl) indicated that the salinity in the groundwaters was not from the direct infiltration of seawater, but rather from the dissolution of mineral salts. The coastal region is characterized by crisscrossed rivers and low topography. The lower part of the coastal region is flooded by high tides and seawater is driven into the canals and rivers toward the inland. At that time, freshwater and seawater are mixed up and the resulting brackish water is left in the lowlands. The brackish water is then evaporated during the dry season, leaving salt crusts on the ground surfaces. At the beginning of the next rainy season, the evaporated salts are dissolved by rainwater and infiltrate into the shallow aquifer at the time of low groundwater level [9,10]. The groundwaters in cluster C had a very low ratio (85), indicating fresh recharge water.
Generally, Ca2+, Mg2+, HCO3 and SO42− indicate controlled carbonate/gypsum minerals dissolution/precipitation processes. pH and CO2 mainly control the dissolution of carbonate minerals, while gypsum is controlled by its solubility product. The molar ratio (Ca2+ + Mg2+)/(SO42− + HCO3) generally follows a 1:1 ratio. The molar ratio of the studied water samples varied from 0.03 to 183.0 (Table 4). This ratio was much higher than unity for the groundwater samples from cluster A (median: 12.6) and cluster B (median: 3). Positive factor loadings of Ca2+ and Mg2+ and negative loadings of pH and HCO3 suggested that the main processes controlling the chemistry of clusters A and B included reverse cation exchange between Ca2+ and Na+ due to salinization according to (Equation (3)) and groundwater mixing with dissolved salt crests. It can be observed that the Ca2+ in groundwater increased due to reverse ion exchange. Almost all the groundwaters in cluster C (median: 0.10) fell below the 1:1 ratio line. It was noted that more than 65% of the DA groundwater samples had calcite oversaturation and the remaining 35% may have come from a calcite- and dolomite-impoverished source or became undersaturated via direct cation exchange according to Equation (2) due to freshwater intrusion [49]. Relatively high alkalinity in groundwater samples from cluster C compared with clusters A and B was due to the second stage of calcite dissolution upon freshening. The resulting groundwaters in cluster C were of the NaHCO3 type, suggesting an aquifer freshening condition.
NO3 showed a strong relation with Na+ and Cl in the loadings of factor 1, indicating a similar source of origin. However, seawater has a very low NO3 concentration (0.2 mg/L), but the analyzed groundwater from clusters A and B had a relatively high NO3 concentration. Therefore, the high NO3 was due to the leakage from non-sealed septic tanks, poor sanitation facilities and nitrate fertilizer from agriculture. A survey that was conducted in one of the villages in the study area by Islam et al. [50] showed that 69% of households used non-sealed septic tanks.
Clusters A and B had high SO42− and MnTotal concentrations compared with cluster C. Aquifers in the study area also contained OM. The relatively high MnTotal was thought to be released by the reduction of OM according to the reaction in Equation (7). On the other hand, the use of fertilizers and around 69% of the non-sealed septic tank could bring more SO42− in the groundwaters of clusters A and B.
Relatively high MnTotal and FeTotal and low phosphate in the groundwater samples from clusters A and B indicated reducing conditions. On the other hand, groundwater samples from cluster C had low MnTotal and FeTotal and high nitrate, indicating oxidizing conditions. It seems that the high contents of FeTotal and MnTotal in clusters A and B were due to the reductive dissolution of ferric oxyhydroxides and manganese oxides via the oxidation of OM in the sediments, according to the reactions in Equations (6) and (7).

5. Summary and Conclusions

Multivariate statistical analysis is a well-proven method for the grouping of waters and detection of significant factors controlling water quality. The CA and FA methods produced a very good outcome in terms of identifying the factors in the present case, as this area has a very complex geology, and many factors controlling the chemistry of groundwater.
CA classified the groundwaters into three main geochemically distinct clusters (clusters A, B and C). CA provides a good insight compared with conventional methods regarding recognizing the vertical zoning of groundwater samples. The groundwater samples from clusters A and B compared very well with the USA and LSA, respectively. The majority of these samples had evaporated dissolved NaCl water, with some CaCl-type water indicating ongoing salinization. The groundwater samples belonging to cluster C characterized the DA system under semi-confined conditions and had mostly NaHCO3-type evolved groundwater.
The groundwater hydrochemistry could be explained by four factors explaining 75% of the total variance. FA showed that the most important factor was salinity, mainly due to the NaCl salt dissolution. The high positive loadings of Ca2+ and Mg2+ and the negative loadings of pH and HCO3 suggested the significance of cation exchange and carbonate dissolution/precipitation in the aquifer system. The integration between FA and hydrochemical ratios gave an insight into the role of cation exchange processes in the aquifers. The high iron and manganese loading indicated a reduced condition via the oxidation of OM. High loadings of NO3 and sulfate could indicate leaking from pit latrines and sewage as the cause of high NO3 and SO42− in groundwater. The significantly high Br loading solely onto factor 4 as the only variable loading high on this factor indicated that the source of Br in groundwater, even in the highly mineralized cluster A and moderately mineralized cluster B, was not due to seawater intrusion from the Bay of Bengal; this was confirmed by the Cl/Br ratios in the highly to moderately salinized groundwater samples. A Cl/Br ratio of several thousand suggested that salt dissolution by monsoon rainfall was the main source of high salinity in the shallow aquifers. In contrast, groundwater in cluster C was free from saltwater contamination and was recharged in the northwestern part of the Bengal Basin. Some NaCl-type groundwaters from cluster C had low ratios of Cl/Br, suggesting paleo-seawater. The deterioration of water quality in clusters A and B was mostly via the dissolution of evaporitic salts and anthropogenic activities to some extent. The groundwater in cluster C was freshened due to freshwater recharge that triggered direct cation exchange. The study revealed that the integrated use of hydrochemistry and multivariate statistics was capable and effective in the determination of hydrogeochemical processes and zonation in the coastal aquifers. It can be stated that the methodology of using CA and FA, along with the available hydrochemical and hydrogeological data, demonstrated itself to be an important tool to characterize different aquifers and hydrogeochemical processes of this study. This integrated study could also aid in developing a numerical model for the sustainable use of groundwater resources in the study area.

Author Contributions

Conceptualization, M.M.R.S. and K.W.; methodology, M.M.R.S. and K.W.; software, M.M.R.S., T.H., M.V.C., D.H. and M.I.; validation, M.M.R.S., T.H., M.V.C., D.H. and K.W.; formal analysis, M.M.R.S., T.H., M.V.C., M.I. and K.W.; investigation, M.M.R.S., D.H., N.A., M.A.Q.B. and M.M.K.; resources, M.M.R.S.; data curation, M.M.R.S. and M.I.; writing—original draft preparation, M.M.R.S.; writing—review and editing, T.H., M.V.C., D.H. and K.W.; visualization, M.M.R.S. and K.W.; supervision, K.W.; funding acquisition, M.M.R.S. All authors have read and agreed to the published version of the manuscript.

Funding

Bangabandhu Science and Technology Fellowship Trust, Ministry of Science and Technology, Government of the People’s Republic of Bangladesh.

Institutional Review Board Statement

Not applicable.

Informed Consent Statement

Not applicable.

Data Availability Statement

The data presented in this study are available on request from the corresponding author.

Acknowledgments

The author thank Jill Van Reybrouck of the Laboratory for Applied Geology and Hydrogeology, Department of Geology, Ghent University, Belgium, for analyzing the groundwater samples. We are grateful to the tubewell owners for the generous access to the wells. Anwar Zahid, Director, Bangladesh Water Development Board is also thanked for providing access to some water chemistry data. The authors would like to thank the anonymous reviewers for their comments and suggestions in improving the quality of the paper.

Conflicts of Interest

The authors declare no conflict of interest.

References

  1. Yang, Q.; Zhang, J.; Wang, Y.; Fang, Y.; Martín, J.D. Multivariate Statistical Analysis of Hydrochemical Data for Shallow Ground Water Quality Factor Identification in a Coastal Aquifer. Pol. J. Environ. Stud. 2015, 24, 769–776. [Google Scholar] [CrossRef]
  2. UNICEF; Bangladesh Bureau of Statistics. Bangladesh MICS 2012–2013: Water Quality Thematic Report; Bangladesh Bureau of Statistics: Dhaka, Bangladesh, 2018. [Google Scholar]
  3. Hossain, M.S.; Dearing, J.A.; Rahman, M.; Salehin, M. Recent changes in ecosystem services and human well-being in the Bangladesh coastal zone. Reg. Environ. Chang. 2016, 16, 429–443. [Google Scholar] [CrossRef] [Green Version]
  4. Rahman, M.T.U.; Rasheduzzaman, M.; Habib, M.A.; Ahmed, A.; Tareq, S.M.; Muniruzzaman, S.M. Assessment of fresh water security in coastal Bangladesh: An insight from salinity, community perception and adaptation. Ocean. Coast. Manag. 2017, 137, 68–81. [Google Scholar] [CrossRef]
  5. Policy, C.Z. Ministry of Water Resources, Government of the People’s Republic of Bangladesh: Dhaka, Bangladesh. 2005. Available online: http://nda.erd.gov.bd/en/c/publication/coastal-zone-policy-2005 (accessed on 15 November 2021).
  6. Qin, D.; Plattner, G.; Tignor, M.; Allen, S.; Boschung, J.; Nauels, A.; Xia, Y.; Bex, V.; Midgley, P. Climate Change 2013: The Physical Science Basis. Contribution of Working Group I to the Fifth Assessment Report of the Intergovernmental Panel on Climate Change; Stocker, T.F., Qin, D., Plattner, G.-K., Tignor, M., Allen, S.K., Boschung, J., Nauels, A., Xia, Y., Bex, V., Midgley, P.M., Eds.; Cambridge University Press: Cambridge, UK; New York, NY, USA, 2014; pp. 5–14. [Google Scholar]
  7. Oude Essink, G.H.P. Impact of Sea Level Rise on Groundwater Flow Regimes: A Sensitivity Analysis for the Netherlands; Delft University Press: Delft, The Netherlands, 1996; Volume 7. [Google Scholar]
  8. Morell, I.; Giménez, E.; Esteller, M. Application of principal components analysis to the study of salinization on the Castellon Plain (Spain). Sci. Total Environ. 1996, 177, 161–171. [Google Scholar] [CrossRef] [Green Version]
  9. Sarker, M.M.R.; Van Camp, M.; Hossain, D.; Islam, M.; Ahmed, N.; Karim, M.M.; Bhuiyan, M.A.Q.; Walraevens, K. Groundwater salinization and freshening processes in coastal aquifers from southwest Bangladesh. Sci. Total Environ. 2021, 779, 146339. [Google Scholar] [CrossRef] [PubMed]
  10. Sarker, M.M.R.; Van Camp, M.; Islam, M.; Ahmed, N.; Walraevens, K. Hydrochemistry in coastal aquifer of southwest Bangladesh: Origin of salinity. Environ. Earth Sci. 2018, 77, 39. [Google Scholar] [CrossRef]
  11. Cloutier, V.; Lefebvre, R.; Therrien, R.; Savard, M.M. Multivariate statistical analysis of geochemical data as indicative of the hydrogeochemical evolution of groundwater in a sedimentary rock aquifer system. J. Hydrol. 2008, 353, 294–313. [Google Scholar] [CrossRef]
  12. Monjerezi, M.; Vogt, R.D.; Aagaard, P.; Saka, J.D. Hydro-geochemical processes in an area with saline groundwater in lower Shire River valley, Malawi: An integrated application of hierarchical cluster and principal component analyses. Appl. Geochem. 2011, 26, 1399–1413. [Google Scholar] [CrossRef]
  13. Hassen, I.; Hamzaoui-Azaza, F.; Bouhlila, R. Application of multivariate statistical analysis and hydrochemical and isotopic investigations for evaluation of groundwater quality and its suitability for drinking and agriculture purposes: Case of Oum Ali-Thelepte aquifer, central Tunisia. Environ. Monit. Assess. 2016, 188, 135. [Google Scholar] [CrossRef]
  14. Sarker, M.M.R.; Van Camp, M.; Hermans, T.; Hossain, D.; Islam, M.; Uddin, M.Z.; Ahmed, N.; Bhuiyan, M.A.Q.; Masud, M.M.; Walraevens, K. Geophysical Delineation of Freshwater–Saline Water Interfaces in Coastal Area of Southwest Bangladesh. Water 2021, 13, 2527. [Google Scholar] [CrossRef]
  15. Wenning, R.J.; Erickson, G.A. Interpretation and analysis of complex environmental data using chemometric methods. TrAC Trends Anal. Chem. 1994, 13, 446–457. [Google Scholar] [CrossRef]
  16. Adams, S.; Titus, R.; Pietersen, K.; Tredoux, G.; Harris, C. Hydrochemical characteristics of aquifers near Sutherland in the Western Karoo, South Africa. J. Hydrol. 2001, 241, 91–103. [Google Scholar] [CrossRef] [Green Version]
  17. Helena, B.; Pardo, R.; Vega, M.; Barrado, E.; Fernandez, J.M.; Fernandez, L. Temporal evolution of groundwater composition in an alluvial aquifer (Pisuerga River, Spain) by principal component analysis. Water Res. 2000, 34, 807–816. [Google Scholar] [CrossRef]
  18. Kim, J.H.; Kim, R.H.; Lee, J.; Cheong, T.J.; Yum, B.W.; Chang, H.W. Multivariate statistical analysis to identify the major factors governing groundwater quality in the coastal area of Kimje, South Korea. Hydrol. Process. Int. J. 2005, 19, 1261–1276. [Google Scholar] [CrossRef]
  19. Cloutier, V.; Lefebvre, R.; Savard, M.M.; Bourque, É.; Therrien, R. Hydrogeochemistry and groundwater origin of the Basses-Laurentides sedimentary rock aquifer system, St. Lawrence Lowlands, Québec, Canada. Hydrogeol. J. 2006, 14, 573–590. [Google Scholar] [CrossRef]
  20. Melloul, A.; Collin, M. The ‘principal components’ statistical method as a complementary approach to geochemical methods in water quality factor identification; application to the Coastal Plain aquifer of Israel. J. Hydrol. 1992, 140, 49–73. [Google Scholar] [CrossRef]
  21. Retike, I.; Kalvans, A.; Popovs, K.; Bikse, J.; Babre, A.; Delina, A. Geochemical classification of groundwater using multivariate statistical analysis in Latvia. Hydrol. Res. 2016, 47, 799–813. [Google Scholar] [CrossRef] [Green Version]
  22. Schot, P.; Van der Wal, J. Human impact on regional groundwater composition through intervention in natural flow patterns and changes in land use. J. Hydrol. 1992, 134, 297–313. [Google Scholar] [CrossRef] [Green Version]
  23. Steinhorst, R.K.; Williams, R.E. Discrimination of groundwater sources using cluster analysis, MANOVA, canonical analysis and discriminant analysis. Water Resour. Res. 1985, 21, 1149–1156. [Google Scholar] [CrossRef]
  24. Farnham, I.M.; Stetzenbach, K.J.; Singh, A.K.; Johannesson, K.H. Deciphering groundwater flow systems in Oasis Valley, Nevada, using trace element chemistry, multivariate statistics, and geographical information system. Math. Geol. 2000, 32, 943–968. [Google Scholar] [CrossRef]
  25. Eang, K.E.; Igarashi, T.; Kondo, M.; Nakatani, T.; Tabelin, C.B.; Fujinaga, R. Groundwater monitoring of an open-pit limestone quarry: Water-rock interaction and mixing estimation within the rock layers by geochemical and statistical analyses. Int. J. Min. Sci. Technol. 2018, 28, 849–857. [Google Scholar] [CrossRef]
  26. Allison, M.A.; Khan, S.; Goodbred Jr, S.L.; Kuehl, S.A. Stratigraphic evolution of the late Holocene Ganges–Brahmaputra lower delta plain. Sediment. Geol. 2003, 155, 317–342. [Google Scholar] [CrossRef]
  27. Goodbred, S., Jr.; Kuehl, S.A. The significance of large sediment supply, active tectonism, and eustasy on margin sequence development: Late Quaternary stratigraphy and evolution of the Ganges–Brahmaputra delta. Sediment. Geol. 2000, 133, 227–248. [Google Scholar] [CrossRef]
  28. Umitsu, M. Late Quaternary sedimentary environments and landforms in the Ganges Delta. Sediment. Geol. 1993, 83, 177–186. [Google Scholar] [CrossRef]
  29. Akter, J.; Sarker, M.H.; Popescu, I.; Roelvink, D. Evolution of the Bengal Delta and its prevailing processes. J. Coast. Res. 2016, 32, 1212–1226. [Google Scholar] [CrossRef] [Green Version]
  30. Hossain, M.S.; Khan, M.S.H.; Chowdhury, K.R.; Abdullah, R. Synthesis of the tectonic and structural elements of the Bengal Basin and its surroundings. In Tectonics and Structural Geology: Indian Context; Springer: Cham, Switzerland, 2019; pp. 135–218. [Google Scholar]
  31. Kinniburgh, D.; Smedley, P. Arsenic Contamination of Groundwater in Bangladesh; British Geological Survey: Keyworth, UK, 2001. [Google Scholar]
  32. Alam, L.; Miyauchi, N.; Shinagawa, A. Study on clay mineralogical characteristics of calcareous and noncalcareous soils of Bangladesh. Clay Sci. 1993, 9, 81–97. [Google Scholar]
  33. Halim, M.; Majumder, R.; Nessa, S.; Hiroshiro, Y.; Sasaki, K.; Saha, B.; Saepuloh, A.; Jinno, K. Evaluation of processes controlling the geochemical constituents in deep groundwater in Bangladesh: Spatial variability on arsenic and boron enrichment. J. Hazard. Mater. 2010, 180, 50–62. [Google Scholar] [CrossRef]
  34. Claassen, H.C. Guidelines and Techniques for Obtaining Water Samples That Accurately Represent the Water Chemistry of an Aquifer; US Geological Survey: Lakewood, CO, USA, 1982; Volume 82. [Google Scholar]
  35. APHA. Standard Methods for the Examination of Water and Wastewater; American Public Health Association, American Water Works Association and Water Pollution Control Federation: New York, NY, USA, 1985. [Google Scholar]
  36. Bangladesh Water Development Board (BWBD). Hydrogeological Study and Mathematical Modelling to Identify Sites for Installation of Observation Well Nests, Selection of Model Boundary, Supervision of Pumping Test, Slug Test, Assessment of Different Hydrogeological Parameters Collection and Conduct Chemical Analysis of Surface Water and Groundwater; Bangladesh Water Development Board: Dhaka, Bangladesh, 2013. [Google Scholar]
  37. Davis, J.C.; Sampson, R.J. Statistics and Data Analysis in Geology; Wiley: New York, NY, USA, 1986; Volume 646. [Google Scholar]
  38. Ward, J.H., Jr. Hierarchical grouping to optimize an objective function. J. Am. Stat. Assoc. 1963, 58, 236–244. [Google Scholar] [CrossRef]
  39. Lawley, D.N.; Maxwell, A.E. Factor analysis as a statistical method. J. R. Stat. Soc. Ser. D 1962, 12, 209–229. [Google Scholar] [CrossRef]
  40. Walraevens, K.; Van Camp, M. Advances in understanding natural groundwater quality controls in coastal aquifers. In Groundwater and Saline Intrusion. Selected Papers from the 18th SWIM Meeting, 1st ed.; IGGM: Madrid, Spain, 2005. [Google Scholar]
  41. Piper, A.M. A graphic procedure in the geochemical interpretation of water-analyses. Eos Trans. Am. Geophys. Union 1944, 25, 914–928. [Google Scholar] [CrossRef]
  42. Stuyfzand, P. A new hydrochemical classification of water types with examples of application to The Netherlands. H20 1986, 19, 562–568. [Google Scholar]
  43. Güler, C.; Thyne, G.D.; McCray, J.E.; Turner, K.A. Evaluation of graphical and multivariate statistical methods for classification of water chemistry data. Hydrogeol. J. 2002, 10, 455–474. [Google Scholar] [CrossRef]
  44. Fetter, C.W.; Boving, T.B.; Kreamer, D.K. Contaminant Hydrogeology; Prentice Hall: Upper Saddle River, NJ, USA, 1999; Volume 406. [Google Scholar]
  45. Dola, S.S.; Bahsar, K.; Islam, M.; Sarker, M.M.R. Hydrogeological classification and the correlation of groundwater chemistry with basin flow in the south-western part of Bangladesh. J. Bangladesh Acad. Sci. 2018, 42, 41–54. [Google Scholar] [CrossRef]
  46. Gerritse, R.G.; George, R.J. The role of soil organic matter in the geochemical cycling of chloride and bromide. J. Hydrol. 1988, 101, 83–95. [Google Scholar] [CrossRef]
  47. Davis, S.N.; Whittemore, D.O.; Fabryka-Martin, J. Uses of chloride/bromide ratios in studies of potable water. Groundwater 1998, 36, 338–350. [Google Scholar] [CrossRef]
  48. Alcalá, F.J.; Custodio, E. Using the Cl/Br ratio as a tracer to identify the origin of salinity in aquifers in Spain and Portugal. J. Hydrol. 2008, 359, 189–207. [Google Scholar] [CrossRef]
  49. Walraevens, K.; Van Camp, M. Advances in understanding natural groundwater quality controls in coastal aquifers. In Proceedings of the 18th Salt Water Intrusion Meeting, Cartagena, Spain, 31 May–3 June 2004. [Google Scholar]
  50. Islam, M.H.; Naznin, R.A.; Datta, N.; Solayman, H.M.; Hasan, R.; Jitu, S.P. Study on sanitation system at Muradia Union of Dumki upazilla in Patuakhali district. In Proceedings of the WasteSafe 2015—4th International Conference on Solid Waste Management in the Developing Countries, Khulna, Bangladesh, 15–17 February 2015. [Google Scholar]
Figure 1. Groundwater samples’ location map with water types.
Hydrology 09 00020 g001
Figure 2. Conceptual hydrogeological model showing the aquifer types with the sediment depositional history of the study area, modified after Sarker et al. [9].
Hydrology 09 00020 g002
Figure 3. Plot of the eigenvalue against PCA components.
Hydrology 09 00020 g003
Figure 4. Piper plot of the groundwater samples showing different water types.
Hydrology 09 00020 g004
Figure 5. Dendrogram for the sampled groundwaters, showing three major clusters.
Hydrology 09 00020 g005
Figure 6. Box and whisker plots of some selected ions of the groundwater samples.
Hydrology 09 00020 g006
Figure 7. The factor loadings of F1 and F2 (61%) for 16 variables before a varimax rotation.
Hydrology 09 00020 g007
Figure 8. Plots of the factor scores on the F1–F2 (A) and F3–F4 factorial planes (B). Here, the groundwater samples are grouped according to their clusters from the CA.
Hydrology 09 00020 g008
Figure 9. The subsurface distribution of water samples against the factor 1 and factor 2 scores of the three different clusters (A, B and C).
Hydrology 09 00020 g009
Table 1. Basic statistical descriptors of the physico-chemical parameters from the ground in range water: n—number of water samples, Max—maximum, Min—minimum, Med—median, Ave—average and Std—standard deviation. Units: T is in °C, pH is unitless and EC is in µS/cm (25 °C). TDS and all other ion concentrations are in mg/L.
TpHECTDSNa+K+Ca2+Mg2+FeTotalMnTotalClSO42−NO3 HCO3PO43−Br
Upper Shallow Aquifer (USA)
n51 515151515151515151515151515151
Max32.17.9043,30029,6168848246.8862.11096.821.208.8019,1331130.0131.510264.5037.2
Min26.65.70709423131.512.30.020.0213<0.10.1240.08<0.1
Med27.67.2010,1807012181616.43180277.23.500.8038201.04.01590.410.5
Ave27.867.2211,1037205191334.8219.4266.16.181.31441883.510.02460.671.3
Std10.4180855328158649.7175.6202.96.441.703492240.420.21980.795.1
Lower Shallow Aquifer (LSA)
n41414141414141414141414141414141
Max31.18.8015,96010,2092910114.3367301.314.102.50685011.030.06001.090.7
Min26.55.90855787692.60.320.100.0310<0.10.3920.18<0.1
Med27.97.38383026225671270852.520.201730<0.12.32140.420.2
Ave28.17.325087322082219.698.3110.33.630.3319121.53.82400.510.2
Std0.910.663940280371221.990.877.73.650.3817652.54.91240.230.2
Deep Aquifer (DA)
n70707070707070707070707070707070
Max338.9211,3907592272628.272.11212.390.30435026.735.17368.3891.6
Min26.57.20565512811.91.21.10.02<0.012<0.1<0.12870.11<0.1
Med28.48.229767872053.27.43.70.170.01510.95.04951.410.4
Ave28.68.13157811043174.811.19.20.240.042562.36.44922.033.7
Std1.20.42194310863984.712.717.10.330.066644.26.61051.7312.0
Table 2. Correlations between the major solutes in groundwater. Numbers in bold indicate significant correlations (r ≥ 0.75).
pHTECTDSNa+K+Ca2+Mg2+FeTotalMnTotalClSO4NO3HCO3PO43−Br
pH1
T0.201
EC−0.44−0.341
TDS−0.44−0.341.001
Na+−0.39−0.320.980.991
K+−0.27−0.280.810.810.841
Ca2+−0.52−0.260.510.510.410.191
Mg2+−0.49−0.330.890.890.830.690.671
FeTotal−0.50−0.160.360.370.300.050.530.451
MnTotal−0.25−0.260.610.590.550.440.410.500.081
Cl−0.47−0.330.990.990.970.780.530.900.410.581
SO42−−0.07−0.210.340.340.350.410.090.27−0.080.520.271
NO3−0.04−0.090.450.450.500.56−0.060.38−0.090.020.440.011
HCO30.520.16−0.42−0.41−0.34−0.18−0.61−0.55−0.52−0.19−0.470.07−0.021
PO43−0.520.08−0.31−0.29−0.26−0.19−0.35−0.34−0.28−0.27−0.31−0.14−0.020.421
Br0.120.030.050.020.060.01−0.05−0.07−0.05−0.060.01−0.020.210.200.051
Table 3. Distribution of groundwater samples and their percentage in the clusters from different aquifer types.
Aquifer TypeCluster TypeNumber of SamplesPercentage of Samples
USACluster A3772
Cluster B714
Cluster C714
LSACluster A1024
Cluster B2356
Cluster C820
DACluster A12
Cluster B34
Cluster C6694
Table 4. The statistical summary of the hydrochemical variables and some ratios of the clusters. All hydrochemical concentrations are reported in mg/L. EC is in µS/cm (at 25 °C), while pH and the molar ratio are unitless.
ClusterStatisticspHECTDSNa+K+Ca2+Mg2+FeTotalMnTotalClSO42−NO3HCO3Cl/BrNa+/ClCa2+/SO42−
Cluster AMaximum7.843,30029,6168848247862109721.208.8019,1331130.0131.5641637,7671.7183.0
Minimum5.76450403981321140.060.0215250.00.12430210.40.3
Mean7.113,63488002362432403096.521.41553586.19.220246,7370.721.8
Median7.212,53183032151241983004.240.8050381.04.313112,3490.612.6
Cluster BMaximum8.66670424412562933225616.050.80262013.16.651255,25033.027.4
Minimum5.9687423132030.060.00470.00.149580.10.1
Mean7.3291618344201195803.870.279822.02.322977541.65.5
Median7.4279014893391071702.870.206830.02.121430000.73.0
Cluster CMaximum8.911,39070121984361862269.951.313552115.442.0102627,500131.73.3
Minimum7.2565495541210.020.0020.00.0183170.40.0
Mean8.116631158324617160.500.082913.57.348976510.00.3
Median8.210008482183940.190.02540.85.1482855.40.1
Table 5. The factor pattern and explained variance for the four factors following a varimax rotation.
ParametersF1F2F3F4
pH−0.22−0.72−0.120.08
T−0.20−0.12−0.430.12
EC0.830.340.410.04
TDS0.840.330.40.01
Na+0.870.240.370.03
K+0.86−0.020.30−0.07
Ca2+0.160.750.350.01
Mg2+0.720.500.33−0.08
FeTotal0.090.760.040.01
MnTotal0.280.140.780.08
Cl0.830.390.36−0.01
SO42−0.16−0.150.800.01
NO30.81−0.18−0.290.15
HCO3−0.21−0.78−0.010.22
PO43−0.03−0.710.15−0.09
Br0.07−0.08−0.030.97
Eigenvalue7.332.451.350.97
Variance %461586
Cumulative %46616975
Publisher’s Note: MDPI stays neutral with regard to jurisdictional claims in published maps and institutional affiliations.

