

Prescriptive-Corrective Irrigation and Macronutrient Management in Greenhouse Soil-Grown Tomato Using the VegSyst-DSS v2 Decision Support Tool

 ,
, 
Abstract
:1. Introduction
2. Materials and Methods
2.1. Site and Cropping Details
2.2. Irrigation and Fertilization Treatments
2.2.1. Conventional Treatment
2.2.2. Prescriptive–Corrective Treatment
2.3. Measurements
2.3.1. Soil
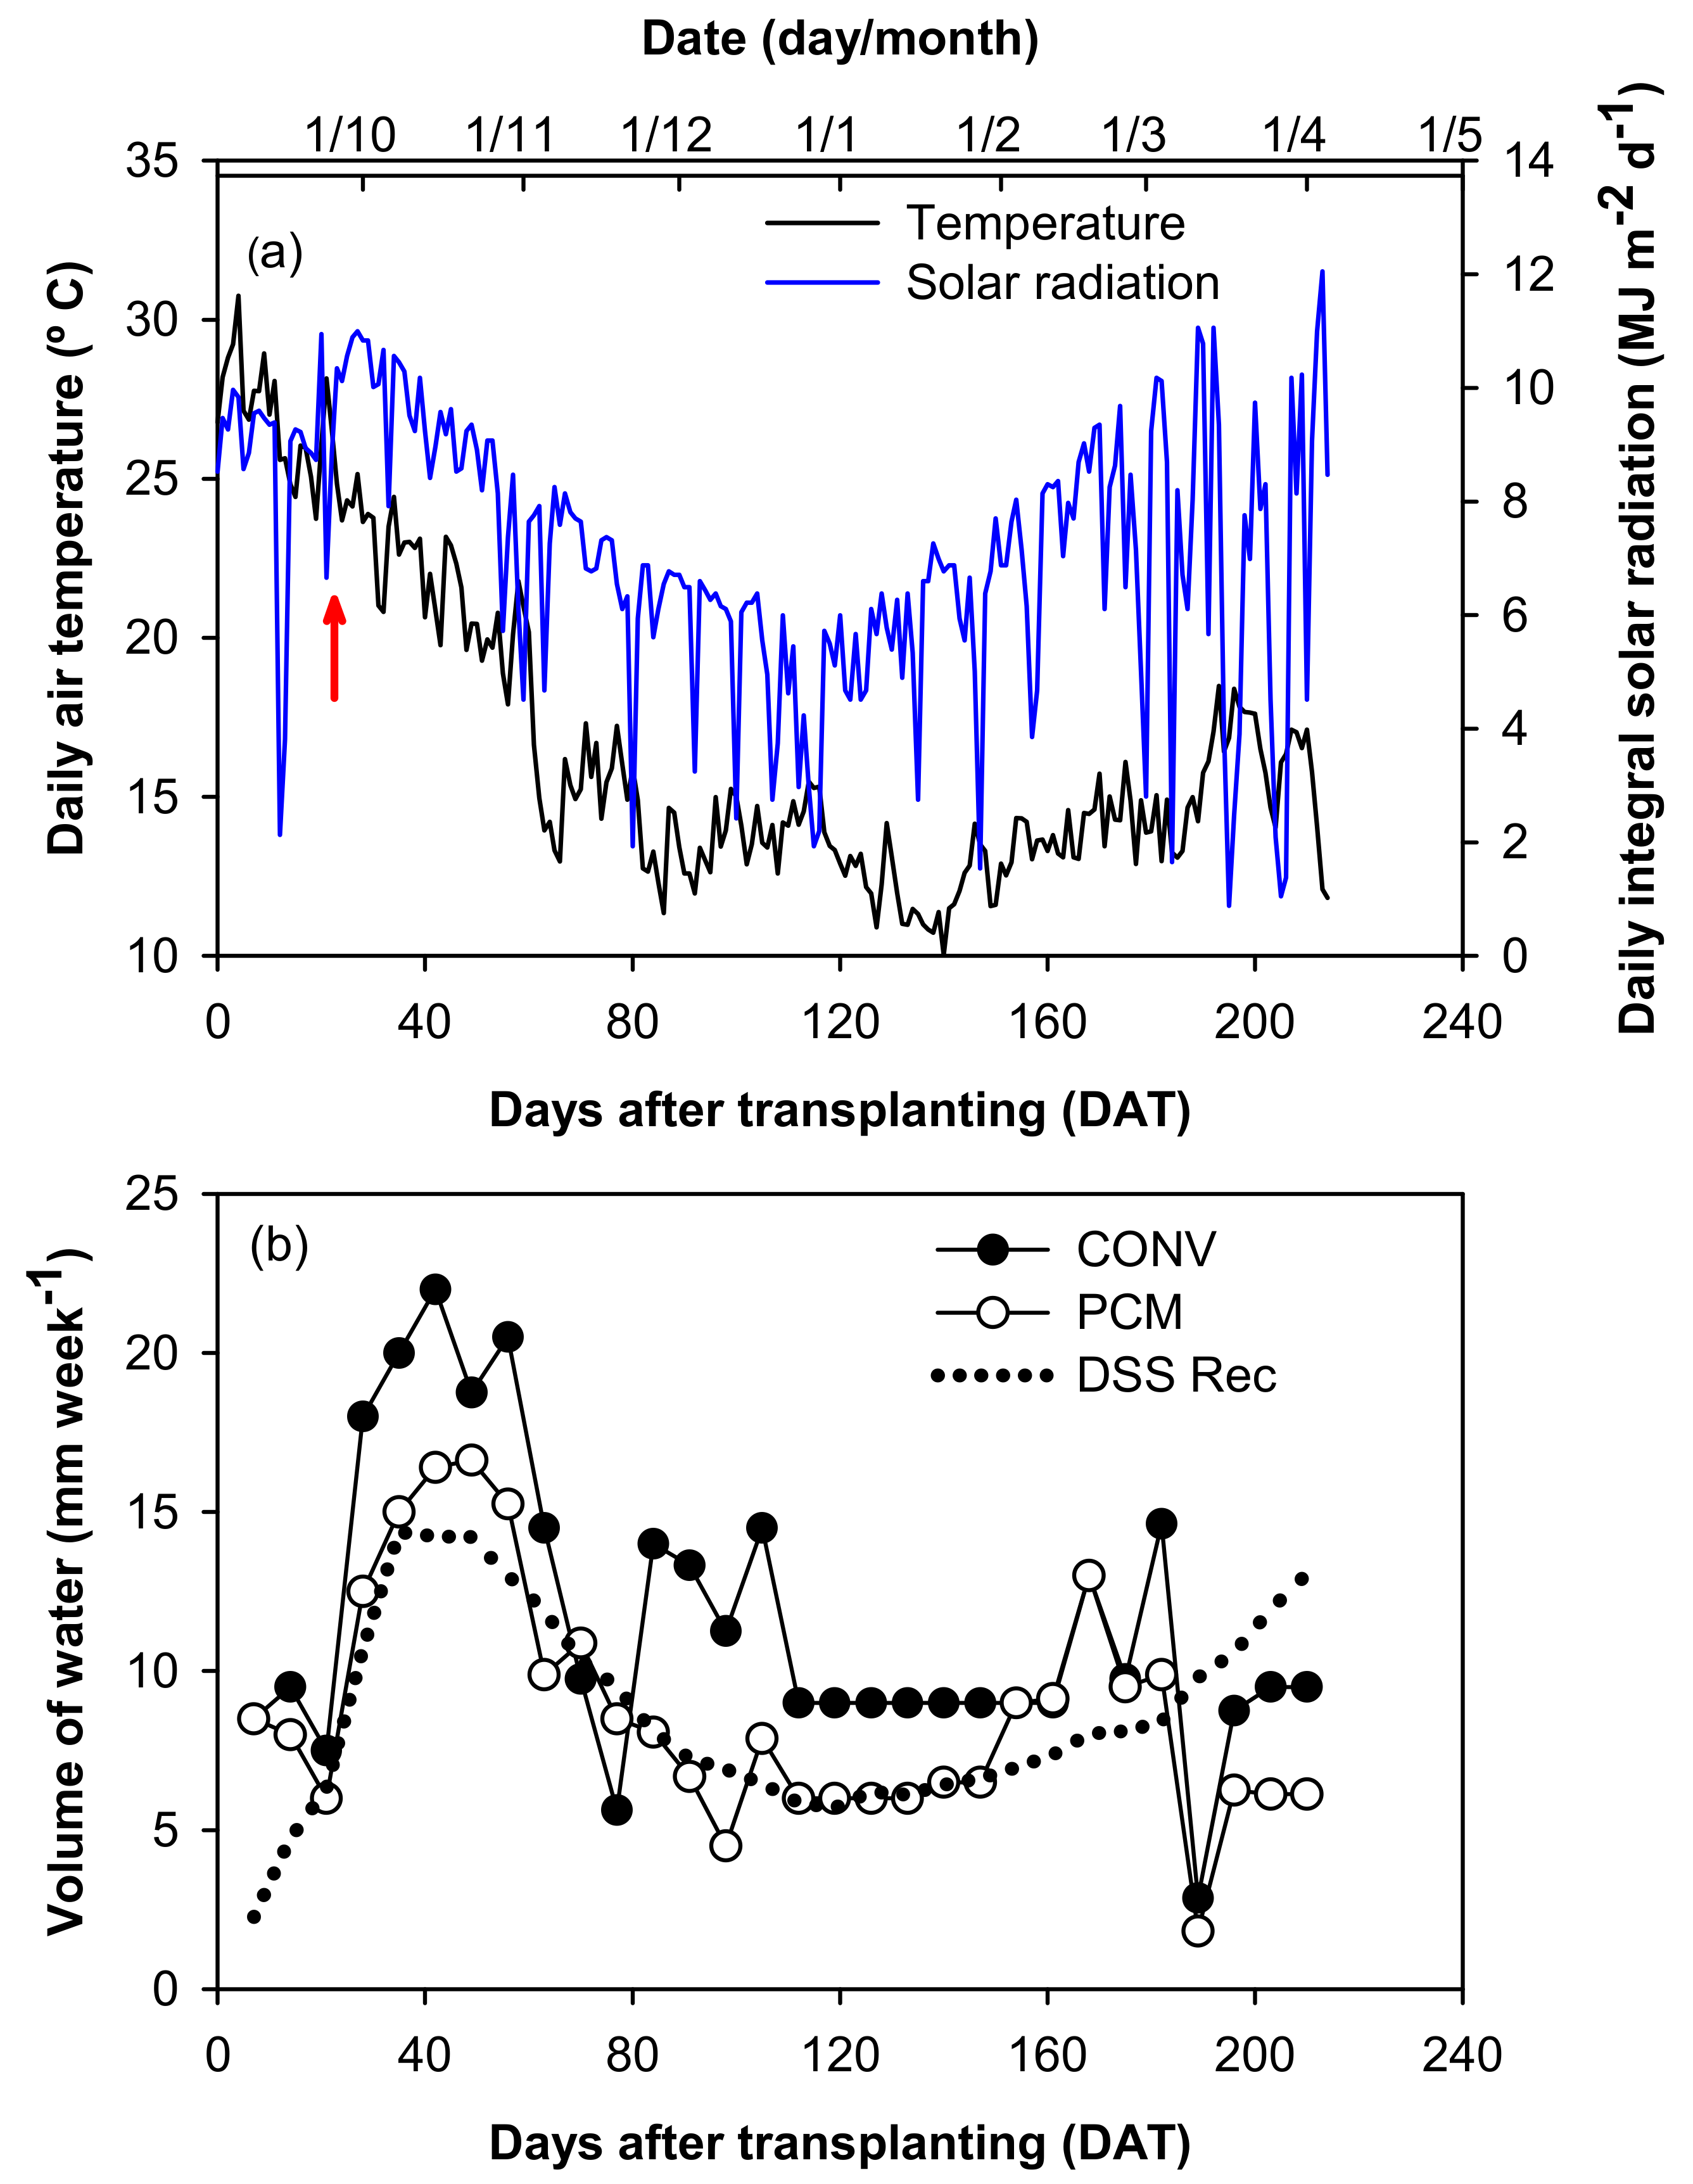
2.3.2. Climate
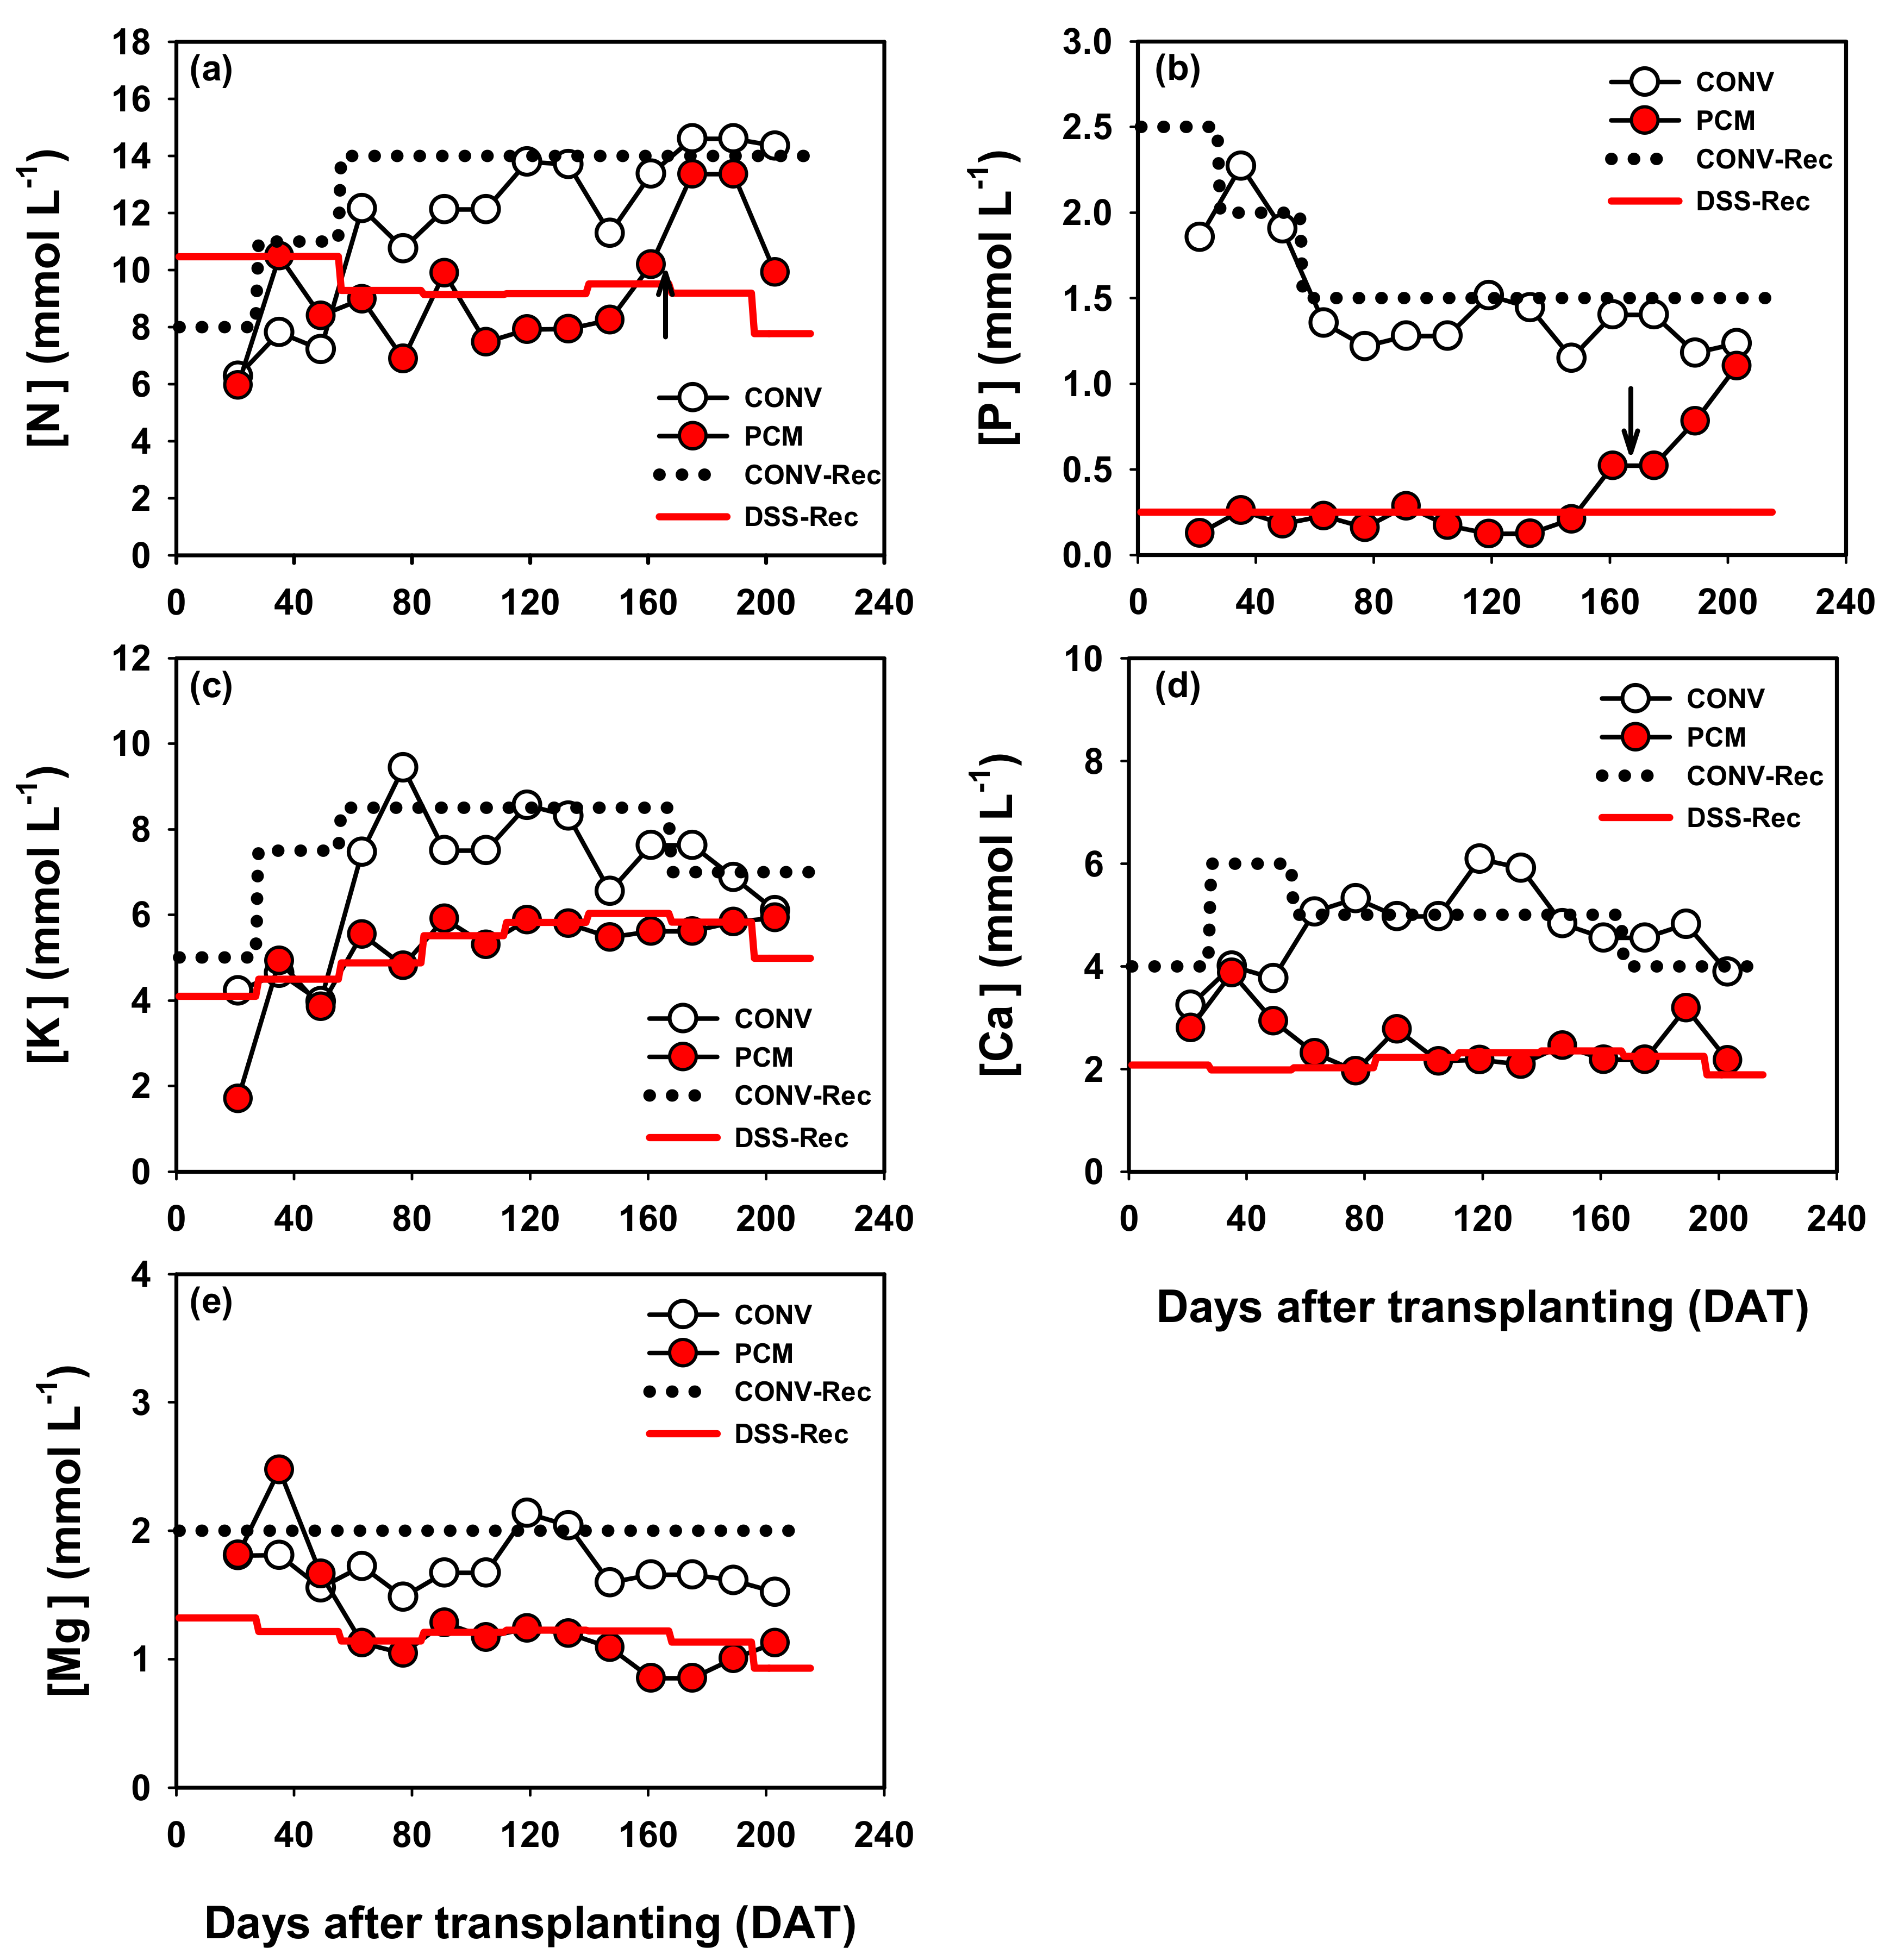
2.3.3. Volume and Composition of the Applied Nutrient Solution
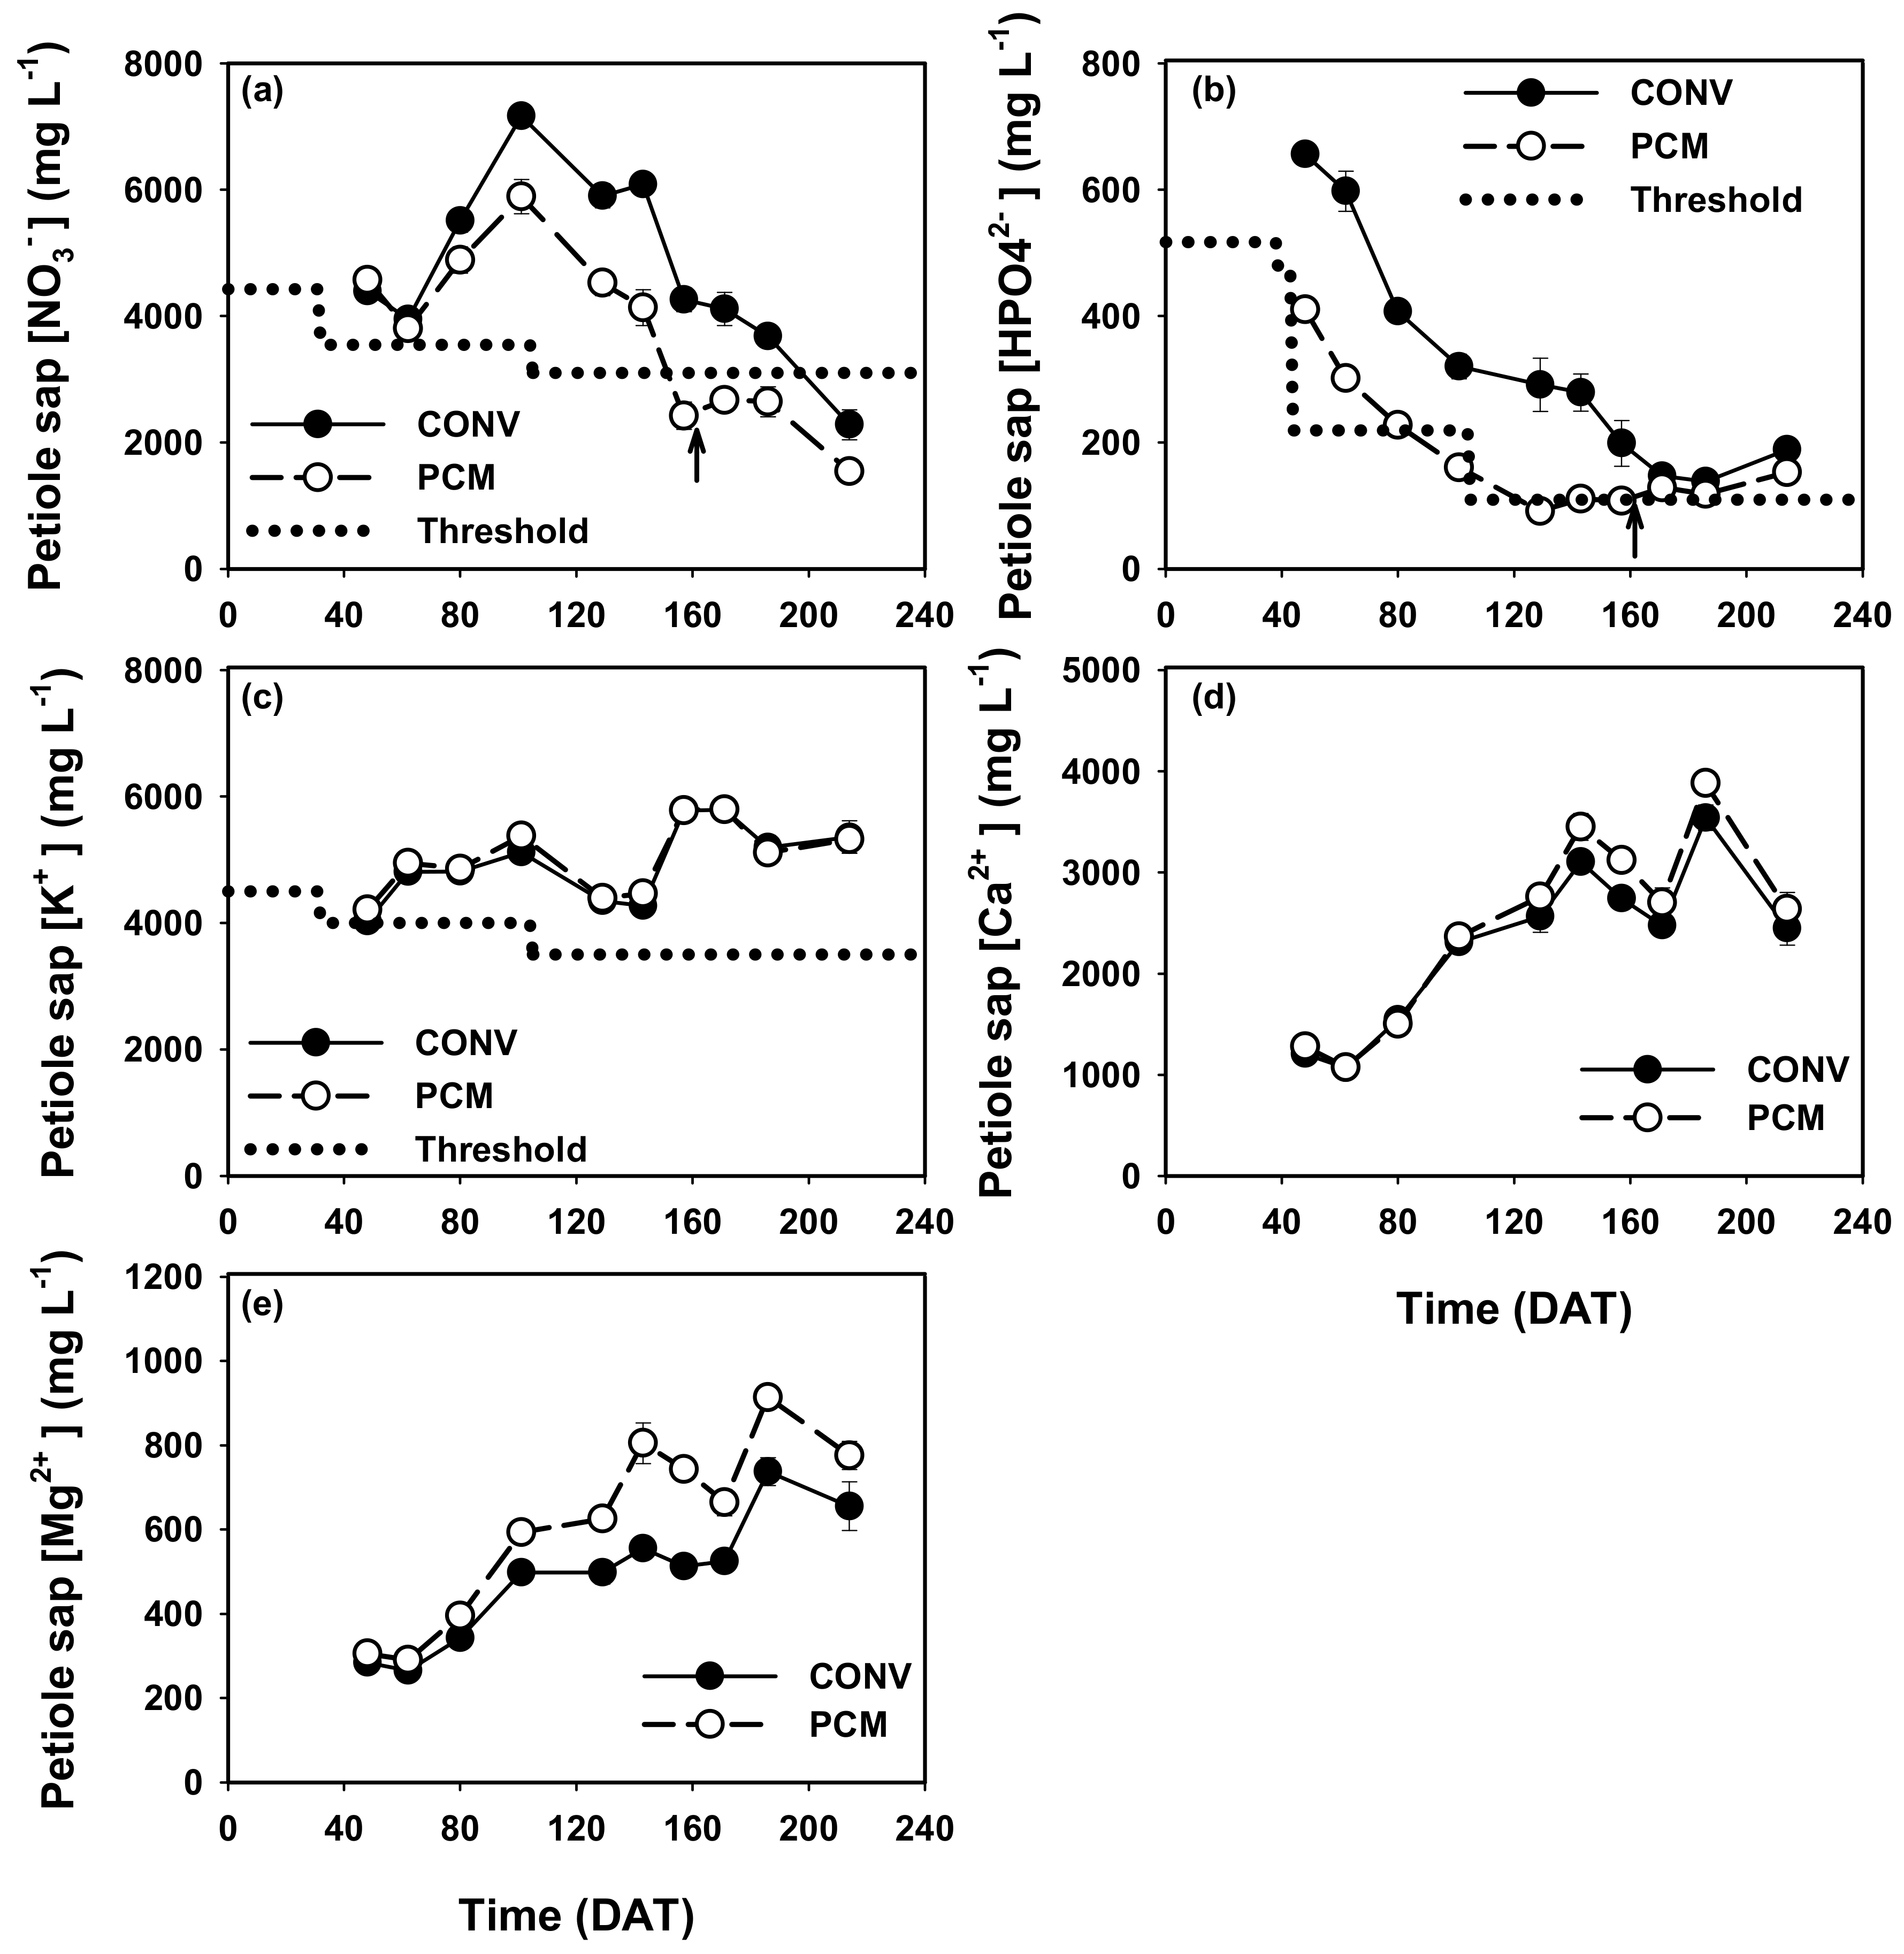
2.3.4. Nutrient Content in Petiole Sap
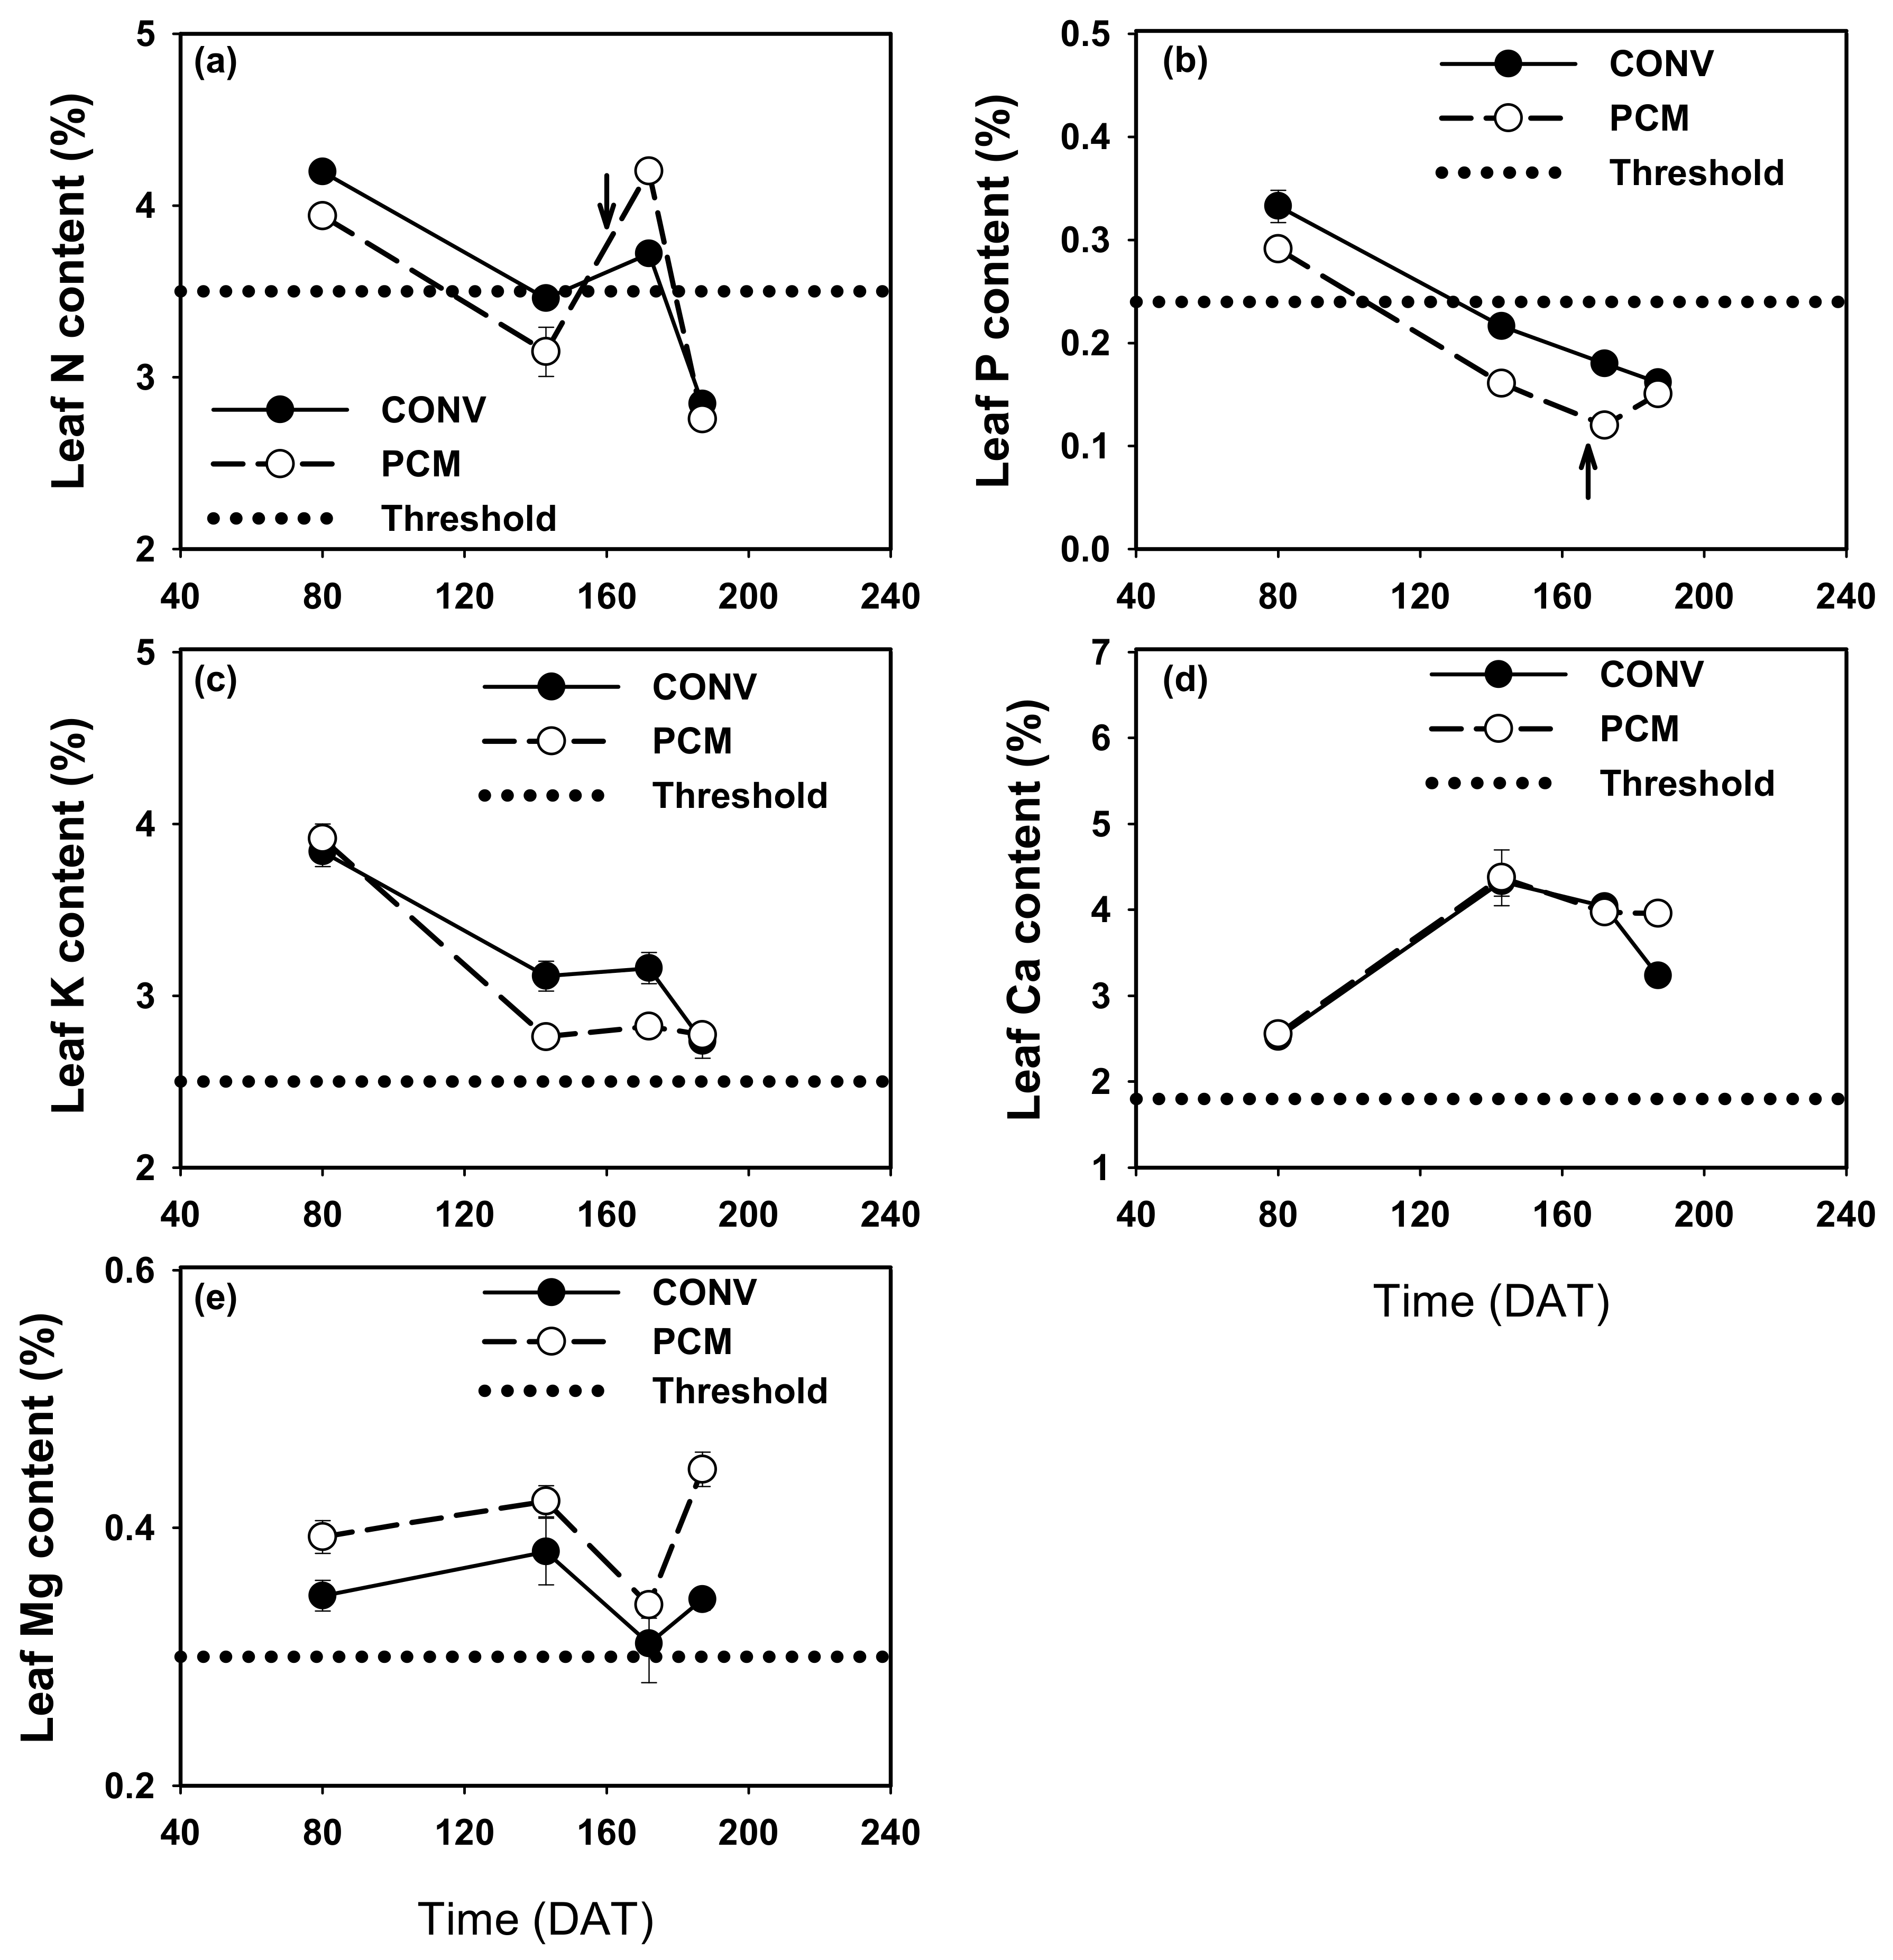
2.3.5. Nutrient Content in Leaves
2.3.6. Nutrients Content in Soil Solution
2.3.7. Crop Production and Quality
2.4. Data Analysis
3. Results
3.1. Water and Nutrients Applied
3.2. Monitoring of Plant Nutrient Status
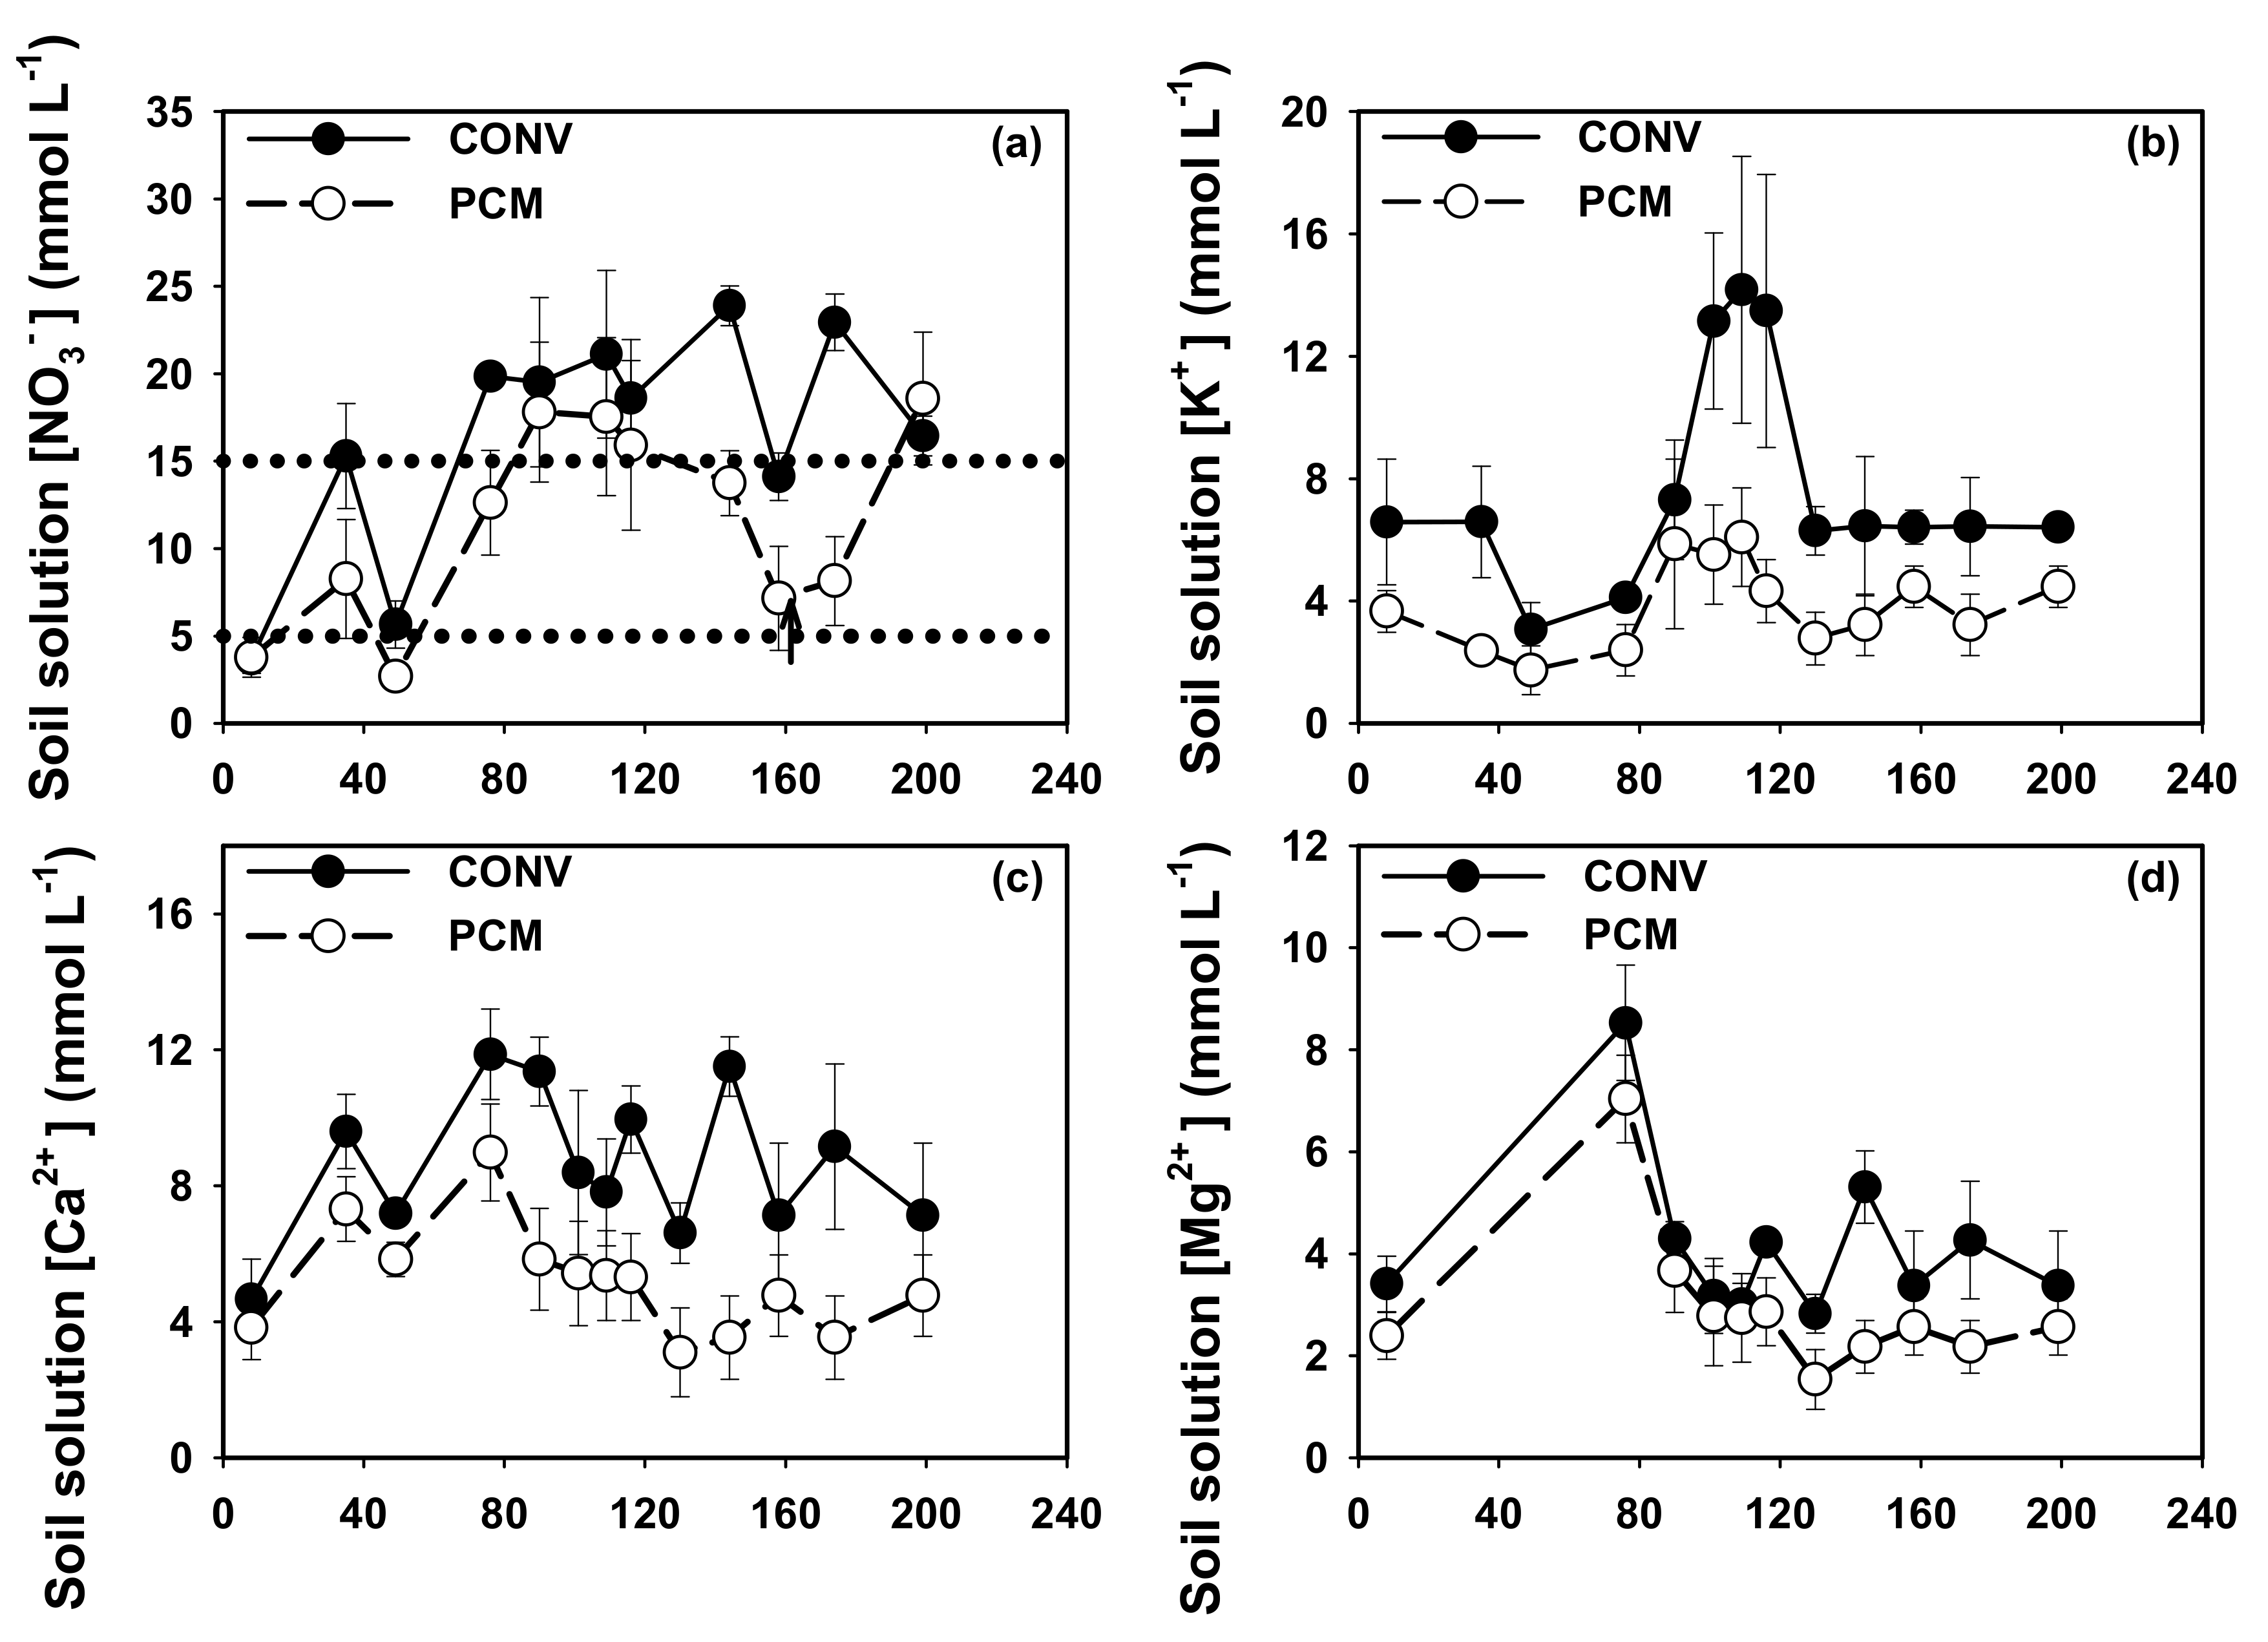
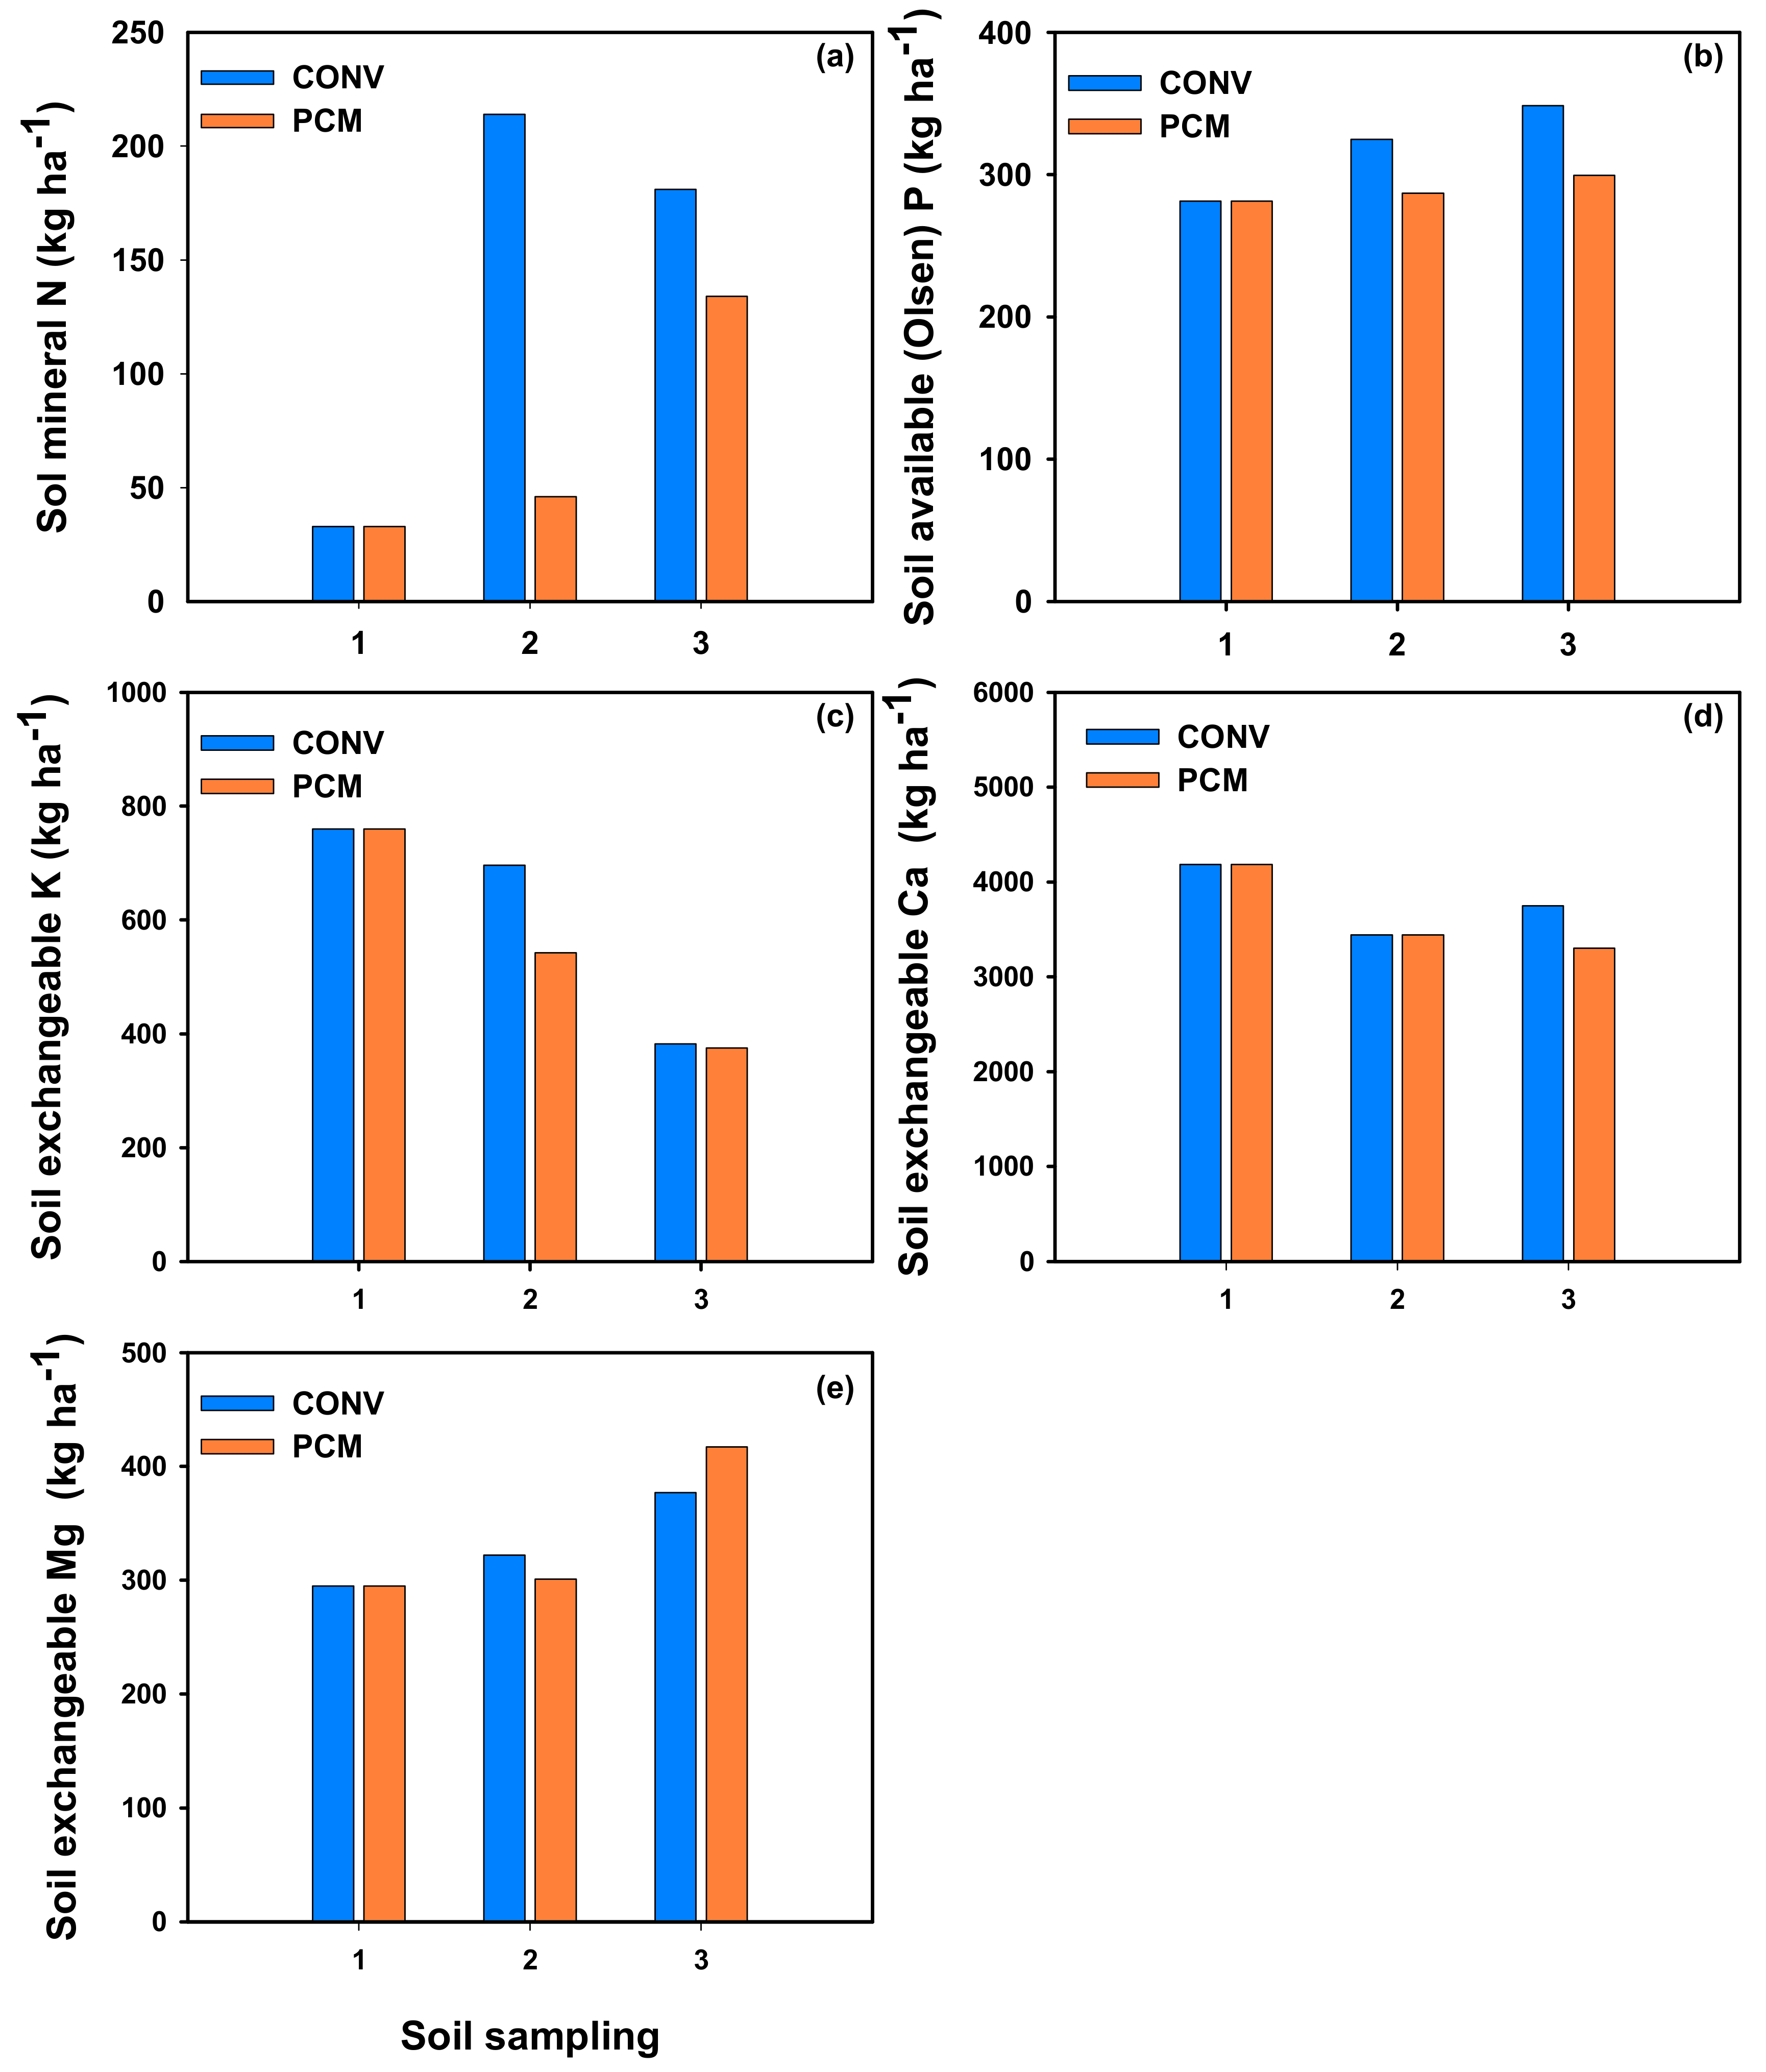
3.3. Monitoring of Soil Nutrient Supply
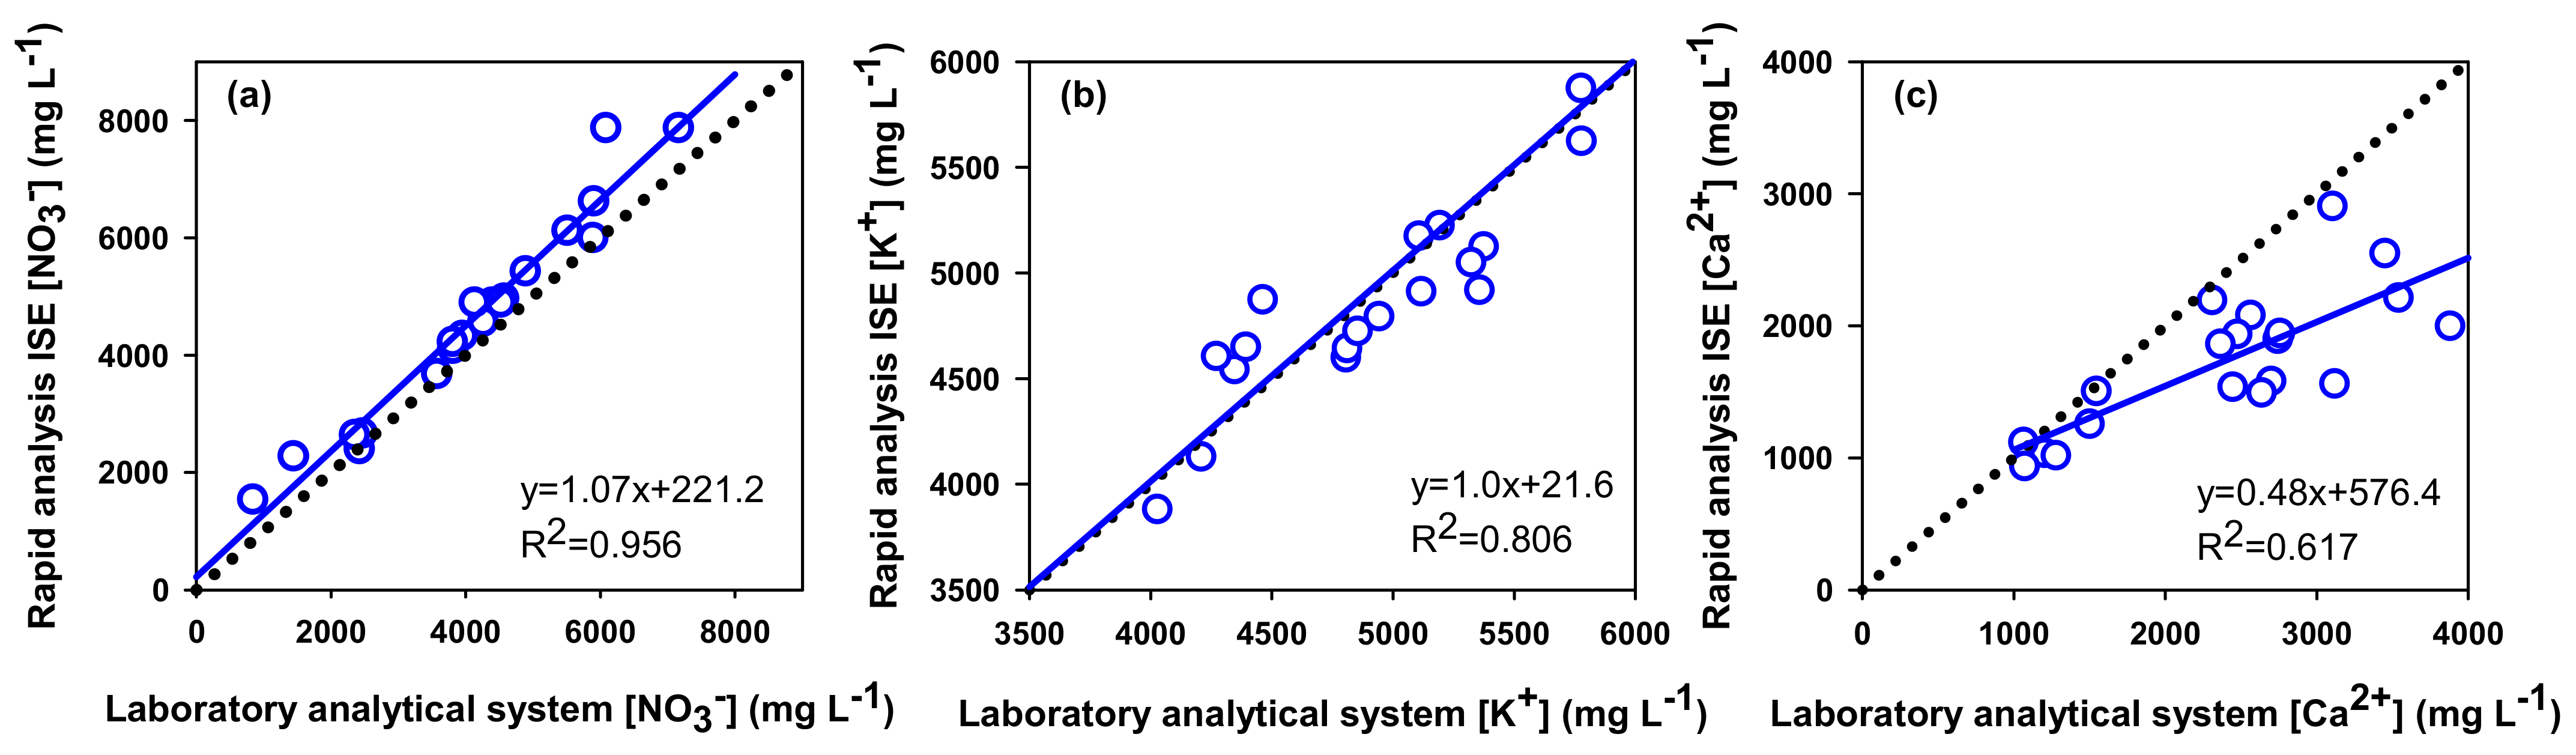
3.4. Comparison between Analytical Methods for Petiole Sap
3.5. Yield and Quality
3.6. Economic Analysis
4. Discussion
5. Conclusions
Author Contributions
Funding
Data Availability Statement
Conflicts of Interest
References
- Cajamar. Análisis de la campaña hortofrutícola de Almería. Campaña 2021/2022. Available online: https://publicacionescajamar.es/series-tematicas/informes-coyuntura-analisis-de-campana/analisis-de-la-campana-hortofruticola-de-almeria-campana-2021-2022 (accessed on 4 May 2023).
- García, M.C.; Céspedes, A.J.; Pérez-Parra, J.J.; Lorenzo, P. El Sistema de Producción Hortícola Protegido de la Provincia de Almería; IFAPA: Almeria, Spain, 2016; p. 180. [Google Scholar]
- Downward, S.R.; Taylor, R. An assessment of Spain’s Programa AGUA and its implications for sustainable water management in the province of Almería, southeast Spain. J. Environ. Manag. 2007, 82, 277–289. [Google Scholar] [CrossRef]
- Pulido-Bosch, A.; Rigol-Sanchez, J.P.; Vallejos, A.; Andreu, J.M.; Ceron, J.C.; Molina-Sánchez, L.; Sola, F. Impacts of agricultural irrigation on groundwater salinity. Environ. Earth Sci. 2018, 77, 197. [Google Scholar] [CrossRef]
- Gil de Carrasco, C. Caracterización Fisicoquímica y Evaluación del Estado General de los Suelos en los Invernaderos del Poniente Almeriense; FIAPA Report Nª 13; FIAPA: Almería, Spain, 2000. (In Spanish) [Google Scholar]
- Anonymous. Council Directive 91/676/EEC concerning the protection of waters against pollution caused by nitrates from agricultural sources. O. J. Eur. Commun. 1991, 375, 1–8. [Google Scholar]
- BOJA. Orden de 23 de Noviembre de 2020, por la Que se Aprueba la Modificación de las Zonas Vulnerables Definidas en el Decreto 36/2008, de 5 de Febrero, por el Que se Designan las Zonas Vulnerables y se Establecen Medidas Contra la Contaminación por Nitratos de Origen Agrario, al Amparo de su Disposición Adicional Primera. Boletín Oficial de la Junta de Andalucía. N°232, 19–40. 2020. Available online: https://www.juntadeandalucia.es/boja/2020/232/BOJA20-232-00022-14825-01_00182062.pdf (accessed on 4 May 2023).
- BOJA. Orden de 23 de Octubre de 2020, por la Que se Modifica la Orden de 1 de Junio de 2015, por la Que se Aprueba el Programa de Actuación Aplicable en las Zonas Vulnerables a la Contaminación por Nitratos Procedentes de Fuentes Agrarias Designadas en Andalucía. Boletín Oficial de la Junta de Andalucía. N°214. 24–42. 2020. Available online: https://www.juntadeandalucia.es/boja/2020/214/BOJA20-214-00019-13098-01_00180369.pdf (accessed on 4 May 2023).
- BOE. Real Decreto 1051/2022 de 27 de Diciembre, por el Que se Establecen Normas Para la Nutrición Sostenible en los Suelos Agrarios. Boletín Oficial del Estado. N°312. p. 42. Available online: https://www.boe.es/diario_boe/txt.php?id=BOE-A-2022-23052 (accessed on 4 May 2023). (In Spanish).
- Gallardo, M.; Thompson, R.B.; Giménez, C.; Padilla, F.M.; Stöckle, C.O. Prototype decision support system based on the VegSyst simulation model to calculate crop N and water requirements for tomato under plastic cover. Irrig. Sci. 2014, 32, 237–253. [Google Scholar] [CrossRef]
- Gallardo, M.; Fernández, M.D.; Giménez, C.; Padilla, F.M.; Thompson, R.B. Revised VegSyst model to calculate dry matter production, critical N uptake and ETc of several vegetable species grown in Mediterranean greenhouses. Agric. Syst. 2016, 146, 30–43. [Google Scholar] [CrossRef]
- Gallardo, M.; Peña-Fleitas, M.T.; Giménez, C.; Padilla, F.M.; Thompson, R.B. Adaptation of VegSyst-DSS for macronutrient recommendations of fertigated, soil-grown, greenhouse vegetable crops. Agric. Water Manag. 2023, 278, 107973. [Google Scholar] [CrossRef]
- Thompson, R.B.; Tremblay, N.; Fink, M.; Gallardo, M.; Padilla, F.M. Tools and Strategies for Sustainable Nitrogen Fertilisation of Vegetable Crops. In Advances in Research on Fertilization Management of Vegetable Crops; Tei, F., Nicola, S., Benincasa, P., Eds.; Springer: Heidelberg, Germany, 2017; pp. 11–63. [Google Scholar]
- Granados, M.R.; Thompson, R.B.; Fernández, M.D.; Martı́nez-Gaitán, C.; Gallardo, M. Prescriptive–corrective nitrogen and irrigation management of fertigated and drip-irrigated vegetable crops using modeling and monitoring approaches. Agr. Water Manag. 2013, 119, 121–134. [Google Scholar] [CrossRef]
- Fernández, M.D.; Baeza, E.; Céspedez, A.; Pérez-Parra, J.; Gázquez, J.C. Validation of on-farm crop water requirements (PrHo) model for horticultural crops in an unheated plastic greenhouse. Acta Hortic. 2009, 807, 295–300. [Google Scholar] [CrossRef]
- Magán, J.J.; Gallardo, M.; Fernández, M.D.; Garcı́a, M.L.; Granados, M.R.; Padilla, F.M.; Thompson, R.B. Showcasing a fertigation management strategy for increasing water and nitrogen use efficiency in soil-grown vegetable crops in the FERTINNOWA project. Acta Hortic. 2019, 1253, 17–24. [Google Scholar] [CrossRef]
- Martínez-Gaitán, C.; Granados, M.R.; Fernández, M.D.; Gallardo, M.; Thompson, R.B. Recovery of 15N labeled nitrogen fertilizer by fertigated and drip irrigated greenhouse vegetable crops. Agronomy 2020, 10, 741. [Google Scholar] [CrossRef]
- Gallardo, M.; Elia, A.; Thompson, R.B. Decision support systems and models for aiding irrigation and nutrient management of vegetable crops. Agr. Water Manag. 2020, 240, 106209. [Google Scholar] [CrossRef]
- Gallardo, M.; Cuartero, J.; Andújar de la Torre, L.; Padilla, F.M.; Segura, M.L.; Thompson, R.B. Modelling nitrogen, phosphorus, potassium, calcium and magnesium uptake, and uptake concentration, of greenhouse tomato with the VegSyst model. Sci. Hort. 2021, 279, 109862. [Google Scholar] [CrossRef]
- Thompson, R.B.; Gallardo, M.; Valdez, L.C.; Fernández, M.D. Using plant water status to define soil water thresholds for irrigation management of vegetable crops using soil moisture sensors. Agr. Water Manag. 2007, 88, 147–158. [Google Scholar] [CrossRef]
- Gallardo, M.; Thompson, R.B.; Fernández, M.D. Water requirements and irrigation management in Mediterranean greenhouses: The case of the southeast coast of Spain. In Good Agricultural Practices for Greenhouse Vegetable Crops. Principle for Mediterranean Climate Areas; FAO: Rome, Italy, 2017; pp. 109–136. [Google Scholar]
- Rodríguez, A.; Peña-Fleitas, M.T.; Padilla, F.M.; Gallardo, M.; Thompson, R.B. Petiole sap nitrate concentration to assess crop nitrogen status of greenhouse sweet pepper. Sci. Hortic. 2021, 285, 110157. [Google Scholar] [CrossRef]
- Peña-Fleitas, M.T.; Gallardo, M.; Thompson, R.B.; Farneselli, M.; Padilla, F.M. Assessing crop N status of fertigated vegetable crops using plant and soil monitoring techniques. Ann. Appl. Biol. 2015, 167, 387–405. [Google Scholar] [CrossRef] [PubMed]
- Peña-Fleitas, M.T.; Gallardo, M.; Padilla, F.M.; Rodríguez, A.; Thompson, R.B. Use of a portable rapid analysis system to measure nitrate concentration of nutrient and soil solution, and plant sap in greenhouse vegetable production. Agronomy 2021, 11, 819. [Google Scholar] [CrossRef]
- Peña-Fleitas, M.T.; Grasso, R.; Gallardo, M.; Padilla, F.M.; de Souza, R.; Rodríguez, A.; Thompson, R.B. Sample temperature affects measurement of nitrate with a rapid analysis ion selective electrode system used for N management of vegetable crops. Agronomy 2022, 12, 3031. [Google Scholar] [CrossRef]
- Fernández-Rodríguez, R.; Camacho-Ferre, F. Manual Práctico de Fertirrigación en Riego por Goteo: Sistemática de Resolución de Problemas, Ejemplos Resueltos, 2nd ed.; Ediciones Agrotécnicas: Madrid, Spain, 2013; p. 169. (In Spanish) [Google Scholar]
- Fernández, M.D.; López, J.C.; Baeza, E.; Céspedes, A.; Meca, D.E.; Bailey, B. Generation and evaluation of typical meteorological year datasets for greenhouse and external conditions on the Mediterranean coast. Int. J. Biometeorol. 2015, 59, 1067–1081. [Google Scholar] [CrossRef]
- Fernández, M.D.; Bonachela, S.; Orgaz, F.; Thompson, R.; López, J.C.; Granados, M.R.; Gallardo, M.; Fereres, E. Measurement and estimation of plastic greenhouse reference evapotranspiration in a Mediterranean climate. Irrig. Sci. 2010, 28, 497–509. [Google Scholar] [CrossRef]
- Hochmuth, G.J. Efficiency ranges for nitrate-nitrogen and potassium for vegetable petiole sap quick test. HortTechnology 1994, 4, 218–222. [Google Scholar] [CrossRef]
- Cadahia, C. La Savia Como Índice de Fertilización. Cultivos Agroenergéticos, Hortícolas, Frutales y Ornamentales; Ediciones Mundi-Prensa: Madrid, Spain, 2008; p. 254. (In Spanish) [Google Scholar]
- Red de Información Agroclimática de Andalucía (RIA). Available online: https://www.juntadeandalucia.es/agriculturaypesca/ifapa/riaweb/web/ (accessed on 5 July 2023).
- EU 790/2000. COMMISSION REGULATION (EC) No 790/2000 of 14 April 2000 Laying Down the Marketing Standard for Tomatoes (OJ L 95, 15.4.2000, p. 24). Available online: https://eur-lex.europa.eu/legal-content/EN/TXT/PDF/?uri=CELEX:02000R0790-20010701&from=MT (accessed on 10 October 2023).
- Grasso, R.; Peña-Fleitas, M.T.; de Souza, R.; Rodríguez, A.; Thompson, R.B.; Gallardo, M.; Padilla, F.M. Nitrogen effect on fruit quality and yield of muskmelon and sweet pepper cultivars. Agronomy 2022, 12, 2230. [Google Scholar] [CrossRef]
- Casas, A.; Casas, E. El Análisis de Suelo-Agua-Planta y su Aplicación en la Nutrición de los Cultivos Hortícolas en la Zona del Sureste Peninsular; Caja Rural de Almería: Almería, Spain, 1999; p. 249. (In Spanish) [Google Scholar]
- Rodríguez, A.; Peña-Fleitas, M.T.; Padilla, F.M.; Gallardo, M.; Thompson, R.B. Soil monitoring methods to assess immediately available soil N for fertigated sweet pepper. Agronomy 2020, 10, 2000. [Google Scholar] [CrossRef]
- Soto, F.; Gallardo, M.; Thompson, R.B.; Peña-Fleitas, T.; Padilla, F.M. Consideration of total available N supply reduces N fertilizer requirement and potential for nitrate leaching loss in tomato production. Agr. Ecosyst. Environ. 2015, 200, 62–70. [Google Scholar] [CrossRef]
- Rodríguez, A.; Peña-Fleitas, M.T.; Gallardo, M.; de Souza, R.; Padilla, F.M.; Thompson, R.B. Sweet pepper and nitrogen supply in greenhouse production: Critical nitrogen curve, agronomic responses and risk of nitrogen loss. Eur. J. Agron. 2020, 117, 126046. [Google Scholar] [CrossRef]
- Marschner, H. Mineral Nutrition of Higher Plants, 2nd ed.; Academic Press: San Diego, CA, USA, 2002; p. 889. [Google Scholar]
- Bonachela, S.; Fernández, M.D.; Cabrera-Corral, F.J.; Granados, M.R. Salt and irrigation management of soil-grown Mediterranean greenhouses tomato crops drip-irrigated with moderately saline water. Agric. Water Manage. 2022, 262, 107433. [Google Scholar] [CrossRef]
- Cabrera-Corral, F.J.; Bonachela, S.; Fernández, M.D.; Granados, M.R.; López, J.C. Lysimetry methods for monitoring soil solution electrical conductivity and nutrient concentration in greenhouse tomato crops. Agric. Water Manag. 2016, 178, 171–179. [Google Scholar] [CrossRef]
- López-Martín, M.; Thompson, R.B.; Giménez, C.; Gallardo, M. VegSyst-DSS Suite software to calculate nutrient solution composition in greenhouse soil-grown vegetable crops. Acta Hortic. in press.


| Soil Parameter | Initial Conditions | Soil Evaluation | Nutrient Application Factor (f1) |
|---|---|---|---|
| Texture | Sandy loam | Soil type 1 | |
| Total carbonates (%) | 12.9 | Adequate | |
| Organic matter (%) | 1.6 | Used in N balance | |
| N-NO3− (kg ha−1) | 33.4 | Used in N balance | |
| Available P (mg kg−1) | 100.5 | Very high | 0.2 |
| Exch. K (mg kg−1) | 271.5 | Medium | 1.2 |
| Exch. Ca (mg kg−1) | 1497.0 | Medium | 1.2 |
| Exch. Mg (mg kg−1) | 105.5 | Low | 1.8 |
| Total Values | CONV | PCM | PCM/CONV (%) |
|---|---|---|---|
| Irrigation (mm) | 348 | 265 | 75 |
| N (kg ha−1) | 539 | 325 | 60 |
| P (kg ha−1) | 159 | 24 | 15 |
| K (kg ha−1) | 843 | 478 | 57 |
| Ca (kg ha−1) | 604 | 257 | 42 |
| Mg (kg ha−1) | 137 | 83 | 60 |
| Seasonal average | |||
| [N] (mmol L−1) | 12.3 (12.9) | 9.5 (9.4) | |
| [P] (mmol L−1) | 1.5 (1.7) | 0.3 (0.3) | |
| [K] (mmol L−1) | 6.9 (7.6) | 5.2 (5.2) | |
| [Ca] (mmol L−1) | 4.7 (4.8) | 2.5 (2.1) | |
| [Mg] (mmol L−1) | 1.7 (2.0) | 1.3 (1.2) |
| Petiole Sap (mg L−1) | |||
|---|---|---|---|
| Conv | PCM | Significance | |
| NO3− | 4608 ± 76.7 | 3587 ± 92.0 | ** |
| HPO42− | 322 ± 10.1 | 181 ± 3.5 | *** |
| K+ | 4949 ± 119.1 | 5023 ± 23.1 | ns |
| Ca2+ | 2299 ± 20.8 | 2475 ± 26.6 | * |
| Mg 2+ | 487 ± 14.3 | 611 ± 8.2 | ** |
| Soil solution (mmol L−1) | |||
| NO3− | 16.5 ± 2.2 | 11.1 ± 3.0 | ** |
| K+ | 8.0 ± 2.1 | 3.9 ± 1.1 | ** |
| Ca2+ | 8.7 ± 1.2 | 5.4 ± 1.2 | ** |
| Mg2+ | 4.2 ± 0.7 | 3.1 ± 0.7 | ** |
| Treatment | Total Yield (kg m−2) | Marketable Yield (kg m−2) | Total Fruit Number (Fruits m−2) | Mean Fruit Weight (g) |
|---|---|---|---|---|
| CONV | 13.6 a | 12.3 a | 95.1 a | 143.3 a |
| PCM | 13.5 a | 12.5 a | 94.9 a | 142.0 a |
| Significance | ns | ns | ns | ns |
| Organoleptic Quality | External Quality | |||||||||
|---|---|---|---|---|---|---|---|---|---|---|
| Treatment | TSS (°Brix) | Titratable Acidity | pH | Fruit Firmness (N) | L * | a * | b * | H | C * | CI |
| CONV | 4.5 a | 0.43 a | 4.4 a | 3.9 a | 41.3 a | 16.4 a | 24 a | 0.97 a | 29.2 a | 17.1 a |
| PCM | 4.7 a | 0.41 a | 4.3 a | 3.9 a | 41.2 a | 17.4 a | 24 a | 0.94 a | 29.7 a | 17.9 a |
| Significance | ns | ns | ns | ns | ns | ns | ns | ns | ns | ns |
| Treatment | Irrigation (€ ha−1) | Fertilizer (kg) | Fertilizer (€ kg−1) | Fertilizer (€ ha−1) | |
|---|---|---|---|---|---|
| CONV | Irrigation | 1566 | |||
| Calcium nitrate | 151.0 | 0.73 | 1225 | ||
| Potassium nitrate | 52.0 | 1.47 | 850 | ||
| Monopotassium Phosphate | 30.5 | 2.76 | 934 | ||
| Potassium sulfate | 36.0 | 1.76 | 703 | ||
| Magnesium sulfate | 66.4 | 0.41 | 302 | ||
| Total | 4014 | ||||
| PCM | Irrigation | 1193 | |||
| Calcium nitrate | 64.6 | 0.73 | 524 | ||
| Potassium nitrate | 63.9 | 1.47 | 1044 | ||
| Monopotassium Phosphate | 7.3 | 2.76 | 223 | ||
| Potassium sulfate | 1.2 | 1.76 | 24 | ||
| Magnesium sulfate | 40.1 | 0.41 | 183 | ||
| Total | 1998 |
| Monitoring Component | Cost (€ ha−1) |
|---|---|
| Soil analysis | 99.2 |
| Leaf analysis | 73.8 |
| Sap analysis | 127.1 |
| Rapid analysis ISE (NO3− and K+) | 211.8 |
| Calibration standard | 266.2 |
| Total | 778.0 |
Disclaimer/Publisher’s Note: The statements, opinions and data contained in all publications are solely those of the individual author(s) and contributor(s) and not of MDPI and/or the editor(s). MDPI and/or the editor(s) disclaim responsibility for any injury to people or property resulting from any ideas, methods, instructions or products referred to in the content. |
© 2023 by the authors. Licensee MDPI, Basel, Switzerland. This article is an open access article distributed under the terms and conditions of the Creative Commons Attribution (CC BY) license (https://creativecommons.org/licenses/by/4.0/).
Share and Cite
Gallardo, M.; Peña-Fleitas, M.T.; Padilla, F.M.; Cedeño, J.; Thompson, R.B. Prescriptive-Corrective Irrigation and Macronutrient Management in Greenhouse Soil-Grown Tomato Using the VegSyst-DSS v2 Decision Support Tool. Horticulturae 2023, 9, 1128. https://doi.org/10.3390/horticulturae9101128
Gallardo M, Peña-Fleitas MT, Padilla FM, Cedeño J, Thompson RB. Prescriptive-Corrective Irrigation and Macronutrient Management in Greenhouse Soil-Grown Tomato Using the VegSyst-DSS v2 Decision Support Tool. Horticulturae. 2023; 9(10):1128. https://doi.org/10.3390/horticulturae9101128
Chicago/Turabian StyleGallardo, Marisa, M. Teresa Peña-Fleitas, Francisco M. Padilla, Juan Cedeño, and Rodney B. Thompson. 2023. "Prescriptive-Corrective Irrigation and Macronutrient Management in Greenhouse Soil-Grown Tomato Using the VegSyst-DSS v2 Decision Support Tool" Horticulturae 9, no. 10: 1128. https://doi.org/10.3390/horticulturae9101128