Article

Stepwise Optimization of the RT-qPCR Protocol and the Evaluation of Housekeeping Genes in Pears (Pyrus bretschneideri) under Various Hormone Treatments and Stresses

1
College of Horticulture, Shanxi Agricultural University, Taigu 030801, China
2
Shijiazhuang Institute of Fruit Trees, Hebei Academy of Agriculture and Forestry, Shijiazhuang 050061, China
*
Author to whom correspondence should be addressed.
Horticulturae 2023, 9(2), 275; https://doi.org/10.3390/horticulturae9020275
Submission received: 10 January 2023 / Revised: 3 February 2023 / Accepted: 4 February 2023 / Published: 17 February 2023

Abstract

:
Real-time quantitative PCR (RT-qPCR) has become a widely used method for exploring plant gene expression level. The method requires using some stably expressed genes as a reference to accurately normalize the RT-qPCR data. However, under various stresses and hormone treatments, the levels of most reference genes vary. Environmental variations also influence their expression levels. The lack of validated, stably expressed reference genes can mislead the study of gene function in pears. “Huangguan” pears have recently become the focus of research on stress resistance mechanisms, such as high resistance. Therefore, the aim of this study was to select the optimal reference genes in Huangguan pears, and we analyzed the expression of the genes EF1α, ACT, SKD1, YLS8, UBQ, GAPDH, TUB, and WDP in a series of pear leaf sets under various stresses and hormone treatments. Using different statistical algorithms, we found that under various treatments, the WDP gene had more stable expression, ACT was the most stable under MeJA treatment, YLS8 was the most valuable reference gene under ABA hormone and heat stress conditions, and GAPDH showed worst results compared to other housekeeping genes, except under heat stress. These results will supply valuable and updated information for the selection of housekeeping genes in pears under biotic and abiotic stresses in the future.

1. Introduction

Pears are one of the most nutritious fruits in the world, providing fiber which is beneficial to human health [1]. Approximately 39 billion tons of pears are delivered across the world every year. Huangguan pear (Pyrus bretschneideri Rehd. cv. Huangguan) is a highly resistant new cultivar widely planted in northern China [2]. In nature, biotic and abiotic environmental stresses are critical factors responsible for decreasing fruit quality and yield and increasing tree losses and production costs. Attacks by pests and pathogen with a wide range of infection strategies have caused serious diseases in pears. To make matters worse, their virulence mechanisms constantly evolve to enable them to adapt to their hosts. This makes it challenging to develop effective and long-term control measures [3]. Abiotic stresses, including drought [4], cold [5], and salt [6], negatively affect, for example, the growth, development, and productivity of pears, while biotic stresses, such as pathogens [7] and insects [8], often lead to diseases and damage the crops. Pear scab disease, as a biotic stress, is a devastating disease caused by Venturia nashicola in Asian countries [9]. It often leads to enormous economic losses for the pear industry [10]. Phytohormones are key regulators of every aspect of a plant’s life cycle [11], including growth, defense, and death. Hormones such as abscisic acid (ABA) [12], ethylene (ETH) [13,14], salicylic acid (SA) [15], and methyl jasmonate (MeJA) [16] are usually associated with plants experiencing biotic and abiotic stresses. Hence, hormones are also used as experimental treatments in the research on defense-related gene expression to explore the mechanisms of metabolic regulation and plant pathogen resistance.
To explore the molecular theory of stress resistance in pears, RT-qPCR has become a powerful and widely used method for analyzing and quantifying the related gene expression levels [17]. Before normalizing the RT-qPCR data, the stability of the reference genes under study must be tested. The ideal reference gene is one that is consistently and steadily expressed in all tissues under various conditions. Commonly used reference genes in plant research are the housekeeping genes, such as ACT (actin), UBQ (ubiquitin), EF1α (elongation factor 1 alpha), and GAPDH (glyceraldehyde-3-phosphate dehydrogenase) [18,19]. However, they have a relatively stable expression only in some conditions in plants, and no single gene is consistently expressed under all kinds of stressful conditions [20]. In previous studies on pears, reference genes PbGAPDHc1 and PbGAPDHc2 were found to be more suitable than others for Yali (Pyrus bretschneideri) pears [21]. TUB (tubulin) and WDP (WD-repeat protein) were suitable reference genes in Dangsansu (Pyrus bretschneideri) pear leaves studied under cold conditions, while UBQ was expressed stably under the stresses of heat and salinity [22]. However, to the best of our knowledge, under biotic conditions, the expression of reference genes in pears is still uncertain and no invariable internal control gene has been reported in tissue stems cultured in an MS medium. Obviously, the lack of validated stably expressed reference genes affects the judgment of the functional study of genes.
In this study, we screened and selected the commonly used housekeeping genes, including EF1α [23], ACT, SKD1 (suppressor of K+ transport growth defect) [24], YLS8 (thioredoxin-like protein) [25], UBQ [26], and GAPDH [27]. In our previous study, TUB and WDP were expressed stably in the transcriptome sequencing of Huangguan after being subjected to V. nashicola. The above-mentioned genes are often constitutively expressed and are required for basic cellular functions. We exposed Huangguan leaves to various experimental treatments; for instance, heat, cold, water deficiency, salinity, ABA, ETH, and pathogens. Considering that gene expression levels can correspondingly change under different conditions, each reference gene should be experimentally tested. This work represents the first effort for selecting optimal reference genes for pear tissue stems cultured under biotic and abiotic stresses. The accuracy of RT-qPCR results greatly improved after the selection of the validated candidate reference genes. Our aim was to find the most stable reference gene under all the above-mentioned conditions.

2. Materials and Methods

2.1. Plant Materials and Treatments

Huangguan pears were grafted on a three-year-old duli pear tree (2021 stock) cultivated in the orchard of the College of Horticulture, Shanxi Agricultural University (Jinzhong, China). The pear scab pathogen, V. nashicola, was cultivated at 22 °C in darkness in a growth chamber at the College of Horticulture at Shanxi Agricultural University. In 2022, the 3rd to 5th leaves from the one-year-old shoots were collected for further use. In the experiments, six different treatments were used: (1) foliar spray with the MeJA solution (0.1 mM); (2) foliar spray with the SA solution (0.1 mM); (3) foliar spray with the ABA solution (0.1 mM); (4) foliar spray with the ETH solution (0.1 mM); (5) smear inoculation of leaves using pear scab spore suspension (for the biotic stress treatment of leaves, the pathogen V. nashicola was washed with sterile distilled water and a spore suspension was prepared at a concentration of 1.0 × 10⁵ CFU/mL); (6) and sterile distilled water (control). Three healthy shoots were used for replication. For each treatment, three biological replications were used. The sampled leaves were collected at 0, 12, 24, and 48 h post-treatment (hpt), instantly frozen in liquid nitrogen, and stored at −80 °C until further processing.
Abiotic stress assays were carried out with Huangguan leaves from buds regenerated in vitro. The tissue culture and the regeneration system of Huangguan were established as before [28]. One-year-old shoots were selected and cut into sections. Each section with a bud was sterilized for 90 s in 75% alcohol, followed by 8–10 min of periodic agitation in 0.1% HgCl2. After sterilization, the materials were rinsed with sterilized water three times. Disinfected sections were placed on culture media containing the complete Murashige and Skoog (MS) medium with vitamins (Coolabor, Beijing, China), 6-BA (2 mg/L), and indole butyric acid (IBA) (0.5 mg/L). After buds sprouted, tissue culture stems were transferred to new MS media. The medium plus 40% (w/v) polyethylene glycol (PEG6000) simulated water-deficit stress, while the medium plus 400 mM NaCl simulated salinity stress. The sections were placed in treatments simulating 40 °C and 4 °C hot and cold stress, respectively. The controls grew at 23 ± 2 °C under cool white fluorescent lamps, which provided light in a 16 h photoperiod of 110 μmol/m2 s. At 0, 48, and 96 hpt, the leaves of three replication shoots were collected and frozen in liquid nitrogen. A total of three biological replications were prepared for further research.

2.2. RNA Isolation and cDNA Synthesis

Total RNA was extracted from leaves using the CTAB-LiCl method [29], and the optical density (OD) was measured with a NanoDrop ND-1000 spectrophotometer using a UV spectrophotometer (Themo, USA) and gel electrophoresis. After running the RNA on an agarose gel, we used the RNA with an OD260/OD280 ratio between 1.8 and 2.0, an OD260/OD230 ratio greater than 2.0, and clear bands for 28S and 18S for cDNA synthesis. Subsequently, cDNA was synthesized following the instructions of the PrimeScript™ RT reagent Kit with gDNA Eraser (Perfect Real Time) kit (TaKaRa, Dalian, China). The resulting cDNA was stored at −20 °C.

2.3. Verification of Candidate Reference Genes

As previously reported, 8 candidate reference genes were selected and the primers were redesigned in primer-BLAST (https://www.ncbi.nlm.nih.gov/tools/primer-blast/index.cgi?LINK_LOC=BlastHome (accessed on 6 November 2021)) as per the following criteria: primer length 17–20 bp and GC content 40–60% (Table S1). All primers were synthesized by Sangon Biotech Co., Ltd. (Shanghai, China). Gel electrophoresis was used to confirm one PCR product per primer pair. Then, the PCR products were purified using the QIAquick Gel Extraction Kit (Qiagen, Hilden, North Rhine-Westphalia, Germany) and linked to pMD19-T (TaKaRa) transformed in DH5α Coli. Each clone of a gene was sequenced in Sangon Company. The accuracy of the sequences of candidate reference genes as query sequences was confirmed against pear genomes using BLASTN and BLASTX in NCBI (https://www.ncbi.nlm.nih.gov/ (accessed on 6 November 2021)).

2.4. Optimization of qPCR Conditions

As demonstrated by Zhao [3], qPCR conditions, such as different annealing temperatures (56, 58, 60, and 62 °C) and different primer concentrations (250, 300, 350, and 400 mM), were optimized for each factor. In each instance, the optimal factor was the one that had the lowest Cq value. Then, we used the optimal annealing temperature and the primer concentration for each primer pair and serial dilutions of the cDNA (1:10, 1:20, 1:40, 1:80, and 1:160 dilutions) to obtain the standard cDNA concentration curve on a logarithmic scale. For each primer, we calculated the standard curve and the PCR efficiency (E, %). We plotted the averaged Cq values from three technical replicates against lg (cDNA ng/reaction), as the initial cDNA concentration could be calculated by dividing 1000 ng of RNA by 10 µL of cDNA (i.e., 100 ng/µL) and the serially diluted cDNA (1:10, 1:20, 1:40, 1:80, and 1:160 dilutions) could be 10, 5, 2.5, 1.25, and 0.625 ng/µL. The correlation coefficients (R2) and the standard curves equations of 8 candidate reference genes in pear leaves were calculated in Excel (Microsoft Office 2010). The amplification efficiencies (E) were calculated as E% = (10−1/A − 1) × 100 using the slopes of the standard curves. Only primers with an amplification efficiency near 100% and a correlation coefficient (R2) > 0.99 were used for further RT-qPCR amplification.

2.5. RT-qPCR and Data Analyses

For each qPCR reaction, we used a PCR reaction volume of 10 µL, which contained 5 µL of Green qPCR MasterMix (Biomed, China), 0.3 µL of each pair of primers, 1 µL of diluted cDNA, and 3.4 µL of ddH2O. The cycling protocol was used as follows: 2 min at 95 °C followed by 40 rounds of 15 s at an annealing temperature of 95 °C and 40 rounds of 30 s at an annealing temperature of 60 °C. To verify the specificity of primer amplification, we generated a melting curve (95 °C for 10 s, 65 °C for 60 s and, 97 °C for 1 s). To monitor possible sampling error and experimental error, we used three biological replicates, with three technical replicates for each sample. When the programs were completed, we immediately calculated background-corrected fluorescence data and quantification cycle (Cq) values using LightCycler ®96 instrument software version 1.1.0.1320.
To assess and rank the feasibility of candidate reference genes, we analyzed the Cq of RT-qPCR in the web tool RefFinder (http://blooge.cn/RefFinder/ (accessed on 6 November 2021)) using GeNorm, NormFinder, and BestKeeper [30]. The outcome values indicated the stability of the reference genes. Using GeNorm (https://seqyuan.shinyapps.io/seqyuan_prosper (accessed on 6 November 2021)) [31], we ranked candidate genes according to their expression stability by calculating the M-values. The default value of Vn/n+1 was 0.15, which was slightly adjustable. If Vn/n+1 was no greater than 0.15, the optimal number of reference genes was n, indicating that the use of n most stable candidate genes as the reference genes is adequate for ensuring the accurate normalization of RT-qPCR data and the addition of one more candidate gene will not make a significant difference. Finally, we used RefFinder to obtain a comprehensive stability ranking of all the candidate reference genes.

2.6. Validation of Housekeeping Genes

A typical event in plants under abiotic and biotic stresses is a burst of reactive oxygen species (ROS), leading to a hypersensitive response and programmed cell death [32]. Plant NADPH oxidase, well known as a respiratory burst oxidase homolog (RBOH), mainly catalyzes the production of ROS [33]. Most plants have been found to respond to hormone and abiotic stresses [34,35]. Thus, to validate the reliability of the selected reference genes, we selected and investigated the expression levels of PbRBOHC(Pbr038667.1) as an object gene under various experimental conditions. For each stress, the relatively best and worst reference genes were selected for the experimental condition comparison study. The relative expression level of each housekeeping gene was calculated using the formula L = 2 C q .

2.7. Statics Analysis

We acquired raw fluorescence Cq values from qPCR experiments and analyzed them in Excel (Microsoft Office 2010). We created the figures in Origin 9.0 software. For each biological replicate of each tissue sample, we calculated the average Cq value of the three technical replicates. We calculated the coefficient of variation (CV, %) of the Cq values of each candidate gene for different samples individually and in combination. In addition, we calculated the correlation coefficients (R2) and the standard curves equations of the 8 candidate reference genes in pear leaves in Excel (Microsoft Office 2010).

3. Results

3.1. Assessment of Primer Specificity and PCR Amplification Efficiency

We selected eight common reference genes ACT, SKD1, YLS8, WDP, TUB, UBQ, GAPDH, and EF1α and then redesigned specific primers using PCR amplicons of similar lengths (Table S1). Agarose gel electrophoresis showed a single band of the expected size (Figure S1). After sequencing, we compared the candidate reference genes in NCBI and confirmed the accuracy of these sequences. The cDNA sequences with redesigned primers of the candidate reference genes were consistent with their homologous sequences in pears. Afterward, we optimized the annealing temperature, the primer concentration, and the optimal template cDNA concentration range for each gene (Table S1). The melt curves of the eight candidate reference genes showed a single peak in each case, representing the specific primers (Figure S2). Under optimal steps, cDNA templates of the same leaf at dilutions of 1:10, 1:20, 1:40, 1:80, and 1:160 were subjected to qPCR and the standard concentration curve at a logarithmic scale was obtained for each primer pair. The standard curves equations of different reference genes were successfully calculated; the correlation coefficients (R2) varied between 0.9949 and 0.9999. The amplification efficiencies (E) were calculated as E% = (10−1/A − 1) × 100 using the slopes (A) of the standard curves and maintained at 100 ± 10% (Table 1; Figure S3).

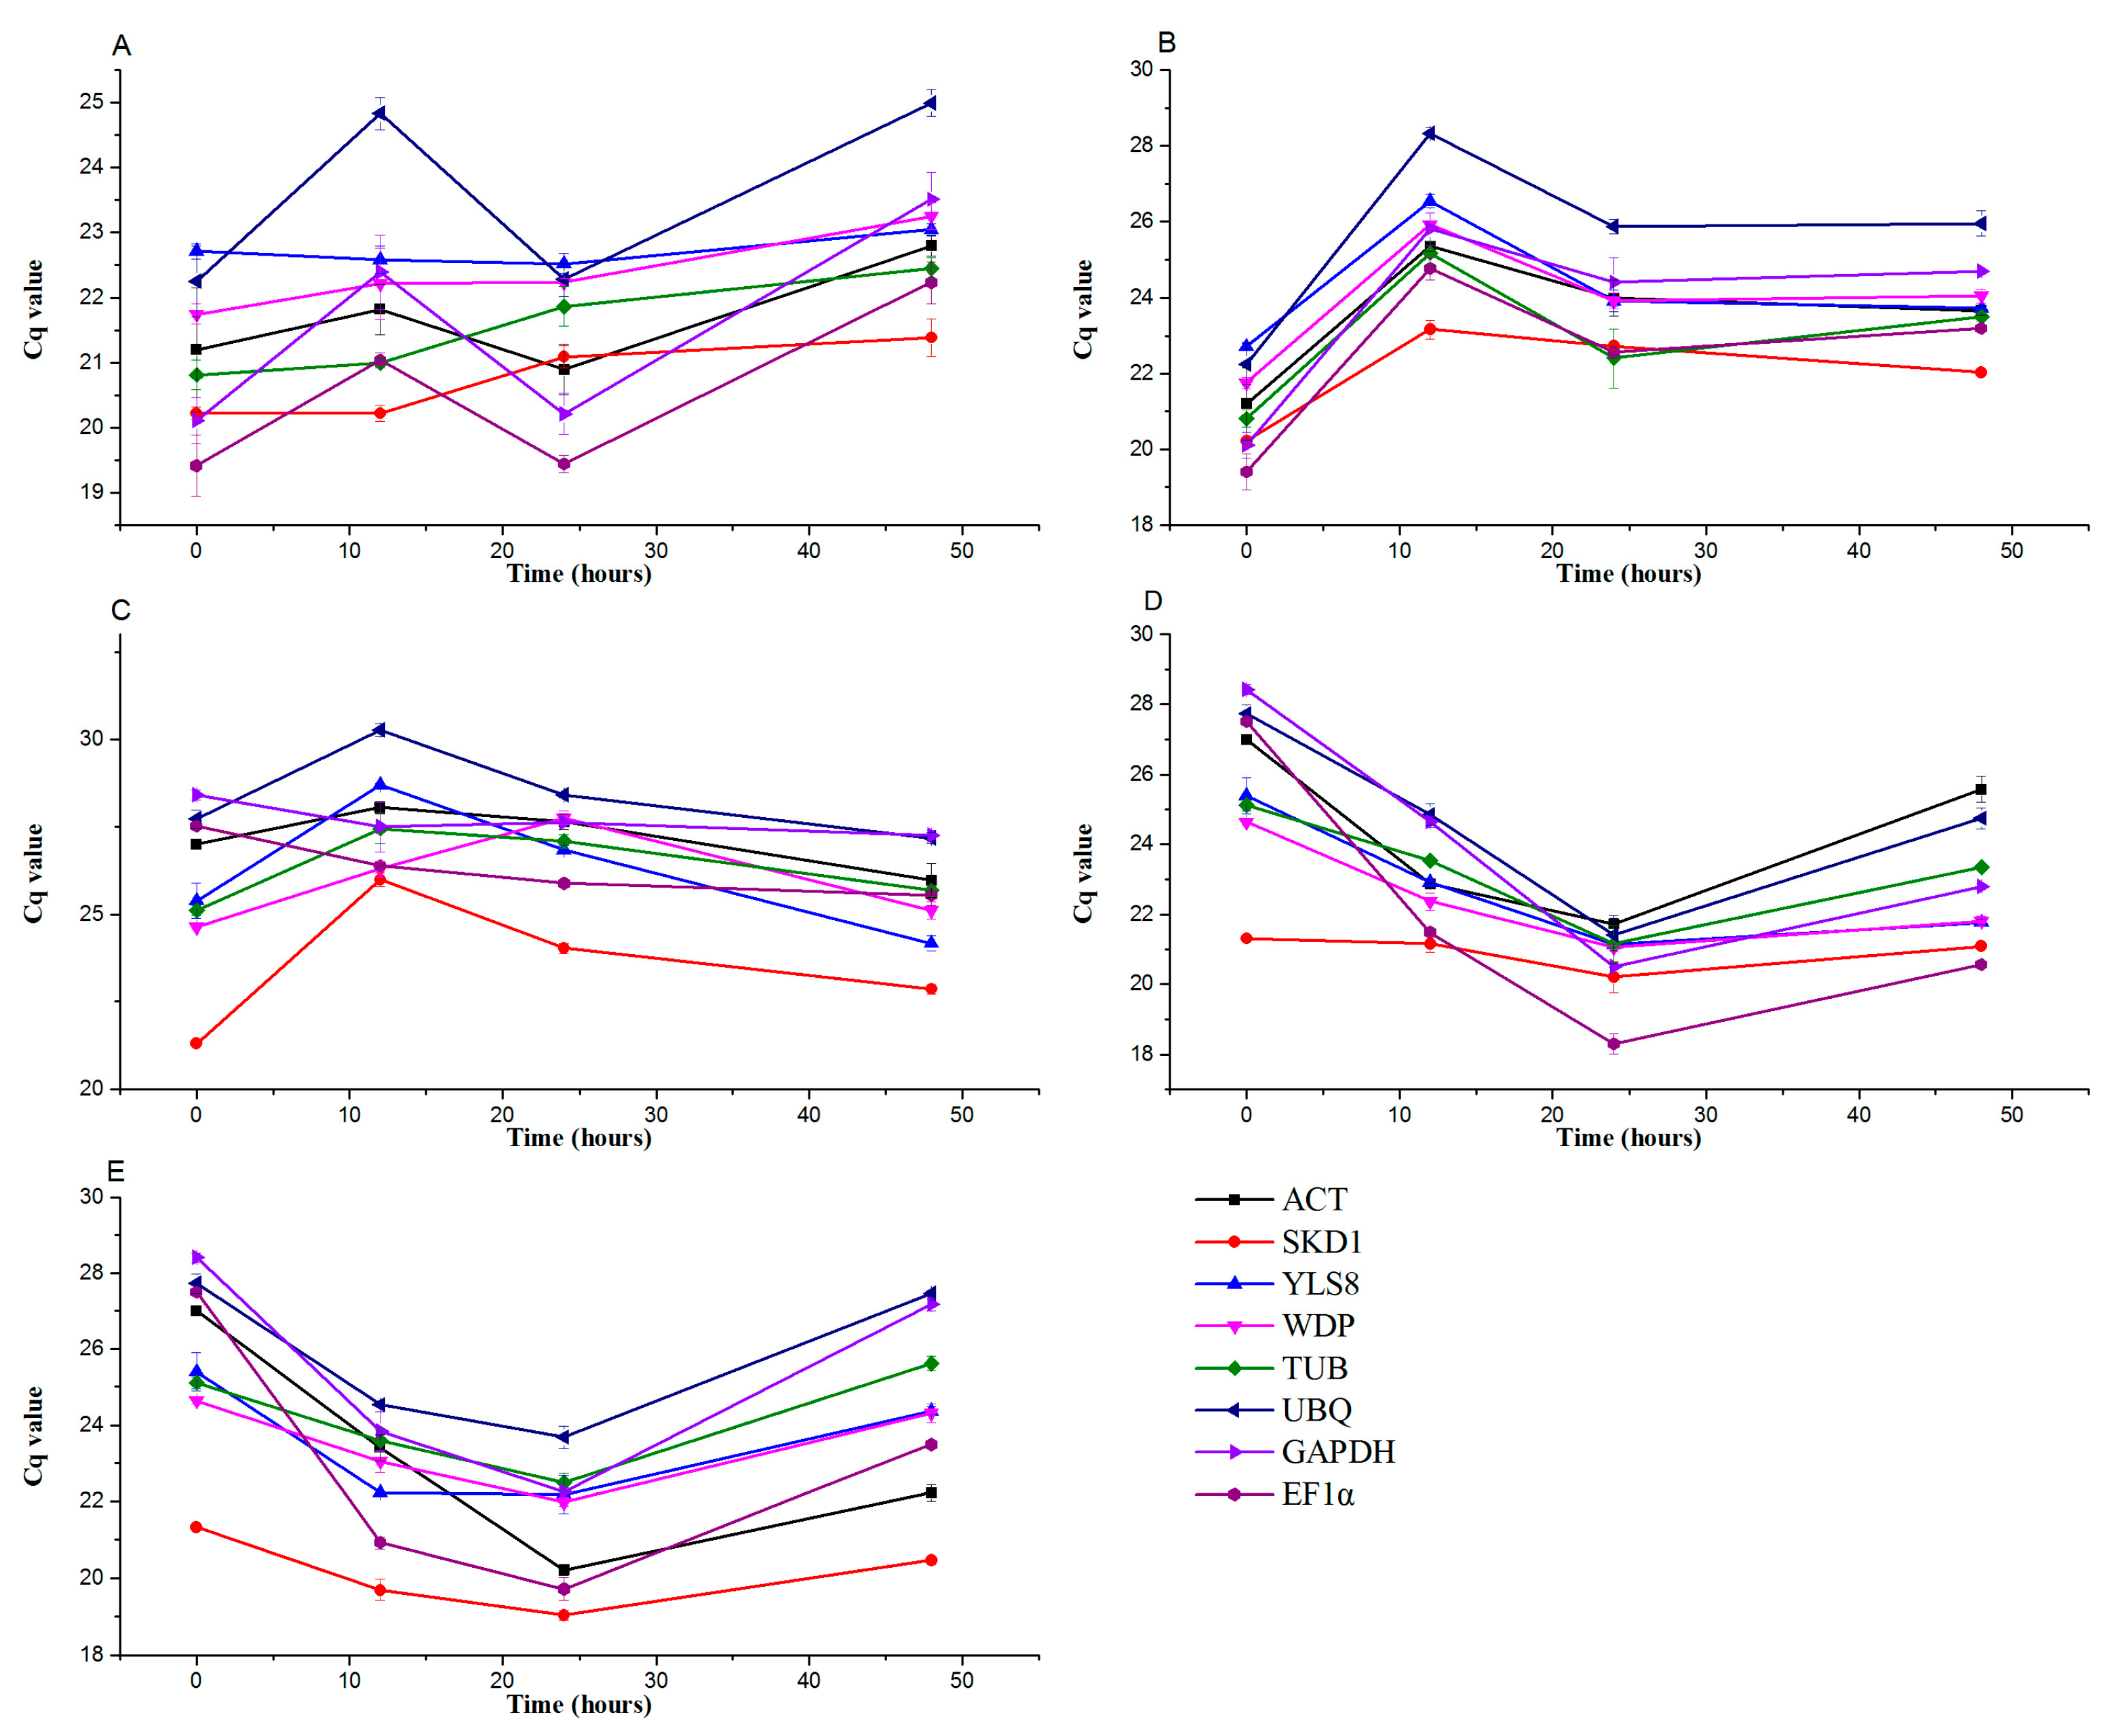
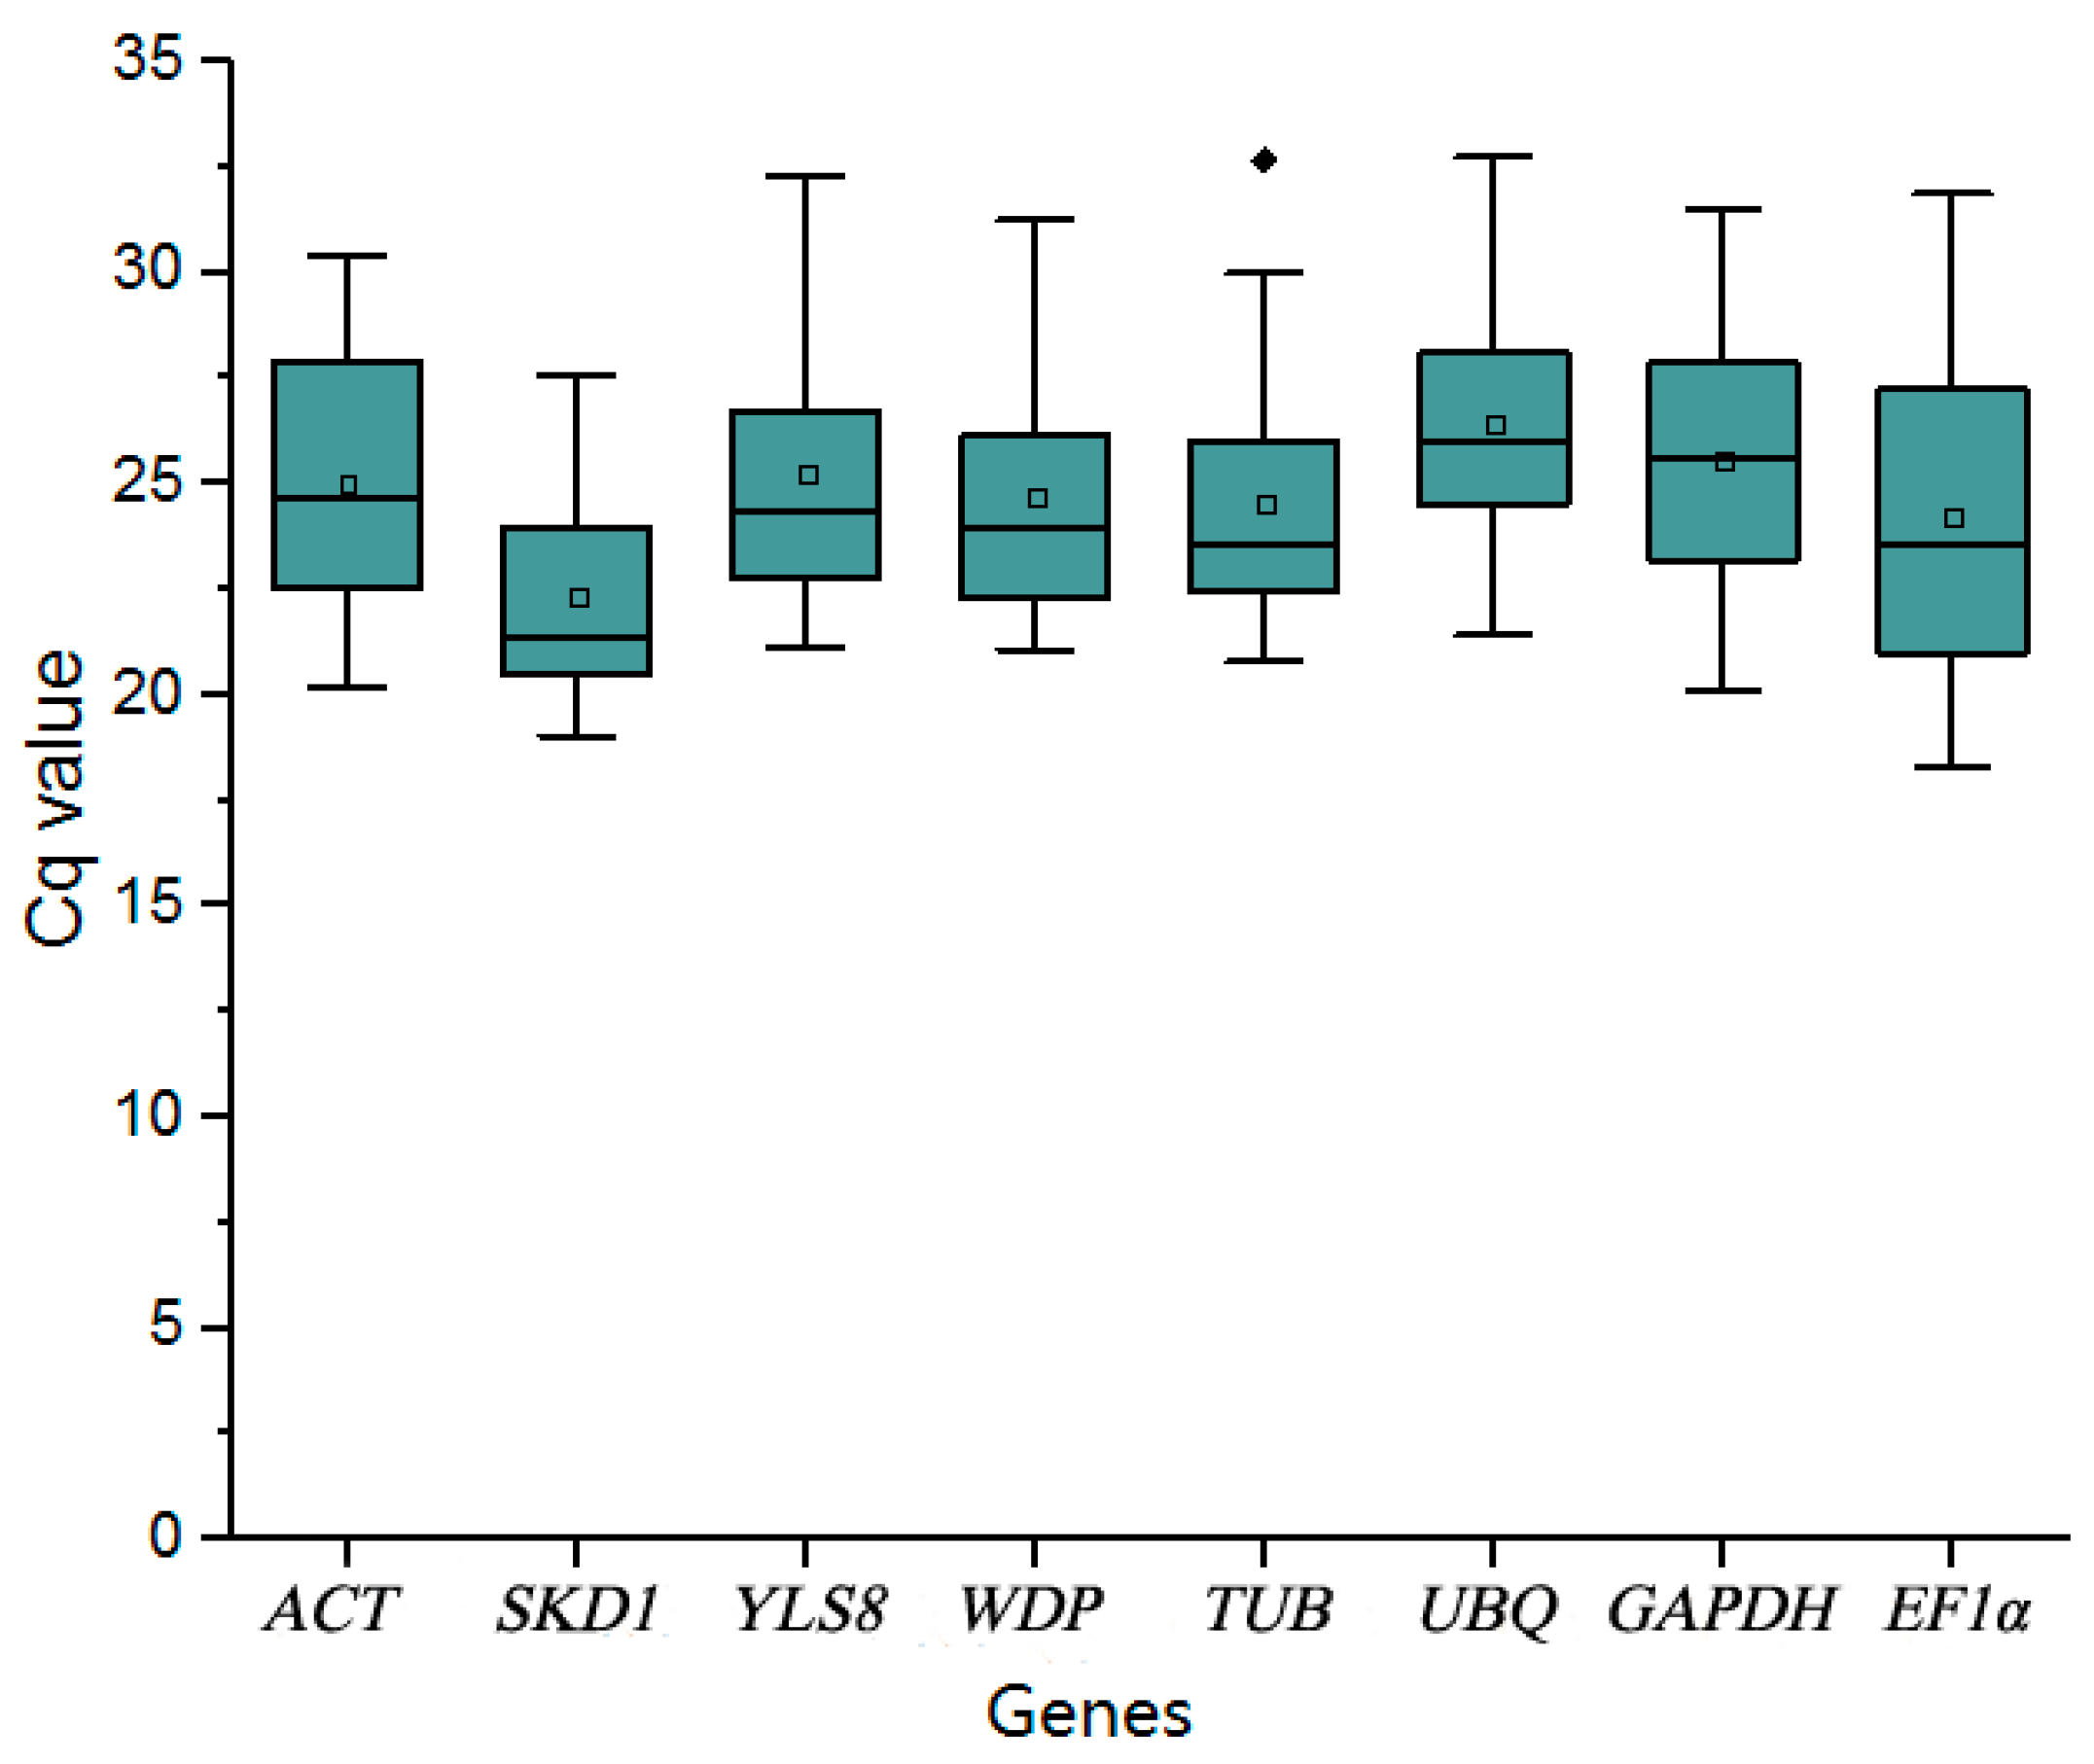
3.2. Transcript Abundance of the Eight Candidate Reference Genes in Pears under Hormone Treatments

Time–course analysis of the average quantification cycle (Cq) values for each gene under different hormone treatments at 0–48 hpt ranged from 20.12 to 28.40 (Figure 1; Table S2). The coefficients of variation (CVs, %) of the Cq values of the eight genes (Table S2) at the same time points were ranked as YLS8(1.02) < WDP(2.85) < SKD1(2.89) < TUB(3.55) < ACT(3.88) < UBQ(6.49) < EF1α(6.65) < GAPDH(7.78), indicating that YLS8 had the most stable transcript abundance under mock treatment (Table S2). Under stress caused by SA/ETH/ABA hormones, SKD1 (5.88/2.37/4.89) had the most stable transcript abundance, while GAPDH (1.80) had more stable expression than the others under MeJA hormone treatment.

3.3. Analysis of the Expression Stability of Reference Genes under Hormone Treatments

It was critical to analyze the expression stability of the candidate reference genes under different experimental conditions using statistical algorithms. We used BestKeeper, NormFinder, and GeNorm for the analysis.

3.3.1. BestKeeper Analysis

BestKeeper calculates the index value from the geometric mean of the Cq of each gene. It performs a Pearson correlation of each reference gene with the BestKeeper index to indicate the correlation of that gene with the index [36]. In BestKeeper, the smaller the values of the SD and the coefficient of variation, the higher the expression stability. In this study, if the SD of a particular gene was >1, it was excluded from the list of candidate reference genes and thus BestKeeper identified five stable reference genes among the eight under mock treatment. Only SKD1 gene had a stable expression under SA, ETH, and ABA hormone treatment, and GAPDH was the most stable reference gene under MeJA treatment (Table 2).

3.3.2. NormFinder Analysis

For each candidate gene, NormFinder can provide a stability value that is a direct measurement of expression variation [37]. The most stably expressed gene had the smallest value. Hence, ACT had the most stable expression under mock and ABA treatments. Specifically, ACT ranked among the top three stable reference genes under other hormone treatments. Under SA, MeJA, and ETH hormone treatments, WDP, TUB, and UBQ were the most stably expressed genes, respectively (Table 2).

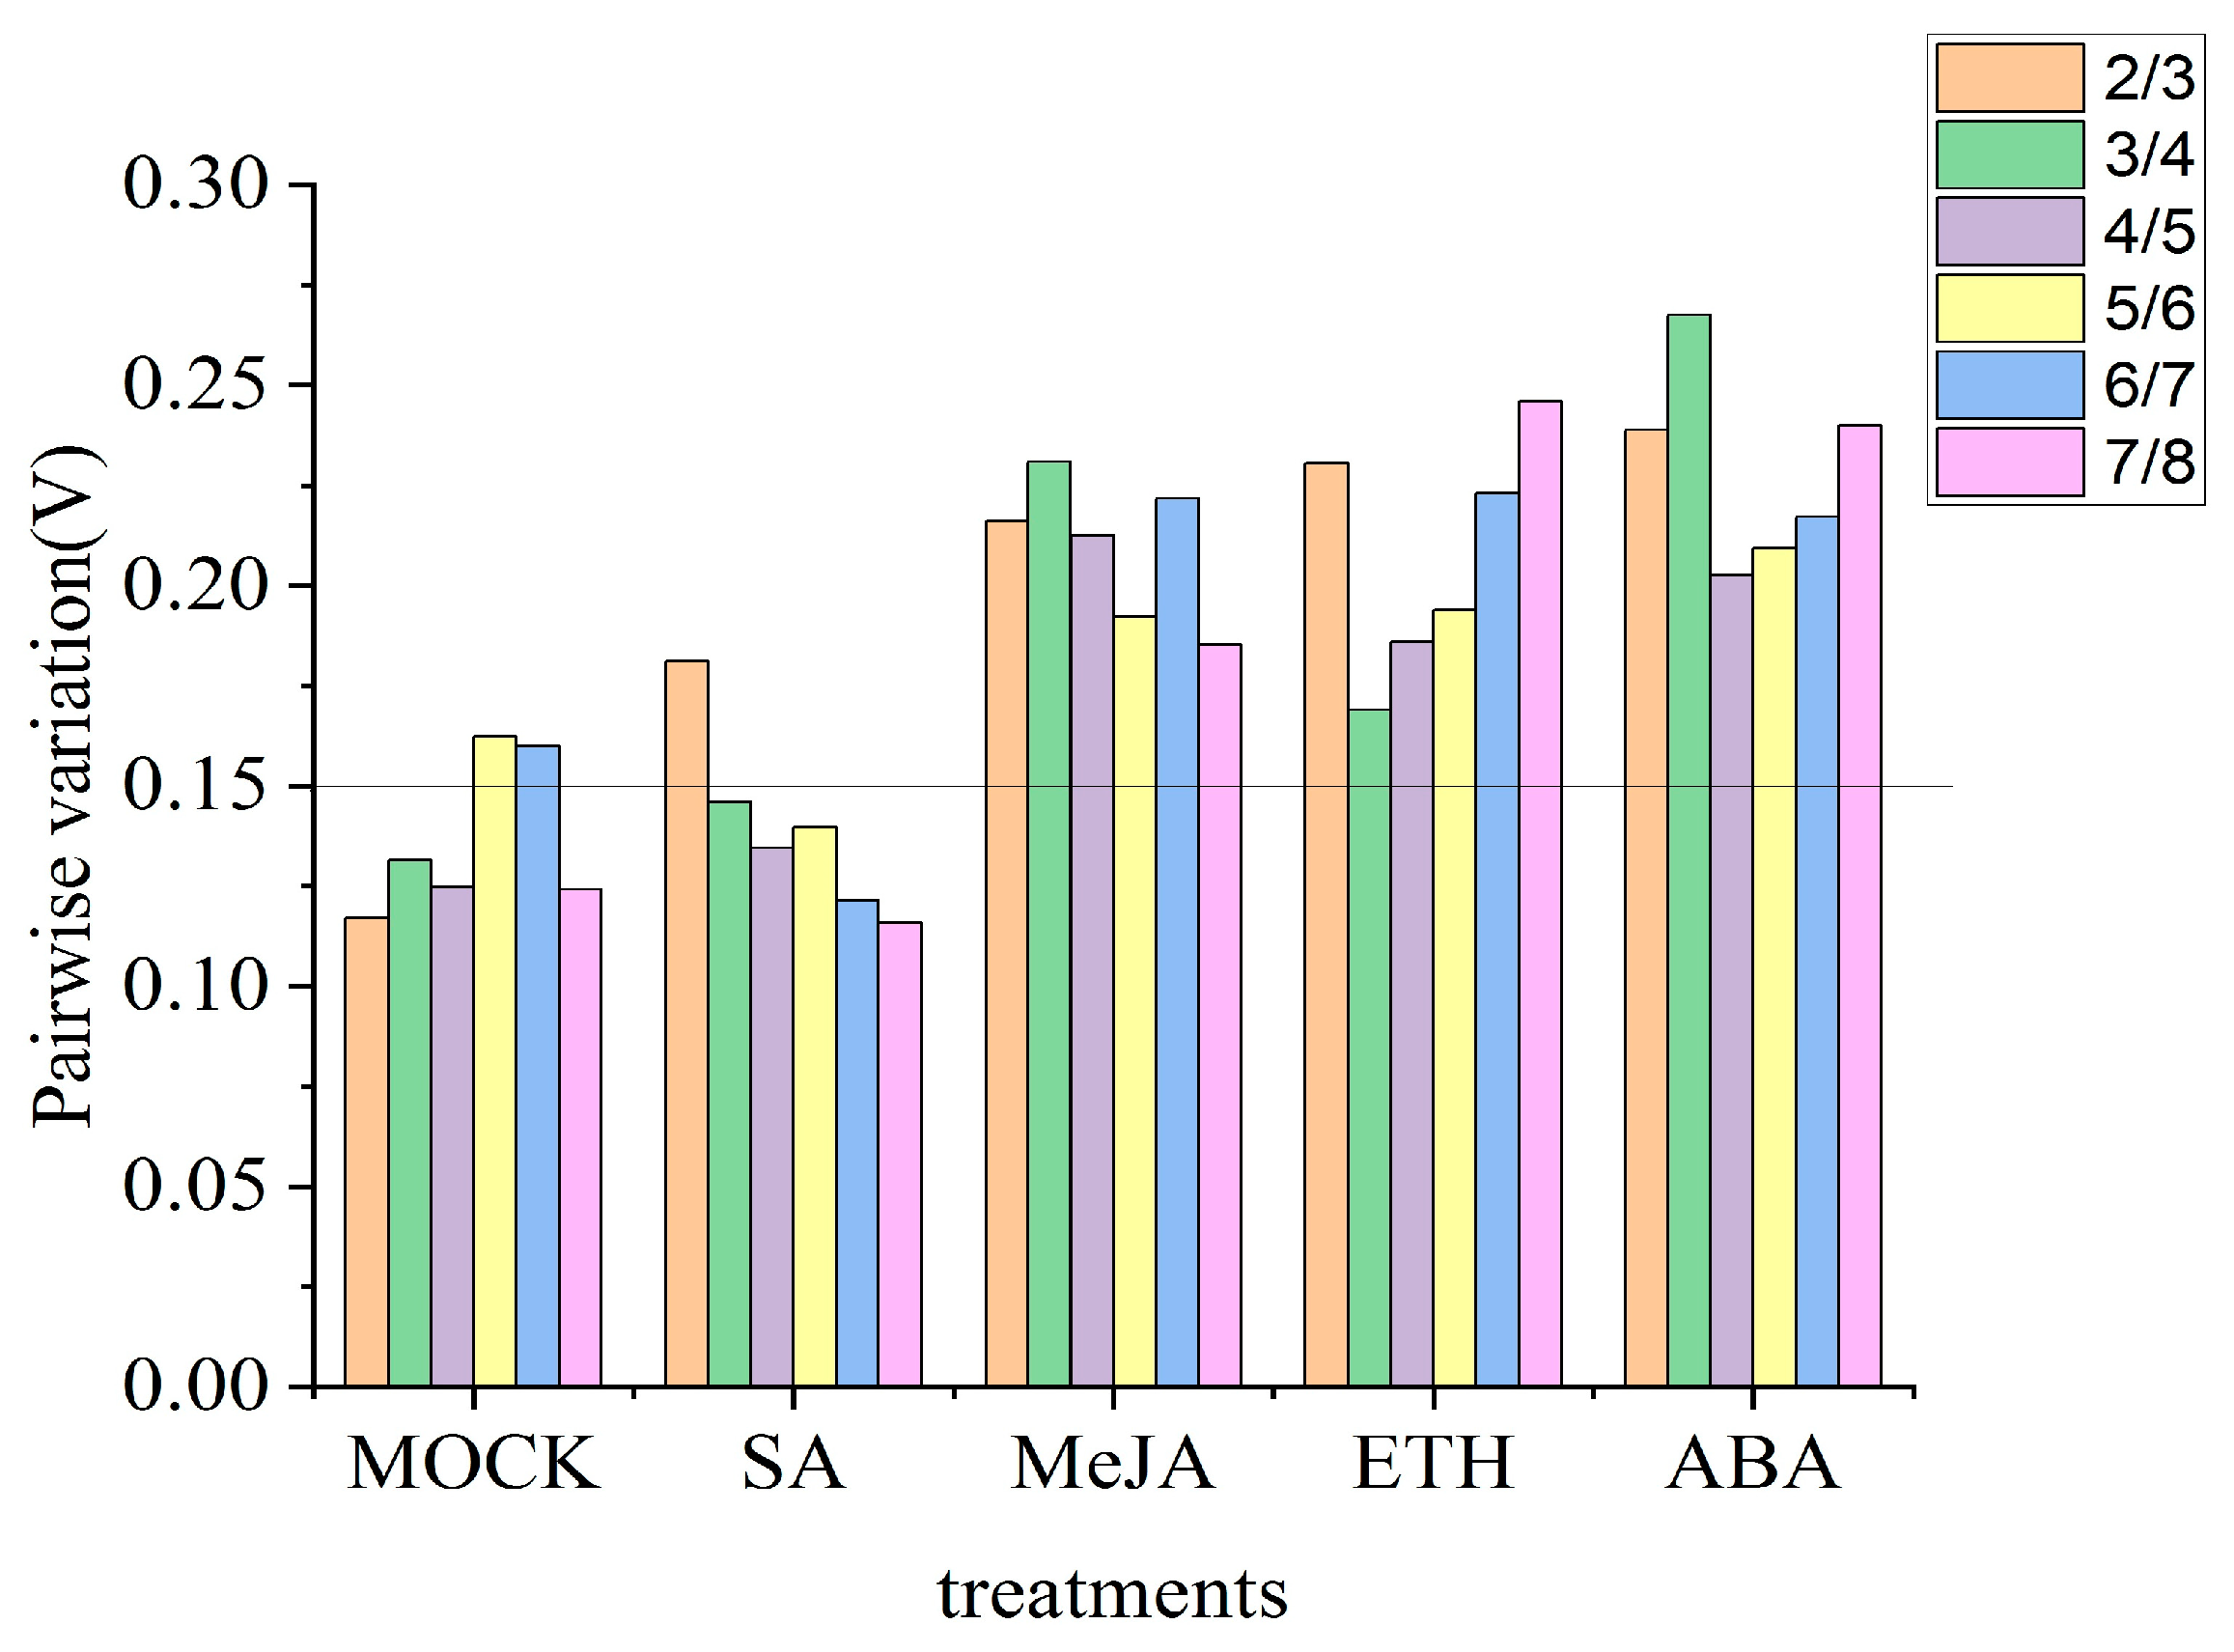
3.3.3. GeNorm Analysis

As per GeNorm analysis, the cut-off range of stability value is less than 0.5 [38]. So, in terms of gene expression, the gene with the lowest value is considered to be the most stable reference gene and vice versa. As per GeNorm analysis, SKD1 and TUB were the most stably expressed genes under mock treatment, ACT and WDP were the most stably expressed genes under SA treatment, ACT and UBQ were the most stably expressed genes under MeJA treatment, WDP and TUB were the most stably expressed genes under ETH treatment, and YLS8 and WDP were the most stably expressed genes under ABA treatment (Table 2). Meanwhile, the number of reference genes used for qPCR analysis relied on the value of Vn/n+1 (n ≥ 2) (Figure 2). When the value of Vn/n+1 was less than 0.15, the optimal number of reference genes was n. Therefore, under mock treatment, the value of V2/3 was lower than the default threshold of 0.15. So, the use of the two most stably expressed reference genes SKD1 and TUB ensured accurate normalization of qPCR data. Adding one more reference gene did not make a significant difference. Since the value of V3/4 (0.146) under SA treatment was lower than 0.15, it was practical to use three reference genes (ACT, WDS, and TUB) in qPCR. Although the values of all Vn/n+1 were higher than the default value under MeJA, ETH, and ABA treatments, this did not indicate the number of reference genes used for normalization in RT-qPCR analysis.

3.3.4. RefFinder Analysis

Slight differences in the analysis results of the three software programs are clearly visible. The results were confirmed using the web-based tool RefFinder, which compared and re-ranked the tested reference genes on the basis of the geometric mean of the weights of the three software programs. As per the comprehensive ranking performed by RefFinder, the stability rankings of the genes under mock treatment were WDP > ACT > TUB > SKD1 > YLS8 > EF1α > UBQ > GAPDH, and the stability rankings of the genes under each hormone treatment were as follows: WDP > ACT > EF1α > TUB > SKD1 > UBQ > YLS8 > GAPDH under SA treatment; ACT > TUB > UBQ > GAPDH > YLS8 > WDP > EF1α > SKD1 under MeJA treatment; UBQ > WDP > YLS8 > TUB > ACT > SKD1 > GAPDH > EF1α under ETH treatment; and YLS8 > WDP > ACT > TUB > UBQ > SKD1 > GAPDH > EF1α under ABA treatment (Table 3). To sum up, WDP and ACT exhibited the best stability under hormone treatments for normalization in qPCR.

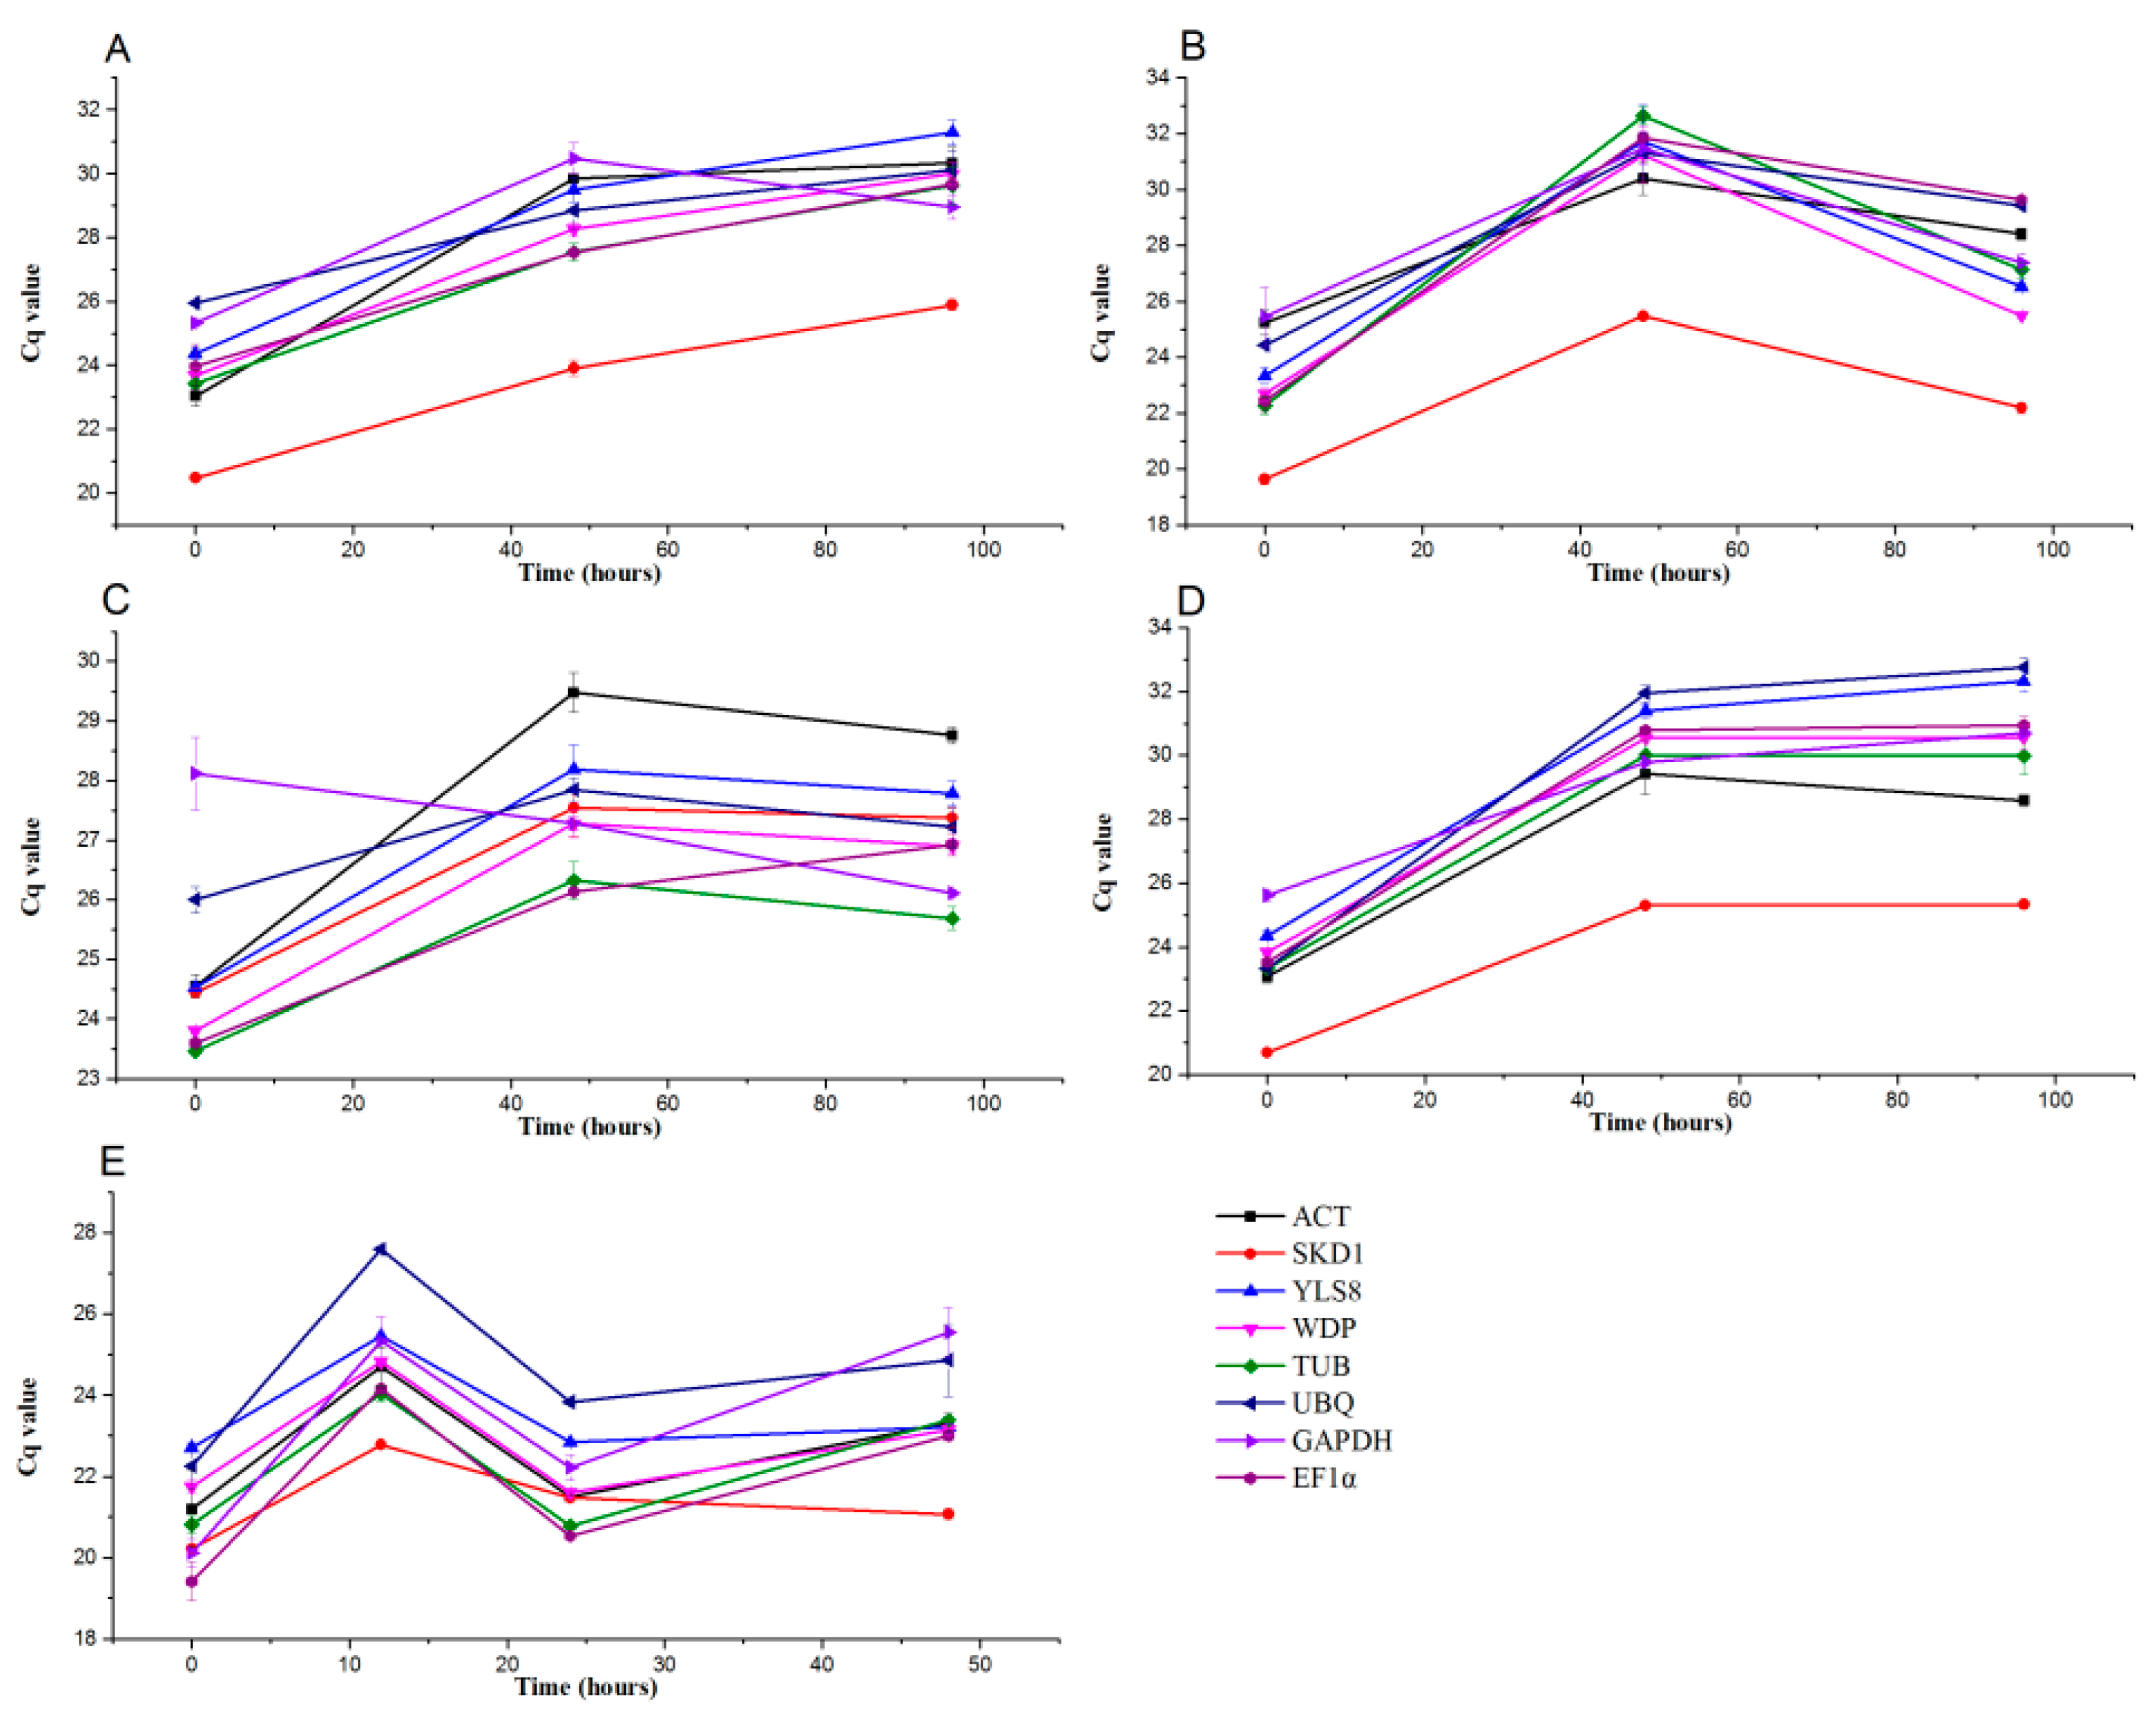
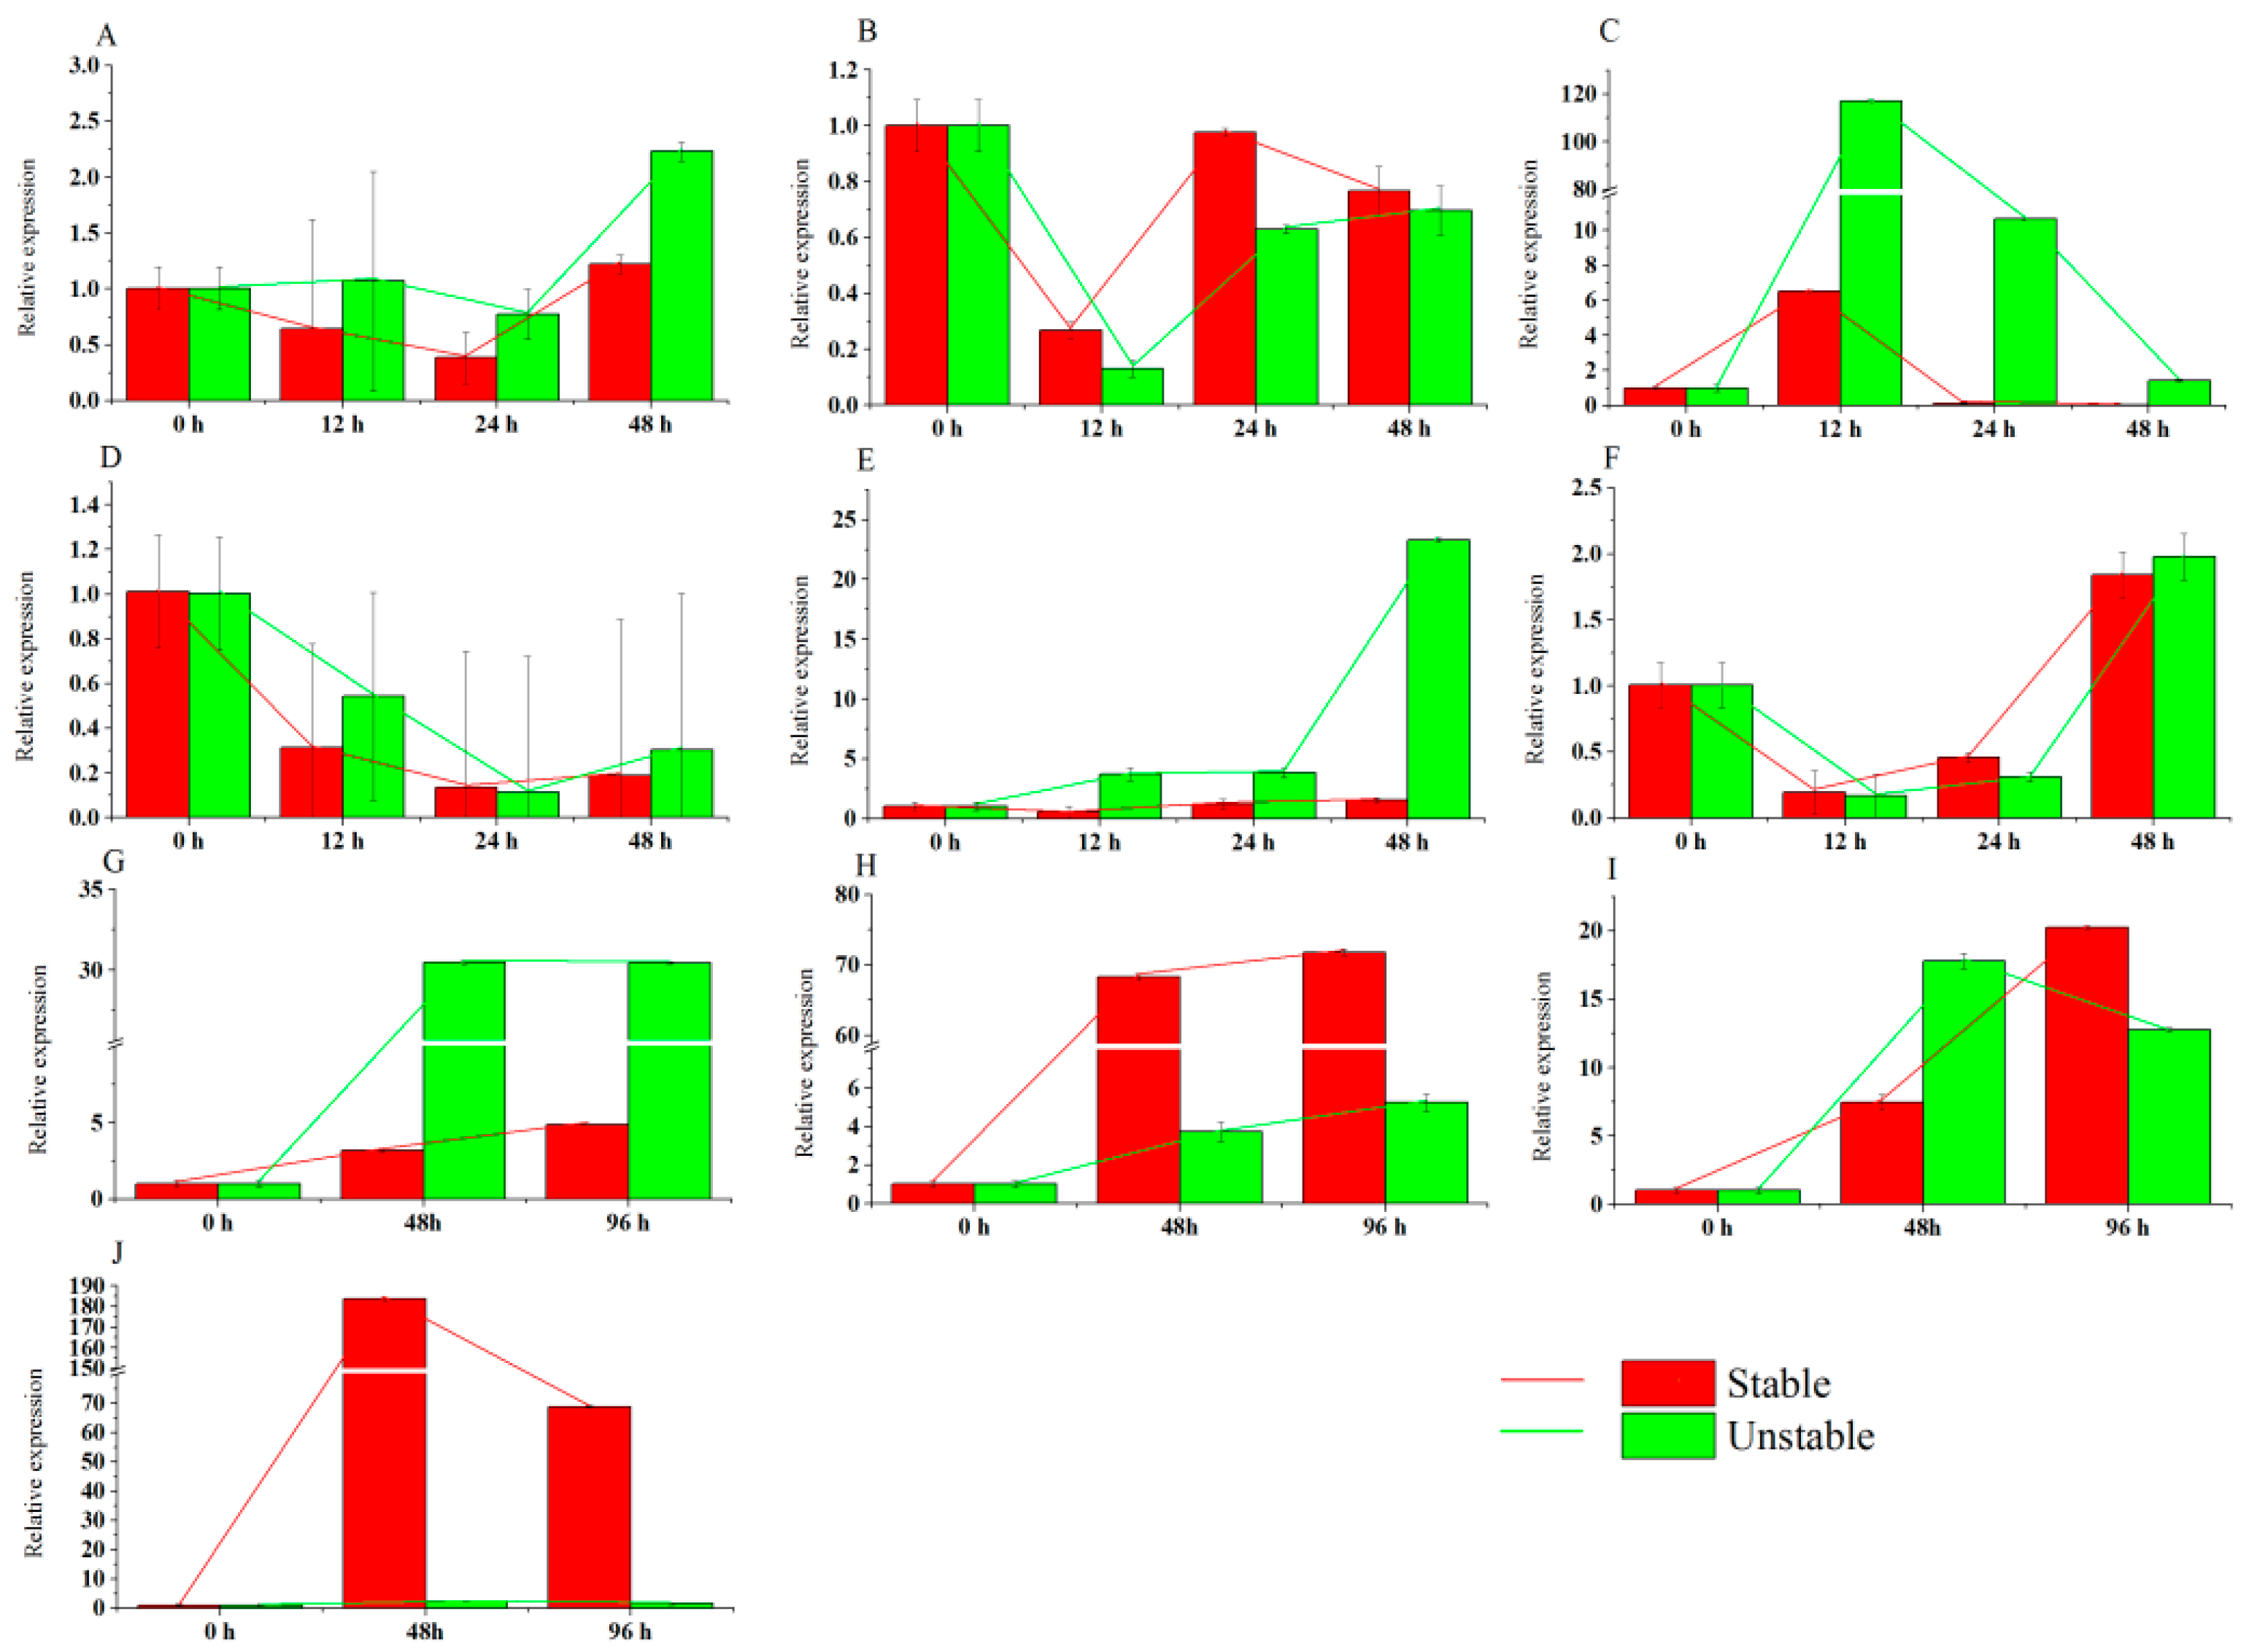
3.4. Transcript Abundance of the Eight Candidate Reference Genes in Pears under Abiotic and Biotic Stress Treatments

To select the best reference gene in pears under abiotic and biotic stresses, the leaves of buds were cultivated in MS media under 4 °C, 40 °C, 40% PEG-6000, and 400 mM NaCl. We examined the expression of eight reference genes under different abiotic and biotic stresses. The transcript abundance of each gene in terms of the same amount of total RNA per reaction was measured in the leaves, and the average Cq values were from 22.42 to 29.35 (Figure 3; Table S2). Lower Cq values reflected higher mRNA transcript levels, and SKD1 had the higher transcript levels among the reference genes under cold (23.42), heat (22.42), and salinity (23.76) stresses. YLS8 (25.16), UBQ (28.39), and ACT (27.6) had the lowest expression levels under cold, heat, and salinity stresses conditions, respectively. In pear leaves under water-deficit stress, TUB (25.16) had a high expression level, while ACT (27.60) had the lowest expression level. According to the coefficients of variation (CVs, %) of the Cq values, at the three time points, the eight genes were ranked as follows under various stresses: UBQ < GAPDH < EF1α < SKD1 < TUB < WDP < YLS8 < ACT under cold stress, ACT < GAPDH < UBQ < SKD1 < YLS8 < WDP < EF1α < TUB under heat stress, UBQ < GAPDH < TUB < SKD1 < EF1α < WDP < YLS8 < ACT under water-deficit stress, and GAPDH < SKD1 < ACT < WDP < TUB < YLS8 < EF1α < UBQ under salinity stress (Table S2). Accordingly, UBQ, ACT, and GAPDH were stably expressed genes used in this aspect of qPCR analysis under abiotic stress.
Next, we studied the expression stability of each candidate reference genes in Huangguan pear leaves under biotic treatment with V. nashicola, the causal agent of scab disease. Time–course analysis of the average Cq values for each gene at 0, 12, 24, and 48 hpt showed that EF1α (19.41) had the highest expression level and UBQ (27.58) had the lowest expression level among the eight candidate reference genes in leaves after infection (Figure 3). The coefficients of variation (CVs, %) of the Cq values of the eight genes across the four time points were ranked as SKD1 < YLS8 < WDP < ACT < TUB < UBQ < EF1α < GAPDH (Table S2).

3.5. Analysis of the Expression Stability of Reference Genes under Abiotic and Biotic Stress Treatment

It is critical to analyze the expression stability of the candidate reference genes under abiotic and biotic stress conditions using statistical algorithms. Under the optimized qPCR conditions, the transcript abundance of the eight candidate reference genes were quantified in leaves subjected to cold, heat, PEG, NaCl, and V. nashicola.

3.5.1. BestKeeper Analysis

According to the same standard, the transcript abundance of the eight candidate reference genes in Huangguan pear leaves under abiotic and biotic stresses were analyzed using the statistical algorithm software BestKeeper. Because the value of stably expressed genes had to be <1, many genes in analysis results would be omitted under abiotic stresses. UBQ (0.68) and GAPDH (0.71) were stable as reference genes under water-deficit stress (Table 3). YLS8 (0.87) and WDP (0.91) were stable as reference genes in leaves infected with V. nashicola (Table 4).

3.5.2. NormFinder Analysis

We used NormFinder to calculate the value of the eight reference genes according to the Cq of qPCR. In the stability ranking of Huangguan leaves under four abiotic stresses, WDP (0.71) and YLS8 (0.86) were more stable than the other genes. For each abiotic stress, GAPDH was the least stable reference gene. WDP (0.11) was the best one in cold-stressed leaves. Under heat treatment, YLS8 (0.67) was the most stable reference gene. In leaf samples subjected to PEG or NaCl, SKD1 (0.09) and TUB/WDP (0.01) were the best choices, respectively (Table 4). In leaf samples subjected to the pathogen V. nashicola, ACT (0.28) and WDP (0.31) were the top two stable reference genes.

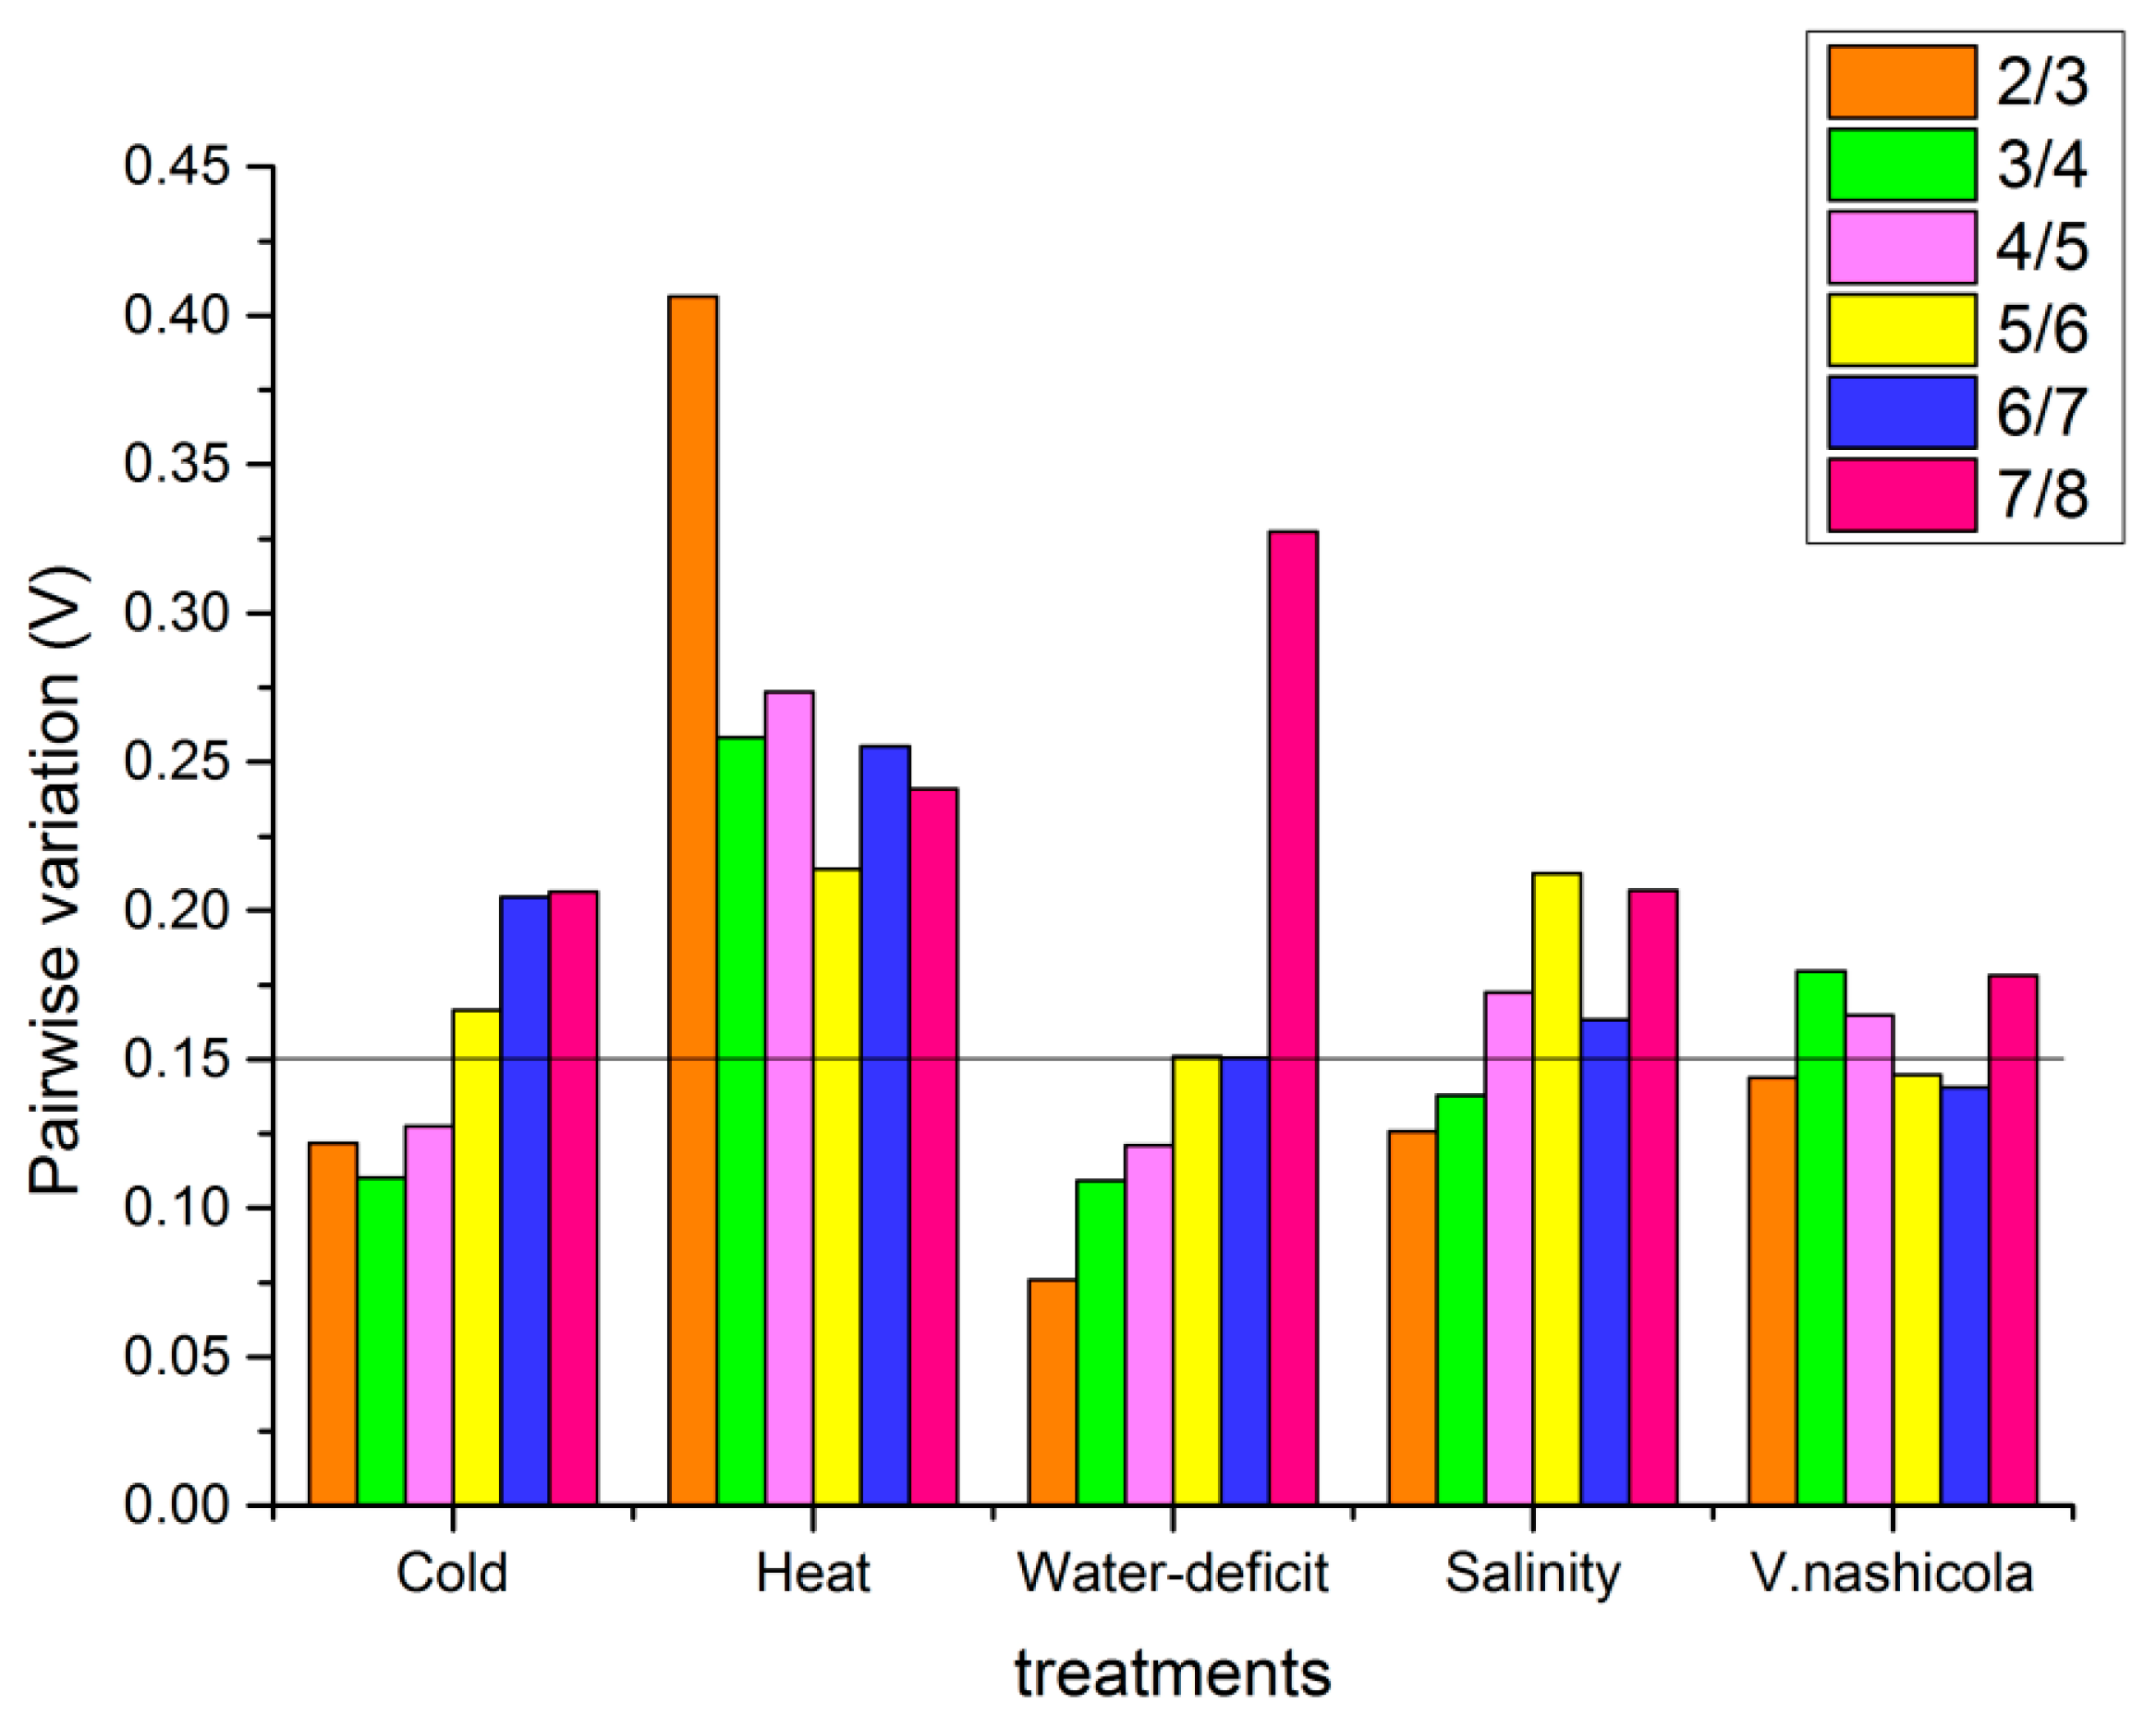
3.5.3. GeNorm Analysis

The expression stability of the eight candidate genes was further analyzed using GeNorm software. According to GeNorm analysis, the cut-off range of the stability value is < 1.5 (Table 4) but when choosing a sample of reference genes on the basis of Vn/n+1 (Figure 4), the V of V2/3 was less than the threshold of 0.15 for all eight genes in cold, water-deficit, salinity, and pathogen-stressed leaves. So, we referred to SKD1|EF1α (0.14), YLS8|WDP (0.10), WDP|TUB (0.03), and ACT|WDP (0.30) as housekeeping genes. Although the transcript abundance of housekeeping genes maintained the GeNorm analysis condition, none of the values of Vn/n+1 under heat stress were less than 0.15, which means that we were uncertain about the number of reference genes to use in qPCR. From an economic perspective, the top two genes YLS8|WDP were acceptable reference genes.

3.5.4. RefFinder Analysis

RefFinder can provide a stability value that is a direct measurement of expression variation by comparing and re-ranking the results of three computer programs. In a comprehensive ranking, WDP was among the top three most stable reference genes under various abiotic stresses. WDP, YLS8, SKD1, and TUB were the best reference genes under cold, heat, water-deficient, and salinity stresses, respectively (Table 5). Under biotic stress inflicted by V. nashicola, the stability rankings of the genes were ACT > WDP > TUB > SKD1 > YLS8 > EF1α > UBQ > GAPDH.

3.5.5. Validation of Selected Reference Genes

To normalize the expression level of PbRBOHC, we used the most and least stably expressed reference genes under various conditions on the basis of the analysis of the statistical algorithms above. In other words, the relative expression level (Q) of PbRBOHC was calculated using the formula Q = 2 C t . The genes were analyzed after mock (WDP and GAPDH), SA (WDP and GAPDH), MeJA (ACT and SKD1), ETH (UBQ and EF1α), and ABA (YLS8 and EF1α) treatment and under V. nashicola (ACT, GAPDH), cold (WDP, ACT), heat (YLS8, EF1α), water-deficit (SKD1, ACT), and salinity (TUB, UBQ) conditions. Two reference genes were used to normalize the expression level of PbRBOHC and PbRBOHC was found to be expressed differently in comparison with the two reference genes (Figure 5). For instance, compared with the stable reference gene GAPDH and the unstable reference gene WDP in the mock treatment (Figure 5A), the expression of the target gene PbRBOHC decreased and was lower. In SA treatment (Figure 5B), it was more highly expressed compared with the unstable reference gene. In some other conditions, the expression pattern of PbRBOHC was totally different. After ABA (Figure 5E) treatment, PbRBOHC remained almost unchanged when normalized with the stable reference gene YLS8. However, its expression level rose with the unstable EF1α. The target gene was highly expressed and had a time–effect expression pattern under V. nashicola (Figure 5F), cold (Figure 5G), heat (Figure 5H), water-deficit (Figure 5I), and salinity (Figure 5J) treatments when normalized with stable reference genes but hardly showed these trends when normalized with unstable ones. Further examination of the role of PbRBOHC in pear leaves revealed that its expression levels increased under V. nashicola, cold, heat, water-deficit, and salinity treatments, which is possibly related to biotic and abiotic stress causing an ROS burst.

4. Discussion

As a gene expression research tool, RT-qPCR is a convenient method of identifying gene expression and exploring the status and characteristics of plants. However, factors such as RNA quality and integrity, primer specificity, and concentration can influence the amplification efficiency and expression results of genes. To ensure equal qPCR amplification efficiency, it is necessary to optimize these factors for the relative quantification of the expression of reference and target genes [3]. In our study, we redesigned the primers of selected housekeeping genes to ensure the specificity of PCR products of less than 150 bp. A series of adjustments were made so that each candidate reference gene achieved R2 > 0.99 and E = 100 ± 10%. Normalization of the RT-qPCR data required internal control genes that display uniform expression under different conditions. Otherwise, without a suitable referent gene, the resulting Cq values of qPCR could lead to inaccurate expressions of target genes [38]. NormFinder, GeNorm, and BestKeeper, three common pieces of software, are often used to evaluate the expressed Cq values to select the best reference gene under various conditions. Although in some instances, the ranking using BestKeeper software was almost the converse of rankings performed using other software, as is the case compared to previous studies [23,39,40], RefFinder can help to comprehensively analyze the values and overall rank of the reference genes. We applied our optimized protocol to test the expression stability of a set of reference genes in the leaves of Huangguan pears. The leaves were of particular interest for studying gene expression under the different hormone treatments or environmental stresses. Different statistical algorithms of the different analysis approaches provided different validation ranks in the same treatment. Therefore, we recommend using four pieces of software to ensure that the results are convincing.
According to previous studies on the selection of plant reference genes for RT-qPCR, the expression level of a reference gene might not be constant under various stress conditions in citrus fruits [41]. For example, Xu [42] suggested that in pears subjected to abiotic stresses, ACT2/7, ubiquitin extension protein (UBI), and yellow-leaf-specific gene 8 (YLS8) were the most stable housekeeping genes among 18 selected candidate reference genes. ACT and tubulin have been widely used as reference genes in citrus fruits [43] and peach [44] under abiotic stresses. In potato, EF1α and sec3 were the most stably expressed genes under drought and osmotic stress conditions but EF1α and APRT were the most stable genes under cold stress [23]. However, in potato tubers, the most suitable reference genes were C2, sec3, and CUL3A [45]. In blueberry leaves and root, GAPDH was the worst reference gene under high alkalinity but EF1α was the best under PEG-simulated drought [46]. In our study, eight commonly used housekeeping genes were studied. We applied hormones to these genes because phytohormones are mainly related to biotic and abiotic stresses in plants. We also included various experimental stresses, which had a significant influence on the growth and quality of horticultural crops. Interestingly, we found some housekeeping genes were consistent in the three analysis programs. The results showed that ACT and WDP were relatively stable reference genes under hormones and biotic treatments. In abiotic stresses, WDP had more stable expression than ACT because ACT was ranked at the bottom for cold and water-deficit stresses. Although the ranking results were different, these differences revealed the expression levels of the invariable genes in pears under various conditions. In RefFinder analysis, the expression levels of EF1α and GAPDH were unstable under biotic and abiotic stresses. Chen [22] was the first to select WD-repeat protein (WDP) gene as a housekeeping gene from the transcriptome data [22]. It has been proved to be the most stable reference gene under cold treatment in different tissues of Dangshansu pear. After comparing 10 reference genes in pear pollen samples under ABA and abiotic stress treatments, especially high temperature and NaCl, Chen found that PbrEF1α was the most stable reference gene. After redesigning the primer and optimizing RT-qPCR, we also proved that WDP was among the top two best housekeeping genes under abiotic and biotic stresses in Huangguan, while EF1α ranked second in leaves only under cold-stress treatment in our study. This difference was in diverse organs or tissues because reference genes were unstable in different tissues.
The basic rule for a reference gene is that its expression level is insensitive to the exterior environment or any internal development changes. The Cq values of ideal reference genes among different samples were expected to be the same. However, according to our study, the Cq values varied from 19 to 30 (Figure 1 and Figure 3) and the CV of the Cq value ranged from 1.02 to 17.88 (Table S2). It was hard to tell which reference gene had constant expression under all experimental conditions in pear samples (Figure 6) because some specific housekeeping genes were regulated under various exterior treatments. For instance, salinity and ABA treatments greatly affected UBQ and EF1α depolymerization and expression, which also occurred in a study on Arabidopsis and tobacco [47]. Through the study of the PbRBOHC expression level, different reference genes were used to normalize gene expression. The expression level of the target gene was inconsistent with the above reference genes. We also found that the analysis results of the gene expression pattern changed with different reference genes. Using an unvalidated reference gene to normalize led to errors. Thus, it was necessary and significant to validate a reliable reference gene to normalize gene expression profiling under certain conditions.
In summary, in this study, we analyzed the stability of reference genes for RT-qPCR in pear leaves subjected to different hormone treatments and various biotic and abiotic stresses. WDP was suitable for gene quantification in pear under various experimental stresses, except MeJA treatment. ACT had the most stable expression under MeJA. Moreover, the best reference gene was not always the most stable one under specific conditions. More candidate reference genes should be explored with the release of the pear genome sequences and abundant transcriptome sequencing [48], such as annexin and β-tubulin. The results obtained will provide guidelines for selecting reference genes and analyzing gene expression in pears under different experimental conditions. They will also provide a reference for the analysis of other crops via suitable RT-qPCR normalization conditions in the future.

5. Conclusions

In this study, we valuated eight common candidate reference genes in pear (Pyrus bretschneideri Rehd.) leaves subjected to hormonal (SA, MeJA, ETH, and ABA), biotic (V. nashicola), and abiotic (cold, heat, water deficit, and salinity) stresses. As per the results, WDP was a relatively stable reference gene under all conditions except MeJA, while ACT had the most stable expression under MeJA. It is recommended that only EF1α and GAPDH be used as reference genes under experimental treatments.

Supplementary Materials

The following supporting information can be downloaded at https://www.mdpi.com/article/10.3390/horticulturae9020275/s1, Figure S1: The plot of the averaged Cq values of three technical replicates against the Log (cDNA in ng/reaction) for optimizing qPCR conditions for each candidate reference genes in pears; Figure S2: The analysis of specific primers and PCR efficiency for eight reference genes in pear leaves under control condition. Melting curves of reference genes showing single peaks.(a) ACT,(b) SKD1,(c) YLS8,(d) WDP,(e) TUB,(f) UBQ,(g) GAPDH,(h) EF1α; Table S1: Primer sequences used for qRT-PCR and the details of optimized protocol; Table S2: The Ct value of the reference genes of pear leaves under various experimental treatments.

Author Contributions

Conceptualization, P.Z., L.H., Y.W., X.L., X.F. and L.L.; investigation, Y.W. and X.L.; methodology, L.H.; validation and writing—original draft preparation, P.Z.; writing—review and editing, X.F.; project administration, L.L.; funding acquisition, L.L. All authors have read and agreed to the published version of the manuscript.

Funding

This research was financially supported by the Basic Research Program of Shanxi Province (Free Exploration) (grant no. YDZJSX2022A042).

Data Availability Statement

Not applicable.

Conflicts of Interest

The authors declare that they have no known competing financial interests in this paper.

References

  1. Wu, J.; Wang, Z.W.; Shi, Z.B.; Zhang, S.; Ming, R.; Zhu, S.L.; Khan, M.A.; Tao, S.T.; Korban, S.S.; Wang, H.; et al. The genome of the pear (Pyrus bretschneideri Rehd.). Genome Res. 2013, 23, 396–408. [Google Scholar] [CrossRef] [PubMed] [Green Version]
  2. Wang, Y.T.; Li, Y.; Sun, Y.H. The breeding and application of the middle season ripening, scab resistant new pear variety-Huangguan pear. J. Hebei Agric. Sci. 1998, 2, 40–42. [Google Scholar] [CrossRef]
  3. Zhao, F.Z.; Maren, N.A.; Kosentka, P.Z.; Kosentka, P.Z.; Liao, Y.Y.; Lu, H.Y.; Duduit, J.R.; Huang, D.B.; Ashrafi, H.; Zhao, T.J.; et al. An optimized protocol for stepwise optimization of real-time RT-PCR analysis. Hortic. Res. 2021, 8, 179. [Google Scholar] [CrossRef] [PubMed]
  4. Liu, Y.; Yang, T.Y.; Lin, Z.K.; Gu, B.J.; Xing, C.H.; Zhao, L.Y.; Dong, H.Z.; Gao, J.Z.; Xie, Z.H.; Zhang, S.L.; et al. A WRKY transcription factor PbrWRKY53 from Pyrus betulaefolia is involved in drought tolerance and AsA accumulation. Plant Biotechnol. J. 2019, 17, 1770–1787. [Google Scholar] [CrossRef] [Green Version]
  5. Xing, C.H.; Liu, Y.; Zhao, L.Y.; Zhang, S.L.; Huang, X.S. A novel MYB transcription factor regulates ascorbic acid synthesis and affects cold tolerance. Plant Cell Environ. 2019, 42, 832–845. [Google Scholar] [CrossRef]
  6. Dong, H.Z.; Wang, C.M.; Xing, C.H.; Yang, T.Y.; Yan, J.X.; Gao, J.Z.; Li, D.L.; Wang, R.; Blumwald, E.; Zhang, S.L.; et al. Overexpression of PbrNHX2 gene, a Na+/H+ antiporter gene isolated from Pyrus betulaefolia, confers enhanced tolerance to salt stress via modulating ROS levels. Plant Sci. 2019, 285, 14–25. [Google Scholar] [CrossRef]
  7. Mizuno, A.; Tsukamoto, T.; Shimizu, Y.; Ooya, H.; Matsuura, T.; Saito, N.; Sato, S.; Kikuchi, S.; Uzuki, T.; Azegami, K. Occurrence of bacterial black shoot disease of European pear in Yamagata prefecture. J. Gen. Plant Pathol. 2010, 76, 43–51. [Google Scholar] [CrossRef]
  8. Rou-Zi, A.; Wang, Q. Bionomics of grapholitha molesta busck and its control measures. Biol. Disaster Sci. 2018, 41, 160–162. [Google Scholar] [CrossRef]
  9. Ishii, H.; Yanase, H. Venturia Nashicola, the scab fungus of Japanese and Chinese pears: A species distinct from V. pirina. Mycol. Res. 2000, 104, 755–759. [Google Scholar] [CrossRef]
  10. Ma, M.Z. Analysis of harmful symptoms and epidemic causes of pear scab. China Agric. Inf. 2014, 7, 100. [Google Scholar] [CrossRef]
  11. Gray, W.M. Hormonal regulation of plant growth and development. PLoS Biol. 2004, 2, E311. [Google Scholar] [CrossRef] [PubMed] [Green Version]
  12. Kitagawa, Y.; Yamamoto, H.; Oritani, T. Biosynthesis of abscisic acid in the fungus Cercospora cruenta stimulation of biosynthesis by water stress and isolation of a transgenic mutant with reduced biosynthetic capacity. Plant Cell Physiol. 1995, 36, 557–564. [Google Scholar] [CrossRef]
  13. Pré, M.; Atallah, M.; Champion, A.; De Vos, M.; Pieterse, C.M.J.; Memelink, J. The AP2/ERF domain transcription factor ORA59 integrates jasmonic acid and ethylene signals in plant defense. Plant Physiol. 2008, 147, 1347–1357. [Google Scholar] [CrossRef] [PubMed] [Green Version]
  14. Weingart, H.; Ullrich, H.; Geider, K.; Völksch, B. The role of ethylene production in virulence of Pseudomonas syringae pvs. glycinea and phaseolicola. Phytopathology 2001, 91, 511–518. [Google Scholar] [CrossRef] [Green Version]
  15. Park, S.-W.; Kaimoyo, E.; Kumar, D.; Mosher, S.; Klessig, D.F. Methyl salicylate is a critical mobile signal for plant systemic acquired resistance. Science 2007, 318, 113–116. [Google Scholar] [CrossRef]
  16. Stintzi, A.; Weber, H.; Reymond, P.; Browse, J.; Farmer, E.E. Plant defense in the absence of jasmonic acid: The role of cyclopentenones. Proc. Natl. Acad. Sci. USA 2001, 98, 12837–12842. [Google Scholar] [CrossRef] [Green Version]
  17. Bustin, S.A.; Benes, V.; Garson, J.A.; Hellemans, J.; Huggett, J.; Kubista, M.; Mueller, R.; Nolan, T.; Pfaffl, M.W.; Shipley, G.L.; et al. The MIQE guidelines: Minimum information for publication of quantitative real-time PCR experiments. Clin. Chem. 2009, 55, 611–622. [Google Scholar] [CrossRef] [Green Version]
  18. Schmidt, G.W.; Delaney, S.K. Stable internal reference genes for normalization of real-time RT-PCR in tobacco (Nicotiana tabacum) during development and abiotic stress. Mol. Genet. Genomics. 2010, 283, 233–241. [Google Scholar] [CrossRef]
  19. Kundu, A.; Patel, A.; Pal, A. Defining reference genes for qPCR normalization to study biotic and abiotic stress responses in Vigna mungo. Plant Cell Rep. 2013, 32, 1647–1658. [Google Scholar] [CrossRef]
  20. Wang, Y.J.; Dong, L.; Zhang, C.; Wang, X.Q. Reference gene selection for real-time quantitative PCR normalization in tree peony(Paeonia suffruticosa Andr). J. Agric. Biotechnol. 2012, 20, 521–528. [Google Scholar] [CrossRef]
  21. Yan, H.B.; Ge, W.Y.; Cheng, Y.D.; He, J.G.; Guan, J.F. Cloning and characters analysis of GAPDH gene family in Yali pear. J. Northwest AF Univ. (Nat. Sci. Ed.). 2012, 40, 181–186. [Google Scholar] [CrossRef]
  22. Chen, Y.; Wu, X.; Gu, C.; Yin, H.; Zhang, S. Selection of reference genes in qRT-PCR of pear “Dangshansuli”. China Fruits 2018, 1, 16–22, 35. [Google Scholar] [CrossRef]
  23. Tang, X.; Zhang, N.; Si, H.J.; Calderón-Urrea, A. Selection and validation of reference genes for RT-qPCR analysis in potato under abiotic stress. Plant Methods 2017, 13, 85. [Google Scholar] [CrossRef] [PubMed]
  24. Liu, Z.; Qin, Z.L.; Wu, T.; Li, X.M.; Tu, J.F.; Yang, F.C.; Zhu, H.Y. Fluorescence Quantitative Reference Genes and Their Primers and Applications in Leaf Tissues of Two Tree Pears at Different Developmental Stages. CN107988407A. 2018. Available online: https://www.zhangqiaokeyan.com/patent-detail/061204415708.html (accessed on 6 November 2021).
  25. Abbas, A.; Yu, H.Y.; Li, X.J.; Cui, H.L.; Chen, J.C.; Huang, P. Selection and validation of reference genes for RT-qPCR analysis in Aegilops tauschii (Coss.) under different abiotic stresses. Int. J. Mol. Sci. 2021, 22, 11017. [Google Scholar] [CrossRef]
  26. Chen, J.Q.; Li, X.Y.; Wang, D.Q.; Li, L.T.; Zhou, H.S.; Liu, Z.; Wu, J.; Wang, P.; Jiang, X.T.; Fabrice, M.R.; et al. Identification and testing of reference genes for gene expression analysis in pollen of Pyrus bretschneideri. Sci. Hortic. 2015, 190, 43–56. [Google Scholar] [CrossRef]
  27. Czechowski, T.; Stitt, M.; Altmann, T.; Udvardi, M.K.; Scheible, W.-R. Genome-wide identification and testing of superior reference genes for transcript normalization in Arabidopsis. Plant Physiol. 2005, 139, 5–17. [Google Scholar] [CrossRef] [Green Version]
  28. Duan, Y.; Tian, C.; Song, Y. In vitro culture and rapid propagation of pear Xuehuali. Shanxi Agric. Univ. (Nat. Sci. Ed.). 2014, 34, 464–467. [Google Scholar] [CrossRef]
  29. Jaakola, L.; Pirttilä, A.M.; Halonen, M.; Hohtola, A. Isolation of high quality RNA from Bilberry (Vaccinium myrtillus L.) Fruit. Mol. Biotechnol. 2001, 19, 201–204. [Google Scholar] [CrossRef]
  30. Xie, F.L.; Xiao, P.; Chen, D.L.; Xu, L.; Zhang, B.H. miRDeepFinder:a miRNA analysis tool for deep sequencing of plant small RNAs. Plant Mol. Biol. 2012, 80, 75–84. [Google Scholar] [CrossRef]
  31. Vandesompele, J.; Preter, K.D.; Pattyn, F.; Poppe, B.; Roy, N.V.; Paepe, A.D.; Speleman, F. Accurate normalization of real-time quantitative RT-PCR data by geometric averaging of multiple internal control genes. J. Genome Biol. 2002, 3, 34.1–34.11. [Google Scholar] [CrossRef] [Green Version]
  32. Greenberg, J.T.; Yao, N. The role and regulation of programmed cell death in plant-pathogen interactions. Cell Microbiol. 2004, 6, 201–211. [Google Scholar] [CrossRef] [PubMed]
  33. Sagi, M.; Fluhr, R. Production of reactive oxygen species by plant NADPH oxidases. Plant Physiol. 2006, 141, 336–340. [Google Scholar] [CrossRef] [PubMed] [Green Version]
  34. Cepauskas, D.; Miliute, I.; Staniene, G.; Gelvonauskiene, D.; Stanys, V.; Jesaitis, A.J.; Baniulis, D. Characterization of apple NADPH oxidase genes and their expression associated with oxidative stress in shoot culture in vitro. Plant Cell Tissue Organ. Cult. 2015, 124, 621–633. [Google Scholar] [CrossRef]
  35. Cheng, X.; Li, G.H.; Manzoor, M.A.; Wang, H.; Abdullah, M.; Su, X.Q.; Zhang, J.Y.; Jiang, T.S.; Jin, Q.; Cai, Y.P.; et al. In silico genome-wide analysis of respiratory burst oxidase homolog (RBOH) family genes in five fruit-producing trees, and potential functional analysis on lignification of stone cells in Chinese White Pear. Cells 2019, 8, 520. [Google Scholar] [CrossRef] [PubMed] [Green Version]
  36. Pfaffl, M.W.; Tichopad, A.; Prgomet, C.; Neuvians, T.P. Determination of stable housekeeping genes, differentially regulated target genes and sample integrity: BestKeeper-excel-based tool using pair-wise correlations. Biotechnol. Lett. 2004, 26, 509–515. [Google Scholar] [CrossRef] [PubMed]
  37. Andersen, C.L.; Jensen, J.L.; Ørntoft, T.F. Normalization of real-time quantitative reverse transcription-PCR data: A model-based variance estimation approach to identify genes suited for normalization, applied to bladder and colon cancer data sets. Cancer Res. 2004, 64, 5245–5250. [Google Scholar] [CrossRef] [Green Version]
  38. Taylor, S.C.; Nadeau, K.; Abbasi, M.; Lachance, C.; Nguyen, M.; Fenrich, J. The ultimate qPCR experiment: Producing publication quality, reproducible data the first time. Trends Biotechnol. 2019, 37, 761–774. [Google Scholar] [CrossRef] [Green Version]
  39. Mallona, I.; Lischewski, S.; Weiss, J.; Hause, B.; Egea-Cortines, M. Validation of Reference Genes for Quantitative Real-Time PCR during Leaf and Flower Development in Petunia Hybrida. BMC Plant Biol. 2010, 10, 4. [Google Scholar] [CrossRef] [Green Version]
  40. Rapacz, M.; Stępień, A.; Skorupa, K. Internal standards for quantitative RT-PCR studies of gene expression under drought treatment in barley (Hordeum vulgare L.): The effects of developmental stage and leaf age. Acta Physiol. Plant. 2012, 34, 1723–1733. [Google Scholar] [CrossRef] [Green Version]
  41. Mafra, V.; Kubo, K.S.; Alves-Ferreira, M.; Ribeiro-Alves, M.; Stuart, R.M.; Boava, L.P.; Rodrigues, C.M.; Machado, M.A. Reference genes for accurate transcript normalization in Citrus genotypes under different experimental conditions. PLoS ONE 2012, 7, e31263. [Google Scholar] [CrossRef]
  42. Xu, Y.Y.; Li, H.; Li, X.G.; Lin, J.; Wang, Z.H.; Yang, Q.S.; Chang, Y.H. Systematic selection and validation of appropriate reference genes for gene expression studies by quantitative real-time PCR in pear. Acta Physiol. Plant. 2015, 37, 40. [Google Scholar] [CrossRef]
  43. Liu, Z.; Ge, X.X.; Wu, X.M.; Kou, S.J.; Chai, L.J.; Guo, W.W. Selection and validation of suitable reference genes for mRNA qRT-PCR analysis using somatic embryogenic cultures, floral and vegetative tissues in Citrus. Plant Cell Tiss. Organ Cult. 2013, 113, 469–481. [Google Scholar] [CrossRef]
  44. Tong, Z.G.; Gao, Z.H.; Wang, F.; Zhou, J.; Zhang, Z. Selection of reliable reference genes for gene expression studies in peach using real-time PCR. BMC Mol. Biol. 2009, 10, 71. [Google Scholar] [CrossRef] [PubMed] [Green Version]
  45. Mariot, R.F.; de Oliveira, L.A.; Voorhuijzen, M.M.; Staats, M.; Hutten, R.C.B.; Van Dijk, J.P.; Kok, E.; Frazzon, J. Selection of Reference Genes for Transcriptional Analysis of Edible Tubers of Potato (Solanum tuberosum L.). PLoS ONE 2015, 10, e0120854. [Google Scholar] [CrossRef]
  46. Deng, Y.; Li, Y.D.; Sun, H.Y. Selection of Reference Genes for RT-qPCR Normalization in Blueberry (Vaccinium corymbosum × Angustifolium) under Various Abiotic Stresses. FEBS Open Bio 2020, 10, 1418–1435. [Google Scholar] [CrossRef]
  47. Pleskot, R.; Potocký, M.; Pejchar, P.; Linek, J.; Bezvoda, R.; Martinec, J.; Valentová, O.; Novotná, Z.; Žárský, V. Mutual Regulation of Plant Phospholipase D and the Actin Cytoskeleton. Plant J. 2010, 62, 494–507. [Google Scholar] [CrossRef]
  48. Wang, Y.Z.; Dai, M.S.; Cai, D.Y.; Shi, Z.B. Expression stability analysis of common internal reference genes in pear fruit based on high-throughput sequencing. Mol. Plant Breed. 2019, 17, 746–753. [Google Scholar] [CrossRef]
Figure 1. Transcript abundance of the eight reference genes in pear leaves under control conditions and when exposed to different hormones as measured using qPCR. (A) Mock, (B) SA, (C) MeJA, (D) ETH, and (E) ABA treatment.
Horticulturae 09 00275 g001
Figure 2. Analysis of reference genes for qPCR normalization using GeNorm in pear leaves under control condition and different hormones. The pairwise variation (Vn/n+1) in the eight candidate reference genes under different treatments was calculated using GeNorm software, and the optimal number of reference genes was determined using the lowest number of genes with a Vn/n+1 value smaller than 0.15.
Horticulturae 09 00275 g002
Figure 3. Transcript abundance of the eight reference genes of pear leaves under abiotic and biotic stresses measured using RT-qPCR. Cq values indicate the mean values of transcript abundance from three independent replicates ± standard errors (vertical bars). (A) Cold, (B) heat, (C) water deficit, (D) salinity, and (E) V. nashicola.
Horticulturae 09 00275 g003
Figure 4. Analysis of reference genes for qPCR normalization using GeNorm in pear leaves under different stresses. The pairwise variation (Vn/n+1) in the eight candidate reference genes under abiotic and biotic treatments was calculated using GeNorm software, and the optimal number of reference genes was determined using the lowest number of genes with a Vn/n+1 value smaller than 0.15.
Horticulturae 09 00275 g004
Figure 5. The calculated relative expression levels of PbRBOHC using the most and least stable reference genes in pear leaves under different experimental stresses. Error bars represent the SD. (A) Mock, (B) SA, (C) MeJA, (D) ETH, (E) ABA, and (F) V. nashicola treatment and (G) cold, (H) heat, (I) water-deficit, and (J) saline conditions.
Horticulturae 09 00275 g005
Figure 6. RT-qPCR Cq values of the candidate reference genes in pear leaves. Candidate reference genes were analyzed in all conditions. Boxes indicate the 25th and 75th percentiles. Lines across boxes represent the median values. Circles represent the mean values, and the spot represents the outlier. Whiskers represent the maximum and minimum values.
Horticulturae 09 00275 g006
Table 1. List of genes and the optimized qPCR results for eight candidate reference genes.
GeneSequence IDAmplicon Length (bp)Annealing Tm (°C)R2Amplification Efficiency (%)
ACTGU830958139600.9999104.39
SKD1XM009366023127600.9992106.66
YLS8XM009353468119600.9993111.02
WDPPbr03854485600.9995111.29
TUBPbr042345114600.9949111.62
UBQPbr00861488600.9977108.20
GAPDHPbr036263118600.9983111.71
EF1αXM_00937630291600.9993108.39
Table 2. Ranking of the expression stability of the eight candidate reference genes in pears under control conditions and hormone treatments with Cq values being calculated using statistical algorithm software.
MockSAMeJAETHABA
GeneValueGeneValueGeneValueGeneValueGeneValue
Calculated in BestKeeper
YLS80.17SKD10.91GAPDH0.36SKD10.37SKD10.76
WDP0.45WDP1.08EF1α0.62WDP0.99TUB1.07
SKD10.51YLS81.16ACT0.68TUB1.17WDP1.09
TUB0.63ACT1.18TUB0.94YLS81.35YLS81.36
ACT0.63TUB1.37UBQ0.95UBQ1.75UBQ1.63
EF1α1.11EF1α1.54WDP1.08ACT2.00ACT2.00
UBQ1.33UBQ1.68SKD11.47GAPDH2.39GAPDH2.44
GAPDH1.40GAPDH1.82YLS81.50EF1α2.60EF1α2.77
Calculated in NormFinder
ACT0.22WDP0.09TUB0.33UBQ0.28ACT0.48
WDP0.27ACT0.16ACT0.35YLS80.30YLS80.52
EF1α0.56EF1α0.43UBQ0.44ACT0.43UBQ0.53
TUB0.70TUB0.51WDP1.09WDP0.71WDP0.82
YLS80.74UBQ0.68YLS81.09TUB0.77TUB0.87
SKD10.77SKD10.84GAPDH1.27GAPDH1.05GAPDH1.18
UBQ0.94YLS80.88SKD11.37SKD11.72SKD11.65
GAPDH0.96GAPDH0.90EF1α1.44EF1α1.94EF1α1.89
Calculated in GeNorm
SKD1|TUB0.19ACT|WDP0.31ACT|UBQ0.69WDP|TUB0.40YLS8|WDP0.38
WDP0.31TUB0.47TUB0.72YLS80.61TUB0.62
YLS80.43EF1α0.56YLS80.86UBQ0.69UBQ0.87
ACT0.52UBQ0.63SKD10.98ACT0.81ACT0.98
EF1α0.68YLS80.72WDP1.08GAPDH0.94SKD11.09
UBQ0.82SKD10.78GAPDH1.25SKD11.13GAPDH1.23
GAPDH0.88GAPDH0.84EF1α1.34EF1α1.35EF1α1.42
Table 3. Rankings of the expression stability of the eight candidate reference genes in pears under control conditions and hormone treatments, with Cq values being calculated in RefFinder.
MockSAMeJAETHABA
GeneValueGeneValueGeneValueGeneValueGeneValue
WDP1.86WDP1.19ACT1.57UBQ2.11YLS81.68
ACT2.66ACT2.00TUB2.21WDP2.38WDP2.63
TUB2.83EF1α3.83UBQ2.59YLS82.63ACT2.78
SKD13.08TUB3.94GAPDH3.98TUB2.94TUB3.50
YLS83.31SKD13.98YLS85.03ACT4.05UBQ3.66
EF1α4.24UBQ5.44WDP5.18SKD14.30SKD14.14
UBQ7.00YLS85.45EF1α5.66GAPDH6.24GAPDH6.48
GAPDH8.00GAPDH8.00SKD16.44EF1α8.00EF1α8.00
Table 4. Ranking of the expression stability of the eight candidate reference genes in pears under different abiotic and biotic stresses, with Cq values being calculated using statistical algorithm software.
ColdHeatWater DeficitSalinityV. nashicola
GeneValueGeneValueGeneValueGeneValueGeneValue
Calculated using BestKeeper
UBQ1.56UBQ1.56UBQ0.68SKD12.06SKD10.74
GAPDH1.95GAPDH1.95GAPDH0.71GAPDH2.06YLS80.95
SKD11.97SKD11.97TUB1.13ACT2.63WDP1.16
EF1α2.06EF1α2.06EF1α1.30TUB2.97ACT1.33
TUB2.30TUB2.30SKD11.34WDP2.99TUB1.46
WDP2.43WDP2.43WDP1.46EF1α3.26UBQ1.59
YLS82.68YLS82.68YLS81.54YLS83.33EF1α1.80
ACT3.14ACT3.14ACT2.03UBQ4.01GAPDH2.14
Calculated using NormFinder
WDP0.11YLS80.67SKD10.09TUB0.01ACT0.15
TUB0.32SKD10.92TUB0.18WDP0.01WDP0.42
EF1α0.47UBQ0.96WDP0.29EF1α0.38TUB0.44
SKD10.49WDP1.04YLS80.47YLS80.64EF1α0.55
YLS80.60GAPDH1.05UBQ0.48ACT0.66UBQ0.72
UBQ0.98ACT1.36EF1α0.62SKD11.24YLS80.85
ACT1.34TUB1.56ACT1.33GAPDH1.28SKD11.06
GAPDH1.63EF1α1.88GAPDH2.61UBQ1.63GAPDH1.41
Calculated using GeNorm
SKD1|EF1α0.14YLS8|WDP0.29YLS8|WDP0.10WDP|TUB0.03ACT|WDP0.30
TUB0.29GAPDH0.91SKD10.19EF1α0.26TUB0.40
WDP0.37SKD11.00TUB0.32YLS80.41EF1α0.57
YLS80.48ACT1.17EF1α0.44ACT0.60UBQ0.70
UBQ0.66UBQ1.27UBQ0.61SKD10.83YLS80.78
ACT0.89TUB1.45ACT0.74GAPDH0.95SKD10.87
GAPDH1.11EF1α1.63GAPDH1.22UBQ1.13GAPDH1.02
Table 5. Ranking of the expression stability of the eight candidate reference genes in pears under different abiotic and biotic stresses, with Cq values being calculated in RefFinder.
ColdHeatWater DeficitSalinityV. nashicola
GeneValueGeneValueGeneValueGeneValueGeneValue
WDP2.21YLS81.50SKD11.97TUB1.68ACT1.41
EF1α2.45SKD12.38WDP2.45WDP1.78WDP1.86
SKD12.63WDP3.13TUB2.91EF1α3.57TUB3.41
TUB2.78GAPDH3.41YLS83.25SKD13.83SKD14.30
UBQ3.83ACT3.66UBQ3.66ACT4.40YLS84.36
YLS85.44UBQ4.36EF1α4.95YLS84.60EF1α4.60
GAPDH5.66TUB7.00GAPDH5.66GAPDH5.12UBQ5.48
ACT7.24EF1α8.00ACT7.24UBQ8.00GAPDH8.00
Disclaimer/Publisher’s Note: The statements, opinions and data contained in all publications are solely those of the individual author(s) and contributor(s) and not of MDPI and/or the editor(s). MDPI and/or the editor(s) disclaim responsibility for any injury to people or property resulting from any ideas, methods, instructions or products referred to in the content.

