Article

De Novo Transcriptome Analysis by PacBio SMRT-Seq and Illumina RNA-Seq Provides New Insights into Polyphenol Biosynthesis in Chinese Olive Fruit

1
Fujian Vocational College of Agriculture, Fuzhou 350303, China
2
College of Horticulture, Fujian Agriculture and Forestry University, Fuzhou 350002, China
3
Chaoshan Vocational and Technical College, Jieyang 515343, China
*
Author to whom correspondence should be addressed.
Horticulturae 2024, 10(3), 293; https://doi.org/10.3390/horticulturae10030293
Submission received: 8 February 2024 / Revised: 10 March 2024 / Accepted: 14 March 2024 / Published: 19 March 2024
(This article belongs to the Section Genetics, Genomics, Breeding, and Biotechnology (G2B2))

Abstract

:
Polyphenols play a crucial role in fruit flavor. To elucidate the mechanism of fruit polyphenol metabolism, we constructed a transcriptome atlas through PacBio single-molecule real-time (SMRT) sequencing and Illumina next-generation sequencing (NGS) using Canarium album (Lour.) Raeusch., which is a fantastic fruit rich in polyphenolic compounds. In this work, PacBio full-length transcriptome assembly generated 135,439 isoforms with an average length of all isoforms of 2687.94 bp and an N50 length of 3224 bp. To gain deeper insights into the molecular mechanisms of polyphenol biosynthesis in C. album, we constructed twelve RNA-Seq libraries from four developmental stages of the fruits. We identified a total of 28,658 differentially expressed genes (DEGs). We found that many DEGs were involved in metabolic pathways, biosynthesis of secondary metabolites, biosynthesis of antibiotics, starch and sucrose metabolism, and plant hormone signal transduction. Here, we report the expression profiles of 215 DEGs encoding 27 enzymes involved in the polyphenol biosynthesis pathway in C. album. In addition, 285 differentially expressed transcription factors (TFs) continuously down-regulated in four developmental periods of C. album fruit, which may indicate their potential role in the response to polyphenol metabolism and phenylpropanoid biosynthesis pathways. This report will help us understand polyphenol biosynthesis’s functions and metabolic mechanism in C. album. The transcriptome data provide a valuable resource for genetic and genomics research. They will facilitate future work exploiting C. album and other fruits used as medicine and food.

1. Introduction

Canarium album (Lour.) Raeusch., also known as Chinese olive, is a member of the Burseraceae family, which is native to tropical and subtropical regions, including China, Vietnam, Thailand, Malaysia, and Japan [1,2,3]. Canarium album is of great economic importance for its edible and nutrient-rich pulp and kernels [4,5,6]. Different from Olea europaea L., which is mainly used as the extraction source for olive oil, C. album fruits have a relatively low oil content. Its fresh fruit exhibits a unique flavor profile, which is bitter and astringent at first and then becomes sweet and fragrant after chewing [4,7]. The flavor is mainly due to C. album being rich in polyphenols. These fantastic fruits accumulate rich secondary metabolites, such as phenolic compounds [8,9], flavonoids [10], terpenoids [11,12] and polysaccharides [13,14], which are responsible for some pharmacological functions, such as antibacterial, antiviral, and anti-inflammation [15,16,17]. In particular, the fruit has played an important role in antioxidant capacity and free-radical scavenging ability [5,8,18], which benefit from its total phenolic content (TPC). The TPC of C. album is much higher than most fruits [19,20]. The polyphenols of C. album are the primary material basis for the astringent taste of the fruits, and are essential and complex secondary metabolites in plants, including phenolics, flavonoids, flavonols, tannins, lignins, anthocyanins [21,22]. The biosynthesis pathway of polyphenol has been studied in many plants [23]. However, most studies on C. album have focused on determining its phenolic substances. In contrast, few studies have reported on the molecular organisms’ biosynthesis and metabolism, mainly due to the lack of reference genomic and transcriptome information. It is thus necessary to study the polyphenol metabolism at the transcriptome level to guide the development and utilization of C. album worldwide.
Transcriptome sequencing or RNA sequencing is a high-resolution, sensitive, high-throughput next-generation sequencing (NGS) approach. It assembles RNA transcripts from individual or whole functional and developmental stage samples. Presently, NGS technologies have become a standard tool for many applications in basic biology, clinical diagnostics, and agronomical research [24]. During the past two decades, transcriptome sequencing technology has made tremendous progress, which improves gene ontology and understanding of the mechanisms of biological processes, molecular functions, and cellular components. However, there is limited information available on this topic. Short reads and misassembly, which are disadvantages of NGS technology, quickly result in the loss of some vital information and greatly hinder its ability to estimate transcript abundance at a genome-wide scale [25,26].
In recent years, third-generation sequencing (TGS) has overcome the limitations of second-generation sequencing, and long-read sequencing (LRS) technology has significantly increased the length of a single contiguous read from a few hundred to millions of base pairs. LRS technologies enable faster, more efficient, and higher throughput ultralong reads, which allow for direct sequencing of genomes that would be impossible or difficult to investigate using short-read sequencing approaches [27,28]. The Pacific BioSciences (PacBio, Menlo Park, CA, USA) RSII TGS technology has accomplished single-molecule real-time (SMRT) sequencing. The full-length transcripts can significantly increase the accuracy of genome annotation and transcriptome characterization compared to the transcript assembled from short RNA-seq reads [29]. PacBio SMRT sequencing technology is instrumental in capturing entire transcriptomes and constructing a comprehensive transcriptome for species without genomes [30]. However, PacBio sequencing has a relatively high error rate and low throughput. Therefore, combining the two sequencing methods is necessary to correct for uniform coverage and high accuracy [31,32,33,34].
Therefore, we used SMRT sequencing and Illumina high-throughput sequencing to obtain a global overview of the full-length transcriptome of C. album. We identified the genes involved in the polyphenol biosynthesis pathway and analyzed the expression patterns. This study first combined SMRT-Seq and RNA-Seq to generate the complete and full-length transcriptome of C. album. This will help researchers further understand the polyphenol biosynthesis of C. album, which is essential to accumulation and regulation. Our study could lay a foundation for medicinal activity research, astringency mechanism studies, and fruit quality regulation of C. album.

2. Materials and Methods

2.1. Plant Materials

The fruits of C. album cultivar ‘Changying’, cultivated at the C. album plantation located in Minhou county, Fujian Province, China (26°13′ N, 119°02′ E, 127 m altitude), were used as materials. We selected three healthy and approximately uniform trees with the same environmental conditions for the experiment. C. album fruit samples were collected at 20, 40, 70, and 110 days after flowering (DAF). Three biological replicates (three trees) for each developmental stage were harvested. At each developmental stage, 20–30 representative fruits without visible blemishes or diseases were sampled from each tree. The fruit pulp of all samples was cut into pieces, immediately frozen in liquid nitrogen, and stored at −80 °C until RNA isolation, and synchronously, we measured the fruit weight, longitudinal diameter, and transverse diameter. The fruit shape index was calculated, being equal to the longitudinal diameter divided by the transverse diameter. Each index was repeated with 10 fruits.

2.2. Measurement of Total Phenolic Content (TPC)

The determination of the TPC in C. album was based on the UV spectrophotometric method previously reported [35], with minor modifications. Samples of frozen flesh were ground to powder with liquid nitrogen, and 500 mg aliquots of ground samples were suspended in 15 mL of prechilled 40% ethanol. The mixture underwent ultrasonication (KQ-600DE Ultrasonic Instruments, Kunshan, China) for 30 min. After centrifugation for 10 min at 10,000 rpm, we obtained the supernatant. The procedure was then repeated. The supernatant was collected and diluted, and UV–vis spectroscopy determined the light absorption value at a 263 nm wavelength (Lambda-25, Perkin Elmer, Waltham, MA, USA). The TPC of C. album fruits was calculated according to the standard curve of gallic acid (GA) (Yuanye Biotech Co., Ltd., Shanghai, China).

2.3. RNA Sample Preparation

Samples of frozen C. album flesh were ground into flour with liquid nitrogen. The total RNA was extracted from each sample using the TRIzol reagent (Life Technologies, Carlsbad, CA, USA) and processed according to the manufacturer’s protocol. The integrity of the RNA was detected on an Agilent 2100 Bioanalyzer (Agilent Technologies, Santa Clara, CA, USA) and agarose gel electrophoresis. The purity and concentration of the RNA were checked using a NanoDrop micro-spectrophotometer (Thermo Fisher, Waltham, MA, USA).

2.4. PacBio Library Construction and Single-Molecule Sequencing

Approximately 6 μg of total the RNA of C. album (pooled into equal amounts from each sample) was used for PacBio library construction. Oligo (dT) magnetic beads were enriched with mRNA and then reverse transcribed into cDNA. The optimal amplification cycle number generated double-stranded cDNA. Then, the BluePippinTM Size-Selection System was used to perform the >4 kb size selection and the next SMRTbell library construction. After DNA damage was repaired and end-repairs were completed, cDNA templates were ligated with sequencing adapters, primer, and polymerase. Gene Denovo Biotechnology Co. (Guangzhou, China) performed the single-molecule sequencing by the PacBio Sequel platform using P6-C4 chemistry with 10 h movies.

2.5. Illumina RNA-Seq Library Construction and Sequencing

Twelve RNA samples from four development stages of C. album fruit were used for Illumina library construction and paired-end sequencing following the standard high-throughput instruction on the Illumina HiSeqTM 4000 platform (Gene Denovo). First, mRNA from each sample was enriched using Oligo (dT) beads, and Ribo-ZeroTM Magnetic Kit (Epicentre) was used to wipe off the rRNA. Second, the enriched mRNA was fragmented into short fragments and reverse transcribed into cDNA with random primers. Third, the cDNA fragments were ligated to Illumina sequencing adapters after purification, end repair was performed, and poly(A) was added. Finally, the ligation products were selected by purified, PCR amplified, and sequenced using Illumina HiSeqTM 4000.

2.6. Data Analyses of Single-Molecule Sequencing Data

The raw sequencing reads from cDNA libraries were classified and subjected to the circular consensus sequence (CCS) reads through the SMRT Link v6.0 pipeline. This was used to classify the raw sequencing reads from cDNA libraries and clustered to transcript consensus [36]. According to cDNA primers and poly-A tail signal, CCS reads could be classified into full-length non-chimeric (FLNC), non-full-length (nFL), full-length chimaera, and short reads that were discarded. Subsequently, the FLNC reads were clustered by ICE (iterative clustering for error correction) algorithm to generate the cluster consensus isoforms. To obtain the FL polished high-quality consensus sequences (accuracy ≥ 99%), the nFL reads were polished by Quiver algorithm, and the low-quality isoforms were further corrected using Illumina short reads obtained from the same samples by the LoRDEC tool (version 0.8) [33]. Ultimately, to filter the final transcriptome isoform sequences, the software CD-HIT-v4.6.7, with a threshold of 0.99 identities, was used to remove the redundant sequences.
Basic annotation of isoforms was performed, including protein functional annotation, pathway annotation, eukaryotic clusters of orthologous groups (KOG) functional annotation, and Gene Ontology (GO) annotation. Isoforms were BLAST-analyzed against the NCBI non-redundant protein (Nr) database (http://www.ncbi.nlm.nih.gov, accessed on 27 August 2021), the Swiss-Prot protein database (http://www.expasy.ch/sprot, accessed on 27 August 2021), the Kyoto Encyclopedia of Genes and Genomes (KEGG) database (http://www.genome.jp/kegg, accessed on 27 August 2021), and the COG/KOG database (http://www.ncbi.nlm.nih.gov/COG, accessed on 27 August 2021) with the BLASTx program (http://www.ncbi.nlm.nih.gov/BLAST, accessed on 27 August 2021) at an E-value threshold of 10−5 to evaluate sequence similarity with genes of other species. GO annotation was analyzed by Blast2GO software [37] according to Nr annotation results of isoforms. Then, the GO functional classification of isoforms was performed using the WEGO software [38]. The protein coding sequences of isoforms were aligned by hmmscan to the Plant TF database (PlnTFDB; http://planttfdb.cbi.pku.edu.cn/, accessed on 27 August 2021) and to TF families.

2.7. Quality Assessment of Transcriptome Assembly

To obtain high-quality clean reads of RNA-seq data, we filtered raw reads after eliminating reads with adapters and containing unknown nucleotides (N ≥ 10%); the low-quality reads containing more than 40% of low-quality bases (Q-value ≤ 20) were also discarded. At the same time, the Q20, Q30, and GC content were calculated. After alignment with Ribosome RNA (rRNA), residual rRNA reads were removed, and we acquired high-quality clean reads. Using the full-length isoforms generated from SMRT sequencing as reference sequences, the high-quality clean reads were mapped to the reference transcriptome by the short reads alignment tool Bowtie2 [39] with default parameters, and the mapping ratio was calculated. Only high-quality clean reads with a perfect match were further analyzed. To evaluate the sequencing data’s reliability and operational stability, we calculated the correlation coefficient and the principal component analysis (PCA) among samples. The closer the correlation coefficient approaches to 1 indicated, the better the repeatability between two parallel experiments. PCA was performed using R package models (http://www.r-project.org/, accessed on 27 August 2021).

2.8. Differentially Expressed Genes (DEGs) Analysis and Functional Annotation

The gene abundances were calculated and normalized to FPKM (fragments per kilobase of transcript per million fragments mapped) [40]. The unigene expression levels among the different development stages of C. album were further analyzed based on RNA-seq. The edgeR package (http://www.r-project.org/, accessed on 27 August 2021) identified DEGs across four periods with a fold change (FC) ≥ 2 and a false discovery rate (FDR) < 0.05 in comparison. Then, all DEGs were subjected to enrichment analysis of GO functions and KEGG pathways to identify significantly enriched GO terms and metabolic pathways.

2.9. Gene Validation and Quantitative Real-Time PCR (RT-qPCR) Analysis

RT-qPCR characterized the expression profiles of 9 DEGs to validate the reliability of RNA-seq. The total RNA of each sample was firstly extracted and used for first-strand cDNA synthesis according to the instructions provided with the RNAprep Pure Plant Kit (Polysaccharides & Polyphenolics-rich) and the FastKing gDNA Dispelling RT SuperMix (TIANGEN, Beijing, China).
The corresponding primer pairs were designed using Primer 5.0 software, and the primer sequence information is given in Table S1. RT-qPCR was performed on a Roche LightCycler96 instrument (Kanton Basel, Basel, Switzerland) using SYBR-green to detect gene expression abundances according to the protocol of RealUniversal Color PreMix (SYBR Green) (TIANGEN). Briefly, 20 μL of the reaction mixture was added to each well. The PCR reactions were performed by a predegeneration at 95 °C for 15 min followed by 40 cycles at 95 °C for 10 s and 60 °C for 20 s. The dissociation curves identified nonspecific PCR products. Three biological replicates with three technical replicates were carried out.
The RT-qPCR output data were generated by the instrument’s on-board software LightCycler® 96 SW 1.1 (Roche). The beta-actin gene (ACT7) was used as an internal control [41]. The 2−∆∆CT method was used to determine the relative expression levels of the genes that were calculated for development time points relative to the first sampling time point [42].

3. Results

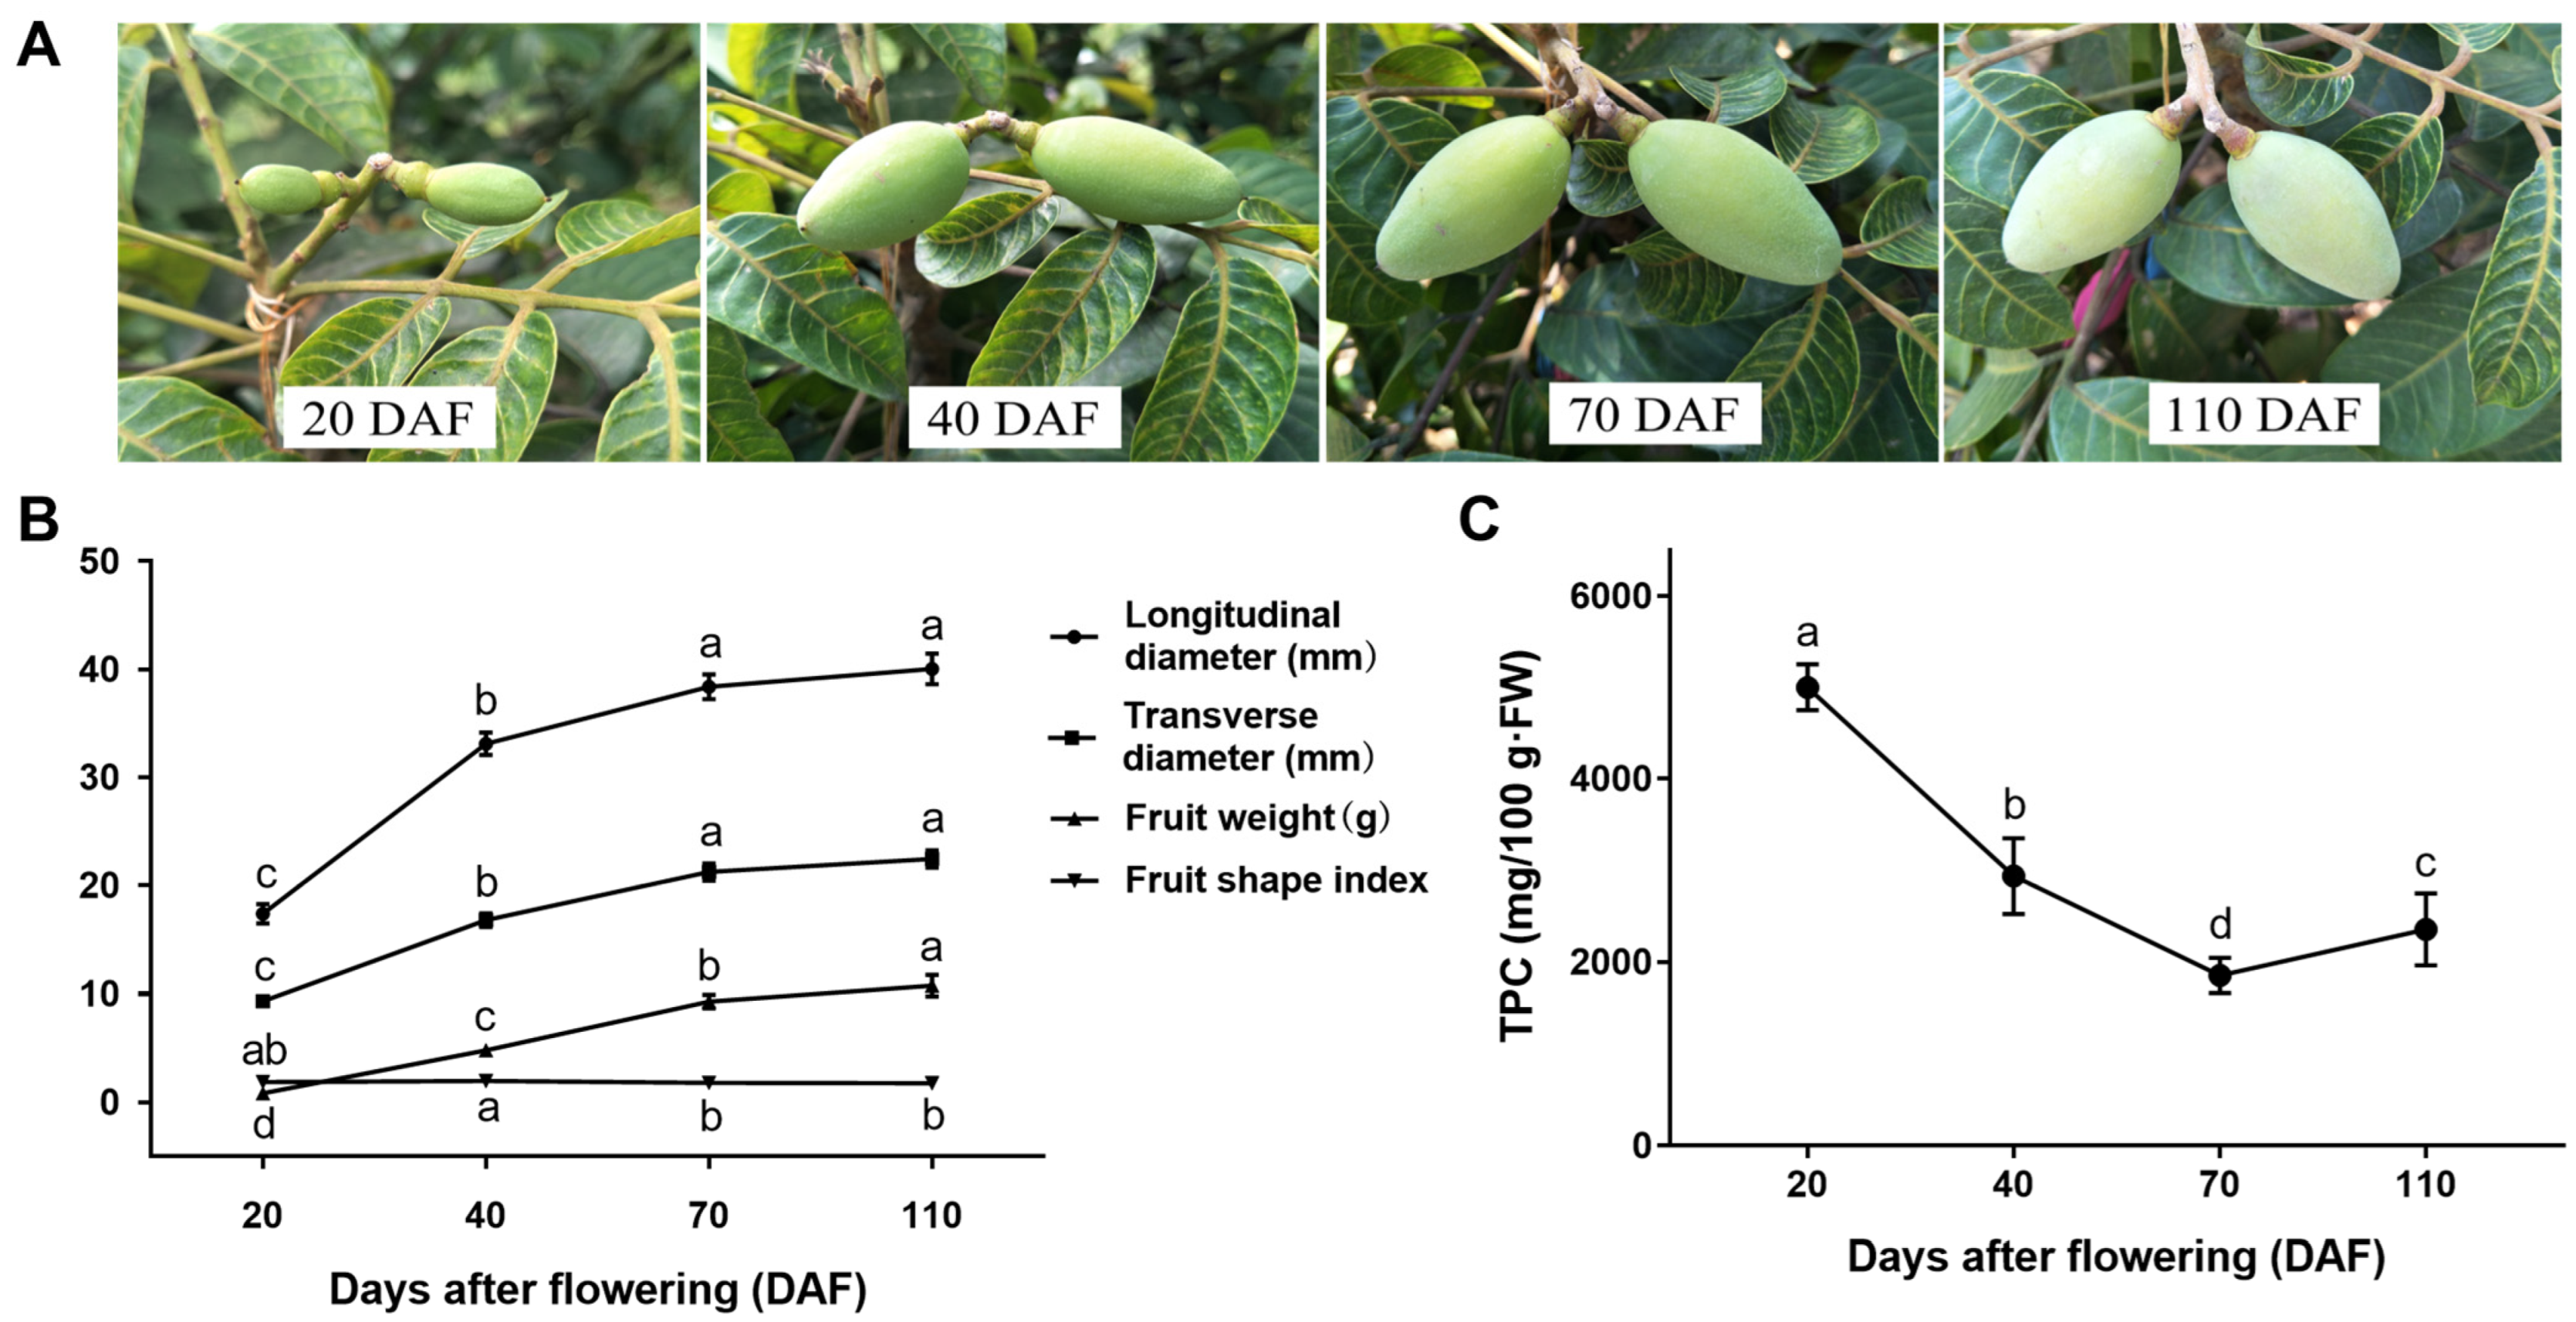
3.1. Growth and Development and TPC of C. Album Fruits

The developmental phenotypic characteristics of C. album fruits are shown in Figure 1A. During the rapid growth period, from 20 DAF to 70 DAF, the longitudinal and transverse diameters of the fruit increased significantly (Figure 1B), and the fruit expanded. Until 110 DAF, the fruit grew steadily. During fruit growth and development, the longitudinal diameter increased from 17.39 mm to 40.04 mm, while the transverse diameter grew from 9.34 mm to 22.45 mm, and the fruit weight gained from 0.83 g to 10.76 g. Polyphenols are essential components affecting fruit quality [43,44]. The fruit shape index remained relatively stable throughout the entire growth period. As shown in Figure 1C, in the early stage of C. album fruit development, the TPC decreased significantly from 5001.24 mg/100 g·FW (20 DAF) to 1855.26 mg/100 g·FW (70 DAF) and increased slightly to 2355.32 mg/100 g·FW in the 110 DAF.

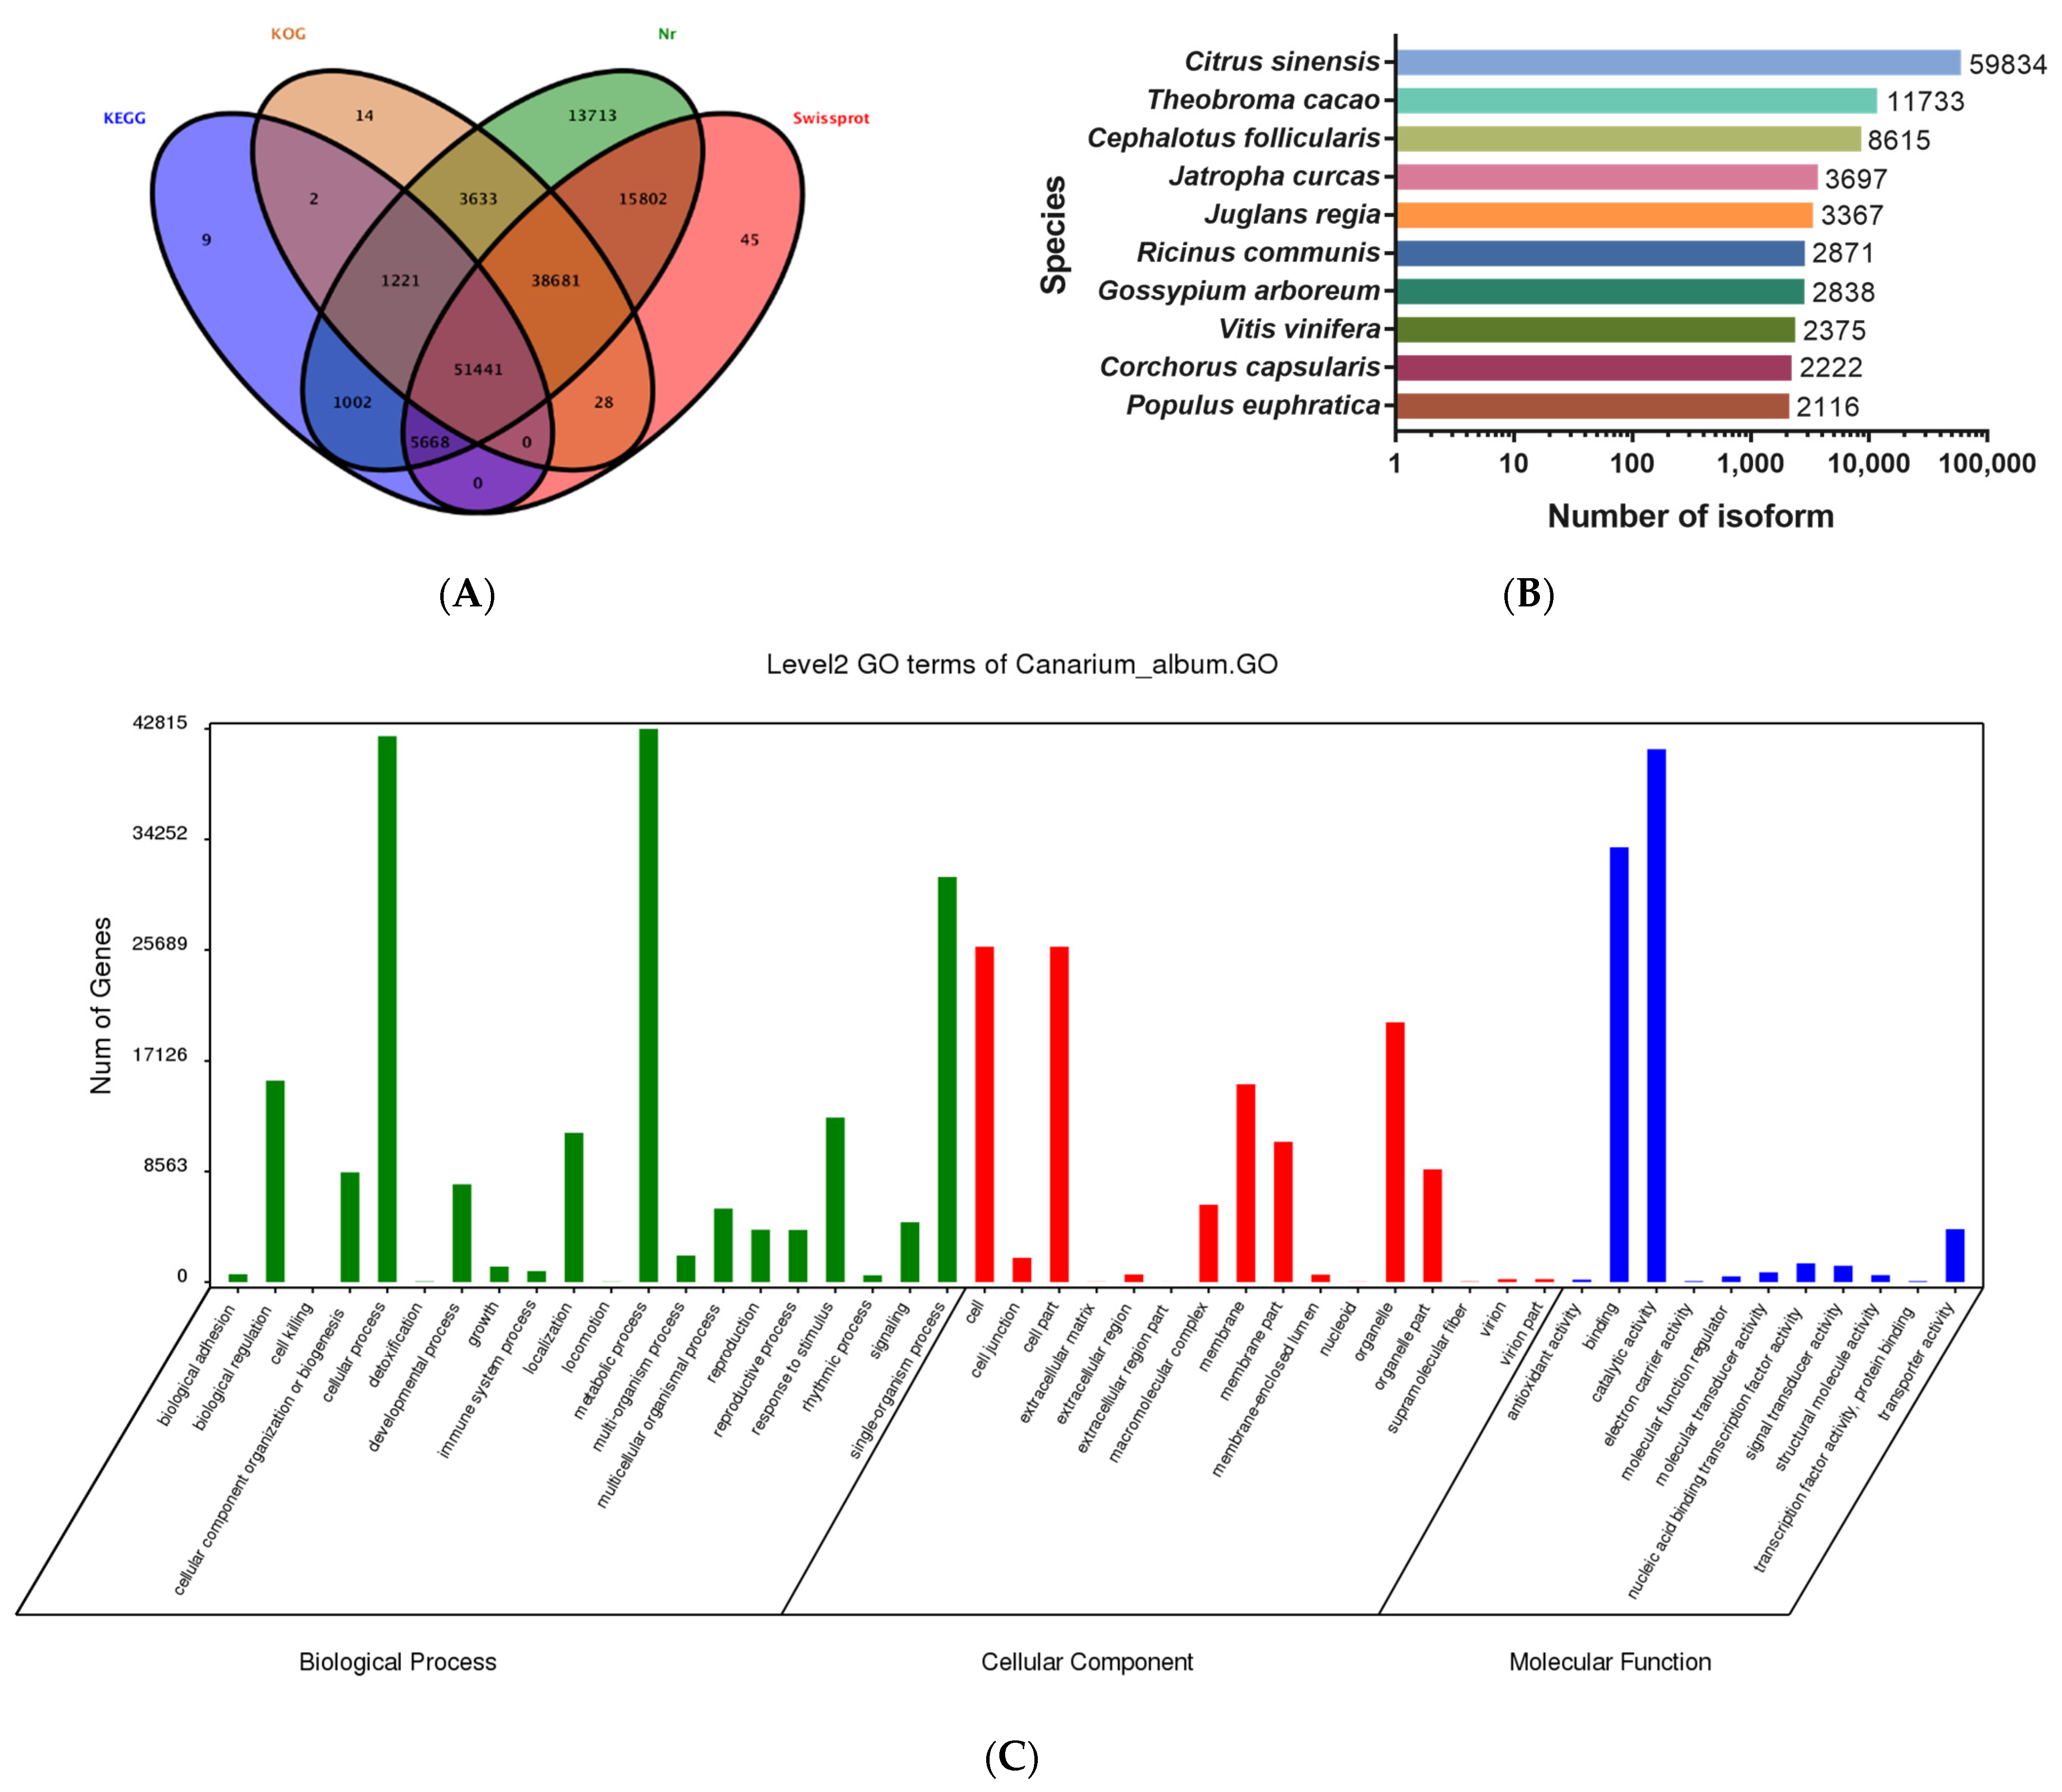
3.2. PacBio SMRT Sequencing Captures Full-Length Transcripts of C. album

Full-length cDNA sequences are essential for correct annotation and identification of authentic transcripts from fruits. We used SMRT technology to construct the complete and full-length C. album transcriptome. We generated 9,196,552 subreads (20 billion bp) using the PacBio Sequel platform (Table S2). We obtained approximately 35.2 Gb of subreads data. All the raw read data have been deposited into the NCBI Sequence Read Archive database (PRJNA749395). A total of 378,289 FLNC reads with an average size of 2670 bp were identified, accounting for 87.19% (Table S3, Figure S1). After filtering the short reads, removing 5′ primer, 3′ primer, and poly-A of FLNC, and clustering and polishing, we obtained high-quality consensus isoforms (Figure S2). Meanwhile, the Illumina RNA-seq library corrected errors to improve the accuracy of sequences further. We acquired a total of 135,439 isoforms as the final full-length transcriptome isoform sequences (Table 1) and the length distribution of the isoform sequences, as shown in Figure S3. The average length of all isoforms was 2687.94 bp, N50 length was 3224 bp, and the GC content was 40.47% (Table 1, Figure S3).
All full-length isoforms were analyzed based on Blastx (E-value ≤ 10−5) searches against the public database to predict the function of these unigenes. According to the results of four database annotations (Figure 2A, Table S4), up to 131,258 isoforms (96.91%) were annotated for function. The number of isoforms assigned to these four databases ranged from 59,342 (43.81%, KEGG) to 131,160 (96.84%, Nr). As shown in Figure 2B, Citrus sinensis has the highest similarity to C. album with 59,834 isoforms (45.62%), followed by Theobroma cacao (8.95%) and Cephalotus follicularis (6.57%). We allocated 70,942 isoforms (52.38%) to GO databases, which were distributed across three main categories: biological process (49.49%), cellular component (29.38%), and molecular function (21.13%) clusters, and further classified them into 47 subcategories (Figure 2C). The candidate genes involved in metabolic and cellular processes of the biological process were the most represented, followed by the catalytic activity of the molecular function. In addition, 95,019 isoforms (70.16%) were allocated to KOG databases (Figure 2D). Among the 25 KOG categories, general function prediction only represented the largest group (33,501 genes, accounted 17.74%), followed by signal transduction mechanisms (25,560, 13.54%) and posttranslational modification, protein turnover, and chaperones (21,886, 11.59%). Moreover, 111,664 isoforms (82.45%) and 59,342 isoforms (43.81%) were allocated to the Swiss-Prot and KEGG databases, respectively (Table S4).

3.3. Quality Evaluation of Illumina RNA-Seq
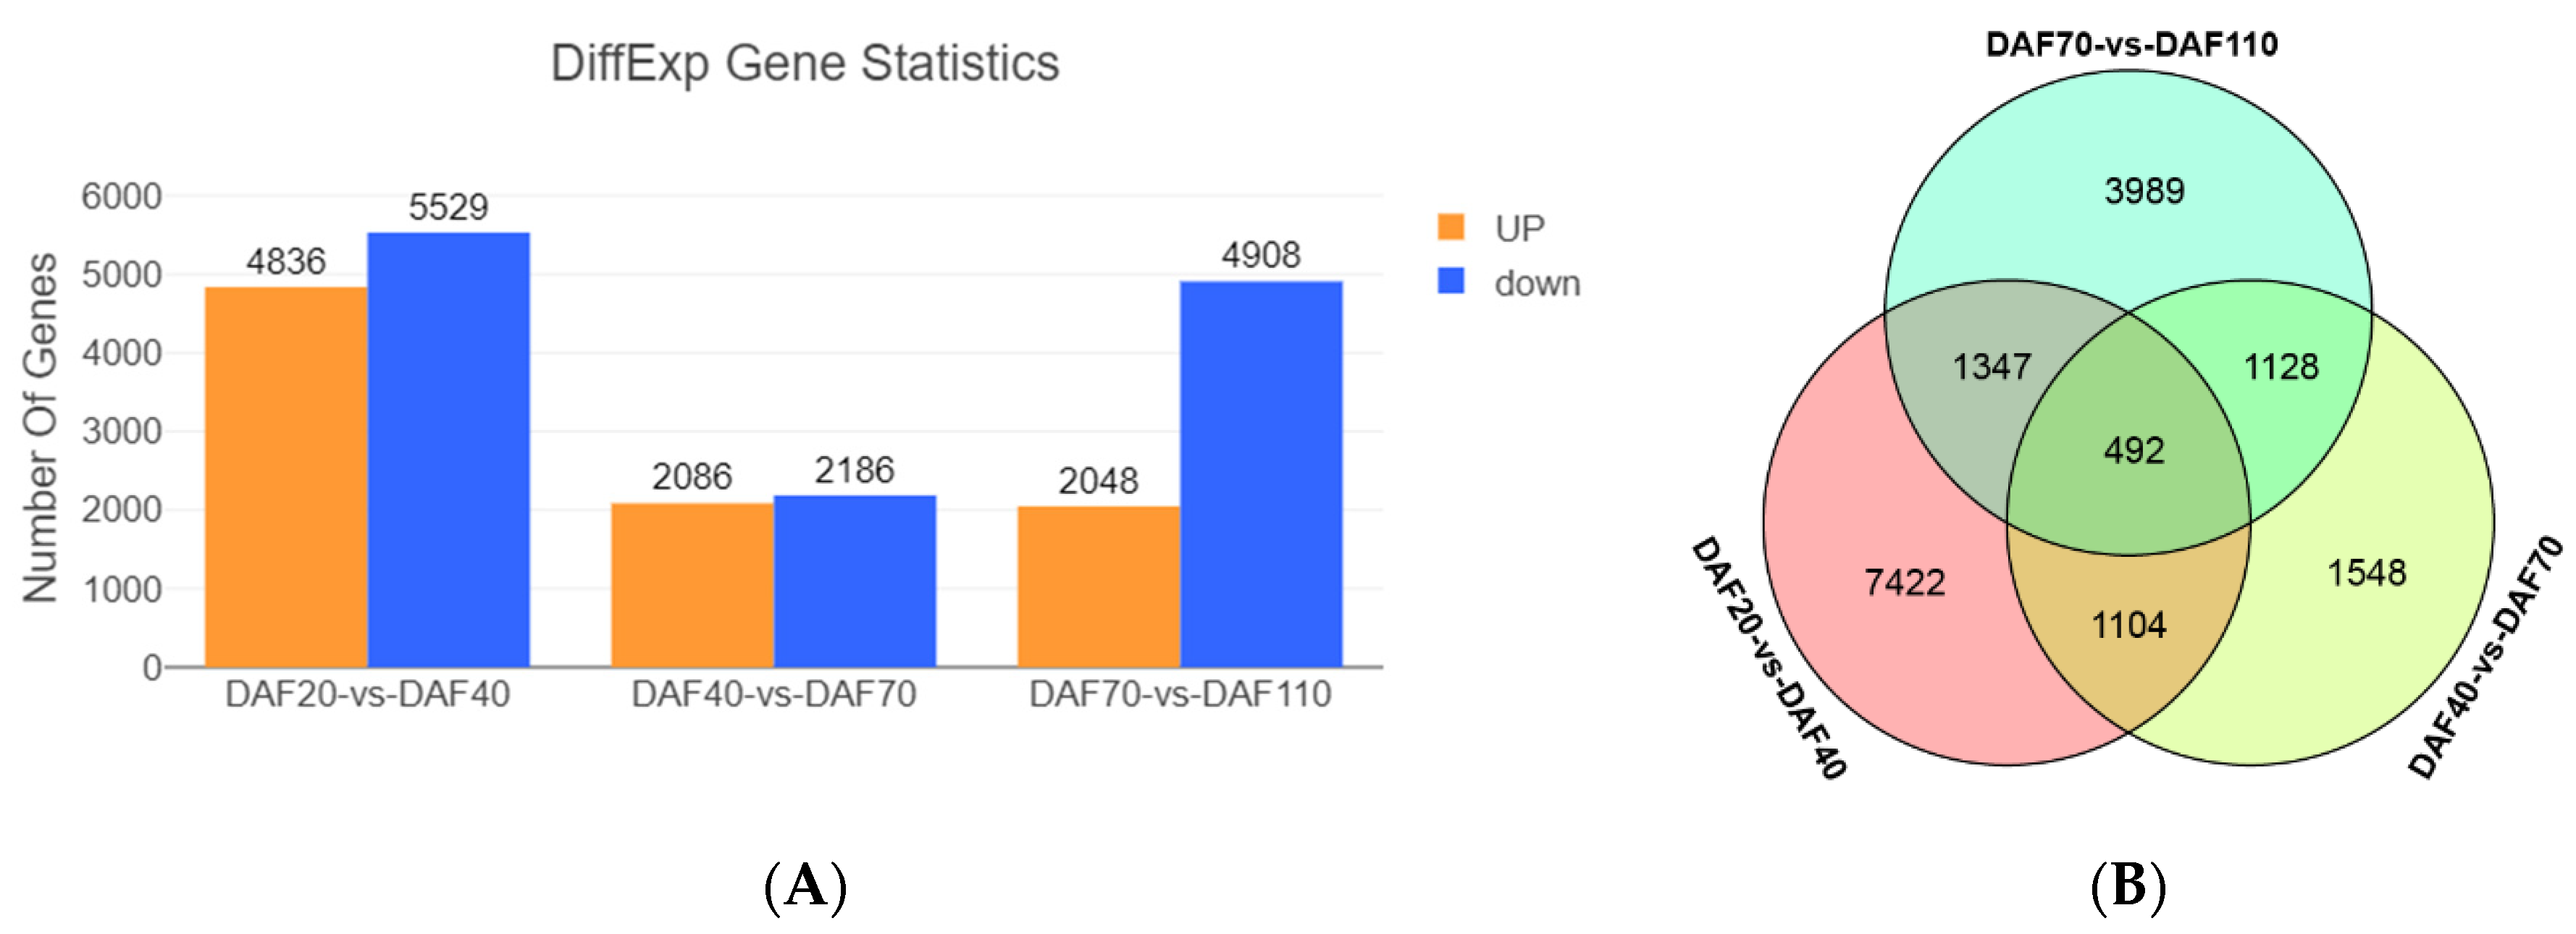
We designed twelve cDNA libraries (three for each stage) for RNA-Seq. In total, 523,412,216 raw reads were generated by the Illumina HiSeqTM 4000 platform (PRJNA749395), yielding a total of 522,724,448 high-quality clean reads (78 billion bp) with an average of 43,560,370 clean reads for each library (Table S5). The Q20 and Q30 of all libraries were more than 97% and 93%, respectively. The average GC content was 44.61%.
The clean reads were then mapped to the reference genes of the C. album full-length transcriptome database via the Bowtie2 software. This would significantly enhance the accuracy of gene annotation and transcriptome characterization [45]—an average of 94.66% of clean reads mapped to the full-length transcripts (Table S6). We evaluated the relative abundance values by calculating the FPKM. Finally, 113,803 genes were identified in all samples, accounting for 84.03% of all reference genes, with more than 88,000 genes from each library (Table S7). The correlation and PCA analyses indicated that the sample had good repeatability, stable operation, and reliable sequencing data (Figure S4).

3.4. DEGs Analysis

The DEGs between groups that met the criteria with FDR < 0.05 and |log2FC| > 1 were screened. Comparative analysis of DEGs at different development stages of C. album fruits (Figure 3A) was performed. In the DAF20-vs-DAF40, DAF40-vs-DAF70, and DAF70-vs-DAF110 groups, 10,365, 4272, and 6956 DEGs were detected, respectively. In the DAF20-vs-DAF40 group, the number of up-regulated and down-regulated DEGs was the highest, with 4836 and 5529 DEGs, respectively. This indicated that more physiological and biochemical activities occurred in C. album fruits during 20~40 DAF. In general, there were more down-regulated DEGs than up-regulated DEGs in each comparison group, especially in the DAF70-vs-DAF110 group, where the number of down-regulated DEGs was 2.4 times as large as that of the up-regulated DEGs, indicating that more genes had adverse regulation effects on C. album fruit development. In total, 492 genes exhibited significant expression changes in all comparison groups, indicating that these genes have a critical regulatory role in fruit growth (Figure 3B). There were 7422, 1548, and 3989 DEGs in DAF20 vs. DAF40, DAF40 vs. DAF70, and DAF70 vs. DAF110, respectively, which may play a unique role in different developmental stages of C. album fruit.

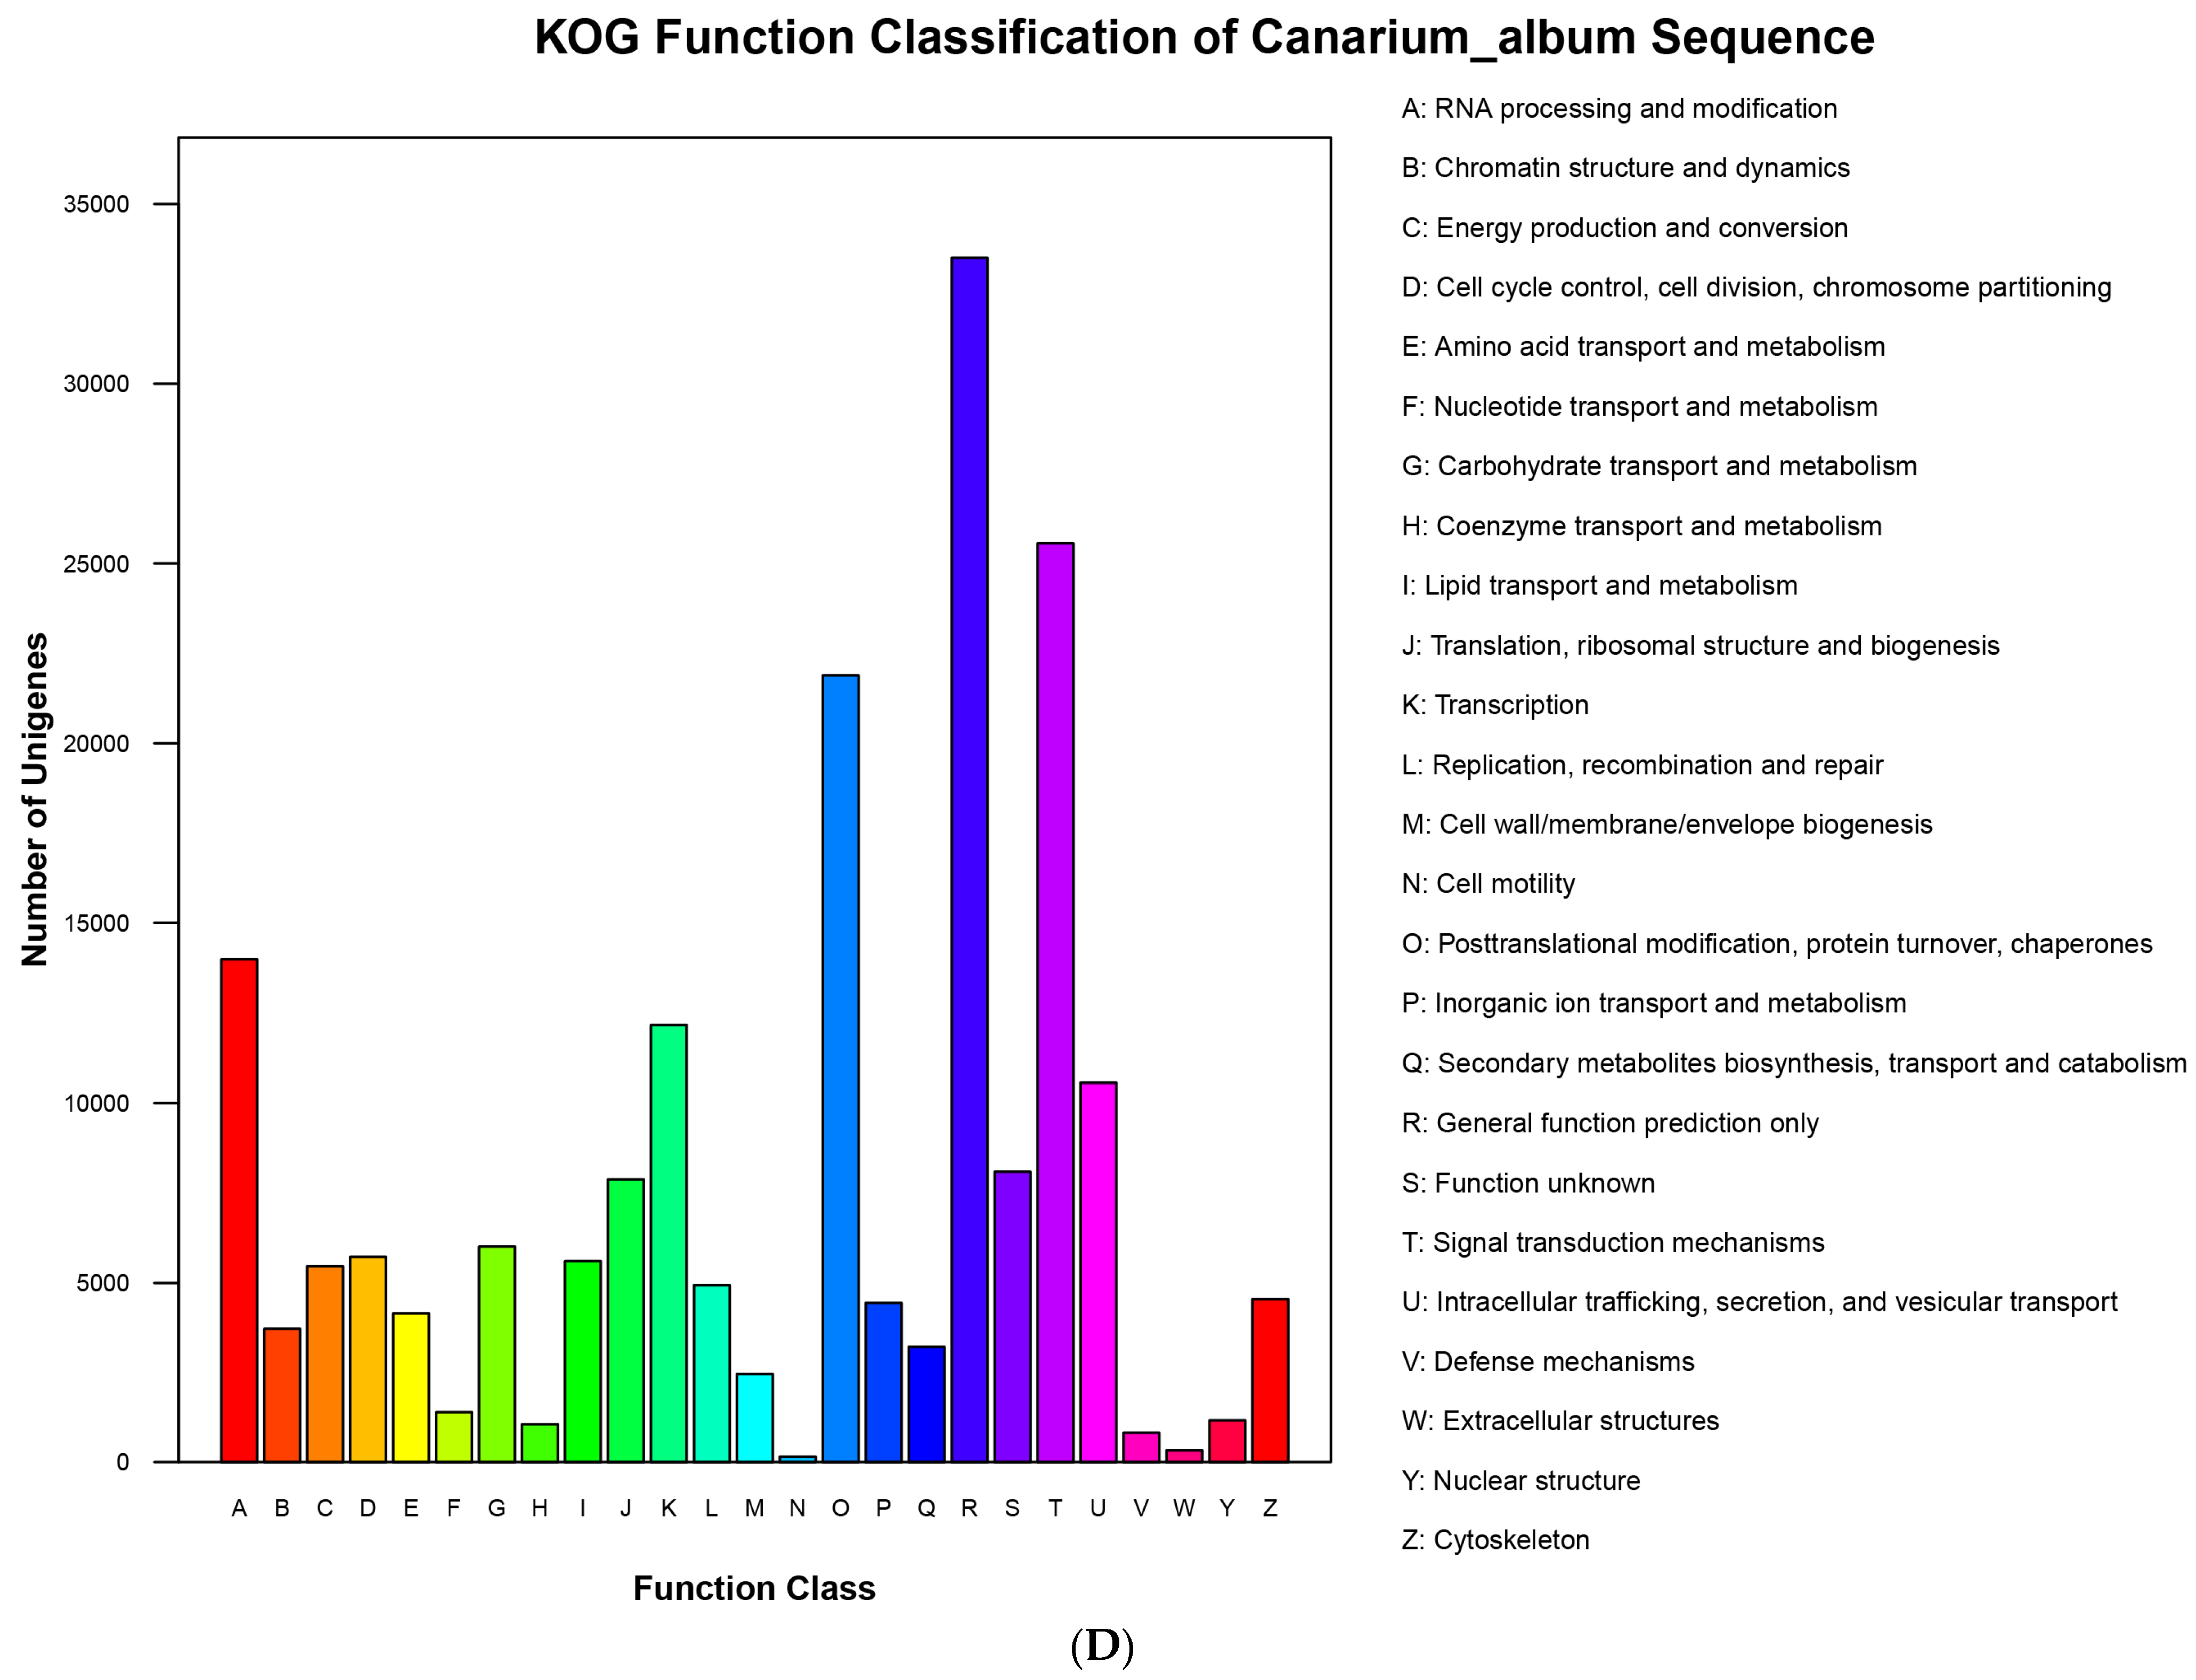
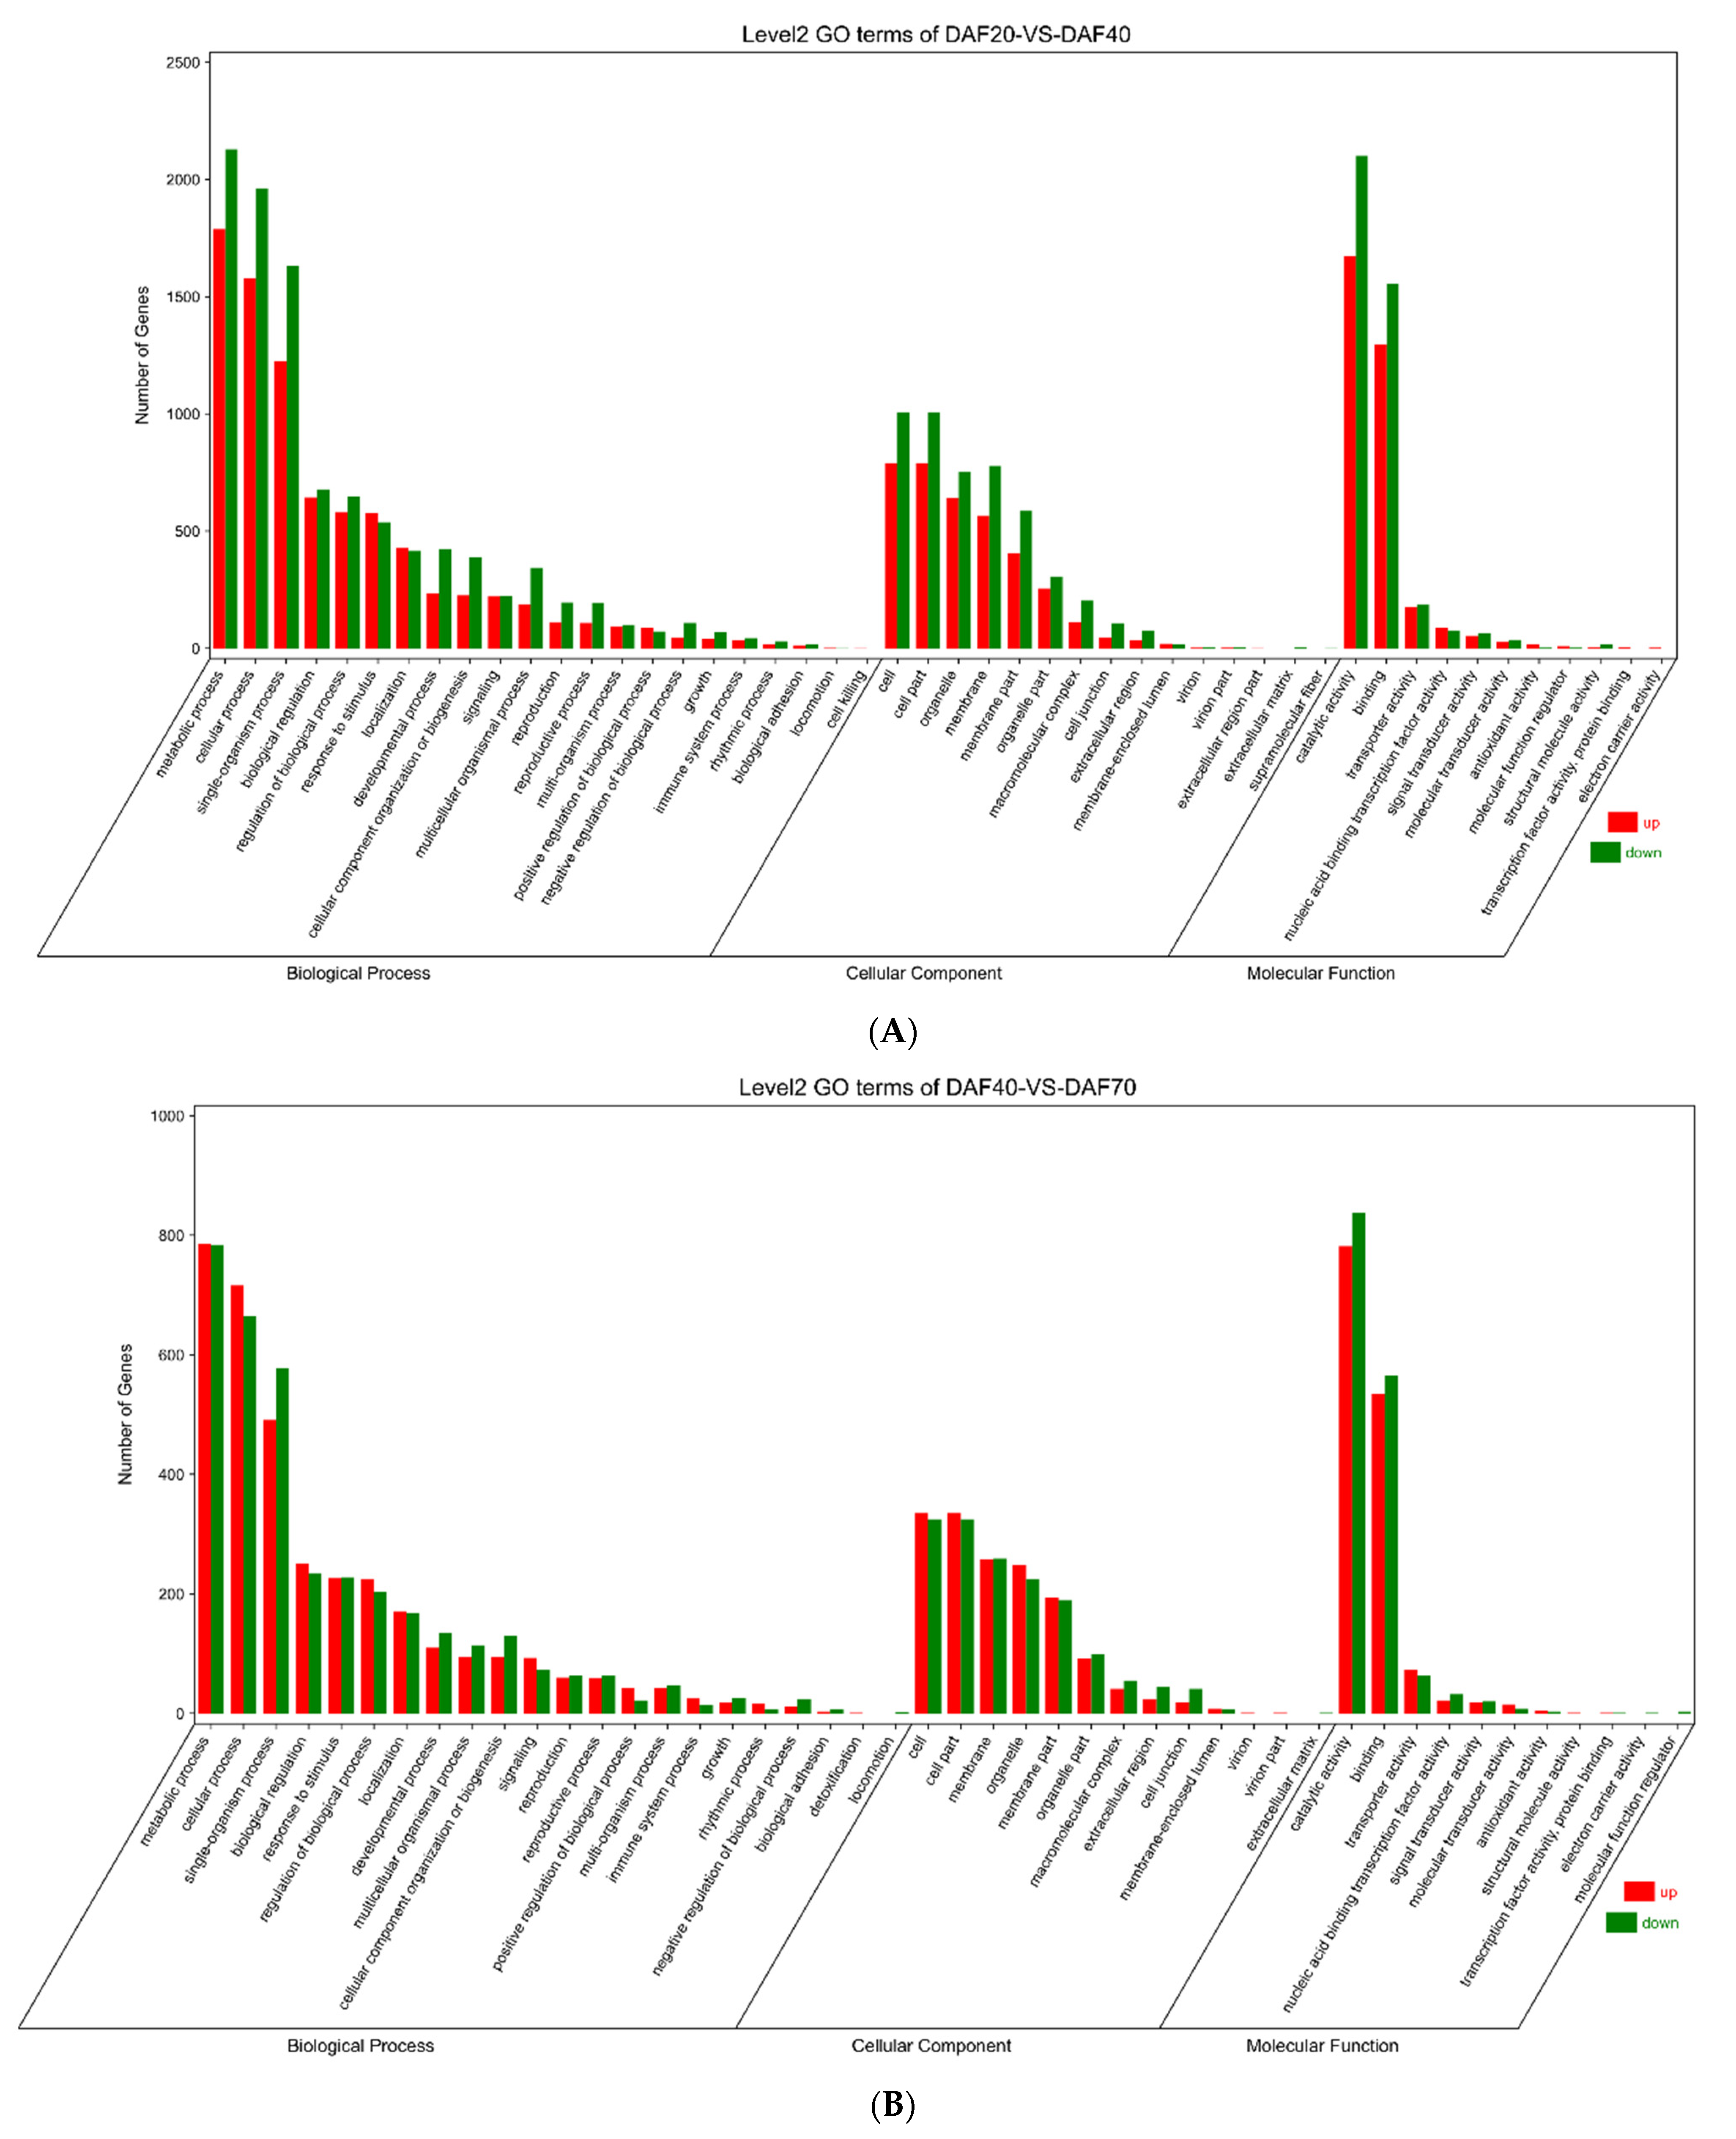
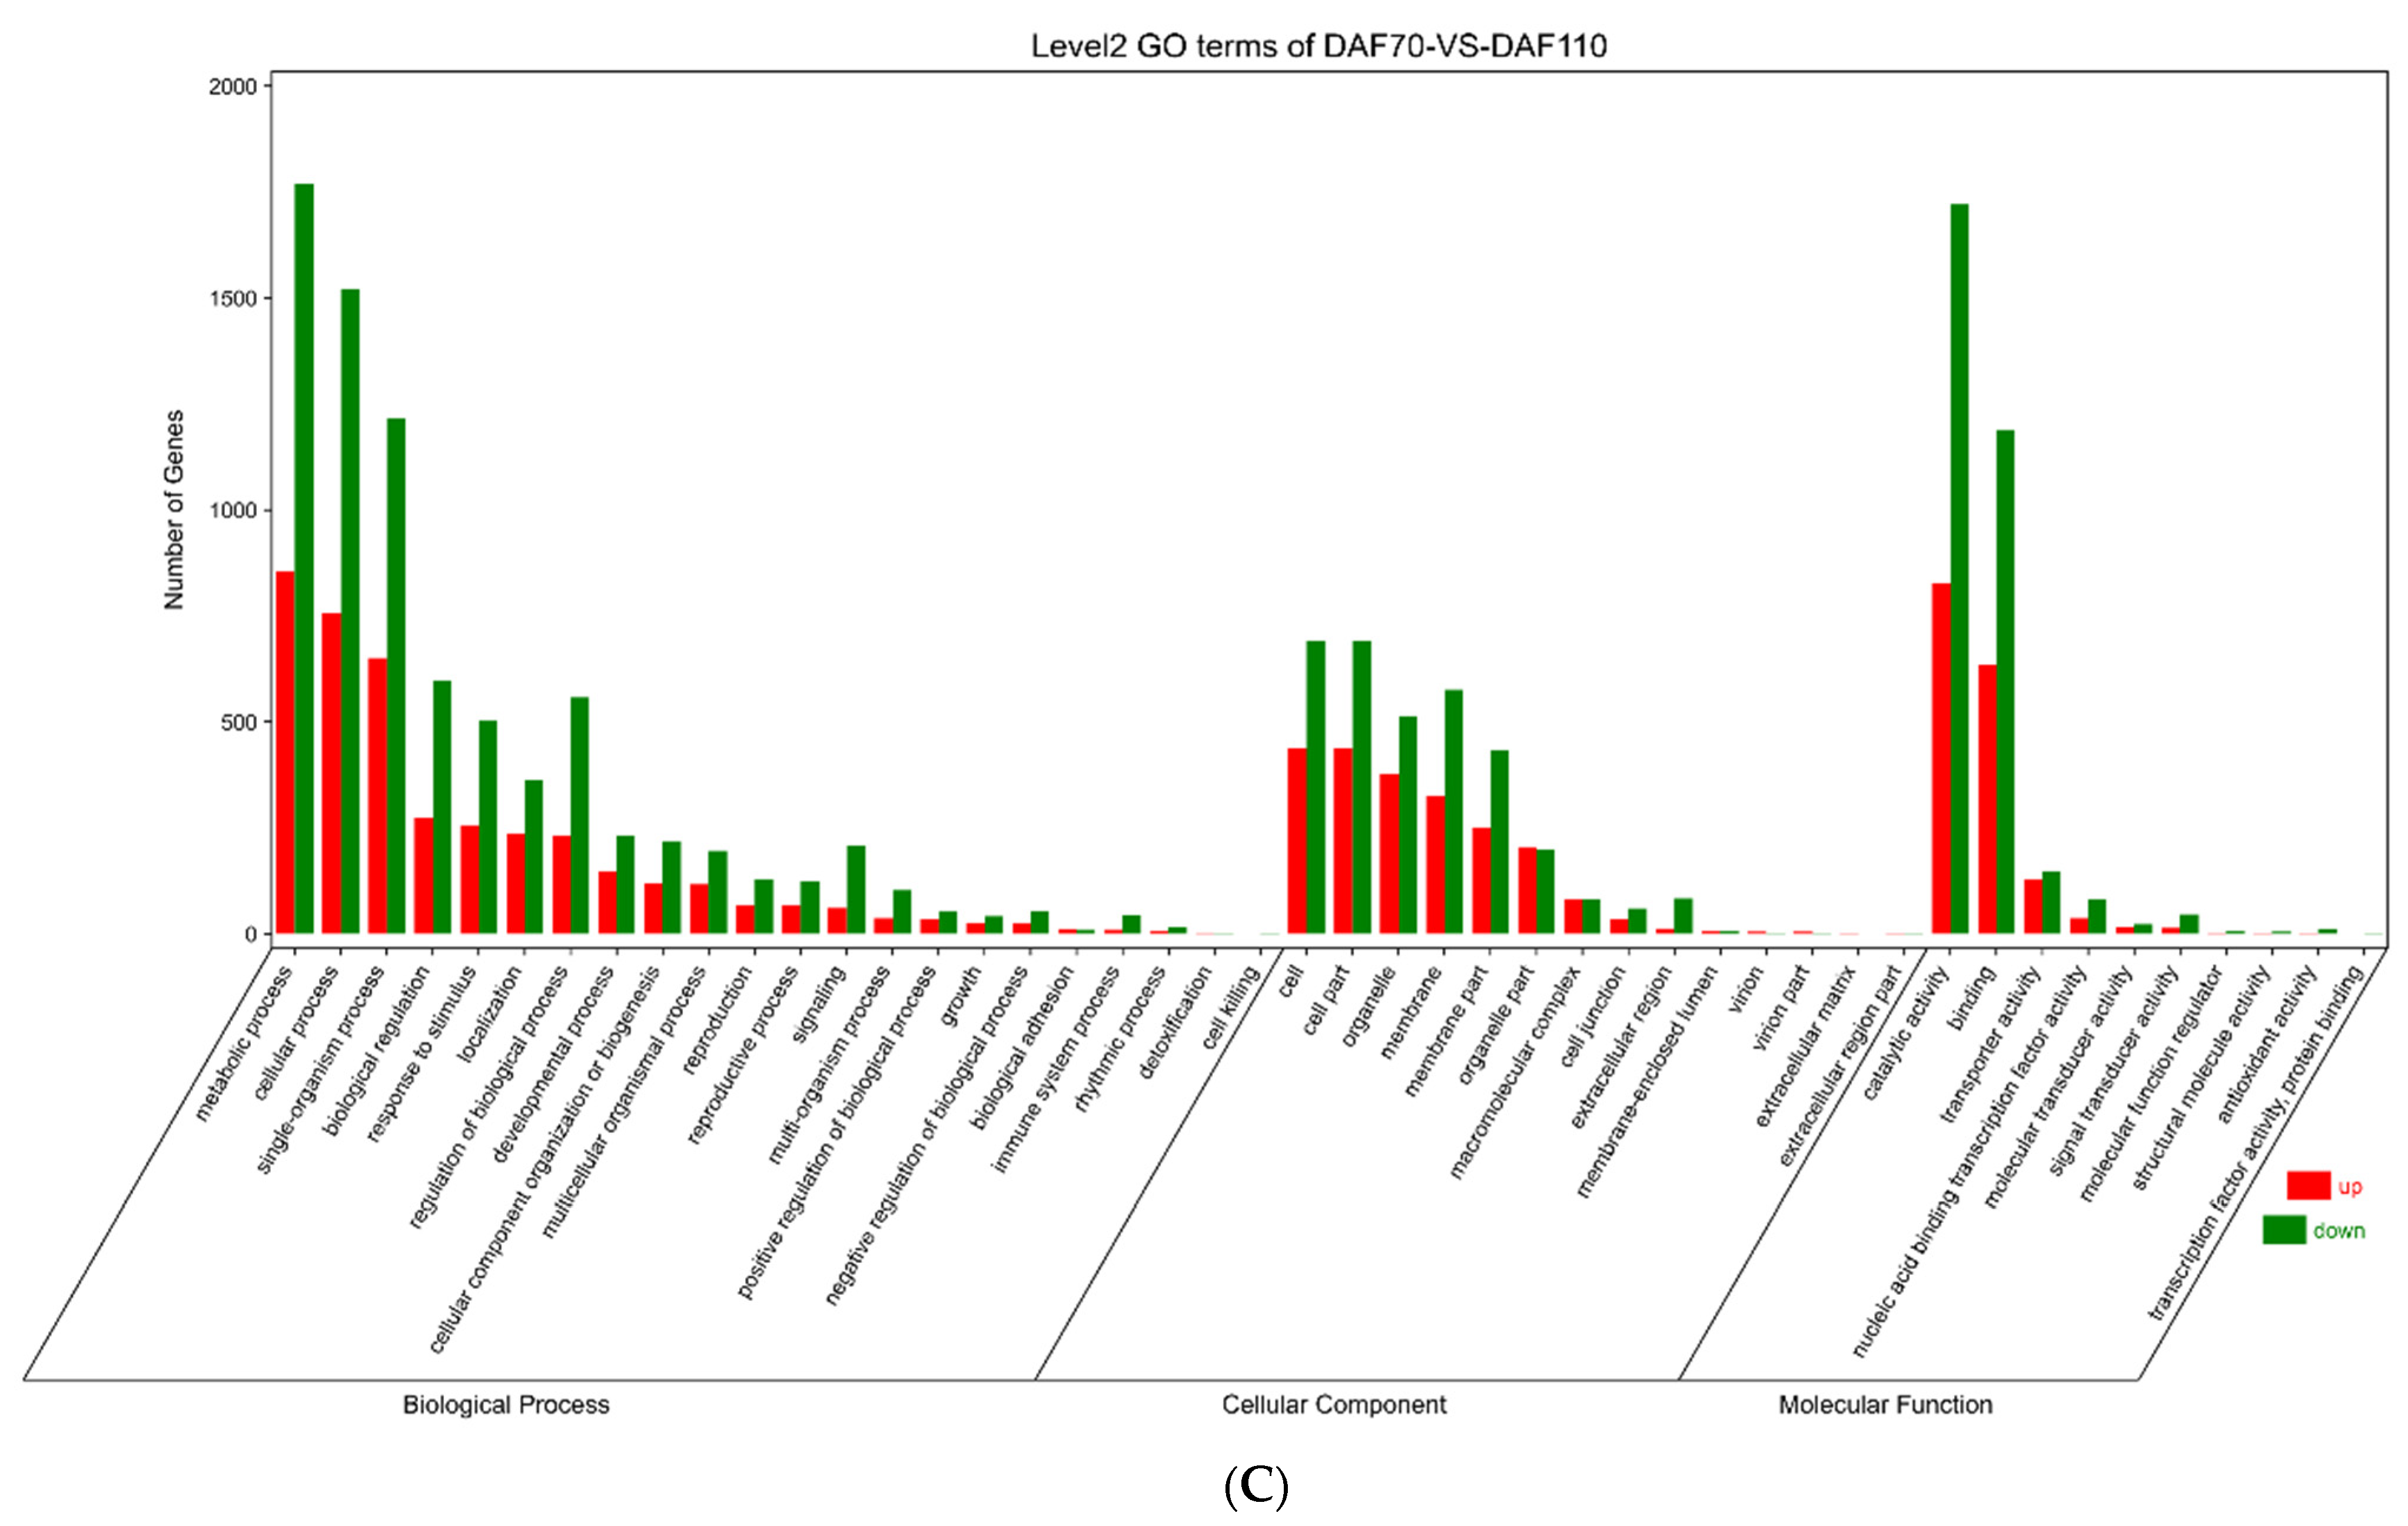
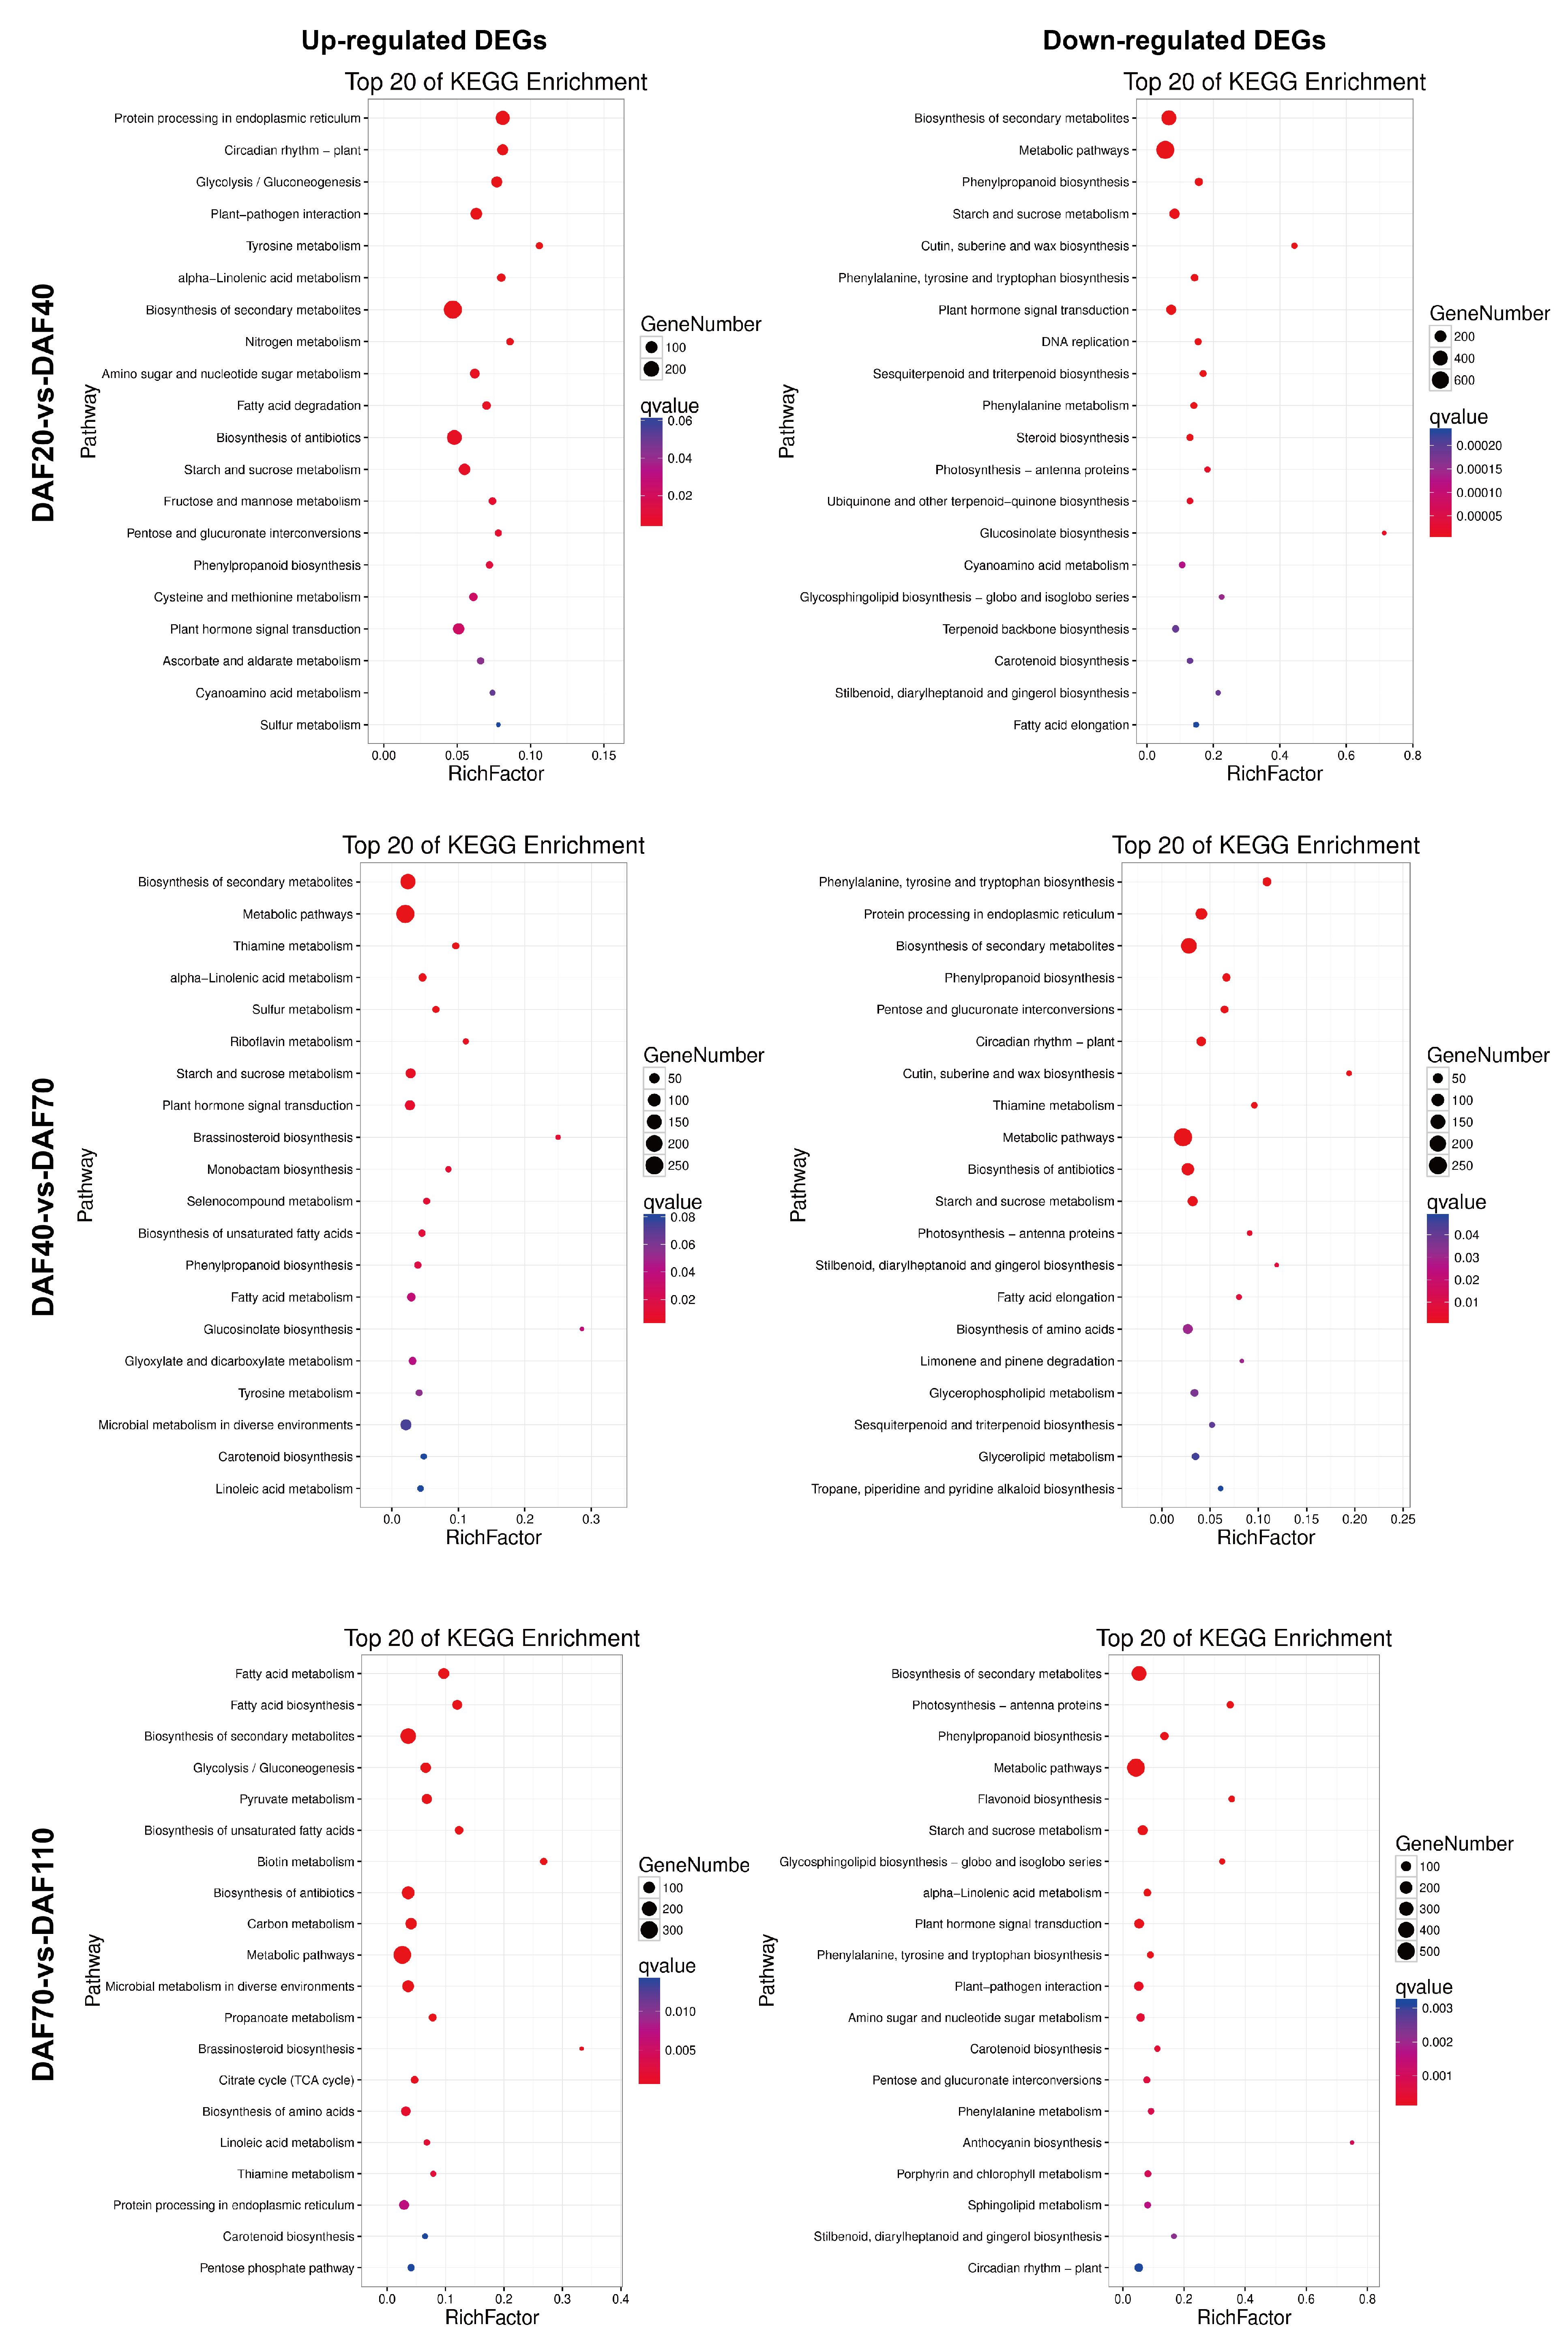
3.5. Functional Annotation of DEGs

Functional annotation was performed on the GO database for DEGs in each group to reveal the functions of these genes involved in fruit development. As shown in Figure 4, DEGs of the DAF20 vs. DAF40, DAF40 vs. DAF70, and DAF70 vs. DAF110 groups were mainly involved in the following functional categories: ‘metabolic process’, ‘cellular process’, and ‘single-organism process’ of the biological progress term; ‘catalytic activity’ and ‘binding’ of the molecular function term; and ‘cell’ and ‘cell part’ of the cellular component term. The DAF20 vs. DAF40 group had more DEGs in each function category. There were more down-regulated DEGs than up-regulated DEGs in each group, especially in the DAF70 vs. DAF110 group, where the number of down-regulated DEGs was almost twice as large as the number of up-regulated DEGs in major subcategories. The results showed that the physiological activities from 20 DAF to 40 DAF and 70 DAF to 110 DAF were more active than those at the 40 DAF to 70 DAF stages during the development of C. album fruits, mainly in terms of metabolism and catalytic function.
We performed KEGG pathway enrichment analysis to understand the characteristics of the complex biological behavior observed in the transcriptome profiles. The overall response pathways of DEGs were presented (Figure 5). In each comparison group, many DEGs concentrated on metabolic pathways and biosynthesis of secondary metabolites. In the up-regulated DEGs, ‘protein processing in endoplasmic reticulum’, ‘circadian rhythm-plant’, ‘glycolysis/gluconeogenesis’, ‘biosynthesis of antibiotics’, and ‘starch and sucrose metabolism’ were significantly enriched in DAF20 vs. DAF40. Meanwhile, ‘brassinosteroid biosynthesis’, ‘riboflavin metabolism’, and ‘biotin metabolism’ were significant from DAF40 to DAF110. In the down-regulated DEGs, the most substantial enrichment pathways of DAF20 vs. DAF40 were ‘phenylpropanoid biosynthesis’, ‘starch and sucrose metabolism’, ‘plant hormone signal transduction’, and ‘phenylalanine, tyrosine and tryptophan biosynthesis’. In addition, ‘cutin, suberine and wax biosynthesis’ and ‘glucosinolate biosynthesis’ were also significantly enriched. Compared with DAF20 vs. DAF40, ‘phenylalanine, tyrosine and tryptophan biosynthesis’, ‘protein processing in endoplasmic reticulum’, ‘phenylpropanoid biosynthesis’, and ‘pentose and glucuronate interconversions’ got richer enrichment in DAF40 vs. DAF70. Interestingly, ‘flavonoid biosynthesis’ was the significantly enriched pathway in DAF70 vs. DAF110. The results indicate that the metabolism in the development of C. album fruit is a very complex biological process. Among thesis pathways, ‘phenylpropanoid biosynthesis’, ‘phenylalanine, tyrosine and tryptophan biosynthesis’, and ‘flavonoid biosynthesis’ were significantly enriched, and were most closely related to the polyphenol metabolism of C. album fruit and deserved further attention.

3.6. Identification of DEGs in Major Polyphenol Biosynthetic Pathway

Polyphenol metabolism mainly includes three main biosynthetic pathways: the hydrolysable tannin (HT) biosynthesis pathway, the phenylpropanoid biosynthesis pathway, and the flavonoid biosynthesis pathway, which also refers to the biosynthesis of hydrolysable tannins (HTs), lignins, lignans, flavones, flavonols, anthocyanins, and condensed tannins (CTs). Among them, the HT biosynthesis pathway is a branch of the shikimic acid pathway. Here, we analyzed DEGs related to polyphenol biosynthesis pathways in C. album fruits and their expression patterns at four developmental stages. We further analyzed the three main metabolic pathways.

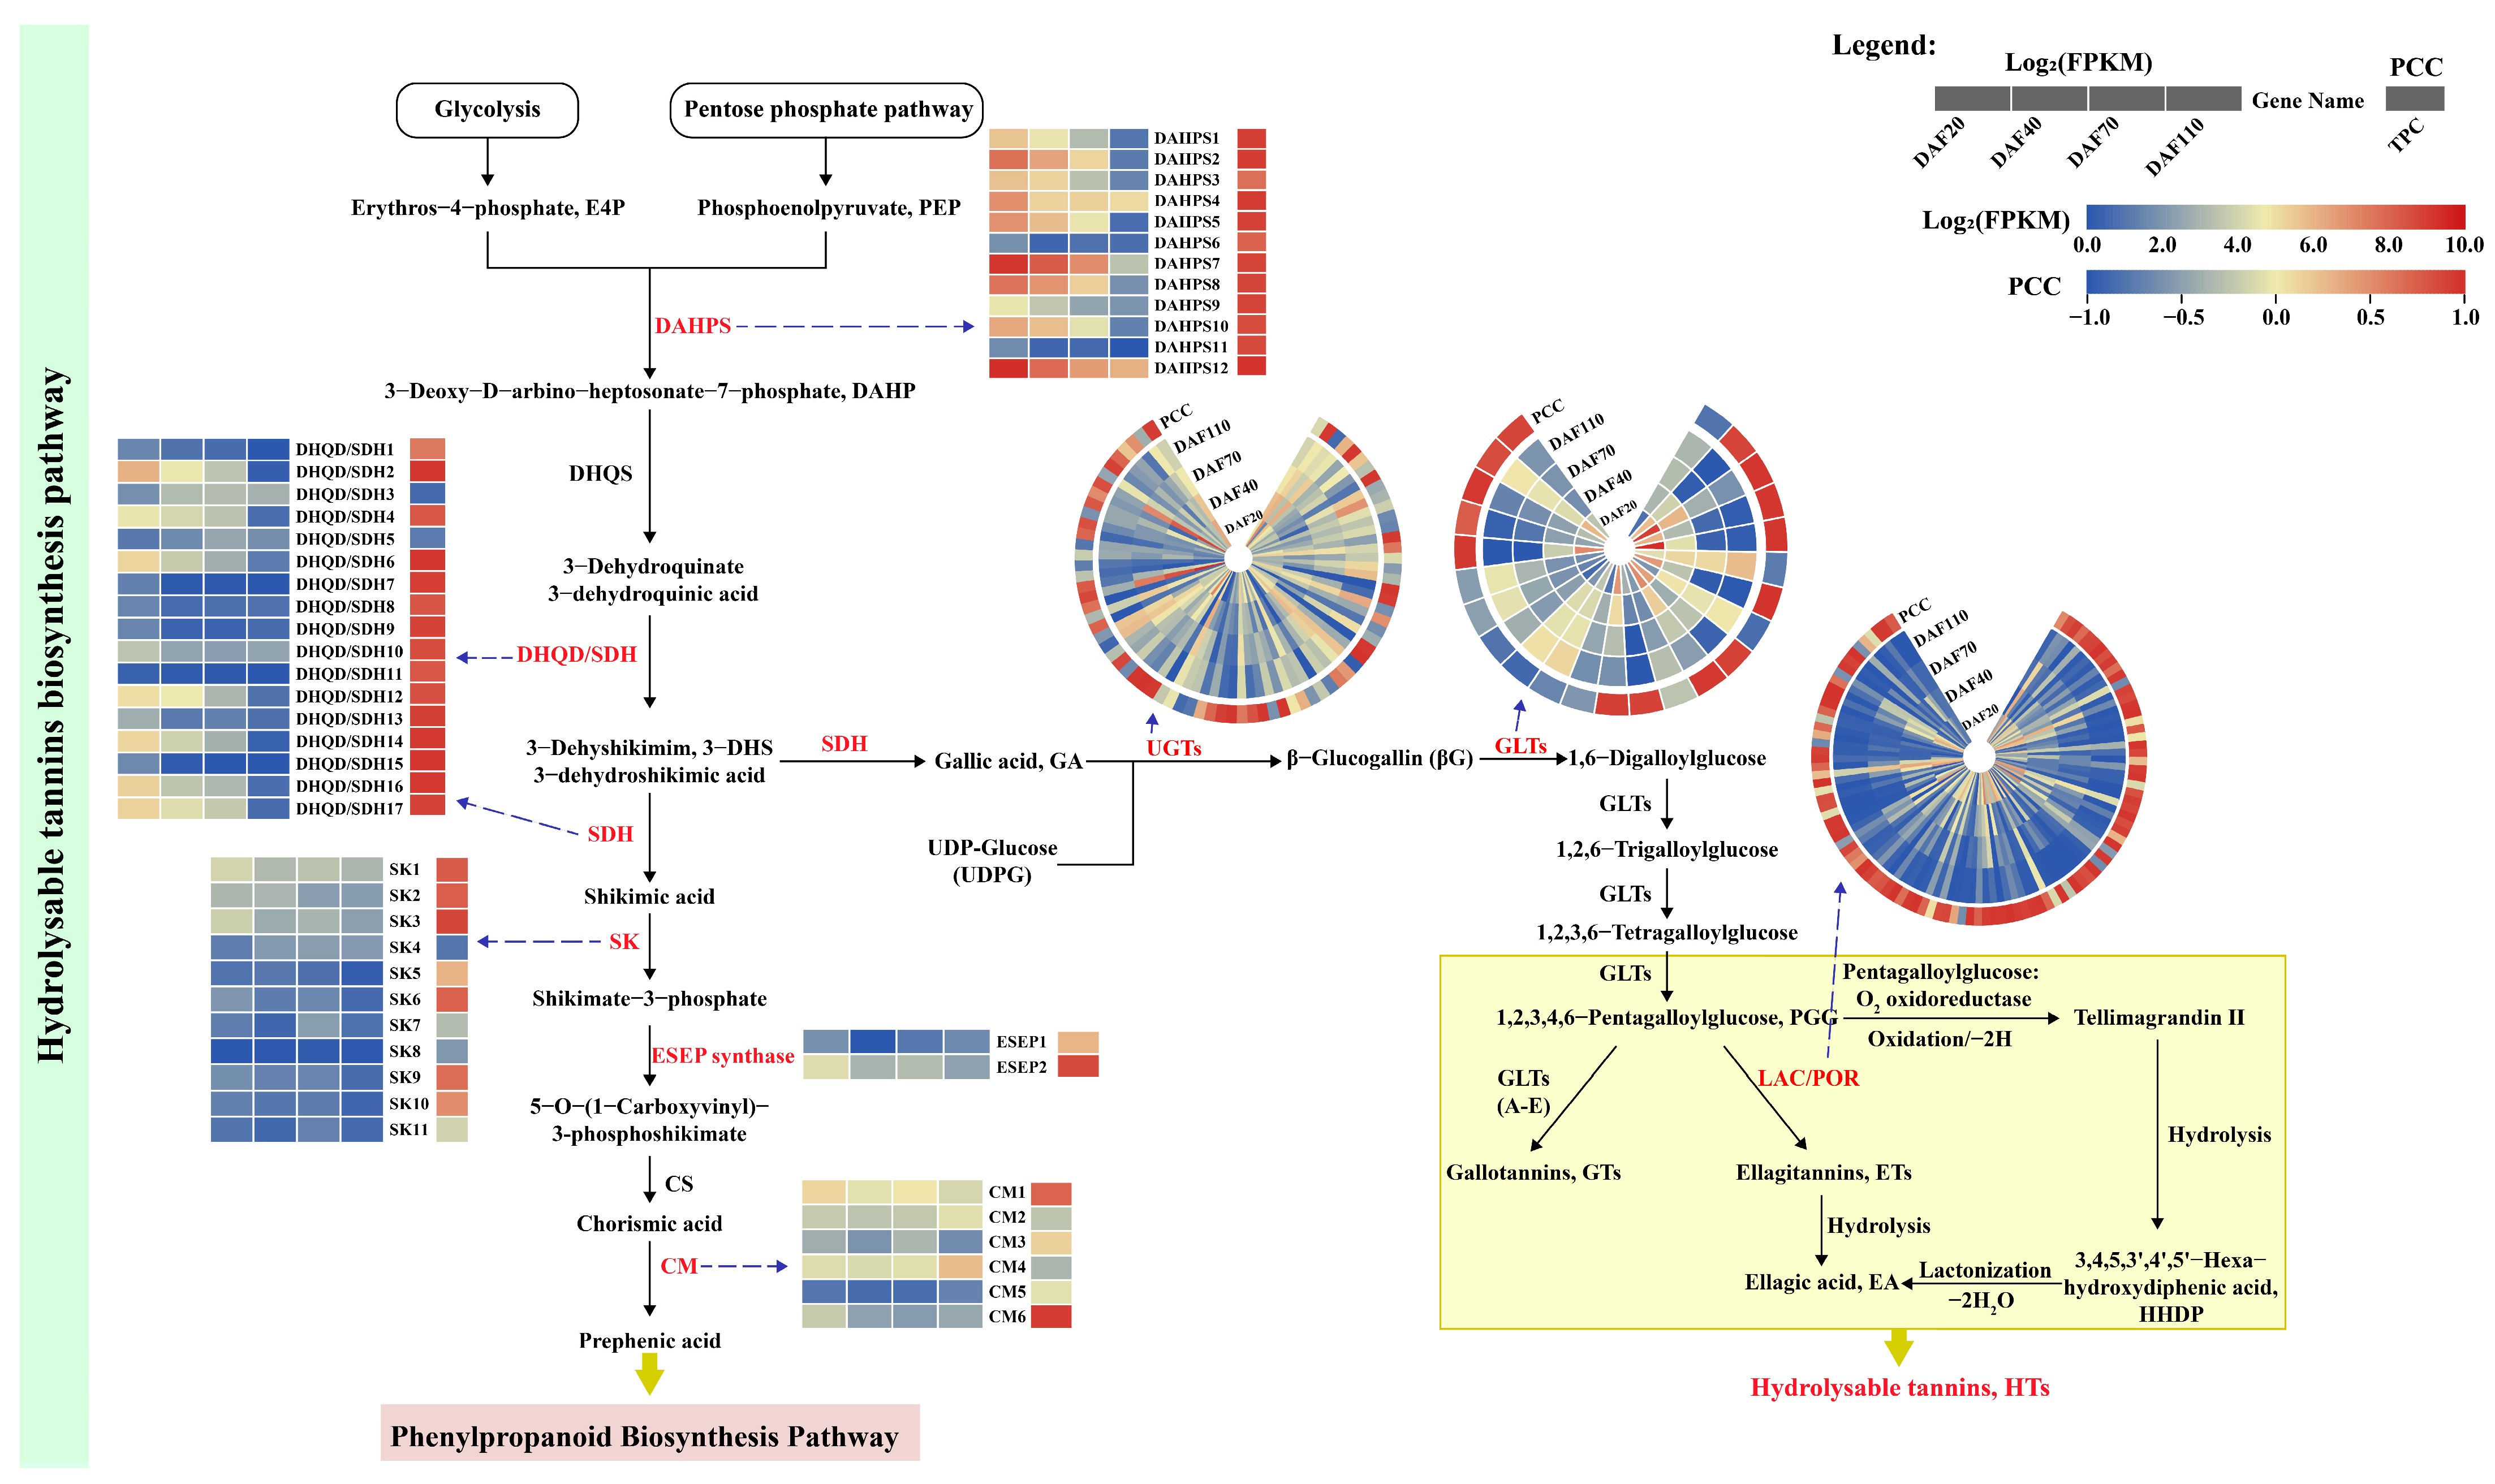
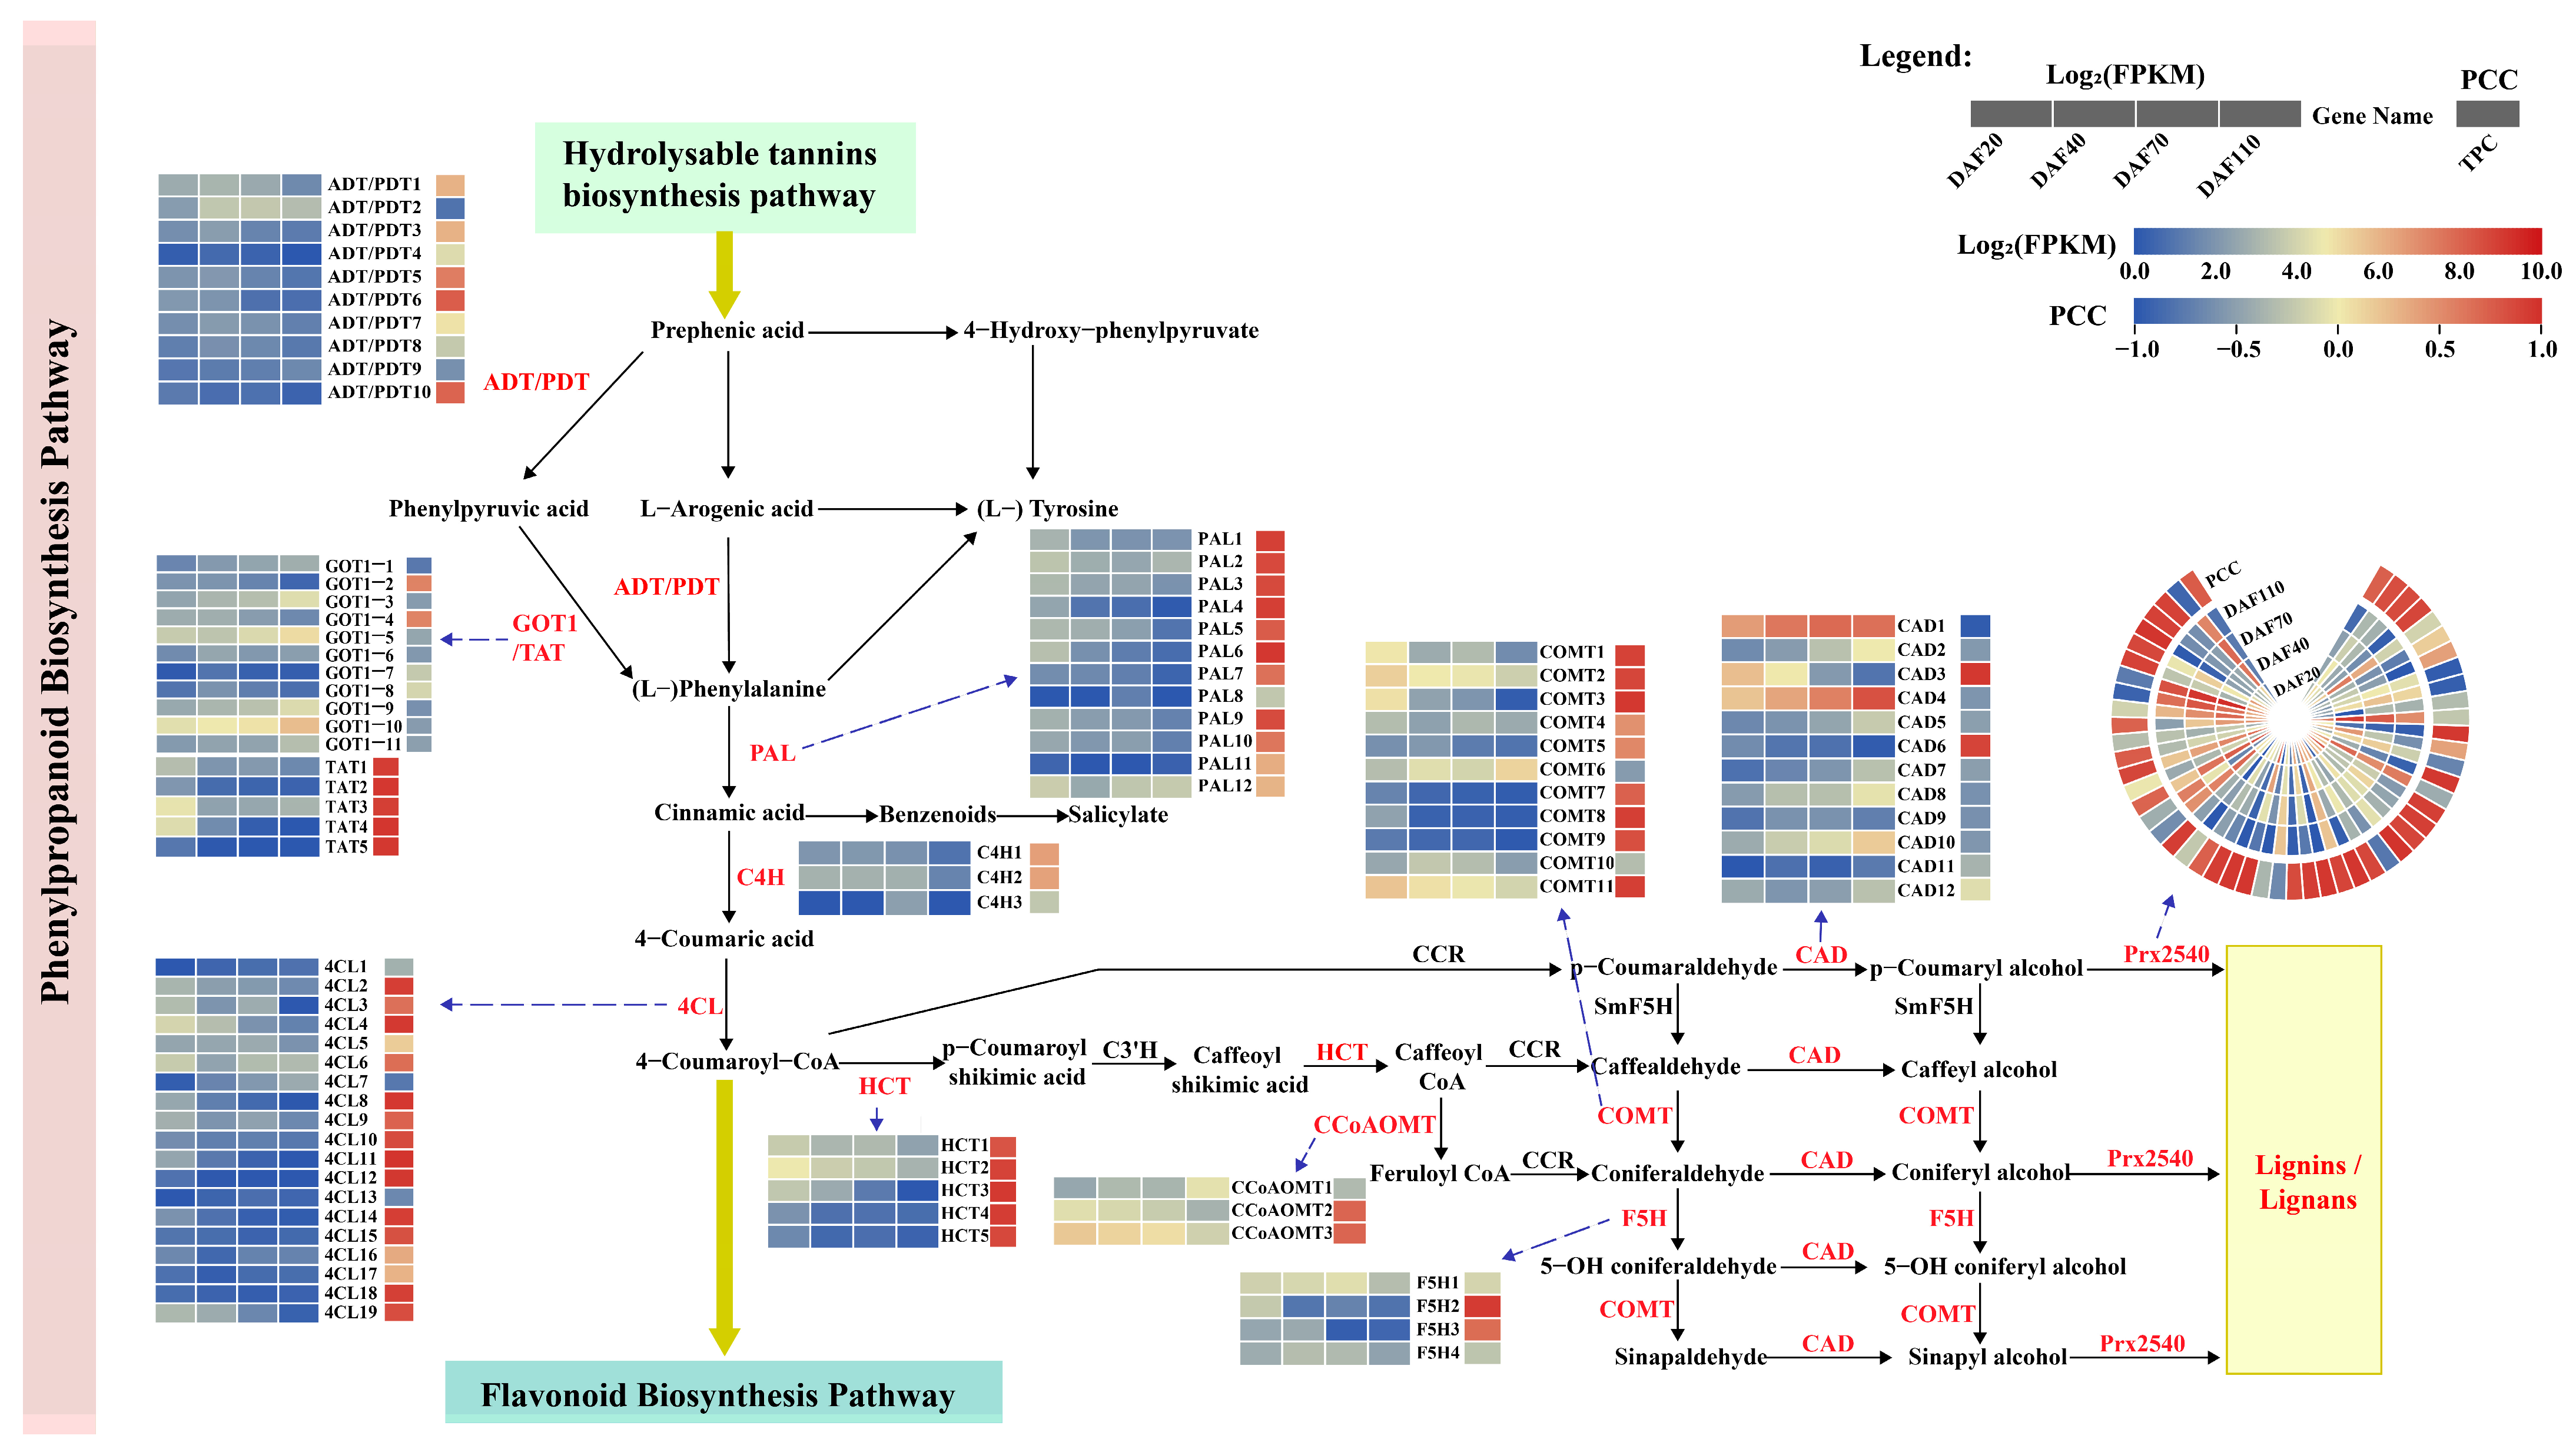
3.6.1. Identification of DEGs Related to HT Biosynthesis Pathway

As shown in Figure 6, the shikimic acid pathway is upstream of the HT biosynthesis pathway. It started from the initial enzyme 3-deoxy-7-phosphoheptulonate synthase (DAHPS, EC 2.5.1.54), which combined erythrose-4-phosphate (E4P) from glycolysis and phosphoenolpyruvate (PEP) from the pentose phosphate pathway to produce 3-deoxy-D-arabino-heptulosonate-7-phosphate (DAHP). We found twelve DAHPS, continuously down-regulated through the four stages of C.album fruit, highly correlated with TPC. Among them, nine unigenes were highly expressed. We identified seventeen unigenes encoding 3-dehydroquinate dehydratase I (DHQD/DHQ, EC 4.2.1.10) or shikimate dehydrogenase (SDH, EC 1.1.1.25), only two of them negatively correlated with TPC. DHQ-SDH is a bifunctional enzyme in many plants [46]. On the one hand, SDH contributes to producing shikimic acid; on the other hand, SDH also forms GA.
As a branch of the shikimic acid pathway, the GA pathway to HT is rarely mentioned and does not seem to be characterized in KEGG. However, previous studies have shown that HT is a crucial component of C. album fruit [47]. Therefore, based on the existing research on HTs [48,49,50,51,52], we mapped the HT biosynthetic pathway in C. album and searched several essential enzyme genes involved in it from our transcriptome database. GA is first catalyzed to form β-glucogallin (βG) by UDP-glucosyltransferases (UGTs) with the UDPGT domain (PF00201) [53]. The pentagalloylglucose (PGG) is then synthesized under the continuous action of galloyltransferases (GLTs, EC 2.3.1.-). GLT belongs to the acyltransferase family with the acyltransferase domain of Pfam (PF01553) [54]. PGG is subsequently converted to ellagitannins via a reaction catalyzed by laccases (LACs, EC 1.10.3.2). LAC contained the characteristic domains Cu_oxidase (PF00394, PF07731, and PF07732) [55]. According to Pfam, we preliminary identified 177 UGTs, 70 acyltransferases, and 164 LACs from the PacBio full-length transcriptome. Among these, 77, 24, and 104 unigenes were differentially expressed, respectively. These genes belonged to large families, and it is still necessary to further determine which genes are crucial to the synthesis of HT in C. album.
Additionally, the C. album transcriptome dataset also contained enzymes like shikimate kinase (SK, EC 2.7.1.71), 3-phosphoshikimate 1-carboxyvinyltransferase (EPSP, EC 2.5.1.19), and chorismate mutase (CM, EC 5.4.99.5). There were 11 SKs, 2 ESEPs, and 6 CMs differentially expressed, respectively. These enzymes helped shikimic acid further produce phenylalanine, the initiator of phenylpropanoid biosynthesis.

3.6.2. Identification of DEGs Related to the Phenylpropanoid Biosynthesis Pathway

KEGG analyses of C. album transcriptome sequences revealed many DEGs involved in the phenylpropanoid biosynthesis pathway (Figure 7). Firstly, the phenylpropanoid biosynthesis pathway starts with the formation of cinnamic acid from phenylalanine by a reaction catalyzed by phenylalanine ammonia-lyase (PAL, EC 4.3.1.24), and cinnamic acid then forms 4-coumarinic acid via a reaction catalyzed by cinnamic acid-4-hydroxylase (C4H, EC 1.14.13.11/1.14.14.91). Here, we identified 12 PALs and 3 C4Hs in C. album, most unigenes coding PAL were positively correlated with TPC. 4-Coumaric acid, which produces 4-coumaryl CoA through a reaction catalyzed by 4-coumarate CoA ligase (4CL, EC 6.2.1.12). There were 19 DEGs encoding 4CL in C. album. Notably, the isoforms of the same gene family may exhibit different expression trends. The expression patterns of some unigenes were consistent with the variation patterns of TPC in C. album fruits. These genes may play a role in phenylpropanoid biosynthesis in C. album fruits.
These CoA-activated compounds, such as 4-coumaroyl-CoA, are starting metabolites for synthesizing lignins, flavonoids, and flavones. Lignins are the principal structural component of plant cell walls, produced by the general phenylpropanoid pathway [56]. During the development of C. album fruit, multiple unigenes encoding the same enzyme involved in lignin biosynthesis showed diverse responses. Here, five shikimate O-hydroxycinnamoyltransferase (HCT, EC 2.3.1.133) were identified and positively correlated with TPC. Meanwhile, the main reductases in the lignin biosynthesis pathway, the cinnamyl alcohol dehydrogenase (CAD, EC 1.1.1.195), were identified with 12 unigenes. Two of them, CAD1 and CAD4, were highly expressed during the growth of C. album fruits, while CAD3 and CAD6 were highly positively correlated with TPC. Generally, CAD has multiple substrates, resulting in a reticulate structure pathway [56]. Moreover, 53 differentially expressed Prx2540 encoding peroxidase (EC 1.11.1.7) was identified with two unigenes (Prx2540-28 and Prx2540-37) up-regulated across the four developmental stages of C. album fruit. These genes may regulate lignin synthesis in C. album fruit, causing the fruit to harden at ripening. In short, these results suggest that the lignin or lignin biosynthesis in C. album fruits is usually active and thus complements the texture characteristics of the fruit.

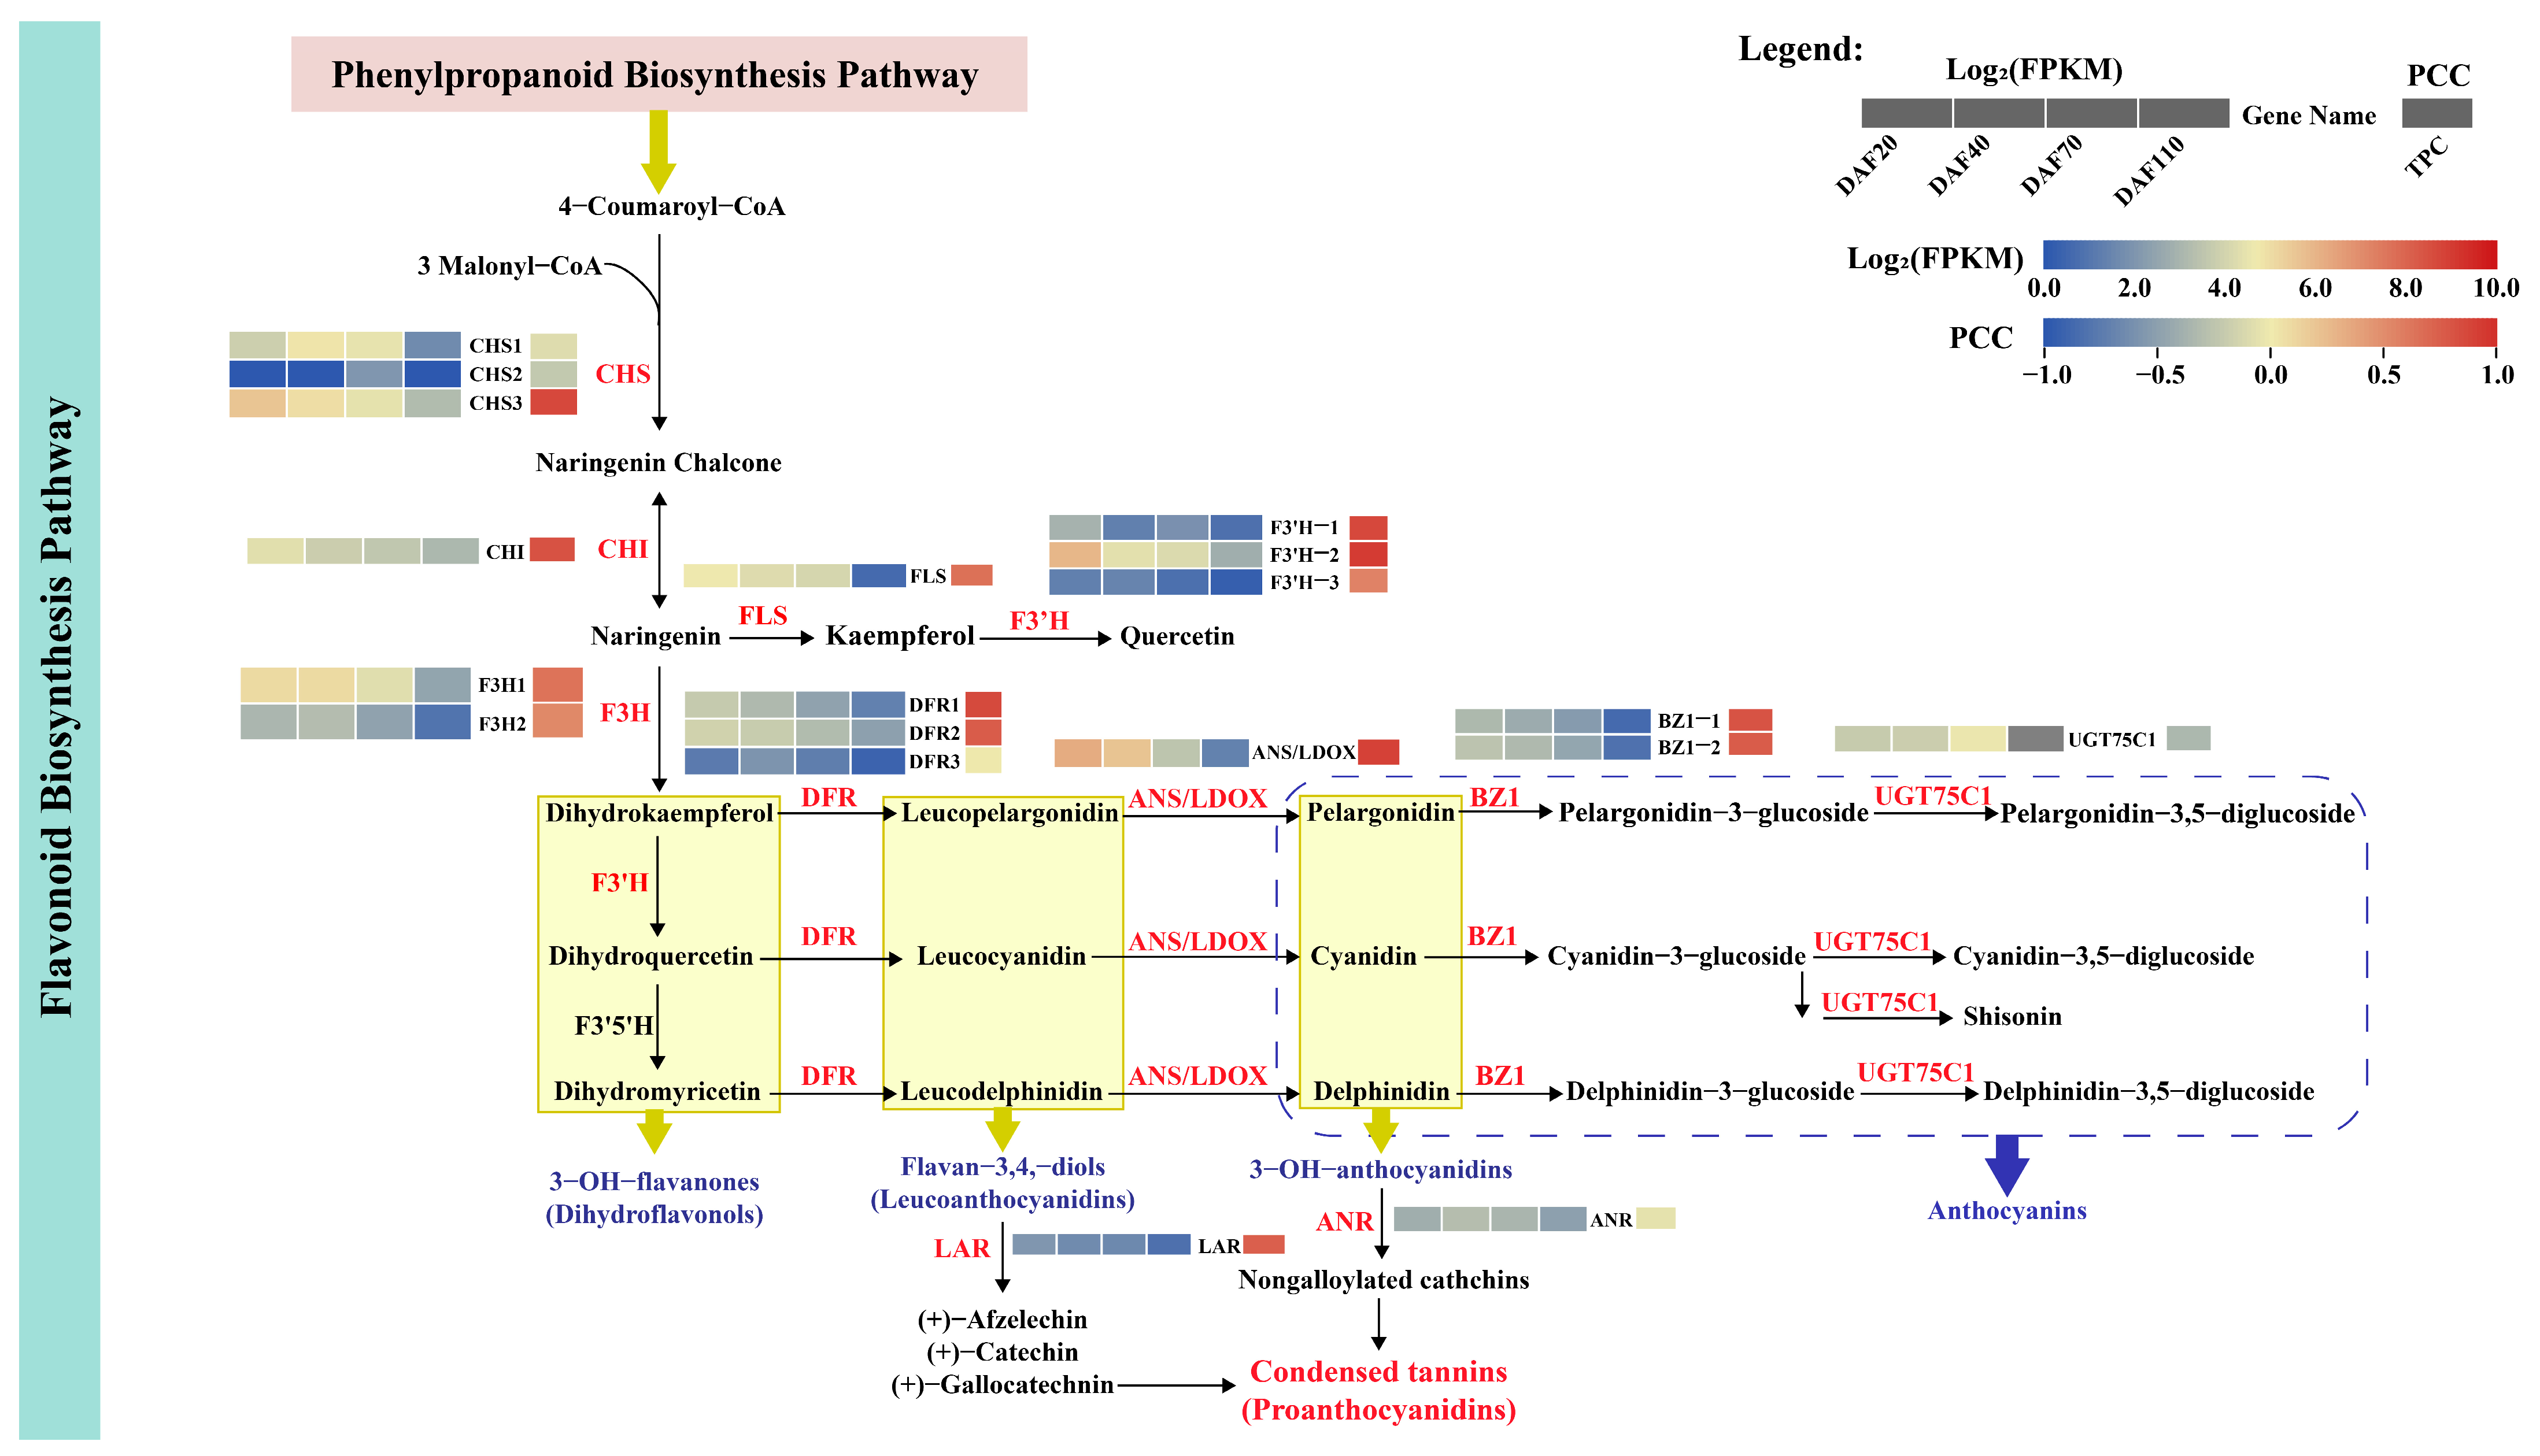
3.6.3. Identification of DEGs Related to the Flavonoid Biosynthesis Pathway

Flavonoids, a class of vital secondary metabolites in plants, are polyphenolic compounds synthesized via the flavonoid pathway [57]. We chose and studied the related pathway DEGs that were detected and involved in flavonoid biosynthesis in the present study (Figure 8).
Chalcone synthase (CHS, EC 2.3.1.74) serves as the initial rate-limiting enzyme in the flavonoid biosynthesis pathway [58]. It catalyzes the conversion of 4-coumaryl CoA and 3-malonyl CoA to produce naringenin chalcone. In this study, three DEGs encoding CHS were identified, with CHS3 exhibiting the highest expression levels. Interestingly, the expression of CHS3 was found to be positively correlated with TPC, suggesting that this gene may regulate key points in flavonoid metabolism. Additionally, chalcone isomerase (CHI, EC 5.5.1.6) catalyzed naringenin chalcone into naringenin. And the naringenin 3-dioxygenase (F3H, EC 1.14.11.9) is required for naringenin conversion to form dihydrokaempferol. This study found one CHI and two F3H with differential expression and showing down-regulation.
As a branching pathway in flavone and flavonol biosynthesis, we found only one flavonol synthase (FLS, EC 1.14.11.23/1.14.20.6) and three flavonoid 3′-monooxygenases (F3′H, EC 1.14.13.21/1.14.14.82). They catalyzed the formation of kaempferol and quercetin. F3H-2 was highly expressed and down-regulated.
Another pathway, dihydroflavonol 4-reductase (DFR, EC 1.1.1.219), provides one entry step in anthocyanin biosynthesis and may produce a leucoanthocyanidin by utilizing any one of the corresponding dihydroflavonols [59]. We identified three unigenes encoding DFR. Further, while anthocyanidin synthase (ANS) or leucocyanidin dioxygenase (LDOX) (EC 1.14.11.19/1.14.20.4) could convert leucoanthocyanidins to 3-OH-anthocyanidins, only one ANS/LDOX with a down-regulated trend was presented here. We also annotated two unigenes encoding anthocyanidin 3-O-glucosyltransferase (BZ1, EC 2.4.1.115) and one unigene encoding UGT75C1, which were mainly converted from 3-OH-anthocyanidins to stable anthocyanins. Finally, we found two unigenes encoding leucoanthocyanidin reductase (LAR, EC 1.17.1.3) and anthocyanidin reductase (ANR, EC 1.3.1.77), respectively. They promoted the synthesis of CTs, which are also known as proanthocyanidins.

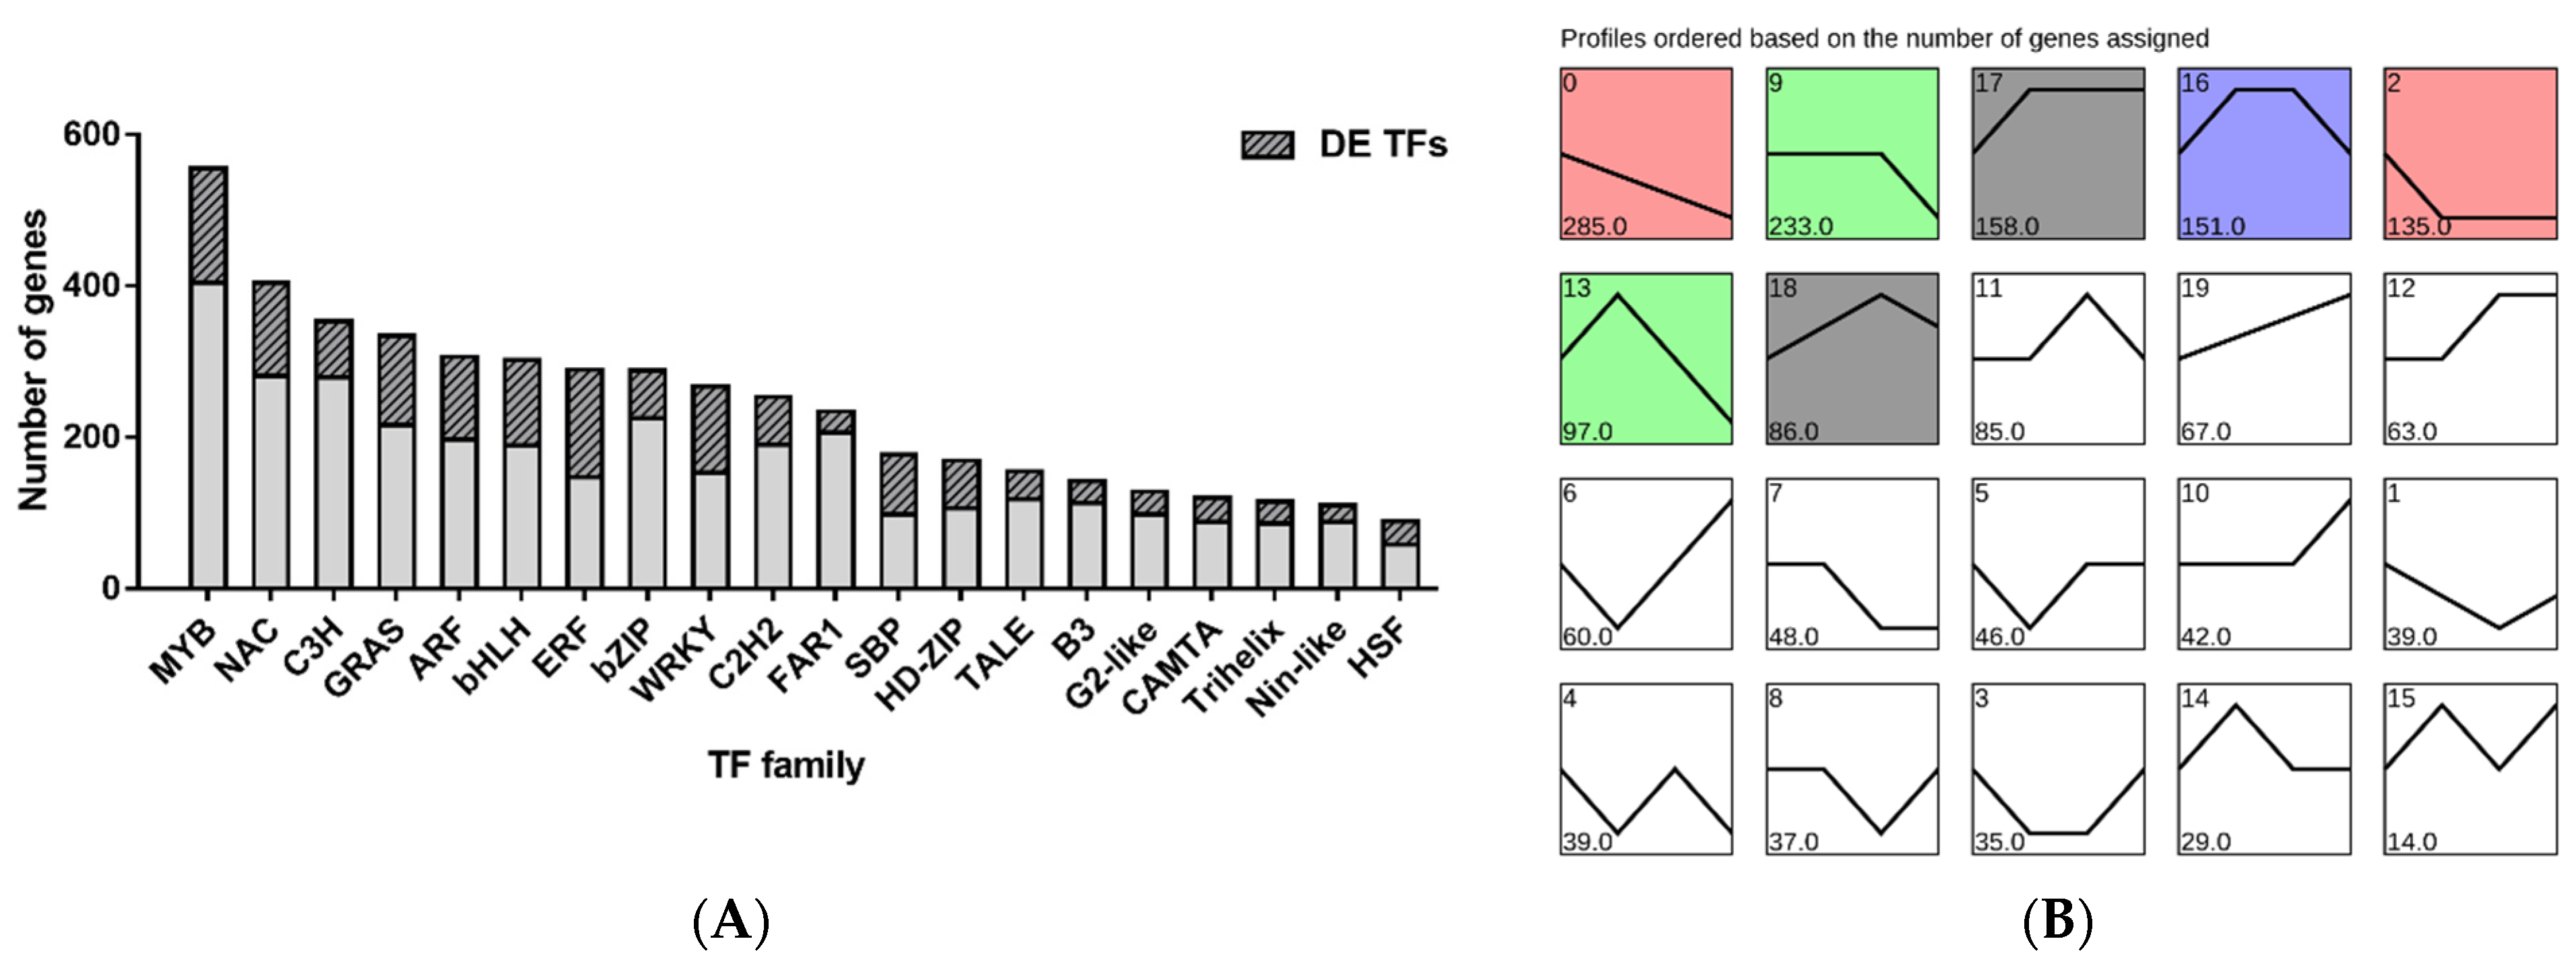
3.7. Identification and Analysis of TFs

TFs are vital components of the transcriptional regulation machinery, which plays a significant role in plant growth and developmental processes by regulating gene expression [60]. Totals of 5860 TFs divided into 56 TF families were predicted from the C. album full-length transcriptome (Figure S5). The top 20 TF families with the most numbers of unigenes are described in Figure 9A. The members of the MYB family were the most abundant (555, 9.47%), followed by the NAC (404, 6.89%) and C3H (353, 6.02%) families. In addition, we also identified several typical TF families, such as GRAS (334, 5.70%), ARF (306, 5.22%), bHLH (302, 5.15%), ERF (289, 4.93%), bZIP (288, 4.91%), and WRKY (267, 4.56%), which are all well known and the most studied plant TFs. We identified 1745 differentially expressed TFs of C. album fruits at different developmental stages. The MYB family, with 151 members, was the richest (counted 8.65%). The ERF family was the second (142, 8.14%), followed by NAC (123, 7.05%), GRAS (118, 6.76%), WRKY (114, 6.53%), bHLH (113, 6.48%), and ARF (109, 6.25%). All had more than 100 differentially expressed members.
Nevertheless, various members have different expression patterns, which suggests that TF families exhibited functional differentiation. Furthermore, we conducted trend analysis on all differentially expressed TFs to find the transcription factors co-expressed with TPC of C. album. As shown in Figure 9B, profile 0 has the most unigenes (285) with a significant expression (p = 2.9 × 10−107). These TFs may play pivotal roles in the characteristic polyphenol metabolism of C. album, so further studies should focus on them.

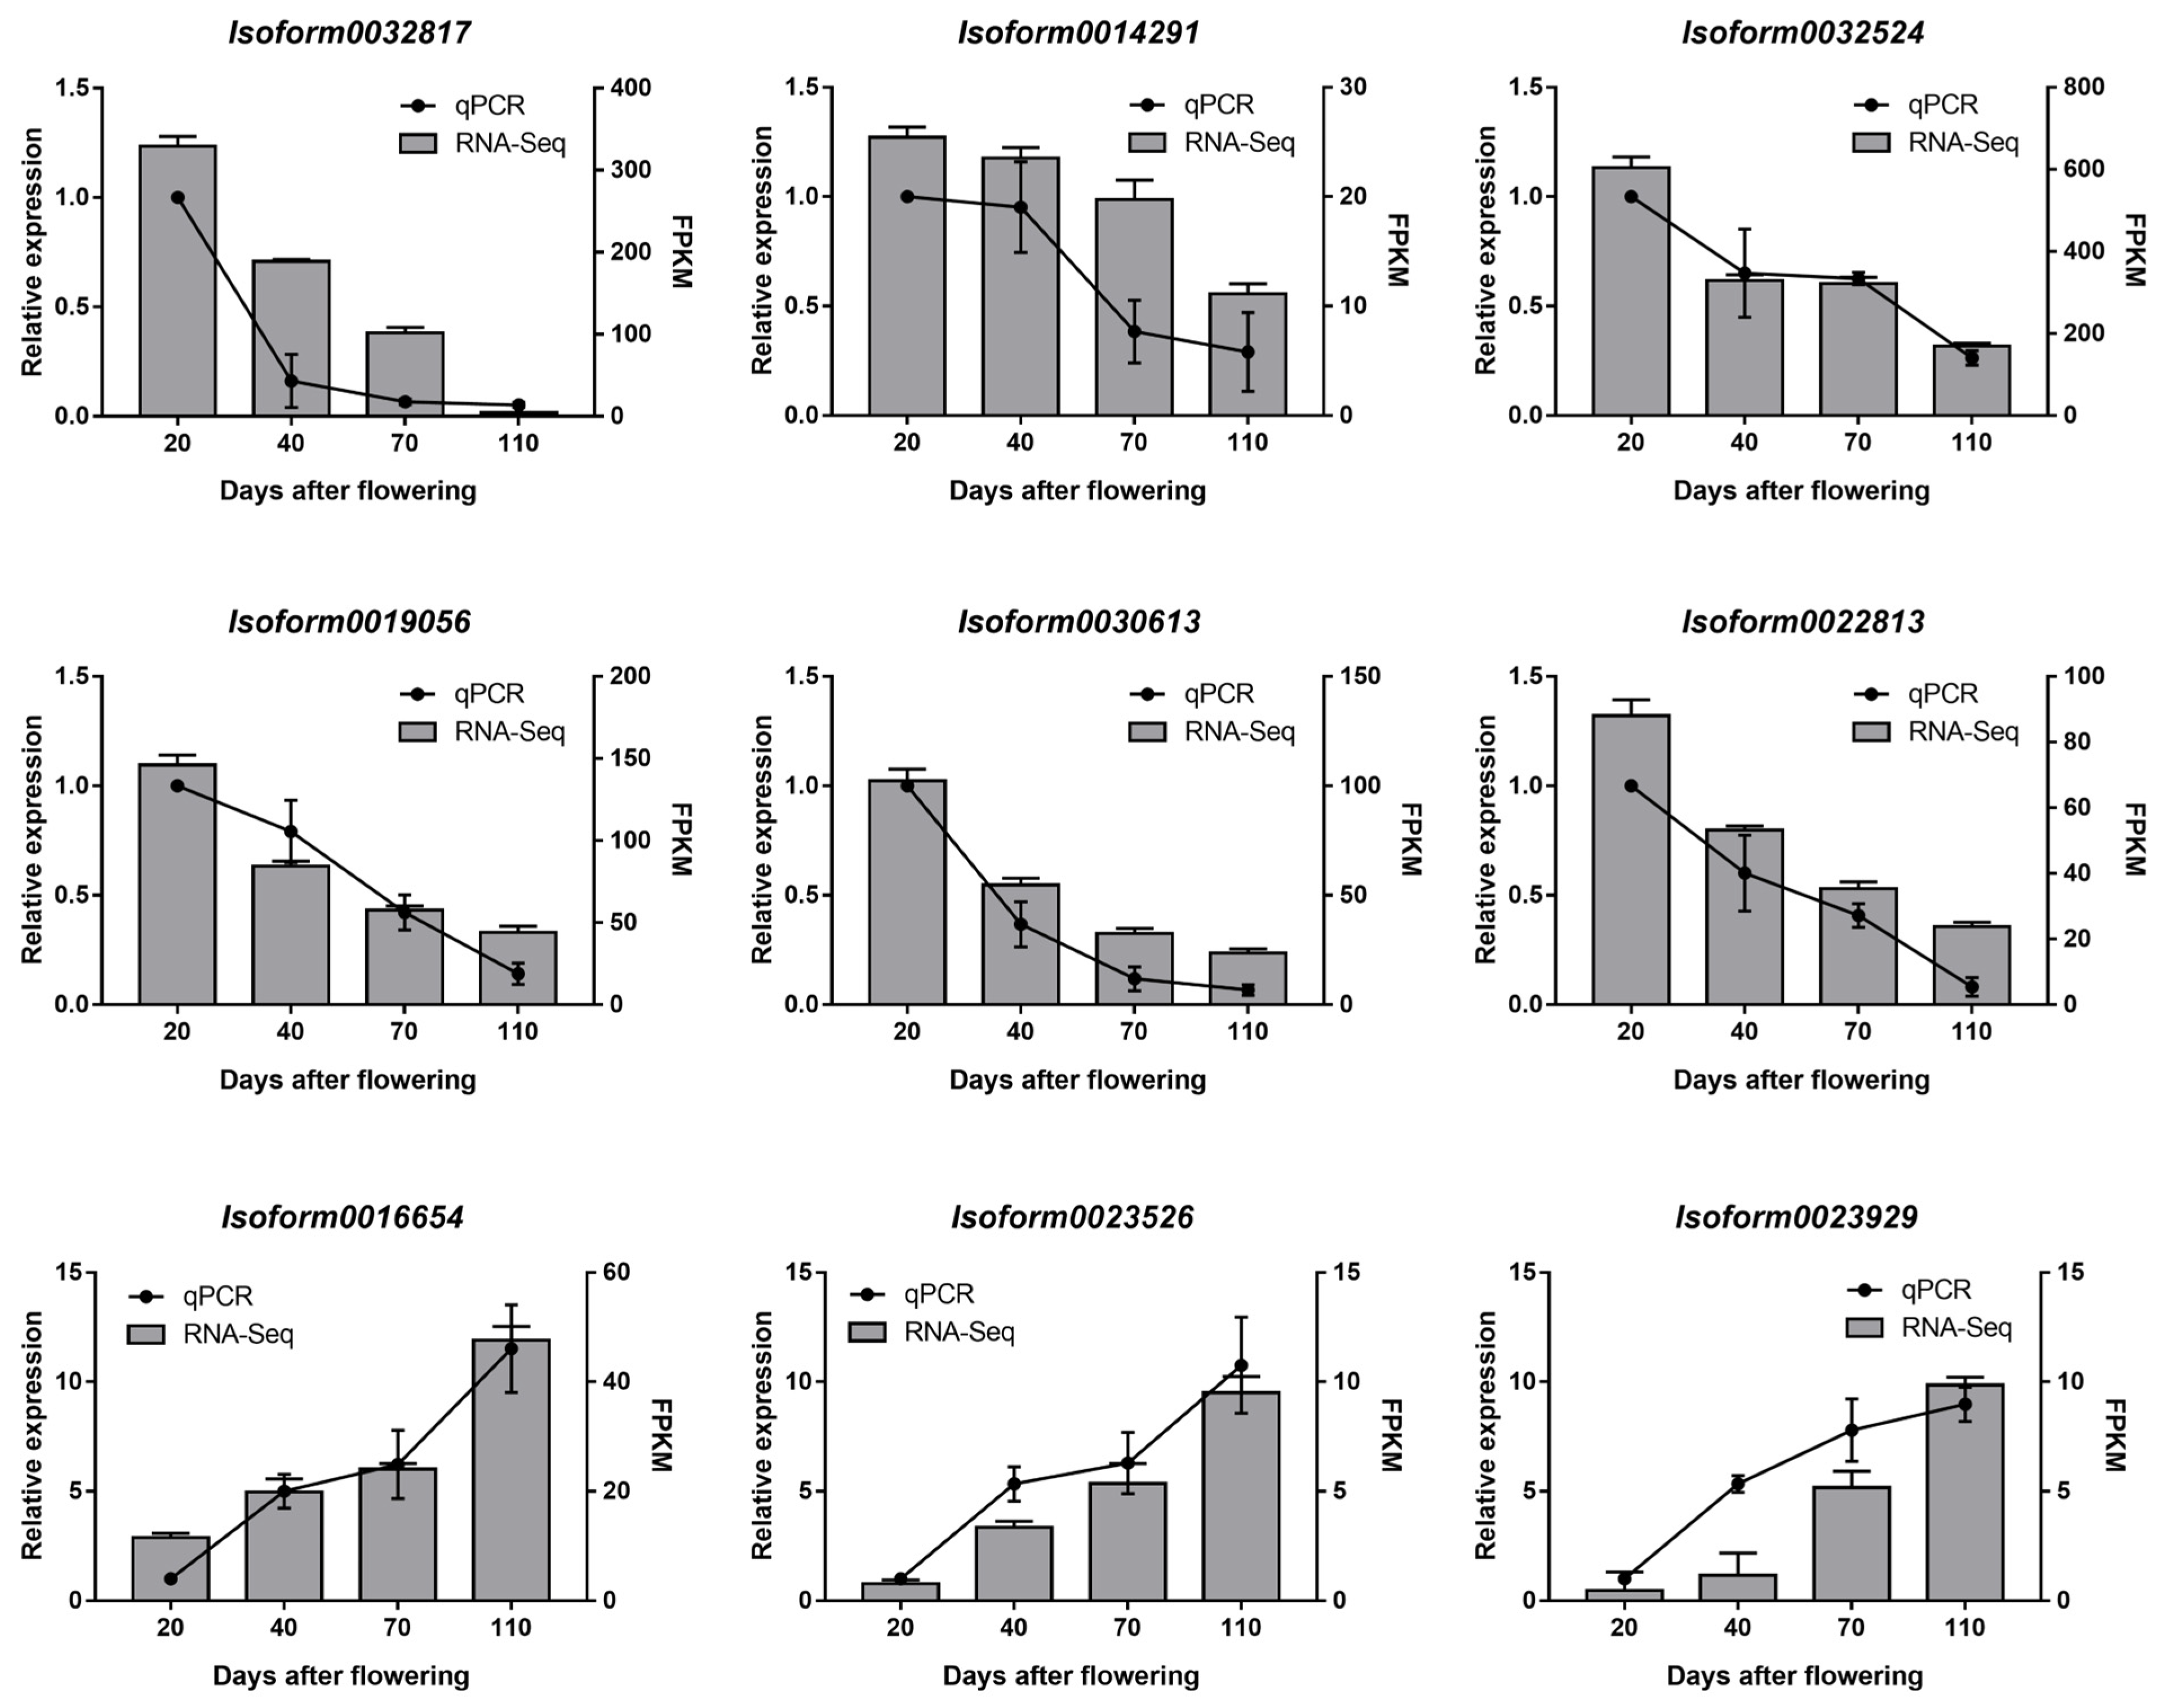
3.8. RT-qPCR for Validation of RNA-Seq

To confirm the accuracy of the transcriptome data, we randomly selected nine DEGs in C. album fruit for analysis by RT-qPCR in a biologically independent experiment. We determined the gene expression level and compared it with RNA-Seq data. As shown in Figure 10, the results showed a high degree of consistency, which proved that the transcriptome data were reliable and highly reproducible.

4. Discussion

4.1. Combined Sequencing Approaches Provided Comprehensive Transcriptome Information of C. album

Transcriptome sequencing was considered for an understanding of the complexity of mechanisms of fruit growth. PacBio SMRT sequencing has emerged as one of the best third-generation platforms, which provides an opportunity to thoroughly investigate the molecular mechanisms of many metabolisms [30]. At present, the application of PacBio sequence or/and RNA-seq methods has laid a foundation for solving many molecular mechanism problems in many plants without reference genomes. TGS techniques have made it possible to gather invaluable genetic information and develop herbal genomics [27]. For instance, the salinity tolerance in the roots of cultivated alfalfa (Medicago sativa L.) has been evaluated by PacBio Iso-Seq and BGISEQ-500 RNA-Seq [61]. We discovered some putative genes related to aurantio-obtusin biosynthesis in Cassia obtusifolia by combining the SMRT and NGS platforms [62]. SMRT and second-generation sequencing were also applied to generate the complete and full-length transcriptome of D. roosii, and the key genes associated with naringin/neoeriocitrin synthesis were further elucidated [63]. In this context, SMRT technology is an effective approach for further biological analysis of plants without genome and molecular genetic bases.
To date, transcriptomic techniques have been successfully applied in C. album [64,65,66], and the chloroplast genome with a 163,140 bp of C. album has been reported [67], the comprehensive genomic and full-length transcriptomic information is still poorly understood. The importance of fruit quality and the exceptional bioactive properties in C. album have long been recognized; hence, we constructed a full-length transcriptome of C. album by using PacBio Sequel and Illumina RNA-seq here to increase our understanding of the vital and dynamic process of C. album fruit development. In this study, SMRT sequencing yielded a total of 135,439 unigenes of C. album, of which 113,803 (84.03%) were successfully mapped in Illumina RNA-seq. Our transcriptome obtained an average length of all isoforms was 2687.94 bp, which was longer than Camellia sinensis with an average length of 1762 bp [68] and Medicago sativa L. with an average length of 2551 bp [61]. The results suggested that PacBio could capture longer and more complete transcript sequences as reported, and the transcriptome sequences of C. album were reliable.
A total of 28,658 DEGs were identified via the transcriptomic comparison of the C. album fruit at four developmental periods, which greatly enriched the current understanding of the gene expression profile of C. album. The enrichment analysis of the KEGG pathway showed that the DEGs significantly enriched the metabolic pathways and the biosynthesis of secondary metabolites pathways. Simultaneously, we predicted 5860 TFs clustered into 56 TF families, with 1745 TFs differentially expressed. Noteworthy families with high numbers of DEGs included the MYB, ERF, NAC, GRAS, WRKY, bHLH, ARF, SBP, C3H, bZIP, C2H2, and HD-ZIP families. The identification of abundant TFs in our transcriptome indicated that the transcriptional regulation was relatively complex in C. album. The discovery of these TFs will provide reference information for further research on the growth and polyphenol biosynthesis of C. album. Based on these sequence data, we suggest that C. album may have an enormous genome. Our study could provide a valuable reference for gene identification and quality inspection of the whole genome sequencing of C. album in future research.

4.2. Differentially Expressed Transcripts Reveal the Metabolism and Regulation of Polyphenols of C. album Fruit

We further analyzed the polyphenol biosynthetic pathways’ global gene expression profiles in different development stages; 215 DEGs encoded 27 enzymes involved in polyphenol biosynthesis. The upstream HT biosynthesis pathway genes, such as DAHPS, DHQD/SDH, SK, and EPSP, were generally down-regulated. Moreover, fewer unigenes were encoding the enzymes involved in the flavonoid pathway, one for CHI, FLS, ANS/LDOX, and LAR; two for F3H and BZ1; three for CHS, F3’H, and DFR. They also show a downward trend in expression levels, consistent with the changing polyphenol content in C. album fruit. Previous studies have shown that DAHPS, C4H, CHS, F3H, etc., are the critical enzymes in the flavonoid biosynthesis pathway [22,58,69]. In future research, these unigenes should be investigated to confirm their regulatory effect on C. album polyphenol. In addition, there were many differential genes related to the lignin and lignan pathways. This indicates that lignin or lignan formation seems to be more critical during the growth and development of C. album fruits [70]. Unigenes that increase expression as C. album fruit matures should be considered. In particular, HTs are rich polyphenols of C. album [47]. Three prominent gene families, UGT, acyltransferases, and LAC, play essential roles in the pathway of HT synthesis. According to local blast, 177 UGTs, 70 acyltransferases, and 164 LACs from PacBio full-length transcriptome were identified, with 77, 24, and 104 DEGs, respectively. However, the key unigenes involved in the polyphenol synthesis of C. album need further exploration.
Known TFs like MYB, bHLH, AP2/ERF, WRKY, Zinc finger, DOF, NAC, SPL, and bZIP have been employed to manipulate various metabolic and developmental pathways [60,71]. In the work, a total of 5860 TFs were predicted from the full-length C. album transcriptome (Figure S5). As different members have different expression patterns, we performed trend analysis on all differentially expressed TFs. As shown in Figure 9B, profile 0 was consistent with the trend of TPC in C. album with a significant expression (P = 2.9 × 10−107). Therefore, these 285 differentially expressed TFs may play a central role in regulating fruit development and the polyphenol metabolism of C. album. Subgroup 4 of the MYB family has been proposed to have a negative impact on the accumulation of phenylpropanoid metabolites, functioning as a transcriptional repressor of the phenylpropanoid pathway by inhibiting the transcription of key enzymes [72]. In our study, the TFs that were negatively regulated (profile 19 in Figure 9B) did not show differential expression. As a result, further attention should be given to these down-regulated TFs.
These TF families are related to secondary metabolisms, such as the phenylpropanoid metabolism and the phenolic acid metabolism [72]. MBW regulates the expression of structural genes closely associated with flavonoid biosynthesis: MYB, bHLH, and WDR (WD-repeat) [69]. We detected 151 unigenes for MYB TFs and 113 unigenes for bHLH. Additionally, no differentially expressed WDR was found in our study. MYB TFs represent one of the most prominent family TFs in plants, which have indispensable functions in regulating the biosynthesis of plant secondary metabolites. Recently, other studies have demonstrated that MYB TFs regulate the biosynthesis of phenylpropanoid, flavonoids, lignins, and other primary and secondary metabolic reactions [73]. For instance, SmMYB98 and SmMYB1 could enhance phenolic acid accumulation, like tanshinone and salvianolic acid, by upregulating gene expression in the phenolic acid biosynthesis pathway [74,75]. In our present study, Isoform0032534 encodes MYB with the highest expression abundance. Thus, we speculate that it may have a crucial role in polyphenol metabolites. Another TF family, bHLH, regulates flavonoid biosynthesis and usually interacts with MYB [76]. A total of 17 DEGs coding for bHLH have been identified in the study. The expression levels of Isoform0017495, Isoform0000733, and Isoform0021010 were relatively high. Additionally, ERF, WRKY, ZnF, and bZIP are also involved in the biosynthesis of secondary metabolites, such as phenolic compounds and carotenoids [77,78,79]. These results provide comprehensive information on the genes involved in polyphenol metabolites and biosynthesis of C. album. The DEGs and TFs identified here can be evaluated further. This study has also laid a solid foundation for exploring the functions of DEGs in regulating other physiology and traits.

5. Conclusions

The paper is the first time that third-generation full-length transcriptional sequencing and RNA-seq comprehensive transcriptome analysis have been presented in C. album, which provides a valuable resource for future research on gene discovery, molecular breeding, and metabolic engineering in C. album. PacBio and Illumina identified totals of 135,439 and 113,803 transcripts, respectively. The match rate of RNA-seq to SMRT-seq was 84.03%. The average length of full-length transcripts was 2687.94 bp, the N50 length was 3224 bp, and the GC content was 40.47%. Moreover, we predicted 5860 TFs belonging to 56 TF families. In this study, 28,658 DEGs were identified, and their functions were analyzed using GO and KEGG. Next, we surveyed 215 differentially expressed unigenes encoding 27 enzymes related to polyphenol biosynthesis. While 1745 differentially expressed TFs were trend analyzed, 285 TFs were continuously down-regulated across the four developmental stages of C. album fruit. These unigenes played essential roles in C. album fruit response to polyphenol metabolism. The findings may prove valuable for dissection mechanisms of fruit growth traits and genetic organization, gene cloning, and whole-genome sequencing of C. album for future studies.

Supplementary Materials

The following supporting information can be downloaded at: https://www.mdpi.com/article/10.3390/horticulturae10030293/s1, Figure S1. Classification and statistics of CCS reads (A) and length distribution of full-length non-chimeric reads (B) in C. album from SMRT data; Figure S2. Length (A) and quality (B) distribution of consensus isoforms in C. album from SMRT data; Figure S3. Length distribution of isoform sequences in C. album from SMRT data; Figure S4. Correlation analysis (A) and principal component analysis (PCA) (B) of the samples; Figure S5. TF family distribution in C. album according to SMRT data; Table S1. Primer sequences for RT-qPCR; Table S2. Information of raw reads in C. album from SMRT data; Table S3. Categorization of information of transcripts in C. album from SMRT data; Table S4. Function annotation of isoforms in C. album from SMRT data; Table S5. Statistics of data filtering from RNA-Seq data; Table S6. Results of clean reads mapped to the C. album full-length transcripts; Table S7. The number of genes expressed in each sample in C. album from RNA-Seq data.

Author Contributions

Conceptualization, Q.C. and Q.Y.; methodology, Q.Y. and S.Z.; software, Q.Y. and Q.X.; validation, W.W. and Z.L.; formal analysis, S.Z.; investigation, Q.Y. and S.Z.; resources, Q.C., Y.Y. and H.W.; data curation, Q.X. and W.W.; writing—original draft preparation, Q.Y.; writing—review and editing, Q.C. and W.W.; visualization, Q.Y. and Q.X.; supervision, Q.C. and Y.Y.; project administration, Q.C.; funding acquisition, Q.C. and Q.Y. All authors have read and agreed to the published version of the manuscript.

Funding

This research was funded by the Natural Science Foundation of Fujian Province (grant number 2022J01397), the Introduction of Talents and Scientific Research Project of Fujian Vocational College of Agriculture (grant number 2023JS015) and Special Construction of Modern Agricultural Industrial Technology System of Fujian Province (Fujian Financial and Educational Guidance Project, grant number [2020]74).

Data Availability Statement

Data are contained within the article and Supplementary Materials.

Acknowledgments

We thank Linmin Liu, Nana Qiu, and Yuxuan Ju for their help during the experiment.

Conflicts of Interest

The authors declare no conflicts of interest.

Correction Statement

This article has been republished with a minor correction to the figures number order, some punctuation, Acknowledgments and reference 3. This change does not affect the scientific content of the article.

Abbreviations

4CL4-coumarate CoA ligase
ANRanthocyanidin reductase
ANSanthocyanidin synthase
BZ1anthocyanidin 3-O-glucosyltransferase
C4Hcinnamic acid-4-hydroxylase
CADcinnamyl alcohol dehydrogenase
CCScircular consensus sequence
CHIchalcone isomerase
CHSChalcone synthase
CMchorismate mutase
CTsCondensed tannins
DAFDays after flowering
DAHP3-deoxy-D-arabino-heptulosonate-7-phosphate
DAHPS3-deoxy-7-phosphoheptulonate synthase
DEGsdifferentially expressed genes
DFRdihydroflavonol 4-reductase
DHQD/DHQ3-dehydroquinate dehydratase I
E4Perythrose-4-phosphate
EPSP3-phosphoshikimate 1-carboxyvinyltransferase
F3Hnaringenin 3-dioxygenase
F3’Hflavonoid 3’-monooxygenase
FCFold change
FDRFalse discovery rate
FLNCFull-length non-chimeric
FLSflavonol synthase
FPKMFragments per kilobase of transcript per million fragments mapped
GAGallic acid
GLTsgalloyltransferases
GOGene Ontology
HCTO-hydroxycinnamoyltransferase
HTshydrolysable tannins
KEGGThe Kyoto Encyclopedia of Genes and Genomes
KOGEukaryotic clusters of orthologous groups
LACslaccases
LARleucoanthocyanidin reductase
LDOXleucocyanidin dioxygenase
LRSLong-read sequencing
nFLNon-full-length
NGSNext-generation sequencing
NrNon-redundant protein
PALphenylalanine ammonia-lyase
PCAPrincipal component analysis
PCCPearson correlation coefficient
PEPphosphoenolpyruvate
PGGpentagalloylglucose
RT-qPCRQuantitative real-time PCR
SDHshikimate dehydrogenase
SKshikimate kinase
SMRTSingle-molecule real-time
TFsTranscription factors
TGSThird-generation sequencing
TPCTotal phenolic content
UGTsUDP-glucosyltransferases
βGβ-glucogallin

References

  1. Raven, P.H.; Zhang, L.; Al-Shehbaz, I.A. Flora of China; Science Press & Missouri Botanical Garden Press: Beijing, China; St. Louis, MO, USA, 2008. [Google Scholar]
  2. Mei, Z.; Zhang, X.; Liu, X.; Imani, S.; Fu, J. Genetic analysis of Canarium album in different areas of China by improved RAPD and ISSR. Comptes Rendus Biol. 2017, 340, 558–564. [Google Scholar] [CrossRef] [PubMed]
  3. He, C.N. Canarium album (Lour.) Raeusch. (Qingguo, Chinese Olive). In Dietary Chinese Herbs; Springer: Vienna, Austria, 2015; pp. 307–313. [Google Scholar] [CrossRef]
  4. Chen, Y.M.; Lin, B.; Lin, Y.F.; Sang, Y.Y.; Lin, M.S.; Fan, Z.Q.; Chen, Y.H.; Wang, H.; Lin, H.T. Involvements of membrane lipid and phenolic metabolism in reducing browning and chilling injury of cold-stored Chinese olive by γ-aminobutyric acid treatment. Postharvest Biol. Technol. 2024, 209, 112664. [Google Scholar] [CrossRef]
  5. Kuo, C.T.; Liu, T.H.; Hsu, T.H.; Lin, F.Y.; Chen, H.Y. Antioxidant and antiglycation properties of different solvent extracts from Chinese olive (Canarium album L.) fruit. Asian Pac. J. Trop. Med. 2015, 8, 987–995. [Google Scholar] [CrossRef] [PubMed]
  6. Mogana, R.; Wiart, C. Canarium L.: A Phytochemical and Pharmacological Review. J. Pharm. Res. 2011, 4, 2482–2489. [Google Scholar]
  7. He, Z.Y.; Xia, W.S. Nutritional composition of the kernels from Canarium album L. Food Chem. 2007, 102, 808–811. [Google Scholar] [CrossRef]
  8. He, Z.Y.; Xia, W.S.; Chen, J. Isolation and structure elucidation of phenolic compounds in Chinese olive (Canarium album L.) fruit. Eur. Food Res. Technol. 2008, 226, 1191–1196. [Google Scholar] [CrossRef]
  9. Liu, H.; Qiu, N.; Ding, H.; Yao, R. Polyphenols contents and antioxidant capacity of 68 Chinese herbals suitable for medical or food uses. Food Res. Int. 2008, 41, 363–370. [Google Scholar] [CrossRef]
  10. Xiang, Z.-B.; Liu, X.-Y.; He, C.-L.; Lin, S.H. Flavonoids from Canarium album. Asian J. Chem. 2014, 26, 4529–4530. [Google Scholar] [CrossRef]
  11. Giang, P.M.; Konig, W.A.; Son, P.T. Chemical composition of the resin essential oil of Canarium album from Vietnam. Chem. Nat. Compd. 2006, 42, 523–524. [Google Scholar] [CrossRef]
  12. Tamai, M.; Watanabe, N.; Someya, M.; Kondoh, H.; Omura, S.; Zhang, P.L.; Chang, R.; Chen, W.M. New hepatoprotective triterpenes from Canarium album. Planta Medica 1989, 55, 44–47. [Google Scholar] [CrossRef]
  13. Zeng, H.; Miao, S.; Zheng, B.; Lin, S.; Jian, Y.; Chen, S.; Zhang, Y. Molecular Structural Characteristics of Polysaccharide Fractions from Canarium album (Lour.) Raeusch and Their Antioxidant Activities. J. Food Sci. 2015, 80, H2585–H2596. [Google Scholar] [CrossRef]
  14. Wen, L.; Lin, S.; Zhu, Q.; Wu, D.; Jiang, Y.; Zhao, M.; Sun, J.; Luo, D.; Zeng, S.; Yang, B. Analysis of Chinese Olive Cultivars Difference by the Structural Characteristics of Oligosaccharides. Food Anal. Methods 2013, 6, 1529–1536. [Google Scholar] [CrossRef]
  15. Li, J.; Wang, R.; Wang, Y.; Zeng, J.; Xu, Z.; Xu, J.; He, X. Anti-Inflammatory Benzofuran Neolignans from the Fruits of Canarium album (Chinese Olive). J. Agric. Food Chem. 2022, 70, 1122–1133. [Google Scholar] [CrossRef] [PubMed]
  16. Yeh, Y.T.; Hsu, K.M.; Chen, H.J.; Su, N.W.; Liao, Y.C.; Hsieh, S.C. Identification of Scoparone from Chinese Olive Fruit as a Modulator of Macrophage Polarization. J. Agric. Food Chem. 2023, 71, 5195–5207. [Google Scholar] [CrossRef]
  17. Wang, M.; Zhang, S.; Zhong, R.; Wan, F.; Chen, L.; Liu, L.; Yi, B.; Zhang, H. Olive Fruit Extracts Supplement Improve Antioxidant Capacity via Altering Colonic Microbiota Composition in Mice. Front. Nutr. 2021, 8, 645099. [Google Scholar] [CrossRef]
  18. He, Z.Y.; Xia, W.S.; Liu, Q.H.; Chen, J. Identification of a new phenolic compound from Chinese olive (Canarium album L.) fruit. Eur. Food Res. Technol. 2009, 228, 339–343. [Google Scholar] [CrossRef]
  19. He, Z.; Xia, W.S. Analysis of phenolic compounds in Chinese olive (Canarium album L.) fruit by RPHPLC-DAD-ESI-MS. Food Chem. 2007, 105, 1307–1311. [Google Scholar] [CrossRef]
  20. Fu, L.; Xu, B.T.; Xu, X.R.; Gan, R.Y.; Zhang, Y.; Xia, E.Q.; Li, H.B. Antioxidant capacities and total phenolic contents of 62 fruits. Food Chem. 2011, 129, 345–350. [Google Scholar] [CrossRef] [PubMed]
  21. Tijjani, H.; Zangoma, M.H.; Mohammed, Z.S.; Obidola, S.M.; Egbuna, C.; Abdulai, S.I. Polyphenols: Classifications, Biosynthesis and Bioactivities. In Functional Foods and Nutraceuticals: Bioactive Components, Formulations and Innovations; Egbuna, C., Dable Tupas, G., Eds.; Springer International Publishing: Cham, Switzerland, 2020; pp. 389–414. [Google Scholar]
  22. Cai, J.; Wang, N.; Zhao, J.; Zhao, Y.; Xu, R.; Fu, F.; Pan, T.; Yu, Y.; Guo, Z.; She, W. Accumulation of Polyphenolics and Differential Expression of Genes Related to Shikimate Pathway during Fruit Development and Maturation of Chinese Olive (Canarium album). Agronomy 2023, 13, 895. [Google Scholar] [CrossRef]
  23. Tyagi, K.; Shukla, P.; Rohela, G.K.; Shabnam, A.A.; Gautam, R. Plant Phenolics: Their Biosynthesis, Regulation, Evolutionary Significance, and Role in Senescence. In Plant Phenolics in Sustainable Agriculture; Springer: Berlin/Heidelberg, Germany, 2020; pp. 431–449. [Google Scholar]
  24. Stark, R.; Grzelak, M.; Hadfield, J. RNA sequencing: The teenage years. Nat. Rev. Genet. 2019, 20, 631–656. [Google Scholar] [CrossRef]
  25. Marudamuthu, B.; Sharma, T.; Purru, S.; Soam, S.K.; Rao, C.S. Next-generation sequencing technology: A boon to agriculture. Genet. Resour. Crop Evol. 2023, 70, 353–372. [Google Scholar] [CrossRef]
  26. Tyagi, P.; Singh, D.; Mathur, S.; Singh, A.; Ranjan, R. Upcoming progress of transcriptomics studies on plants: An overview. Front. Plant Sci. 2022, 13, 1030890. [Google Scholar] [CrossRef]
  27. Gao, L.; Xu, W.; Xin, T.; Song, J. Application of third-generation sequencing to herbal genomics. Front. Plant Sci. 2023, 14, 1124536. [Google Scholar] [CrossRef] [PubMed]
  28. Hamim, I.; Sekine, K.-T.; Komatsu, K. How do emerging long-read sequencing technologies function in transforming the plant pathology research landscape? Plant Mol. Biol. 2022, 110, 469–484. [Google Scholar] [CrossRef] [PubMed]
  29. Chen, J.; Tang, X.H.; Ren, C.X.; Wei, B.; Wu, Y.Y.; Wu, Q.H.; Pei, J. Full-length transcriptome sequences and the identification of putative genes for flavonoid biosynthesis in safflower. BMC Genom. 2018, 19, 548. [Google Scholar] [CrossRef] [PubMed]
  30. Rhoads, A.; Au, K.F. PacBio Sequencing and Its Applications. Genom. Proteom. Bioinform. 2015, 13, 278–289. [Google Scholar] [CrossRef] [PubMed]
  31. Au, K.F.; Underwood, J.G.; Lee, L.; Wong, W.H. Improving PacBio Long Read Accuracy by Short Read Alignment. PLoS ONE 2012, 7, e46679. [Google Scholar] [CrossRef]
  32. Koren, S.; Schatz, M.C.; Walenz, B.P.; Martin, J.; Howard, J.T.; Ganapathy, G.; Wang, Z.; Rasko, D.A.; McCombie, W.R.; Jarvis, E.D.; et al. Hybrid error correction and de novo assembly of single-molecule sequencing reads. Nat. Biotechnol. 2012, 30, 693–700. [Google Scholar] [CrossRef]
  33. Salmela, L.; Rivals, E. LoRDEC: Accurate and efficient long read error correction. Bioinformatics 2014, 30, 3506–3514. [Google Scholar] [CrossRef] [PubMed]
  34. Zhang, G.; Sun, M.; Wang, J.; Lei, M.; Li, C.; Zhao, D.; Huang, J.; Li, W.; Li, S.; Li, J.; et al. PacBio full-length cDNA sequencing integrated with RNA-seq reads drastically improves the discovery of splicing transcripts in rice. Plant J. 2019, 97, 296–305. [Google Scholar] [CrossRef]
  35. Xie, Q.; Wang, W.; Chen, Q.X. Comparative study on three different methods for the determination of total phenolics in Chinese olive. Food Sci. 2014, 35, 204–207. (In Chinese) [Google Scholar] [CrossRef]
  36. Gordon, S.P.; Tseng, E.; Salamov, A.; Zhang, J.; Meng, X.; Zhao, Z.; Kang, D.; Underwood, J.; Grigoriev, I.V.; Figueroa, M.; et al. Widespread Polycistronic Transcripts in Fungi Revealed by Single-Molecule mRNA Sequencing. PLoS ONE 2015, 10, e0132628. [Google Scholar] [CrossRef]
  37. Conesa, A.; Gotz, S.; Garcia-Gomez, J.M.; Terol, J.; Talon, M.; Robles, M. Blast2GO: A universal tool for annotation, visualization and analysis in functional genomics research. Bioinformatics 2005, 21, 3674–3676. [Google Scholar] [CrossRef]
  38. Ye, J.; Fang, L.; Zheng, H.; Zhang, Y.; Chen, J.; Zhang, Z.; Wang, J.; Li, S.; Li, R.; Bolund, L.; et al. WEGO: A web tool for plotting GO annotations. Nucleic Acids Res. 2006, 34, W293–W297. [Google Scholar] [CrossRef]
  39. Li, R.; Yu, C.; Li, Y.; Lam, T.-W.; Yiu, S.-M.; Kristiansen, K.; Wang, J. SOAP2: An improved ultrafast tool for short read alignment. Bioinformatics 2009, 25, 1966–1967. [Google Scholar] [CrossRef]
  40. Mortazavi, A.; Williams, B.A.; McCue, K.; Schaeffer, L.; Wold, B. Mapping and quantifying mammalian transcriptomes by RNA-Seq. Nat. Methods 2008, 5, 621–628. [Google Scholar] [CrossRef]
  41. Huang, M.J.; Wen, Z.F.; Chi, Y.B.; Peng, Z.F.; Chen, Q.X. Molecular Cloning and Expression Analysis of Flavonoids 3′-hydroxylase (CaF3H) in Canarium album. Mol. Plant Breed. 2017, 15, 839–847. (In Chinese) [Google Scholar] [CrossRef]
  42. Pfaffl, M.W.; Horgan, G.W.; Leo, D.J. Relative expression software tool (REST©) for group-wise comparison and statistical analysis of relative expression results in real-time PCR. Nucleic Acids Res. 2002, 30, e36. [Google Scholar] [CrossRef]
  43. Lesschaeve, I.; Noble, A.C. Polyphenols: Factors influencing their sensory properties and their effects on food and beverage preferences. Am. J. Clin. Nutr. 2005, 81, 330S–335S. [Google Scholar] [CrossRef]
  44. He, M.; Tian, H.; Luo, X.; Qi, X.; Chen, X. Molecular progress in research on fruit astringency. Molecules 2015, 20, 1434–1451. [Google Scholar] [CrossRef]
  45. Xu, Z.C.; Peters, R.J.; Weirather, J.; Luo, H.M.; Liao, B.S.; Zhang, X.; Zhu, Y.J.; Ji, A.J.; Zhang, B.; Hu, S.N.; et al. Full-length transcriptome sequences and splice variants obtained by a combination of sequencing platforms applied to different root tissues of Salvia miltiorrhiza and tanshinone biosynthesis. Plant J. 2015, 82, 951–961. [Google Scholar] [CrossRef]
  46. Tahara, K.; Nishiguchi, M.; Funke, E.; Miyazawa, S.-I.; Miyama, T.; Milkowski, C. Dehydroquinate dehydratase/shikimate dehydrogenases involved in gallate biosynthesis of the aluminum-tolerant tree species Eucalyptus camaldulensis. Planta 2021, 253, 3. [Google Scholar] [CrossRef]
  47. Chang, Q.; Su, M.; Chen, Q.; Zeng, B.; Li, H.; Wang, W. Physicochemical properties and antioxidant capacity of Chinese olive (Canarium album L.) cultivars. J. Food Sci. 2017, 82, 1369–1377. [Google Scholar] [CrossRef]
  48. Torres-Leon, C.; Ventura-Sobrevilla, J.; Serna-Cock, L.; Ascacio-Valdes, J.A.; Contreras-Esquivel, J.; Aguilar, C.N. Pentagalloylglucose (PGG): A valuable phenolic compound with functional properties. J. Funct. Foods 2017, 37, 176–189. [Google Scholar] [CrossRef]
  49. Qin, G.H.; Xu, C.Y.; Ming, R.; Tang, H.B.; Guyot, R.; Kramer, E.M.; Hu, Y.D.; Yi, X.K.; Qi, Y.J.; Xu, X.Y.; et al. The pomegranate (Punica granatum L.) genome and the genomics of punicalagin biosynthesis. Plant J. 2017, 91, 1108–1128. [Google Scholar] [CrossRef]
  50. Yuan, Z.H.; Fang, Y.M.; Zhang, T.K.; Fei, Z.J.; Han, F.M.; Liu, C.Y.; Liu, M.; Xiao, W.; Zhang, W.J.; Wu, S.; et al. The pomegranate (Punica granatum L.) genome provides insights into fruit quality and ovule developmental biology. Plant Biotechnol. J. 2018, 16, 1363–1374. [Google Scholar] [CrossRef]
  51. Grundhofer, P.; Niemetz, R.; Schilling, G.; Gross, G.G. Biosynthesis and subcellular distribution of hydrolyzable tannins. Phytochemistry 2001, 57, 915–927. [Google Scholar] [CrossRef]
  52. Niemetz, R.; Gross, G.G. Oxidation of pentagalloylglucose to the ellagitannin tellimagrandin II, by a phenol oxidase from Tellima grandiflora leaves. Phytochemistry 2003, 62, 301–306. [Google Scholar] [CrossRef]
  53. Cheng, X.; Muhammad, A.; Li, G.; Zhang, J.; Cheng, J.; Qiu, J.; Jiang, T.; Jin, Q.; Cai, Y.; Lin, Y. Family-1 UDP glycosyltransferases in pear (Pyrus bretschneideri): Molecular identification, phylogenomic characterization and expression profiling during stone cell formation. Mol. Biol. Rep. 2019, 46, 2153–2175. [Google Scholar] [CrossRef]
  54. Cui, Y.; Ma, J.; Liu, G.; Wang, N.; Pei, W.; Wu, M.; Li, X.; Zhang, J.; Yu, J. Genome-Wide Identification, Sequence Variation, and Expression of the Glycerol-3-Phosphate Acyltransferase (GPAT) Gene Family in Gossypium. Front. Genet. 2019, 10, 116. [Google Scholar] [CrossRef]
  55. Xu, X.; Zhou, Y.; Wang, B.; Ding, L.; Wang, Y.; Luo, L.; Zhang, Y.; Kong, W. Genome-wide identification and characterization of laccase gene family in Citrus sinensis. Gene 2019, 689, 114–123. [Google Scholar] [CrossRef]
  56. Vanholme, R.; De Meester, B.; Ralph, J.; Boerjan, W. Lignin biosynthesis and its integration into metabolism. Curr. Opin. Biotechnol. 2019, 56, 230–239. [Google Scholar] [CrossRef]
  57. Ni, J.; Zhao, Y.; Tao, R.; Yin, L.; Gao, L.; Strid, A.; Qian, M.; Li, J.; Li, Y.; Shen, J.; et al. Ethylene mediates the branching of the jasmonate-induced flavonoid biosynthesis pathway by suppressing anthocyanin biosynthesis in red Chinese pear fruits. Plant Biotechnol. J. 2020, 18, 1223–1240. [Google Scholar] [CrossRef]
  58. Zuk, M.; Dzialo, M.; Richter, D.; Dyminska, L.; Matula, J.; Kotecki, A.; Hanuza, J.; Szopa, J. Chalcone Synthase (CHS) Gene Suppression in Flax Leads to Changes in Wall Synthesis and Sensing Genes, Cell Wall Chemistry and Stem Morphology Parameters. Front. Plant Sci. 2016, 7, e0132628. [Google Scholar] [CrossRef]
  59. Wu, Q.; Wu, J.; Li, S.-S.; Zhang, H.-J.; Feng, C.-Y.; Yin, D.-D.; Wu, R.-Y.; Wang, L.-S. Transcriptome sequencing and metabolite analysis for revealing the blue flower formation in waterlily. BMC Genom. 2016, 17, 897. [Google Scholar] [CrossRef]
  60. Mitsuda, N.; Ohme-Takagi, M. Functional analysis of transcription factors in Arabidopsis. Plant Cell Physiol. 2009, 50, 1232–1248. [Google Scholar] [CrossRef]
  61. Luo, D.; Zhou, Q.; Wu, Y.; Chai, X.; Liu, W.; Wang, Y.; Yang, Q.; Wang, Z.; Liu, Z. Full-length transcript sequencing and comparative transcriptomic analysis to evaluate the contribution of osmotic and ionic stress components towards salinity tolerance in the roots of cultivated alfalfa (Medicago sativa L.). BMC Plant Biol. 2019, 19, 32. [Google Scholar] [CrossRef]
  62. Deng, Y.; Zheng, H.; Yan, Z.C.; Liao, D.Y.; Li, C.L.; Zhou, J.Y.; Liao, H. Full-Length Transcriptome Survey and Expression Analysis of Cassia obtusifolia to Discover Putative Genes Related to Aurantio-Obtusin Biosynthesis, Seed Formation and Development, and Stress Response. Int. J. Mol. Sci. 2018, 19, 2476. [Google Scholar] [CrossRef]
  63. Sun, M.Y.; Li, J.Y.; Li, D.; Huang, F.J.; Wang, D.; Li, H.; Xing, Q.; Zhu, H.B.; Shi, L. Full-Length Transcriptome Sequencing and Modular Organization Analysis of the Naringin/Neoeriocitrin-Related Gene Expression Pattern in Drynaria roosii. Plant Cell Physiol. 2018, 59, 1398–1414. [Google Scholar] [CrossRef]
  64. Lai, R.L.; Shen, C.G.; Feng, X.; Gao, M.X.; Zhang, Y.Y.; Wei, X.X.; Chen, Y.T.; Cheng, C.Z.; Wu, R.J. Integrated Metabolomic and Transcriptomic Analysis Reveals Differential Flavonoid Accumulation and Its Underlying Mechanism in Fruits of Distinct Canarium album Cultivars. Foods 2022, 11, 2527. [Google Scholar] [CrossRef]
  65. Lai, R.L.; Guan, Q.X.; Shen, C.G.; Feng, X.; Zhang, Y.Y.; Chen, Y.T.; Cheng, C.Z.; Wu, R.J. Integrated SRNA-Seq and RNA-Seq Analysis Reveals the Regulatory Roles of miRNAs in the Low-Temperature Responses of Canarium album. Horticulturae 2022, 8, 667. [Google Scholar] [CrossRef]
  66. Lai, R.L.; Feng, X.; Chen, J.; Zhang, Y.Y.; Wei, X.X.; Chen, Y.T.; Cheng, C.Z.; Wu, R.J. De novo transcriptome assembly and comparative transcriptomic analysis provide molecular insights into low temperature stress response of Canarium album. Sci. Rep. 2021, 11, 10561. [Google Scholar] [CrossRef] [PubMed]
  67. Lai, R.L.; Feng, X.; Chen, J.; Chen, Y.T.; Wu, R.J. The complete chloroplast genome characterization and phylogenetic analysis of Canarium album. Mitochondrial DNA B Resour. 2019, 4, 2948–2949. [Google Scholar] [CrossRef] [PubMed]
  68. Qiao, D.; Yang, C.; Chen, J.; Guo, Y.; Li, Y.; Niu, S.; Cao, K.; Chen, Z. Comprehensive identification of the full-length transcripts and alternative splicing related to the secondary metabolism pathways in the tea plant (Camellia sinensis). Sci. Rep. 2019, 9, 2709. [Google Scholar] [CrossRef] [PubMed]
  69. Xu, W.; Dubos, C.; Lepiniec, L. Transcriptional control of flavonoid biosynthesis by MYB-bHLH-WDR complexes. Trends Plant Sci. 2015, 20, 176–185. [Google Scholar] [CrossRef]
  70. Wang, J.; Cai, J.R.; Zhao, J.Y.; Guo, Z.X.; Pan, T.F.; Yu, Y.; She, W.Q. Enzyme Activities in the Lignin Metabolism of Chinese Olive (Canarium album) with Different Flesh Characteristics. Horticulturae 2022, 8, 408. [Google Scholar] [CrossRef]
  71. Yang, C.Q.; Fang, X.; Wu, X.M.; Mao, Y.B.; Wang, L.J.; Chen, X.Y. Transcriptional regulation of plant secondary metabolism. J. Integr. Plant Biol. 2012, 54, 703–712. [Google Scholar] [CrossRef]
  72. Wu, S.; Zhu, B.; Qin, L.; Rahman, K.; Zhang, L.; Han, T. Transcription Factor: A Powerful Tool to Regulate Biosynthesis of Active Ingredients in Salvia miltiorrhiza. Front. Plant Sci. 2021, 12, 622011. [Google Scholar] [CrossRef]
  73. Cao, Y.; Li, K.; Li, Y.; Zhao, X.; Wang, L. MYB Transcription Factors as Regulators of Secondary Metabolism in Plants. Biology 2020, 9, 61. [Google Scholar] [CrossRef]
  74. Zhou, W.; Shi, M.; Deng, C.; Lu, S.; Huang, F.; Wang, Y.; Kai, G. The methyl jasmonate-responsive transcription factor SmMYB1 promotes phenolic acid biosynthesis in Salvia miltiorrhiza. Hortic. Res. 2021, 8, 10. [Google Scholar] [CrossRef]
  75. Hao, X.; Pu, Z.; Cao, G.; You, D.; Zhou, Y.; Deng, C.; Shi, M.; Nile, S.H.; Wang, Y.; Zhou, W.; et al. Tanshinone and salvianolic acid biosynthesis are regulated by SmMYB98 in Salvia miltiorrhiza hairy roots. J. Adv. Res. 2020, 23, 1–12. [Google Scholar] [CrossRef]
  76. Arlotta, C.; Puglia, G.D.; Genovese, C.; Toscano, V.; Karlova, R.; Beekwilder, J.; De Vos, R.C.H.; Raccuia, S.A. MYB5-like and bHLH influence flavonoid composition in pomegranate. Plant Sci. 2020, 298, 110563. [Google Scholar] [CrossRef] [PubMed]
  77. An, J.P.; Zhang, X.W.; Bi, S.Q.; You, C.X.; Wang, X.F.; Hao, Y.J. The ERF transcription factor MdERF38 promotes drought stress-induced anthocyanin biosynthesis in apple. Plant J. 2020, 101, 573–589. [Google Scholar] [CrossRef] [PubMed]
  78. Huang, Q.; Sun, M.; Yuan, T.; Wang, Y.; Shi, M.; Lu, S.; Tang, B.; Pan, J.; Wang, Y.; Kai, G. The AP2/ERF transcription factor SmERF1L1 regulates the biosynthesis of tanshinones and phenolic acids in Salvia miltiorrhiza. Food Chem. 2019, 274, 368–375. [Google Scholar] [CrossRef] [PubMed]
  79. Cao, W.; Wang, Y.; Shi, M.; Hao, X.; Zhao, W.; Wang, Y.; Ren, J.; Kai, G. Transcription Factor SmWRKY1 Positively Promotes the Biosynthesis of Tanshinones in Salvia miltiorrhiza. Front. Plant Sci. 2018, 9, 554. [Google Scholar] [CrossRef]
Figure 1. Growth and total phenolic content (TPC) of C. album fruits at 20, 40, 70, and 110 days after flowering (DAF). (A) Phenotypes of C. album fruits. (B) Growth indexes of C. album fruits. Each data point is the average mean of ten fruits ± SD. (C) TPC of C. album fruits. Each data point is the average mean of four biological repetitions ± SD. Based on the Tukey–Kramer test, different lowercase letters indicate significant differences at p < 0.05 levels.
Horticulturae 10 00293 g001
Figure 2. Full-length transcriptome sequencing and assembly of C. album by the SMRT method. (A) Venn diagram of the full-length transcripts against four public databases. (B) Distribution and statistics of isoforms in each sample species (only the first ten are shown). (C) The diagram of GO function classification. (D) The diagram of KOG function classification.
Horticulturae 10 00293 g002aHorticulturae 10 00293 g002b
Figure 3. Analysis of differentially expressed genes (DEGs) among the DAF20 vs. DAF40, DAF40 vs. DAF70, and DAF70 vs. DAF110 groups. (A) Statistical analysis of DEGs at different developmental stages of C. album fruit. (B) Venn diagram showing the distribution of DEGs.
Horticulturae 10 00293 g003
Figure 4. GO enrichment analysis of DEGs. Three main categories of GO category enrichment analysis of DEGs in groups of DAF20 vs. DAF40 (A), DAF40 vs. DAF70 (B), and DAF70 vs. DAF110 (C).
Horticulturae 10 00293 g004aHorticulturae 10 00293 g004b
Figure 5. KEGG pathway enrichment analysis of DEGs. The Top20 pathways with the most significant q-value in the DAF20 vs. DAF40, DAF40 vs. DAF70, and DAF70 vs. DAF110 groups. Up-regulated DEG pathway enrichment analysis based on the differentially up-regulated genes in each comparison group. Down-regulated DEG pathway enrichment analysis based on the differentially down-regulated genes in each comparison group. In the bubble diagrams, the ordinate is KEGG pathways, and the abscissa is the enrichment factor (the number of differences in the KEGG pathway divided by all the quantities; the magnitude represents the quantity; the redder the color, the smaller the p value).
Horticulturae 10 00293 g005
Figure 6. Analysis of DEGs involved in the HT biosynthesis pathway in C. album fruit. In the metabolic pathways, the enzymes marked in red indicated that their coding genes were differentially expressed. The heatmap of DEGs encoding each enzyme is shown near the enzymes. The gene expression was based on the log2(FPKM) value. FPKM was the mean of three replicates. The Pearson correlation coefficient (PCC) was used to measure the correlation between the expression of DEGs and TPC. The names of genes in the signaling pathway are presented in the abbreviation list. The solid arrow represents the pathway, the dashed arrow leads to the differentially expressed genes of enzymes in that pathway, and the yellow-green bold arrow represents the explanatory role. This is also applicable to the image that follows.
Horticulturae 10 00293 g006
Figure 7. Analysis of DEGs involved in phenylpropanoid biosynthesis pathway in C. album fruit. In the metabolic pathways, the enzymes marked in red indicated that their coding genes were differentially expressed. The heatmap of DEGs encoding each enzyme is shown near the enzymes. The gene expression was based on the log2(FPKM) value. FPKM was the mean of three replicates.
Horticulturae 10 00293 g007
Figure 8. Analysis of DEGs involved in the flavonoid biosynthesis pathway in C. album fruit. In the metabolic pathways, the enzymes marked in red indicated that their coding genes were differentially expressed. The heatmap of DEGs encoding each enzyme is shown near the enzymes. The gene expression was based on the log2(FPKM) value. FPKM was the mean of three replicates.
Horticulturae 10 00293 g008
Figure 9. Distribution and trend analysis of TF families in C. album. (A) The top 20 TF families and differentially expressed TFs distribution in C. album. According to the C. album SMRT data, the top 20 TF families with the largest number were predicted and their number distribution of differential expression in the RNA-seq. (B) Trend analysis was conducted for all differentially expressed TFs, divided into 20 profiles. They are sorted by the number of genes (bottom left), from the most to the least. The clustered profiles with p-value ≤ 0.05 were considered significant and are colored.
Horticulturae 10 00293 g009
Figure 10. Expression analysis and RT-qPCR verification of DEGs in C. album fruit. The column shows the expression level from RNA-seq, and the broken line shows the relative expression level from RT-qPCR. FPKM calculated the relative gene expression levels from RNA-seq data. RT-qPCR was used to examine the relative gene expression, which was determined by the 2−∆∆CT method and normalized with the reference gene ACT7. Each reaction was performed in three biological replicates with three technical replicates.
Horticulturae 10 00293 g010
Table 1. Information of the full-length transcriptome isoform sequences in C. album from SMRT data.
Total number135,439
Total length (bp)364,052,044
Maximum length (bp)11,994
Minimum length (bp)56
Average length (bp)2687.94
N50 length (bp)3224
GC content40.47%
Disclaimer/Publisher’s Note: The statements, opinions and data contained in all publications are solely those of the individual author(s) and contributor(s) and not of MDPI and/or the editor(s). MDPI and/or the editor(s) disclaim responsibility for any injury to people or property resulting from any ideas, methods, instructions or products referred to in the content.

