
3D WebGIS for Ephemeral Architecture Documentation and Studies in the Humanities


Politecnico di Torino, Department of Architecture and Design, Viale Mattioli, 39, 10125 Torino, Italy
*
Author to whom correspondence should be addressed.
Heritage 2024, 7(2), 913-947; https://doi.org/10.3390/heritage7020044
Submission received: 19 January 2024
/
Revised: 7 February 2024
/
Accepted: 9 February 2024
/
Published: 11 February 2024
(This article belongs to the Special Issue Innovative Systems and Metodolgies for Monitoring and Valorization of Cultural Heritage)
Abstract
:The documentation and visualization of ephemeral CH, especially for World’s Fairs architecture, remains a neglected endeavor on the global scale. While digital products like 3D models find extensive application in CH, the use of a WebGIS has scarcely been explored in this domain. When a WebGIS is used for CH, it serves to communicate the output of research, not as a tool to support the development of the research itself. Moreover, aspects like procedural development for the creation of a WebGIS platform, its upgrading, and its long-term preservation are key factors for the maintenance of the digital tool, but they have scarcely been considered in the literature. Through the Turin 1911 project, this paper defines a procedure for the creation of a WebGIS for ephemeral architectural documentation, showing how a WebGIS platform can be designed, implemented, tested, and maintained. The novelty of this study lies in the creation of a 2D/3D WebGIS based on a tailored spatial database; the WebGIS is coupled with a dedicated website for the constant updating of the research data documenting the Turin 1911 International Exposition. The discussion emphasizes the transformative role of a WebGIS in not only sharing information but also serving as a dynamic platform for conducting digital humanities studies in 3D environments.
1. Introduction
1.1. From GIS to 3D WebGIS for the Humanities
Geographical information system (GIS) platforms have been proven to be an effective analysis tool not only in different fields, especially in cultural heritage (CH) [1,2,3], but also in studying historical data (like maps, drawings, and statistical data), becoming historical GIS (HGIS) [4]. Having data stored in a structured way, as in GIS, allows the performance of queries on large records that could be challenging for a human, demonstrating effectiveness in analyzing phenomena’s evolution over time, such as in the cases of historical earthquakes [5] or political boundaries changing [6]. Additionally, an HGIS can be used to collect and catalog historical documents—like newspapers and depictions [7]. Historical data can be connected to past landscapes they represent, they can be attached as simple attachments, or they can be georeferenced, and geometries can be extracted, as in [4,8]. Environments not visible today can be reconstructed by extracting 2D features from the georeferenced historical maps; then, the reconstructed space can be navigated through space and time, thanks to the database (DB) structure, as in [7]. Unfortunately, most of these studies remain relegated to GIS projects loaded on local computers. Moreover, a GIS requires downloading software, and users must be GIS experts; meanwhile, to understand data, it is not required to have GIS skills. These limitations were overcome through the advent of WebGIS platforms [9]; this term is sometimes replaceable with GeoWeb [10].
A WebGIS offers advantages such as global coverage of an audience, a large number of users working on the same project thanks to scalability, a low cost per user, cross-platform capabilities in terms of devices’ typology and related operating systems, and ease of use [11]. Today, WebGIS applications are commonly used as providers of geographical data [12], in planning territorial maintenance [9], and for disaster analysis and risk prevention [13,14]. Moreover, other innovative WebGIS applications have recently arisen in the CH domain [15,16,17,18,19,20]. Very few studies have exploited a WebGIS for the humanities, but it demonstrates great potential in these areas. Especially when research deals with archival materials, a WebGIS opens the door to material stored in uneasy-to-access depots, also providing access to georeferenced historical cartography, like in the cases of the Portals of the Geological Survey of Italy [21], the State Archive of Como (Italy) [22], and 19th-century maps of Cyprus [23,24]. In addition to being georeferenced and representing digital archives, a WebGIS also allows the spatialization and visualization of conceptual places, like Dante’s Inferno [25], or the comprehension of a huge amount of documentation of physical places, as in Mapping Ancient Athens, which covers 160 years of archaeological excavations [26]. Past events can be retraced and narrated in WebGIS applications, and the visualization of ephemeral architecture can be achieved by reconstructing structures, thanks to historical depictions and maps, as in the case of Napoleon‘s journey to Venice [27]. A WebGIS is used not only for data archiving, visualization, queries, and downloads but also for generating analysis maps—such as density maps and statistical data—allowing the retrieval of, for instance, the distribution of historical images for the Yunnan–Vietnam Railway [28]. Relationships between historical events, their locations, and people can be observed over time, such as the influence played by an important Chinese politician across China [29] or the Australian places visited by the explorer Sir Joh Forrest over the 19th century [30]. In [31], a WebGIS was applied to research the Chinese diaspora in Southeast Asia, connecting religious sites with archival and historical sources. More advanced studies have provided analytical tools in a 3D WebGIS to analyze 3D models georeferenced in space, as in the MayaArch3D project for the UNESCO site of Copan (Honduras), where 2D and 3D data are integrated [32].
As demonstrated in these studies, WebGIS applications enable experts in the humanities and non-information and communication technologies (ICT)—and non-GIS experts in general—to integrate information and explore relationships hidden in various documents that, without the use of a WebGIS, would remain difficult to discover. Structuring a WebGIS platform helps researchers reduce the complexity of querying numerous data, spatializing them, referring them to a specific time, and saving time for experts [29]. Unfortunately, these studies are limited in different ways. In general, people experience places from the human point of view and in a 3D visualization, and not using 2D representations from a bird’s-eye view. In almost all the studies here considered, a WebGIS is solely conceived as 2D, missing an opportunity to make historical places more understandable to everyone [21,28,29]. Ontologies and cataloging standards for historical documents and architectures are rarely adopted and declared; good examples are the study conducted by Wei [29] for ontologies’ applications in relating people, events, places, and time—and the Istituto Superiore per la Protezione e la Ricerca Ambientale (ISPRA) geoportal—regarding the application of cataloging standards to maps. Relationships are not always considered, missing an opportunity to expand knowledge; a good example is provided by [28]. Often, a WebGIS is employed to publish research results, but the link is not provided or is no longer available—like in the MayaArch3D project [32] 1—overlooking the opportunity provided by a WebGIS to exchange data and stressing the need for maintenance or archival plans for WebGIS applications. In general, WebGIS maintenance is neglected in the observed literature, risking tool inaccessibility and, thus, data loss.
1.2. WebGIS Overview
From the users’ side, a WebGIS does not require downloading GIS software or expertise in using it; only a device and the internet are necessary, showing the ease of WebGIS usage [9]. From WebGIS creators’ side, different types of expertise are requested to design and create a WebGIS application, mainly depending on the usage of commercial or free and open-source solutions [33,34]. When the architecture of a WebGIS relies on free and open-source solutions—such as QGIS 2, gvSIG 3, GRASS GIS 4, and Thuban 5—many software are involved, and more ICT skills are needed 6. Commercial solutions—such as ArcGIS Pro 7 (ESRI), GeoMedia 8 (Hexagon), and AutoCad Map 3D 9 (Autodesk)—offer services and packages ready to be used, simply inserting the desired data, and they provide customized solutions that request minimal interface design; otherwise, application programming interfaces (APIs) are provided for developers to fully customize their applications [14]. Commercial solutions have proven to be more costly but less time-consuming than open-source solutions that request operator expertise in GIS and ICT [33].
Technically, a WebGIS 10 is based on a DB that can be managed using the GIS software itself [10] or that can be based on different DB models—relational, object-oriented, hierarchical, or network DBs—managed via a specific database management system (DBMS), like MySQL 11 or PostgreSQL 12 [29,32]. Due to their nature, relational DBs allow the relation between entities, representing the most logical solution for projects dealing with cataloging and archiving [35], common activities performed when dealing with CH. Data can be stored in spatial DBs to handle geometries and their coordinates in a defined reference system [28]. Data can be queried using structured query language (SQL), and predefined queries can be integrated into the application, enabling users to apply them just by clicking a button and without knowing SQL [32]. When dealing with CH, building the data structure—especially in the case of relational DBs—is the most costly and time-consuming stage of a GIS project, but structured data are more usable for computers than unstructured ones [36,37]. Using thesauri, linked open data (LOD), and ontologies clearly define concepts and their mutual relations, avoiding misunderstandings among experts in different fields and promoting data exchange. Connecting a WebGIS to a DB stored on an online server allows a more collaborative working solution [5]. In addition to textual data, images are paramount sources of information, providing more data than the metadata about what is represented. Therefore, the combination of text-based and image-based searches could constitute a powerful tool that led us to rethink the method we use for our studies [38] and how WebGIS interfaces are designed. A WebGIS can constitute a helpful tool for many studies, but it cannot be exhaustive or be overloaded with data; thus, integration with other interfaces like websites could be beneficial [39,40]. However, the observed literature does not consider the use of geo-DBs for WebGIS design, and integration with websites is scarcely applied in the digital humanities [21,22,27,28,29,31].
Different data types can be inserted into a WebGIS (raster and vector data); tables storing only textual and/or numerical data and relations between them can be displayed [28]. Moreover, GIS can exploit standardized geospatial services provided by different cartographic services—like the Open Geospatial Consortium (OGC)—as online services, such as a web map service (WMS), to display maps as image files, a web feature service (WFS) to display vector data in geographical markup language (GML) coding, and web coverage services (WCSs) to provide access to geodata describing phenomena varying in space [34]. The usage of standardized geospatial services is beneficial because they provide interoperability in geographical data, allowing data exchange and integrability. Recently, some steps forwards have extended WebGIS potentialities and applications. Three-dimensional models—such as point clouds, triangular irregular networks (TINs), and building information models (BIMs)—can also be loaded into GIS software and uploaded onto a WebGIS, giving birth to 3D WebGIS applications [32]. Three-dimensional models can be loaded with different levels of detail (LoD)—to provide a synthetic index of the geometric level of detail of a model [41]—and queried. Three-dimensional elements can be selected according to time, and new relationships can be discovered on a WebGIS, providing a new collaborative working tool in the humanities [32]. Three-dimensional visualization can be generated in many ways. Two-dimensional footprints can be extruded according to the height stored in a field, as in [3,42]. More detailed 3D models—reality-based or documents-based—can be integrated with a simple link in the record that opens a dedicated software for its visualization, such as in [4], or 3D models can be loaded into GIS environments. Different data types can cooperate to generate other data, as point clouds and vector files can be combined to extract roof shapes and obtain digital terrain models (DTMs) and digital surface models (DSMs), as in the case of the urban model of the City of Turin [42]. A WebGIS is limited by the ability to visualize large, complex and large, polygonal models [32], but thanks to WebGL and graphics-processing power, today, 3D scenes are loaded faster and smoother than what happened some years ago on the web, providing more intuitive ways for understanding [11]. Alongside 3D visualizations in a WebGIS, virtual reality (VR) visualization is supported [11,42,43], and recently, machine learning algorithms have been combined with a WebGIS to predict landslide risk [44], observe traffic behavior through social media data [45], detect and quantify forest damage [46], and evaluate hotel locations [47]. Additionally, real-time data can be collected and displayed in WebGIS applications, creating smart workflows and expanding the potentialities of collaborative works [11], like taking advantage of the acquisition of crowdsourcing data [13]. A WebGIS is a tool that facilitates access to culture and makes knowledge understandable to a broader audience, but it could also be a teaching tool [48]. From this perspective, WebGIS applications have become more appealing learning, teaching, and working tools, but VR applications, artificial intelligence, real-time data, and crowdsourcing data are rarely exploited in a WebGIS for the CH domain or in the humanities. WebGIS applications, as digital products, risk data loss and rapid application obsolescence due to their inherent vulnerability in the ever-evolving technological panorama. The ease of web content publication and the rapid content updates pose two fundamental questions: what should be archived, and is it worth the effort? Acknowledging the challenge of maintaining digital products, especially on institutional platforms, initiatives like the Internet Archive 13 and its Wayback Machine 14 have emerged [49]. The Wayback Machine allows users to archive web pages for future access, mitigating the impact of web page unavailability. The usage of persistent identifiers, like the Digital Object Identifier (DOI), is another solution, ensuring reliable retrieval and access to digital items [50]. However, DOI availability is limited to recognized institutions, enhancing credibility. Yet, when dealing with cultural heritage (CH), the focus often shifts to preserving CH through digital products, sidelining essential digital preservation aspects. The London Charter [51] addresses the topic of sustainable strategies to ensure the long-term preservation of CH-related digital visualizations, emphasizing the importance of maintaining access to digital objects, rather than preserving the storage medium. While it provides a general framework, technical issues are not explicitly addressed. Many research projects documenting CH lack a plan for the long-term preservation of digital objects, as reported by [52]. For 3D models’ long-term preservation, some aspects should be addressed in relation to digital products’ life cycle (like storage space, the data format, accessibility, usability, metadata, cost, documentation, and the preservation scope), aspects that often are not discussed or defined when starting a digital project [53,54,55]. When dealing with spatial data like with GIS, other issues arise. File format adoption in GIS presents challenges for data preservation, with proprietary formats posing compatibility risks. Relational databases with spatial data require attention to preserve relationships for data integrity. Open-source DBMS like PostgreSQL are suggested, but the preservation aspect is often overlooked when selecting DBMS or GIS software. The complexity increases when considering applications running on the web, as highlighted by the National Geographical Digital Archive. In addition to content preservation, medium preservation has also become crucial for the survival of the entire web system. Actions such as software upgrades, data backups, monitoring, and migration to stable technologies are crucial for preserving digital products on the web. Without proper life cycle planning, data may become inaccessible, and recovery costs may outweigh maintenance expenses, like in the case of the Canada Land Inventory [56]. While extensive documentation and working procedures are recognized as fundamental for mitigating risks, not all institutions and groups invest in these actions, leaving room for uncertainty but also opportunities for improvement [57,58].
1.3. Research Aim
Recognizing the need for documentation describing a WebGIS that could be useful for its long-term preservation, which aspects should be included in the documentation, and how can they be summarized? Additionally, considering the potential offered through a WebGIS application, can this be beneficial to study past events in the humanities field? This paper outlines the development of a new, dedicated 2D/3D WebGIS for the Turin 1911 project, detailing the procedural workflow and its integration into a dedicated website and considering aspects sometimes neglected in the literature—like WebGIS testing and maintenance. The aim is to propose a tailored workflow and a novel report to document how the WebGIS is achieved and maintained. This WebGIS can be replicated for other World’s Fairs and, if properly readapted, to ephemeral or no-longer-visible architecture in general. Conversely to much research considered in the previous section, in this paper, a WebGIS is not solely applied for dissemination purposes but also demonstrates how WebGIS applications can be used as easy tools supporting the research itself, providing a new, interactive way to explore ephemeral architecture and unveil hidden connections. Section 2 explains the Turin 1911 project—the applicative case study—focusing on the analysis of the digital documentation of Worlds’ Fairs, and it describes the designed workflow. Section 3 illustrates the obtained results. Section 4 discusses how WebGIS applications can be fruitfully applied to ephemeral architecture studies and documentation. Section 5 presents the final conclusions and recommendations.
2. Materials and Methods
This study takes a single fair, the Turin 1911 International Exposition, as a case study for ephemeral architecture documentation. After the presentation of the Turin 1911 project, this section illustrates the state of the art of the digital documentation of World’s Fairs to introduce the topic. Finally, the workflow for the development of a tailored WebGIS is illustrated, covering all phases involved, from the design of the WebGIS to its maintenance.
2.1. The Turin 1911 Project
World’s Fairs, prominent mass gatherings in the 19th and 20th centuries, highlighted the evolving world of modernity but were ephemeral events conceived to showcase, rather than preserve, ephemeral architecture and what they displayed. The Esposizione Internazionale delle Industrie e del Lavoro (International Exposition of Industry and Labour) held in Turin (Italy) in 1911 was no exception; after its closing, documents—sole witnesses of magnifying but ephemeral architecture—found shelter in several repositories worldwide, making their study nearly impossible.
Led by the University of California San Diego (USA) and Politecnico di Torino (Italy), Turin 1911 [59] is a digital project (https:italyworldsfairs.org accessed on 8 Feruary 2024) dedicated to the documentation and study of the 1911 World’s Fair held in Turin on the occasion of the 50th anniversary of the Reign of Italy. The World’s Fair took place in the fabulous location of Valentino Park, covering around 1 million m2—of which 250,000 m2 were covered [60]—an area that is larger than the actual park (Figure 1) and has mostly changed over time. Around two hundred ephemeral objects in different styles were built for the fair and predestined to be dismantled or destroyed at the closing of the event. This architecture reappeared on fragile paper documents (Figure 2) and in a few historical documentaries. In 2009, the Turin 1911 project team developed a website devoted to the documentation and analysis of the 1911 Turin International Exposition. The website was mainly conceived as a digital archive and was based on a DB designed to display all the documents dispersed in numerous archives, libraries, museums, and collections spread worldwide, both public and private. The archival goal responded to a global need. Before 2010, there was no dedicated archive exclusively focused on World’s Expositions, when the first international institution for the World’s Fairs documentation was created, the World Fairs Museum.
The website dedicated to the Turin 1911 exposition sought to establish a more enduring and structured platform for the numerous materials associated with this fair, streamline research processes, and evolve into an innovative forum for exploration. In 2018, the Turin 1911 project moved a step forward by virtually reconstructing a few of the 1911 Turin pavilions. Starting from the collected archival materials, and thanks to the contributions of architects and engineers, ephemeral architecture can now be easily observed in 3D [61,62]. Furthermore, various methods were experimented with to conduct the 3D metric survey of the Medieval Hamlet and Valentino Castle that are still visible today [63,64]. After more than 10 years since its construction, the Turin 1911 website seems obsolete in content navigation, and the DB presents many issues. The website displays a dated appearance (Figure 3) and requires re-platforming; the content lacks optimal organization and presentation, and the tools for visualizing images and books are outdated. The DB is not a spatial DB; nor are thesauri and standards followed to catalog the archival materials. Thus, it is not optimal for studying the Turin 1911 Fair [65]. Hence, a new geo-DB comprising georeferenced data and organized following cataloging standards and thesauri was created. The new website was designed, prototyped, and integrated with WebGIS applications to also display the 3D models of the reconstructed structures [39,40]. The website domain (italyworldsfairs.org) was preserved, and from 27 October 2023, the new Turin 1911 website is visible instead of the old one. The old website was archived, thanks to the Internet Archive Wayback Machine 15, and it is visible on its dedicated webpage 16.
2.2. Digital Documentation of World’s Fairs
As already reported, World’s Fairs 17 are ephemeral events able to attract millions of spectators to showcase the latest innovations; additionally, they are places of international architectural impact where iconic structures survive in cultural memory. Only a few structures survive after the closing of these events, like the Space Needle in Seattle (WA), while others are dismantled or destroyed, like the Crystal Palace in London (UK). Due to their intrinsically ephemeral aspect, World’s Fairs architecture is destined not to endure every time physically, and this innovative architecture faces the risk of being lost. If little regard is afforded to architectural survival, even less attention is given to preserving the materials documenting a World’s Fair—such as guidebooks, photographs, technical drawings, and videos—that often represent the sole physical witnesses of these ephemeral events. Various private or public institutions—like archives, museums, and libraries—preserve the original documents but are located worldwide, so the identification, consultation, and study of all the documents related to a World’s Fair become hard tasks. Classical access to archival materials is even more complex if we consider aspects like incomplete and monolingual inventories and fragile or difficult-to-handle materials [67]. Archives are paramount sources of primary data for researchers, especially for ephemeral CH like World’s Fairs, but the accessibility of repositories is still the main obstacle in CH research, also due to budget limitations [38].
On one side, archival research can be extremely time-consuming and costly; on the other side, the rapid development of ICT offers unprecedented conditions for easing archival research. Among the ICT available in everyday life, the most-used technologies for communication and information are the internet, computers, and smartphones since they ease daily activities [68]. Today, the internet represents a new place to start a research project [69,70], and the advent of mobile devices has redefined access to the documentation of CH and how research is conducted [68]. The digitization of archival material and online publishing expose them to a broader audience while preserving the original. Nevertheless, online research can be counter-productive due to the huge amount of data available online; thus, metadata have become relevant to perform productive queries when the online data amount becomes huge [71]. Additionally, starting from visual documentation like photographs, maps, and drawings, a 3D digital reconstruction can be achieved. While not always essential, a 3D representation of an object can enhance comprehension, making the invisible architecture visible and comprehensible to non-experts in architecture modeling [67]. Digital projects for CH often lack coordination among institutions, a common language, and shared procedures [72].
In this framework, the digital documentation of World’s Fairs is no exception. Unlike other CH—like archaeological excavations or underwater CH—World’s Expos have no dedicated international conventions, guidelines, or recommendations for their documentation, nor is a single cataloging standard well suited to describe a historical event, providing a 360° overview. World’s Fairs are only regulated by the Bureau International des Expositions (BIE) [73], according to the 1928 Paris Convention [74], which focuses only on event organization. Thus, World’s Fairs’ protection and study are not undertaken despite their relevance to humankind’s culture. Regarding ICT applications, the BIE website provides an inventory of all World’s Fairs [75], but this inventory is only browsable by clicking on a single exposition; data cannot be queried, filtered, or compared. In addition to BIE, the most important institution for World’s Fairs is the World Expo Museum [76] in Shanghai, which is today the only international center for World’s Fairs’ documentation recognized by the BIE. The World Expo Museum gathers all kinds of original materials, promotes World’s Fairs-related activities, and has a documentation center and a library. Nevertheless, the World Expo Museum lacks digital tools to disseminate what it preserves; for instance, sending an email, making a phone call, or making an in-person visit are the only ways to verify whether the library owns a book because the institution lacks an online catalog. In addition to the World Expo Museum, many institutions demonstrate a great interest in preserving World’s Fairs heritage, carrying on digitization activities and the online dissemination of the archival material documents that they own. Few museums have permanent collections related to individual exhibitions, such as the Queens Museum in New York [77] and the Museum of the City of New York [78]. In addition to a physical exhibition, both institutions try to digitally display their materials online, providing digital images for the collected materials that are accompanied by metadata.
Only a few libraries, mainly based in the United Kingdom and the United States, are creating digital collections specifically dedicated to Universal Expos 18. Among these, notable for their effort—especially in digitization, online publishing, metadata provision, and free access—are the Century 21 World’s Fair Digital Document Library by the Seattle Public Library and the Louisiana Purchase Exposition: The 1904 St. Louis World’s Fair by the Missouri State Library and Archives. Furthermore, the Smithsonian Library provides a DOI to guarantee a never-changing string to store and retrieve the digital element and its metadata. The University of Maryland Collections websites provide a subdivision of the material according to the fair name and object type (like photographs and catalogs), but there is no connection with a thesaurus, nor are terms’ definitions provided, leaving space for ambiguity. Despite all these efforts, these collections are always part of institutional websites, remaining trapped in data structures not specifically designed for World’s Fairs’ documentation. Additionally, content navigation design often creates obstacles, rather than facilitating research. Mainly, a search is performed by typing keywords and selecting filters, which is perfect for expert users who already know the collection, but these tools are not welcoming for non-experts.
Two publishing companies have created digital collections about World’s Fairs for research and education purposes; they base their repositories on original archival materials preserved by other libraries and archives. The Smithsonian Collections Online; World’s Fairs and Expositions, Visions of Tomorrow [79]—by the GALE company 19—simply shows the digitized material for 7 sample expositions. Users are free to explore the digital documents by interactive flip books but can also download PDF files. The World’s Fairs. A Global History of Expositions [80] digital collection—by Adam Matthew (SAGE publishing company) 20—shows the most interesting system to systematically collect and display digitized and categorized materials. In addition to images, the digital collection extensively uses 360° object viewers, sound-play tools for audio, and flip books. Furthermore, using interactive plans, Adam Matthew is the sole one trying to locate the archival material in space using a 2D map. Despite all this, access is restricted, and no information about the meaning of the categories is provided.
Finally, very few digital projects—ExpoMuseum [81], the 1939 New York World’s Fair 21, and the World’s Columbian Expositions of 1893 [82]—started through the initiative of individuals (and not institutions) with the primary aim to create something digital. The World’s Columbian Exposition Reconstruction represents the sole case in which 3D modeling aspires to reconstruct a fair entirely. Despite this effort, the main aim is not the study of the fair itself and its online public sharing; rather, the fairground is used as a testbed for educational and research purposes. Therefore, many aspects are not considered, such as the long-term archiving of the models or the connection to the original documents that are the sources for the 3D modeling.
All of these digital collections are basically physical collections converted into a digital form, regarding dissemination on the internet as a support but not as the primary aim. With the technologies available today, much more can be done to facilitate public access to documents closed in many depots, combine them to expand knowledge, extract other information, and empower their study.
2.3. Workflow Definition
Many software types, models, and methodologies are available to develop a WebGIS; in this paragraph, we propose a tailored workflow that can be applied not only to the Turin 1911 case study but also to other WebGIS platforms for CH documentation. The present workflow is particularly focused on a WebGIS for CH, and it improves the WebGIS development cycle proposed by Alesheik in 2002 [12]. The proposed workflow also takes inspiration from the waterfall method 22—it is subdivided into planning, analysis, design, implementation, testing, and maintenance phases—and it integrates other key aspects. When designing a WebGIS for a specific project, it is important to consider technical aspects influencing the cost, development time, and needed expertise, as suggested in [33]. Additionally, other aspects, like the scope of usage, target audience, data interoperability, software compatibility, WebGIS application configuration (like for smartphones, tablets, and desktops), operating systems, languages, terms’ definitions based on thesauri, ontologies, working documentation, and data authorship, should be considered. The proposed workflow can be summarized in 4 phases: design, implementation, testing, and maintenance. In the following subparagraphs, for each phase, aspects to be considered are reported for comprehensive guidance; then, results regarding the Turin 1911 WebGIS are reported in Section 3.
2.3.1. WebGIS Design
When designing a WebGIS, the first aspects to be clarified are the scope and target users. Then, devices, browser applications, and operating systems should be defined. After these preliminary steps, the most relevant aspect to consider is the data. In some cases, data can be already available—like data that come from existing repositories—they can be generated from specific acquisitions like questionnaires, or they can be acquired via sensors. Existing data should be searched, analyzed, and harmonized in a data structure. Building or adapting a data structure could be the most challenging step [36,37]. Data should be structured according to their goal and users, and a DBMS has to be selected according to needs [28], using—as far as possible—cataloging and geographical standards or guidelines. A reusable data structure for CH documentation does not exist, and it needs to be tailored according to the case study, requesting time and expertise in cataloging and systematizing [19,33]. In the design process, using a common thesaurus for CH is essential for the dialogue between different experts [33], and LOD can expand on the contextualization of CH, as demonstrated in [83]. In this phase, entities composing the DB—like tables, polygonal features, and raster features—and the data schema can be defined using different approaches. Codd [84] proposed a method that uses conceptual, logical, and physical models, following an ever-increasing level of detail. According to Sensini [85], there are three approaches for DBs’ design: top-down, bottom-up, and mixed. Technically, according to Ismanto [9], a WebGIS should include 5 key components: a web application, digital base maps, operational layers, one or more geo-DBs, tools, and tasks 23. Considering the above, we propose a list of key aspects that must be defined and can be used as concise documentation for a WebGIS: the scope, users, uses, devices, browsers, existing data, data entities, data structure, DB model, DBMS software, GIS software, WebGIS applications, GIS server, interoperability with other software, cataloging standard, geographical standard, thesauri, LOD, ontologies, data, and WebGIS authorship. WebGIS specifications for Turin 1911 are discussed and summarized in a table reported in Section 3.
2.3.2. WebGIS Implementation
Independently from the selected software, we propose the following steps to implement a WebGIS:
- Raster maps and vector data preparation;
- Online data sharing;
- Two- or three-dimensional WebGIS creation.
These steps were used for the Turin 1911 case study, and their results are reported in Section 3. In raster maps and vector data preparation, historical maps are selected, georeferenced, and used to extract 2D and 3D vector data. A data source, georeferencing method, and reference system are specified. The process of deriving geometries from historical maps is briefly explained. Some aspects related to the selected software—ESRI produces—are addressed. In detail, regarding vector data, ArcGIS Pro (ESRI) provides different types of vector data to create 3D elements: 2D polygonal feature classes, multi-patch feature classes, and 3D objects. An analysis of the three types is proposed. Regarding online publishing, sharing data contained in a spatial DB on the GIS server can lead to the generation of various visualization types. Several tests were performed to verify the most efficient data type visualization since online performance differs according to the settings. Finally, for the 2D/3D WebGIS creation, ArcGIS Online 24 and ArcGIS Enterprise 25 were both tested in combination with Web App Builder (WAB) 26 and Experience Builder 27. Many technical issues were faced during the creation process and were solved with an iterative process that concurrently considered the three main steps: data preparation in ArcGIS Pro, online publishing with ArcGIS Online and Enterprise, and WebGIS creation. Many issues were related to the available options—since the ArcGIS Enterprise and ArcGIS Online interfaces can be slightly different—and to the compatibility between Map Viewer or Map Viewer Classic and the applications available to develop a WebGIS, like WAB. Representational state transfer (REST) services, the hypertext transfer protocol secure (HTTPS), uniform resource locators (URLs), the web map tile service (WMTS), and caching systems were adopted to facilitate the retrieval of online data on the WebGIS and access it. All these challenges were considered during the WebGIS creation step, influencing the choice of one application over another. Finally, the WebGIS configuration, tools, and integration into the Turin 1911 project website are illustrated.
2.3.3. WebGIS Testing
WebGIS testing refers to visualization, accessibility, data uploading, integration into the website, and possible research uses. The WebGIS configurations were checked on different devices (a desktop computer, a tablet, and a smartphone), and accessibility from different browsers was tested. The WebGIS was integrated into the website (https://italyworldsfairs.org/ accessed on 8 February 2024), and its visualization was tested from a desktop computer, a tablet, and a smartphone. How data on the WebGIS can be updated is illustrated. Finally, some examples of the usage from a digital humanities research point of view are illustrated.
2.3.4. WebGIS Maintenance
In this paper, maintenance refers to all actions performed to keep the WebGIS accessible, ensuring its functionality and usability, surviving operating systems and software obsolescence over the years. Section 3 discusses key aspects considered for Turin 1911, namely data, software and server updates, compatibility preservation, data and application backups and security settings, and strategies for long-term accessibility and archiving.
3. Results
3.1. WebGIS Design
The Turin 1911 WebGIS was designed as an interactive map for non-GIS scholars and the general public to be incorporated into the conventional website. The WebGIS is a tool for both the dissemination and study of the Turin 1911 Fair, taking the Adam Matthew Collection (see Section 2.2) as a guiding example. The WebGIS was designed for desktop computers, tablets, and smartphones using the browsers Apple Safari 28, Google Chrome 29, Mozilla Firefox 30, Microsoft Edge 31, Opera 32, or Samsung Internet 33. In the past years, a research group at the University of Virginia created and connected a DB to a website for the Turin 1911 project. The DB was a PostgreSQL relational DB running on an Ubuntu server. The DB model was designed for the Divina Commedia and re-used for the Turin 1911 project. The structure of this former DB was analyzed, stressing challenges—such as the lack of structured terms and geometries—and potentialities—such as the archival materials’ classification and the usage of a website retrieving data from a relational DB. A first attempt to preserve and enable the existing DB as a geo-DB was reported in [40]. After critical considerations about preserving the DB, a new strategy was designed and followed. Following the DB modeling defined by Codd [84] and a bottom-up approach, a new geo-DB was conceived based on a fresh conceptual model in which entities and the relations between them were identified, as in Figure 4. The spatial entities are built environment objects and components 34.
The non-spatial entities are architectural documents, archival materials, a glossary, lists, locations, protagonists, and secondary sources 35.
The glossary entity collects all the indexing terms derived from thesauri, while the lists entity defines the categories to which the terms in the glossary belong. Additionally, blocks of the City of Turin (vector data), a 1911 City of Turin map (raster data), a 1911 Turin fairground map (raster data), and a City of Turin DTM (raster data) were used but not inserted into the geo-DB stored on the server. Entities and fields were structured according to an ad hoc schema developed for the Turin 1911 World’s Fair; this is a novel combination of the International Standard Bibliographic Description (ISBD) in the International Federation of Library Association 36 (IFLA) and Getty Research Institute 37 documents, namely the Guide to the Description of Architectural Drawings by the Foundation for Documents of Architecture (FDA) and the Categories for the Description of Works of Art (CDWA). The classification established in the old website was improved upon using terminologies extracted from Getty thesauri—the Art and Architecture Thesaurus (AAT), Union List of Artist Names (ULAN), and Thesaurus of Geographic Names (TGN)—which are also available as LOD. In addition to their use as cataloging standards, WMS and WFS are used as geographical standards. The architecture overseeing geo-DB management and data visualization adheres to the schema depicted in Figure 5. It manages two methods of interactions: a more prevalent one through a website and a less common one via a WebGIS.
The website (https://italyworldsfairs.org/ accessed 8 February 2024) has a dedicated back-office for data editing, pointing at the same geo-DB of the WebGIS. The devised WebGIS serves as a straightforward tool aimed at offering a comprehensive view of all constructed environmental objects for the exposition and the corresponding archival documentation. It aids users in locating and contextualizing every object within the 2D/3D environment.
A simplified 3D visualization of all the expositive built environment objects was preferred instead of more expensive and detailed 3D modeling. The 3D rendering of the objects, obtained by extruding the 2D geometry according to its height, enabled editors without GIS expertise in editing the geometries to simply type the numerical height of the object. Though schematic, this visualization makes visible what is no longer observable today. The WebGIS was conceived only for visualization and not data editing. The WebGIS works as an entry point to individual built-environment objects’ and components’ web pages, providing minimal information on the WebGIS and allowing a thorough examination of the conventional web pages. The website shows all the entities contained in the geo-DB, connecting textual data, images, videos, music, and 3D models. The website and the WebGIS work in parallel, and they do not substitute each other. On the WebGIS, a few options for navigation (like zooming, panning, rotation, and localization), image and text searching tools, and preset filters allow the user to analyze data in space. After a careful evaluation with ICT experts who developed the website and managed the servers, we selected commercial software by ESRI since it provides extensive documentation, technical support, and many solutions for WebGIS development that do not require ICT expertise. ArcGIS Pro was selected as the GIS software, PostgreSQL as the RDBMS, and Lavarel 38 as the web application framework. For compatibility issues, the following versions were selected for this implementation: ArcGIS Pro 2.9, ArcGIS server 10.8.1, PostgreSQL 13.3 (64 bit), PostGIS 3.1, and Ubuntu 20.4.4. The DB and software for web development and DBMS are stored on a Linux 5.4.0 (64-bit) machine in San Diego, providing a stable repository for the geo-DB. ArcGIS Enterprise and ArcGIS Online offer different applications to create a web app or website 39; among these, WAB and Experience Builder were selected and evaluated in the implementation phase (see Section 3.2). As proposed in the workflow definition (see Section 2.3.1), suggested key aspects summarizing the Turin 1911 WebGIS specifications are reported in Table 1.
3.2. WebGIS Implementation
3.2.1. Raster Maps and Vector Data Preparation
Among all the collected maps documenting the Turin 1911 fairground and the City of Turin (see [39]), one map describing the fair (1:3000 original scale) and one of the City of Turin (1:15,000 original scale) were selected as references to recreate the geometries as they were supposed to be in 1911. For the fairground map, the selected one is by the Gran Didier publisher (Figure 6) since it is the most detailed and reliable. For the City of Turin map, the one contained in the Torino e dintorni book (Figure 7) was selected since, among the available maps, it is the most detailed and displays a larger area of the city. Shapefiles from the Base Dati Territoriale di Riferimento degli Enti (BDTRE) 40 were used as references to georeference the historical maps, following the approach reported hereafter. Once the historical map was loaded into ArcGIS Pro, the fairground map was georeferenced using adjust transformation type 41 with 60 control points spread over the city, finding homologous points in the historical map and the current map, such as corners of bridges and buildings. The georeferencing reported 0.53 m as a root mean square (RMS) error that is compatible with the maximum graphic error (0.6 m) of the original scale of the drawing (1:3000). For the City of Turin map, the same approach was followed, using the spline transformation with 64 points 42. Since ArcGIS Online is based on the WGS 1984 Web Mercator (Auxiliary Sphere) as a reference system (EPSG:3857) 43—a conformal projection preserving shape and directions but altering area and distances 44—this system was used for the creation of raster and vector datasets. The raster files were converted locally from WGS84 UTM 32N (EPSG:32632) to Web Mercator in ArcGIS Pro using the Project Raster geoprocessing tool. Then, only the map of the fair was loaded in the geo-DB using the Raster to Geodatabase geoprocessing tool; the software took 1 h and 4 min to complete the process since the file weight was 4.56 GB and had a ground sampling distance (GSD) of 3.3 cm/pixel. ArcGIS Pro provides three data types to create 3D geometries (polygonal feature classes, multi-patch feature classes, and 3D objects). Creating 3D geometries is a straightforward process involving the extrusion of 2D polygonal feature classes based on a field that stores height information. Without using an API for JavaScript and without having 3D editing skills, the 3D depiction is editable online just by entering a different value for the height.
This 3D visualization is appropriate for LoD 1 visualization. Utilizing a multi-patch feature class allows for the creation of complex 3D geometries, extending up to LoD 2 and beyond. However, proficiency in 3D modeling is required, and the online editing of geometries without JavaScript API support is not possible. Three-dimensional objects share similarities with multi-patches, but they offer additional fields for controlling the origin, rotation, and scale of each record. Since Turin 1911 aims to recreate ephemeral objects in an urban context, and considering that we do not have enough information about all the geometries, a simple solution was requested to assist non-GIS experts in adding new data over time, according to new discoveries. GIS and WebGIS environments render 3D models—which are hypothetical representations of what is no longer visible today—by extruding 2D geometries according to a numeric field. The principal height of a façade is measured on technical drawings, when available, or the height is derived from descriptive texts. Roofs, domes, and towers are not represented. Hence, the elevation is less reliable and accurate in comparison with the footprint representation. Even if more detailed 3D modeling of the entire fair is desirable, this is time-consuming and expensive, and it demands extensive research interpretations of historical sources to rebuild around 200 buildings. Additionally, not all architecture has graphical representations, and archival research is still ongoing. The Turin 1911 team is working on the LOD 3 representation of a few pavilions, generated on the basis of the available historical documentation [39,40]. Feature classes (components and built-environment objects) are created in the spatial DB in ArcGIS Pro using WGS 1984 Web Mercator as a reference system. The polygons of the shapefiles are loaded into the components and built-environment objects feature classes in the spatial DB. The height of polygons in components and built-environment objects is contained in the elevation field in meters; this field is used to extrude polygons starting from the ground. This visualization reaches an outdoor LoD 1 without indoor spaces, following the LoD schema proposed by [86], which distinguishes between indoor LoDs and outdoor LoDs. The City of Turin DTM 45—depicting the shape of the city visible today—integrates the data.
3.2.2. Online Data Sharing
To create a 3D WebGIS in ArcGIS Pro, a 2D map was created with the vector and raster data obtained following the procedure reported before. Labels’ appearance and feature classes’ colors were defined for components and built-environment objects; aliases were set for each entity. Labels display the title text of the single component and built-environment object in a balloon callout; when zooming in, starting from a certain zoom level, the callout is displayed, facilitating the localization of the geometries. Since the historical map of the fairground is not oriented north-up, contains text at the bottom, and has a horizontal layout, this configuration was followed for the WebGIS design. Once these steps are completed, the data are ready to be shared online.
As explained in [40], with an ArcGIS Online account, it is not feasible to develop a WebGIS that directly references the geo-DB, permitting the online sharing of data only as copied data. The ArcGIS Enterprise account allows for pointing directly to a spatial DB; hence, if an edit is applied to the data on the geo-DB, it is immediately visible on the WebGIS. To achieve this, it is requested to register the spatial DB connection (.sde file) using an ArcGIS server on the ArcGIS Enterprise Portal. With ArcGIS Enterprise, it is possible to select between referencing registered data or copying all data. Referencing registered data enables the display of information stored in the geo-DB and accommodates real-time updates. Conversely, copying all data generates a duplicate on the GIS server at the moment of online sharing, leading to a loss of connection with the spatial DB. Then, three configurations can be selected: exploratory, editable, and visualization. The exploratory configuration dynamically displays a rendered map image layer on which queries are supported. The editable configuration displays also feature layers that are editable in addition to the characteristics of the previous one. The visualization configuration shows only cached map image layers for fast visualization. Editing functionality can be activated for both reference-registered data and copied data. However, in the former scenario, edits are directly applied in real time to the spatial DB itself, whereas in the latter case, data edits do not affect the geo-DB, as it is a duplicate of the data stored on the ArcGIS server. Many factors influence the data loading speed, such as the number of layers, polygons, vertices, the use of shadows, labels, symbols, and layer visibility, 46 but most of all, the configuration settings. When layers are published with any kind of configuration that references registered data, geometries may not consistently load in the Map Viewer application. Often, errors in data loading are reported, making the creation of a WebGIS based on these data impossible with ArcGIS Enterprise. In addition to configurations, other settings (time zones, coordinate system, and Z- and M-values) 47 are available during the sharing phase; these must be properly configured to finalize the data publishing. The time zones of date fields must match the DB time, while the coordinate system of the layers must match the Web Mercator coordinate system; otherwise, base maps cannot be used. Feature classes with Z- and M-values are not editable online; therefore, during the geo-DB creation, they are not set. After considering all these aspects, AcrGIS Online was used instead of ArcGIS Enterprise to deliver a reliable online application with swift data loading. Predefined scales and corresponding bounding boxes were applied to cache the historical maps; then, they were shared as copied WMTS to be loaded faster. A single WFS containing the two entities—built-environment objects and components—was published as non-editable copied data, while city blocks of Turin 1911 are published as individual WFS. Instead of directly pointing to the spatial DB—as should be possible with ArcGIS Enterprise—the raster and feature classes are copied with ArcGIS Online; since they are copies, the editable function is useless and, thus, was not applied. Necessary WFS layers can be readily overwritten to keep the WebGIS content up to date. It is important to note that, if there are changes to the data schema, the layer cannot be replaced; instead, it must be republished.
3.2.3. Two-/Three-Dimensional WebGIS Creation
Using an ArcGIS Online account, it is not possible to establish a WebGIS directly linked to a spatial DB, while ArcGIS Enterprise allows the creation of a WebGIS that points to the data contained in the spatial DB on the server. Data published online—in ArcGIS Enterprise or Online—can be visualized online with Map Viewer Classic or Map Viewer, the newer version of Map Viewer Classic. These two visualizers do not have the same options (namely, pop-up configuration and map rotation management) 48. An ArcGIS map published with a rotation different from 0 m is displayed wrongly in Map Viewer Classic because rotation is not supported. In Map Viewer, the rotated map is displayed correctly. The combination of Experience Builder and Map Viewer is preferred because WAB does not support map rotation 49 or pop-up configuration 50. Additionally, ESRI has announced that WAB is being retired, and it recommends migrating to Experience Builder 51. Due to variations in options between Map Viewer on ArcGIS Online and ArcGIS Enterprise—with certain features, like rotation and pop-up configuration, not available in Enterprise—ArcGIS Online was the preferred choice. Additionally, the decision to work with copied data, rather than referenced registered data, further supported this preference. However, data can be published in Enterprise, and later maps or web apps can be created, retrieving published data from ArcGIS Online and using URLs based on HTTPS and the REST service.
Once the raster and vector data are shared online, a 2D map is generated in Map Viewer within ArcGIS Online. All published data are loaded on the 2D map and the rotation is correctly visualized. Built-environment objects are categorized based on object/work type—using terms derived from Getty AAT—and colored according to them (Figure 8). Pop-ups are configured for built-environment objects, showing for each of them only a few pieces of information retrieved from a selection of related fields for each record (title text, a representative image, alternate title text, object/work type, creator description, code in the 1911 map, and the link to the specific web page), as is visible in Figure 9. If an image is not available for an element, a placeholder image is displayed. For components, the fields are similar; instead of object/work type, the component/part of is shown. The dark gray ESRI base map was selected as the base map, while layer styles (color and transparency) and labels were already set in the ArcGIS Pro project and are used also here. Then, similar to what was done for the 2D map, a local 3D scene is created with Scene Viewer. The 3D scene was created as a drawing style, thanks to 3D extrusion using the values stored in the elevation field. After the creation of the 2D map and 3D scene, the sharing options are set to public for all shared data and maps to allow everyone to see them without an ESRI account.
Following the preparation of web services, maps, and scenes, the WebGIS was constructed using ArcGIS Experience Builder in ArcGIS Online. This platform facilitates the creation of web applications without the need for coding, employing configurable widgets for customization. Additionally, Experience Builder provides automatic configurations of templates for desktop, tablet, and smartphone versions that can be manually adapted. The Turin 1911 WebGIS is accessible at https://arcg.is/1HfSqG (accessed on 21 December 2023), as shown in Figure 10. A specific template was designed to display the 2D map or, alternatively, the 3D scene as the main window. The 2D and 3D scenes are synchronized, ensuring that when the user switches between them, the framed portion and zoom levels remain consistent. The map/scene showcases the Map of the Turin 1911 World’s Fair, the Map of the City of Turin in 1911, components, built-environment objects, and the city blocks of Turin in 1911. Two image galleries feature all the components and built-environment objects, and they are synchronized with the 2D map and 3D scene. These galleries exclusively show elements framed in the current map/scene view; hence, during zoom operations, only the objects visible in the window at that moment are presented in the galleries. Conversely, when a search is active in the image gallery, only the records visible in the gallery are presented on the 3D scene/2D map. Similar to the pop-ups, the galleries provide only a few pieces of information for each record (an image, title text, the code in the 1911 map, and alternate title text). As is visible in Figure 11, several tools were configured in Experience Builder, namely searching, the selection of 2D maps/3D scenes, a layer list and legend, layer information, an informative button, and navigation. Search tools were configured: a free text search bar insisting on the title text and alternate title text fields and a tool to order results by title text, alternate title text, or the code in the 1911 map. Two buttons allow the selection of a 2D map or 3D scene.
A filter allows the display of built-environment objects according to the object/work type field—namely, city and province pavilions, colonial exhibits, entrance structures, exhibition kiosks, gardens (open spaces), national pavilions, office buildings, permanent structures, recreation structures, theme structures, and transportation structures 52. A layers list and legend are provided. A Layer Info button was created to provide a description of the layers composing the scene. An informative button—displayed with a question mark symbol (?)—shows all the tools available in the WebGIS. In the navigation tools, a button toggles the geo-localization of the device on/off. Consequently, when users explore Valentino Park with a mobile device, the device’s integrated global navigation satellite system (GNSS) retrieves their real-time position. This allows for a comparison of the user’s location with historical maps using the WebGIS (Figure 12).
Actions and events are set to define what happens when hovering, clicking, and selection are done on records in the lists and on geometries on the map/scene. The WebGIS is an interactive tool to navigate the environment digitally; upon querying a geometry, a pop-up displaying relevant information appears.
Alternatively, users can browse the image gallery or seek a specific object in the list. Once identified and selected, the active 3D scene or 2D map will pan and zoom to the chosen object, highlighting it, and when queried, the geometry displays the associated pop-up (Figure 13). After having configured the WebGIS desktop version, ArcGIS Experience automatically configured the WebGIS for small-sized devices (such as smartphones) and medium-sized devices (such as tablets). These configurations were manually adjusted to improve the visualization in a vertical configuration (Figure 14 and Figure 15). Finally, the embedded code was generated and inserted into the traditional website devoted to the Turin 1911 project (https://italyworldsfairs.org/explore accessed on 21 December 2023).
3.3. WebGIS Testing
The WebGIS is accessible from and properly works with different browsers, namely Apple Safari, Google Chrome, Mozilla Firefox, and Microsoft Edge, as declared by ESRI 53, and also with Opera and Samsung Internet. Large raster files are smoothly rendered on the WebGIS; for instance, the historical fairground map (4.56 GB) is rapidly rendered as a single raster on the WebGIS. The loading time is calculated with PageSpeed Insight (Google) 54, and basic metrics—first contentful paint (FCP) 55, largest contentful paint (LCP) 56, and total blocking time (TBT) 57—are reported for computers and mobile devices in Table 2. For the Turin 1911 WebGIS, FCP reported good results for both computers and smart devices—less than 1.8 s, which is the value indicated by Google 58 for a good FCP. LCP is higher than the suggested value, which is 2.5 s. TBT exceeds the suggested time of 50 ms.
The non-optimal FCP and LCP values are probably due to WMTSs and WFSs, which are large files but based on a caching system. Hence, once the content is loaded, the visualization is smooth and efficient 59, thanks to the caching system. Regarding the positioning option available on the WebGIS, the device must grant access to positioning data. Automatically, the application recognizes the device (desktop, tablet, or smartphone) on which the WebGIS is open and renders the correct configuration. The WebGIS integrated into the website is properly visible from a desktop device, while from smartphones and tablets, some actions do not properly work (like exiting the full-screen view). Moreover, the experience from a smartphone is not optimal due to the small size of the screen and the availability of several options that request larger screens.
Regarding configuration editing, any edits done to the WebGIS in Experience Builder are immediately visible on the website after publishing since the embedded code is based on a stable URL that is not affected by editing. Data editing on the geo-DB is not visible on the WebGIS because the data have been published as copied data. Hence, an overwriting process is requested.
The designed WebGIS represents a navigation tool, making visible what is no longer visible today, but it also serves as a research tool capable of revealing concealed observations, helping digital humanities experts study fair design. For instance, the filter to display a built-environment object based on the object/work type can be applied to show only national pavilions; these are mostly aligned on the right riverside, or on the left side as Hungary, and the small pavilions of Russia, Bulgaria, and India, except for Turkey and Great Britain (Figure 16). The WebGIS makes evident what is not always clear and visible to everyone. Historical pictures integrated into a simplified 2D/3D depiction of objects facilitate the discovery of previously unknown architecture, as tested for the Eternit Pavilion. An unidentified shape on the 1911 Turin map corresponds to the Eternit Pavilion, as it is situated to the left of the Touring Club Alpine Hotel in a photograph (Figure 17).
3.4. WebGIS Maintenance
For the Turin 1911 case study, several actions were undertaken and are here specified to guarantee the long-term preservation of the WebGIS. Since the WebGIS is based on the geo-DB and it is integrated into a website, these three components cannot be dissociated, especially for maintenance.
Concerning the data updates, up to now, the WebGIS direct connection to the spatial DB experiences slow performance when rendering 3D geometries online. As a result, data are copied online, and updates to the WebGIS require intervention from a GIS expert following a concise procedure. The WFS and WMTS layers can be readily overwritten as necessary to keep the WebGIS content up to date. However, it is important to note that, if there are changes to the data schema, layers cannot be overwritten; instead, they must be reshared online.
As regards data and applications backups and security settings, automatic backups (daily, weekly, monthly, and yearly) are set up on the Turin 1911 server to avoid data losses and permit data retrieval in the case of errors on the server. This refers not only to data stored in the geo-DB but also to all software, applications, and files that concur with the geo-DB, WebGIS, and website development. Files have security settings active to avoid overwriting or deleting files by mistake.
Regarding software and server updates, careful attention is paid when software and hardware are updated since this procedure requests updating the geo-DB; otherwise, the geo-DB will be inaccessible from ArcGIS Pro. Every year, ESRI releases a new version of ArcGIS Pro; when the software version is updated, the geo-DB must be updated to preserve its accessibility from ArcGIS Pro. Similarly, when the ArcGIS server is updated, the license must be updated; finally, the geo-DB can be updated. Therefore, if the software or server is updated, the geo-DB is no longer accessible via ArcGIS Pro—nor via PgAdmin—until updates are applied to the geo-DB itself. The WebGIS will be accessible because it has been created as copied data, but to update data on the WebGIS, it is necessary to access the geo-DB from ArcGIS Pro and overwrite the data. For the Turin 1911 project, the ArcGIS Pro and ArcGIS Server update procedures are carried out annually to keep the system in line with ESRI’s development. Regarding servers, Ubuntu releases a long-term version every 2 years and provides 5-year standard security maintenance for each stable release. Therefore, for the Turin 1911 project, the server updating is planned to take effect every 5 years. For the ArcGIS server, ESRI has less stable planning for release and retirement than Ubuntu 60; hence, planning for its upgrading cannot be established in advance. Currently, the migration from ArcGIS 10.7 to 11.1 for the Turin 1911 project is ongoing and is still under testing.
Concerning compatibility preservation, before updating, compatibility issues are always checked since a lot of software is involved.
Since digital elements are much more unstable than non-digital ones, long-term preservation strategies are considered for Turin 1911. The WebGIS is accessible via the URL https://arcg.is/1HfSqG (accessed on 21 December 2023); moreover, a stable quick response (QR) code was generated (Figure 18) to provide another accessibility option that is faster and easier for mobile devices because QR-code-scanning avoids the manual entry of the URL. This is a low-cost or zero-cost solution to enhance accessibility. Finally, the archiving of the WebGIS is tested using the Internet Archive Wayback Machine, as done for the old Turin 1911 website. The WebGIS was saved five times, and it should be visible at this link 61. Tests to successfully visualize the archived WebGIS were made with Safari, Google Chrome, Mozilla Firefox, Opera, and Microsoft Edge. Unfortunately, the application loading never ends in any browser; hence, the archived WebGIS is not visible.
4. Discussion
Typically, online archives offer a bidimensional display of documents, and research involves entering a few keywords into a search bar. However, with a WebGIS, research can be undertaken by exploring space in either 3D or 2D. Leveraging commonly used smart devices, such as tablets or smartphones, has the potential to enhance discoveries in this context. Considering the state of the art of the digital documentation of World’s Fairs (see Section 2.2), the substantial improvement provided via a WebGIS application for the documentation of a complex phenomenon like a World’s Fair is demonstrated in this paper.
The Turin 1911 3D WebGIS, retrieving data from the geo-DB, guarantees access to spatialized information through various devices—laptops, tablets, and smartphones—thanks to an internet connection and solely via a browser, avoiding the need for dedicated software and expanding the audience. The Turin 1911 WebGIS was designed as user-friendly because it was conceived for non-experts in geomatics or ICT. Additionally, the integration into a website allows the WebGIS to be graphic-centered, leaving the complete textual information into the traditional website. Data integrity between the website and the WebGIS is preserved because both take data from the same geo-DB, avoiding duplicates. The usage of terms selected from international thesauri and cataloging guidelines and standards guarantees disambiguation and allows data implementation and exchange. Regarding the WebGIS design, the key aspects summarized in the WebGIS specification table (Table 1) provide an overall, synthetic but clear and detailed documentation of the Turin 1911 WebGIS. Documentation describing a WebGIS is often neglected in the literature but is fundamental for good preservation planning and to guarantee an ever-working system. Additionally, topics like testing and maintenance are less considered. Hence, the workflow definition proposed in Section 2.3 and the synthesis of the Turin 1911 WebGIS specification in Table 1 can be used as guidance in creating a user-friendly WebGIS in the CH domain. As regards the implementation phase, the creation of a WebGIS connected to a geo-DB is not an easy task, even for a GIS expert, and many competencies are needed. Some issues remain open, and challenges have influenced the procedure development and adopted solutions (see Section 3.2). For the Turin 1911 project, currently, an efficient WebGIS pointing directly at the geo-DB—developed in ArcGIS Enterprise—is not affordable but must be developed to overcome the procedure to update data on the WebGIS. Even if a commercial GIS solution is tested, some challenges have influenced the development of the procedure for creating an operable WebGIS that is easy to use for non-GIS experts. For instance, ArcGIS Online has forced us to use the WGS 1984 Web Mercator reference system, requesting data reprojection before uploading the entities online. The 3D visualization is very schematic and could be improved with an LoD 2 representation that is more time-consuming and requests more expertise in 3D modeling. The type of 3D visualization is selected according to zero editors’ expertise in 3D modeling. Even a non-expert in ICT, GIS, or 3D modeling can generate 3D geometries. Since the 3D geometry is created as an extrusion of the 2D footprint—based on the georeferenced historical map—anyone can create and edit the simplified 3D representation (LoD 1) by simply typing a value for the object height. The graphical representation of 3D objects is automatically made through the software when editing is saved without reloading or running a command. This solution facilitates the collaboration of different experts in the Turin 1911 study. Many products are available on ArcGIS Online to create an application, but due to incompatibility issues among them, some functionalities are not available across all the products, such as the rotation of a map, the possibility of combining data with different reference systems, and the configuration of the visibility range scales in Map Viewer, Map Viewer Classic, WAB, and Experience Builder. Additionally, different options are available according to the type of ESRI license (ArcGIS Online and ArcGIS Enterprise). These options allow for the displaying of elements in different ways and the performing of various actions. Therefore, selecting the software, the license, and the combination of them should be planned carefully, considering the results to achieve. Additionally, future application retirement should be considered to avoid early obsolescence of the designed WebGIS, as in the case of WAB.
The steps proposed for the WebGIS implementation phase (see Section 2.3.2) are consequential, but an iterative process involving all steps could be necessary to obtain the desired results or because of technical issues. Hence, the design phase can take a long time and much effort. WebGIS implementations on different browsers and devices are easily achieved, but each configuration must be tested because some minor issues can be retrieved, as in the case of Turin 1911 WebGIS for mobile devices, in which some tools do not properly work. Even if we opted for a commercial solution to reduce the requested expertise for developing the WebGIS, some procedures require time for testing, going back and forth between ArcGIS Pro and ArcGIS Online or Enterprise. Even if a WebGIS can be a powerful tool to share vector and raster data worldwide, it can be inefficient due to slow data loading. For Turin 1911, data loading verified with Google PageSpeed Insight does not fully satisfy reference values for a good web application; hence, further improvements are needed. Many objects depicted on the historical map of Turin 1911 are currently not identified or not located in the fairground; hence, much more must be done. The WebGIS assists experts in localizing objects on the map—like for the Eternit Pavilion—and aids in examining subtle dynamics, like the arrangement of national pavilions along the riverbanks. The geo-localization feature offered through these devices allows users strolling in the park to be positioned on the WebGIS. Consequently, users can juxtapose their actual location in the park with the virtual navigation within the digital 1911 world. The WebGIS is rich in visual content but not overwhelmed by text or relations. The Turin 1911 website, working in parallel with the 3D WebGIS, can provide in-depth information about the many aspects of the expositive phenomenon. This solution combines innovative tools—like a WebGIS—with more traditional tools—like a website. The WebGIS integrates the website without substituting it but while proposing a new approach to discovery.
Regarding WebGIS maintenance, using a WebGIS avoids requesting users to upgrade software, but developers must oversee the project to keep the WebGIS accessible to users and update the software and servers on which the web application relies. Software and hardware updating require geo-DB updating; otherwise, the DB would not be accessible, and data could not be updated on the WebGIS. Before updating, compatibility issues must always be checked since a lot of software is involved, requiring good collaboration between IT and GIS experts and time to plan, perform, and test the updating. Digital tools like WebGIS applications are more fragile than physical items, and if maintenance operations are not taken into consideration, they risk rapidly becoming obsolete or inaccessible. Even if the Turin 1911 WebGIS is developed with a commercial solution (available through a paid subscription), the software and server upgrading and backups would have to be coordinated with IT members of the Turin 1911 project, similar to what could be requested in the case of free and open-source applications. This reduces the advantages offered by adopting commercial solutions. Predicting technological development is challenging, but opting for a free and open-source DBMS is a solution that ensures a prolonged and robust life cycle for data storage. As addressed in this paper, QR codes can ease the access of WebGIS applications, but they do not solve long-term preservation problems. A DOI should be favored to provide a stable URL to access the WebGIS, but it requires institutional and paid subscriptions. Even if a DOI is provided, the web application can suffer from obsolescence if actions like upgrading are not undertaken. The preservation of digital objects in general is an issue that has emerged in the last decades; as faced in this paper, some actions should be considered and tested in the literature to avoid losing in a few years what was achieved with great efforts in time, cost, and expertise. Archiving the WebGIS using the Internet Archive is a solution, but—as explained in this paper—it is still a challenge and requires further study. Even if the results of this research present some limitations, some risks—almost neglected in the digital humanities and CH fields—have been highlighted and addressed by this research, such as WebGIS testing and strategies for its long-term preservation. The schematic summary (Table 1) and the overall process illustrated in this paper can be a valuable guide for designing, developing, maintaining, and documenting a WebGIS in the digital humanities field, particularly for long-term projects like Turin 1911. The proposed implementation of a WebGIS, coupled with a dedicated website, represents a comprehensive platform where humanities research itself is undertaken. If properly adopted, the WebGIS illustrated in this paper can revolutionize how experts in the humanities tackle their research, reducing time and costs in the archival research and dissemination phases.
5. Conclusions
World’s Fairs are ephemeral by definition, and it is not possible to preserve physically what is conceived to not be eternal, nor can every item be preserved by a single institution. The digital means could be the most effective solution to face this challenge, and in this way, the memory of World’s Fairs could be traced forever in a digital way. The digital documentation of World’s Fairs is scarce; solely one project has used 3D models (World’s Columbian Expositions of 1893), and only two projects have used data spatialization on 2D maps (Adam Matthew and ExpoMuseum). Digital technologies’ application should be undertaken globally, led by an international institution like the World Expo Museum and supported by the BIE.
In the World’s Exposition documentation topic, the Turin 1911 project emerges as a groundbreaking initiative, aiming to digitally document and study an entire international exposition. Considering the state of the art of the digital documentation of World’s Fairs (Section 2.2), Turin 1911 is not only a digital archive but also a place to study the fair in a 3D-reconstructed environment that, despite the schematic 3D rendering, gives a general idea of what has been lost today and provides a connection between reconstructed built objects and original archival material. The integration of more detailed 3D models is under development, applying BIM modeling [39,40]. In the near future, further digitally reconstructed 3D architecture will be available online to the public. Utilizing spatial DBs and a 3D WebGIS alongside standards for cataloging, Turin 1911 is a pioneer in the application of these innovations in digital humanities to facilitate online information-sharing. The usage of a 2D/3D WebGIS with a 3D virtual reconstruction of the fairground was addressed in this paper. This application can be expanded to other World’s Fairs and connected to the institutions preserving the original material. The designed 3D WebGIS points at a geo-DB based on cataloging principles and also using controlled vocabularies and LOD. In this way, the data are understandable, consistent, linked, and able to withstand technological changes. The 3D WebGIS provides an environment for the visualization and textual and visual query of the content to an audience of non-GIS experts, non-IT experts, and the public. A simplified 3D model assists non-experts in generating the idea of what has been physically lost today and relating it to the context. The development of a WebGIS can deal with a single geo-DB and work in pairs with a traditional website designed as a ‘generous interface’, assisting the researchers in documenting and studying the World’s Fair. A tailored data structure was conceived to create a dedicated geo-DB; different guidelines and standards for cataloging were mixed, and indexing terms derived from thesauri were extensively used to describe elements of the fair. The entire workflow was reported and validated, and it can be adapted and replicated for other case studies, like those concerning other World’s Fairs. In the overall procedure, constant software and server updating is crucial, as well as the data population, to guarantee digital data survival and access. Data and system survival require time and an action plan for each project, even if commercial solutions like ESRI are used.
A 3D WebGIS for a World’s Fair did not exist. The usage of a 2D/3D WebGIS recreates the ‘world’ of the World’s Fair and constitutes a new way of doing research. By adopting this tool, we imagine that research will be more interdisciplinary, collaborative, and, piece by piece, immediately available online to the public. The Turin 1911 WebGIS, developed to document and present the Turin 1911 International Exposition online, provides the necessary foundation for future studies that would otherwise be impossible. The Turin 1911 WebGIS guarantees affordable and public access to information and the continuous dissemination of ongoing research. Additionally, a maintenance plan guarantees that this research will not be obsolete or inaccessible soon. As the volume of digitized information continues to grow, the rapid advancements in information technology contribute to the obsolescence of the software and hardware necessary for accessing and viewing digital information. Considering the life cycle of digital products and real CH, digital objects are more fragile than physical ones and deserve maintenance planning. When a project involves the use of a WebGIS, a preservation plan must be outlined, allocating a budget and specifying the actions to be undertaken along with their frequency. Obsolescence is an emerging risk for all kinds of digital items; we wish for the scientific community to find a way to maintain WebGIS applications online that is resilient to technological changes. We hope that other researchers will consider and address this topic moving forward, research on preserving not only the physical CH but their digital replica as well.
Author Contributions
Conceptualization, A.S.; methodology, A.S.; validation, A.S.; formal analysis, A.S. and F.C.; resources, A.S. and F.C.; data curation, A.S.; writing—original draft preparation, A.S.; writing—review and editing, F.C.; visualization, A.S.; supervision, F.C.; project administration, F.C.; funding acquisition, F.C. All authors have read and agreed to the published version of the manuscript.
Funding
This research was funded by UC San Diego Chancellor’s Associates Endowed Chair Program, San Diego, USA (https://chancellorsassociates.ucsd.edu/our-impact/faculty-endowed-chairs.html#-Chancellor%E2%80%99s-Associates-Chair-, accessed on 27 December 2023).
Data Availability Statement
Publicly available datasets were analyzed in this study. These data can be found here: the WebGIS at https://arcg.is/1HfSqG, the raster map of the 1911 City of Turin at https://tiles.arcgis.com/tiles/eGSDp8lpKe5izqVc/arcgis/rest/services/Map_of_1911_City_of_Turin/MapServer, the raster map of the 1911 Turin World’s Fair at https://tiles.arcgis.com/tiles/eGSDp8lpKe5izqVc/arcgis/rest/services/Map_of_1911_Turin_World_Fair/MapServer/WMTS/1.0.0/WMTSCapabilities.xml, built-environment objects and components at https://services1.arcgis.com/eGSDp8lpKe5izqVc/arcgis/rest/services/Features/FeatureServer, and the city blocks of Turin in 1911 at https://services1.arcgis.com/eGSDp8lpKe5izqVc/arcgis/rest/services/City_of_Turin_1911_map/FeatureServer.
Acknowledgments
The authors acknowledge Cristina Della Coletta—the principal investigator of the Turin 1911 project—the Data and GIS Lab, and the School of Arts and Humanities’ IT team of UC San Diego for technical IT support in developing the WebGIS. The new website was developed in collaboration with the 3Juice company (https://www.3juice.com/ accessed on 8 February 2024).
Conflicts of Interest
The authors declare no conflicts of interest. The funders had no role in the design of the study, in the collection, analyses, or interpretation of data, in the writing of the manuscript, or in the decision to publish the results.
| 1 | The current unavailability of the WebGIS is declared on the website https://mayaarch3d.org/en/about/project-history/ (accessed on 19 December 2023). |
| 2 | https://qgis.org/en/site/ (accessed on 19 December 2023). |
| 3 | http://www.gvsig.com/it/prodotti/gvsig-desktop (accessed on 19 December 2023). |
| 4 | https://grass.osgeo.org/ (accessed on 19 December 2023). |
| 5 | http://thuban.intevation.org/ (accessed on 19 December 2023). |
| 6 | A free and open WebGIS solution can be based on GIS software for data preparation like QGIS, Node.js—https://nodejs.org/en/ (accessed on 19 December 2023), and Leaflet—https://leafletjs.com/ (accessed on 19 December 2023) to render interactive maps in a web interface, Bootstrap—https://getbootstrap.com/ (accessed on 19 December 2023) to develop the webpage, a PostGIS extension to manage spatial functions in DBs, a DBMS such as PostgreSQL to handle the DB and its graphic interface like PgAdmin—https://www.pgadmin.org/ (accessed on 19 December 2023) and GeoServer—https://geoserver.org/ (accessed on 19 December 2023) as a web server to handle geospatial data [19,28,29]. |
| 7 | https://www.esri.com/en-us/arcgis/products/arcgis-pro/overview (accessed on 19 December 2023). |
| 8 | https://hexagon.com/products/geomedia (accessed on 19 December 2023). |
| 9 | https://www.autodesk.com/products/autocad/included-toolsets/autocad-map-3d (accessed on 19 December 2023). |
| 10 | A WebGIS consists of a web browser as a client to send and visualize requests, a web server where the application runs and replies to client requests, and a GIS server able to provide geospatial services—like WFS and WMS—and perform GIS functionalities [28,34], also using URLs and REST services. Since they run on web servers, WebGIS applications can be visualized independently by many users simultaneously [34]. The requests are sent through an HTTP protocol from the client browser (like Internet Explorer, Mozilla Firefox, Google Chrome, or Safari) to the server. The server responds in an amount of time according to the bandwidth and type of architecture, which, in the case of thick architecture, can also exploit the web client to process data [9,10,34]. |
| 11 | https://www.mysql.com/ (accessed on 19 December 2023). |
| 12 | https://www.postgresql.org/ (accessed on 19 December 2023). |
| 13 | https://archive.org/ (accessed on 2 February 2024). |
| 14 | https://help.archive.org/help/wayback-machine-general-information/ (accessed on 2 February 2024). |
| 15 | https://archive.org/web/ (accessed on 19 December 2023). |
| 16 | https://web.archive.org/web/20231207081745/http://iwf.ucsd.edu/ (accessed on 19 December 2023). |
| 17 | A World’s Fair is defined by John Findling [66] as a ’large international exhibition of a wide variety of industrial, scientific, and cultural items that are on display at a specific site for a period of time, ranging usually from three to six months. World’s fairs include exhibits from a significant number of countries and often have an entertainment zone in which visitors can enjoy rides, exotic attractions, and food and beverages’. |
| 18 | The most relevant collections concerning World’s Fairs are the Smithsonian Library’s World’s Fairs digital library (available online: https://library.si.edu/digital-library/collection/worlds-fairs, accessed on 16 December 2023), the University of Chicago Library’s Chicago Collections (available online: https://guides.lib.uchicago.edu/c.php?g=525812&p=3633977, accessed on 16 December 2023), the University of Maryland Hornbake Library’s A Treasury of World’s Fair Art and Architecture collection (available online: https://digital.lib.umd.edu/worldsfairs, accessed on 16 December 2023), the Special Collection and University Archives of the University of Maryland’s World’s Fair Ephemeral and Graphic Materials collection (available online: https://archives.lib.umd.edu/repositories/2/resources/1351, accessed on 16 December 2023), the Missouri State Archives and Missouri State Library’s Louisiana Purchase Exposition: The 1904 St. Louis World’s Fair collection (available online: https://www.sos.mo.gov/archives/mdh_splash/default.asp?coll=muellis, accessed on 16 December 2023), the New York Public Library with the collection dedicated to the 1939-1940 New York World’s Fair, the New York World’s Fair 1939 and 1940 Incorporated records collections (available online: https://archives.nypl.org/mss/2233, accessed on 16 December 2023), the Seattle Public Library with the Century 21 World’s Fair Digital Document Library (available online: https://www.seattle.gov/cityarchives/exhibits-and-education/digital-document-libraries/century-21-worlds-fair and https://cdm16118.contentdm.oclc.org/digital/collection/p15015coll3, accessed on 16 December 2023), the San Diego History Center’s Panama-California Exposition. San Diego 1915-1916 Exposition Postcard and Postcard Tour1 collection (available online: https://sandiegohistory.org/collection/photographs/sdexpo4/, accessed on 16 December 2023), the University of Delaware Library’s Progress Made Visible: American World’s Fairs and Expositions collection (available online: https://exhibitions.lib.udel.edu/worlds-fairs/, accessed on 16 December 2023), the Library of the California State University of Fresno’s Donald G. Larson Collection on International Expositions and Fairs collection (available online: https://calisphere.org/collections/26551/, accessed on 16 December 2023). |
| 19 | https://www.gale.com/intl (accessed on 5 December 2023). |
| 20 | https://www.amdigital.co.uk/ (accessed on 5 December 2023). |
| 21 | Currently, the original website (https://www.1939nyworldsfair.com/about.htm) does not work; fortunately, it has been saved on the Internet Archive and is visible at https://web.archive.org/web/20231116011715/https://www.1939nyworldsfair.com/ (accessed on 16 December 2023). |
| 22 | The waterfall method is an approach applied in engineering to manage an information system project according to a linear progression. For further information, see Ismanto [9]. |
| 23 | Base maps are static maps—like satellite imagery, toponomastic, political, or thematic maps—providing the geographical context to layers. Their selection is based on the use of the WebGIS; WMS are effective and cheap solutions as base maps. Operational layers are an entire dataset or the result of an operation—such as a query—and generally are dynamic elements with which users work on top of base maps. Operational layers—like raster or vector files—can be stored in a geo-DB, surpassing the use of shapefiles. |
| 24 | https://www.arcgis.com/index.html (accessed on 20 December 2023). |
| 25 | https://enterprise.arcgis.com/en/ (accessed on 20 December 2023). |
| 26 | https://www.esri.com/en-us/arcgis/products/arcgis-web-appbuilder/overview (accessed on 20 December 2023). |
| 27 | https://www.esri.com/en-us/arcgis/products/arcgis-experience-builder/overview (accessed on 20 December 2023). |
| 28 | https://www.apple.com/safari/ (accessed on 20 December 2023). |
| 29 | https://www.google.com/ (accessed on 20 December 2023). |
| 30 | https://www.mozilla.org/ (accessed on 20 December 2023). |
| 31 | https://www.microsoft.com/ (accessed on 20 December 2023). |
| 32 | https://www.opera.com/ (accessed on 20 December 2023). |
| 33 | https://www.samsung.com/us/support/owners/app/samsung-internet (accessed on 20 December 2023). |
| 34 | The built-environment objects term is defined by Getty AAT as a ‘General term for any built works or other things classified as being of the built environment, whether extant or not, constructed or not’ (http://vocab.getty.edu/page/aat/300422821, accessed on 20 December 2023). The components term is defined by Getty AAT as the ‘Constituent parts of a larger object. A component differs from an item in that the item can stand alone as an independent work but the component typically cannot or does not stand alone. Examples are a panel of a polyptych or a discrete architectural component such as a dome’ (http://vocab.getty.edu/page/aat/300241583, accessed on 20 December 2023). For the Turin 1911 purpose, components belong to a single built-environment object. |
| 35 | The definition of each term is extracted from Getty AAT: architectural documents, http://vocab.getty.edu/page/aat/300343615; archival materials, http://vocab.getty.edu/page/aat/300379505; glossary, http://vocab.getty.edu/page/aat/300026189; lists, http://vocab.getty.edu/page/aat/300027119; location, http://vocab.getty.edu/page/aat/300248479; protagonists http://vocab.getty.edu/page/aat/300410266; and secondary sources, http://vocab.getty.edu/page/aat/300448977 (accessed on 20 December 2023). |
| 36 | https://www.ifla.org/ (accessed on 20 December 2023). |
| 37 | https://www.getty.edu/research/ (accessed on 20 December 2023). |
| 38 | https://laravel.com/ (accessed on 20 December 2023). |
| 39 | Configurable Apps, Dashboard, Experience Builder, Hub, Instant Apps, Story Maps, and Web AppBuilder are available on ArcGIS Online. Except for ArcGIS Hub, all of these apps are also available on ArcGIS Enterprise. Besides these, other apps are available: App Studio, App Studio developer edition, Business Analyst, Drone2Map, Enterprise Sites, Excalibur, Experience Builder developer edition, Field Map, ArcGIS for Office, ArcGIS for SharePoint, GeoPlanner, Indoors, Insights, Maps for Adobe Creative Cloud, Mission Manager, Navigator, QuickCapture, Solutions, StreetMap Premium, Survey 123, Web AppBuilder developer edition, Workflow Manager, Workforce, Map Viewer, and Scene Viewer (https://doc.arcgis.com/en/arcgis-online/create-maps/create-map-apps.htm and https://enterprise.arcgis.com/en/apps/, accessed on 20 December 2023). |
| 40 | BDTRE is the geographic DB for the Piedmont territory; it is available online: https://www.geoportale.piemonte.it/cms/bdtre/bdtre-2 and https://www.geoportale.piemonte.it/cms/images/bdtre_doc/Specifica2.0.pdf (accessed on 20 December 2023). BDTRE shapefiles are dated back to 2019; they are in the Monte Mario reference system (EPSG:3003) and are converted in WGS84UTM32N with ConveRgo—https://www.cisis.it/?page_id=3214 (accessed on 20 December 2023). |
| 41 | The adjust transformation is optimized for both global and local accuracy; it uses an algorithm combining a polynomial transformation and a TIN interpolation technique. It uses control points for the polynomial transformation and adjusts control points’ positions using the TIN interpolation techniques. |
| 42 | The spline transformation is optimized for local and not global accuracy; it is based on a spline function, and it registers precisely the control points giving a null error, but pixels far away from the control points are not necessarily accurate. |
| 43 | |
| 44 | |
| 45 | The DTM is obtained from the 1:10000 Carta Tecnica Regionale Numerica (CTRN). It has 10-m resolution and 5-m accuracy; the original reference system is WGS84 UTM 32N and is converted into WGS 1984 Web Mercator. |
| 46 | |
| 47 | The Z-value indicates the geometry elevation, while the M- value can record other distance values, such as the distance value from a selected starting point. https://developers.sap.com/tutorials/hana-spatial-intro5-z-m-coordinates.html (accessed on 21 December 2023). |
| 48 | |
| 49 | https://community.esri.com/t5/map-viewer-beta-ques-read-only/will-the-new-map-viewer-be-supported-in-web/td-p/275111 (accessed on 21 December 2023). |
| 50 | https://support.esri.com/en/technical-article/000026323 (accessed on 21 December 2023). |
| 51 | https://www.esri.com/arcgis-blog/products/web-appbuilder/announcements/arcgis-web-appbuilder-roadmap-for-retirement/ (accessed on 21 December 2023). |
| 52 | Except for city and province pavilions and colonial exhibits, all of these classification terms are taken from the Getty AAT: entrance structures, http://vocab.getty.edu/page/aat/300445044; exhibition kiosks, http://vocab.getty.edu/page/aat/300448853; gardens (open spaces) and national pavilions, http://vocab.getty.edu/page/aat/300448941; office buildings, http://vocab.getty.edu/page/aat/300007043; permanent structures, http://vocab.getty.edu/page/aat/300448942; recreation structures, http://vocab.getty.edu/page/aat/300122263; theme structures, http://vocab.getty.edu/page/aat/300448978; and transportation structures http://vocab.getty.edu/page/aat/300120693 (accessed on 28 December 2023). |
| 53 | |
| 54 | https://pagespeed.web.dev/ (accessed on 21 December 2023). |
| 55 | FCP measures the amount of time needed to load any content—like images and text—on the web page opened by a user for the first time. https://web.dev/articles/fcp (accessed on 21 December 2023). |
| 56 | LCP measures the amount of time requested for the larger content—an image or text block—to be fully visible on the web page opened by a user for the first time. https://web.dev/articles/lcp (accessed on 21 December 2023). |
| 57 | TBT measures the amount of time after the FCP during which the main thread is blocked; during this time, the browser has to wait to finish the task before responding. https://web.dev/articles/tbt?hl=it (accessed on 21 December 2023). |
| 58 | https://developers.google.com/speed/docs/insights/v5/about?hl=it (accessed on 21 December 2023). |
| 59 | The test was performed using a computer with a WiFi connection and a 125.82 Mbps download speed and a smartphone with a 4G internet connection and a 37.95 Mbps download speed. |
| 60 | See https://support.esri.com/en-us/products/arcgis-enterprise/life-cycle (accessed on 22 December 2023). |
| 61 |
References
- Yao, Y.; Wang, X.; Luo, L.; Wan, H.; Ren, H. An Overview of GIS-RS Applications for Archaeological and Cultural Heritage under the DBAR-Heritage Mission. Remote Sens. 2023, 15, 5766. [Google Scholar] [CrossRef]
- Petrescu, F. The use of GIS technology in cultural heritage. In Proceedings of the XXI International CIPA Symposium, Athens, Greece, 1–6 October 2007. [Google Scholar]
- Vacca, G.; Quaquero, E.; Pili, D.; Brandolini, M. GIS-HBIM integration for the management of historical buildings. Int. Arch. Photogramm. Remote Sens. Spat. Inf. Sci. 2018, 42, 1129–1135. [Google Scholar] [CrossRef]
- Bitelli, G.; Gatta, G.; Guccini, A.M.; Zaffagnini, A. GIS and Geomatics for Archive Documentation of an Architectural Project: The Case of the Big Arc of Entrance to the Vittorio Emanuele II Gallery of Milan, by Giuseppe Mengoni (1877). J. Cult. Herit. 2019, 38, 204–212. [Google Scholar] [CrossRef]
- Migliaccio, F.; Locati, M.; Carrion, D.; Manenti, L.; Martoccia, M. A Prototype HGIS for Managing Earthquake Data From Historical Documents. Geomat. Nat. Hazards Risk 2019, 10, 118–135. [Google Scholar] [CrossRef]
- Southall, H.; Aucott, P. Expressing History through a Geo-Spatial Ontology. ISPRS Int. J. Geo-Inf. 2019, 8, 362. [Google Scholar] [CrossRef]
- Bitelli, G.; Bartolini, F.; Gatta, G. HGIS and Archive Researches: A Tool for the Study of the Ancient Mill Channel of Cesena (Italy). Int. Arch. Photogramm. Remote Sens. Spat. Inf. Sci. 2016, XLI-B5, 183–189. [Google Scholar] [CrossRef]
- Gatta, G.; Bitelli, G. A HGIS for the study of waterways: The case of Bologna as ancient city of waters. IOP Conf. Ser. Mater. Sci. Eng. 2020, 949, 012051. [Google Scholar] [CrossRef]
- Ismanto, H.; Doloksaribu, A.; Syafrianto, A. Webgis-based Irrigation basic Map Model of Merauke Regency Papua. Webgis-Based Irrig. Basic Map Model Merauke Regency Papua 2016, 152, 21–24. [Google Scholar] [CrossRef]
- Kuria, E.; Kimani, S.; Mindila, A. A Framework for Web GIS Development: A Review. Int. J. Comput. Appl. 2019, 178, 6–10. [Google Scholar] [CrossRef]
- Fu, P. Getting to Know Web GIS, 4th ed.; Esri Press: Redlands, CA, USA, 2020. [Google Scholar]
- Alesheikh, A.A.; Helali, H.; Behroz, H. Web GIS: Technologies and its applications. In Symposium on Geospatial Theory, Processing and Applications; ISPRS: Hannover, Germany, 2002. [Google Scholar]
- Rodrigues da Silva, A.; Estima, J.; Marques, J.; Gamito, I.; Serra, A.; Moura, L.; Ricardo, A.M.; Mendes, L.; Ferreira, R.M.L. A Web GIS Platform to Modeling, Simulate and Analyze Flood Events: The RiverCure Portal. ISPRS Int. J. Geo-Inf. 2023, 12, 268. [Google Scholar] [CrossRef]
- Capolupo, A.; Monterisi, C.; Saponieri, A.; Addona, F.; Damiani, L.; Archetti, R.; Tarantino, E. An Interactive WebGIS Framework for Coastal Erosion Risk Management. J. Mar. Sci. Eng. 2021, 9, 567. [Google Scholar] [CrossRef]
- Aicardi, I.; Boccardo, P.; Chiabrando, F.; Facello, A.; Gnavi, L.; Lingua, A.; Pasquale, F.; Maschio, P.; Spanò, A. A Didactic Project for Landscape Heritage Mapping in Post-disaster Management. Appl. Geomat. 2015, 7, 49–60. [Google Scholar] [CrossRef]
- Brocchini, D.; Chiabrando, F.; Colucci, E.; Sammartano, G.; Spanò, A.; Losè, L.T.; Villa, A. The Geomatics Contribution for the Valorisation Project in the Rocca of San Silvestro Landscape Site. ISPRS Int. J. Geo Inf. 2017, 42, 495–502. [Google Scholar] [CrossRef]
- Colucci, E.; Spanò, A.; Chiabrando, F. WebGIS tools to disseminate archaeological landscape memory. Territ. Ital. 2017, 2, 3. [Google Scholar] [CrossRef]
- Sánchez-Aparicio, L.J.; Moreno-Blanco, R.; Martín-Jiménez, J.A.; Rodríguez-Gonzálvez, P.; Muñoz-Nieto, A.L.; González-Aguilera, D. SmartWall: A New Web-based Platform for the Valorization of the Medieval Wall of Avila. Int. Arch. Photogramm. Remote Sens. Spat. Inf. Sci. 2019, XLII-2/W15, 1055–1062. [Google Scholar] [CrossRef]
- Vacca, G.; Fiorino, D.R.; Pili, D. A WebGIS for the knowledge and conservation of the historical buildings in Sardinia. Int. Arch. Photogramm. Remote Sens. Spat. Inf. Sci. 2017, XLII-4/W2, 171–178. [Google Scholar] [CrossRef]
- Sánchez-Aparicio, L.J.; Masciotta, M.-G.; García-Alvarez, J.; Ramos, L.F.; Oliveira, D.V.; Martín-Jiménez, J.A.; González-Aguilera, D.; Monteiro, P. Web-GIS approach to preventive conservation of heritage buildings. Autom. Constr. 2020, 118, 103304. [Google Scholar] [CrossRef]
- Pantaloni, M.; Console, F.; Congi, M.P.; Ventura, R. The Historical Geological Cartography: From Digital Archive to WebGIS Environment. Abstr. ICA 2021, 3, 230. [Google Scholar] [CrossRef]
- Brovelli, M.A.; Minghini, M.; Giori, G.; Beretta, M. Web Geoservices and Ancient Cadastral Maps: The Web C.A.R.T.E. Project. Trans. GIS 2012, 16, 125–142. [Google Scholar] [CrossRef]
- Chalkias, C.; Papadias, E.; Vradis, C.; Polykretis, C.; Kalogeropoulos, K.; Psarogiannis, A.; Chalkias, G. Developing and Disseminating a New Historical Geospatial Database from Kitchener’s 19th Century Map of Cyprus. ISPRS Int. J. Geo-Inf. 2023, 12, 74. [Google Scholar] [CrossRef]
- Lampropoulos, G.; Panagiotopoulos, G.; Giannakoula, C.; Kokkalas, A. Geovisualization of Historical Geospatial Data: A Web Mapping Application for the 19th-Century Kaupert’s Maps of Attica. Geographies 2023, 3, 398–415. [Google Scholar] [CrossRef]
- Dante’s Inferno. Available online: https://storymaps.arcgis.com/stories/ad2a09720b75435b922396307e2d6004 (accessed on 28 December 2023).
- Theocharaki, A.M.; Costaki, L.; Papaefthimiou, W.; Pigaki, M.; Panagiotopoulos, G. Mapping Ancient Athens: A Digital Map to Rescue Excavations. In Proceedings of the Trandisciplinary Multispectral Modelling and Cooperation for the Preservation of Cultural Heritage; Moropoulou, A., Georgopoulos, A., Doulamis, A., Ioannides, M., Ronchi, A., Eds.; Springer International Publishing: Cham, Switzerland, 2022; pp. 55–65. [Google Scholar]
- Fiorini, G.; Friso, I.; Balletti, C. A Geomatic Approach to the Preservation and 3D Communication of Urban Cultural Heritage for the History of the City: The Journey of Napoleon in Venice. Remote Sens. 2022, 14, 3242. [Google Scholar] [CrossRef]
- Sang, K.; Piovan, S.; Fontana, G.L. A WebGIS for Visualizing Historical Activities Based on Photos: The Project of Yunnan–Vietnam Railway Web Map. Sustainability 2021, 13, 419. [Google Scholar] [CrossRef]
- Wei, T.; Sang, Y.; Chen, S.; Wang, L.; Wang, R.; Wang, J.; Huang, Q.; Wang, J. WebGIS Approach of Entity-oriented Search to Visualize Historical and Cultural Events. Digit. Scholarsh. Humanit. 2022, 37, 868–879. [Google Scholar] [CrossRef]
- Yu, F.; Champion, E.; McMeekin, D. Exploring Historical Australian Expeditions with Time-Layered Cultural Maps. ISPRS Int. J. Geo-Inf. 2023, 12, 104. [Google Scholar] [CrossRef]
- Yan, Y.; Dean, K.; Feng, C.-C.; Hue, G.T.; Koh, K.-H.; Kong, L.; Ong, C.W.; Tay, A.; Wang, Y.-C.; Xue, Y. Chinese Temple Networks in Southeast Asia: A WebGIS Digital Humanities Platform for the Collaborative Study of the Chinese Diaspora in Southeast Asia. Religions 2020, 11, 334. [Google Scholar] [CrossRef]
- Von Schwerin, J.; Richards-Rissetto, H.; Remondino, F.; Agugiaro, G.; Girardi, G. The mayaarch3d project: A 3D webgis for analyzing ancient architecture and landscapes. Lit. Linguist. Comput. 2013, 28, 736–753. [Google Scholar] [CrossRef]
- Rinaudo, F.; Eros, A.; Ardissone, P. Gis and Web-Gis, Commercial and Open Source Platforms: General Rules for Cultural Heritage Documentation. In Proceedings of the 21st CIPA Symposium AntiCIPAting the Future of the Cultural Past, Athens, Greece, 1–6 October 2007. [Google Scholar]
- Agrawal, S.; Gupta, R.D. Web GIS and its architecture: A review. Arab. J. Geosci. 2017, 10, 518. [Google Scholar] [CrossRef]
- Bagnolo, V.; Argiolas, R.; Cera, S. Digital Translations of Paper Architectures. Diségno 2022, 10, 95–106. [Google Scholar]
- Tamborrino, R.R.; Rinaudo, F. Sharing Knowledge, Grasping Cultural Heritage: A Digital Multidisciplinary Approach to the Historical Process of Architecture and Urban Changes. In Heritage and Technology. Mind, Knowledge, Experience, Proceeding of the XIII International Forum ‘le Vie dei Mercanti’ Aversa and Capri, Lecce, Italy, 11–13 June 2015; La Scuola di Pitagora Editrice: Napoli, Italy, 2015; pp. 1261–1270. [Google Scholar]
- Gregory, I.N.; Healey, R.G. Historical GIS: Structuring, Mapping and Analysing Geographies of the Past. Prog. Hum. Geogr. 2007, 31, 638–653. [Google Scholar] [CrossRef]
- Münster, S.; Apollonio, F.I.; Bell, P.; Kuroczynski, P.; Di Lenardo, I.; Rinaudo, F.; Tamborrino, R. Digital Cultural Heritage Meets Digital Humanities. Int. Arch. Photogramm. Remote Sens. Spat. Inf. Sci. 2019, XLII-2/W15, 813–820. [Google Scholar] [CrossRef]
- Spreafico, A. Turin 1911 ‘La Favolosa Esposizione’: From Knowledge to Dissemination Using Integrated Geomatics Methods. Ph.D. Thesis, Politecnico di Torino, Turin, Italy, 23 June 2023. Available online: https://iris.polito.it/handle/11583/2981455 (accessed on 28 December 2023).
- Spreafico, A.; Chiabrando, F.; Della Coletta, C. 3D WebGIS Applications for Digital Humanities Studies: The Turin 1911 Project. Int. Arch. Photogramm. Remote Sens. Spat. Inf. Sci. 2023, XLVIII-M-2, 1501–1508. [Google Scholar] [CrossRef]
- Biljecki, F.; LeDoux, H.; Stoter, J. An Improved LOD Specification for 3D Building Models. Comput. Environ. Urban Syst. 2016, 59, 25–37. [Google Scholar] [CrossRef]
- Sammartano, G.; Avena, M.; Cappellazzo, M.; Spanò, A. Hybrid GIS-BIM approach for the Torino digital-twin: The implementation of a floor-level 3D city geodatabase. Int. Arch. Photogramm. Remote Sens. Spat. Inf. Sci. 2021, 43, 423–430. [Google Scholar] [CrossRef]
- Barazzetti, L.; Roncoroni, F. Generation of a Multi-Scale Historic BIM-GIS with Digital Recording Tools and Geospatial Information. Heritage 2021, 4, 3331–3348. [Google Scholar] [CrossRef]
- Tengtrairat, N.; Woo, W.L.; Parathai, P.; Aryupong, C.; Jitsangiam, P.; Rinchumphu, D. Automated Landslide-Risk Prediction Using Web GIS and Machine Learning Models. Sensors 2021, 21, 4620. [Google Scholar] [CrossRef]
- Salazar-Carrillo, J.; Torres-Ruiz, M.; Davis, C.A., Jr.; Quintero, R.; Moreno-Ibarra, M.; Guzmán, G. Traffic Congestion Analysis Based on a Web-GIS and Data Mining of Traffic Events from Twitter. Sensors 2021, 21, 2964. [Google Scholar] [CrossRef]
- Piragnolo, M.; Pirotti, F.; Zanrosso, C.; Lingua, E.; Grigolato, S. Responding to Large-Scale Forest Damage in an Alpine Environment with Remote Sensing, Machine Learning, and Web-GIS. Remote Sens. 2021, 13, 1541. [Google Scholar] [CrossRef]
- Yang, Y.; Tang, J.; Luo, H.; Law, R. Hotel location evaluation: A combination of machine learning tools and web GIS. Int. J. Hosp. Manag. 2015, 47, 14–24. [Google Scholar] [CrossRef]
- Painho, M.; Peixoto, M.; Cabral, P.; Sena, R. WebGIS as a teaching tool. Proc. ESRI UC 2001, 9–13. [Google Scholar]
- Parejo Vadillo, A.; Kahle, B. The Internet Archive: An Interview with Brewster Kahle. 19 Interdiscip. Stud. Long Ninet. Century 2015, 2015, 21. [Google Scholar] [CrossRef]
- Khedmatgozar, H.R.; Alipour-Hafezi, M. The role of digital identifier systems in the theory of digital objects. Int. J. Inf. Manag. 2017, 37, 162–165. [Google Scholar] [CrossRef]
- Denard, H. A New Introduction to the London Charter. In Paradata and Transparency in Virtual Heritage; Bentkowska-Kafel, A., Denard, H., Baker, D., Eds.; Routledge: London, UK, 2012; pp. 57–71. Available online: https://www.london-charter.org/media/files/ch6_denard.pdf (accessed on 8 February 2024).
- Champion, E.; Rahaman, H. Survey of 3d Digital Heritage Repositories and Platforms. Virtual Archaeol. Rev. 2020, 11, 1–15. [Google Scholar] [CrossRef]
- Doyle, J.; Viktor, H.L.; Paquet, E. Long Term Digital Preservation—Preserving Authenticity and Usability of 3D Data. Int. J. Digit. Libr. 2008, 10, 33–47. [Google Scholar] [CrossRef]
- Belhi, A.; Foufou, S.; Bouras, A.; Sadka, A.H. Digitization and Preservation of Cultural Heritage Products. In Product Lifecycle Management and the Industry of the Future; Springer International Publishing: Cham, Switzerland, 2017; pp. 241–253. ISBN 9783319729046. [Google Scholar]
- Moore, J.; Kettler, H.S. Who cares about 3D preservation? IASSIST Q. 2018, 42, 15. [Google Scholar] [CrossRef]
- Lauriault, T.P.; Pulsifer, P.L.; Taylor, D.F. The Preservation and Archiving of Geospatial Digital Data: Challenges and Opportunities for Cartographers. In Preservation in Digital Cartography; Jobst, M., Ed.; Lecture Notes in Geoinformation and Cartography; Springer: Berlin/Heidelberg, Germany, 2010; pp. 25–55. [Google Scholar] [CrossRef]
- Clark, J.H. The long-term preservation of digital historical geospatial data: A review of issues and methods. J. Map Geogr. Libr. 2016, 12, 187–201. [Google Scholar] [CrossRef]
- Pinnick, J. Exploring digital preservation requirements: A case study from the National Geoscience Data Centre (NGDC). Rec. Manag. J. 2017, 27, 175–191. [Google Scholar] [CrossRef]
- Della Coletta, C.; Chiabrando, F.; Spreafico, A. Turin 1911; University of California San Diego: San Diego, CA, USA, 2023. [Google Scholar] [CrossRef]
- Ferrettini, E. Gli albori di una grande esposizione, L’Esposizione di Torino. G. Uff. Illus. Dell’esposizione Internazionale Delle Ind. E Del Lav. 1911, 1910, 13–16. [Google Scholar]
- Einaudi, D.; Spreafico, A.; Chiabrando, F.; della Coletta, C. From archive documentation to online 3d model visualization of no longer existing structures: The turin 1911 project. Int. Arch. Photogramm. Remote Sens. Spat. Inf. Sci. 2020, 43, 837–844. [Google Scholar] [CrossRef]
- Scovazzo, S. L’esposizione Universale di Torino 1911: Rilievo Fotogrammetrico e Modellazione 3D per Applicazioni di Realtà Virtuale = Universal Exposition of Turin 1911: Photogrammetric Survey and 3D Modelling for Virtual Reality Application. Master’s Thesis, Politecnico di Torino, Turin, Italy, 2020. Available online: http://webthesis.biblio.polito.it/id/eprint/16705 (accessed on 8 February 2024).
- Chiabrando, F.; Coletta, C.D.; Sammartano, G.; Spanò, A.; Spreafico, A. “Torino 1911” project: A contribution of a slam-based survey to extensive 3D heritage modeling. Int. Arch. Photogramm. Remote Sens. Spat. Inf. Sci. 2018, XLII-2, 225–234. [Google Scholar] [CrossRef]
- Chiabrando, F.; Sammartano, G.; Spanò, A.; Spreafico, A. Hybrid 3D Models: When Geomatics Innovations Meet Extensive Built Heritage Complexes. ISPRS Int. J. Geo-Inf. 2019, 8, 124. [Google Scholar] [CrossRef]
- Spreafico, A.; Della Coletta, C. Towards Online 3D Archive of Historical Site: The Turin 1911 World’s Fair. In Proceedings of the Joint International Event 9th ARQUEOLÓGICA 2.0 & 3rd GEORES, Valencia, Spain, 26–28 April 2021; pp. 487–490. Available online: https://www.researchgate.net/profile/Alessandra-Spreafico-2/publication/353046430_TOWARDS_ONLINE_3D_ARCHIVE_OF_HISTORICAL_SITE_THE_TURIN_1911_WORLD'S_FAIR/links/60e5e86830e8e50c01eb22a1/TOWARDS-ONLINE-3D-ARCHIVE-OF-HISTORICAL-SITE-THE-TURIN-1911-WORLDS-FAIR.pdf (accessed on 8 February 2024).
- Findling, J. “World’s Fair,” Encyclopedia Britannica. Available online: https://www.britannica.com/topic/worlds-fair (accessed on 5 December 2023).
- Maiwald, F.; Henze, F.; Bruschke, J.; Niebling, F. Geo-information Technologies for a Multimodal Access on Historical Photographs and Maps for Research and Communication in Urban History. In Proceedings of the International Archives of the Photogrammetry, Remote Sensing & Spatial Information Sciences, Milan, Italy, 8–10 May 2019. [Google Scholar] [CrossRef]
- Wahyuningtyas, R. Eliminating Boundaries in Learning Culture Through Technology: A Review of Google Arts and Culture. In Proceedings of the 10th International Conference Revisiting English Teaching, Literature, and Translation in the Borderless World: My World, Your World, Whose World? Satya Wacana University Press: Salatiga, Indonesia, 2017; pp. 179–184. Available online: https://www.researchgate.net/profile/Kristiawan-Indriyanto/publication/337869455_Proceeding_FLA10_Conference_2017/links/5defba23299bf10bc3518d3c/Proceeding-FLA10-Conference-2017.pdf#page=180 (accessed on 28 December 2023).
- Scopigno, R.; Callieri, M.; Delleppiane, M.; Ponchio, F.; Potenziani, M. Delivering and using 3D models on the web: Are we ready? Virtual Archaeol. Rev. 2017, 8, 1–9. [Google Scholar] [CrossRef]
- Nishanbaev, I. A web repository for geo-located 3D digital cultural heritage models. Digit. Appl. Archaeol. Cult. Herit. 2020, 16, e00139. [Google Scholar] [CrossRef]
- Münster, S.; Friedrichs, K.; Kröber, C.; Bruschke, J.; Henze, F.; Maiwald, F.; Niebling, F. Urban history in 4 dimensions—Supporting research and education. Int. Arch. Photogramm. Remote Sens. Spat. Inf. Sci. ISPRS Arch. 2017, 42, 525–530. [Google Scholar] [CrossRef]
- Armstrong, A.R.E. Architectural Archives/Archiving Architecture: The Digital ERA. Art Doc. J. Art Libr. Soc. North Am. 2006, 25, 12–17. Available online: https://www.journals.uchicago.edu/doi/pdf/10.1086/adx.25.2.27949434?casa_token=P9TXUTVu7aUAAAAA:3S2nu94dVs_SdWIL3p1-7wFy6VEdQ_ifYWqPG6_vw4K7_ECeOnaGCZn2Jl8KC9oTuFJhTeE_VrLs (accessed on 28 December 2023). [CrossRef]
- Bureau International des Expositions. Available online: https://www.bie-paris.org/site/en/ (accessed on 6 December 2023).
- BIE. Convention Relating to International Exhibitions. Paris, 30 November 1928. Available online: https://www.bie-paris.org/site/images/stories/files/BIE_Convention_eng.pdf (accessed on 6 December 2023).
- Bureau International des Expositions. World Expo. Available online: https://www.bie-paris.org/site/en/all-world-expos (accessed on 15 December 2023).
- World Expo Museum. Available online: http://www.expo-museum.cn/sbbwg/n137/n139/index.html (accessed on 7 December 2023).
- Queens Museum. Available online: https://queensmuseum.org/about/ (accessed on 7 December 2023).
- Museum of the City of New York, 1939 World’s Fair. Available online: https://collections.mcny.org/Explore/Highlights/1939%20World's%20Fair/?gclid=Cj0KCQjwvZCZBhCiARIsAPXbajt0Cdsbxz7qA2JRHdTGItrIR6CxJND19xJAeXjbErrZlPBRb5W6O1kaAj1_EALw_wcB (accessed on 16 December 2023).
- GALE. Smithsonian Collections Online: World’s Fairs and Expositions, Visions of Tomorrow. Available online: https://www.gale.com/intl/c/smithsonian-collections-online-worlds-fairs-and-expositions-visions-of-tomorrow (accessed on 29 September 2022).
- Adam Matthew. World’s Fairs. A Global History of Expositions. Available online: https://www.worldsfairs.amdigital.co.uk/ (accessed on 15 December 2023).
- ExpoMuseum. Available online: https://www.expomuseum.com/about (accessed on 5 December 2023).
- World’s Columbian Expositions of 1893. Available online: http://columbus.iit.edu/ (accessed on 5 December 2023).
- Nishanbaev, I.; Champion, E.; McMeekin, D.A. A Web GIS-Based Integration of 3D Digital Models with Linked Open Data for Cultural Heritage Exploration. ISPRS Int. J. Geo-Inf. 2021, 10, 684. [Google Scholar] [CrossRef]
- Codd, E.F. Relational database: A practical foundation for productivity. In Readings in Artificial Intelligence and Databases; Elsevier: Amsterdam, The Netherlands, 1988; pp. 60–68. [Google Scholar]
- Sensini, S. Basi di Dati. Tecnologie, Architetture e Linguaggi per Database; Apogeo: Milan, Italy, 2021. [Google Scholar]
- Tang, L.; Li, L.; Ying, S.; Lei, Y. A Full Level-of-Detail Specification for 3D Building Models Combining Indoor and Outdoor Scenes. ISPRS Int. J. Geo-Inf. 2018, 7, 419. [Google Scholar] [CrossRef]
Figure 1.
The actual perimeter of Valentino Park on the 2018 orthophoto (above) and the perimeter of the 1911 fair on the historical map (below), N.A. [1911]. Esposizione internazionale di Torino 1911. Planimetria generale. Turin: Grand Didier, original scale 1:1000, 90 × 35 cm (Cristina Della Coletta Collection, CDC-TM-0001).

Figure 2.
Esposizione internazionale di Torino 1911. Panorama generale by A.D.T. N.1, 10 × 14 cm cover, 70 × 13.5 cm panorama (Cristina Della Coletta Collection, CDC-PA-0001).
Figure 2.
Esposizione internazionale di Torino 1911. Panorama generale by A.D.T. N.1, 10 × 14 cm cover, 70 × 13.5 cm panorama (Cristina Della Coletta Collection, CDC-PA-0001).

Figure 3.
Home page of the old Turin 1911 website.

Figure 4.
Conceptual model of the new geo-DB.

Figure 5.
The architecture design for Turin 1911 operational environment [40].
Figure 5.
The architecture design for Turin 1911 operational environment [40].

Figure 6.
N.A. [1911]. Esposizione internazionale di Torino 1911. Planimetria generale. Turin: Grand Didier, 1:3000 original scale, 90 × 35 cm (Cristina Della Coletta Collection, CDC-TM-0001).
Figure 6.
N.A. [1911]. Esposizione internazionale di Torino 1911. Planimetria generale. Turin: Grand Didier, 1:3000 original scale, 90 × 35 cm (Cristina Della Coletta Collection, CDC-TM-0001).

Figure 7.
Plan of the City of Turin, 1:15,000 original scale, in N.A. [1911]. Torino e dintorni. Turin: Stamperia Reale Paravia, p. 197, 35 × 41 cm. (Cristina Della Coletta Collection, CDC-GB-0008).
Figure 7.
Plan of the City of Turin, 1:15,000 original scale, in N.A. [1911]. Torino e dintorni. Turin: Stamperia Reale Paravia, p. 197, 35 × 41 cm. (Cristina Della Coletta Collection, CDC-GB-0008).

Figure 8.
Built-environment objects colored based on the object/work type classification.

Figure 9.
Example pop-up for the Pavilion of Siam.

Figure 10.
The Turin 1911 2D/3D WebGIS.

Figure 11.
WebGIS tools’ configuration in ArcGIS Experience Builder.

Figure 12.
The user’s position in Valentino Park (blue dot) is available thanks to the GNSS device.

Figure 13.
When the record is selected from the image gallery, the corresponding geometry (Royal Navy) is highlighted.
Figure 13.
When the record is selected from the image gallery, the corresponding geometry (Royal Navy) is highlighted.

Figure 14.
Configuration for iPad Pro.

Figure 15.
Configuration for iPhone 12.

Figure 16.
Only national pavilions are displayed, thanks to a filter option.

Figure 17.
The Eternit Pavilion is localized through a combination of historical images and the map.
Figure 17.
The Eternit Pavilion is localized through a combination of historical images and the map.

Figure 18.
QR code for the Turin 1911 WebGIS. Available online: https://arcg.is/1HfSqG (accessed on 21 December 2023).
Figure 18.
QR code for the Turin 1911 WebGIS. Available online: https://arcg.is/1HfSqG (accessed on 21 December 2023).


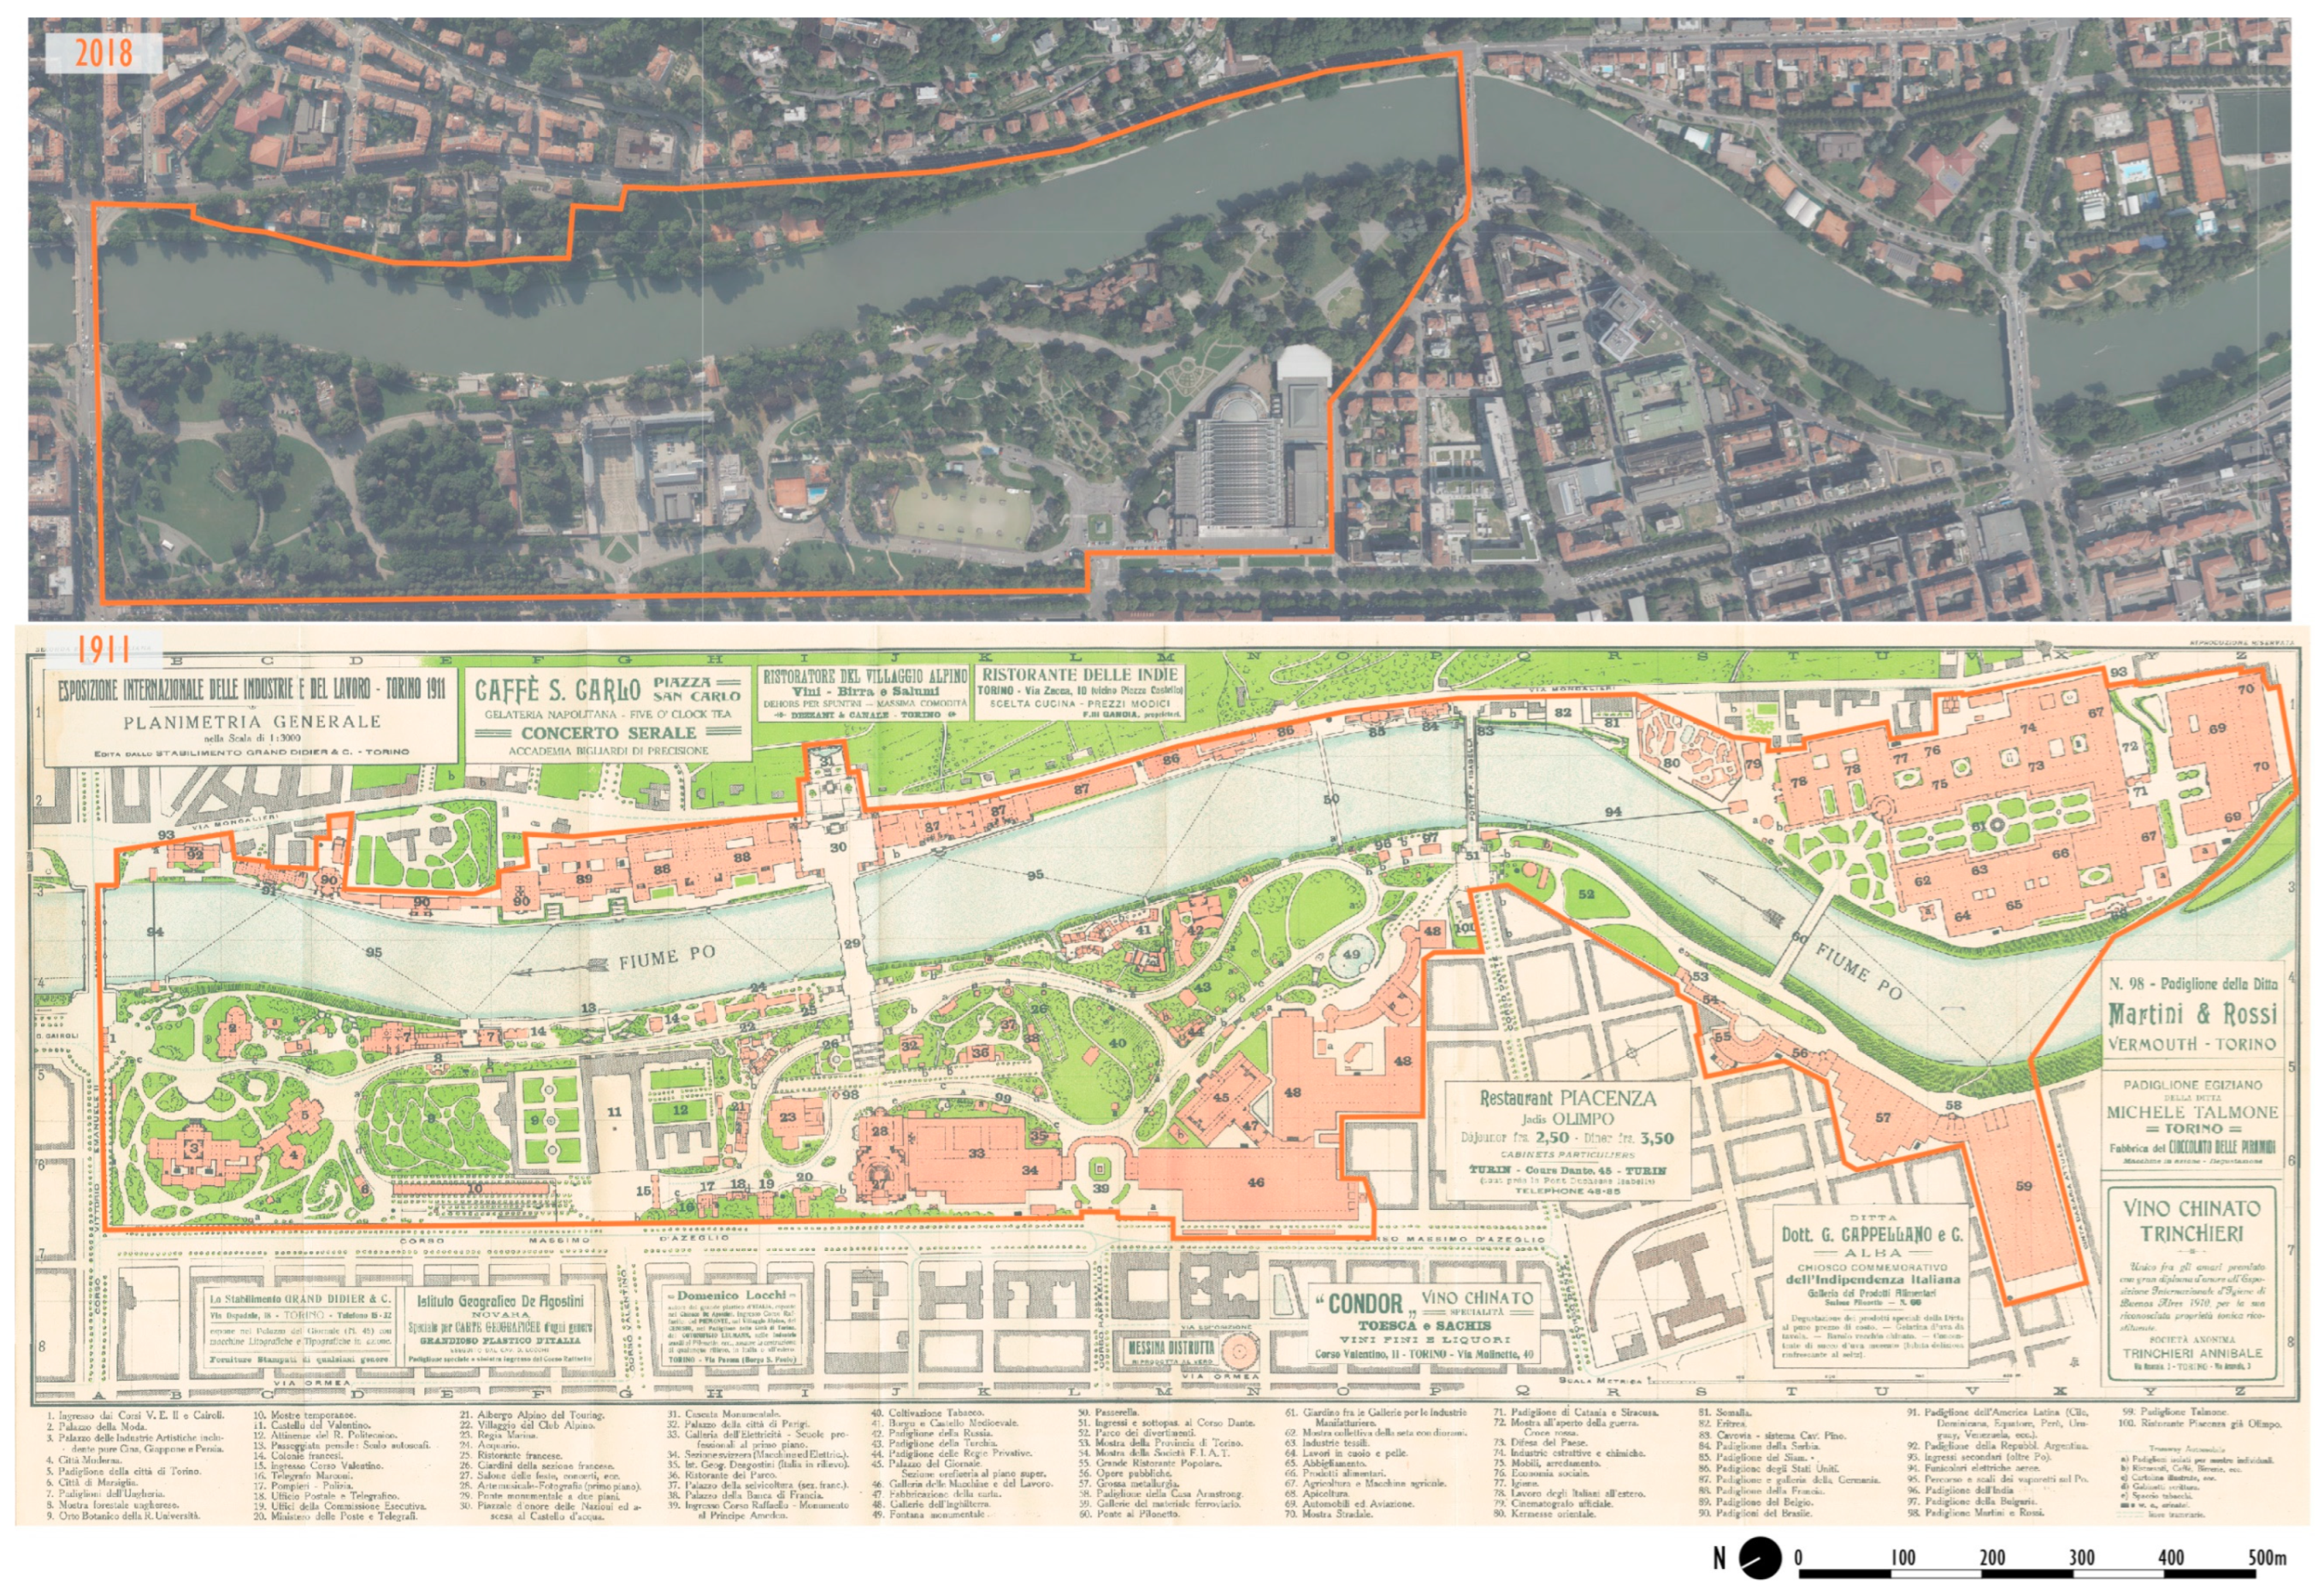
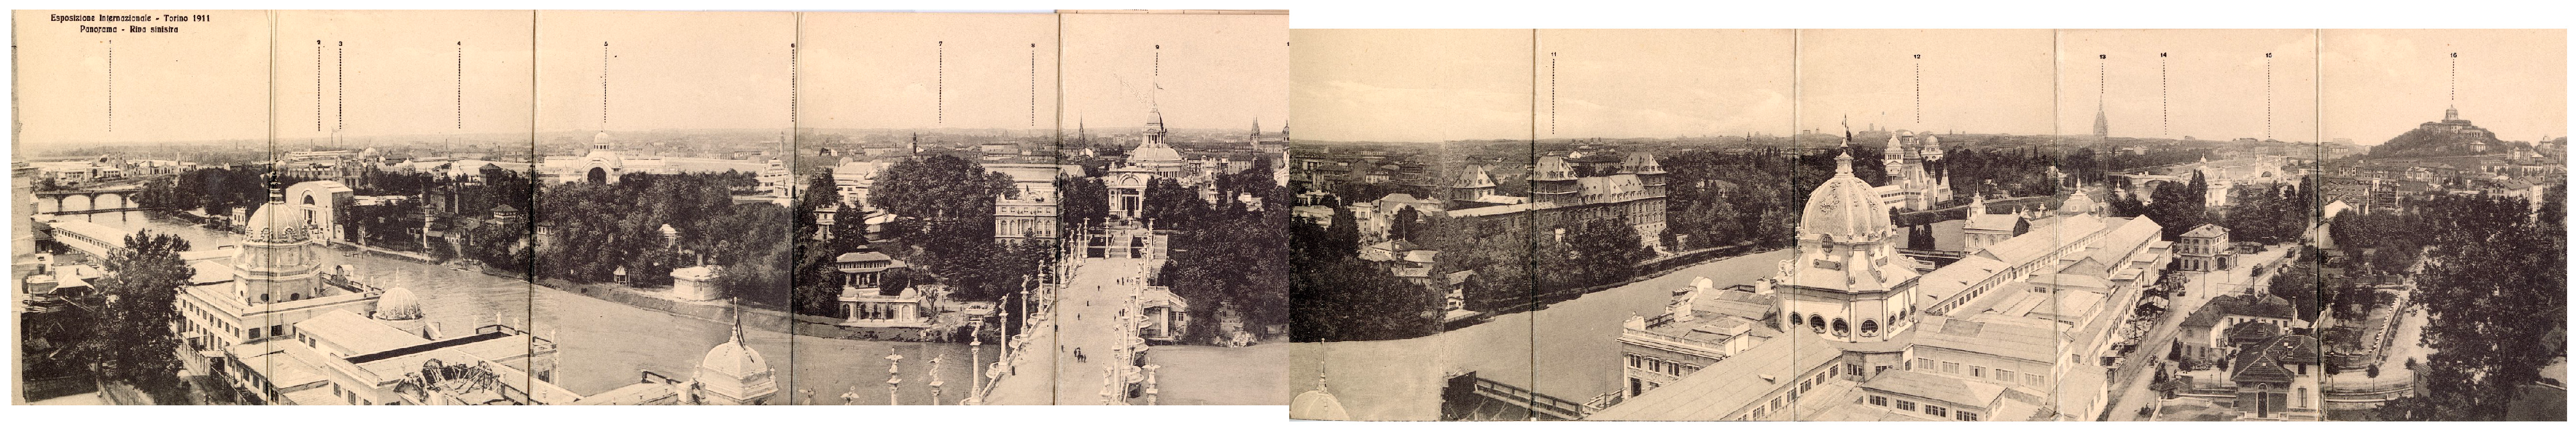
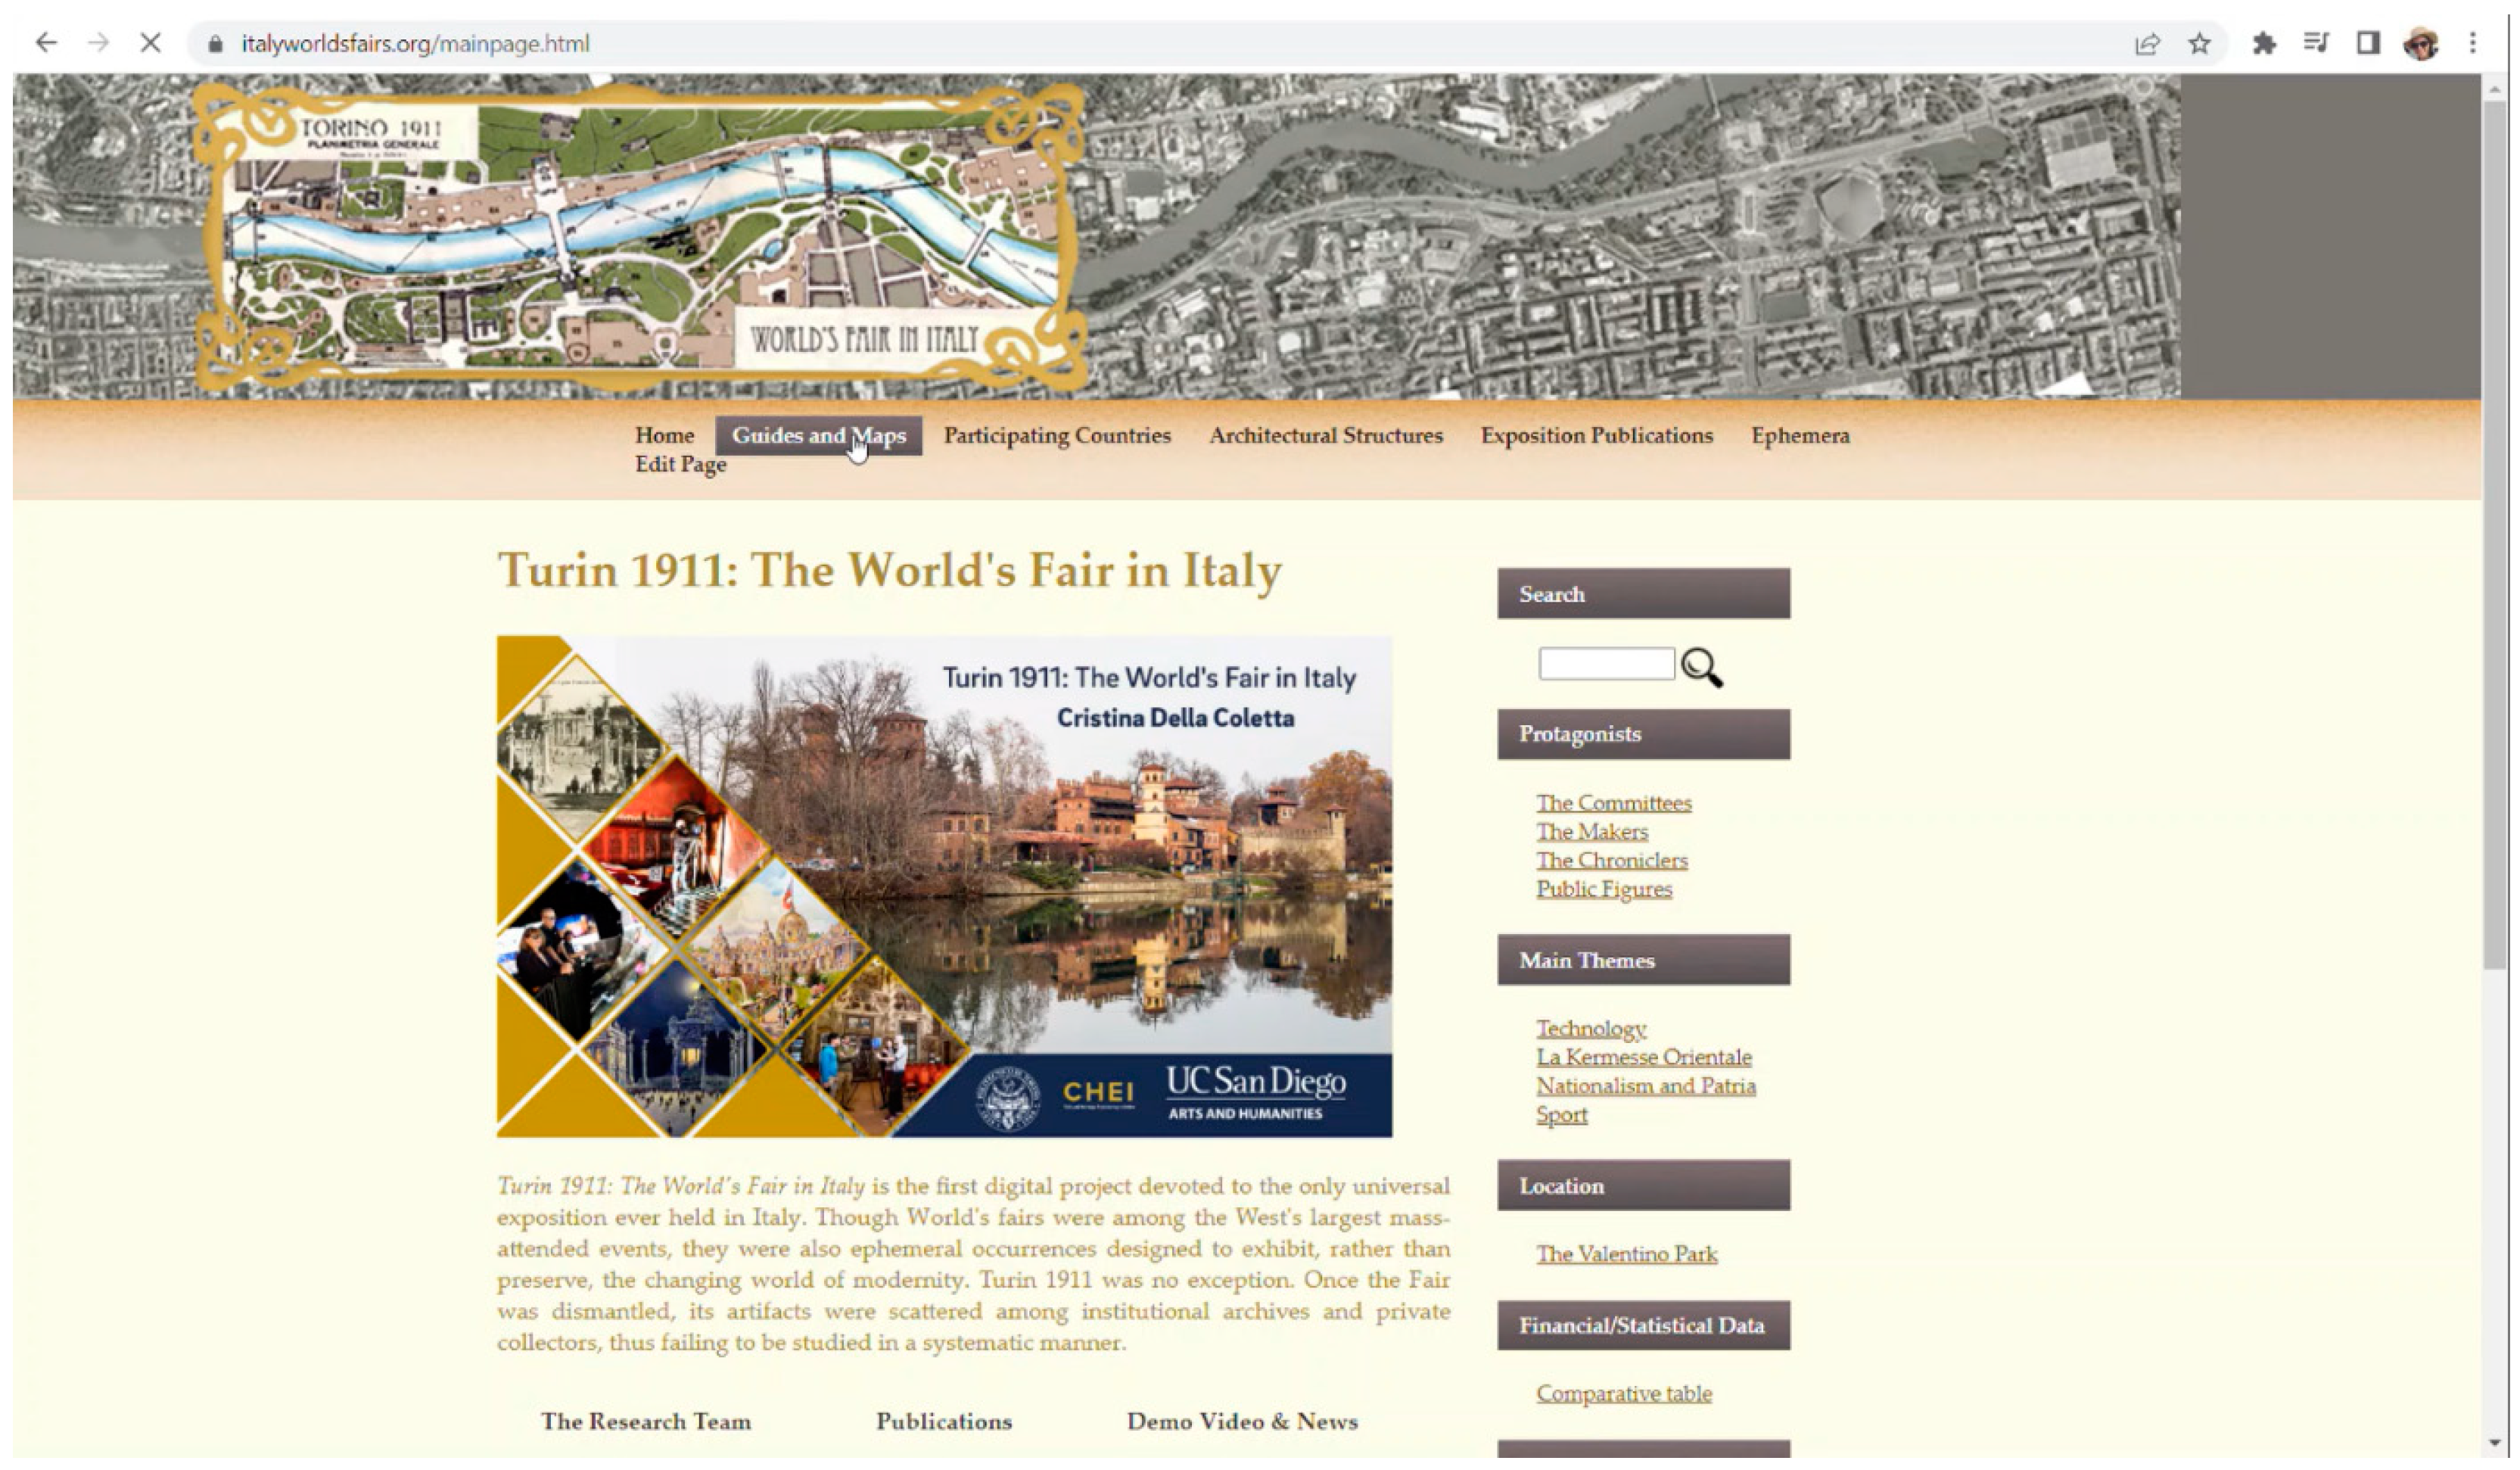
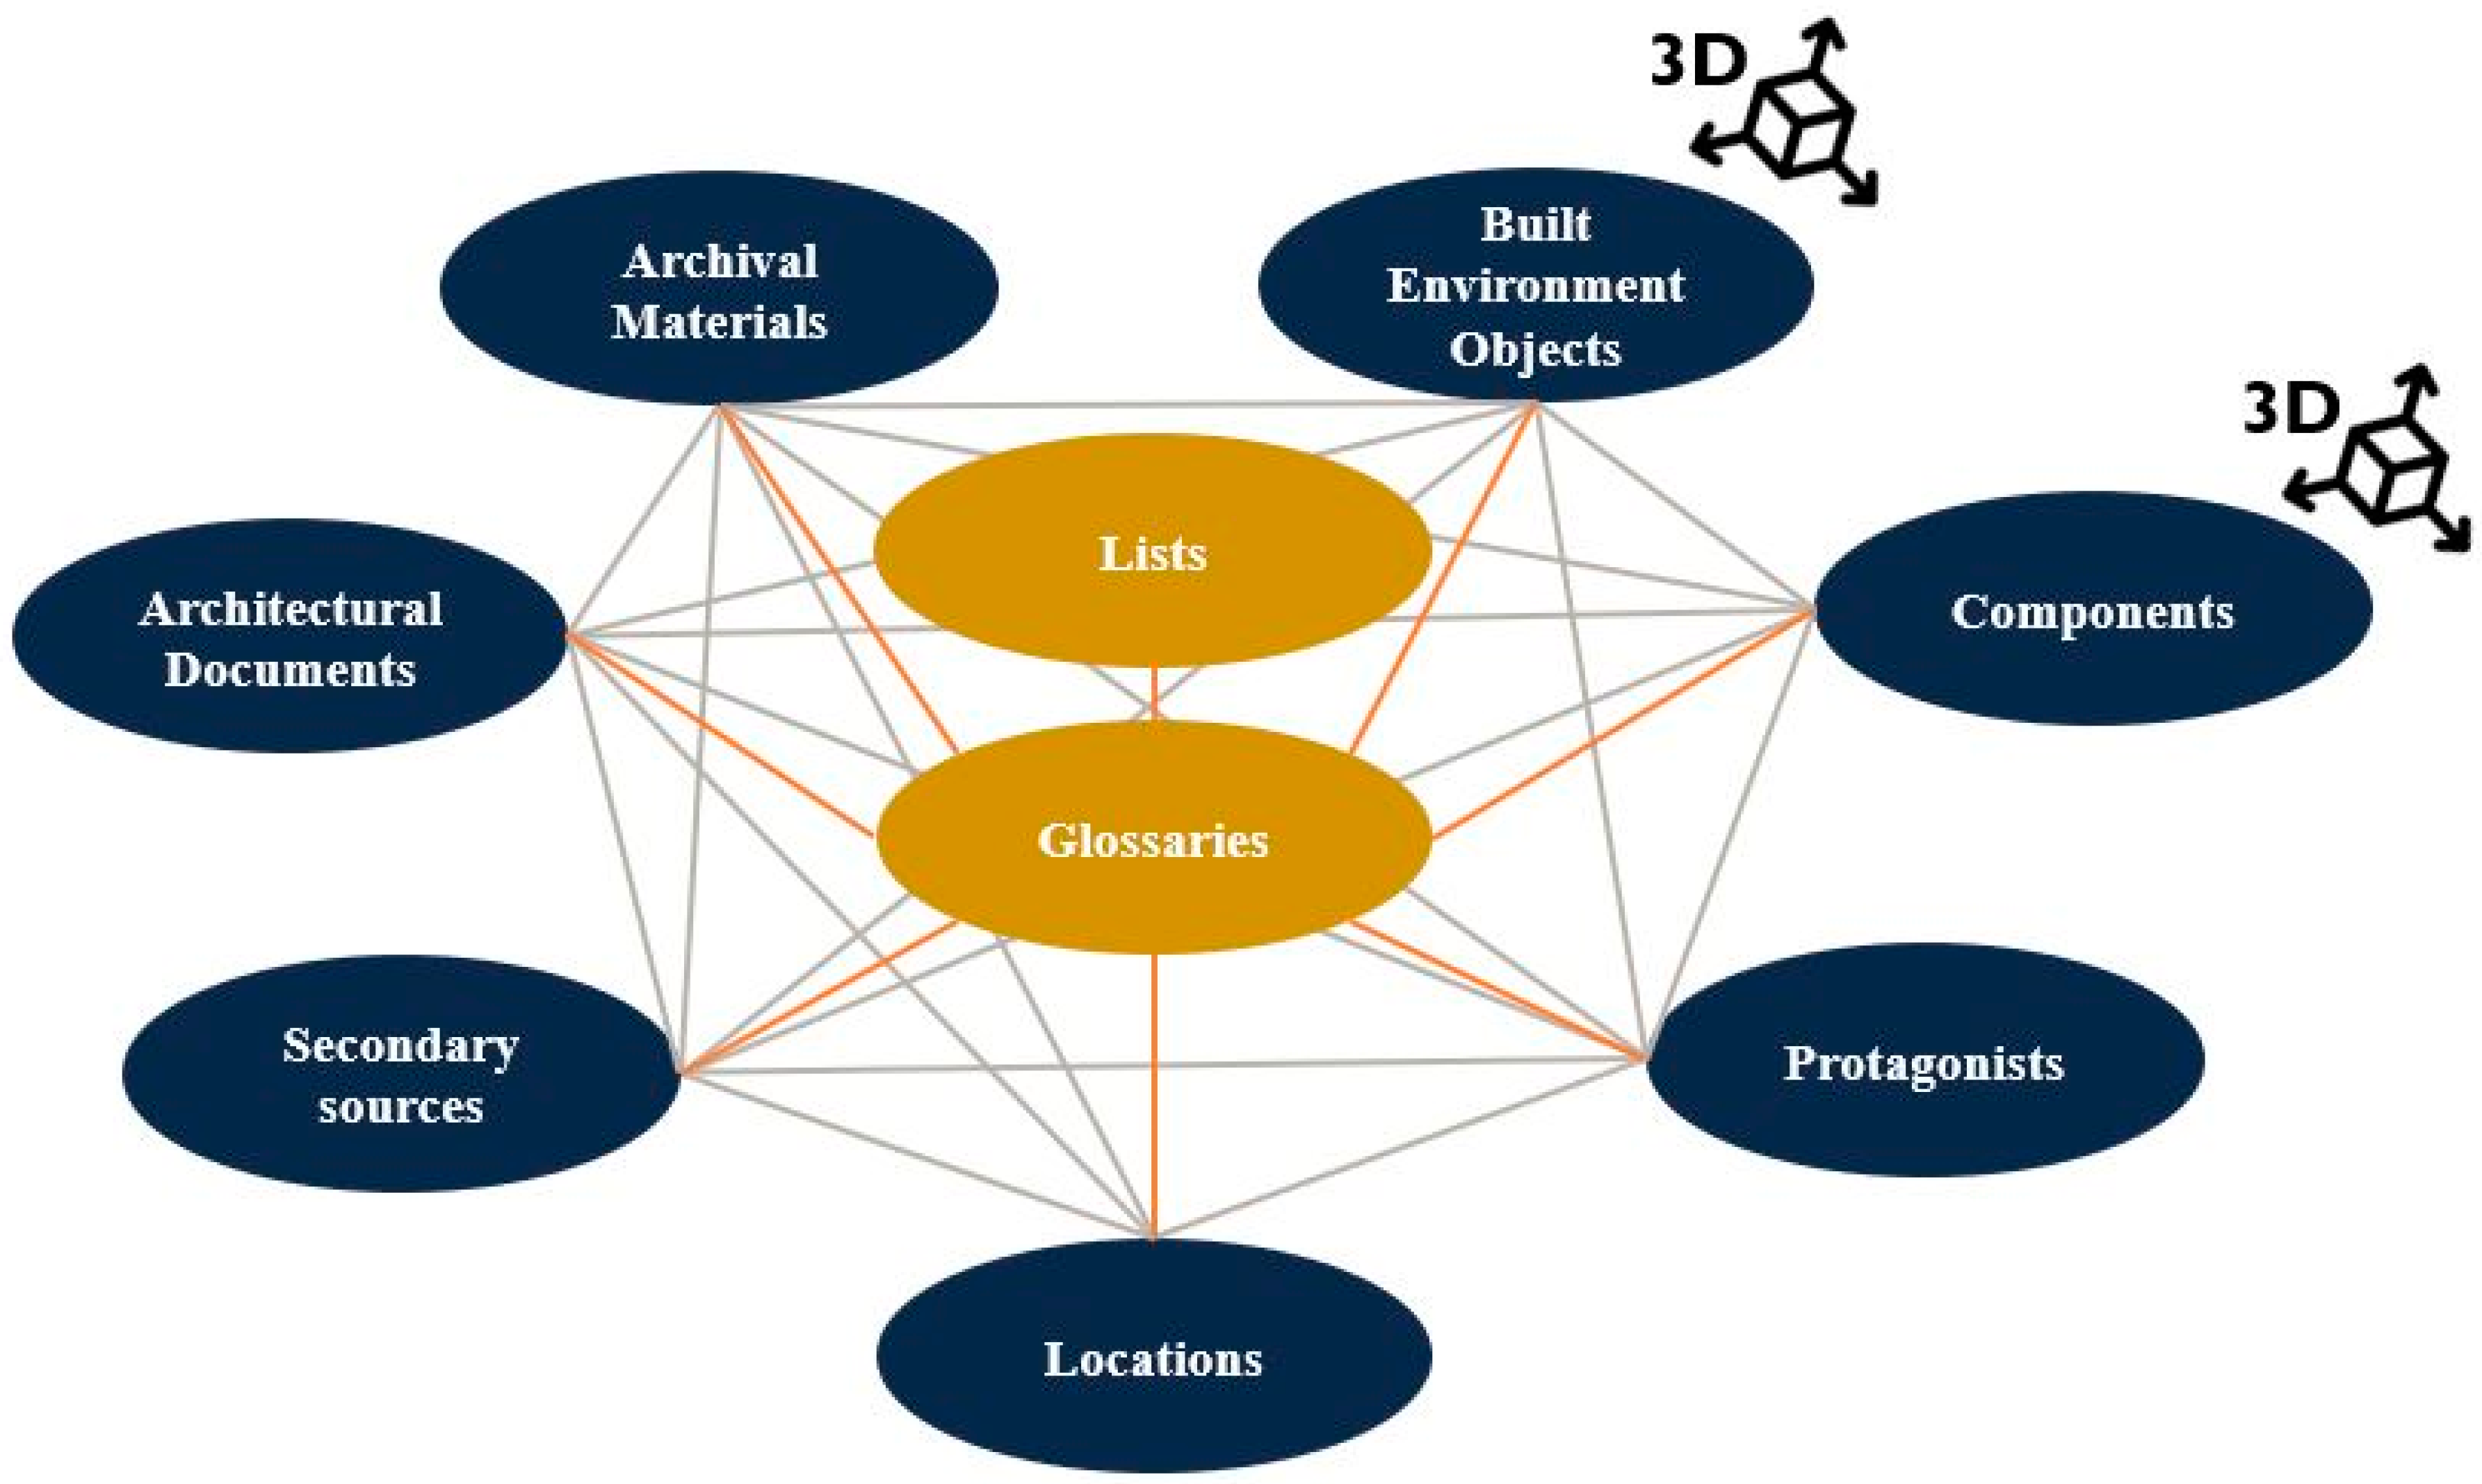
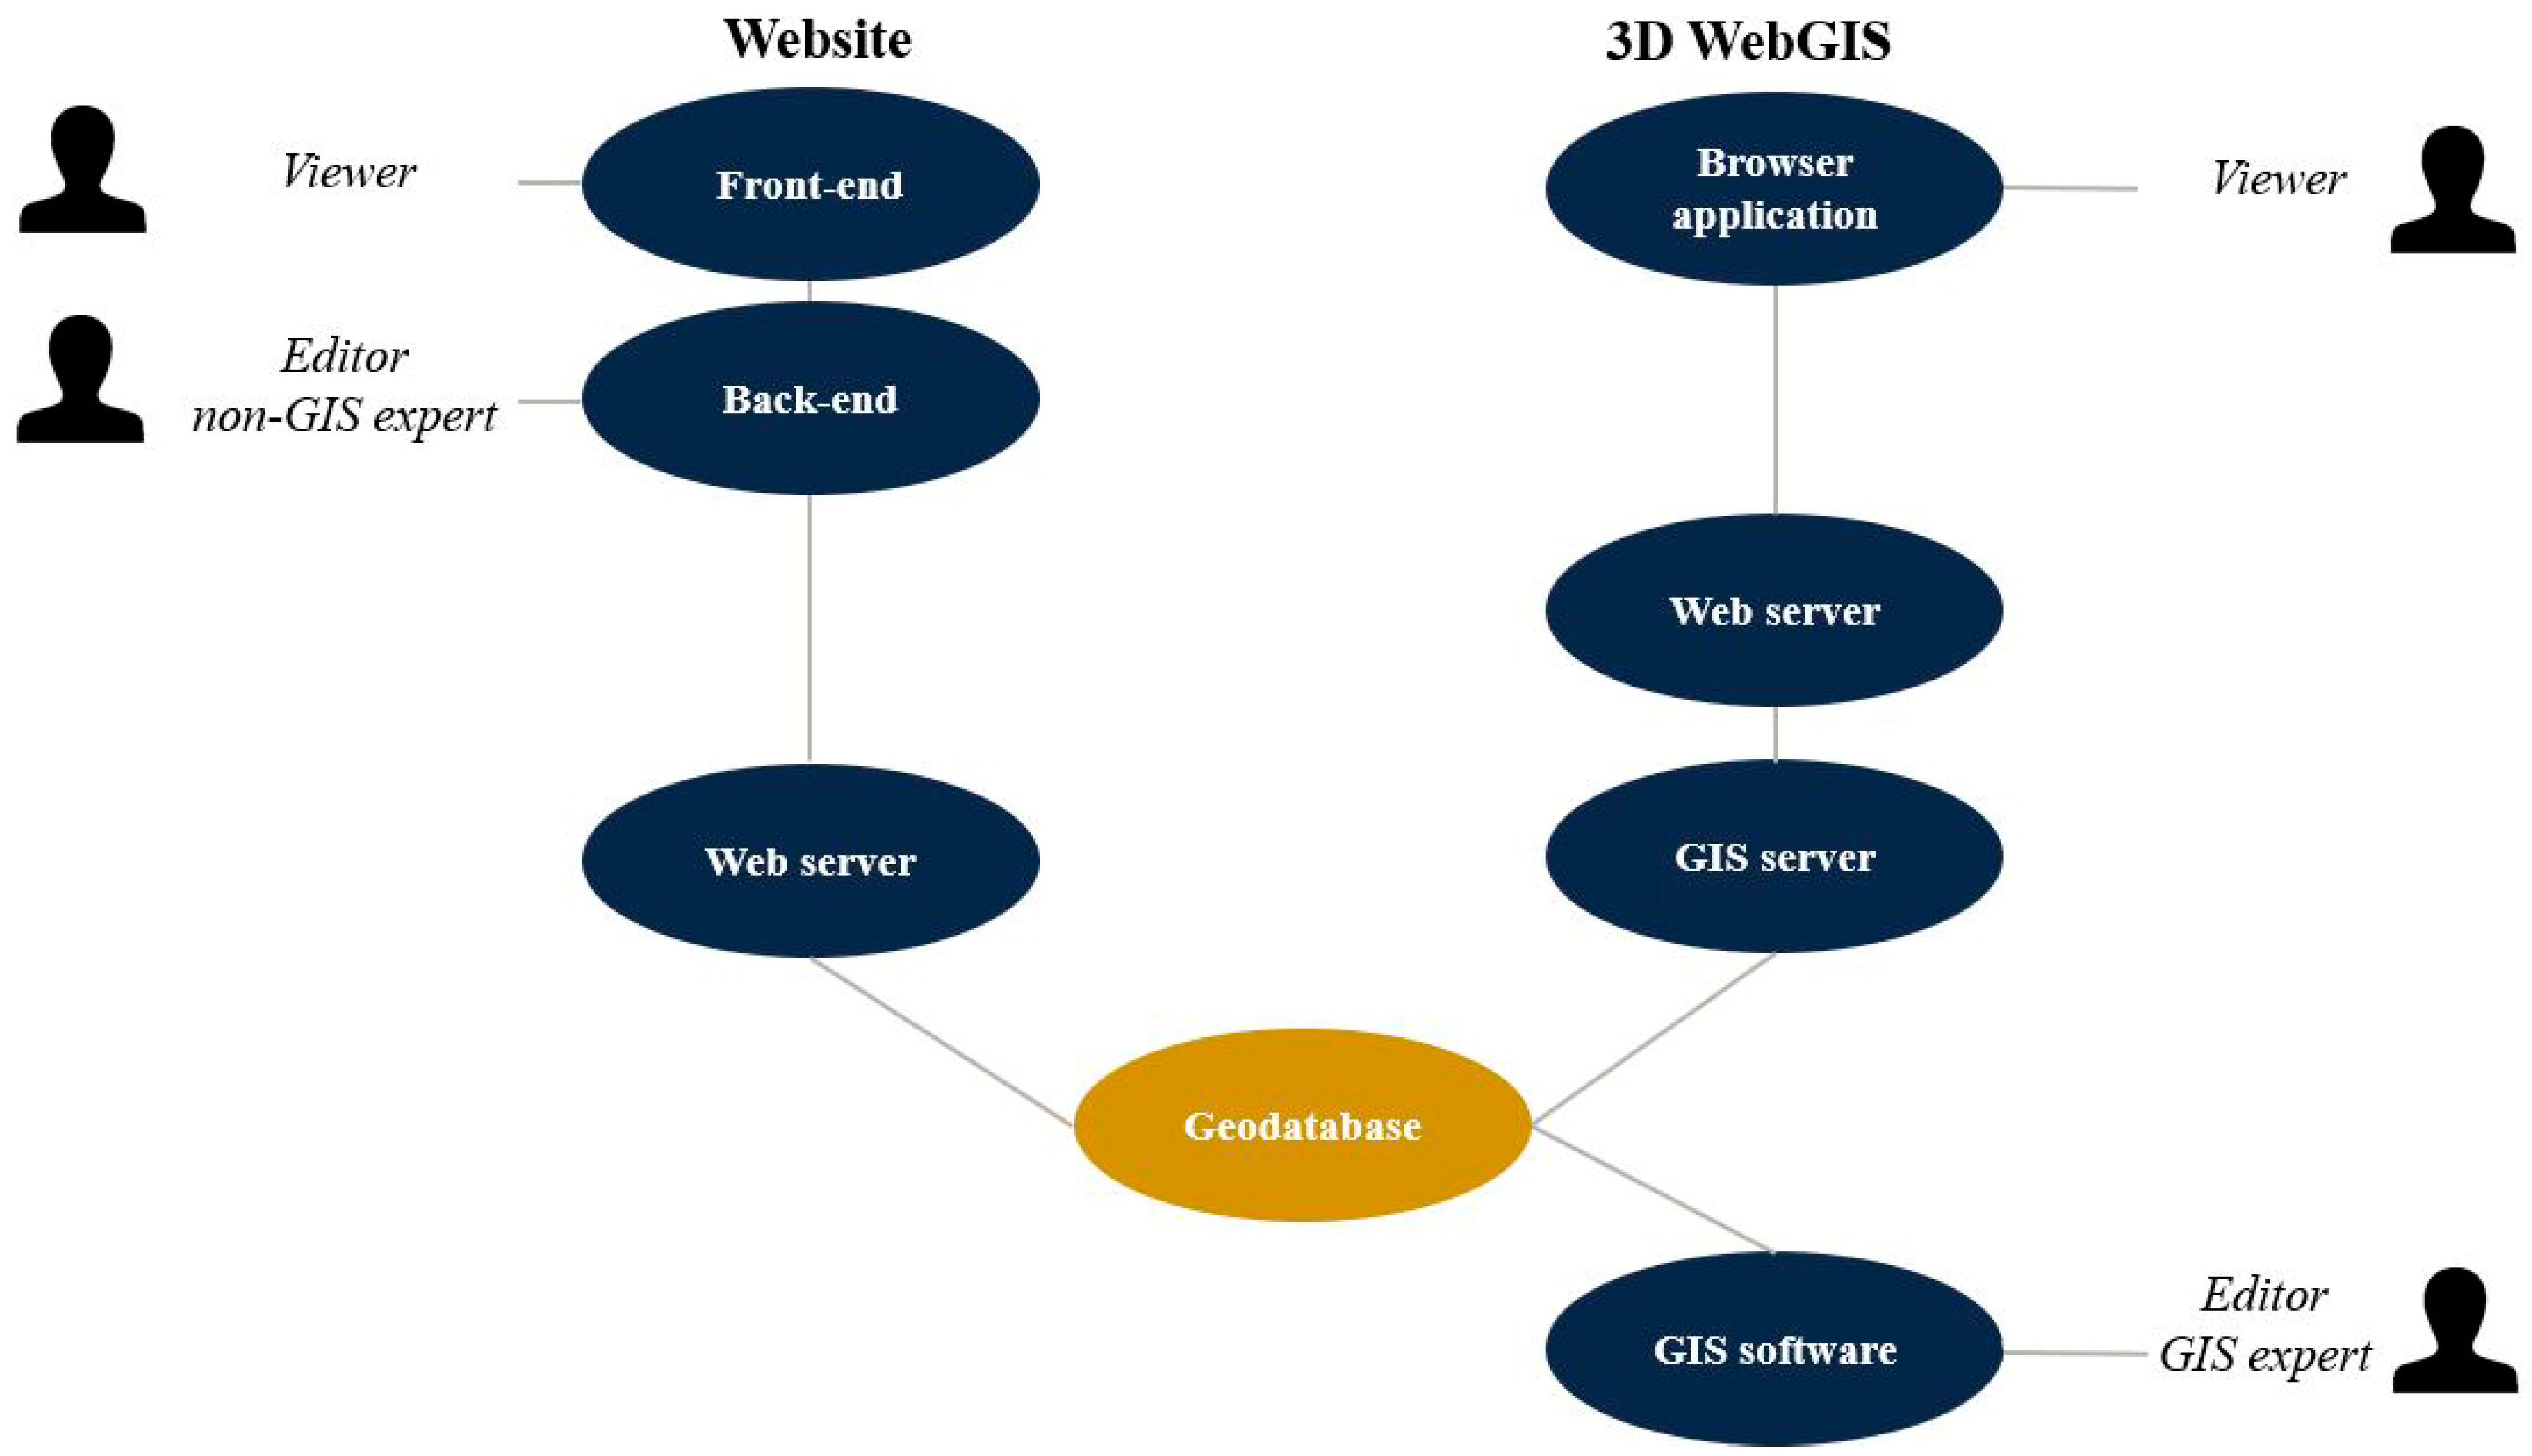
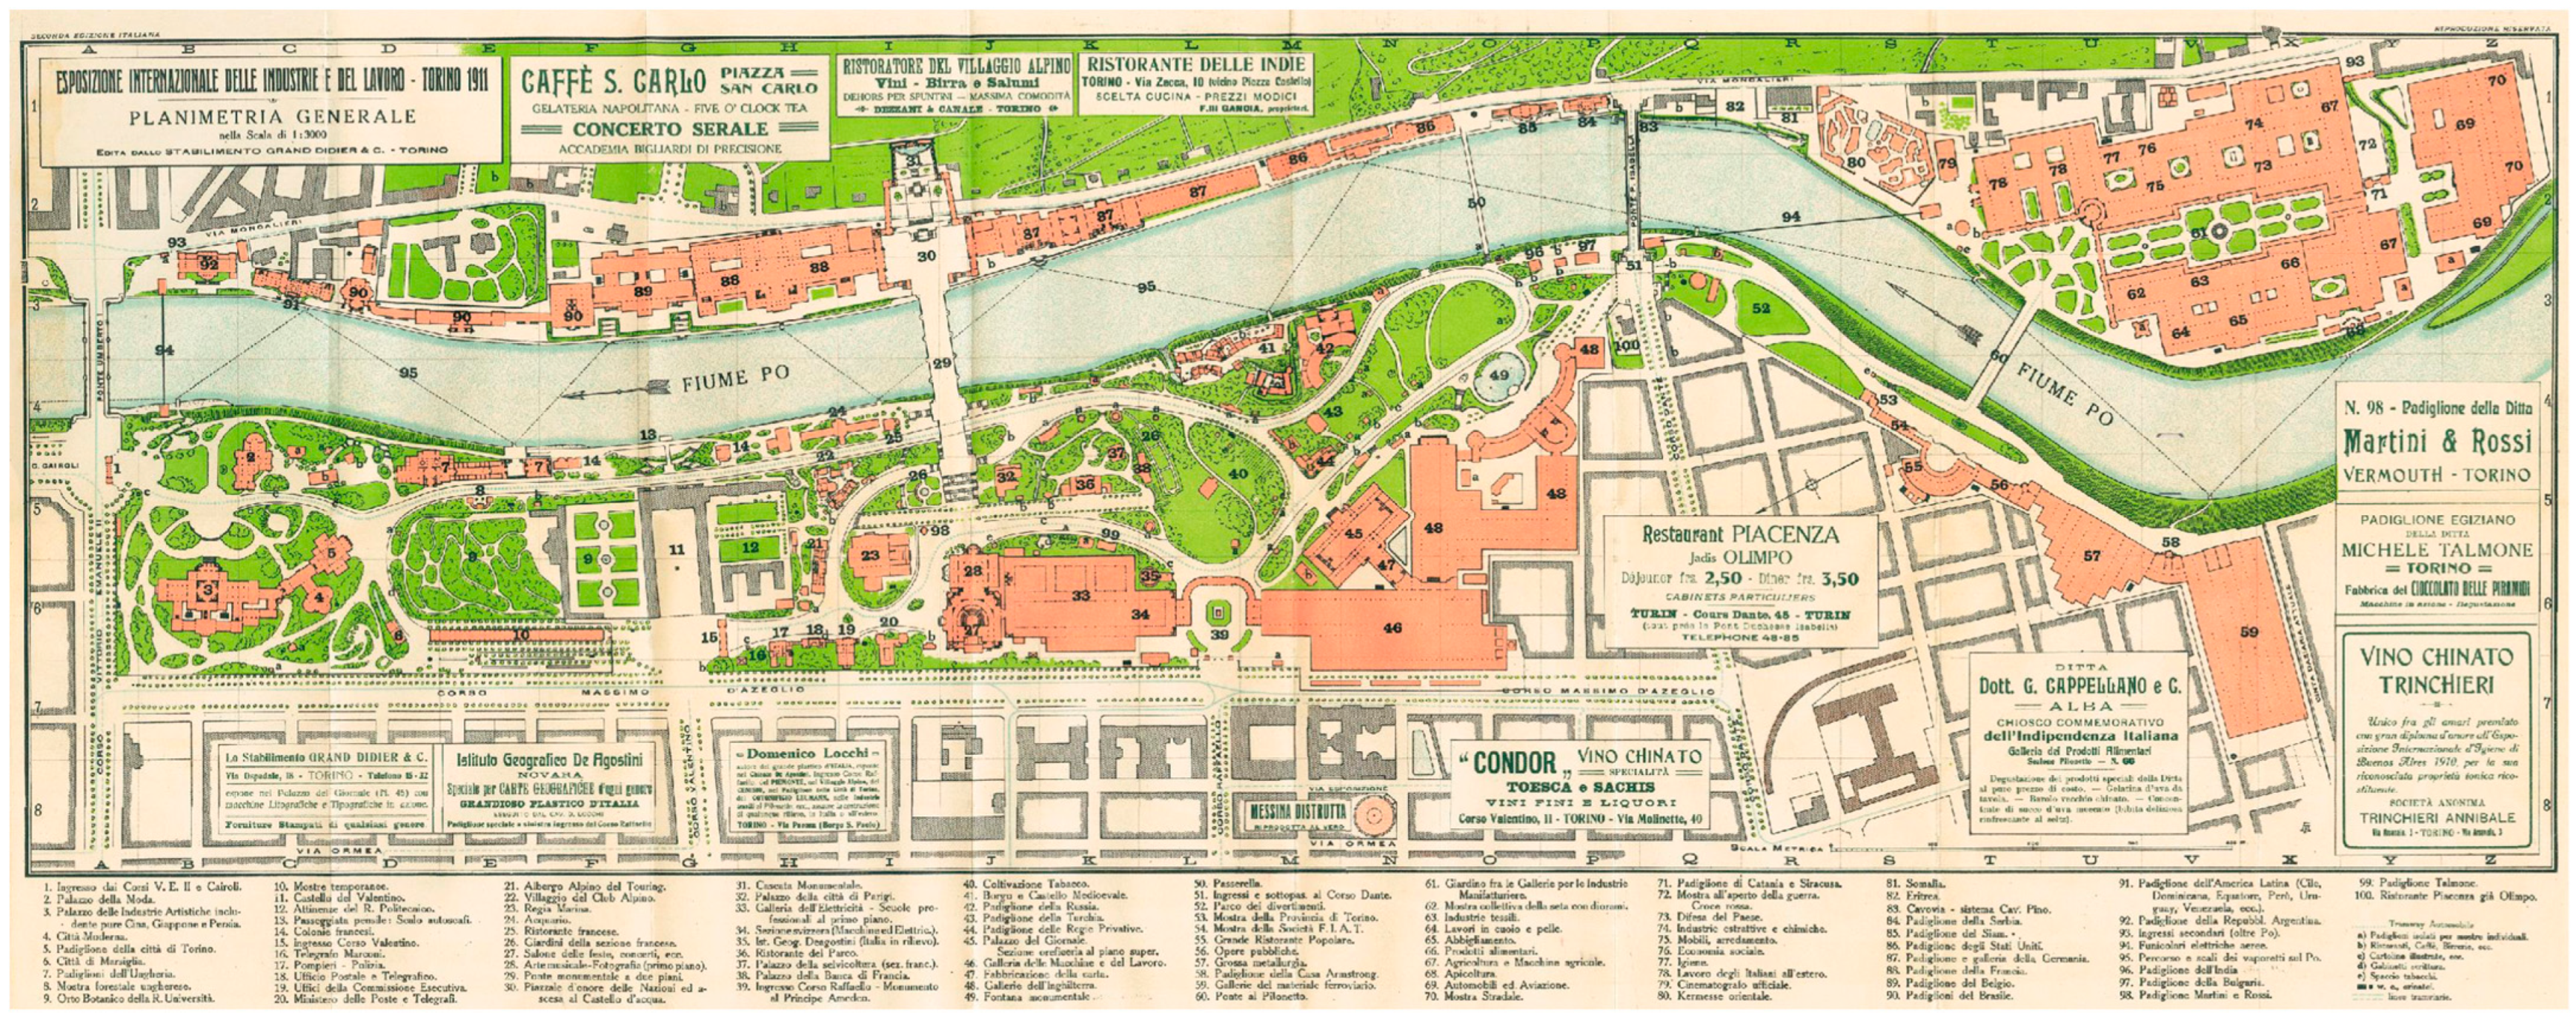
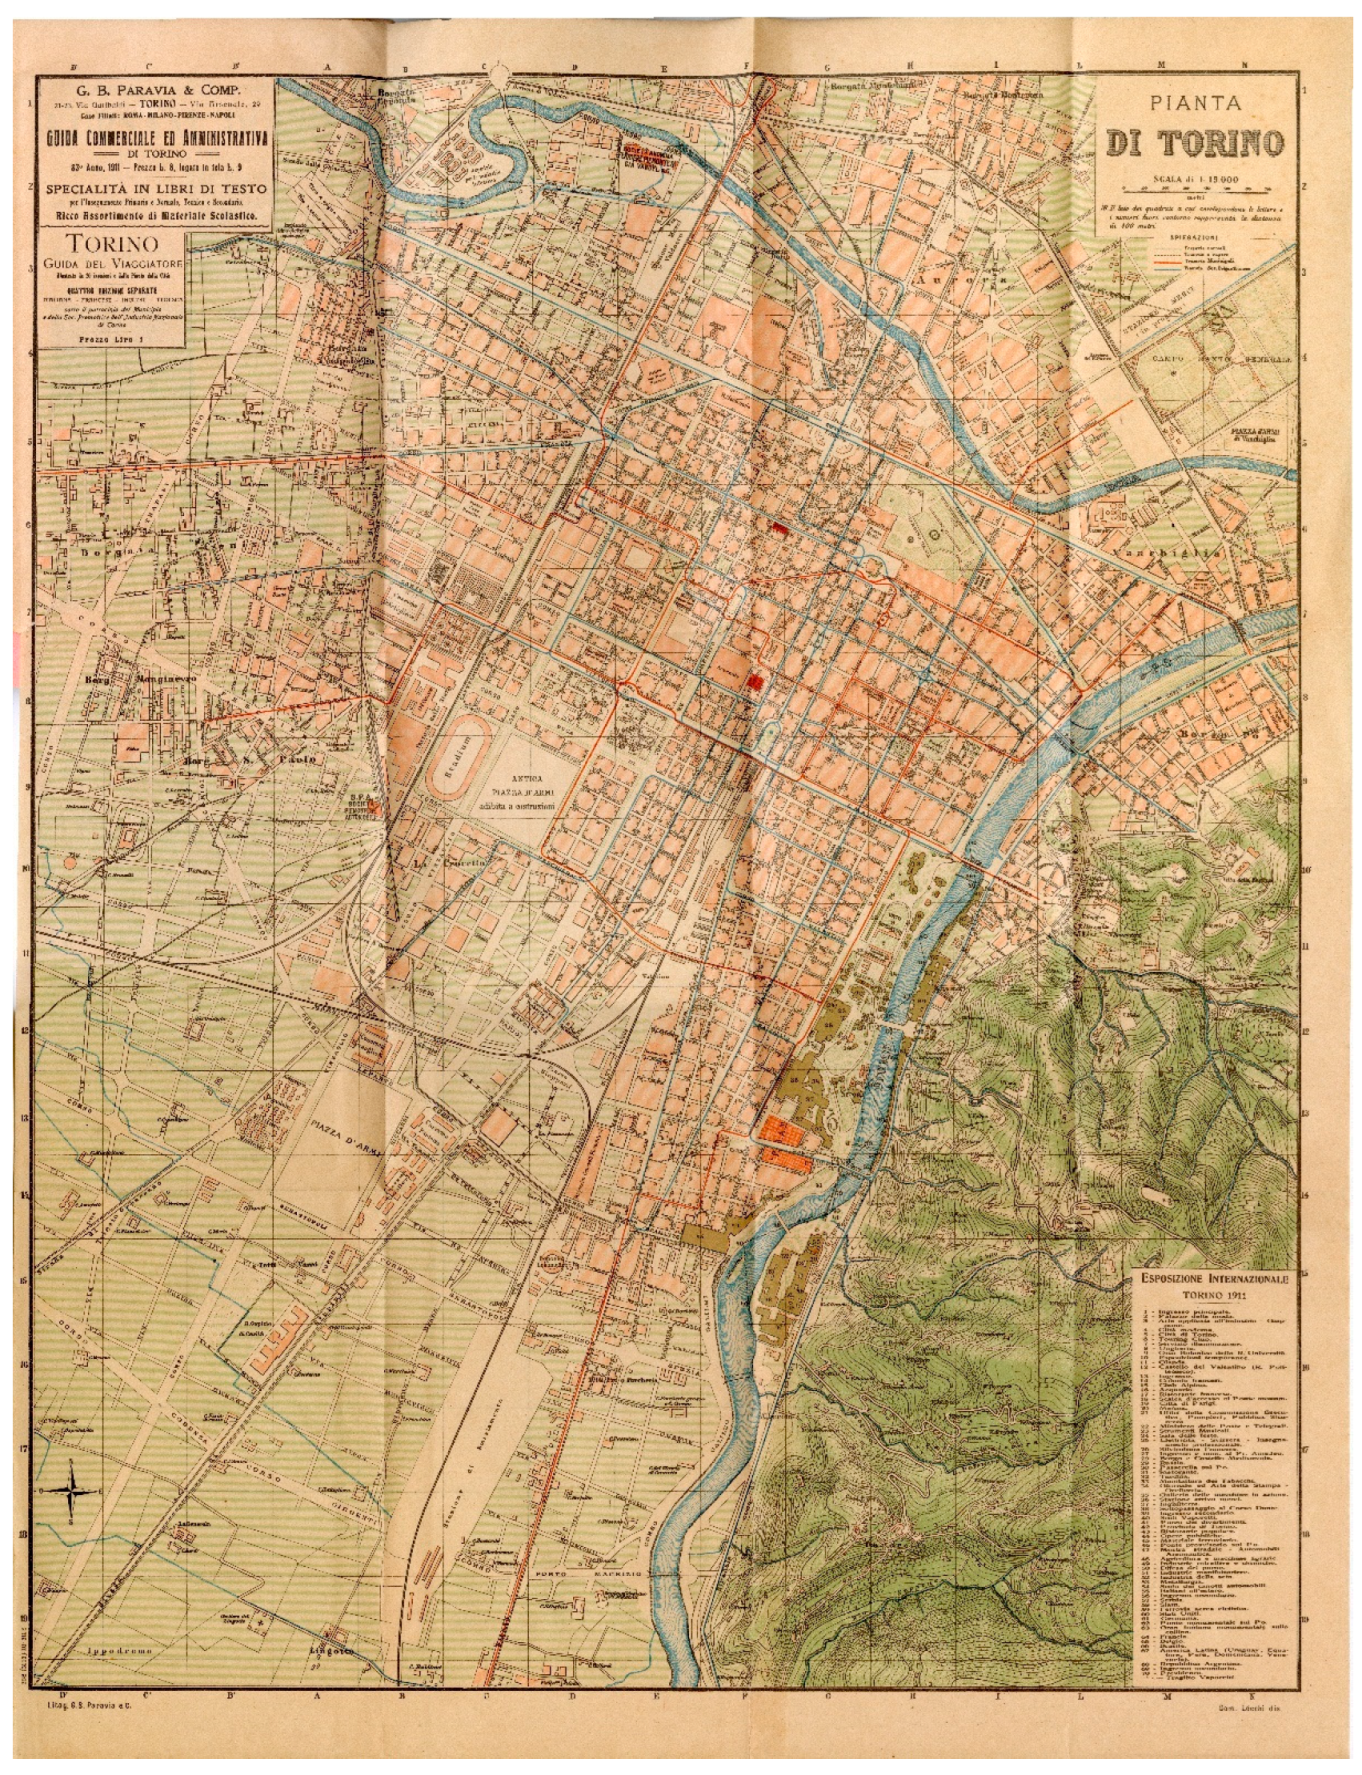
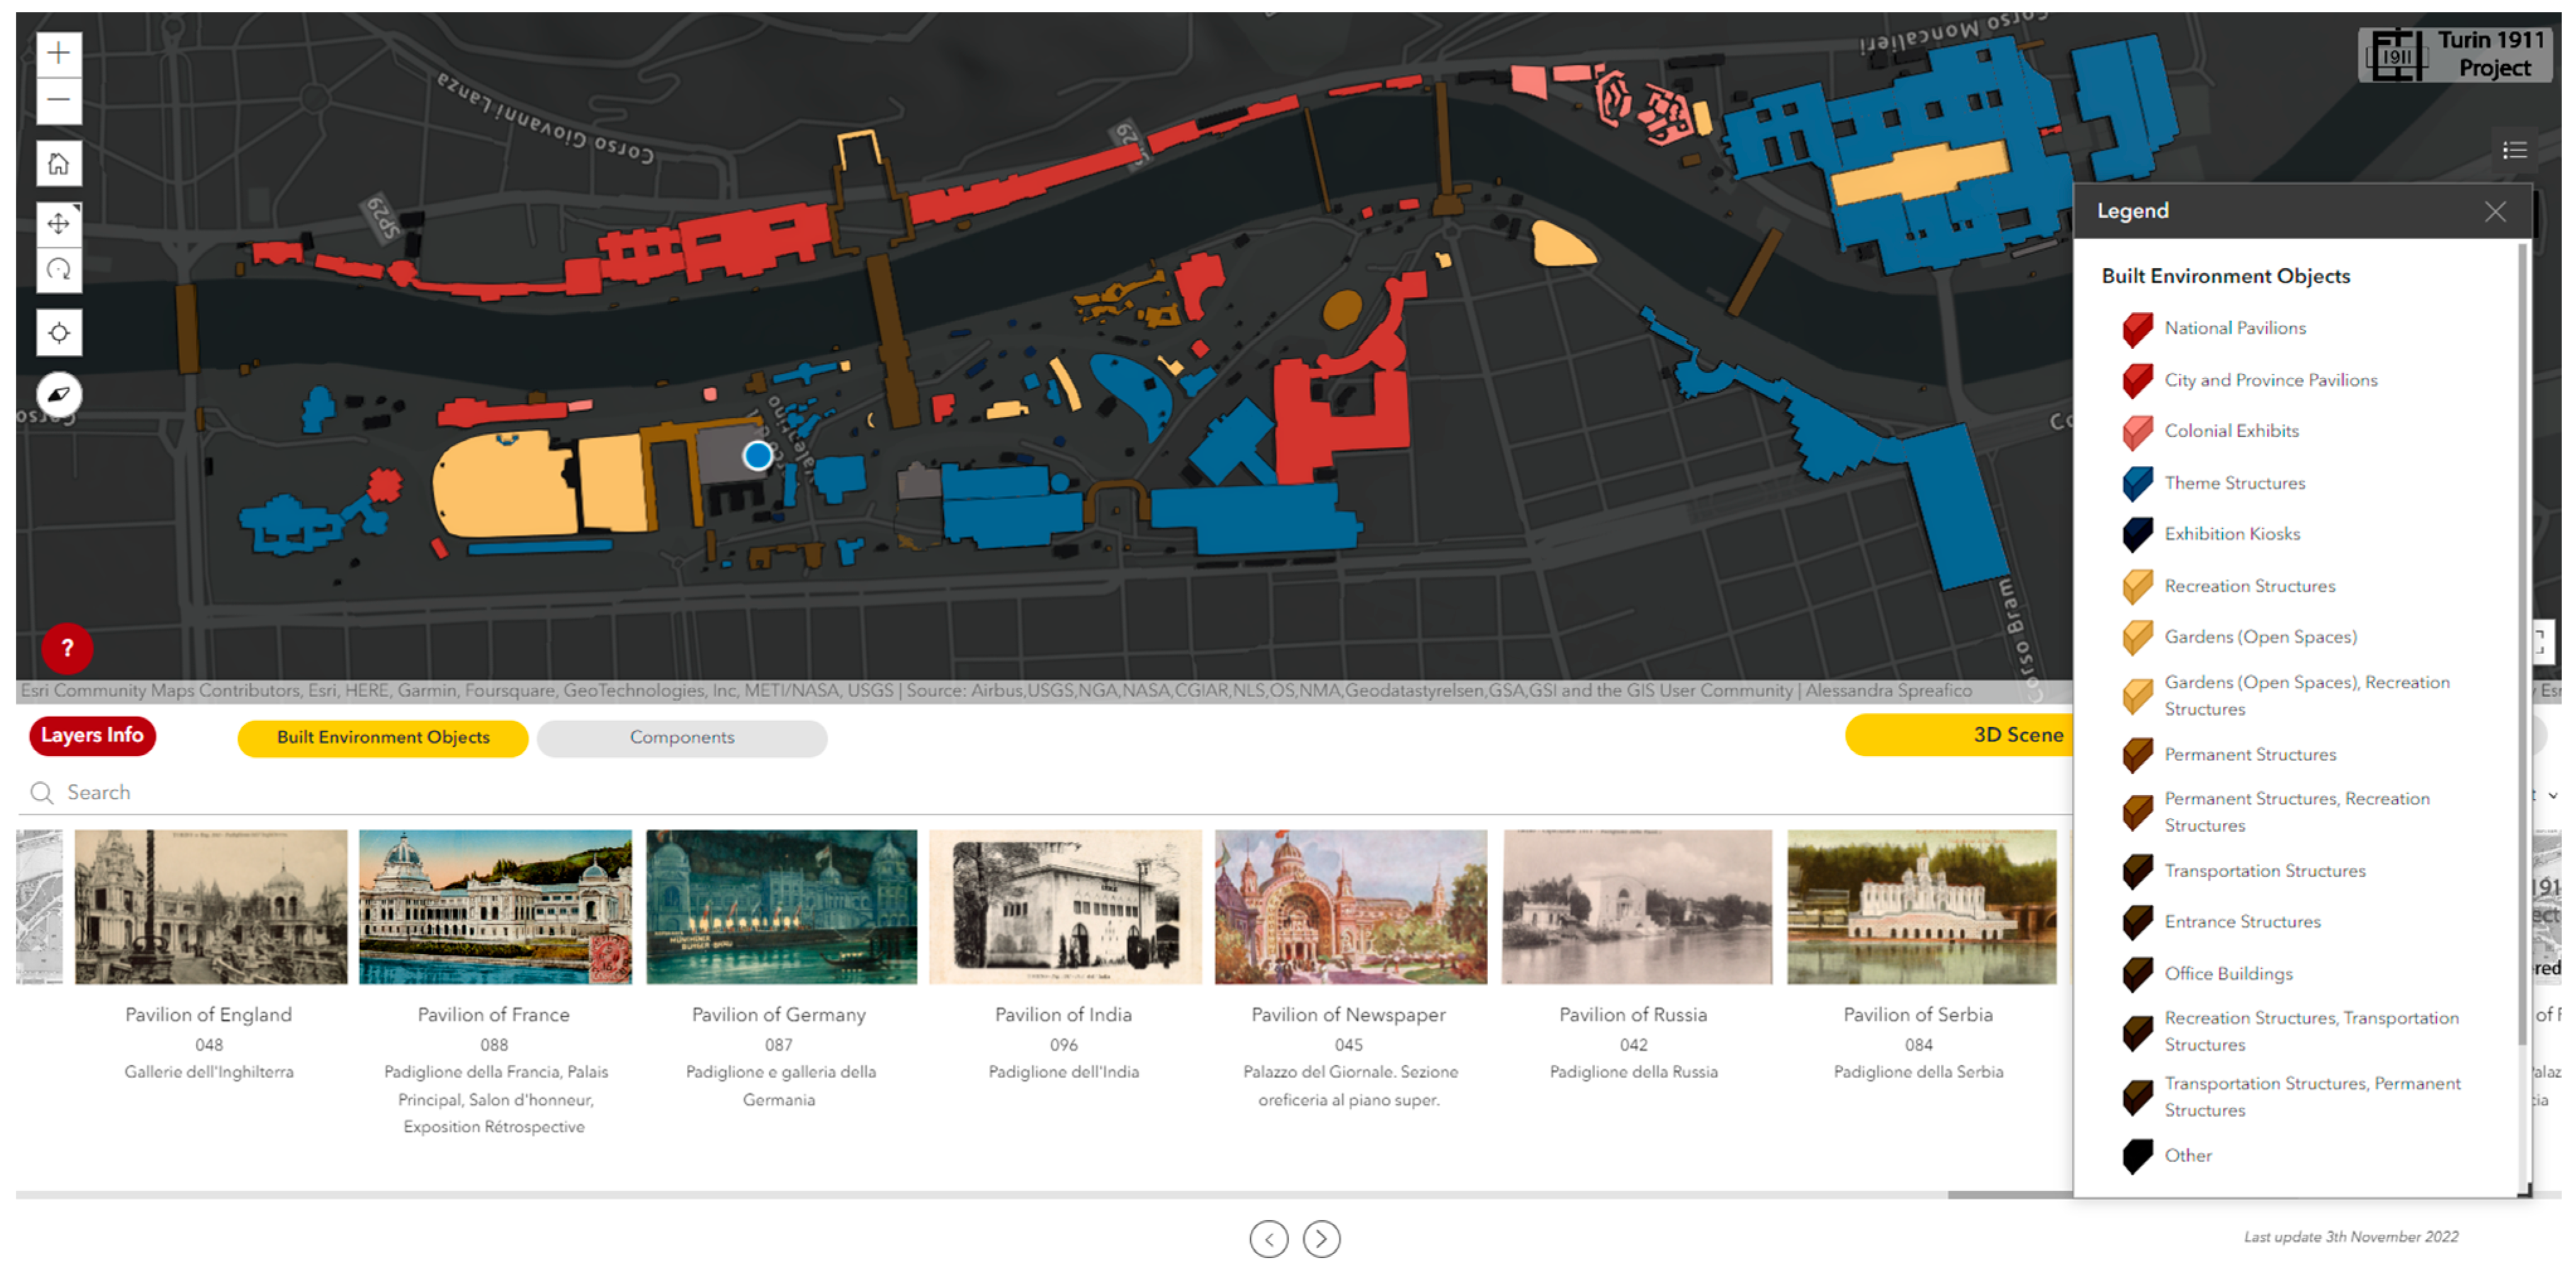
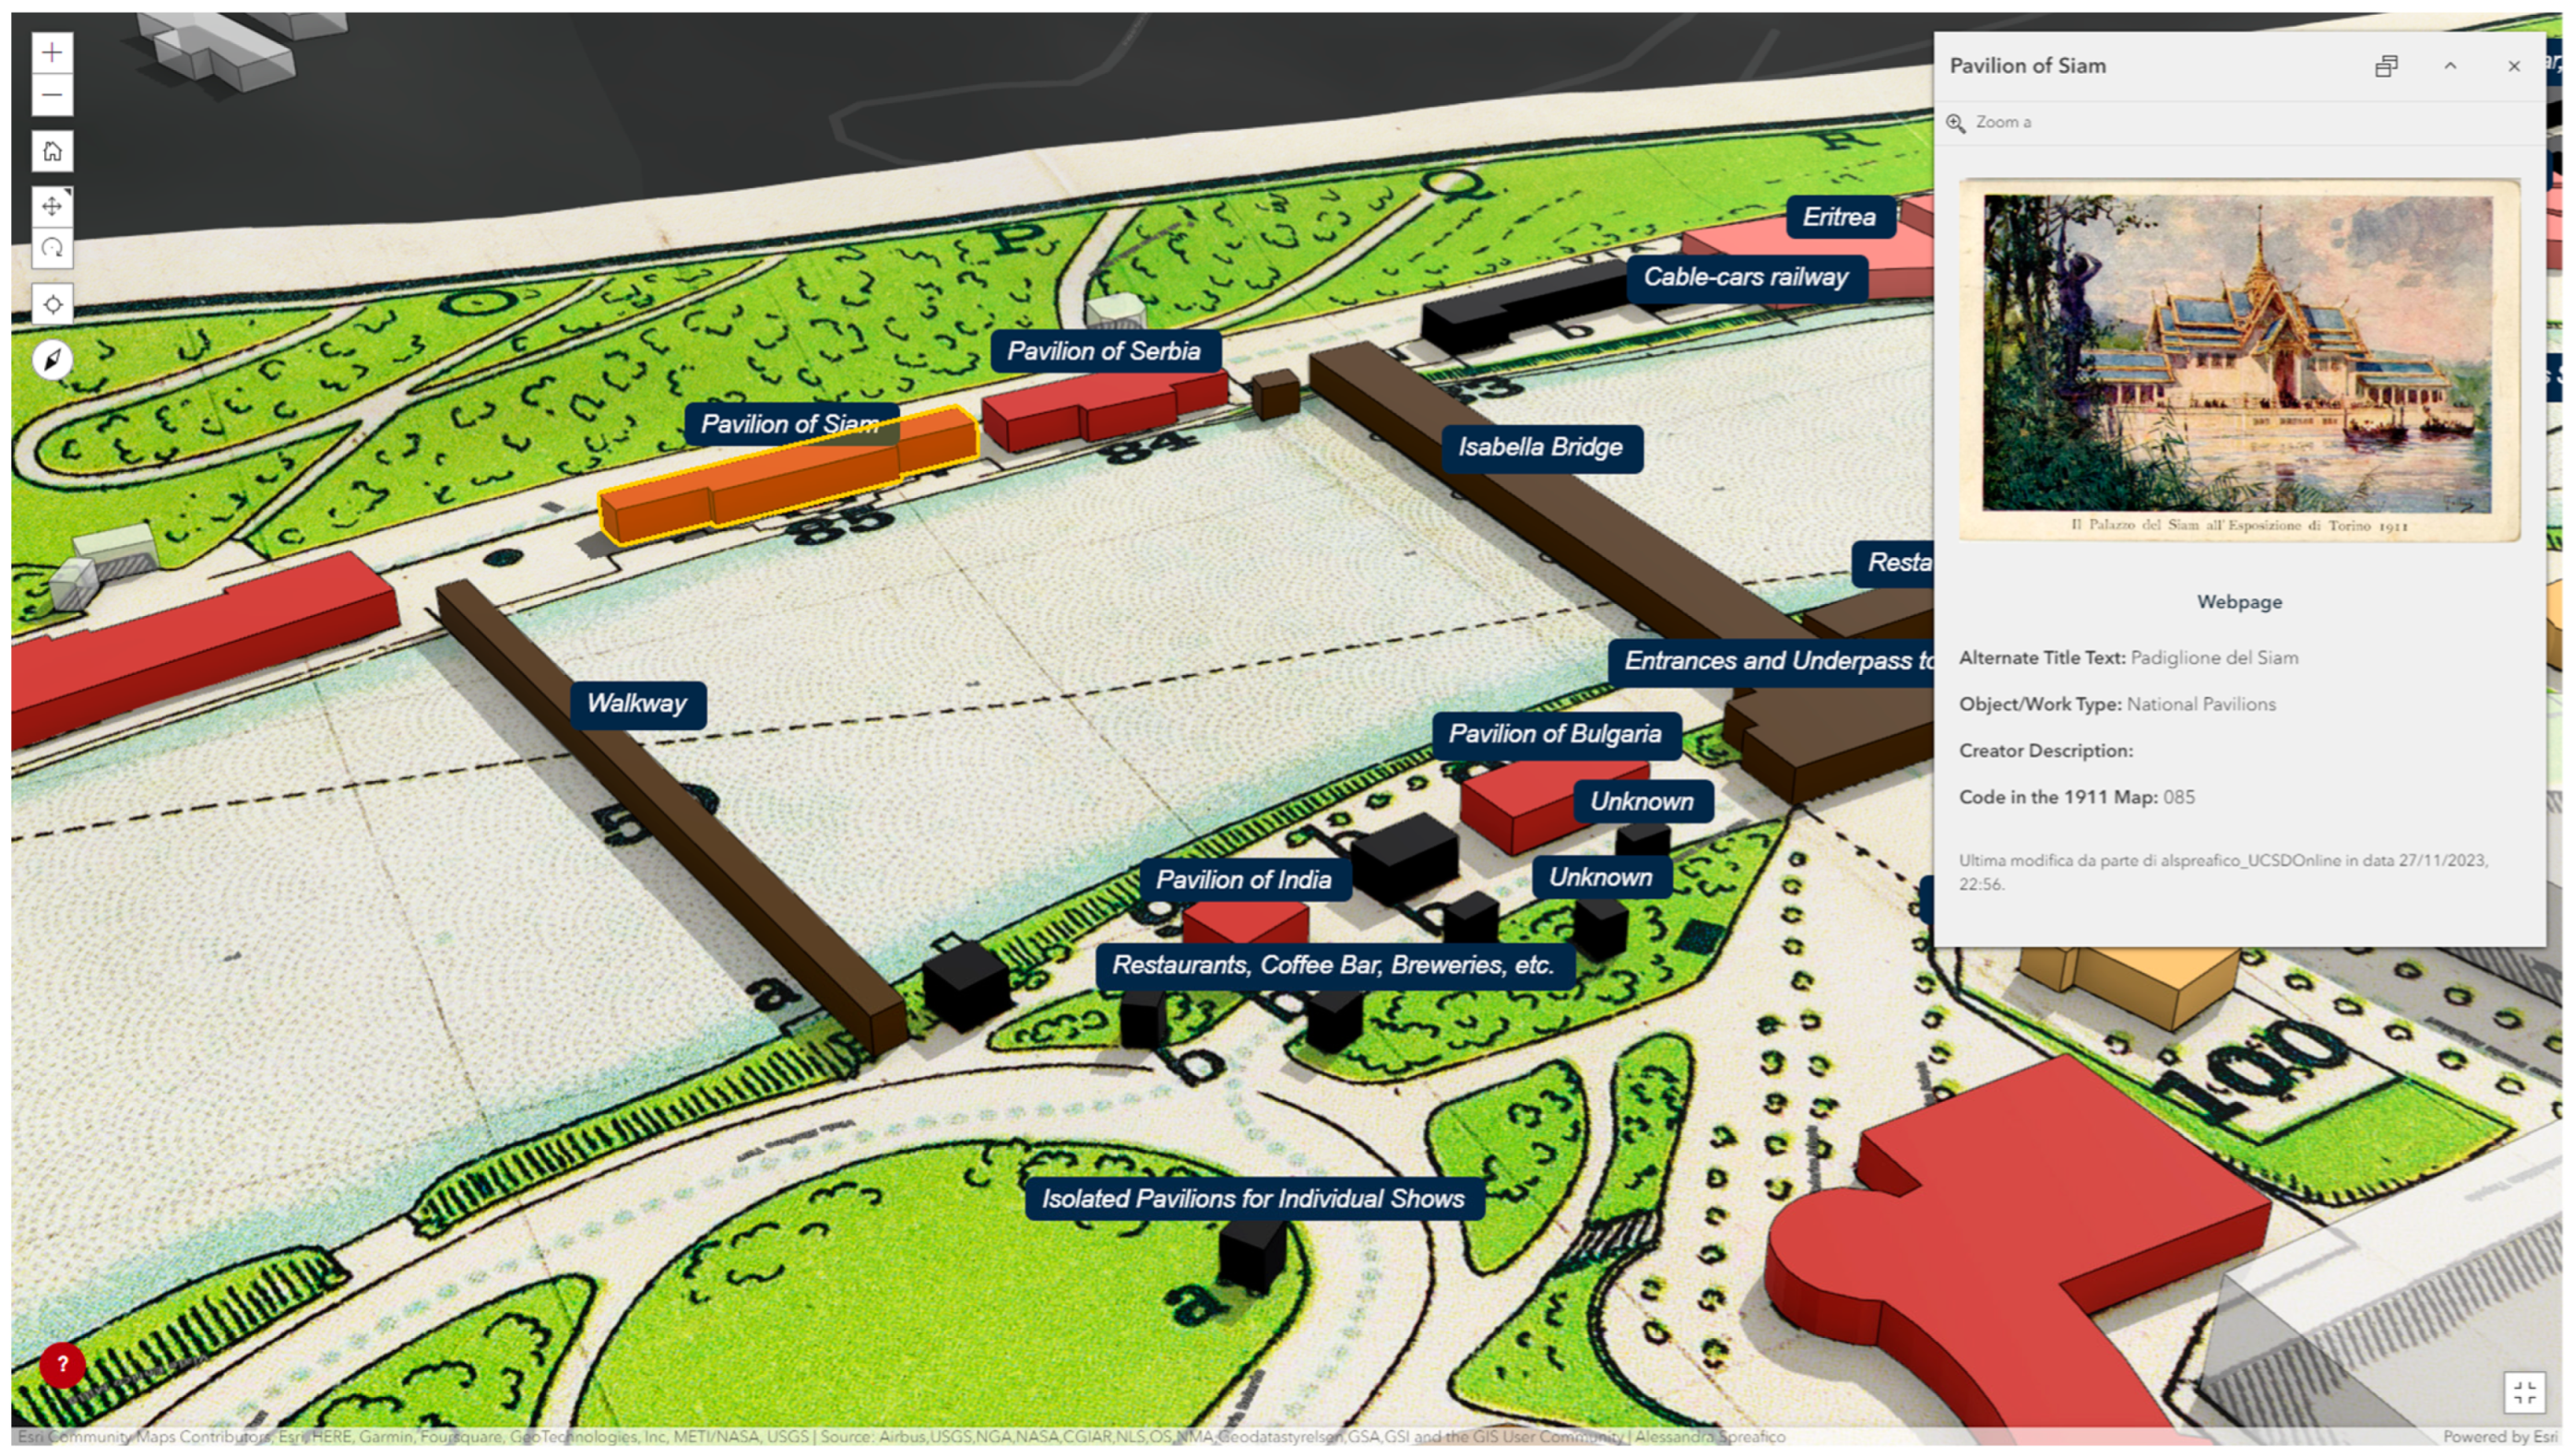
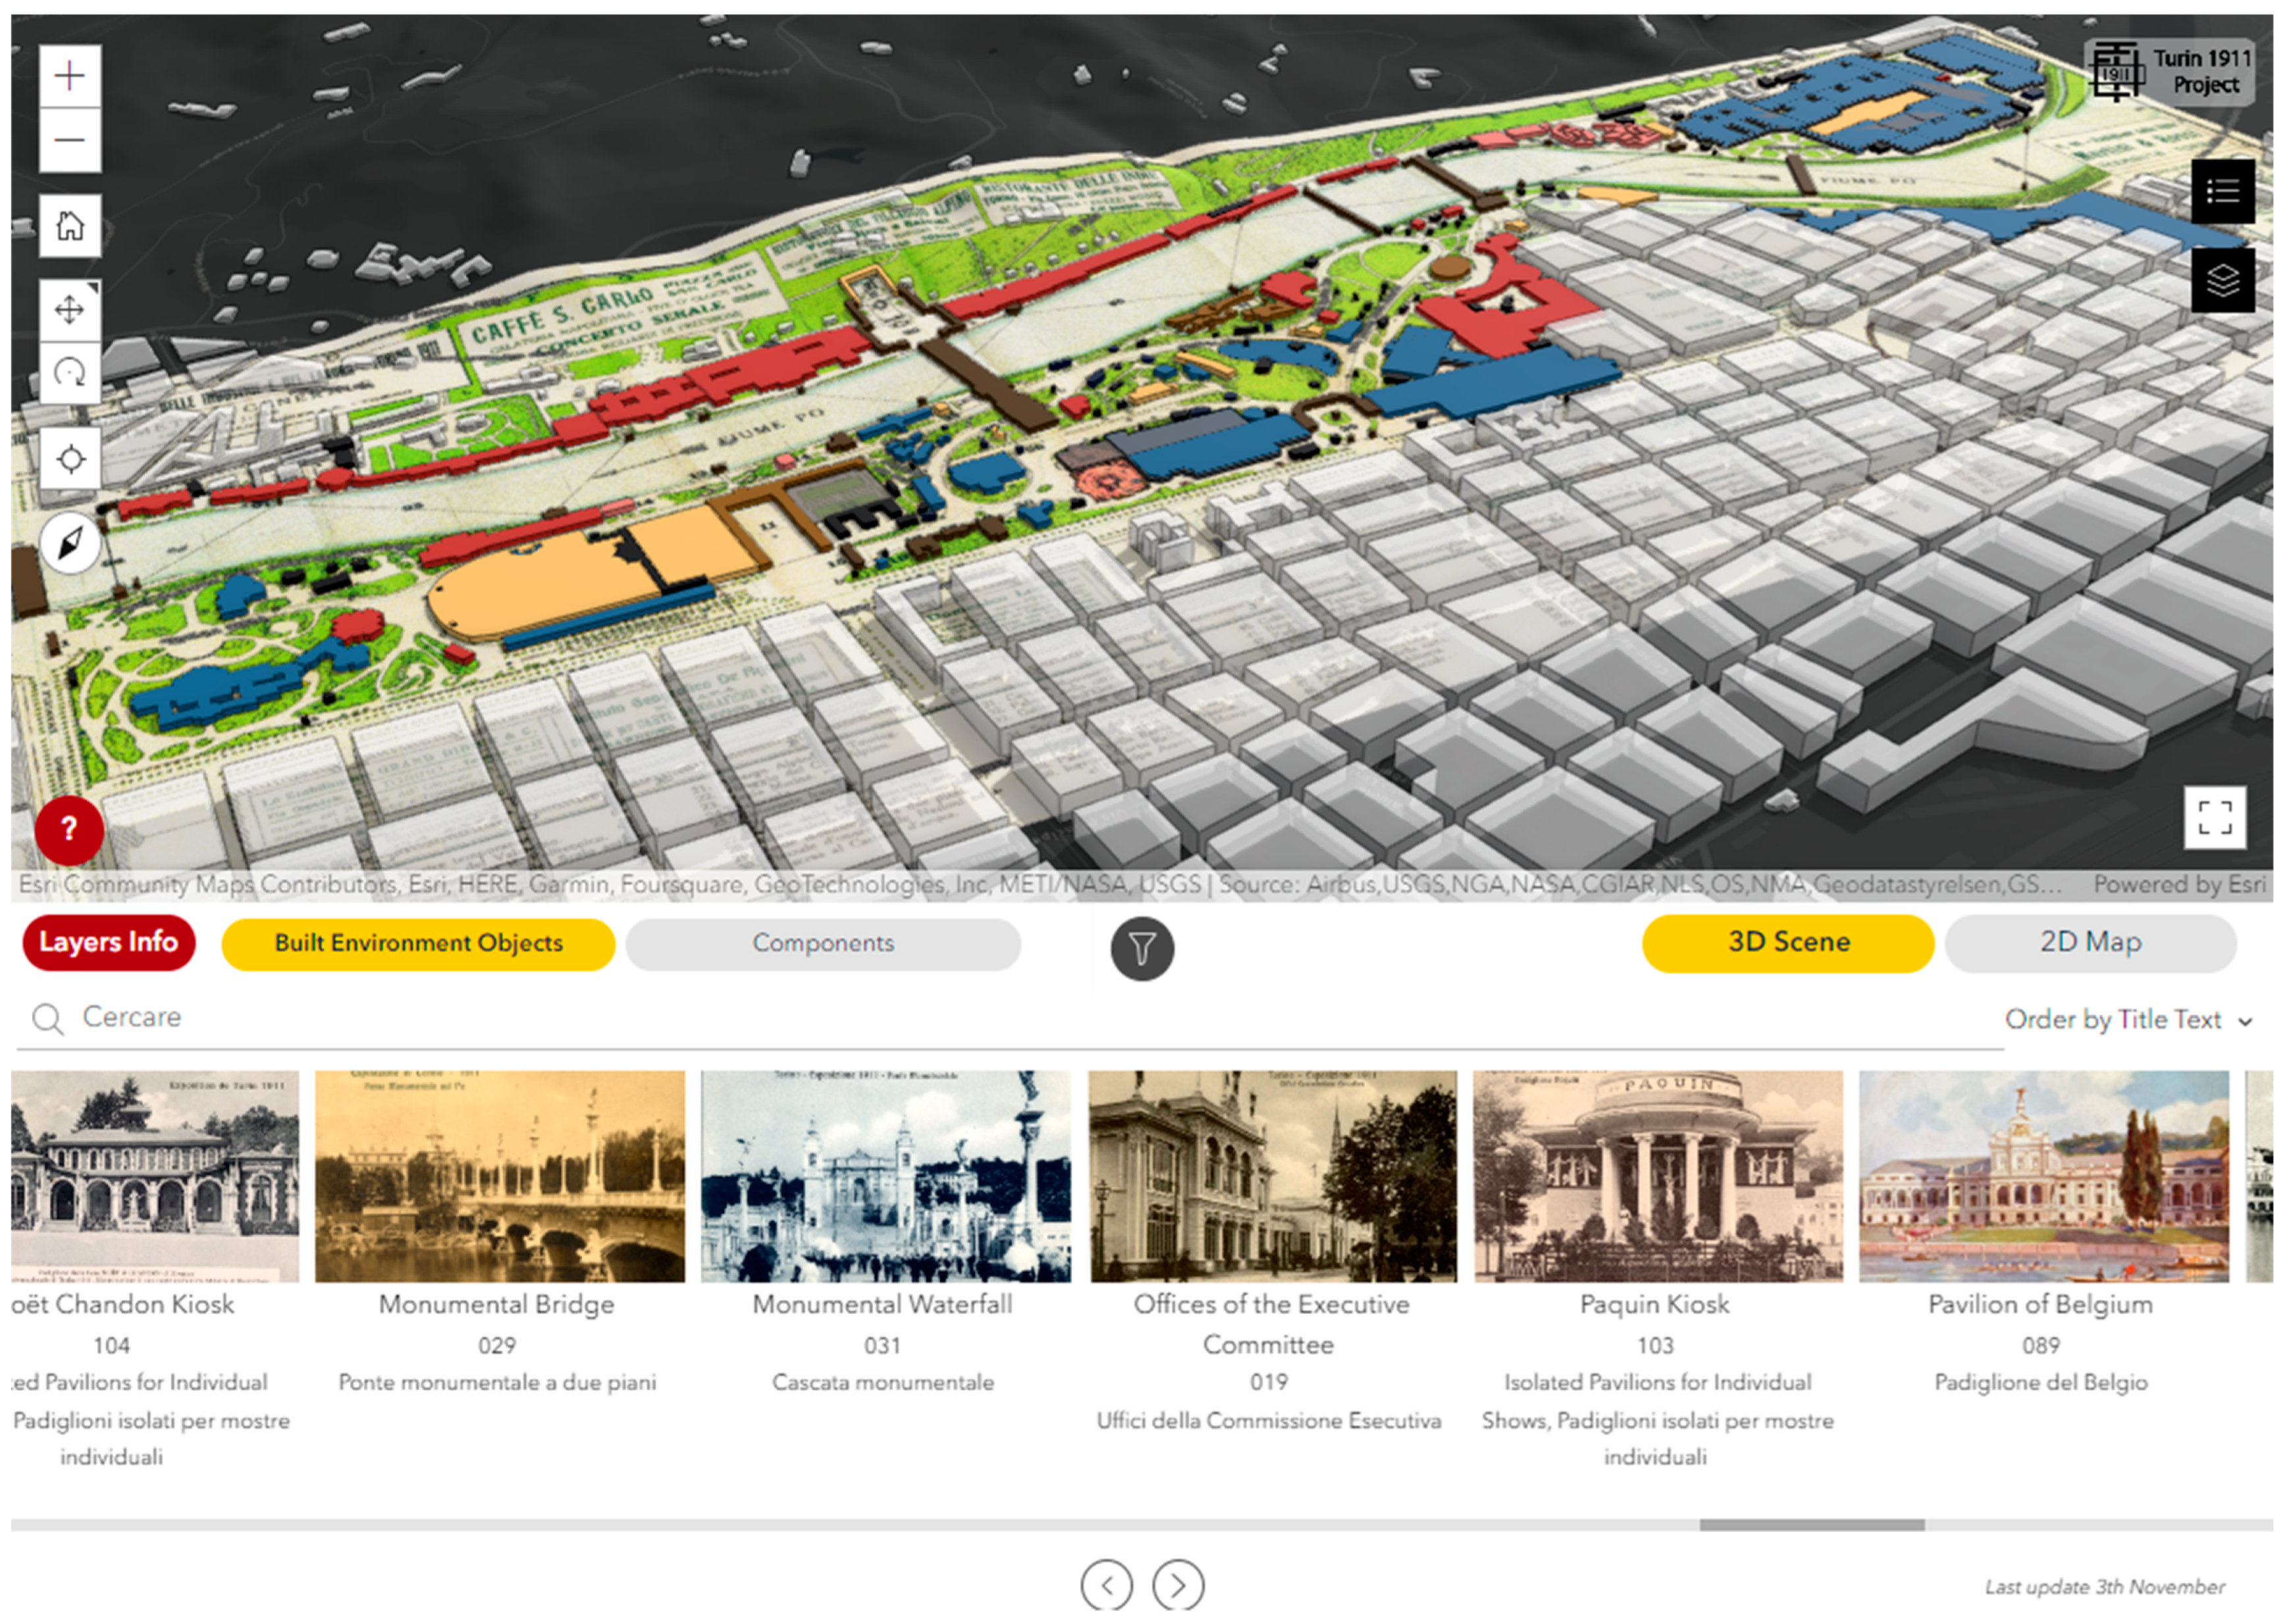
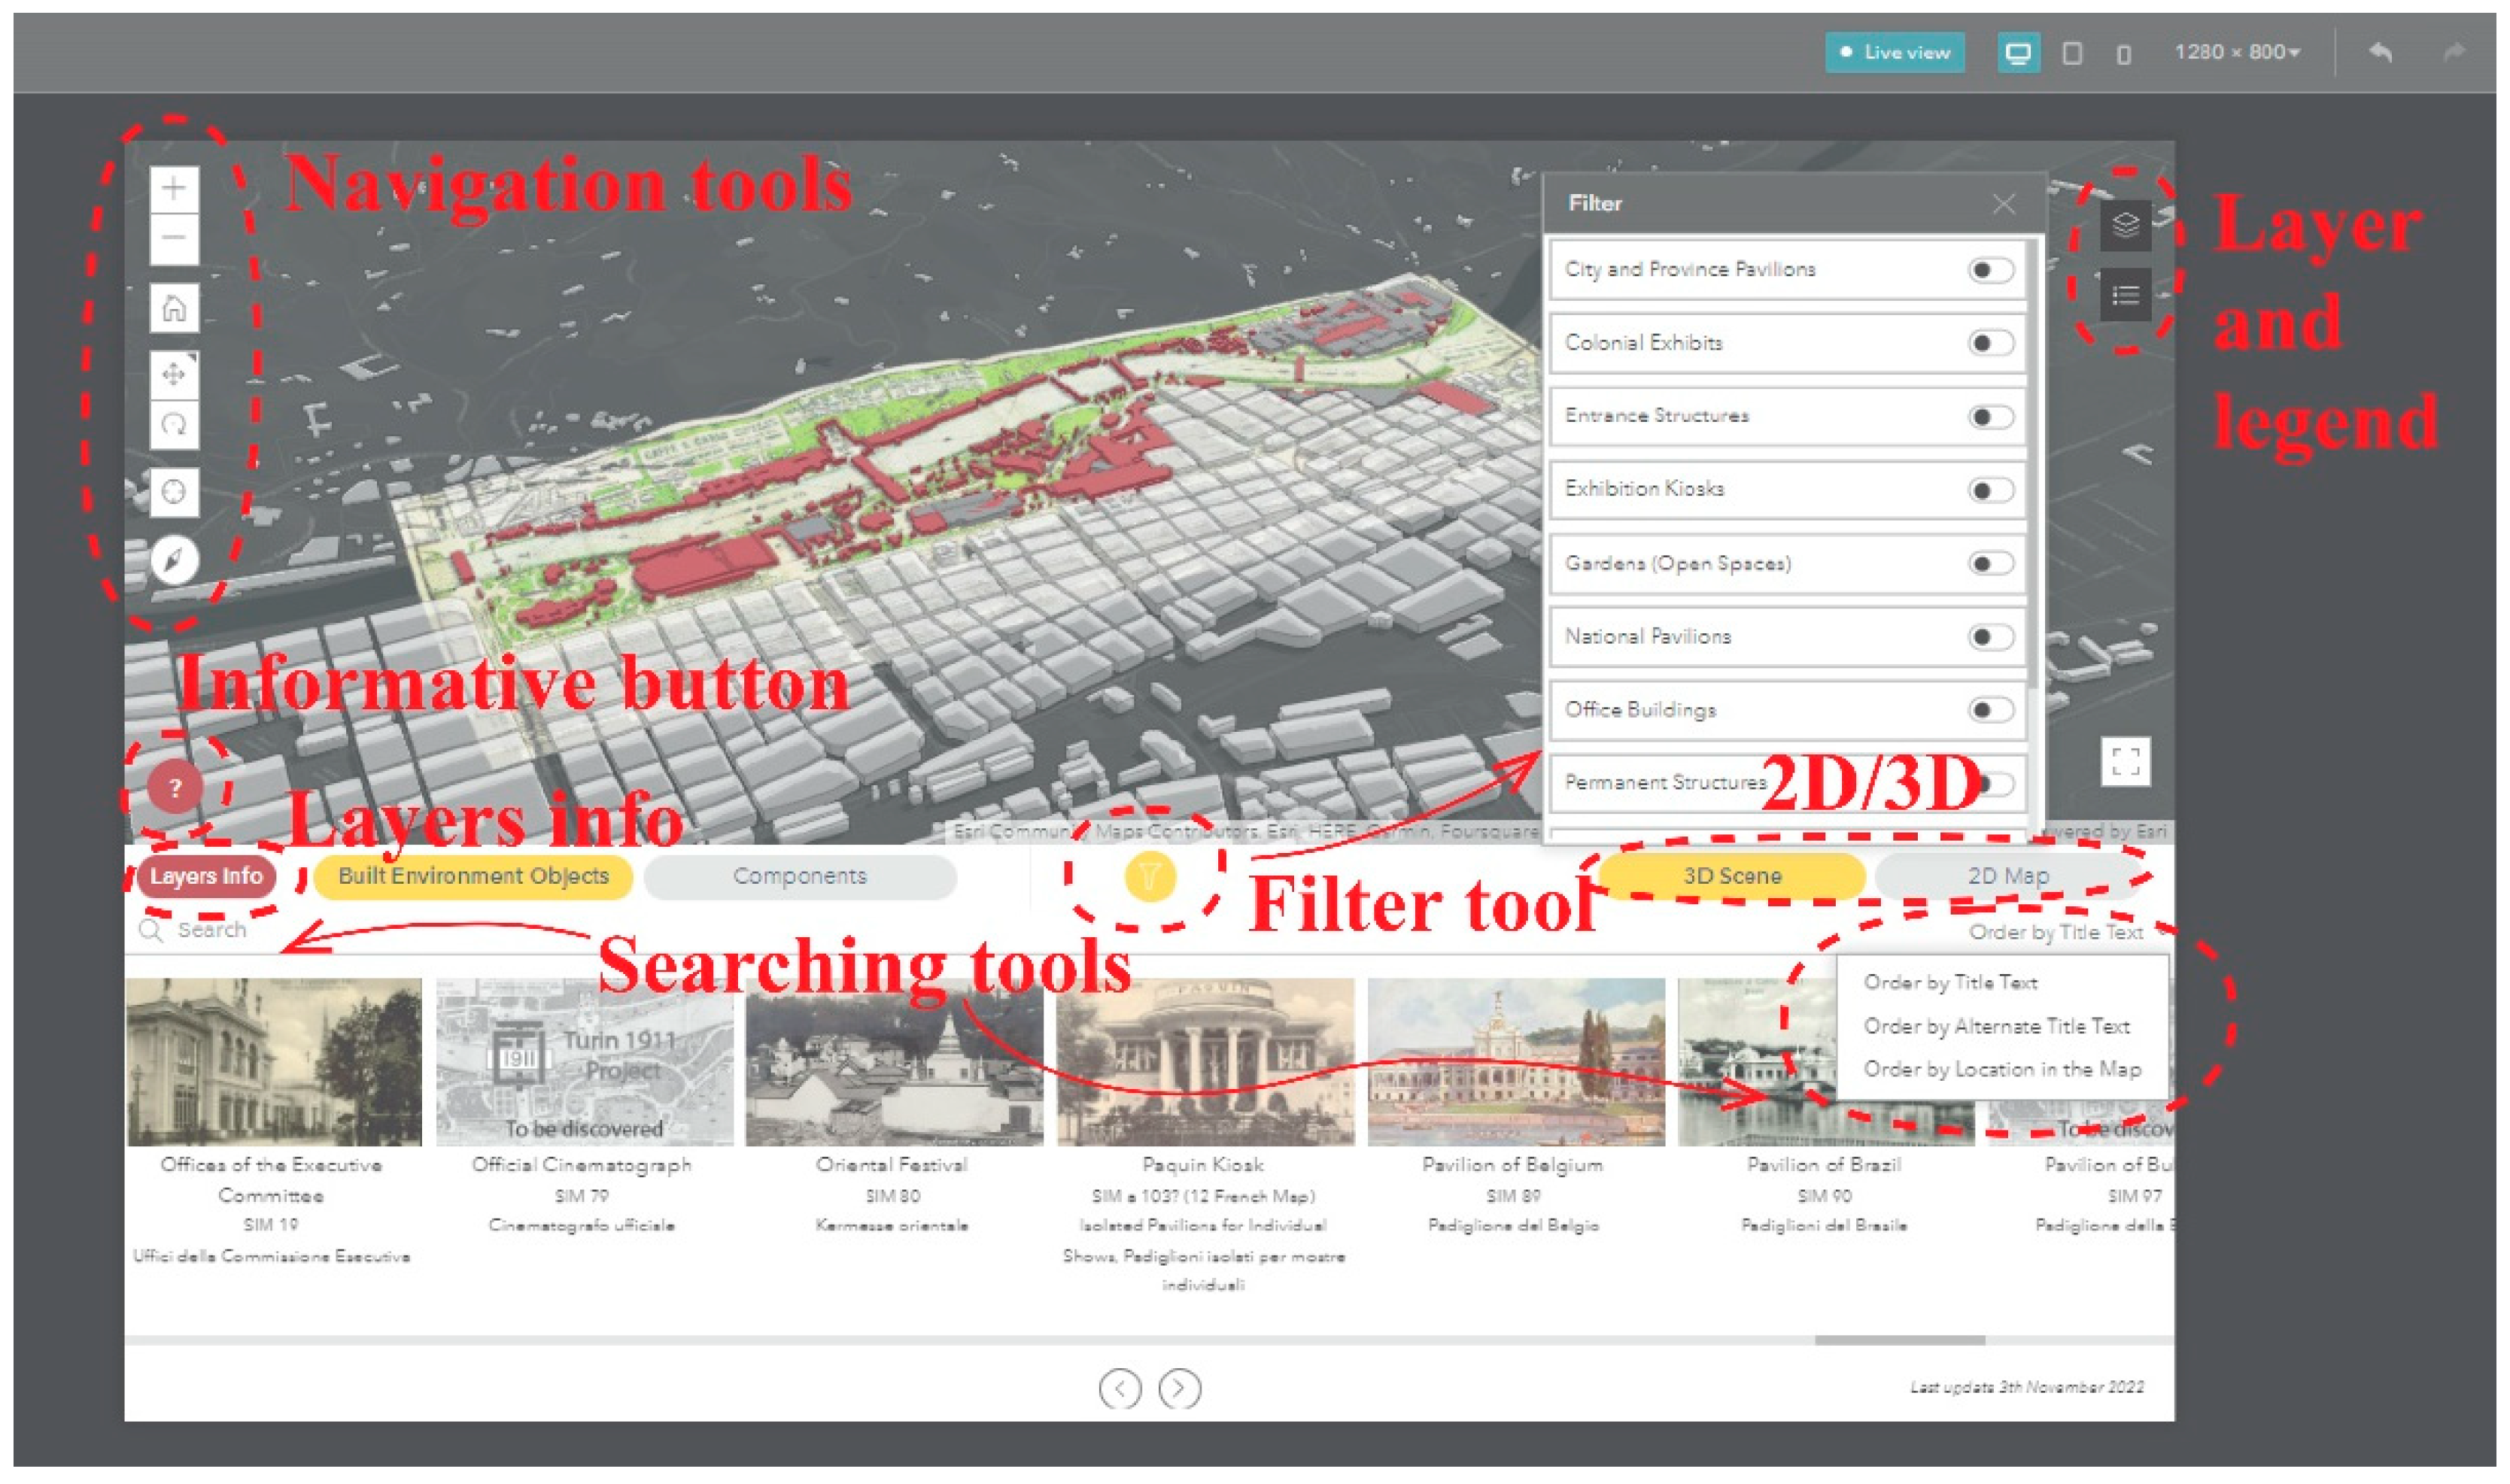
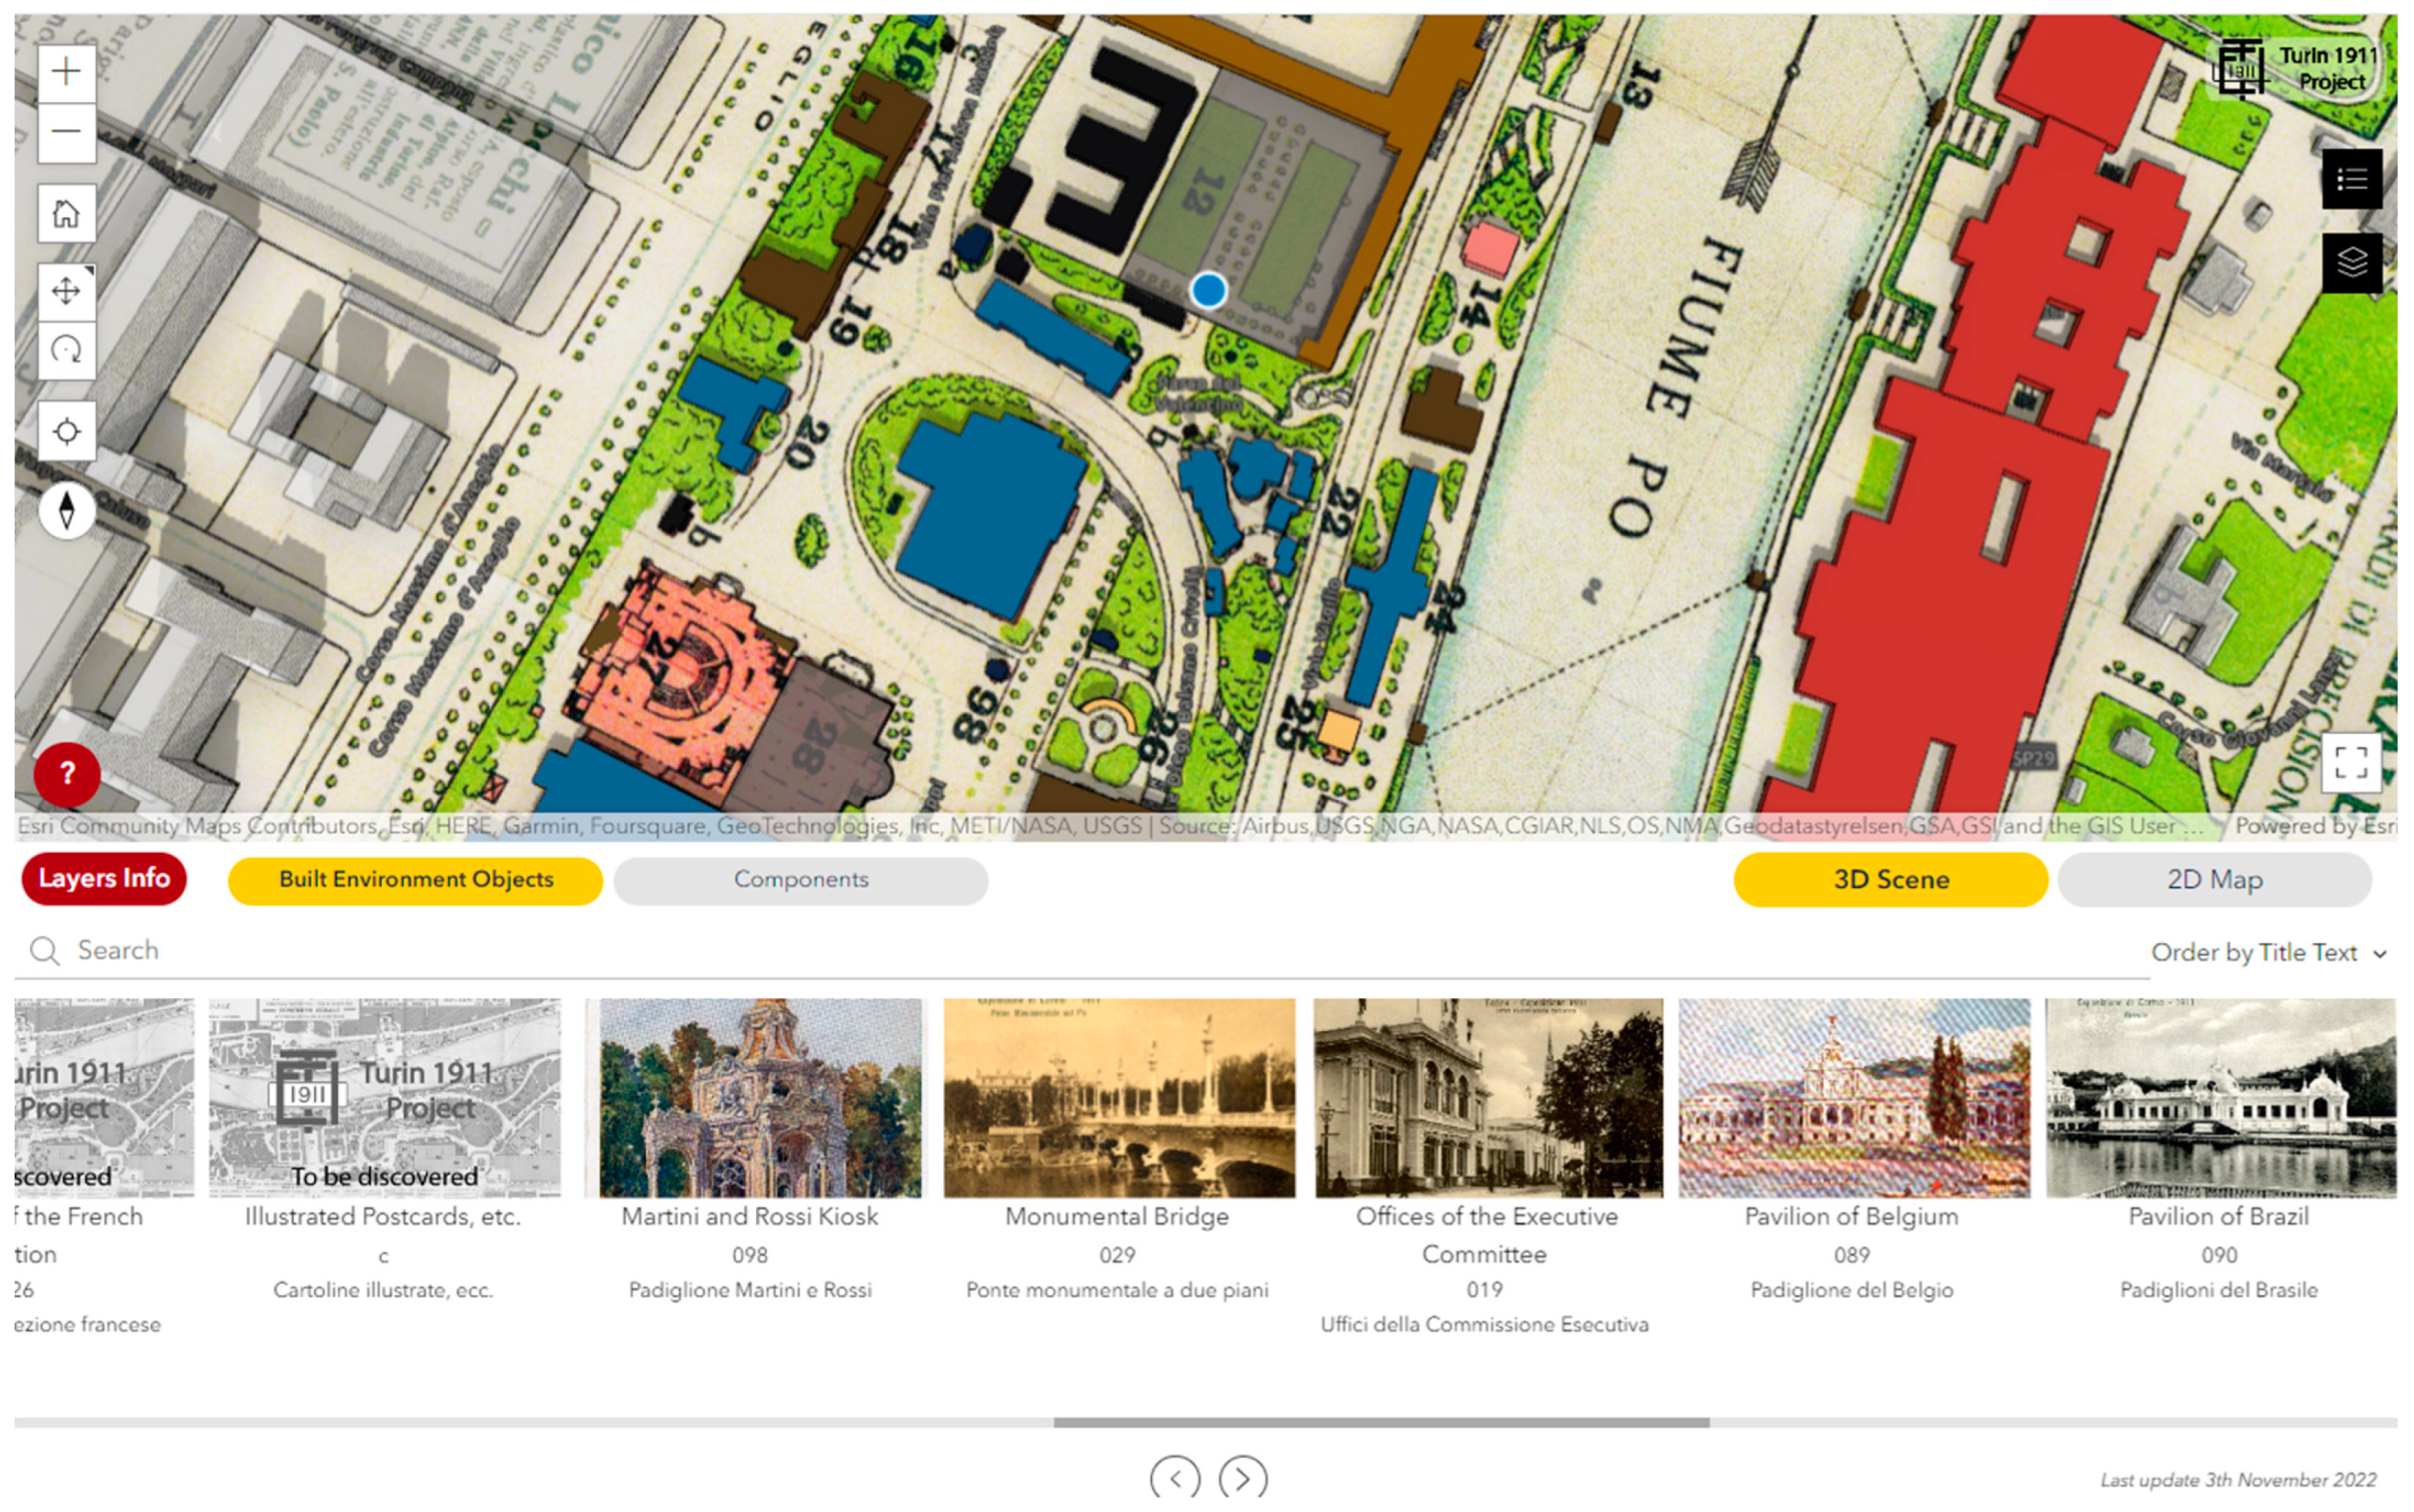
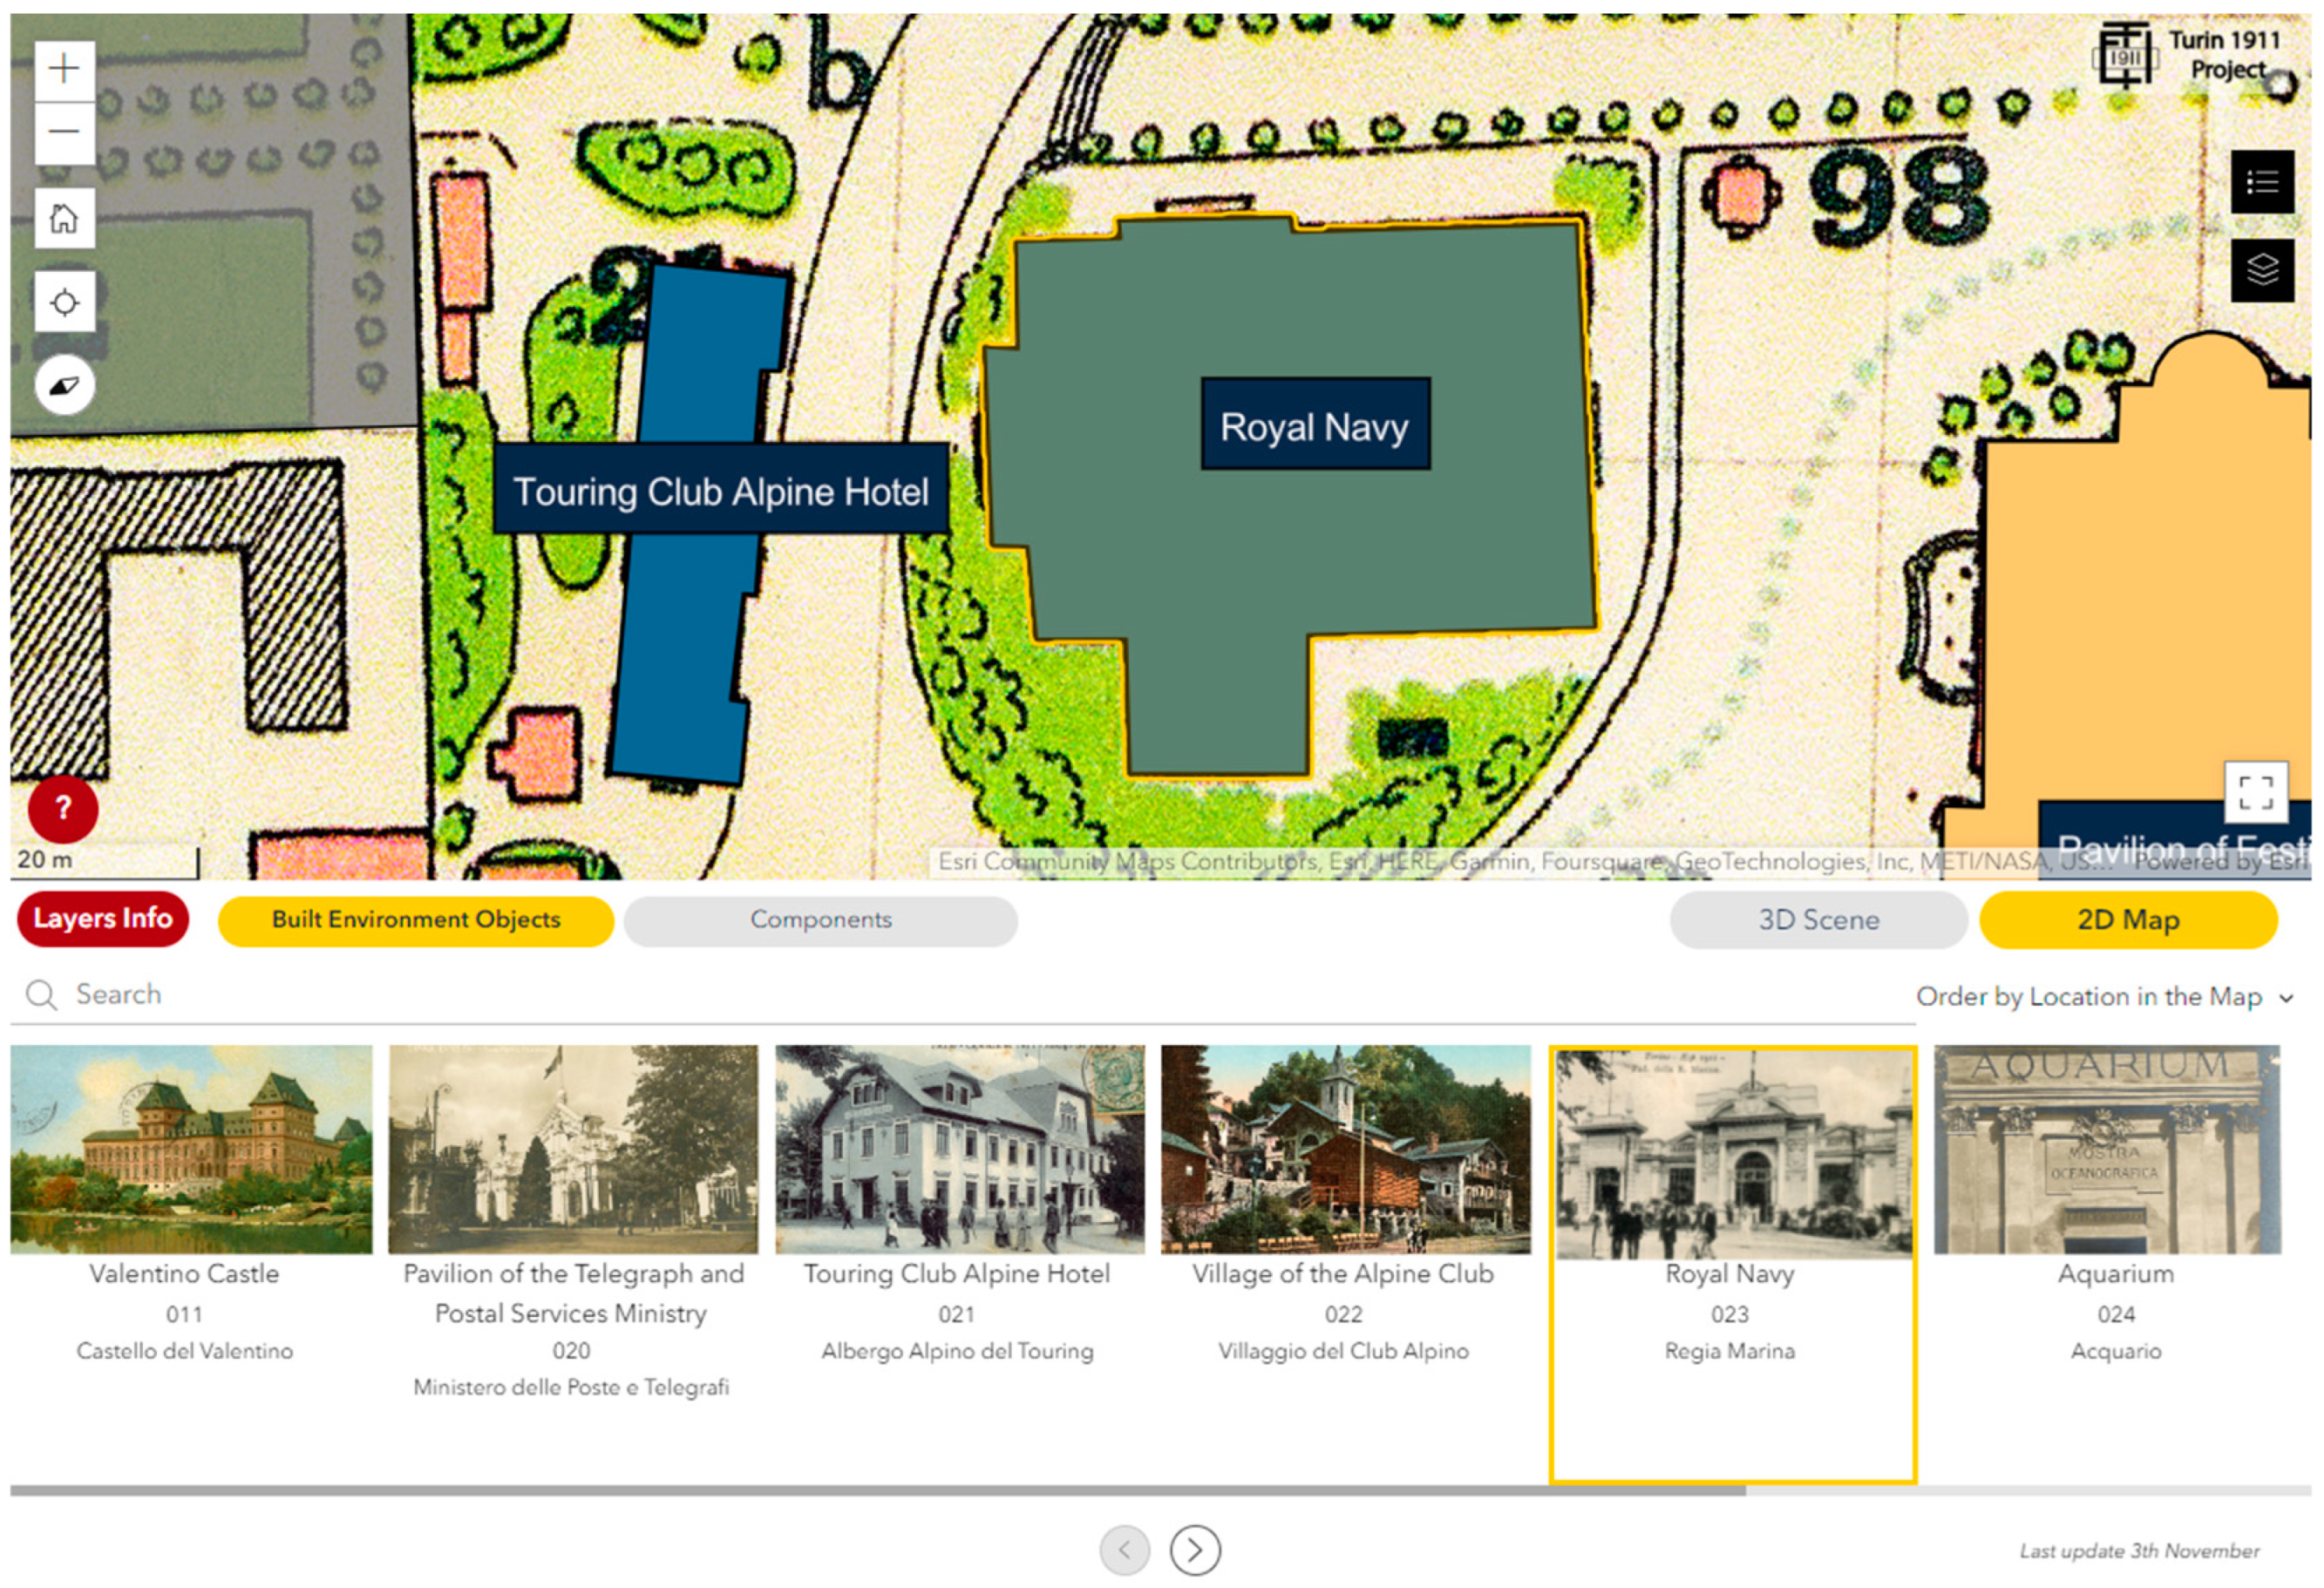
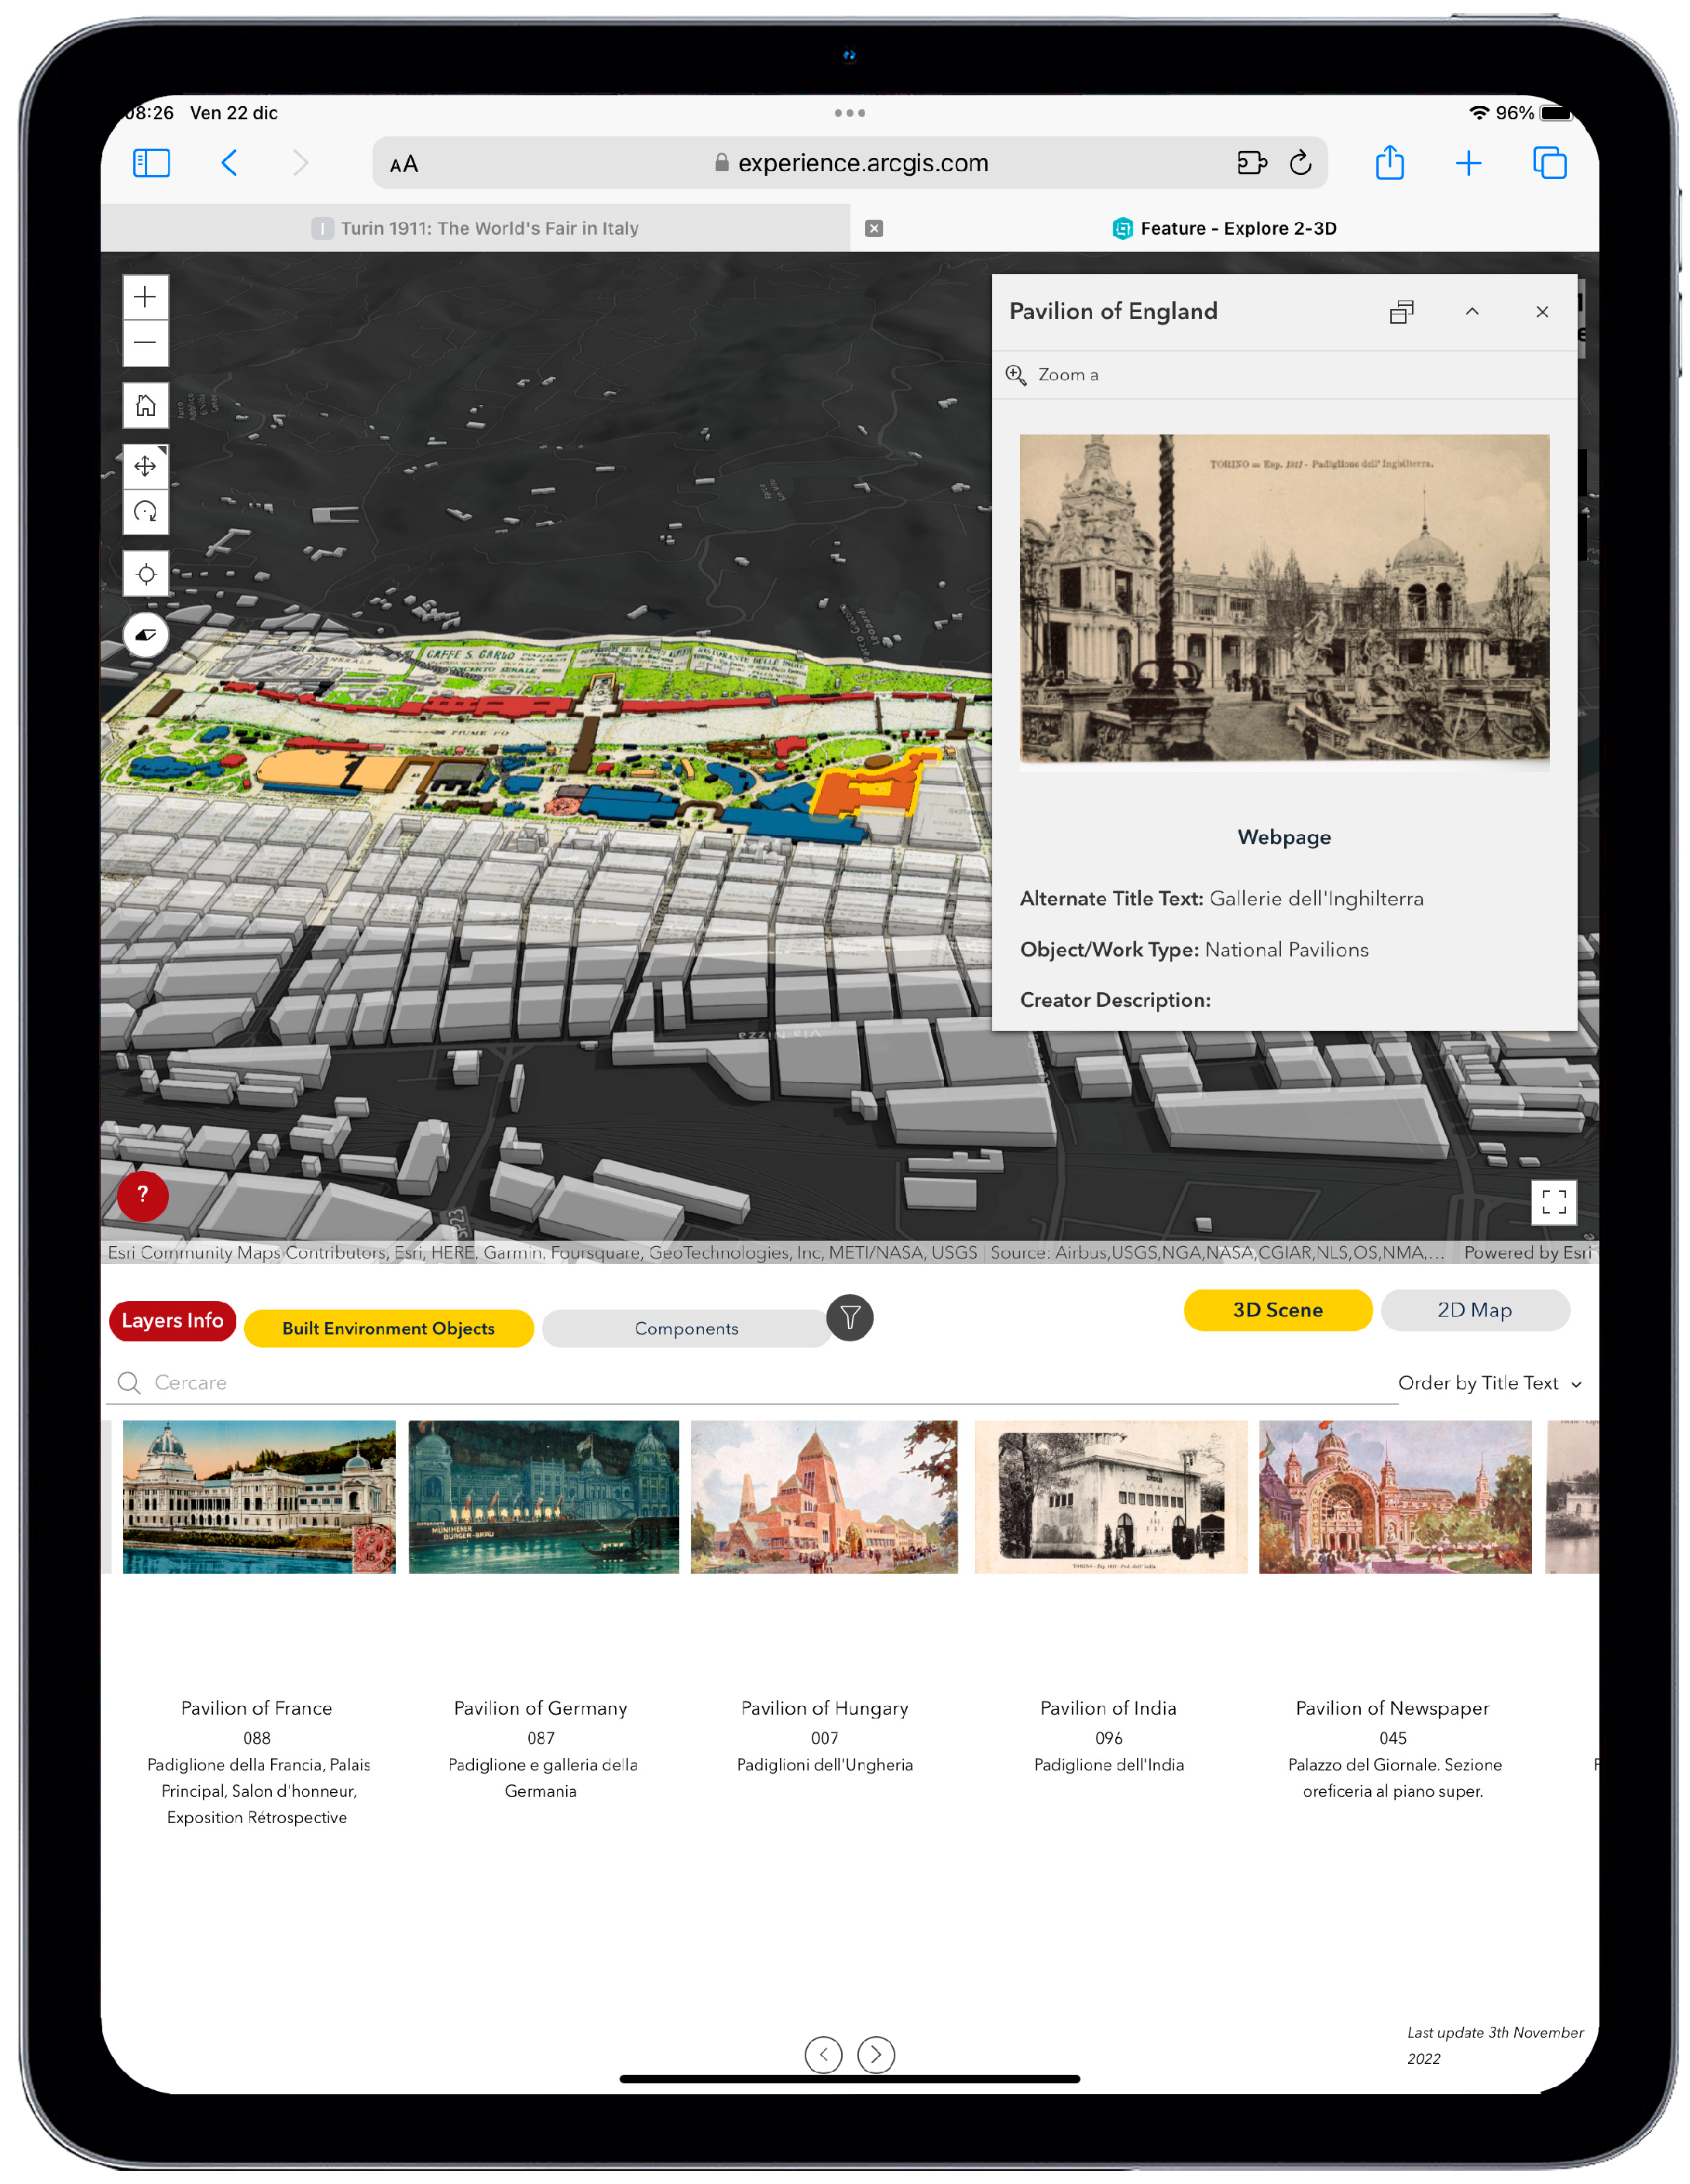
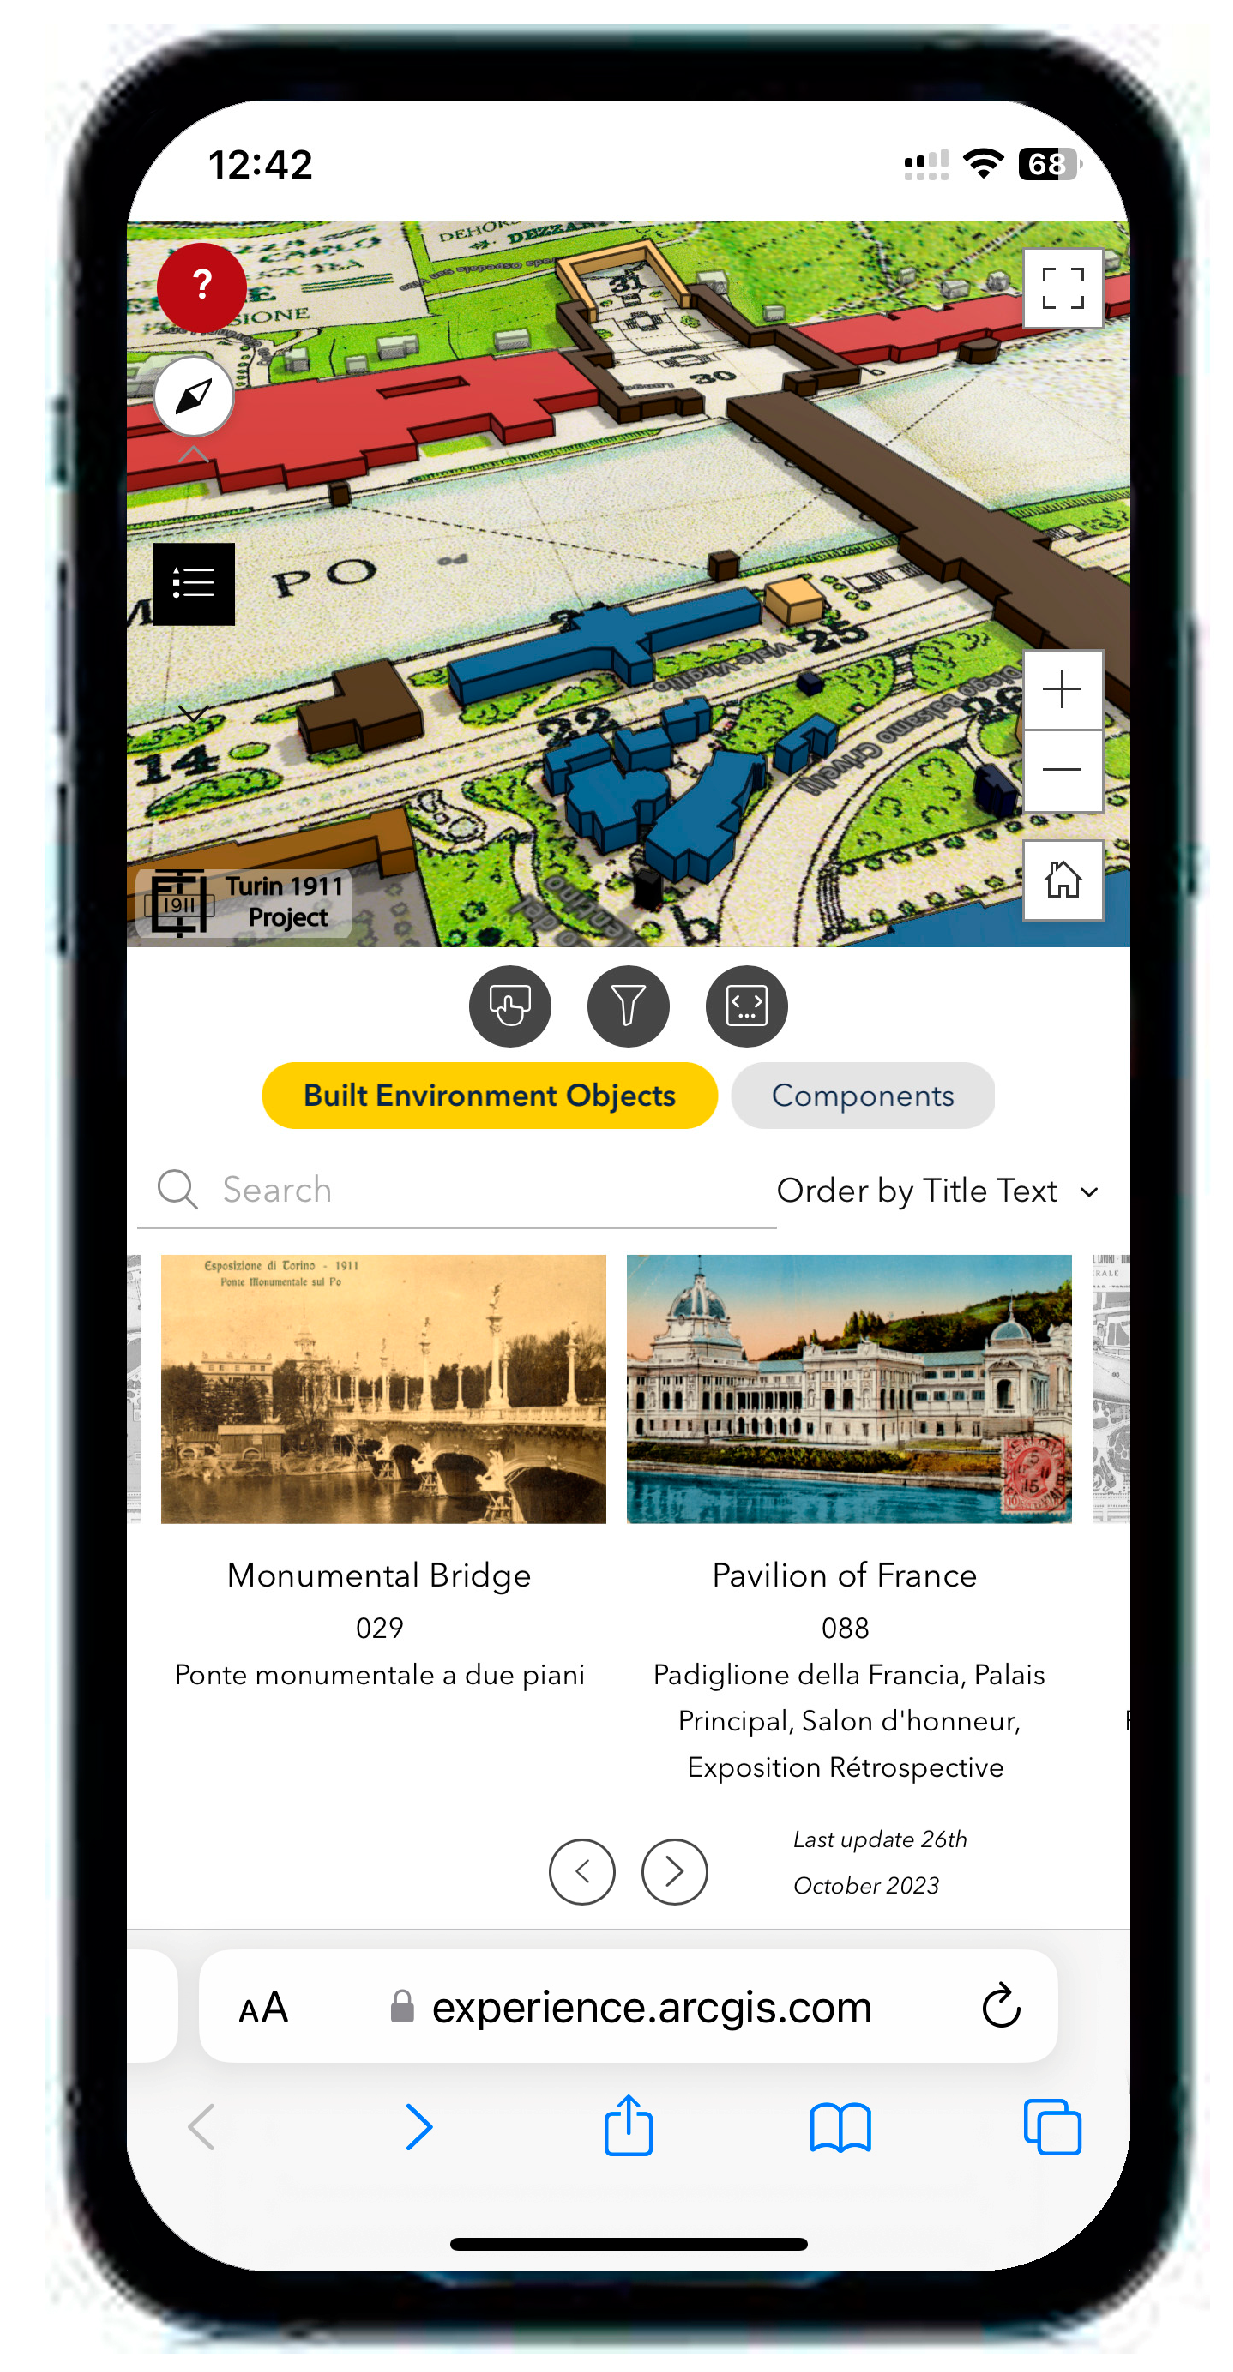
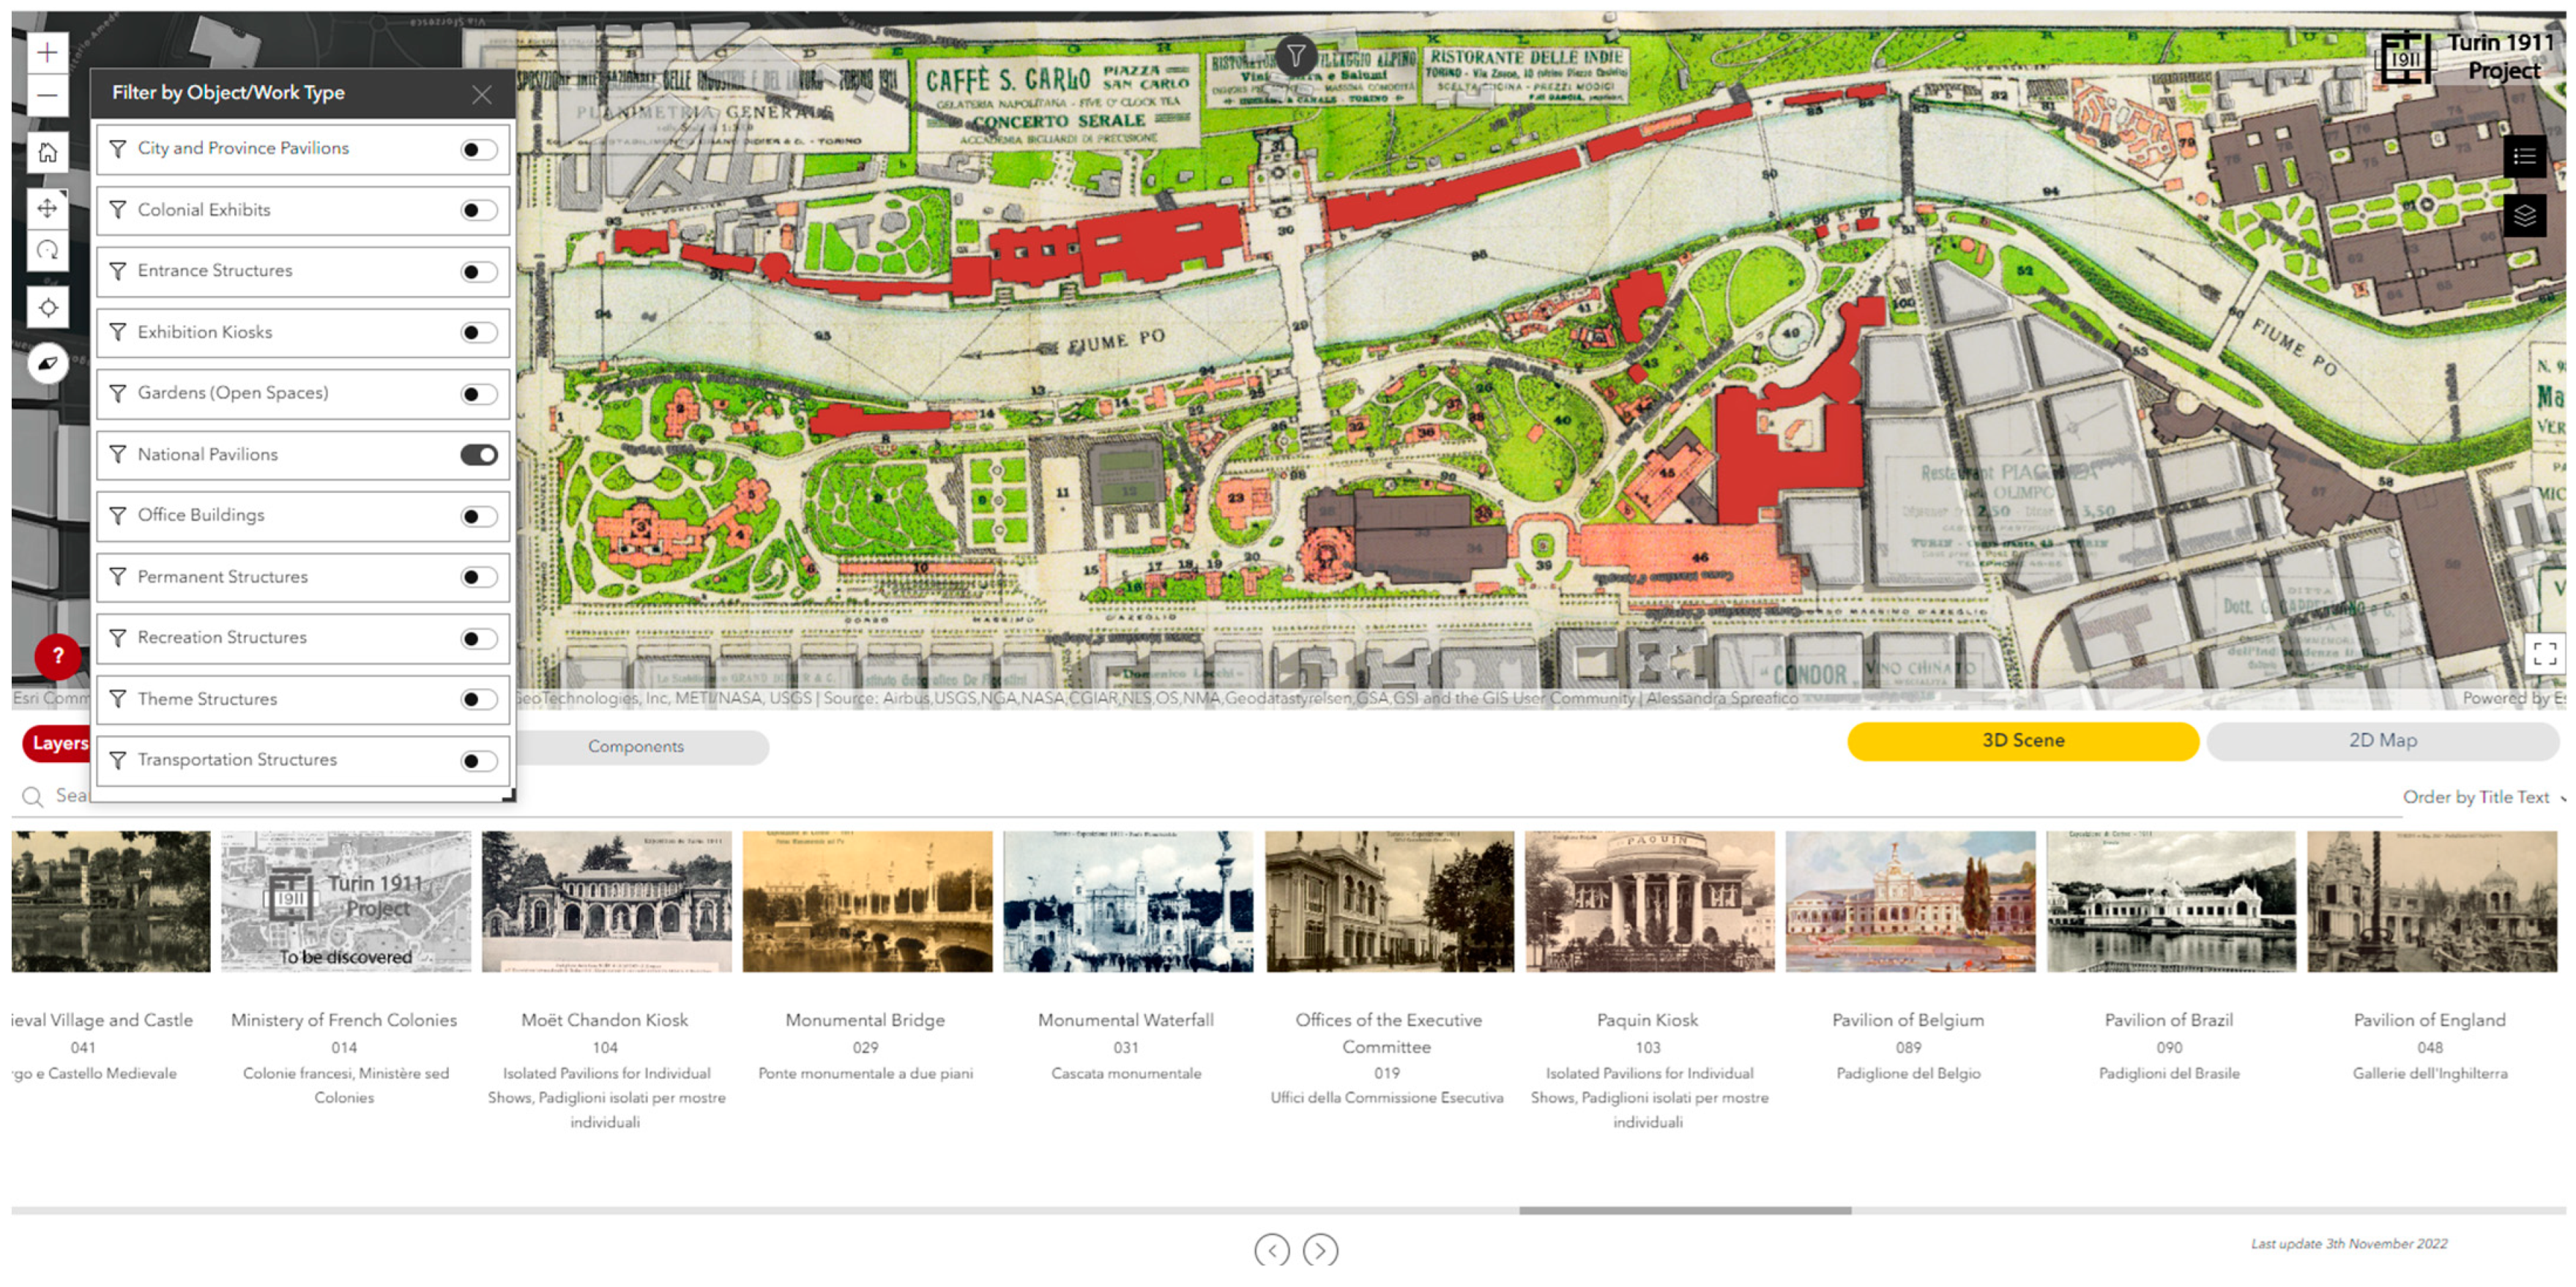
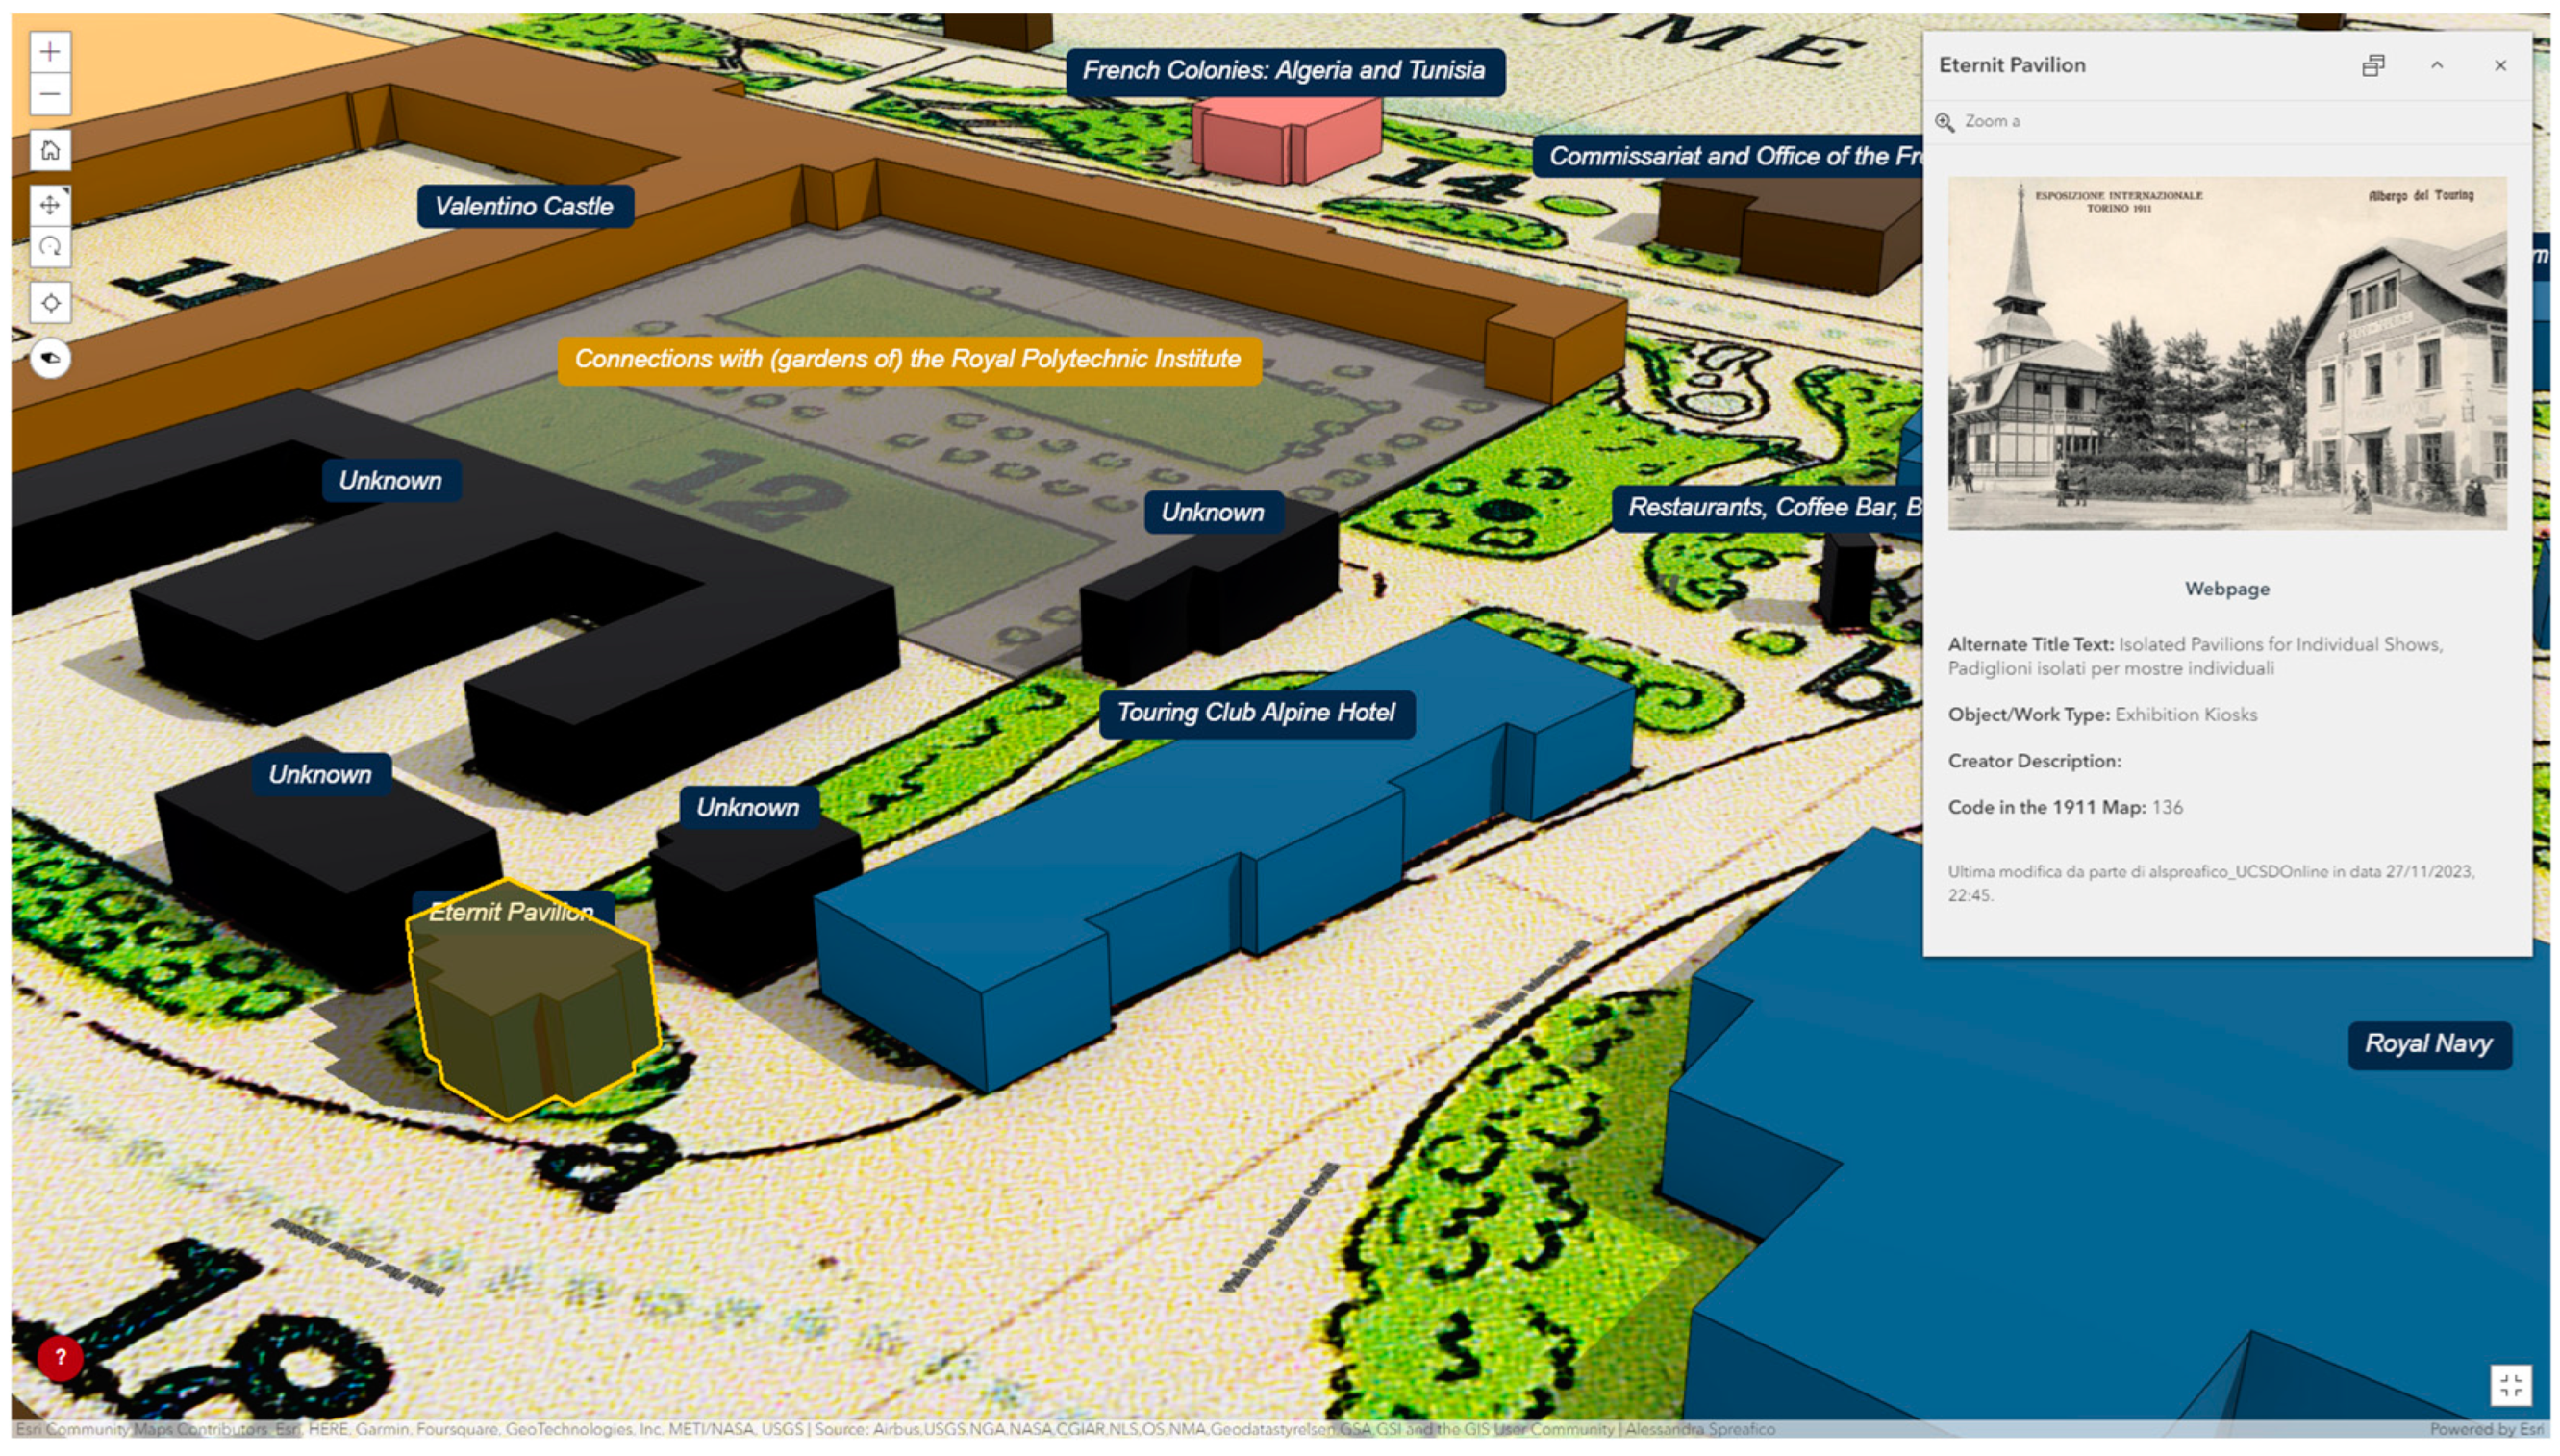
Table 1.
Synthesis of the Turin 1911 WebGIS specifications.
| Scope | Simple tool to explore and research the built-environment objects and components of the Turin 1911 World’s Fair. WebGIS integrated into a website. Little information is inserted into the WebGIS; in-depth information is on the website. |
| Users | Scholars without GIS expertise and the general public. |
| Uses | Only 2D/3D visualization with little information using basic tools (navigation, preconfigured searching, and querying tools). |
| Devices | Desktops, tablets, and smartphones. |
| Browsers | Apple Safari, Google Chrome, Mozilla Firefox, Microsoft Edge, Opera, and Samsung Internet. |
| Existing data | Retrieved data harmonized in a new data model. |
| Data entities | 1911 City of Turin map (raster data), 1911 Turin fairground map (raster), architectural documents (non-spatial data), archival materials (non-spatial data), blocks of the City of Turin (vector data), built-environment objects (vector data), components (vector data), DTM (raster data), glossary (non-spatial data), lists (non-spatial data), locations (non-spatial data), protagonists (non-spatial data), and secondary sources (non-spatial data). |
| Data structure | Novel. |
| DB model | Relational geo-DB stored on an Ubuntu server. |
| DBMS software | PostgreSQL 13.3. |
| GIS software | ArcGIS Pro 2.9. |
| WebGIS applications | ArcGIS Online and Enterprise; WAB and Experience Builder. |
| GIS server | ArcGIS server 10.8.1. |
| Interoperability with other software | Lavarel for website development. |
| Cataloging Standard | Getty CDWA and FDA guide; ISBD. |
| Geographical standard | WMS and WFS. |
| thesauri | Getty AAT, ULAN, and TGN. |
| LOD | Getty AAT, ULAN, and TGN. |
| Ontologies | Not used. |
| Data and WebGIS authorship | Turin 1911 team, Politecnico di Torino and University of California San Diego. |
Table 2.
Results of the page speed insight tests for the Turin 1911 WebGIS.
| Computers | Mobile Devices | |
|---|---|---|
| First contentful paint (s) | 0.3 | 1.2 |
| Largest contentful paint (s) | 4.6 | 19.5 |
| Total blocking time (ms) | 1.72 | 9.5 |
Disclaimer/Publisher’s Note: The statements, opinions and data contained in all publications are solely those of the individual author(s) and contributor(s) and not of MDPI and/or the editor(s). MDPI and/or the editor(s) disclaim responsibility for any injury to people or property resulting from any ideas, methods, instructions or products referred to in the content. |
© 2024 by the authors. Licensee MDPI, Basel, Switzerland. This article is an open access article distributed under the terms and conditions of the Creative Commons Attribution (CC BY) license (https://creativecommons.org/licenses/by/4.0/).
Share and Cite
MDPI and ACS Style
Spreafico, A.; Chiabrando, F. 3D WebGIS for Ephemeral Architecture Documentation and Studies in the Humanities. Heritage 2024, 7, 913-947. https://doi.org/10.3390/heritage7020044
AMA Style
Spreafico A, Chiabrando F. 3D WebGIS for Ephemeral Architecture Documentation and Studies in the Humanities. Heritage. 2024; 7(2):913-947. https://doi.org/10.3390/heritage7020044
Chicago/Turabian StyleSpreafico, Alessandra, and Filiberto Chiabrando. 2024. "3D WebGIS for Ephemeral Architecture Documentation and Studies in the Humanities" Heritage 7, no. 2: 913-947. https://doi.org/10.3390/heritage7020044