
Assessing the Impact of the 2023 Kahramanmaras Earthquake on Cultural Heritage Sites Using High-Resolution SAR Images


1
State Key Laboratory of Information Engineering in Surveying, Mapping, and Remote Sensing, Wuhan University, Wuhan 430079, China
2
Institute of Archaeological Sciences, University of Bern, 3012 Bern, Switzerland
*
Author to whom correspondence should be addressed.
Heritage 2023, 6(10), 6669-6690; https://doi.org/10.3390/heritage6100349
Submission received: 10 August 2023
/
Revised: 20 September 2023
/
Accepted: 28 September 2023
/
Published: 9 October 2023
(This article belongs to the Section Cultural Heritage)
Abstract
:Earthquakes are hard to predict, and the destruction caused by the events far outstrip the monetary damage. Important cultural heritage sites functioning as places of community and identity have a value which evades pure pecuniary calculation. This makes understanding the complete economic and social impact of earthquakes a difficult and daunting task. We use high-resolution TerraSAR-X data acquired after the 2023 earthquake in Turkey to assess its impact on selected cultural heritage sites. Leveraging different orbit and incidence angles of image acquisition allow us to show the difficulties in interpreting high-resolution SAR data. While large impacts, like the complete collapse of structures, can be detected successfully, small-scale damage and partial collapses are often difficult to detect from single SAR images. We find that single SAR scene interpretation for damage assessment of cultural heritage is not a viable option. While contextualizing data might help to understand the situation, SAR is only helpful if data of the intact cultural heritage sites have been obtained before the event.
1. Introduction
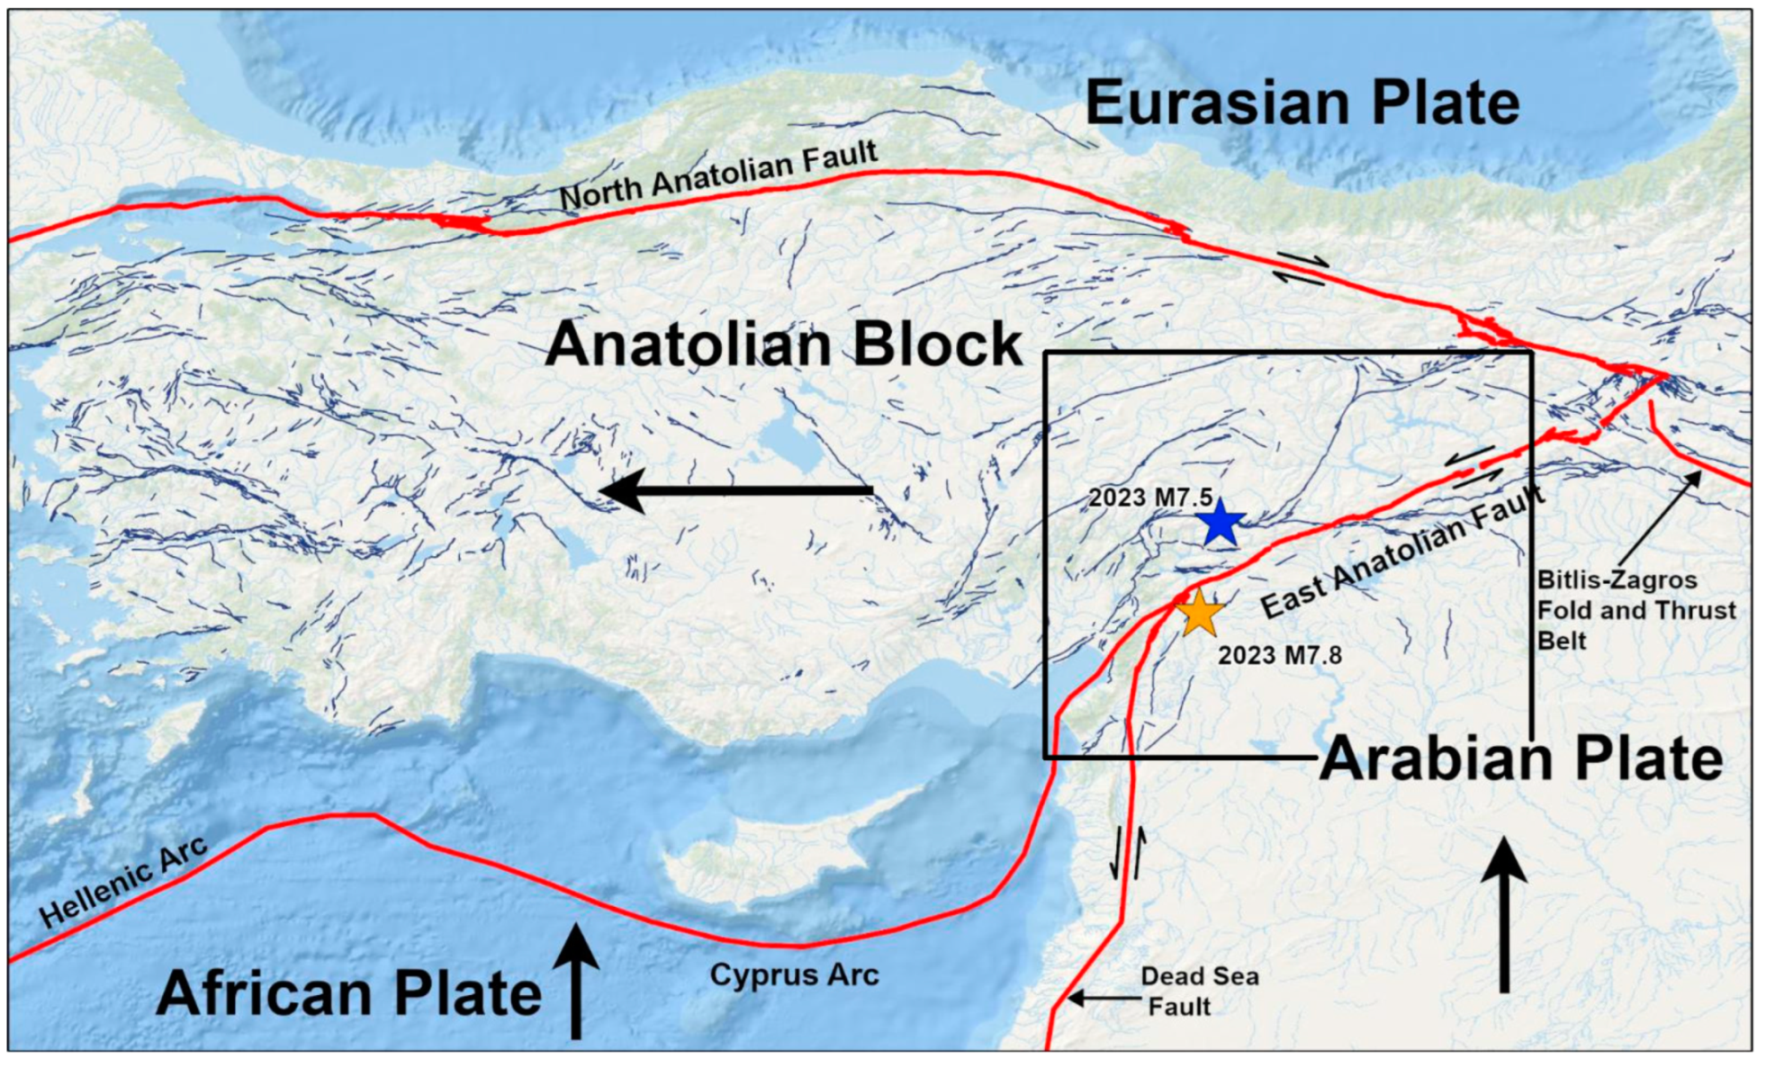
The February 6 earthquake in southeastern Turkey near the Turkey–Syria border left a trail of havoc at cultural heritage sites. Assessing the impact of an event is crucial for understanding the cultural and historical costs of a disaster. The twin quakes with magnitudes 7.8 and 7.5 resulted in widespread damage and casualties rising to tens of thousands, the catastrophic effect spreading across eleven cities. Such earthquakes cause enormous social and financial damage, resulting in long-term societal impacts. Response time is critical for mitigating damage and long-term effects [1]. The zone of occurrence of this earthquake is a hotbed for seismic activity because of its complex network of plate boundaries. The Dead Sea fault zone between the Arabian and African plates is one of the world’s most typical intracontinental transform faults, which are strike-slip faults that cut the lithosphere (Figure 1). It stretches over 1000 km from the Red Sea to the Bitlis Belt at the Maras triple junction [2]. The present-day geodynamics of the eastern Mediterranean are mainly influenced by the relative motions of these three major plates [3]. Remote sensing technologies have ultimately been used as beneficial instruments for disaster and emergency response because of their advantage of mapping damage over a large area [4]. Being weather- and cloud-influence-free, SAR is extremely responsive to different surface changes [5].
The affected cities are home to some of Turkey’s most iconic heritage sites. Cities in eastern and southeastern Turkey have played a significant role in the country’s cultural history. The earliest settlements in the world appeared in southeastern Turkey [7]. Part of the earthquake zone lies north of the Fertile Crescent, which is a historically significant archaeological area. The Fertile Crescent is also called the “Cradle of Civilization”, as it hosted the transformation of hunter-gatherer groups into the first settled communities in the Middle East and Mediterranean basin from the beginning of the 9th millennium BC [8]. There are historical structures littered across the cities, and many of them have been undergoing excavation by archaeologists. Stopping natural disasters such as earthquakes, forest fires, landslides, and floods is impossible because they usually occur without prior warning. Mitigating the impact of these disasters is very important for saving and restoring, where possible, the affected cultural heritage.
Various studies have used SAR data and different techniques to detect and assess damage and even conduct archaeological prospections. Kandasamy and Kumar [9] used the persistent scatterer interferometric synthetic aperture radar (PS-InSAR) technique to find long-term deformation patterns in cultural heritage sites. Anirudh et al. [10] presented semi-automated structure damage detection that occurred due to earthquakes by using SAR data and other necessary datasets. The system combines high-resolution structure listing information with maps of the intensity of earthquake ground shaking and surface-level changes determined by analyzing before- and after-event InSAR pictures. Gionanni et al. [11] used a ground-based SAR interferometric technique to monitor man-made cultural heritage sites and used a Ku-band GBSAR interferometer to generate a deformation map. Tapete and Cigna [12] relied on the properties and capabilities of COSMO-SkyMed for the environmental monitoring of land surface processes, and condition assessment of archaeological heritage and landscape disturbance due to anthropogenic impacts. Tang et al. [13] developed a Multi-Temporal Interferometric Synthetic Aperture Radar (MTInSAR) approach by analyzing Persistent Scatterers (PS) and Distributed Scatterers (DS) to detect the deformation heritage site of Beijing Summer Palace. Cigna et al. [14] combined changed detection, InSAR, and SBAS techniques for heritage-site protection and archaeological prospection for excavated and still buried archaeological features, standing monuments, natural reserves, and buried mounds.
This study uses damage detection instead of change detection. It seeks to visually detect damages to cultural heritage sites in Turkey’s earthquake zone using single high-resolution synthetic aperture radar (SAR) images. It also highlights difficulties faced in reading and interpreting the images, as highlighted, for example, by the Column in Karakuş Tumulus, which required the examination of four different images of different polarizations, passes, and incident angles to detect and differentiate the fallen column. Overall, 30 TerraSAR-X high-resolution X-band datasets of different angles, orbits, and polarizations were used in this study. At some locations, we used Google Earth images as reference. The adoption of SAR images in the response to and management of disasters is widespread because of their ability to provide cloud-free images. Compared with optical sensors, Synthetic Aperture Radar (SAR) can provide important information about damage owing to its ability to map areas affected by earthquakes almost entirely unaffected by weather conditions and solar illumination [15]. To detect damage to cultural heritage sites, we used TerraSAR-X images using high-resolution spotlight mode and staring spotlight mode. We tried to visually recognize damage to historical buildings by analyzing TerraSAR-X images from different angles (complex looking) and comparing them with terrestrial and UAV photos taken by locals, archaeologists, and reporters.
Owing to the lack of pre-event archive high-resolution SAR images, any form of change-detection approach was not suitable. Therefore, a multi-angle interpretation, often assisted by collateral data, was implemented. In many cases, this allowed us to identify damage to cultural heritage sites, but this frequently led to ambiguous and unclear interpretations.
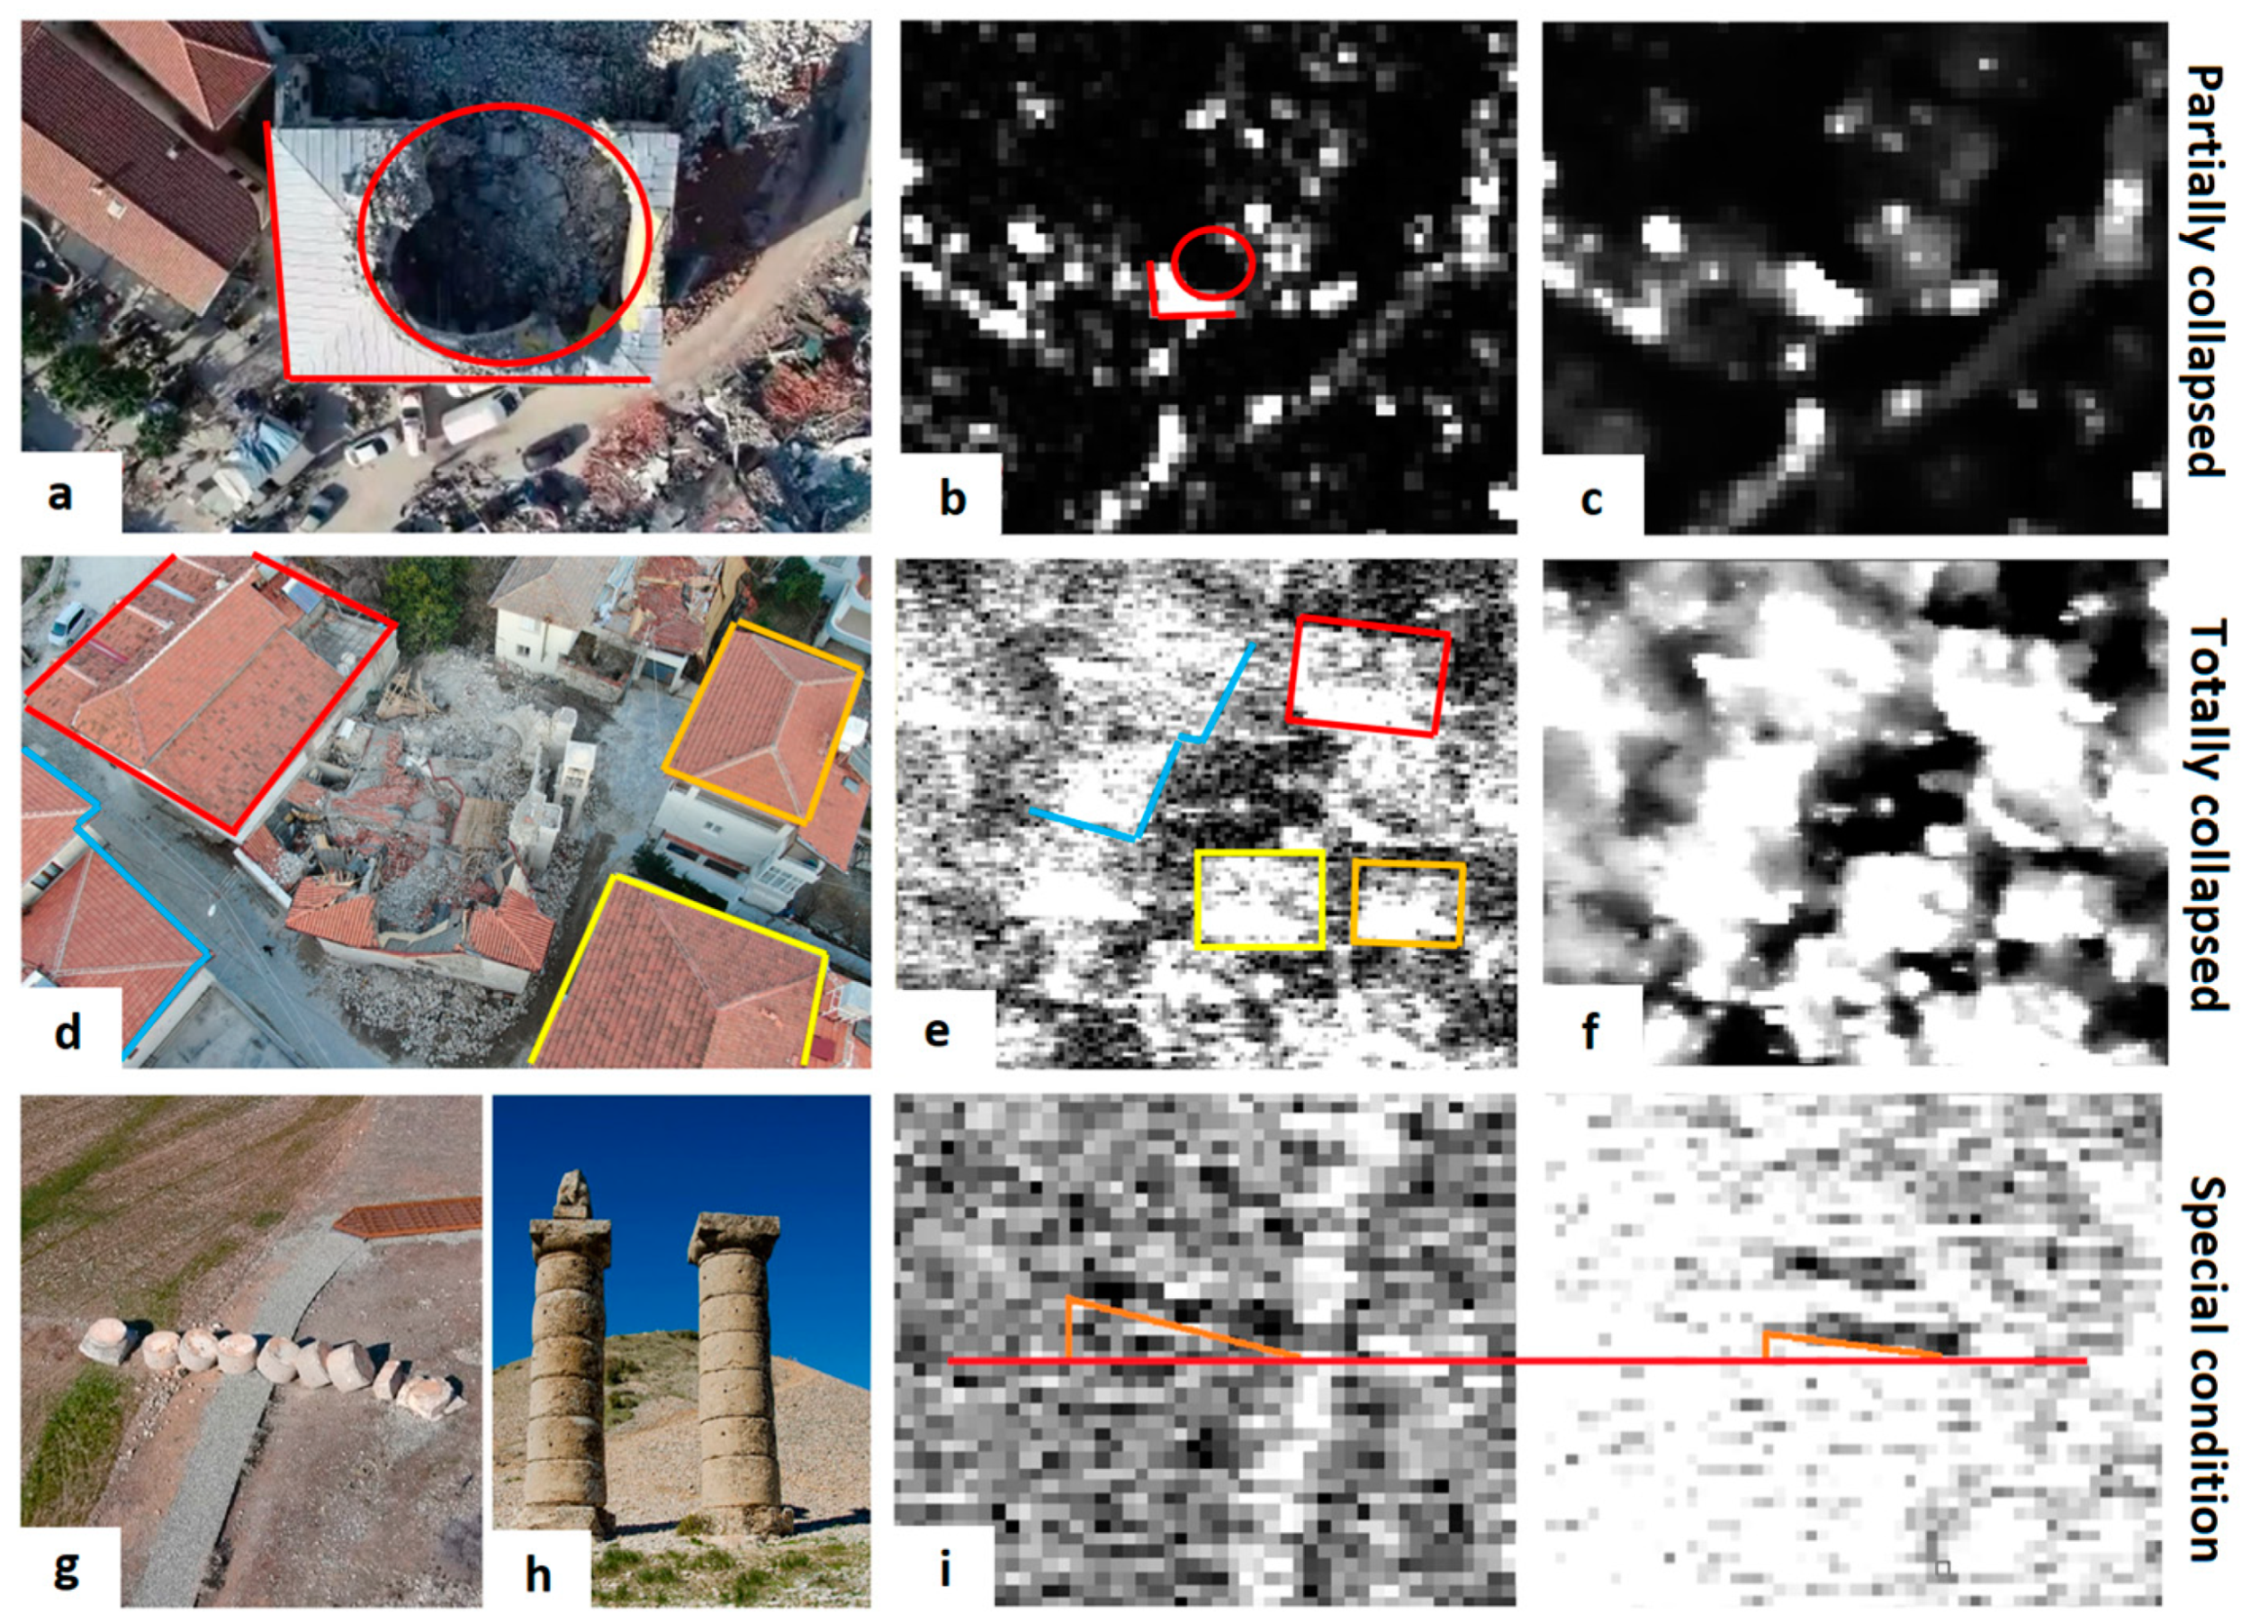
To solve the challenges highlighted in the previous paragraph, we devised new techniques to detect structural damage grouped into three classes: ‘partially collapsed’, ‘totally collapsed,’ and ‘special conditions’. These classes rely on the geometry of the building, the size, and shape of the damage (e.g., the circular dome and curvature of the roof edges were used to detect partially collapsed structures, while we relied heavily on the geometry and backscatter from the roofs of the surrounding structures to detect totally collapsed structures). For the special condition, we used acquisition parameters and shadow angles to identify the structural damage of the fallen column.
In the following, we will show these examples of damage as well as the problems in identifying them clearly, even in very high-resolution SAR images. To this end, we will describe the study area in Section 2 by describing the heritage sites analyzed in this study. Section 3 presents the materials and methods used in this study, and Section 4 presents the results. In the final section, we discuss our results and present our conclusions.
2. Study Area
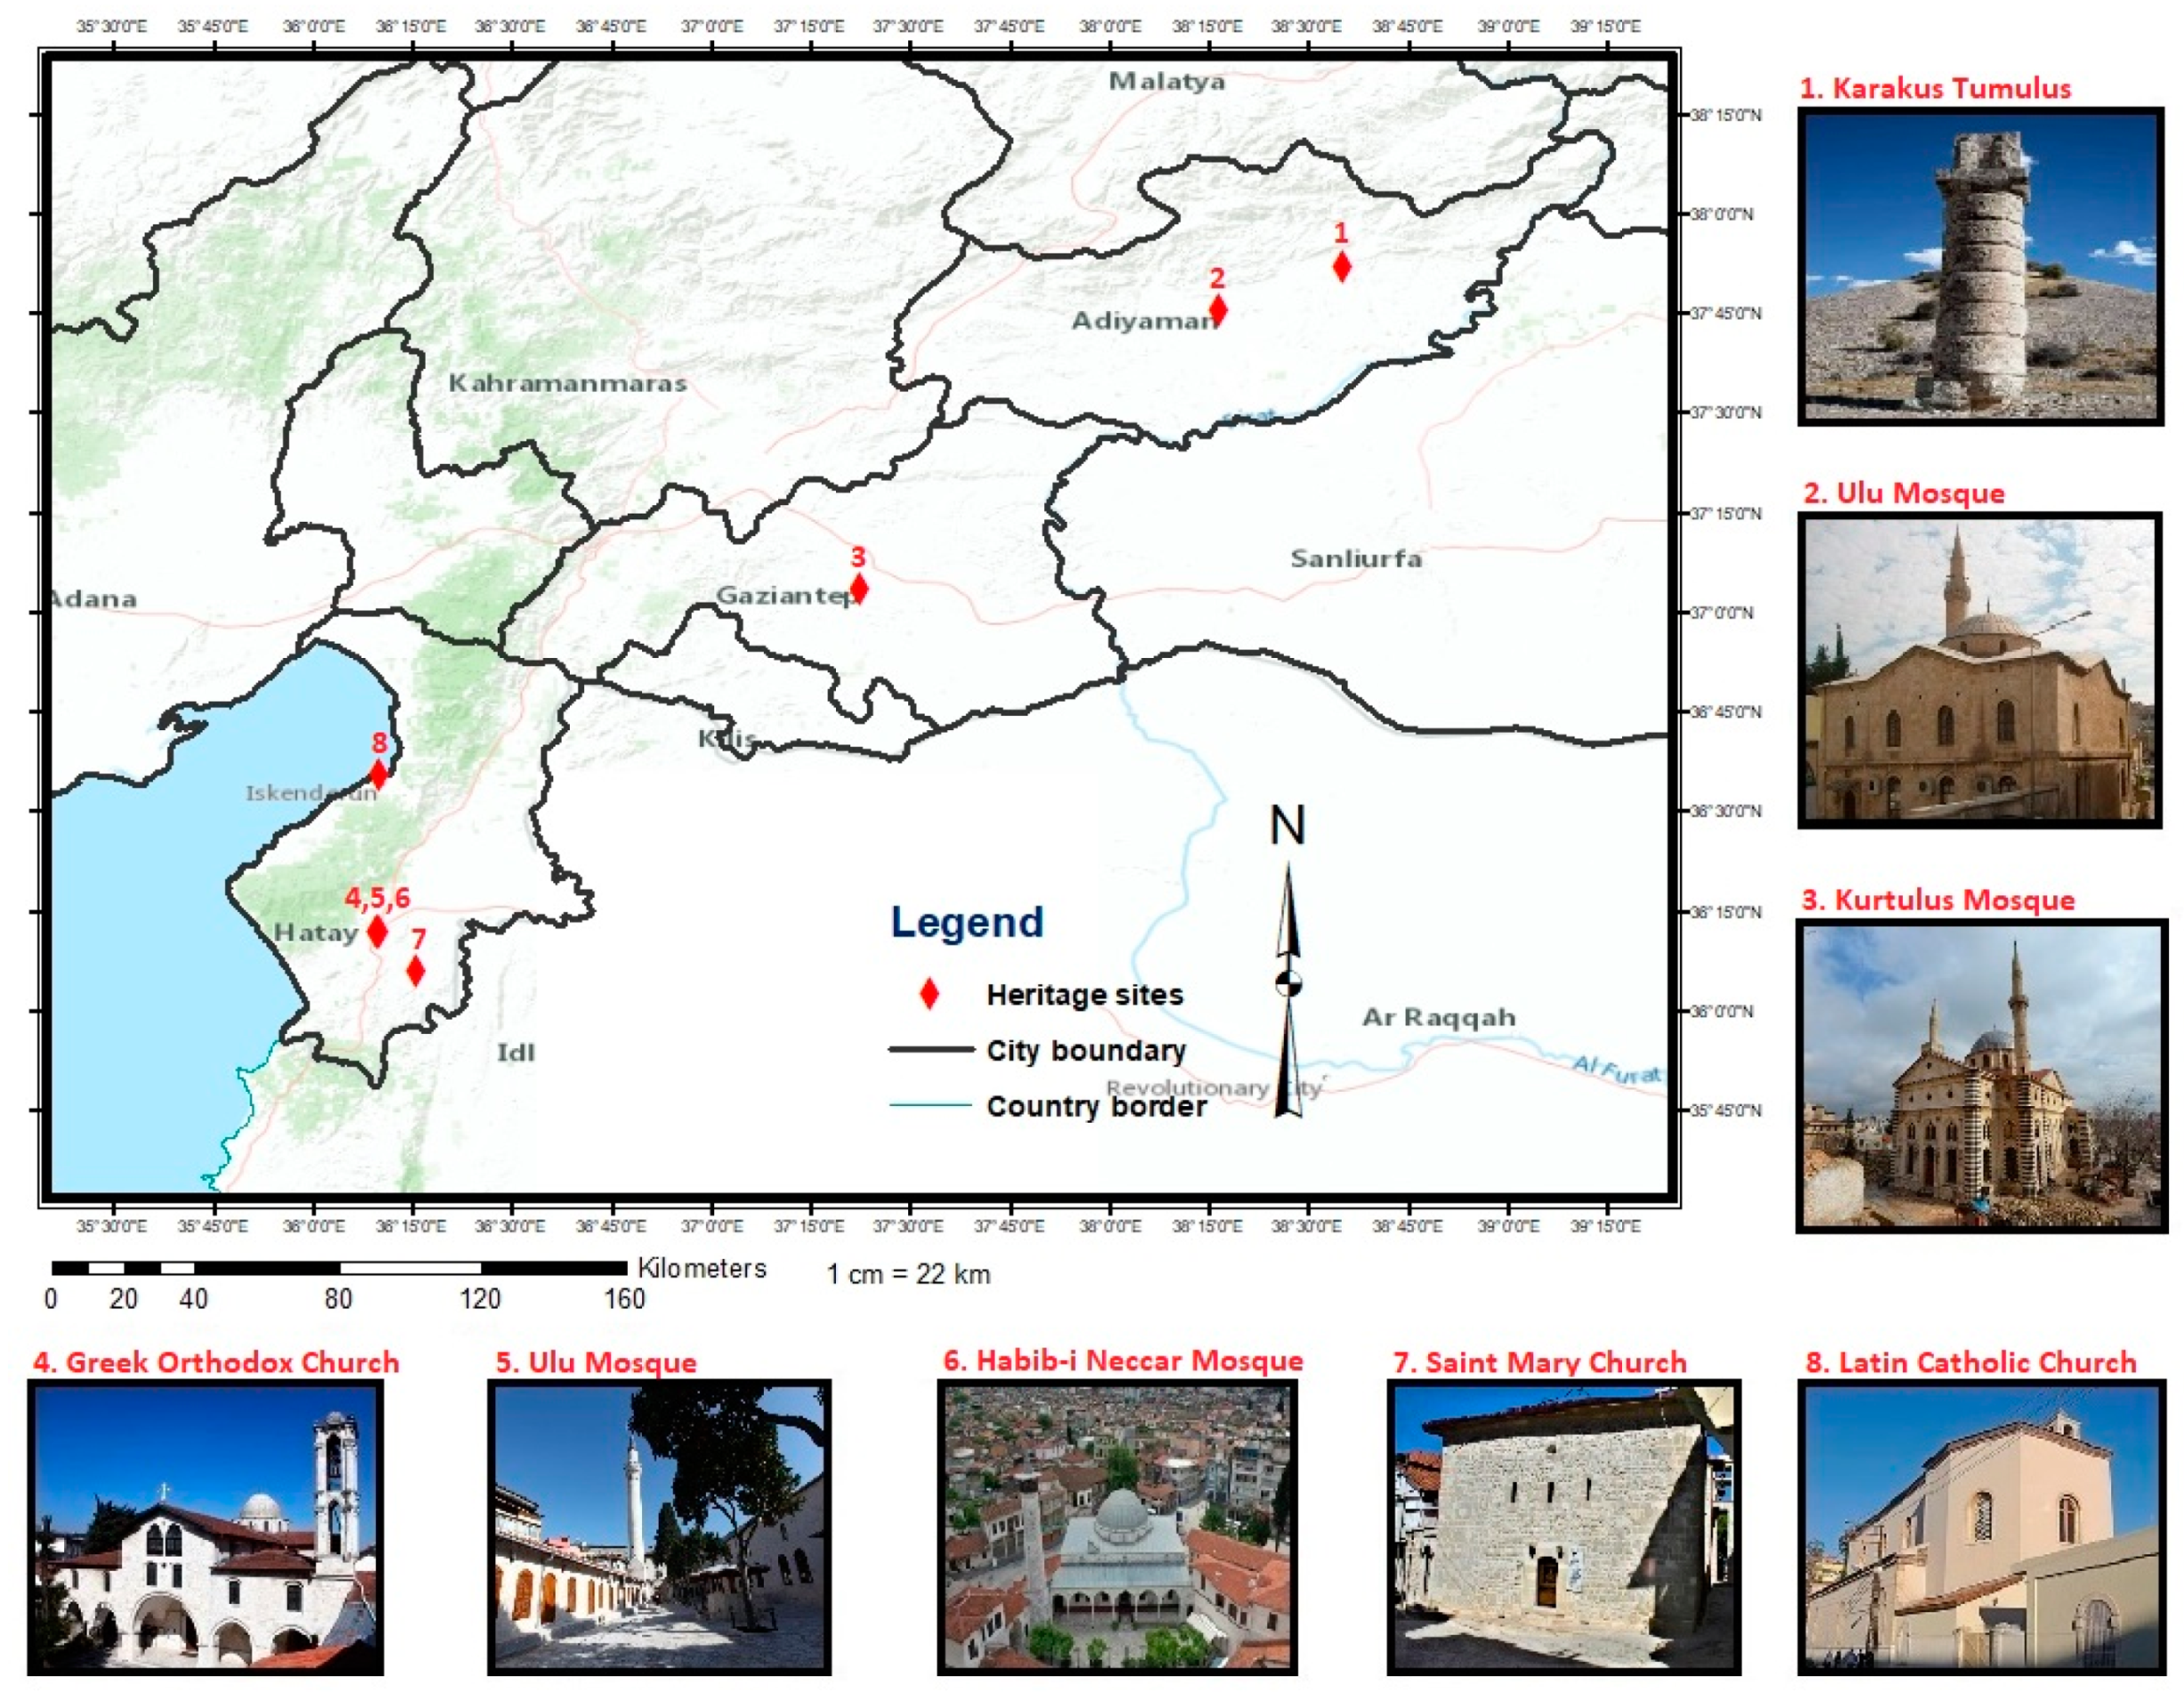
Eleven provinces were affected by the earthquakes. Many cultural heritage sites have been damaged in the affected provinces. The following map shows the locations of the cities and historical buildings where we carried out our work (Figure 2). The Table 1 shows descriptions and characteristics of each site.
2.1. Ulu Mosque—Adıyaman
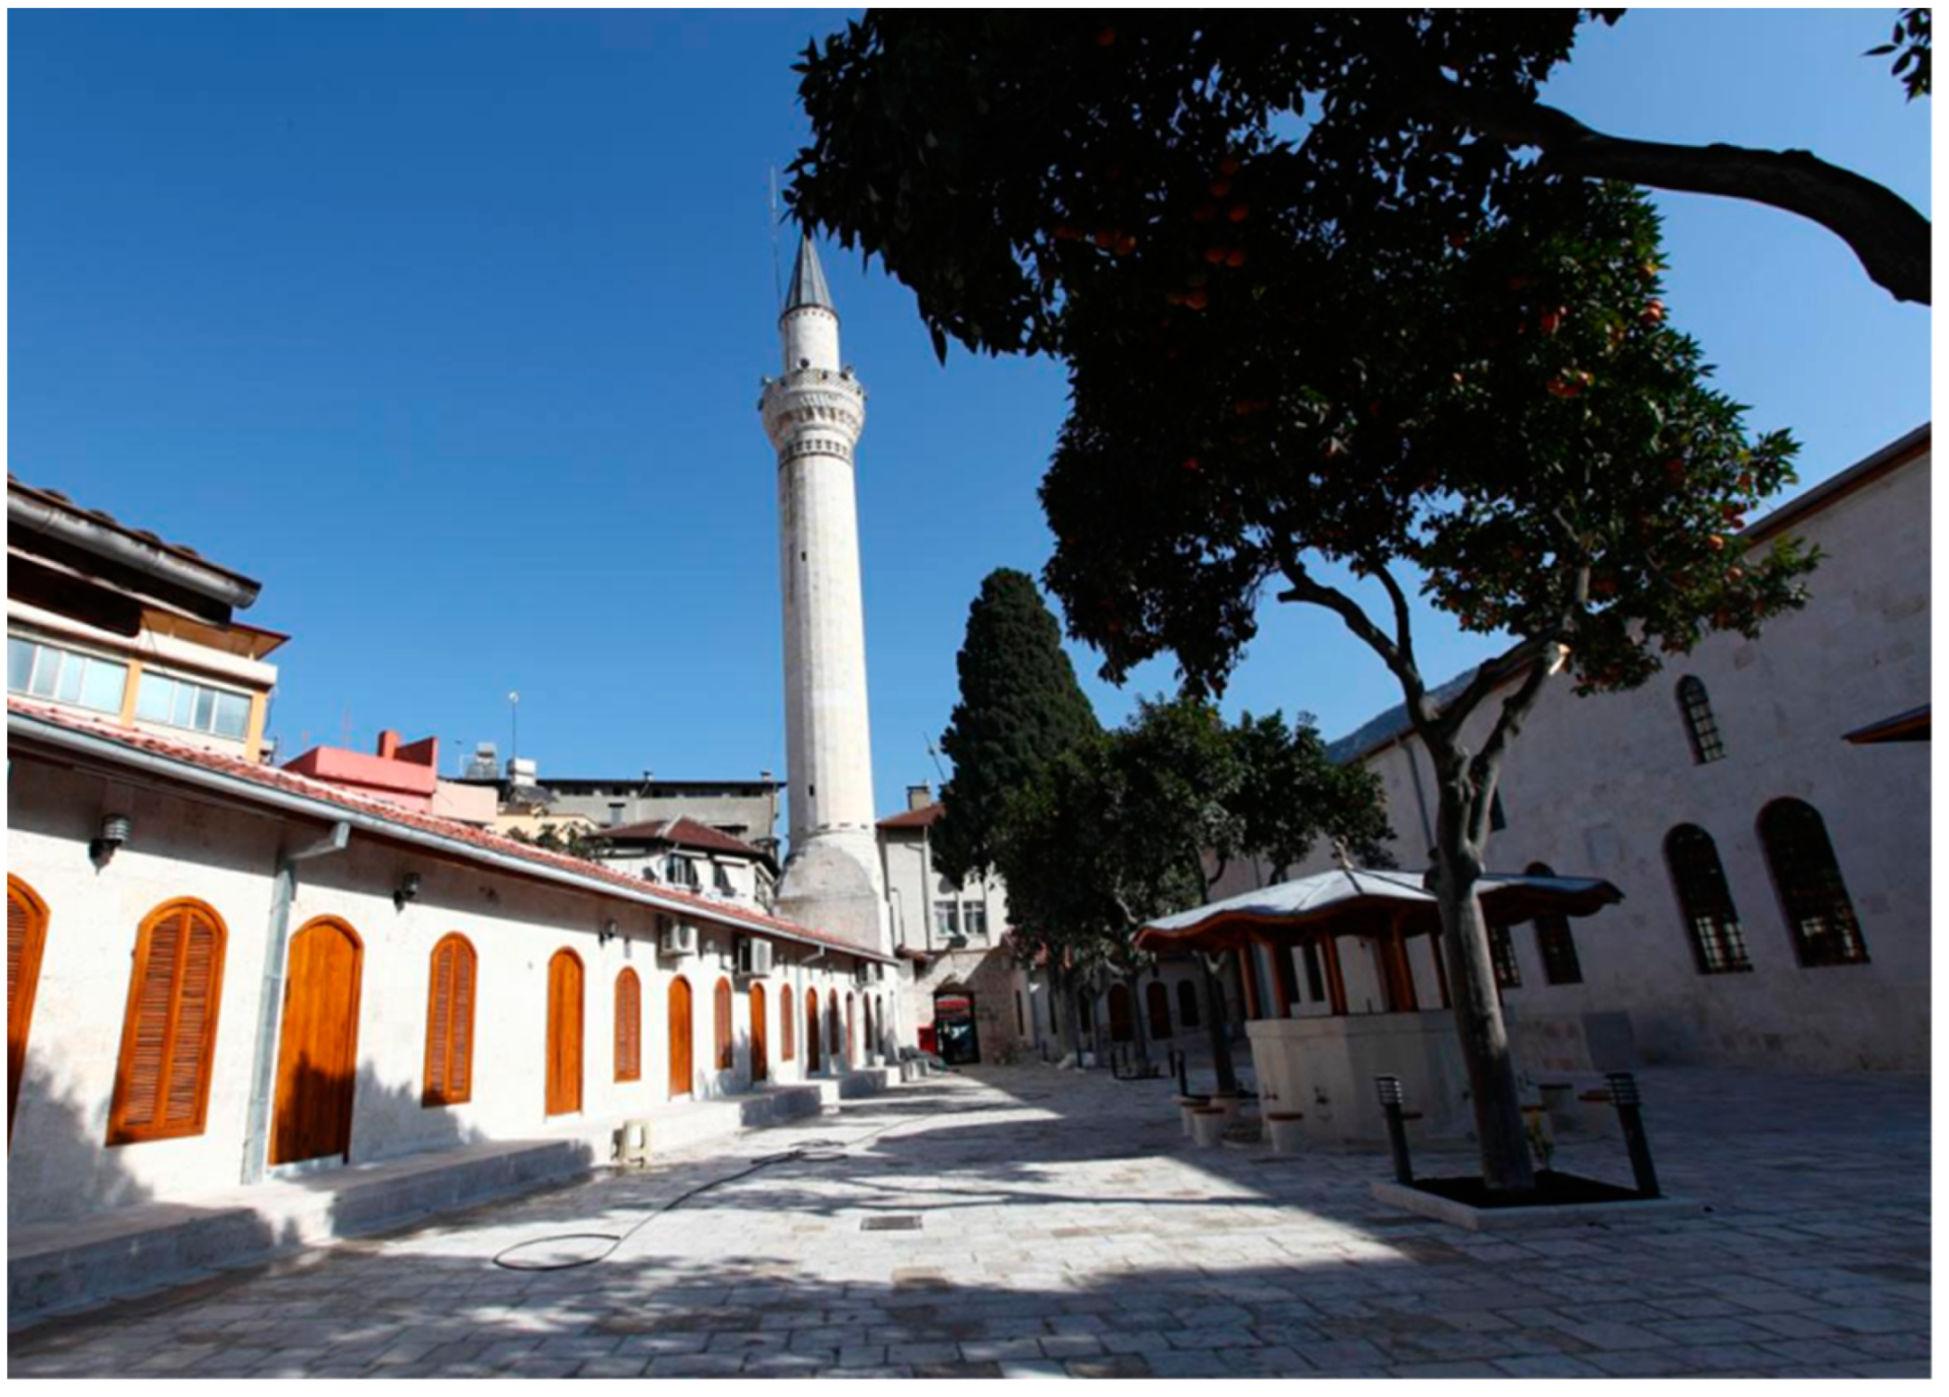
With its location, architectural design, and history, the Adyaman Ulu Mosque (Figure 3), constructed as the city’s first great mosque, dates back to the 16th century. Constructed by Bozkurt Bey in the Dulkadirli Principality, this unique piece of architecture was built using bricks with the dome centrally positioned on the roof. Mosques with central domes first appeared during the Ottoman Empire’s classical era [16]. The mosque was built with stone bricks from the area and had one minaret in the northwest. The earthquake caused significant damage. Only the walls on the north and west sides were standing together with the part of the roof on the northwest of the mosque.
2.2. Habib-I Neccar Mosque—Hatay
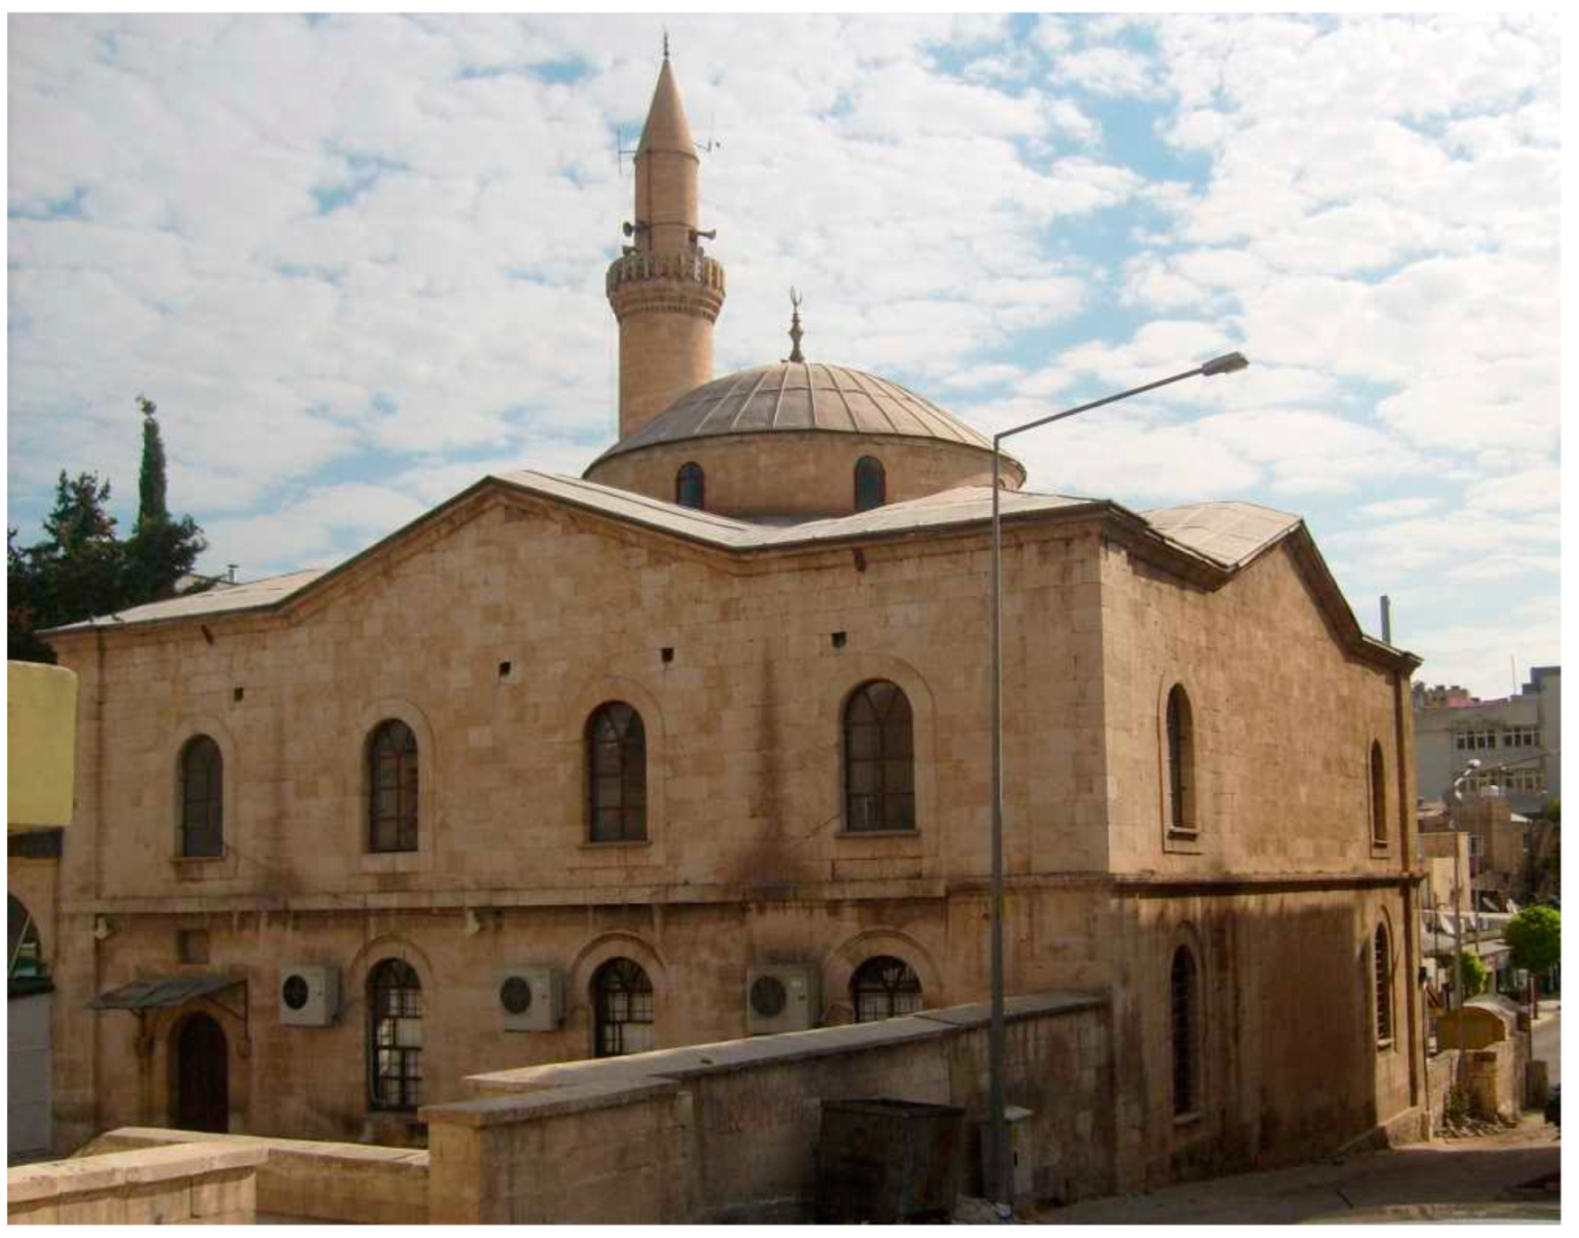
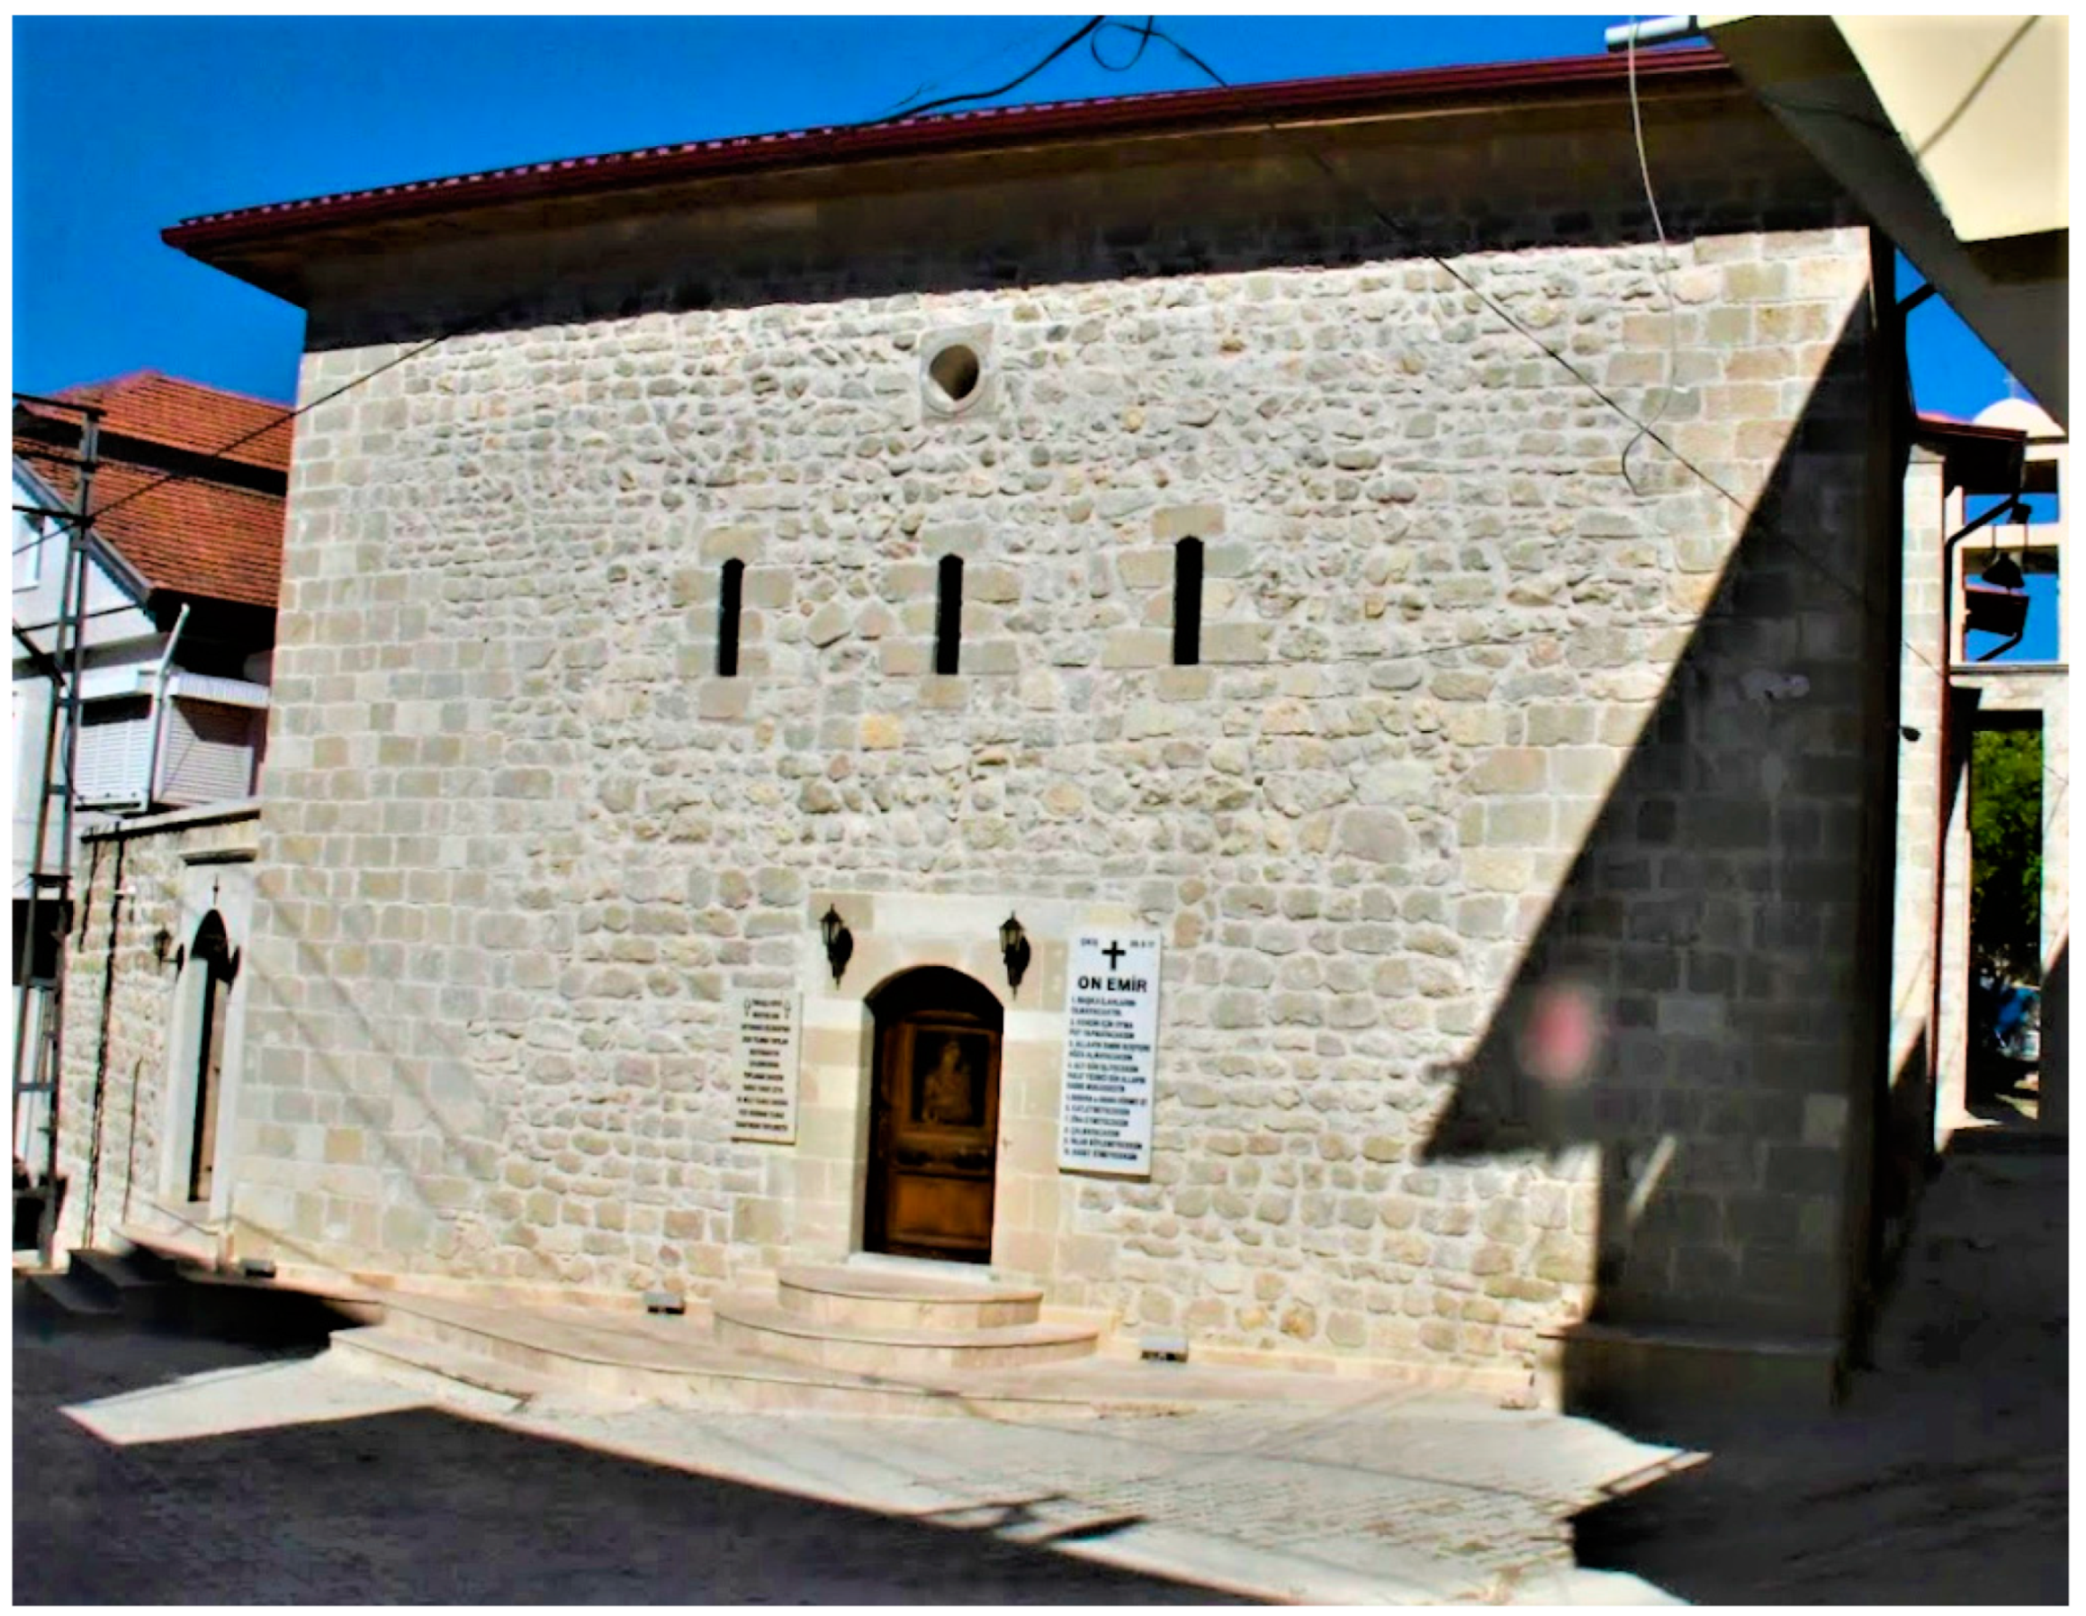
A religious man named Habib-i Neccar worked to spread Christianity while living in Antakya during the Roman era (64 BC–396 AD). The precise date and method of construction of the Habibi Neccar mosque (Figure 4) are unknown. There are rumors that the mosque was originally a chapel, which the Syrian Mamluks had destroyed and replaced with a mosque [18]. Habib-I Neccar mosque, built with stone blocks, which had one minaret on the northeast of the mosque, had incurred significant damage to the dome with about 60% of the roof collapsing.
2.3. Kurtuluş Mosque—Gaziantep
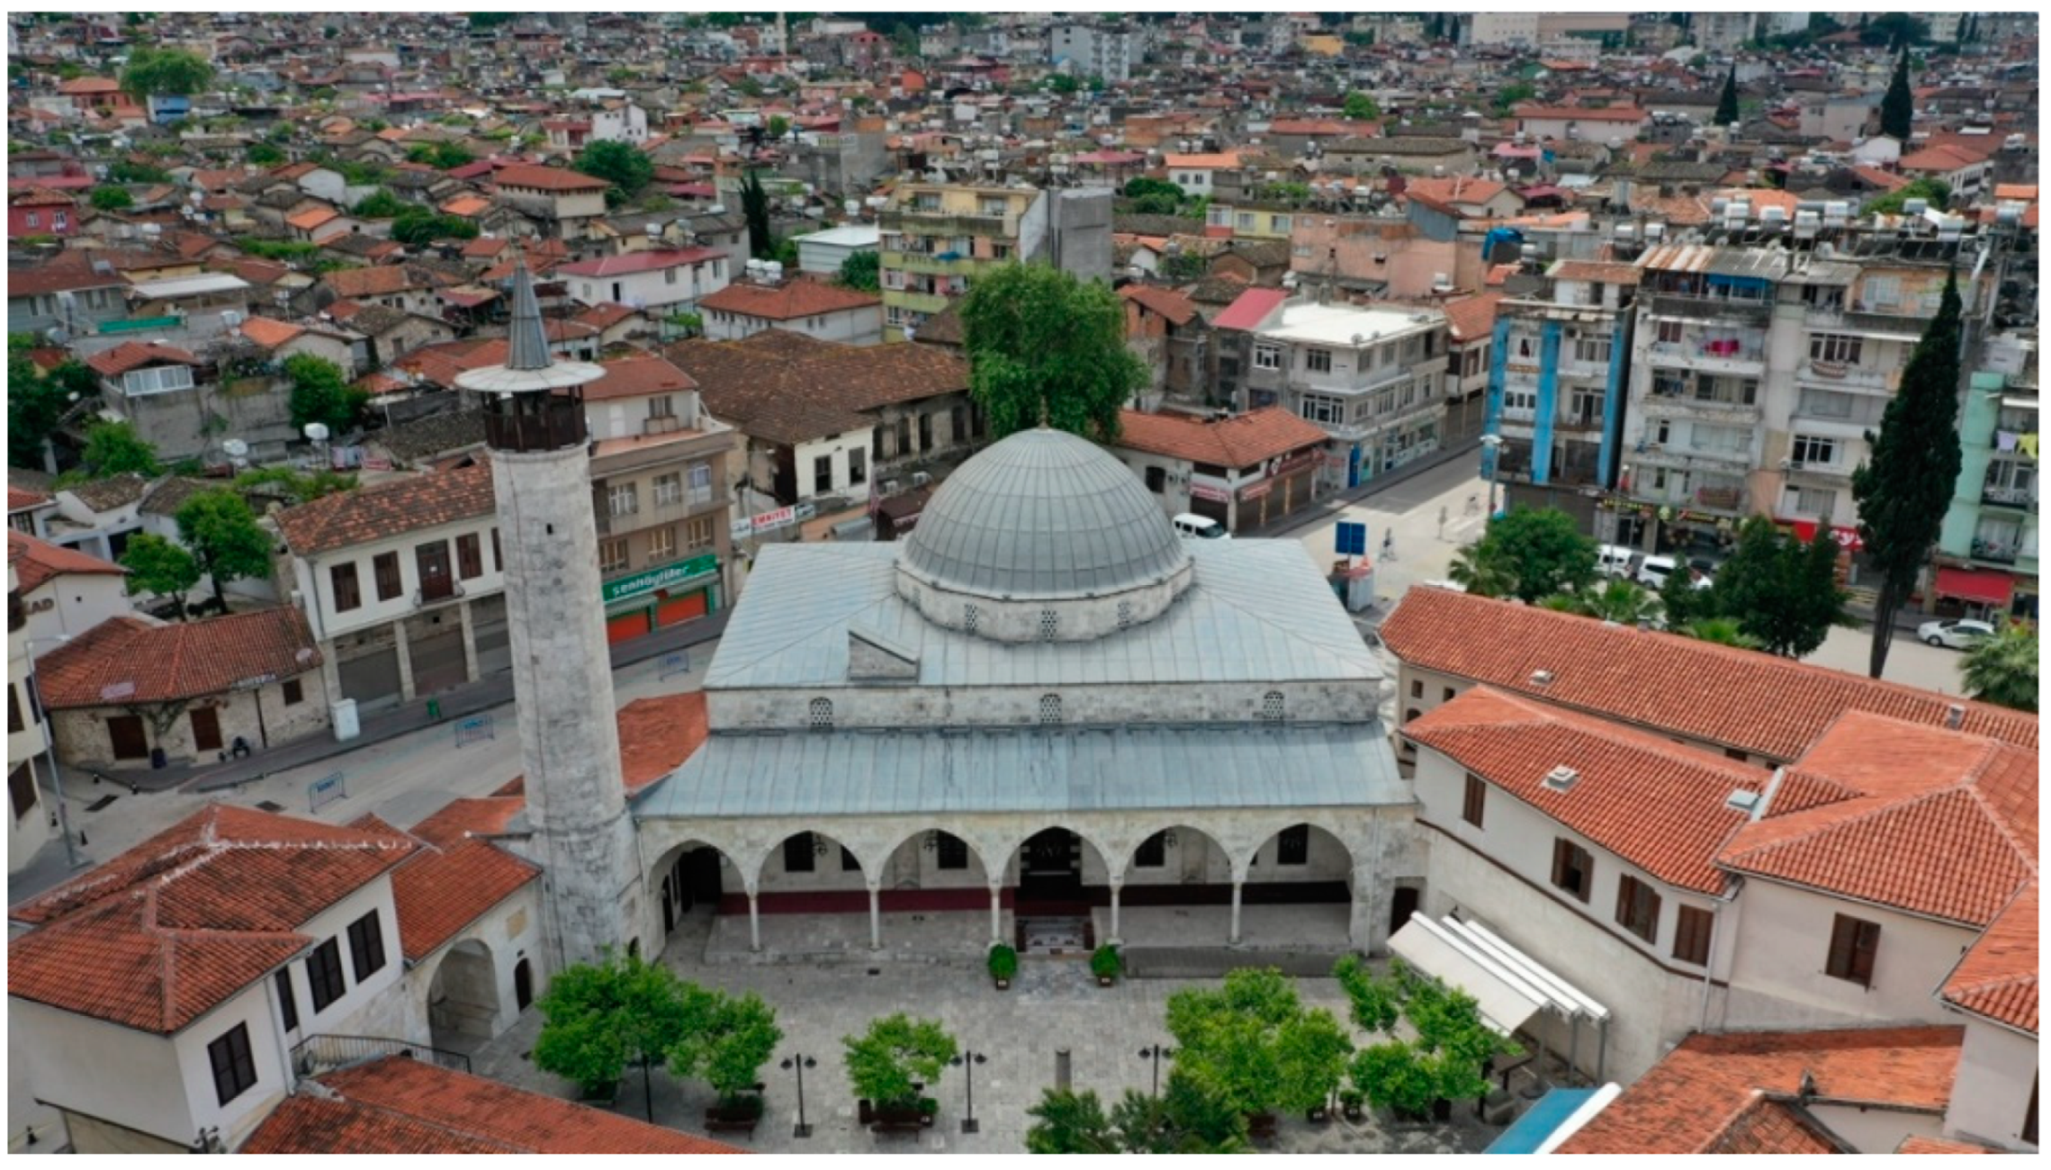
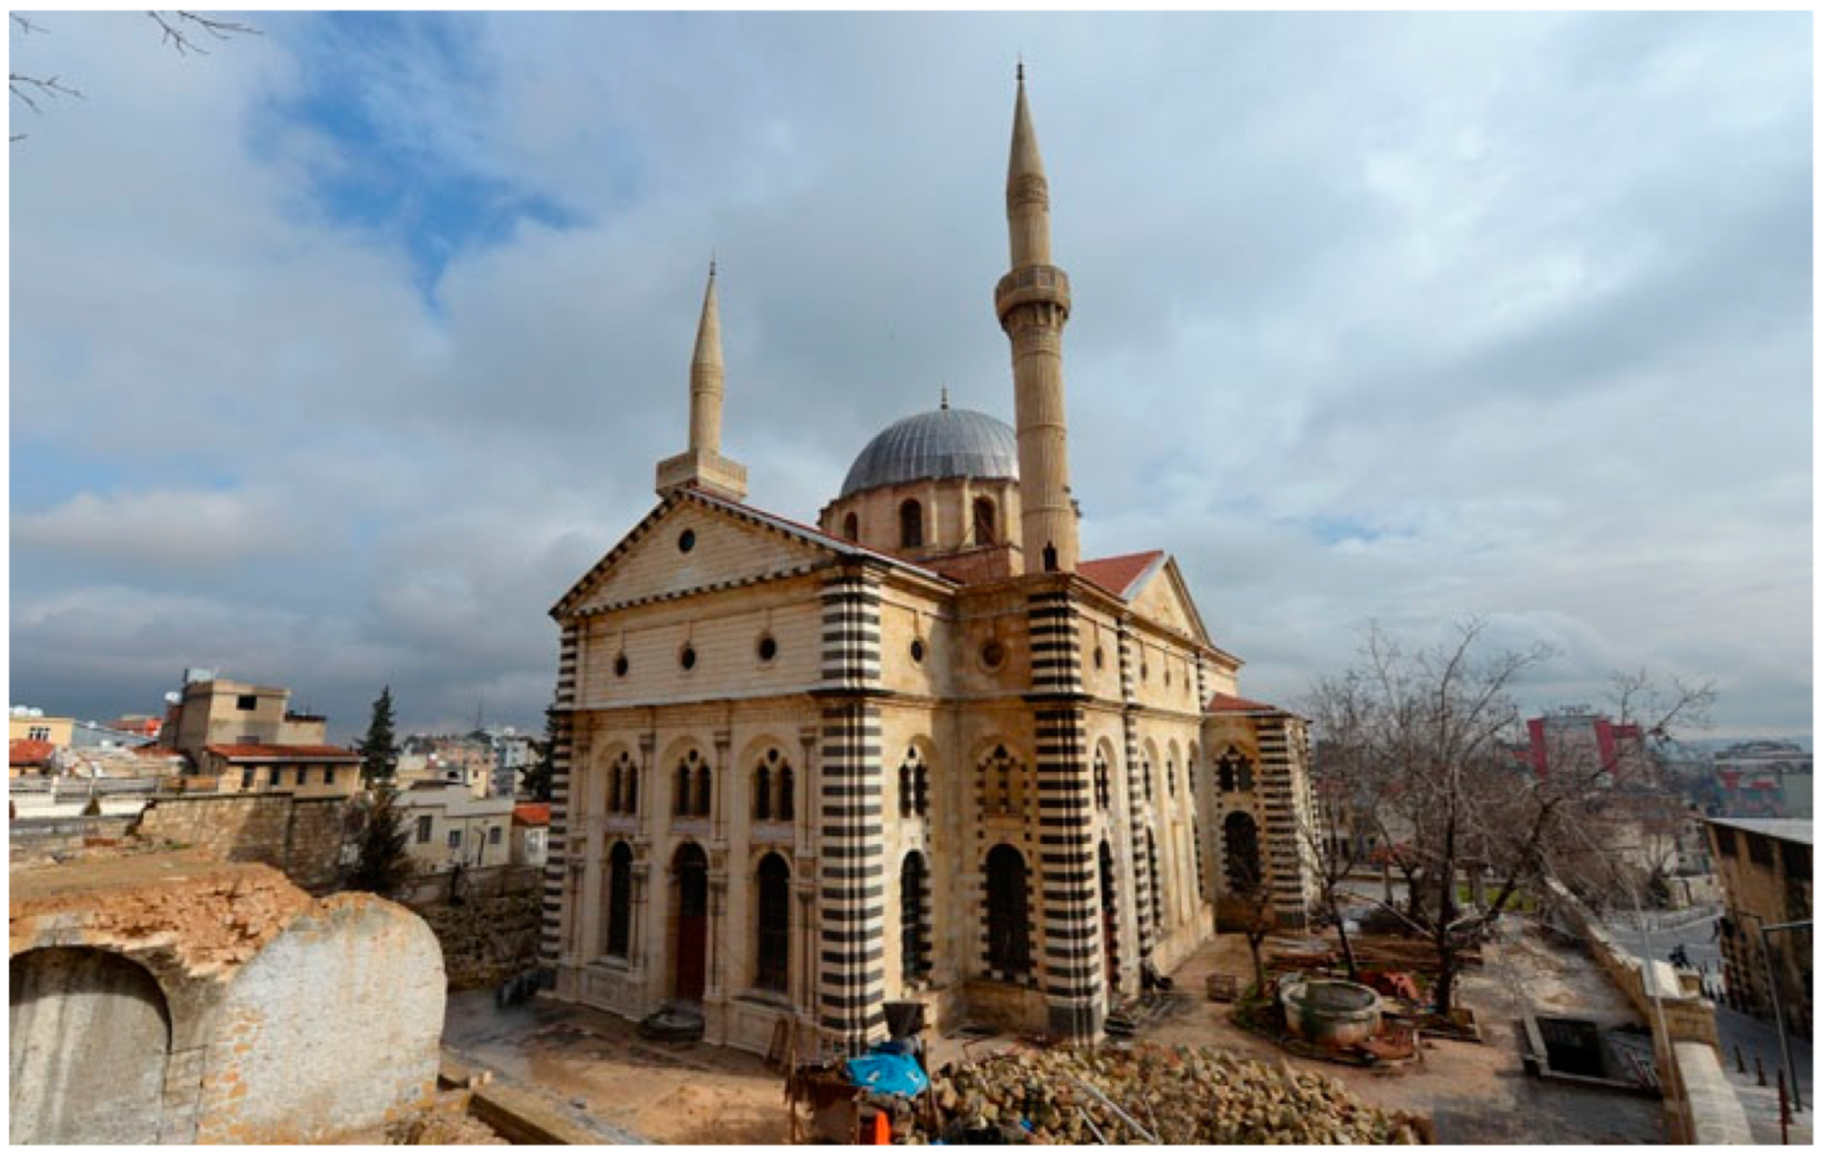
Kurtuluş Mosque (Figure 5), which was the Saint Mary Church when it was built in the 17th century by the Armenians, was one of the biggest churches in Turkey. After 1930, the church was repurposed for prison use and later converted into a mosque in 1980 [20]. The mosque is made of small-scale stone bricks with a giant dome and two minarets beside the dome. This heritage site suffered minor damage to the dome and the two minarets. When the dome collapsed into the mosque, the upper part of the minarets broke off.
2.4. Karakus Tumulus—Adıyaman
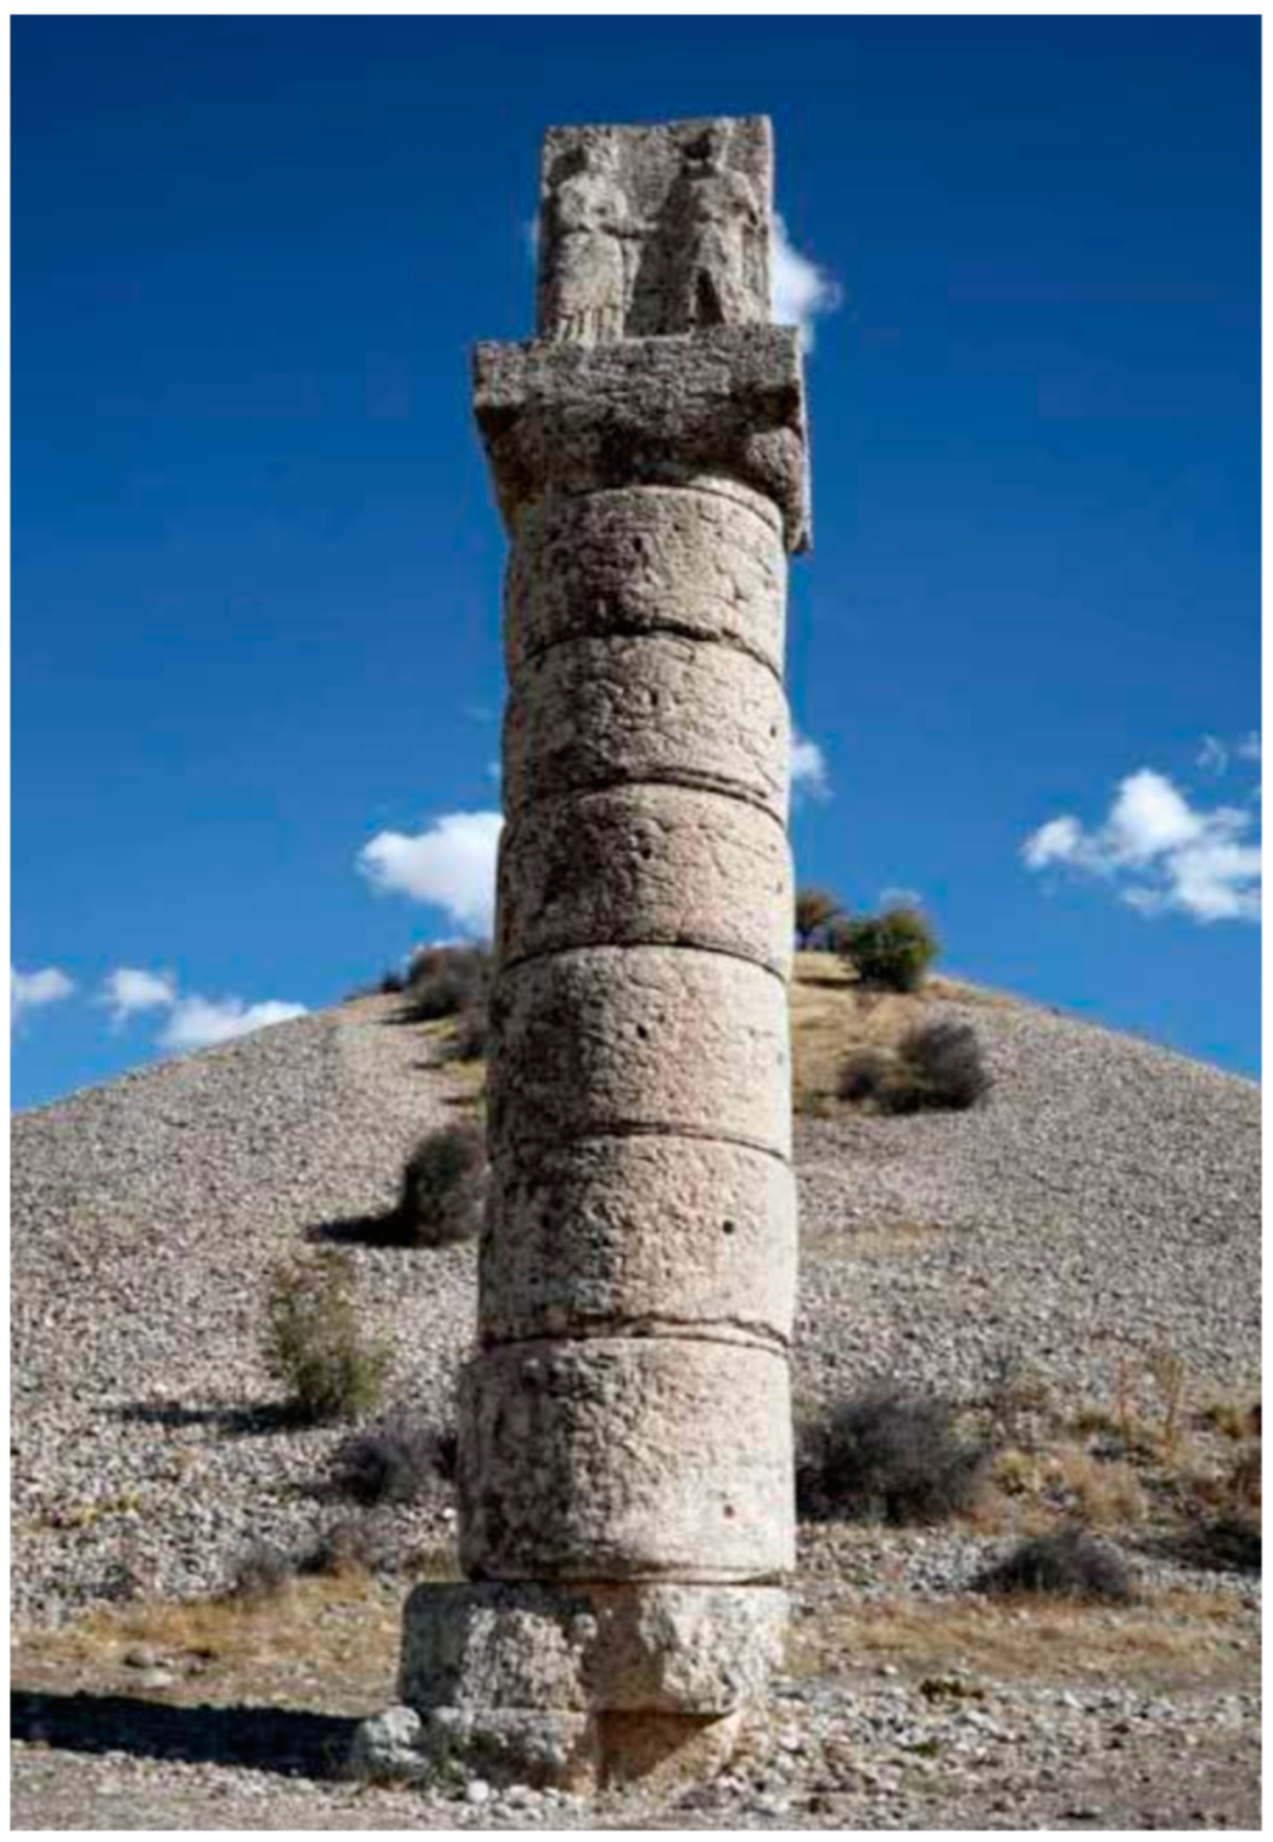
Within the boundaries of the Adyaman Kahta District is the tomb known as the Karakuş Tumulus, which belonged to the women of the Commagene Kingdom Family. Creekstones gathered at the top of the tumulus to form its summit. The tumulus is 20 m high, and because of the eagle statue on top of the column on the south of the tumulus, it was called ‘blackbird (karakuş)’ by local people. To the east of the tumulus are two 10 m tall columns. One pillar featured a bull statue and the other featured a lion statue motif. However, as of now, only the bull’s body, and not its head, is visible. The King of Commagene II, the son of the tumulus, stood to the west. To the west of the tumulus, there is a handshake relief (Figure 6) with Laodike and her brother King Mithridates II (36–20 BC), son of the Commagene King Antiochos I (69–36 BC). It is understood from the inscription on the column that the mausoleum belongs to King Antiochos’ wife, Isias, his daughter Antiochus, and his grandson Aka [22]. The column is a pile of six circular blocks carefully placed on top of each other together with the column head, carrying the famous handshake relief. The earthquake collapsed the column on the west side and damaged the Karakus tumulus.
2.5. İskenderun Latin Catholic Church—Hatay
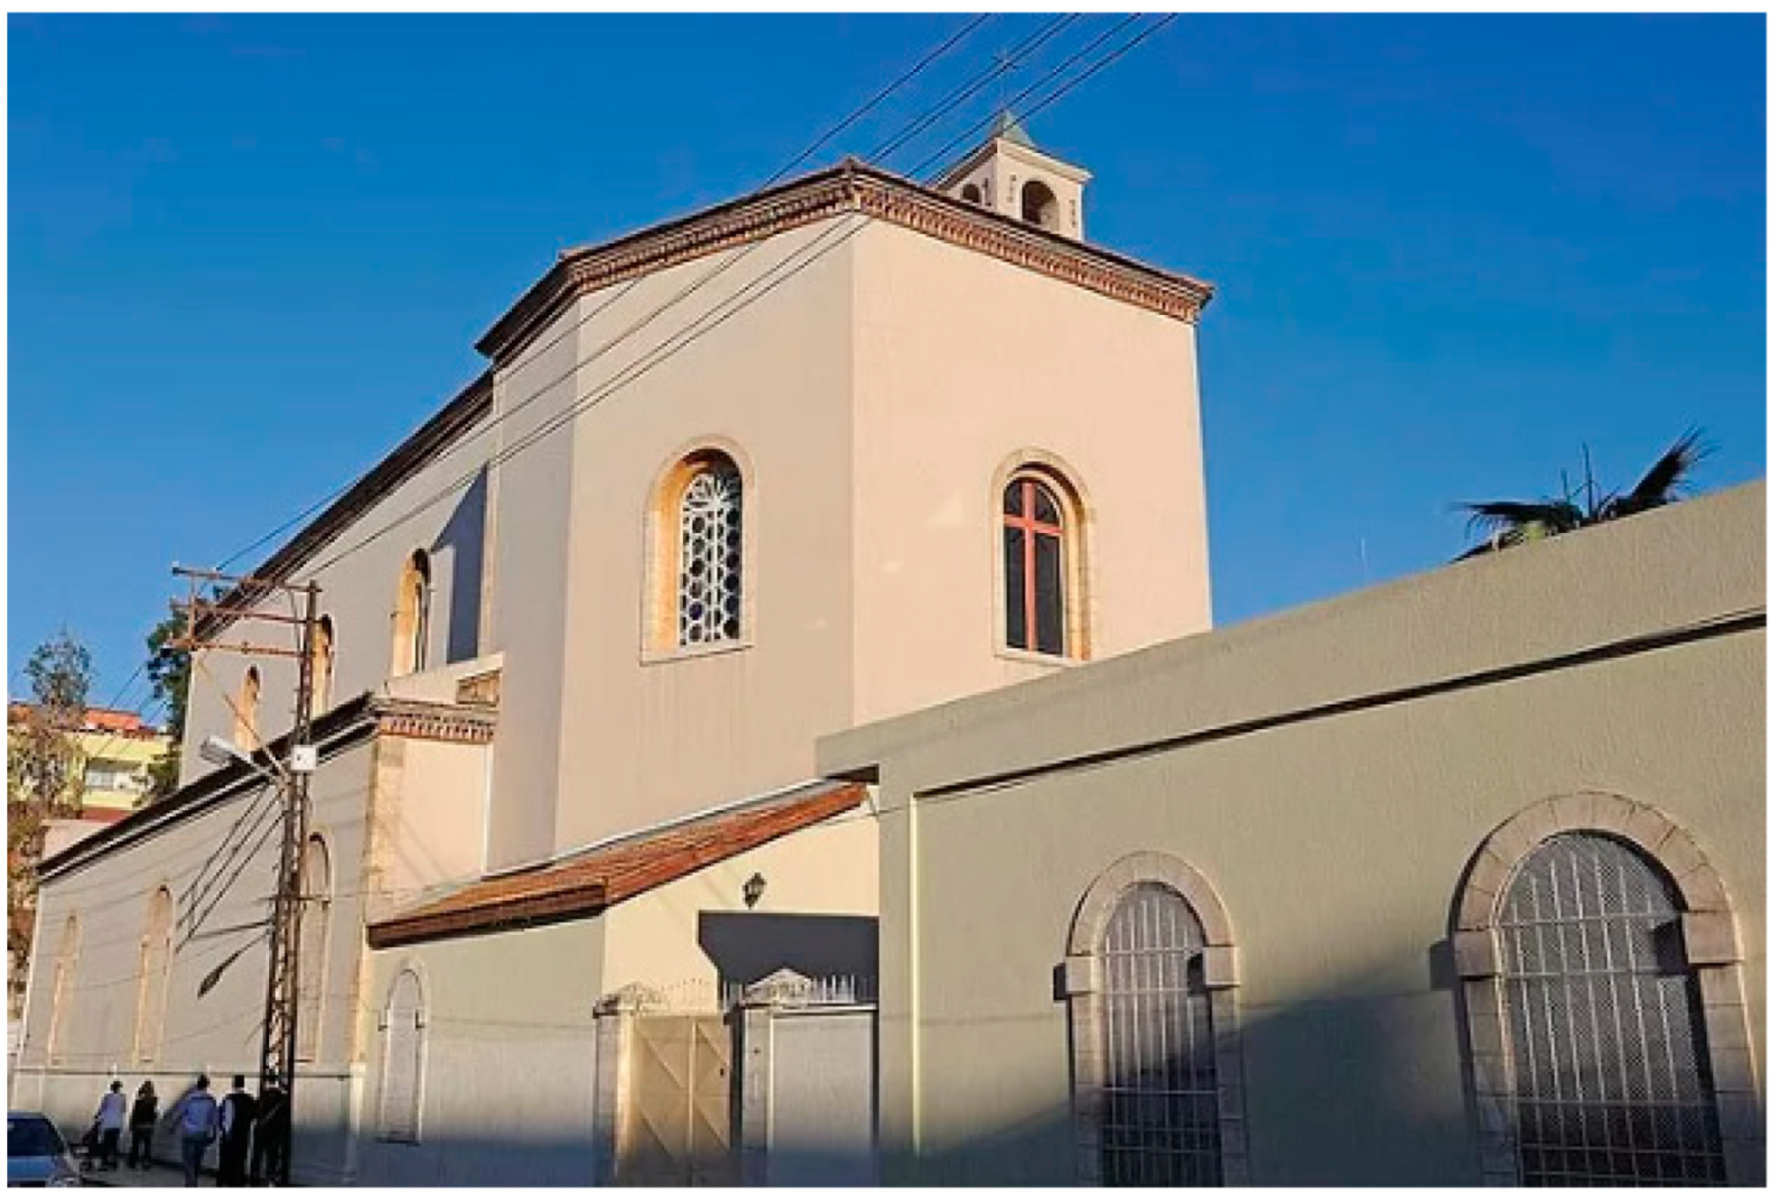
The church was first constructed in 1871, and then a monastery was added for the priests to live in. The 152-year-old church (Figure 7), which was made of red bricks (terracotta), experienced significant damage during the earthquake [24]. The roof of the church and the wall on the west side collapsed. The bell tower of the church remains in a standing position.
2.6. Saint Mary Orthodox Church—Hatay
The Greek Orthodox Church of the Virgin Mary (Figure 8), considered 700 years old, was almost entirely destroyed by the earthquake, except for the bell tower and some wall remnants on its western and southern parts [26]. It was made of stone blocks on the edge and irregularly shaped stones bonded with cement.
2.7. Ulu Mosque—Hatay
The exact date of construction of the mosque is not known. The oldest information that can be determined on this subject is the date of 1271 in the chess-shaped Kufic inscription on the minaret, which belongs to the period when the Mamluk Sultan I. Baybars dominated the city [28] (Figure 9). The mosque was built using a combination of stone blocks and irregularly shaped stones. During the earthquake, the entire structure, including the minarets, collapsed.
2.8. Greek Orthodox Church—Hatay
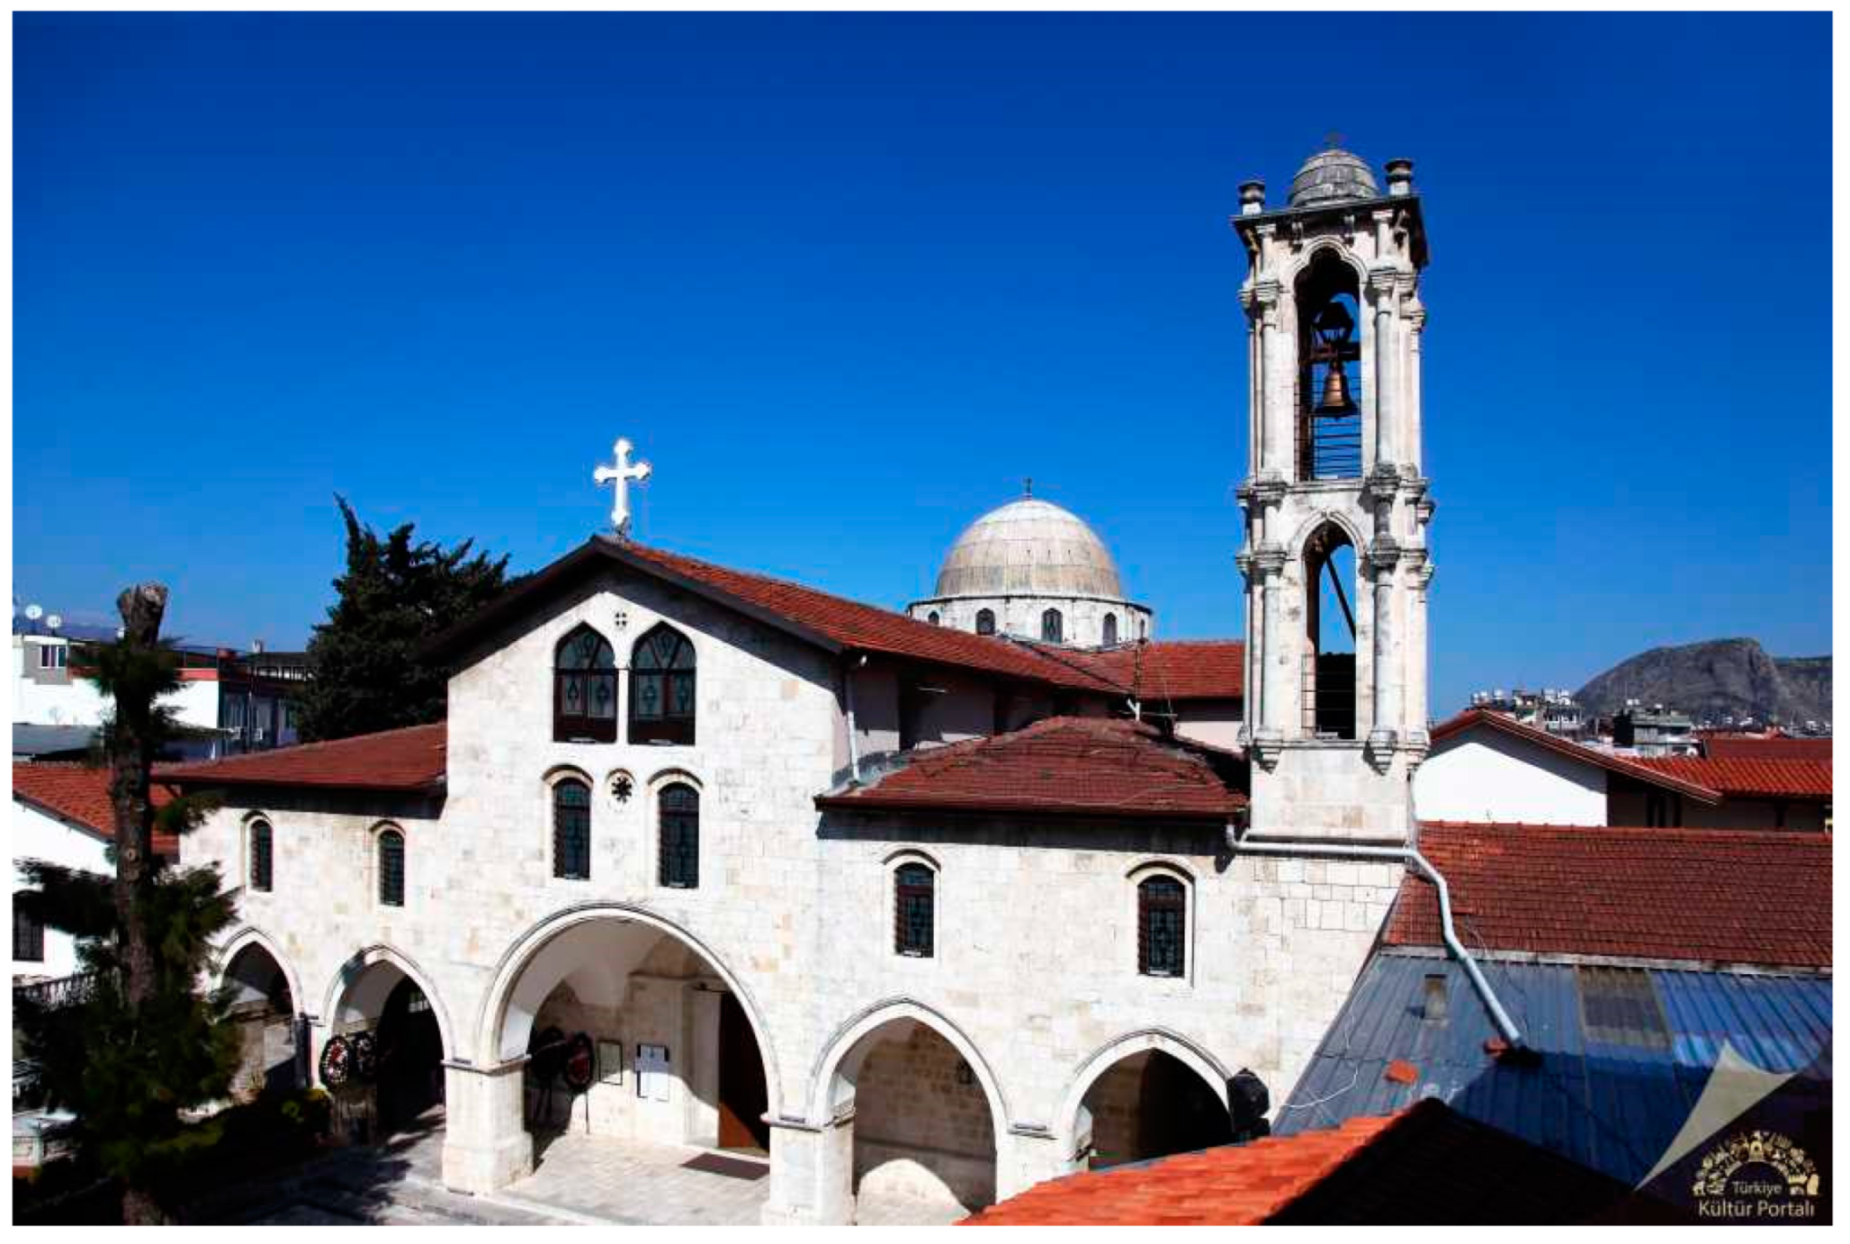
The Orthodox Church (Figure 10) was built at the beginning of the 1860s but was damaged in the 1872 earthquake. The Orthodox Church was established for worship in 1900 and is recorded as the location where the three monotheistic religions coexist. It has a rectangular shape and a bell tower in the southern part of the church [30]. The primary materials of the church were small-scale stone blocks and irregularly shaped stones as fillers inside the walls. The church suffered significant damage during the earthquake, and only some wall remnants are standing on the east and northeast sides.
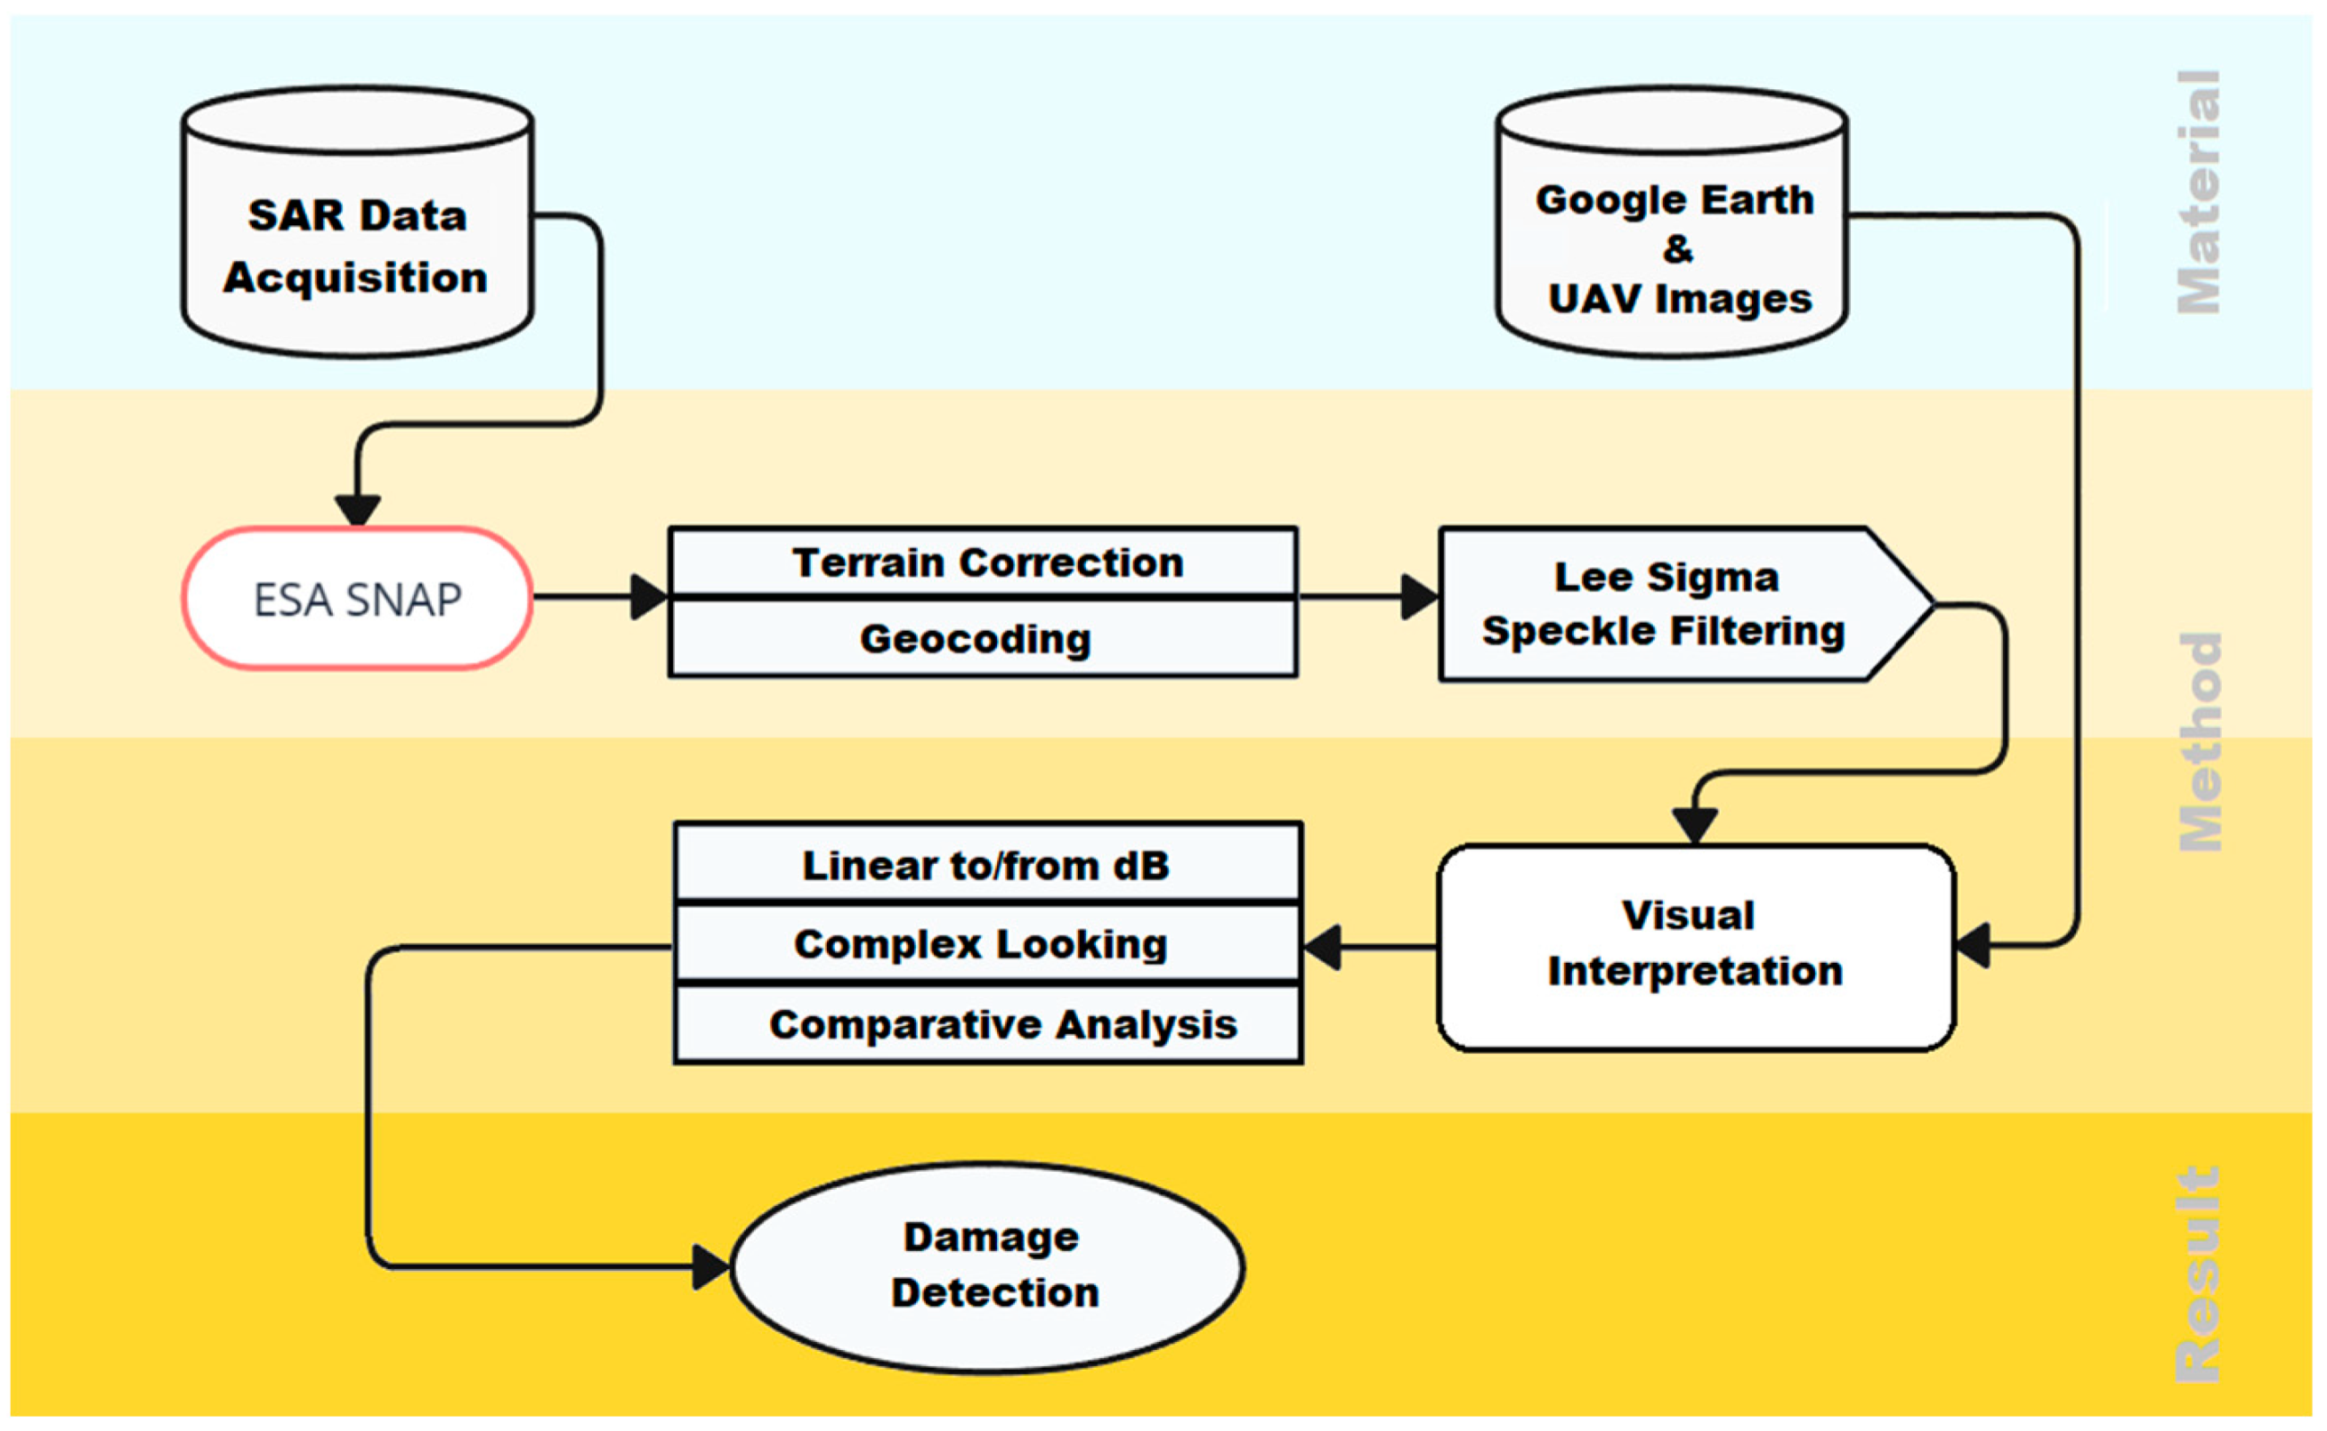
3. Materials and Method
The workflow in Figure 11 simplifies the series of steps taken. We acquired TerraSAR-X images and applied speckle filtering and geo-correction before the interpretation step. In the interpretation step, the color transformation from the SAR backscattering within a suitable color range for visual interpretation is essential. In a target-dependent analysis, we use amplitude, intensity, and linear stretching to the logarithmic dB scale. As single SAR images are difficult to analyze, comparative and joint analyses with collateral data, such as Google Earth, photographs, and UAV images, are often crucial for a better understanding of the data.
3.1. Material
TerraSAR-X data were made available for this study thanks to the quick and timely support of the DLR science team. Since its launch in 2007, TerraSAR-X has continuously provided spaceborne synthetic aperture radar (SAR) images of our planet with unprecedented spatial resolution, and geodetic and geometric accuracy [32]. For this study, we used centimeter-level TerraSAR-X high-resolution X-band SAR images acquired in 2023, immediately after the earthquake. With coarse spatial resolution data, damage detection is usually performed on a building group or at the residential area level. In the very high-resolution (VHR) SAR image, many more building features like edges and point structures become visible. The spatial resolution enables the analysis of individual buildings. The data obtained and used for the research were of two basic acquisition modes: high-resolution spotlight mode and staring spotlight mode. In the staring spotlight mode, the beam sweep rate is set to equal the reference target’s frequency modulation (FM) rate. In other words, the radar beam is configured to exactly follow the target over time, and the squint angle range can be up to ca. ±2.2 degrees. As a result, the azimuth resolution is maximized, enabling it to capture data with up to 0.25 m resolution [32]. The satellite passes include ascending orbits, in which image capture is carried out approximately from the west, and descending orbits, where image capture is carried out approximately from the east. SAR sensors are side-looking and do not offer nadir-view images [33]. All nine images were acquired in single polarization mode, except Hatay city center with dual polarization mode (see Table 2).
Besides SAR images, we also used optical data from Google Earth and Bing to recognize and compare the results we achieved from SAR images. Right after the earthquake, Google Earth updated its images in some cities of the earthquake zone, which helped us validate damage to cultural heritage sites detected during visual analysis and interpretation of Terra-SAR-X images. We received 30 images and could visually detect damage to some of the cultural heritage sites.
3.2. Method
3.2.1. Data Processing
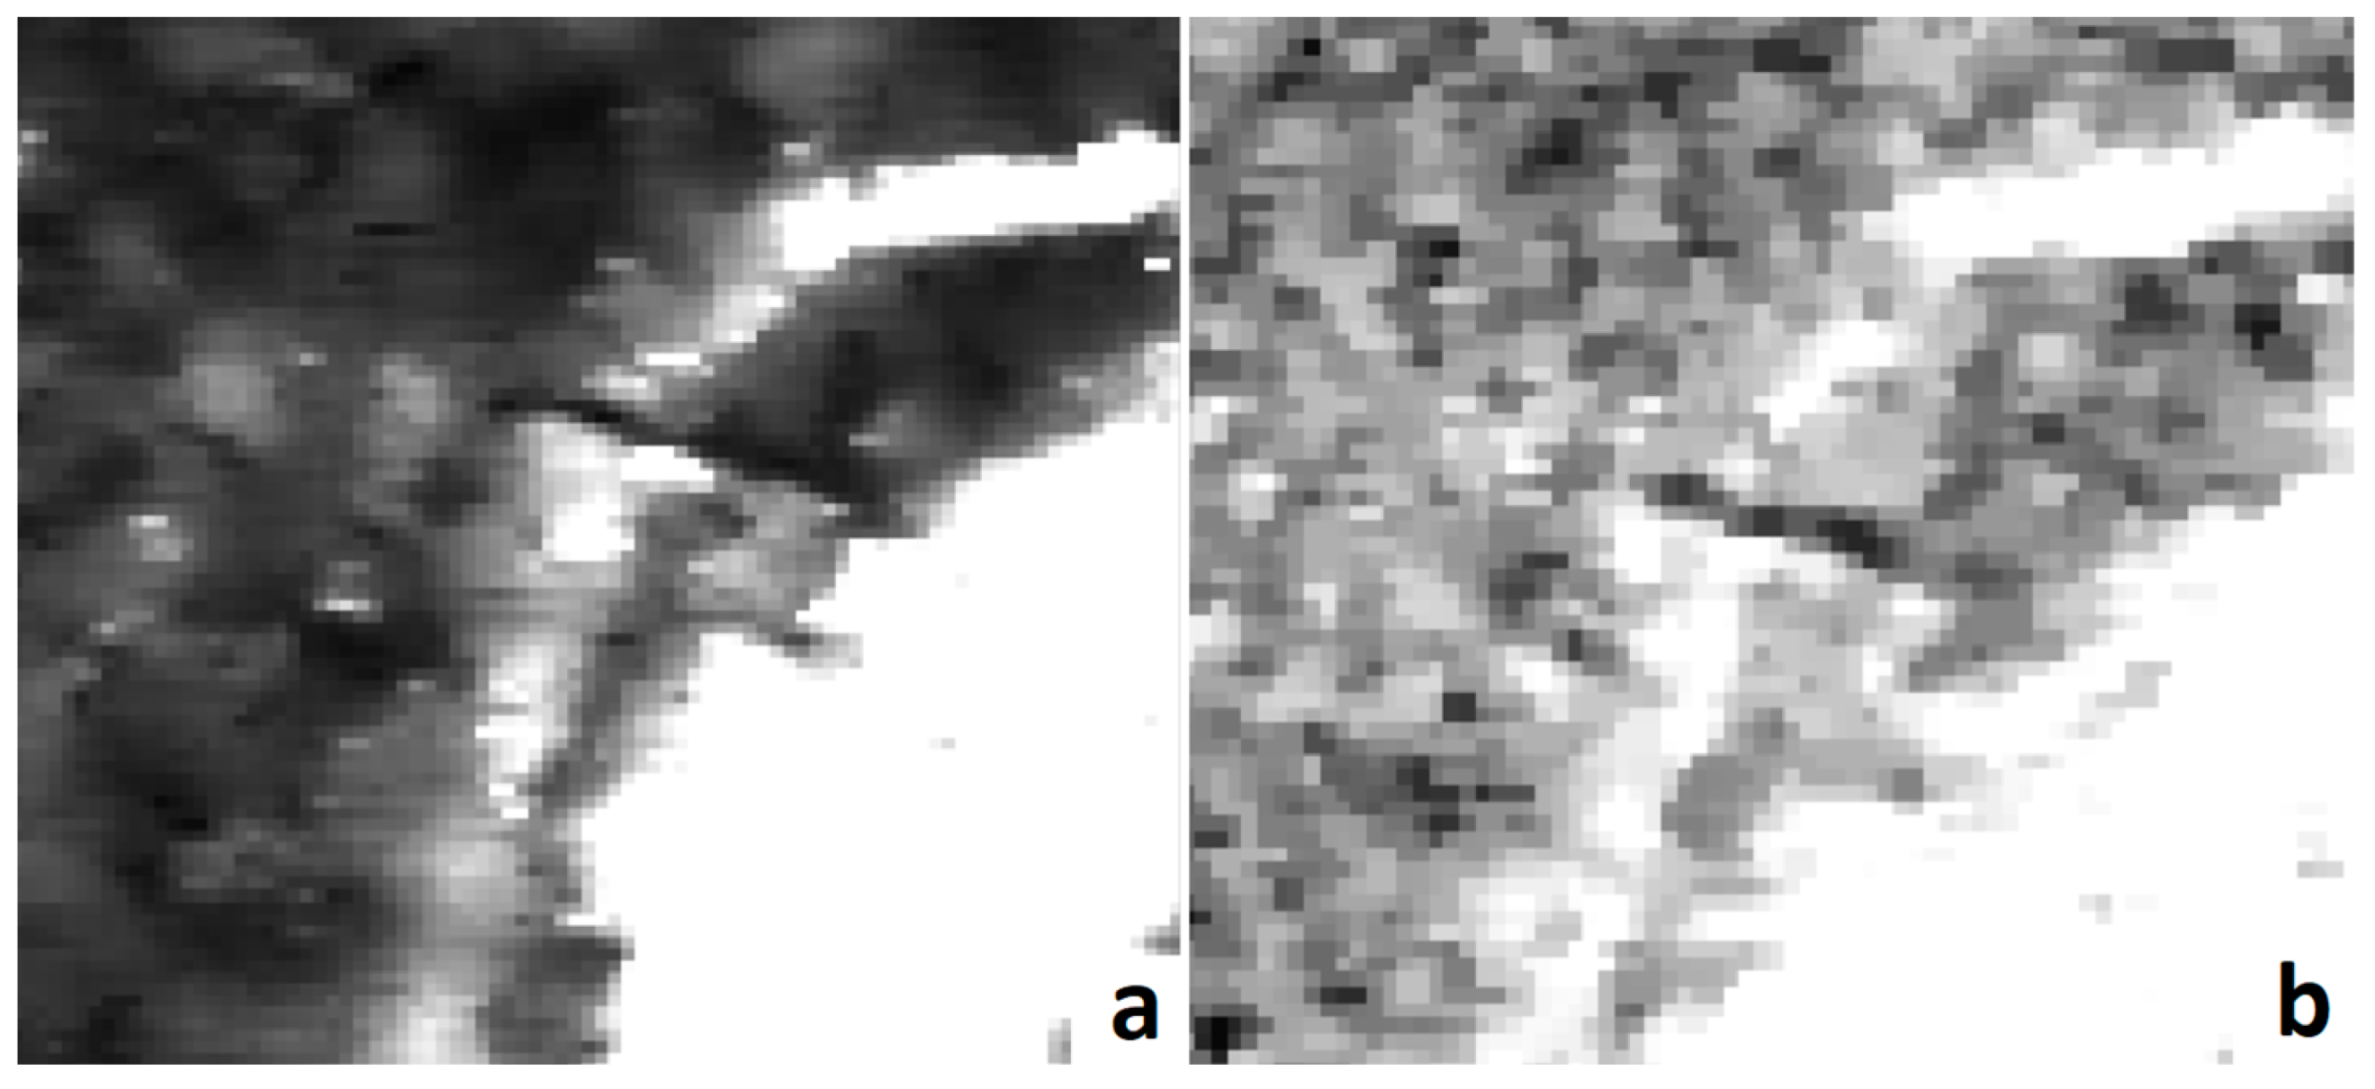
We used Sentinel Applications Platform (SNAP) software to process the TerraSAR-X images in the processing part. First, we used Range-Doppler Terrain Correction to correct the geometry of the images. After geometric correction, the Lee Sigma Speckle Filter was used to understand the linear structures more efficiently. Before deciding on using the Lee Sigma filter, we compared the Lee Sigma filter with others, e.g., the non-linear Median filter. The Median filter provides sharper edges, but there was more speckle, which made it difficult to detect some damage (Figure 12). The Range-Doppler method has been extensively employed in the terrain-geocoding of SAR data because it is a physical solid sensing concept that yields the maximum geometrical precision [34]. This model transforms the SAR coordinates in the 2-dimension image space and geographic coordinates in the 3-dimensional object space [35]. The Lee Sigma Speckle Filter, which is the default parameter, was the most effective filter, retaining the original image’s quality. Sigma filter can smoothly carry out image augmentation and separation and smoothing of signal-related noise [36]. Both filtered and non-filtered images are examined to understand the geometry of the structures.
In some locations, we applied the SNAP tool ‘Linear to/from dB’ to visualize in a broader spectrum. The distribution of backscatter information over the specified color range affects the clarity of visual information from the images. The dB data are logarithmic. As a result, there are more grey pixels and fewer extreme values.
3.2.2. Visual Interpretation
Interpreting SAR images can be challenging, even with very-high-resolution images, because of the unique mode of acquisition that involves sending microwaves and receiving the backscatters, which can be challenging to interpret because of layovers, foreshortening, and shadows. Some parameters to consider for the best possible results include polarization, orbit, and incident angle. We received TerraSAR-X images with different acquisition parameters to find the most suitable images for detecting damage to cultural heritage in the earthquake zone.
Since we did not have pre-event images of the earthquake zone, it was impossible to use change detection methods like Coherence Change Detection. We must visually interpret the images to detect damage and validate them with pictures from earthquake sites.
We devised a mechanism for detecting structural damage, because we were dealing with only post-disaster SAR images due to a lack of archived high-resolution images (Figure 13). To do this, we categorized the damage:
- Partially collapsed: In this situation, the shape and nature of the damage, e.g., Circular dome, curvature of the roof edges, and remaining walls, are used to identify damage.
- Totally collapsed: With little or no reflectance, we relied heavily on backscatter from the surrounding structures. In Figure 13, images a and b, we have marked the buildings around the target location, which helped us to identify the damage.
- Special conditions: In Karakus Tumulus, the acquisition parameters and the standing columns’ shadow angle were vital in identifying the collapsed column.
4. Results
Visual interpretation of SAR images is a challenging undertaking, and when it comes to detecting damage in a single SAR image, it is a difficult task. Therefore, we have used different polarizations, orbits, and incident angles. In addition, optical images were used to compare with SAR images to verify our damage detection results. In this study, eight sites were selected and assessed for various damage types, ranging from partial to total collapse, all showing varying degrees of reflectance in the images. We could detect strong backscatter from the Adyaman Ulu mosque’s remaining northwestern roof corner and the Habib-i Neccar mosque’s collapsed circular dome. In addition, nearly no backscattering was seen in the Hatay Ulu mosque because its roof had collapsed. We are demonstrating the role the difference in the nature of structural damage played in the image interpretation. In the following figures, yellow polygons indicate structures and red arrows indicate the viewing direction of the sensor.
4.1. Totally Collapsed Structures
In some cultural heritage sites, like the Hatay Ulu Mosque (Figure 14) (36°12′6.98″ N, 36°9′42.74″ E), the damage was extensive, and the mosque completely collapsed due to the earthquake. In situations like this, where the entire structure is damaged, detecting the location and damage in a single SAR image was even more complex. In comparison, detecting a partly damaged roof through the backscattering effect would be easier. Still, this example was harder to interpret because the only way to verify was by checking the structures’ location and comparing coordinates.
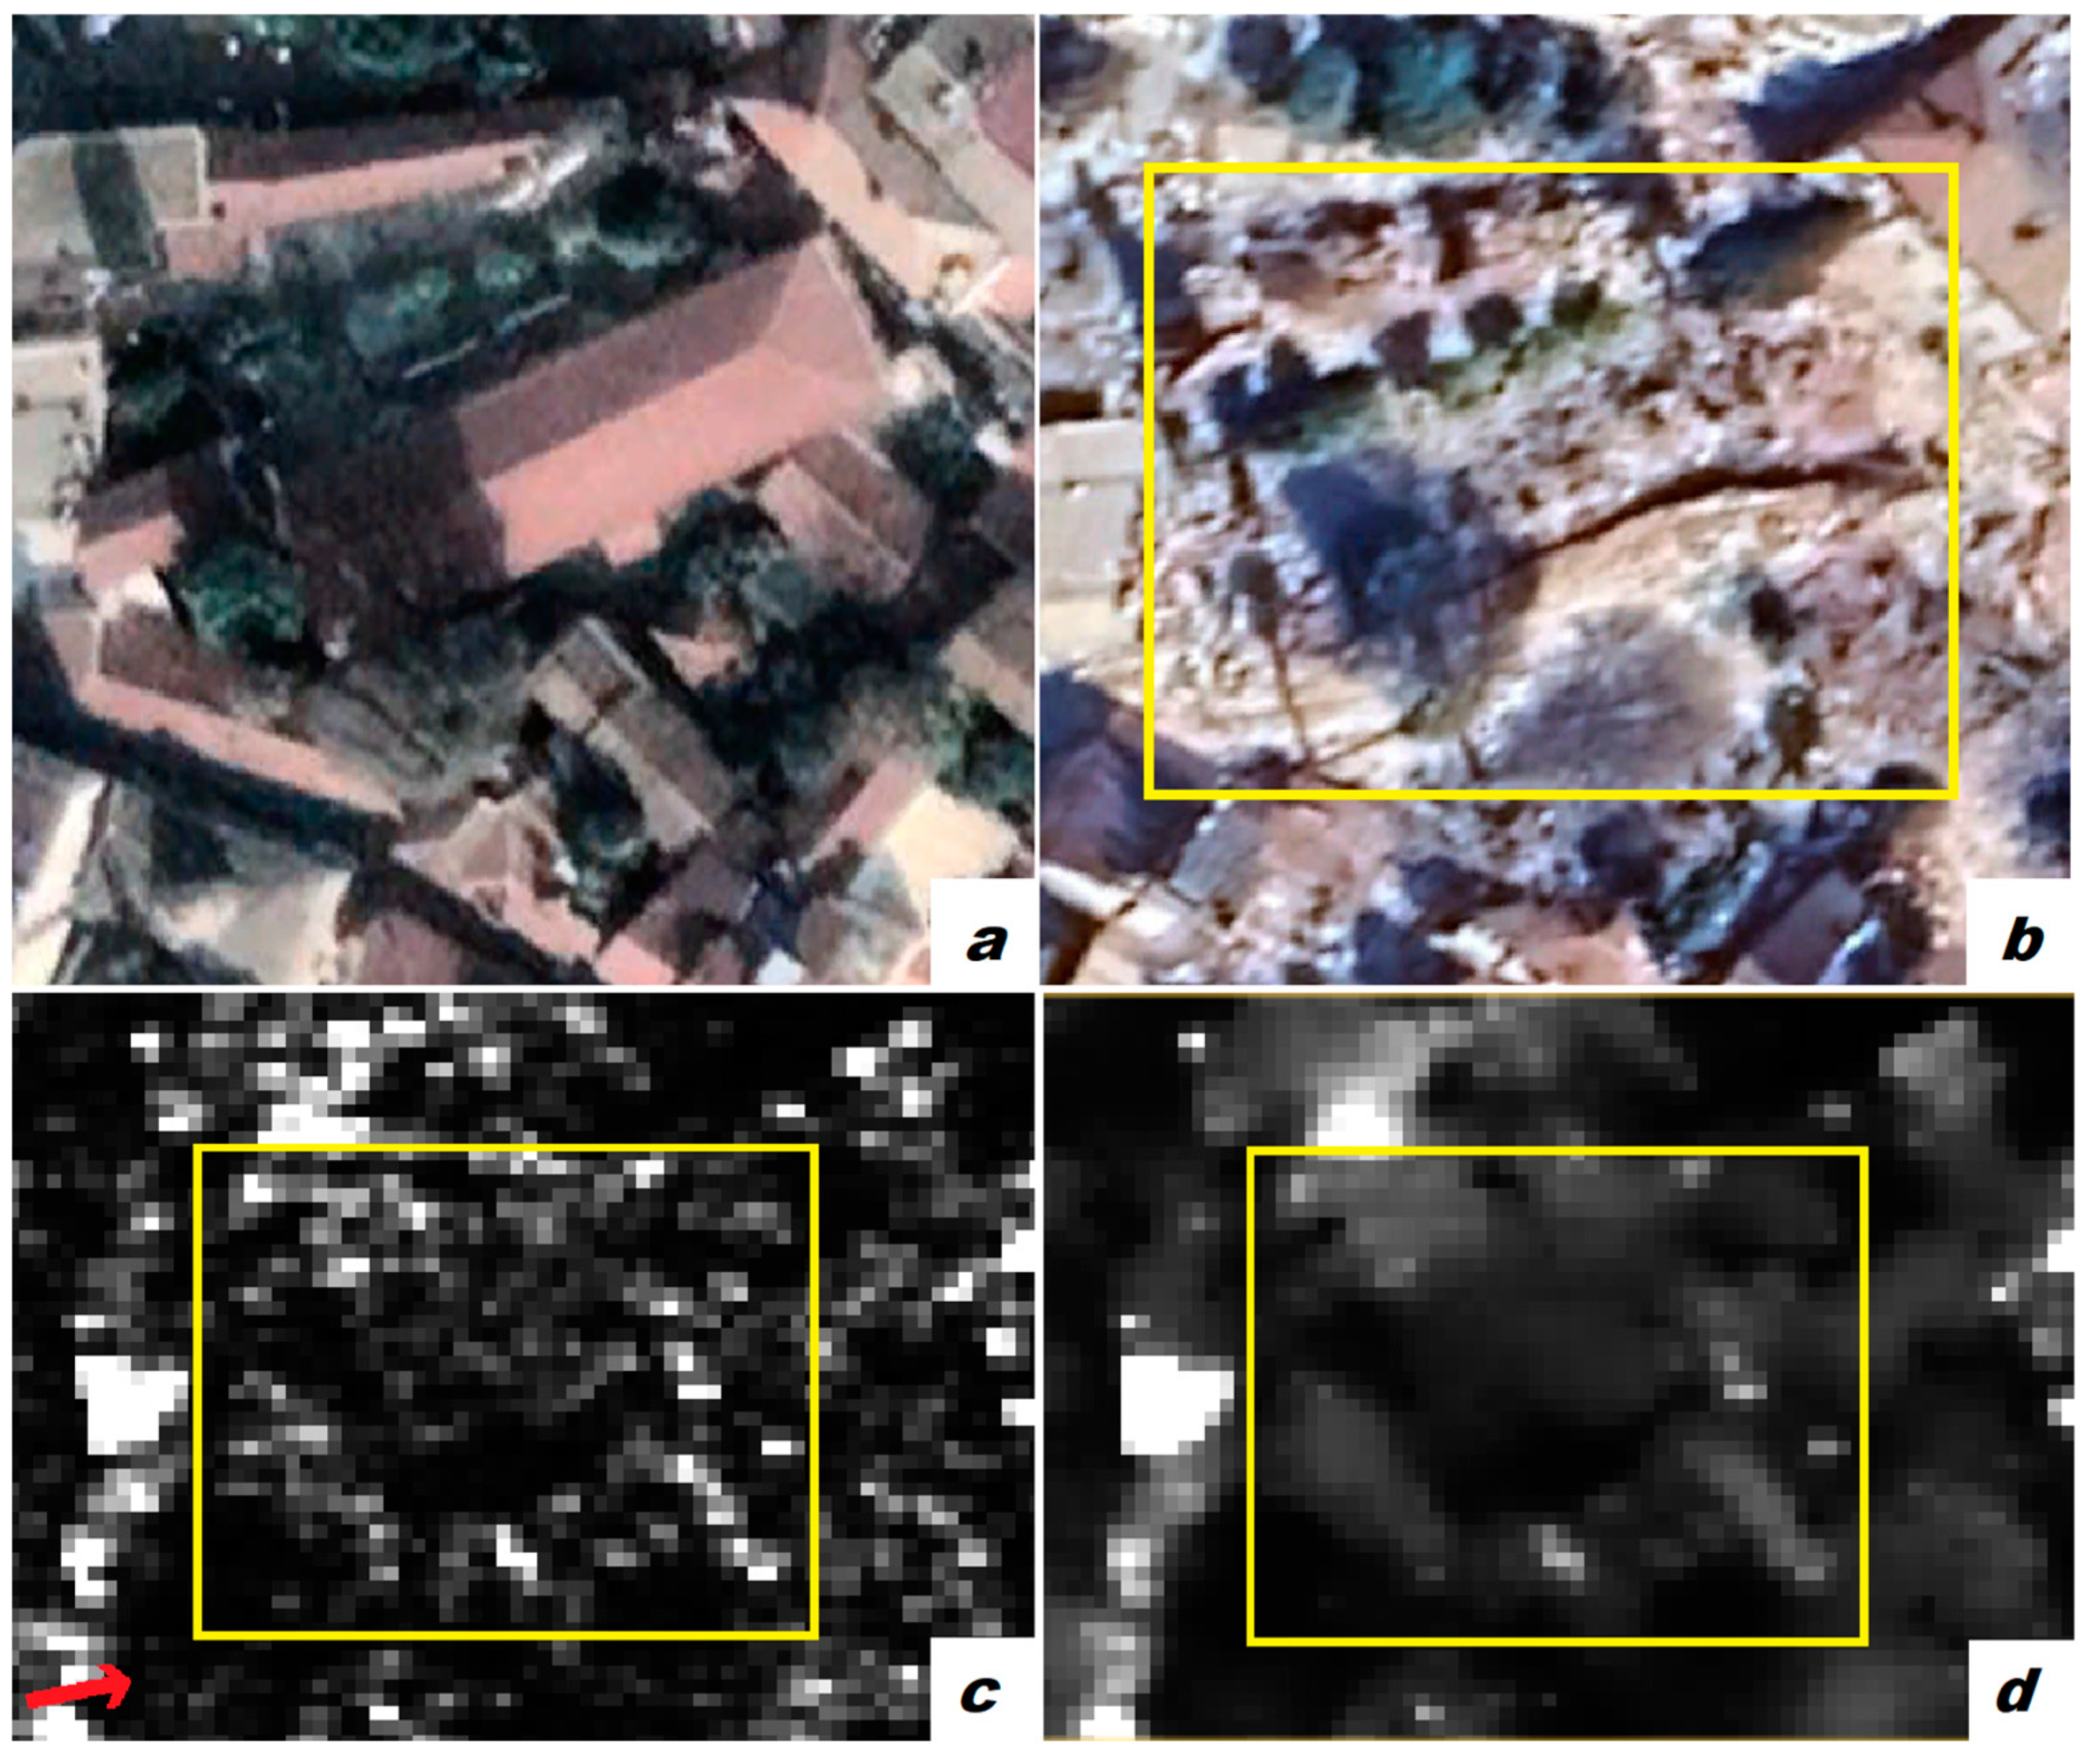
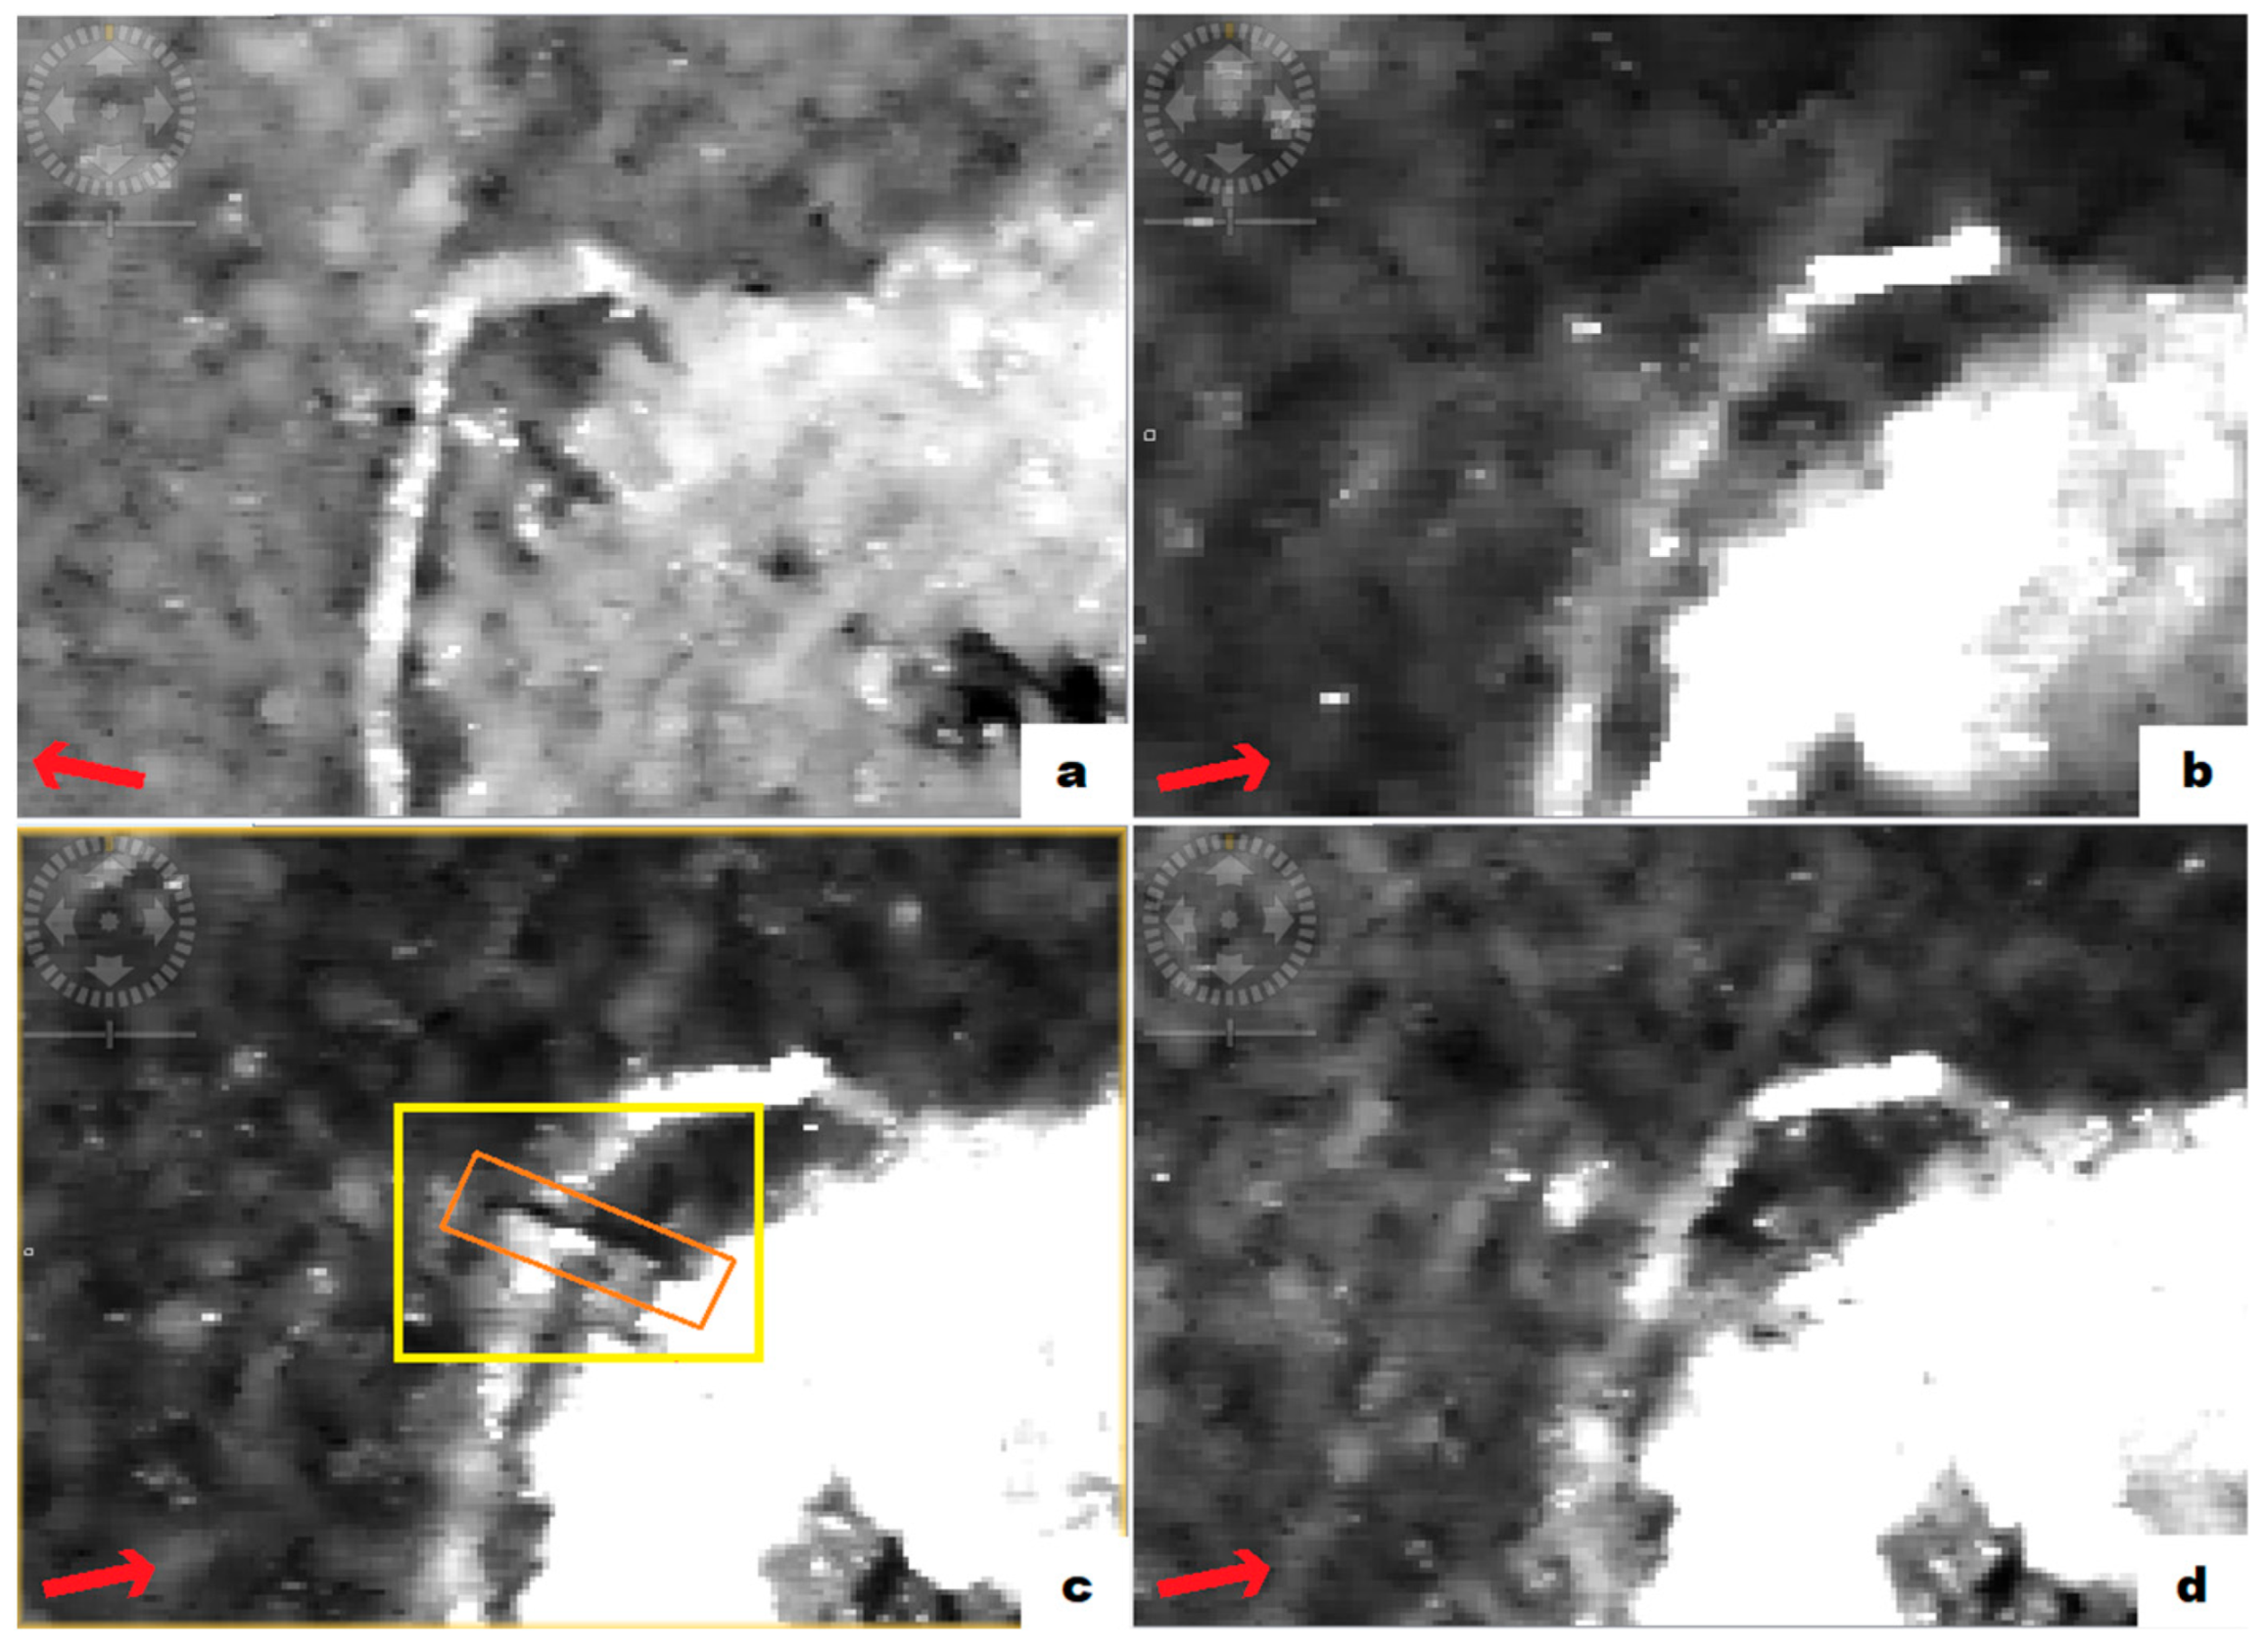
The Greek Orthodox Church (Figure 15) (36°12′0.29″ N, 36°9′39.65″ E) is one of the cultural heritage sites that collapsed, leaving some walls on the northeast side intact. By comparing the church coordinates from Google Earth and the visual interpretation of the SAR image, we could not detect any linear backscatter, which should indicate the structure’s roof. Therefore, the lack of consistent backscatters from the location possibly indicates heavy damage.
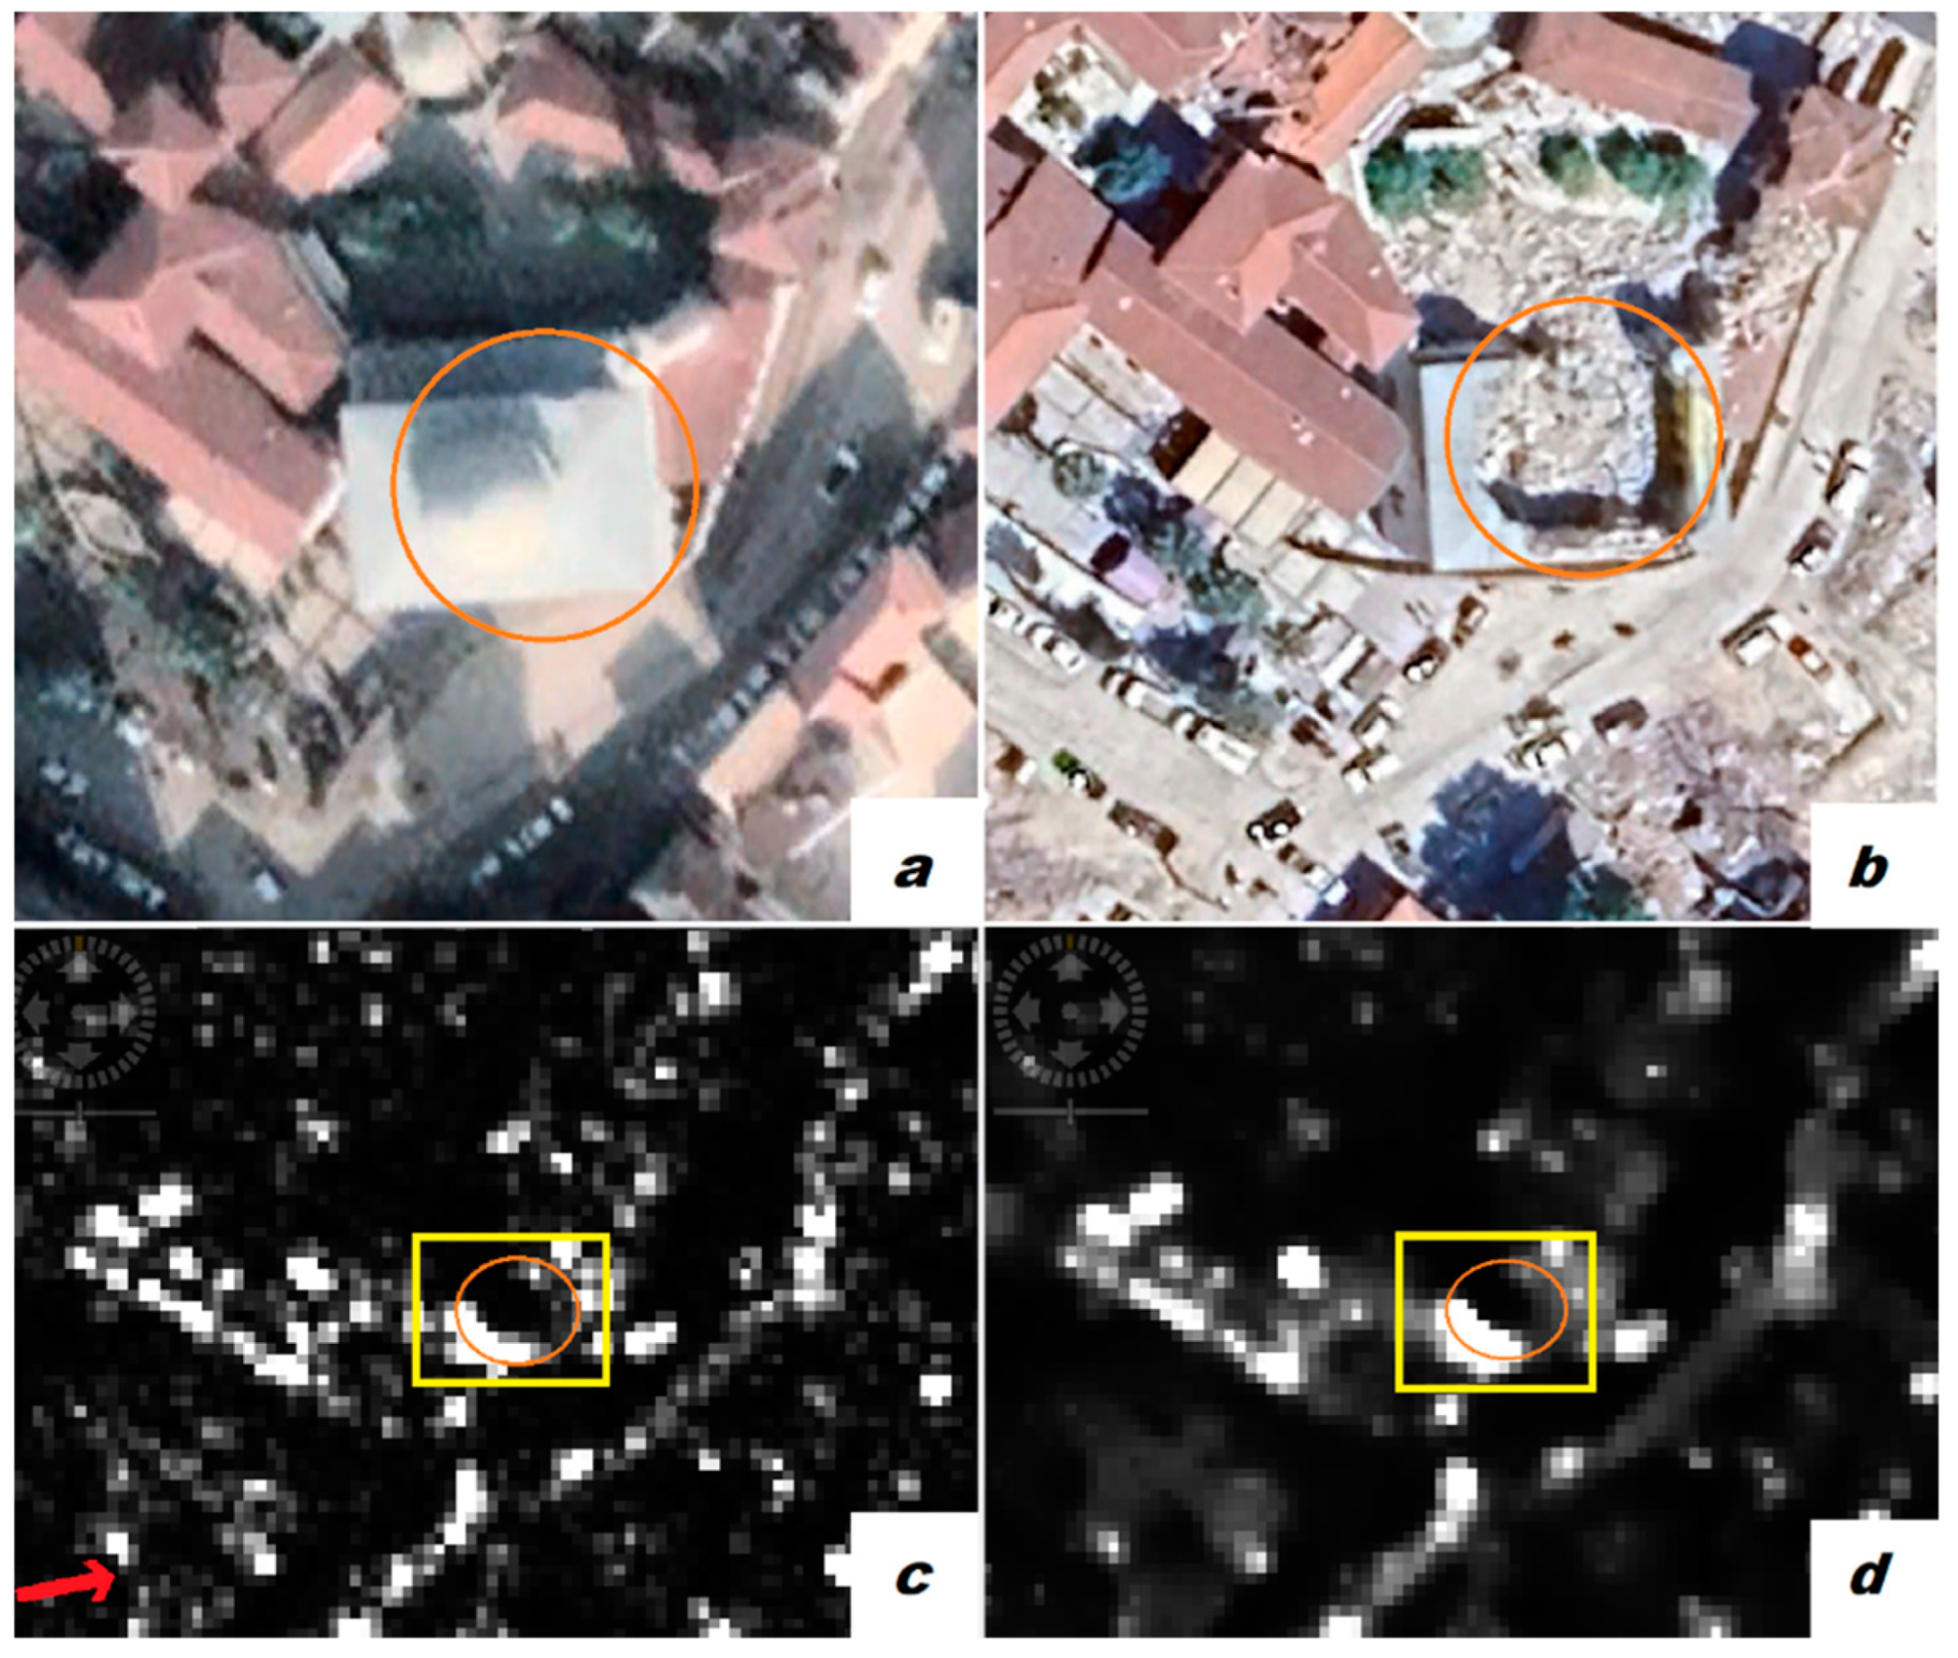
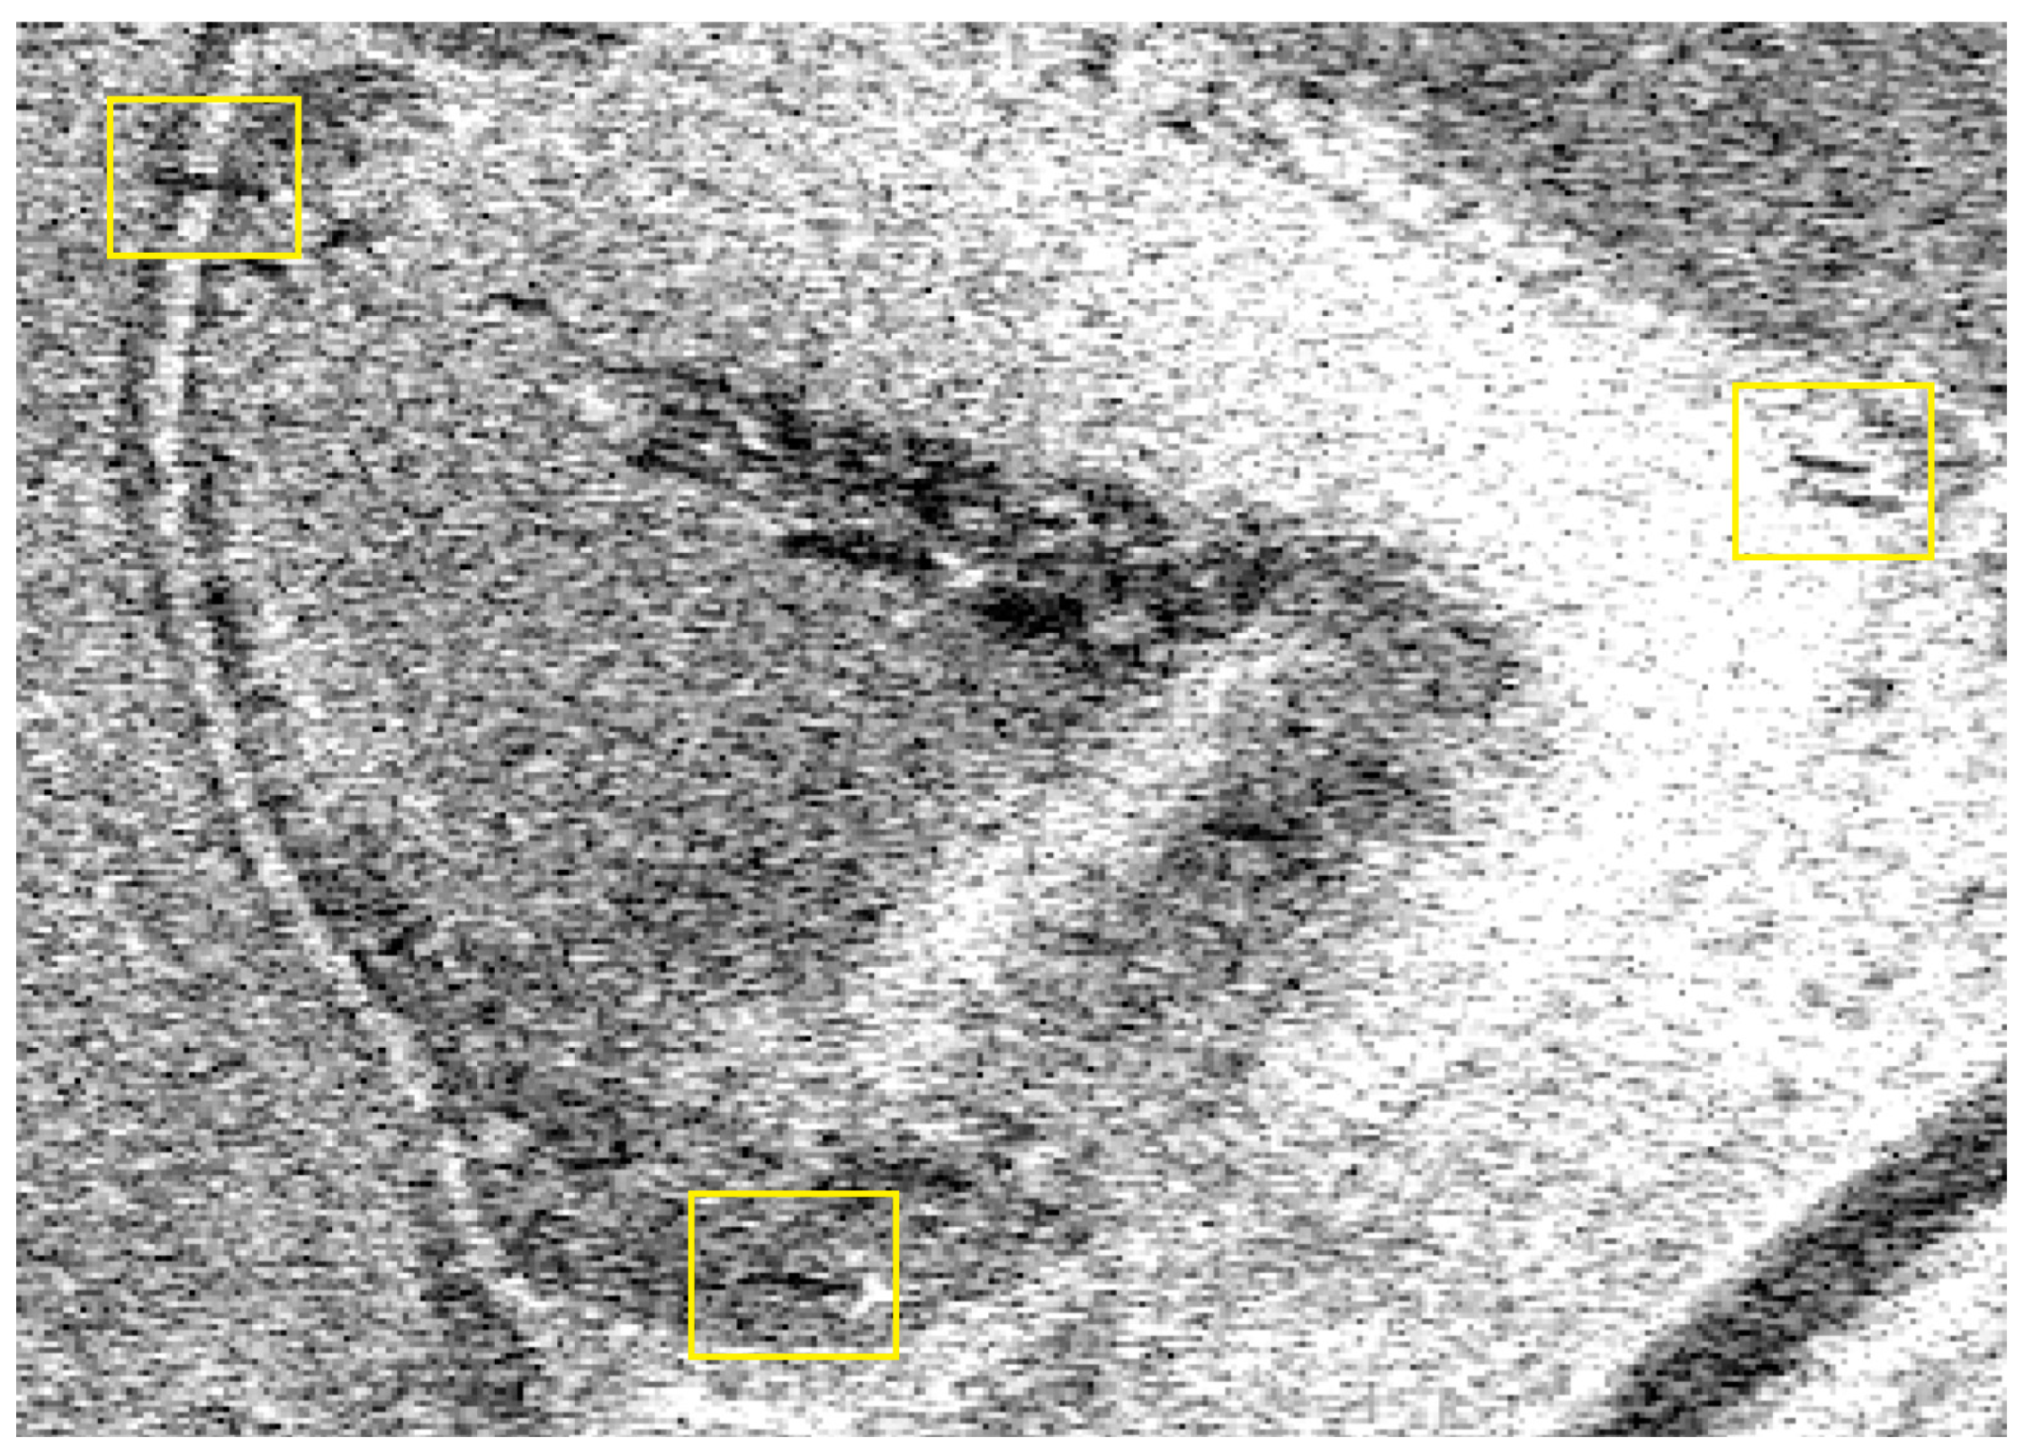
The situation of the Saint Mary Church in Hatay (Figure 16) (36°6′5.48″ N, 36°15′35.19″ E) is unique because it is an almost wholly collapsed structure surrounded by residential buildings that are standing without any major or visible damage. Therefore, that situation allowed us to detect the missing structure by comparing backscattering and tonal differences from rooftops. As shown in the SAR image (Figure 16), the church’s location is identified as a square area with a relative mix of dark and bright pixels surrounded by the brightly scattering roofs of the standing structures around it. Since buildings in that location are almost the same height and similar sizes, we would expect similar backscatter from the roofs.
4.2. Partially Collapsed Structures
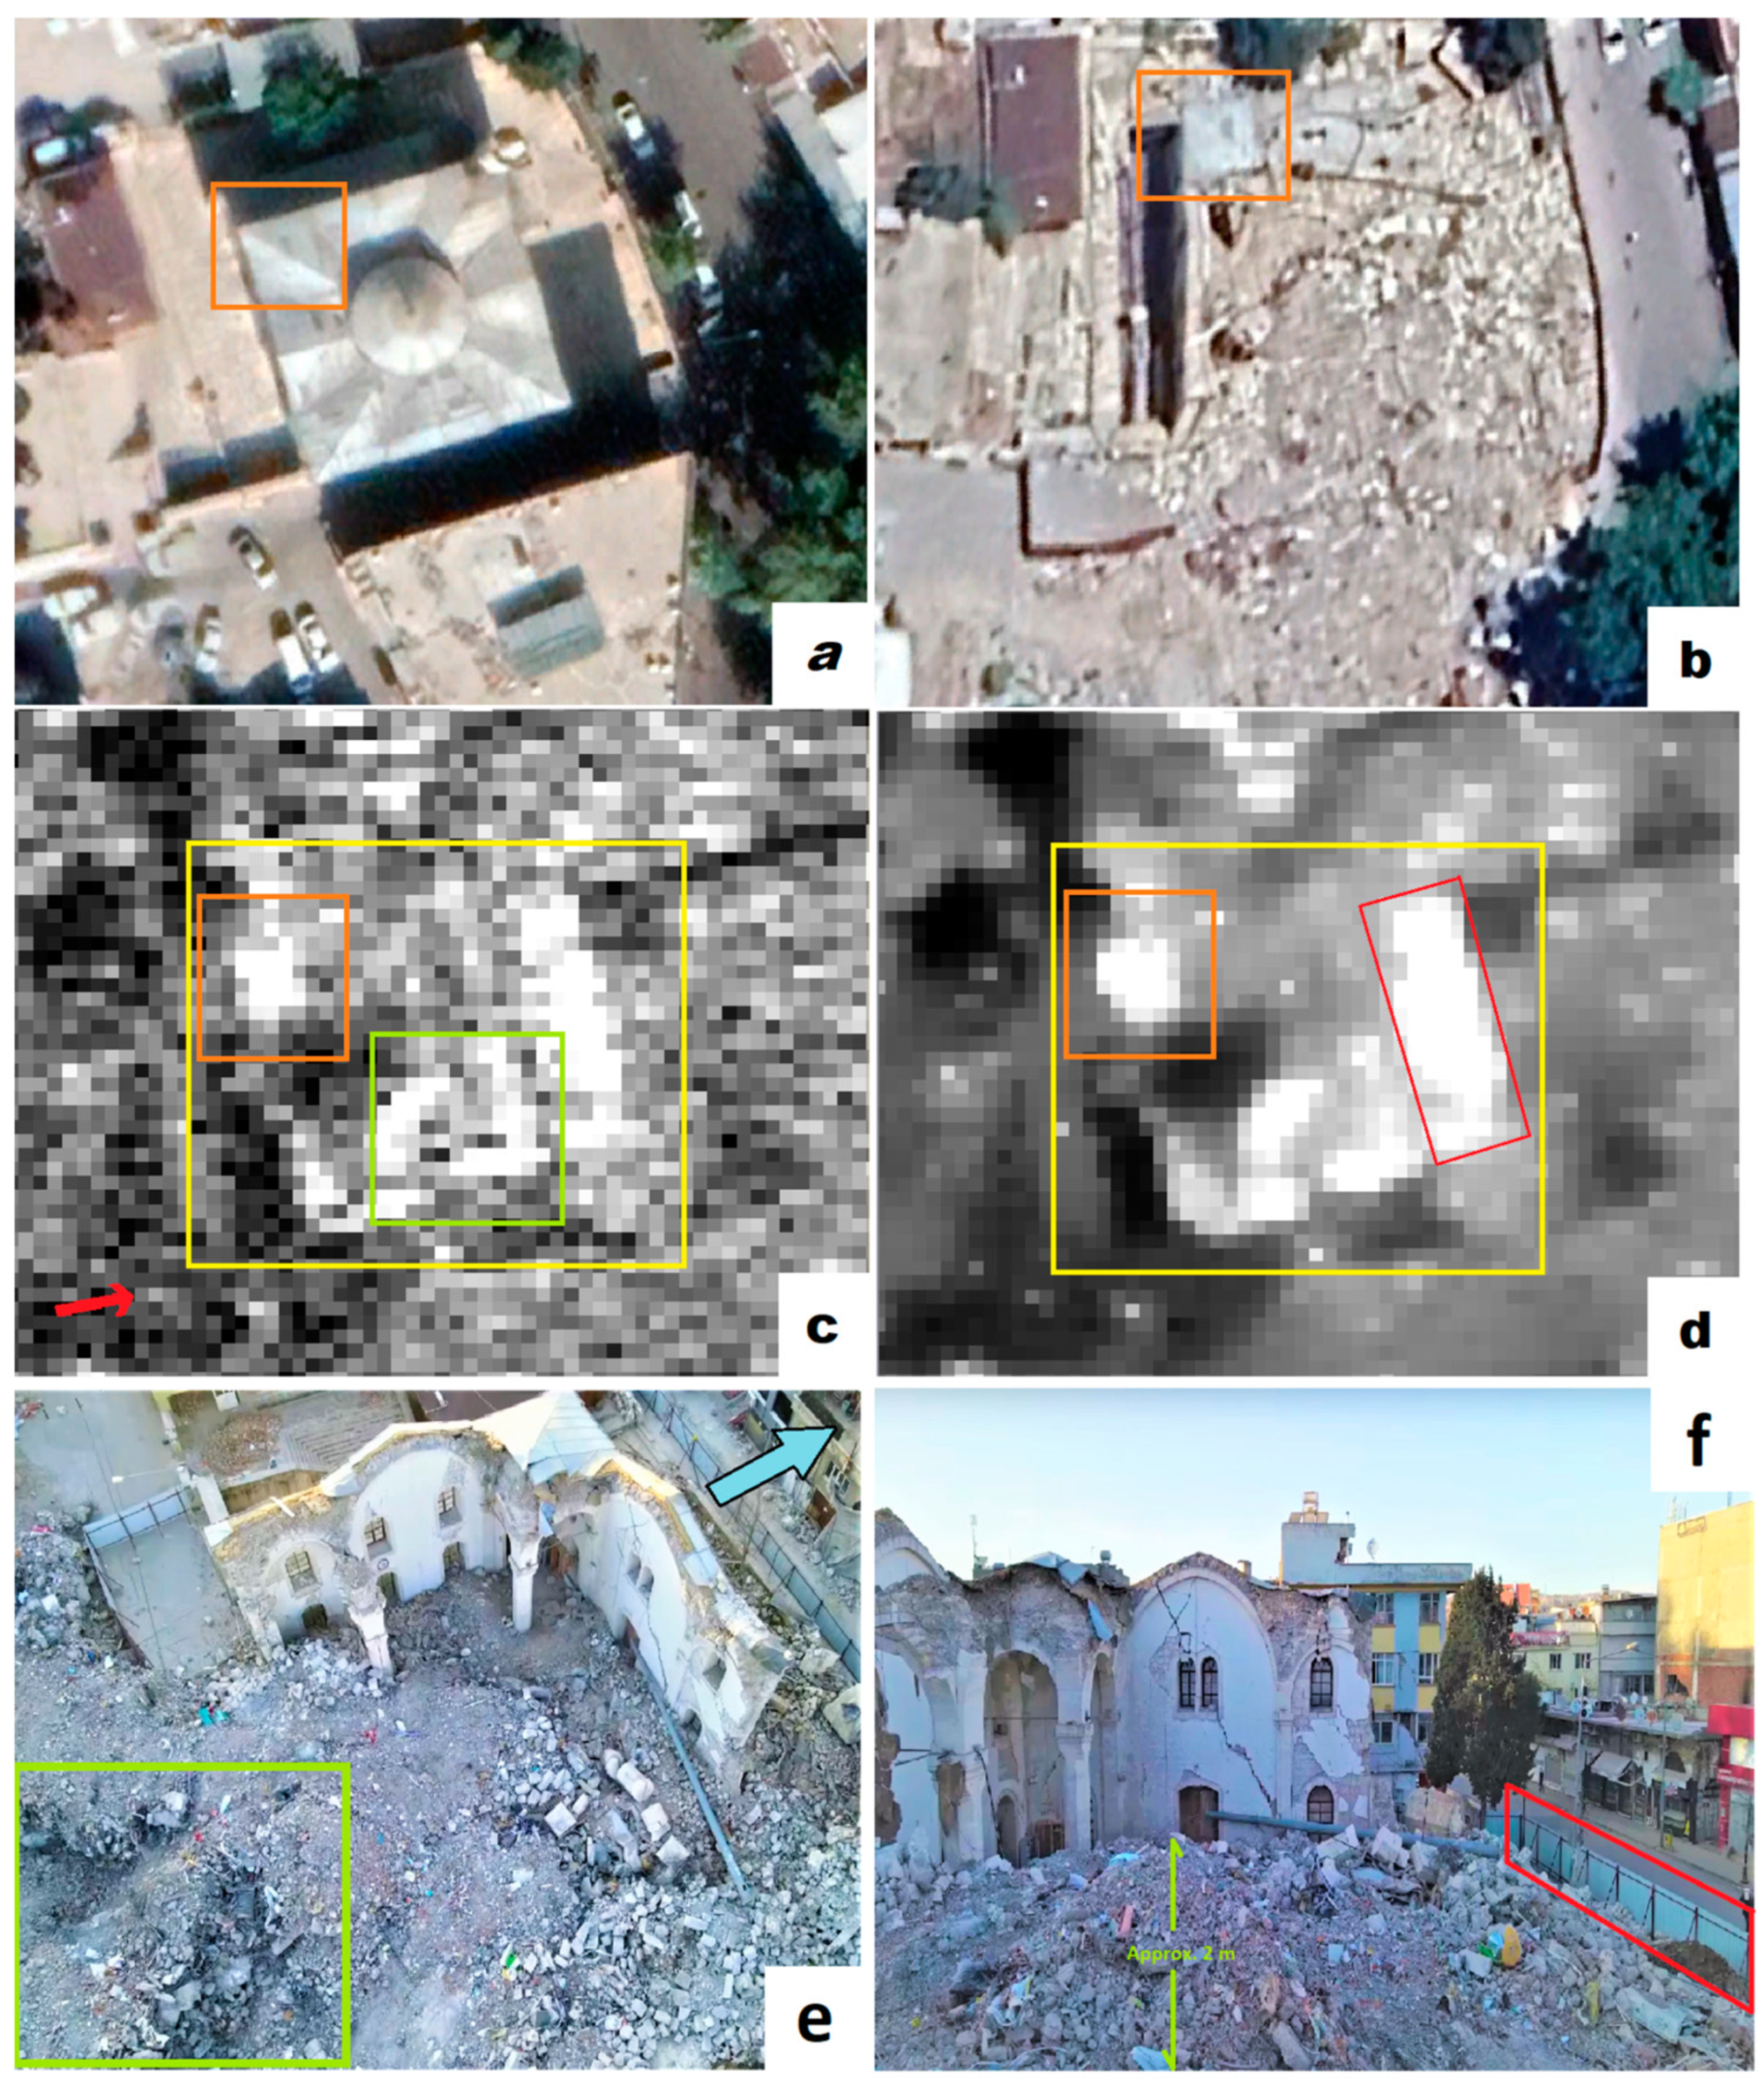
The Adıyaman Ulu Mosque (Figure 17) (37°45′34.21″ N, 38°16′38.70″ E) mostly collapsed after the earthquake, and only the north and west walls and a small portion of the northwest corner of the roof were standing. Because of its square roof with a dome in the middle, we expected consistent backscatter from the SAR image. Still, in the result, we were only able to detect strong backscatter from the remaining northwest corner of the mosque; a very strong backscatter from the makeshift aluminum fence barrier marked with the red rectangle (see Figure 17f), and the approximately 2 m high rubble around the collapsed south and east wall highlighted with the green square (see Figure 17e,f marked) are visible in the SAR images.
The Habib-i Neccar Mosque (Figure 18) in Hatay city center (36°12′5.60″ N, 36°9′55.93″ E) was heavily damaged, and the dome of the mosque and minaret collapsed during the earthquake. Like in the Adıyaman Ulu Mosque example, there should have been a strong backscatter from the mosque’s roof in the SAR image, but that was not the case because of the collapsed portion of the roof.
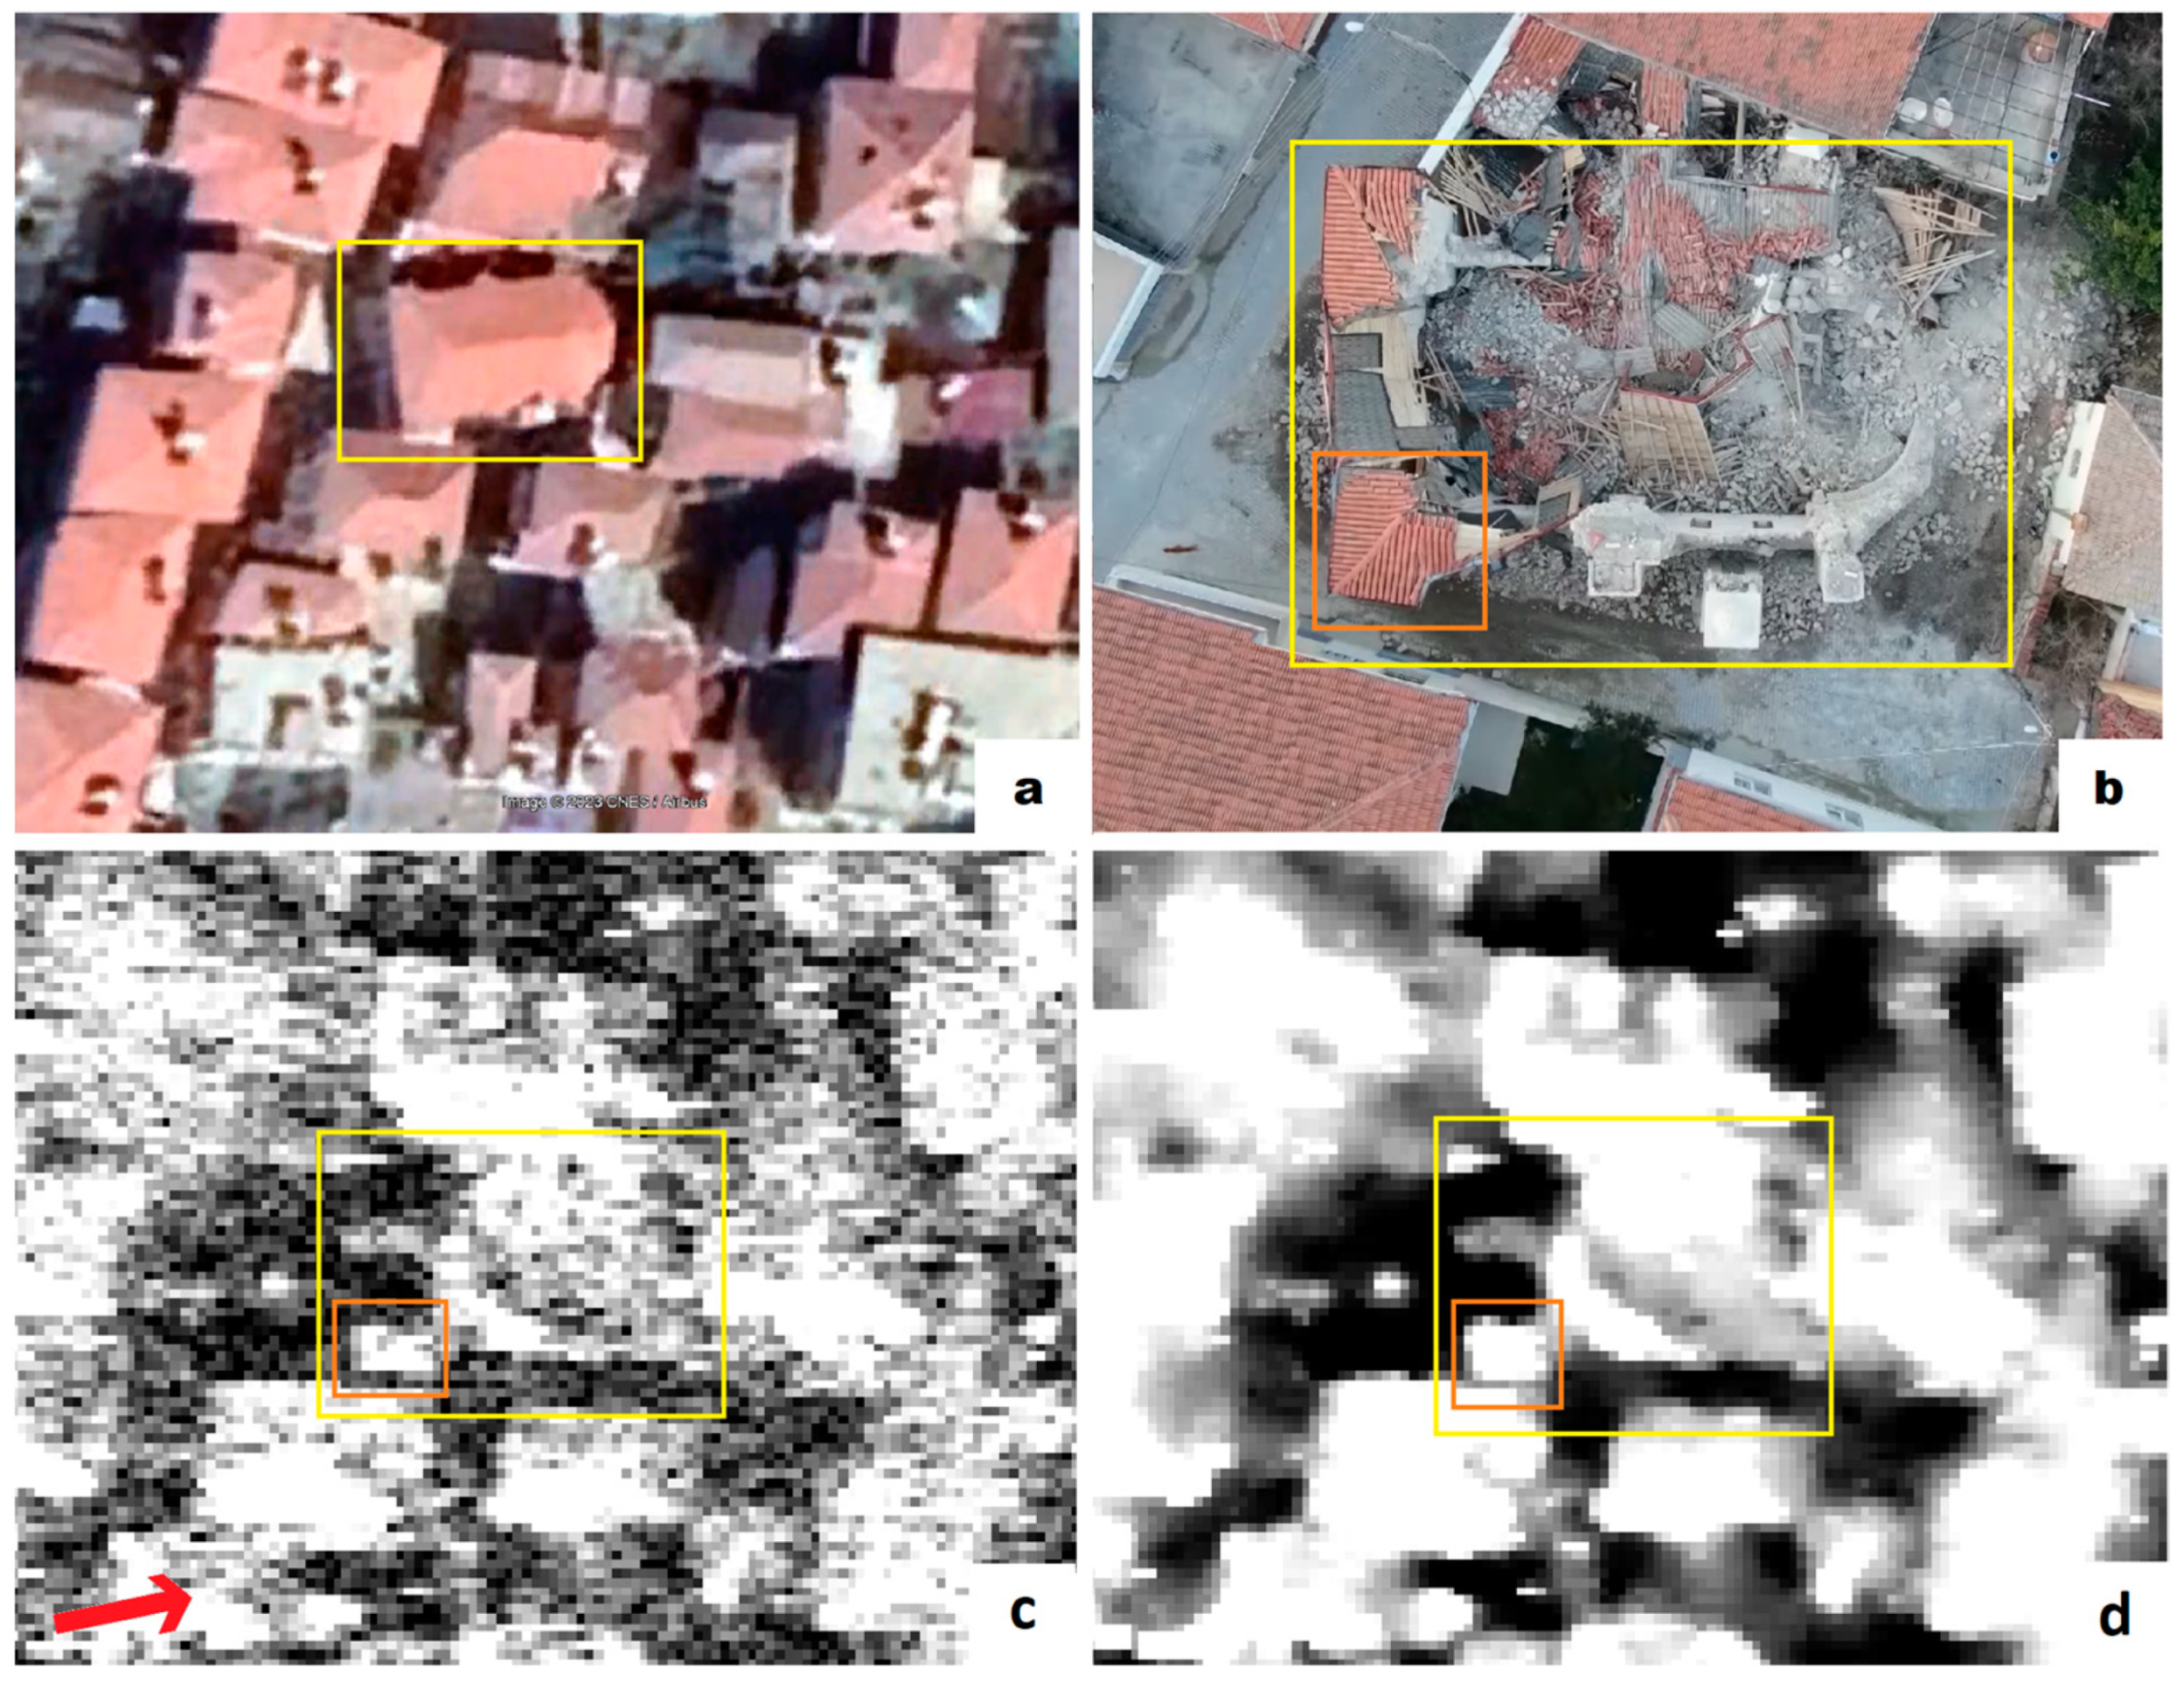
The Hatay Latin Catholic Church (Figure 19) (36°35′28.11″ N, 36°10′5.31″ E) lost its roof, except for the abscissa and wall on the northwest part of the structure. In the SAR images, we detected backscatter from the roof of the abscissa and shadows on the south of it, outside of the church. The rest of the structure in the yellow area in Figure 19 is backscattered with different values of pixels, which are not consistent and linear.
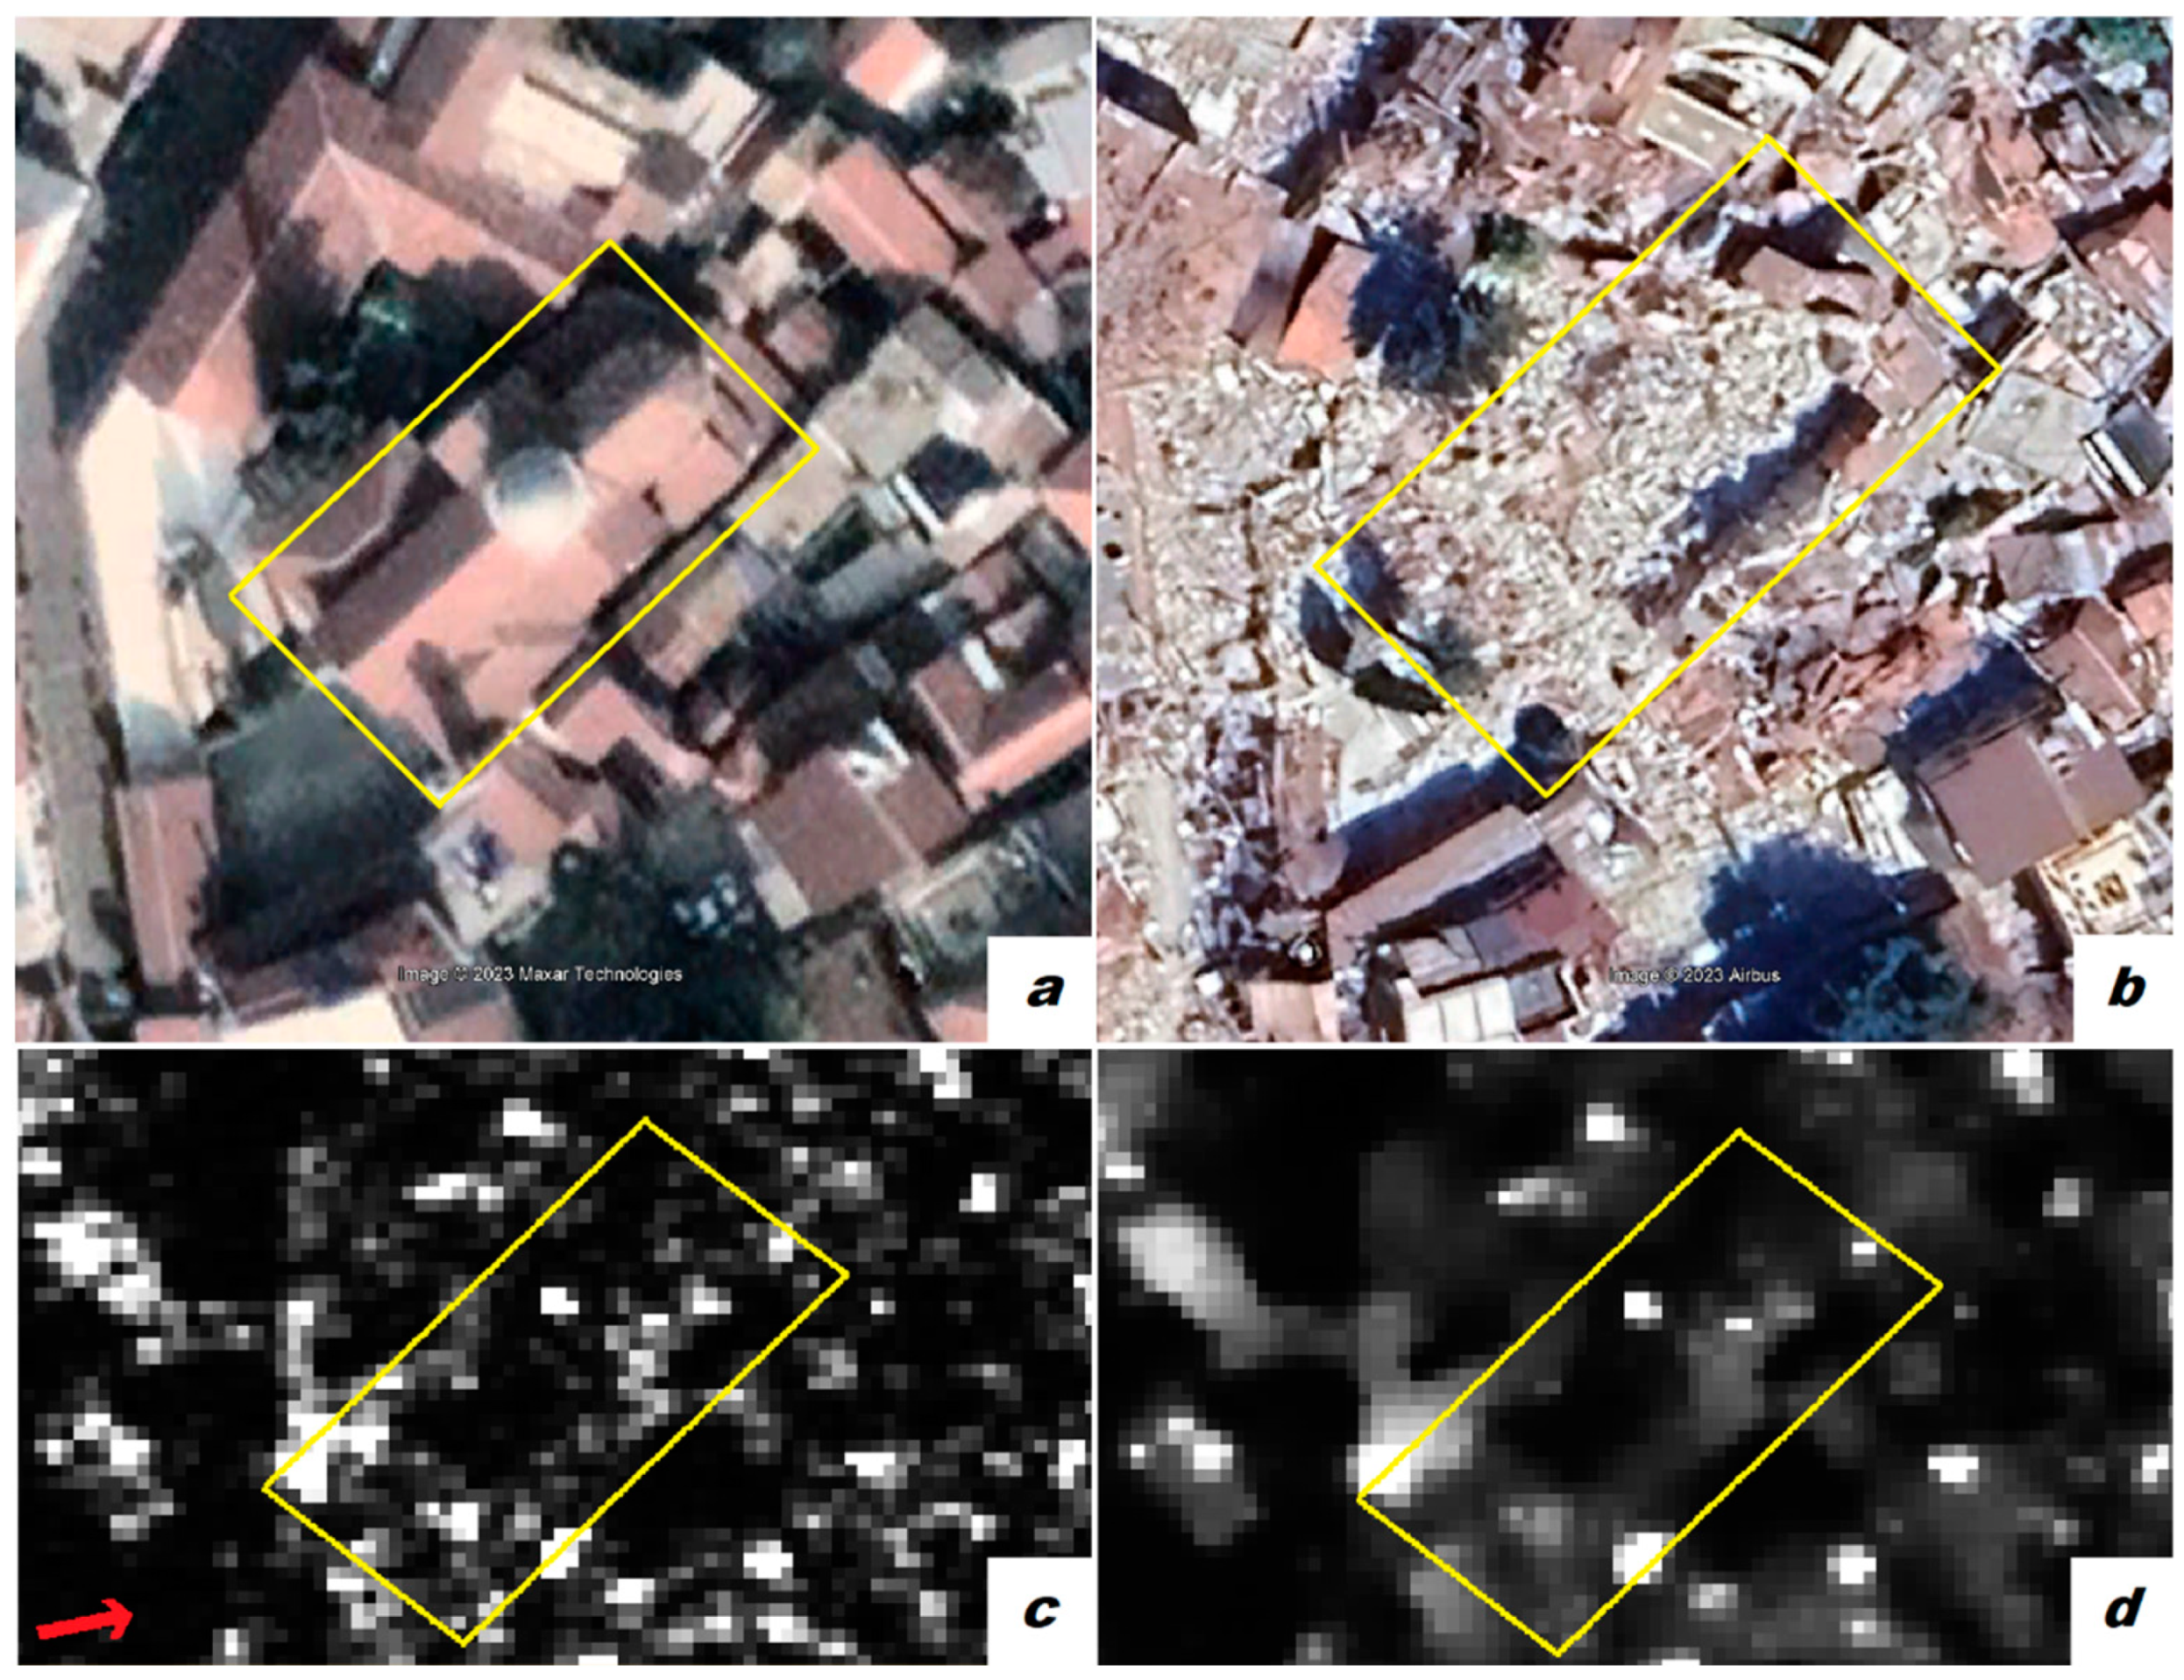
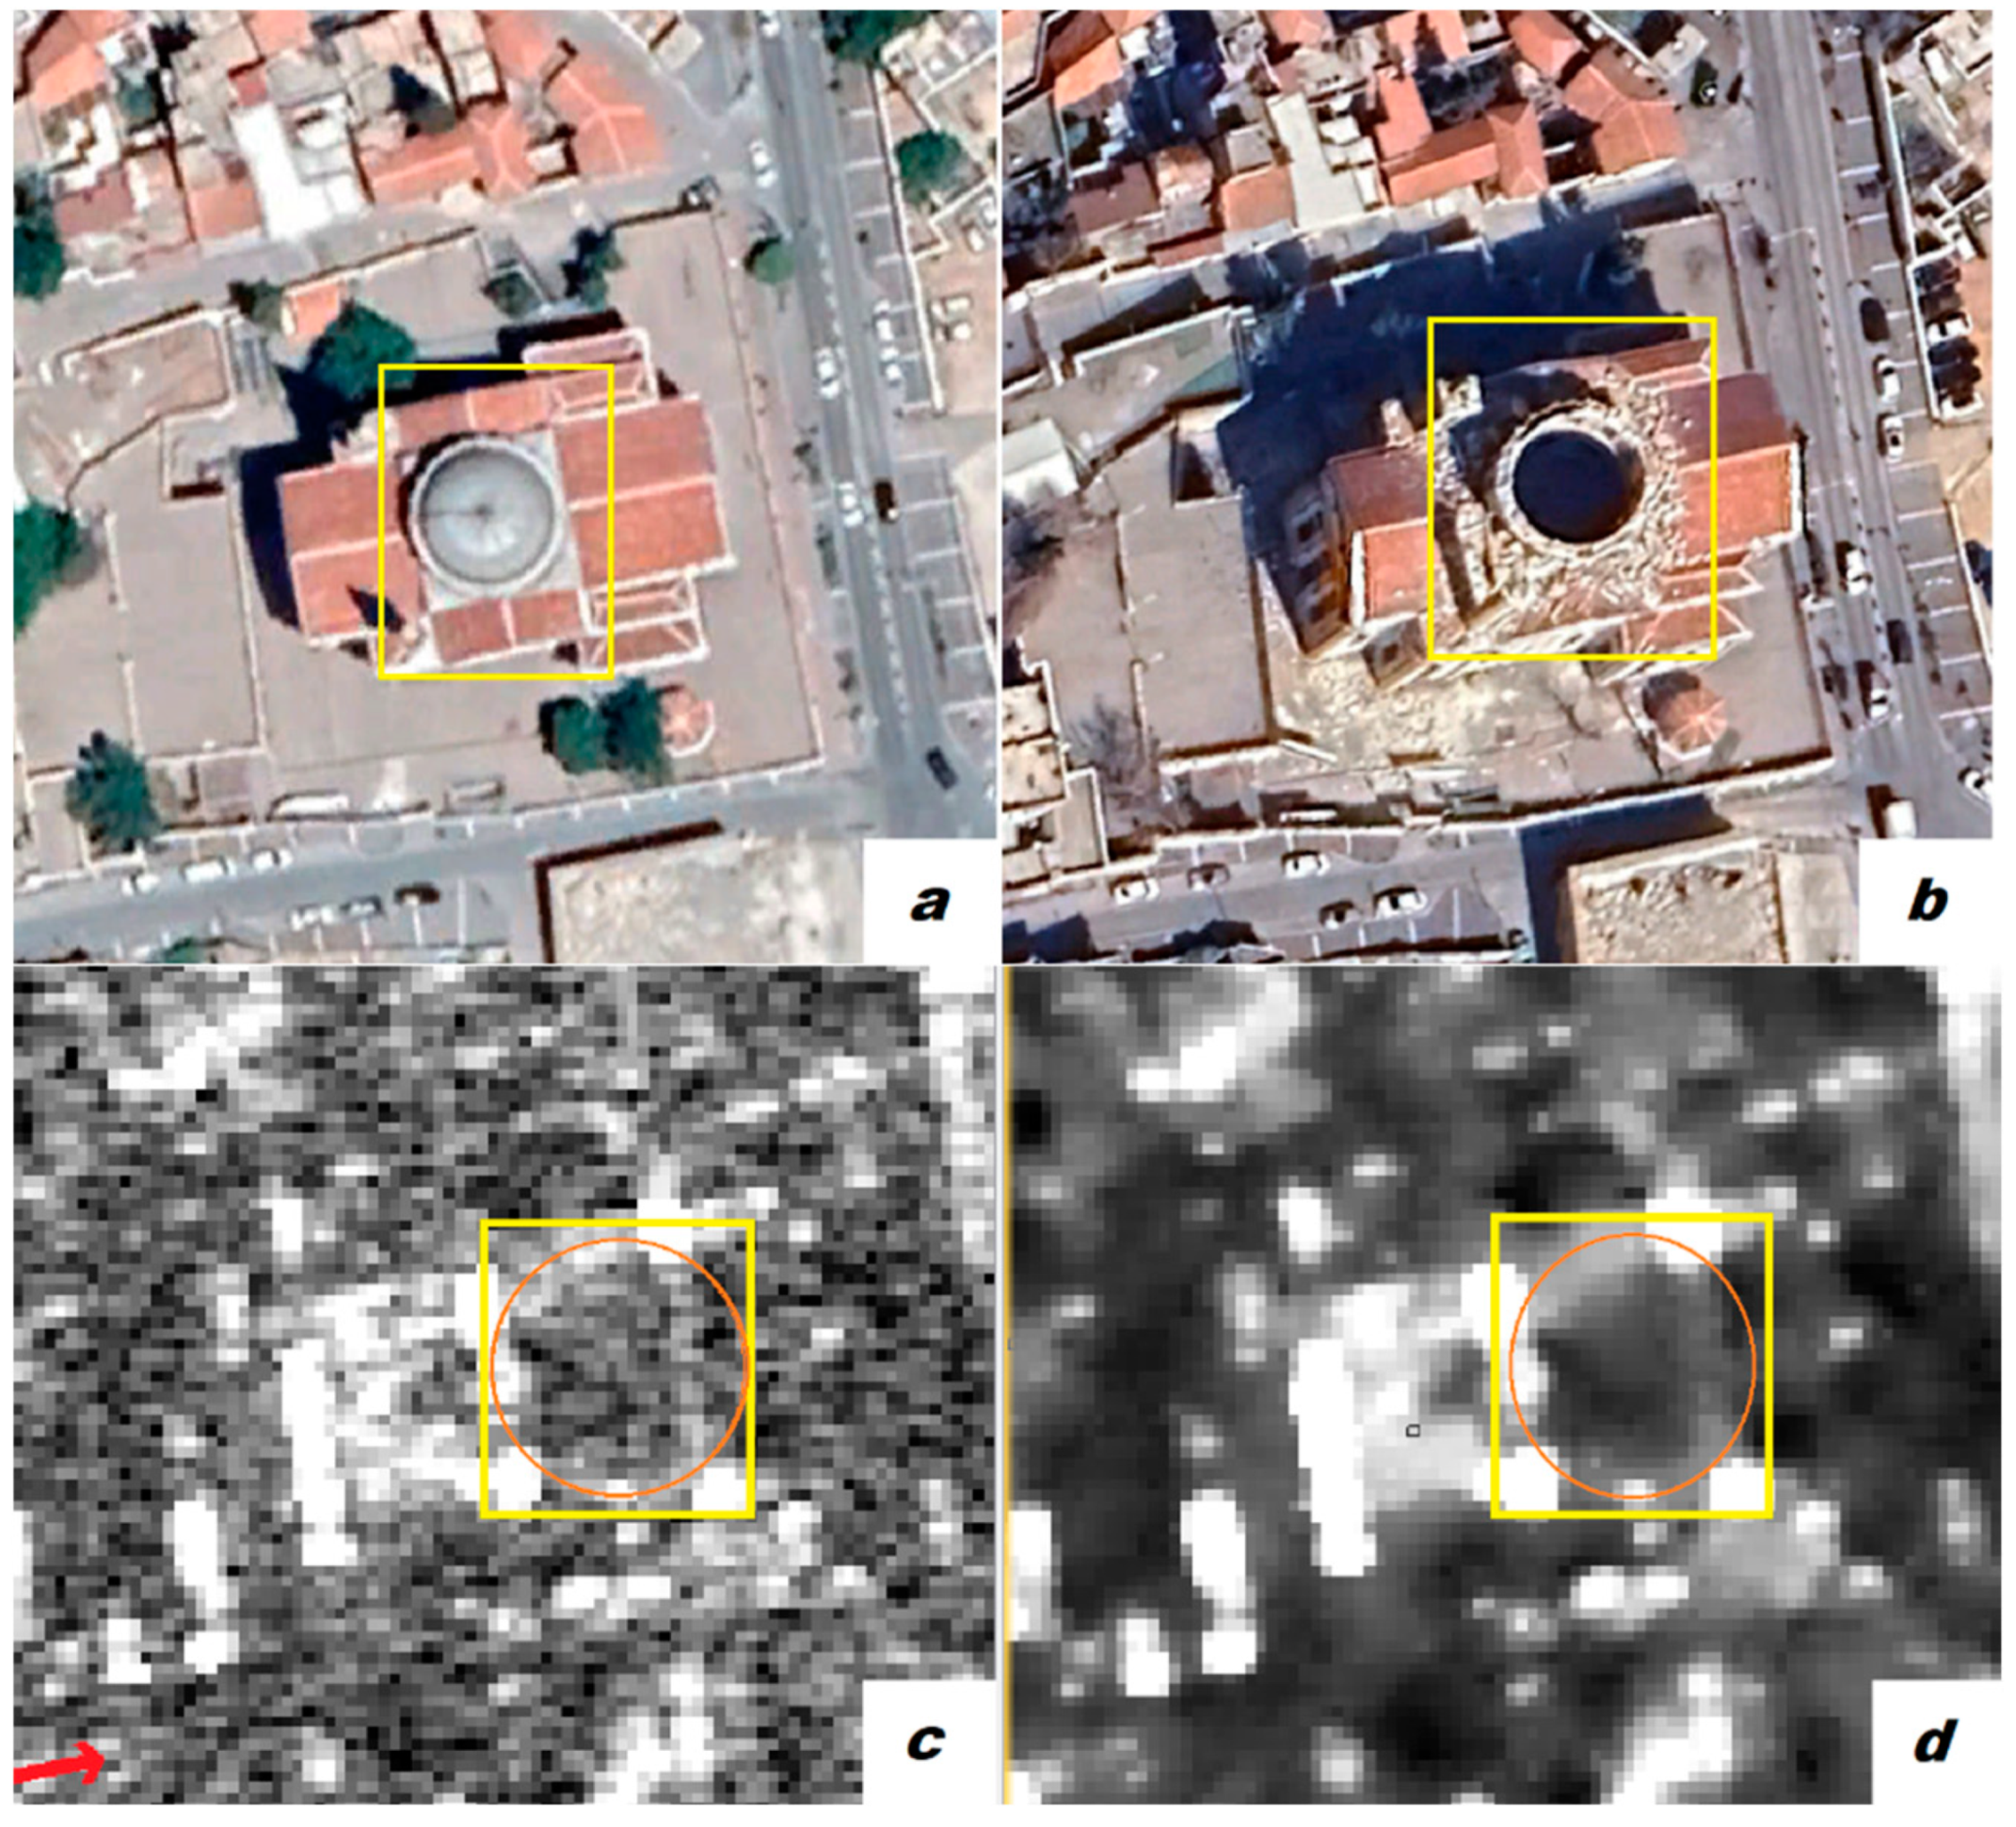
Another case is the Kurtuluş Mosque (Figure 20) (37°3′37.03″ N, 37°22′32.32″ E). Its dome and two minarets were damaged, but the structural frame of the mosque was not damaged. The collapsed dome in the middle of the roof did not backscatter in the SAR image, allowing us to examine the damage in a circular form (Figure 20).
4.3. Special Condition (Karakus Tumulus Case)
The Column in Karakuş Tumulus (Figure 21) (37°52′11.41″ N, 38°35′14.26″ E) is a great example that shows the importance of using different orbits and incidence angles in SAR images, especially for visual interpretation.
The tumulus has four columns, and it is easy to confuse shadows with the damage since their shadow fell to the west side in the first image taken from descending orbit, which is the direction of the column collapse (Figure 22). We tried to illustrate the backscatter of the collapsed column in Figure 23. In the image, it is clear that the angle of the collapsed column is slightly different from the shadow of the standing columns.
In the first image, it was challenging to observe this because the damaged/fallen column and the shadow of the standing columns appear the same. There is a slight difference between their angles but, to be sure, we acquired more images and used different parameters. Out of the four SAR images we received, one (c) had a clear display of the collapsed column (Figure 24). A detailed look into the acquisition parameters of Figure 24, Figure 25 and Figure 26 showed that three (b–d) out of four images had the same pass (Ascending) and two (c,d) of them had the same incidence angle center of 43.16° but different first, last, near, and far longitude and latitude. Figure 24, Figure 25 and Figure 26 show the Karakuş Tumulus terrain corrected SAR images, zoomed images onto the column, and filtered images.
We could determine it was a collapsed column through visual recognition and examining all images with those differences, with and without filter.
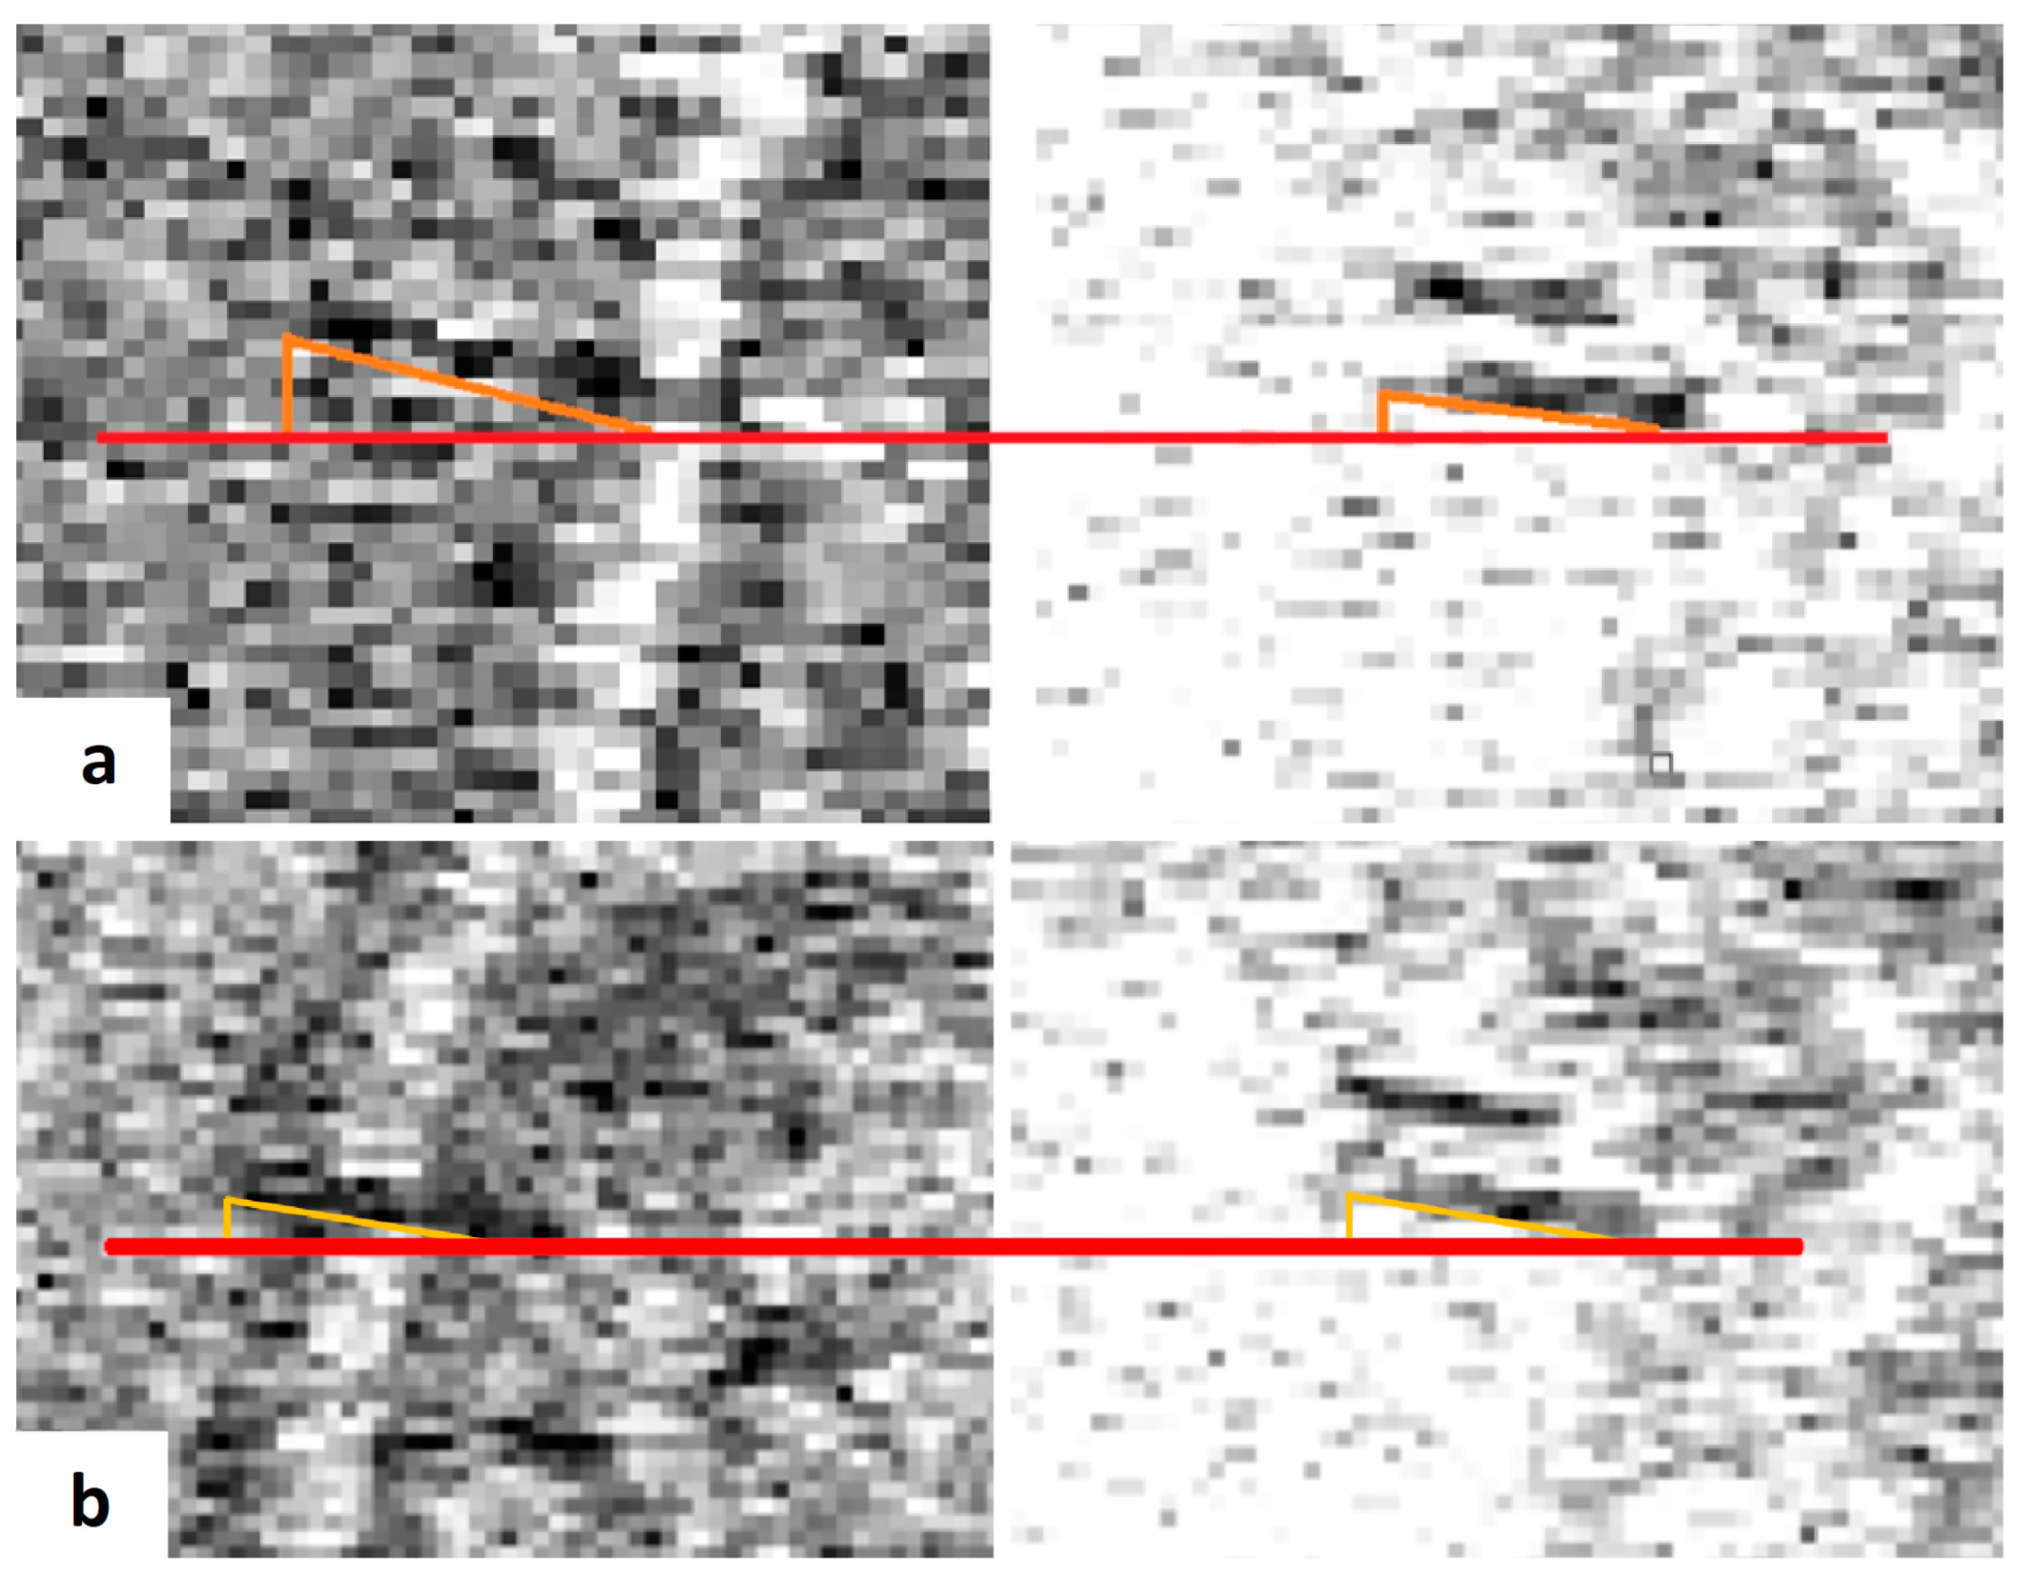
To validate the result of this section, we analyzed recently obtained images of the Karakus Tumulus with the same acquisition parameters after it was re-erected by archaeologists in Turkey a few months after the earthquake. It can be seen that the angles of the shadows of all = standing columns align now (Figure 27). The first image we acquired (from descending orbit) of the Karakus Tumulus, gave a faux shadow effect that could be misinterpreted as a standing column. However, we quickly observed that the supposed ‘shadow’ did not align with the other shadows. This necessitated the acquisition of more images with different parameters, mostly of ascending orbit and different incident angles. From the new images obtained from the ascending orbit, we could see the fallen column because, this time, the shadows naturally fall eastward (Figure 25 and Figure 26). Therefore, acquiring a new SAR image from the descending orbit was crucial to compare the angles with the first image to verify our idea. In Figure 28, shadows of the first (a) and last (b) images taken from the Karakus Tumulus and the angular difference between their corresponding shadows can be compared.
We could compare the results of the fallen and reconstructed columns to verify the mechanism we adopted to identify the damage.
5. Discussion and Conclusions
The difficulty of interpreting SAR images will always feature prominently in the challenge of disaster impact assessment in situations where archived images are unavailable. The result of this study was significantly aided by our previous knowledge of the selected locations and sites and the use of freely available additional satellite images and pictures of the historical buildings and sites for validation.
The challenge of detecting damage from a single SAR post-disaster image was clearly the ambiguity of the results. Nevertheless, different polarizations, orbits, and incident angles can help to reduce these ambiguities. We had different locations and structures to examine and visually interpret, which showed us that the level of damage on buildings is also an effective parameter for understanding the changes in pixel values in SAR images. Many cultural heritage structures show a linear shape of the roof, which would backscatter consistently. Still, in post-disaster SAR images, we could not detect them because they were mostly destroyed.
Often, the occurrence of natural disasters cannot be predicted. Because of the importance of these sites and studies like this, it is highly recommended to regularly acquire and archive high-resolution SAR images of cultural heritage sites to enhance swift response in events of natural disaster occurrence. However, acting in the event of a disaster requires us to use post-disaster images to support relief and emergency rescue. In this case, we assessed the damage on cultural heritage sites by a complex-looking method. This visual interpretation method involves using single or several images of different parameters to delineate structural damage.
When it comes to visual interpretation, the structure’s location and the size of the damage are also important. As mentioned earlier, the different extent of damage gives us other types of backscatter, and sometimes detecting it is associated with the surrounding structures. In addition to the nature of the structural damage, parameters of acquired SAR images play a huge role. Specifically, in the case of the Column in Karakus Tumulus, we have examined how different incident angles and orbits change the view of the damage. Looking from the right direction is one of the primary conditions to see damage in a single SAR image. However, the best direction is typically unknown before acquiring images.
Furthermore, we can see how the nature of the structural damage made a visible difference between Adıyaman Ulu mosque, Habib-i Neccar mosque, and Hatay Ulu mosque, where we could detect strong backscatter from the remaining northwest corner of the mosque roof of the Adıyaman Ulu mosque (Figure 17) and the collapsed circular dome of the Habib-i Neccar mosque (Figure 18). In the case of the Hatay Ulu mosque, there was almost no backscattering because of the entire roof collapse (Figure 14).
Visual interpretation of single SAR post-disaster image is a daunting task, especially in urban areas where all the surrounding structures affect the area of interest, even in high-resolution images like TerraSAR-X. Availability of archived high-resolution images would improve the robustness of the study because coherence change detection is a valuable technique for disaster and relief study.
Author Contributions
Conceptualization, C.S.B.; Formal analysis, C.S.B.; Investigation, C.S.B.; Resources, T.B.; Supervision, T.B.; Visualization, I.C.; Writing—original draft, C.S.B. and I.C.; Writing—review & editing, C.S.B., I.C., G.C. and T.B. All authors have read and agreed to the published version of the manuscript.
Funding
This research was funded by the National Natural Science Foundation of China (grant number 42250610212).
Data Availability Statement
The TerraSAR-X data has been provided by the German Aerospace Center via an Announcement of Opportunities (DLR AO MTH3789).
Conflicts of Interest
The authors declare no conflict of interest.
References
- Shinki, C.; Haoyi, X.; Masashi, M. Backscattering Characteristics of SAR Images in Damaged Buildings Due to the 2016 Kumamoto Earthquake. Remote Sens. 2023, 15, 2181. [Google Scholar]
- Adiyaman, Ö.; Chorowicz, J. Late Cenozoic tectonics and volcanism in the northwestern corner of the Arabian plate: A consequence of the strike-slip Dead Sea fault zone and the lateral escape of Anatolia. J. Volcanol. Geotherm. Res. 2002, 117, 327–345. [Google Scholar] [CrossRef]
- Yıldırım, D.; Sandvol, E. Seismic structure, crustal architecture and tectonic evolution of the Anatolian—African Plate Boundary and the Cenozoic Orogenic Belts in the Eastern Mediterranean Region. Geol. Soc. Lond. Spec. Publ. 2009, 327, 127–160. [Google Scholar]
- Kim, M.; Park, S.-E.; Lee, S.-J. Detection of Damaged Buildings Using Temporal SAR Data with Different Observation Modes. Remote Sens. 2023, 15, 308. [Google Scholar] [CrossRef]
- Taftsoglou, M.; Valkaniotis, S.; Papathanassiou, G.; Karantanellis, E. Satellite Imagery for Rapid Detection of Liquefaction Surface Manifestations: The Case Study of Türkiye–Syria 2023 Earthquakes. Remote Sens. 2023, 15, 4190. [Google Scholar] [CrossRef]
- U.S. Geological Survey, Tectonic Map of Turkey Region. Available online: https://www.usgs.gov/media/images/tectonic-map-turkey-region (accessed on 9 September 2023).
- Enver, A.; Haspolat, Y. The Archaeology of East and South East Anatolia; Rient: Ankara, Turkey, 2022; Volume 1. [Google Scholar]
- Çıvgın, İ. Factors Affecting Plant Domestication Process in the Fertile Crescent: Climate, Natural Environment, and Intercultural Encounters (11000–7000 BC). Mehmet Akif Ersoy Univ. Soc. Sci. Inst. J. 2016, 8, 463–488. [Google Scholar]
- Kandasamy, V.; Kumar, S. SAR for Cultural Heritage Monitoring, 1st ed.; Tylor & Francis: London, UK, 2023. [Google Scholar]
- Rao, A.; Jung, J.; Silva, V.; Molinario, G.; Yun, S.-H. Earthquake building damage detection based on synthetic-aperture-radar imagery and machine learning. Nat. Hazards Earth Syst. Sci. 2023, 23, 789–807. [Google Scholar] [CrossRef]
- Nico, G.; Masci, O.; Panidi, E. Non-destructive monitoring strategies of historical constructions and tangible cultural heritage based on ground-based sar interferometry. In Proceedings of the International Conference “InterCarto. InterGIS”, Petrozavodsk, Russia, 19 July–1 August 2018; Volume 24, pp. 528–535. [Google Scholar]
- Tapete, D.; Cigna, F. COSMO-SkyMed SAR for Detection and Monitoring of Archaeological and Cultural Heritage Sites. Remote Sens. 2019, 11, 1326. [Google Scholar] [CrossRef]
- Tang, P.; Chen, F.; Zhu, X.; Zhou, W. Monitoring Cultural Heritage Sites with Advanced Multi-Temporal InSAR Technique: The Case Study of the Summer Palace. Remote Sens. 2016, 8, 432. [Google Scholar] [CrossRef]
- Cigna, F.; Balz, T.; Tapete, D.; Caspari, G.; Fu, B.; Abballe, M.; Jiang, H. Exploiting satellite SAR for archaeological prospection and heritage site protection. Geo-Spat. Inf. Sci. 2023, 1–26. [Google Scholar] [CrossRef]
- Gong, L.; Wang, C.; Wu, F.; Zhang, J.; Zhang, H.; Li, Q. Earthquake-Induced Building Damage Detection with Post-Event Sub-Meter VHR TerraSAR-X Staring Spotlight Imagery. Remote Sens. 2016, 8, 887. [Google Scholar] [CrossRef]
- Altın, A. Adiyaman Great Mosque from Past to Present. Adıyaman Univ. J. Soc. Sci. Inst. 2016, 8, 1224–1268. [Google Scholar]
- Adıyaman Provincial Directorate of Culture and Tourism. 2019, Ulu Mosque, Adıyaman. Available online: https://www.kulturportali.gov.tr/turkiye/adiyaman/gezilecekyer/ulu-cami553357 (accessed on 19 September 2023).
- Türk, H. Interfaith Tolerance in Antakya and the Example of Habibi Neccar. Folk. Edeb. 2016, 87, 155–172. [Google Scholar]
- Anadolu Ajansı. 2020, Habib-i Neccar Mosque, Hatay. Available online: https://www.trthaber.com/haber/turkiye/anadolunun-ilk-camisinde-ramazan-buruk-geciyor-484309.html (accessed on 19 September 2023).
- Demir, E. A Mosque Church in Ayıntab: Surp Asdvadzadzin Church (Kurtuluş Mosque). Ortadoğu Ve Göç. 2021, 11, 111–132. [Google Scholar] [CrossRef]
- Cambaz, M. 2015, Kurtuluş Mosque, Gaziantep. Available online: https://www.mustafacambaz.com/details.php?image_id=40989 (accessed on 19 September 2023).
- Culture and Tourism Ministry of Turkey. Karakuş Tümülüsü Anıt Mezar. Available online: https://www.kulturportali.gov.tr/turkiye/adiyaman/gezilecekyer/karakus-tumulusu--anit-mezar. (accessed on 18 July 2023).
- Cangül, C. 2023, Handshake Relief Column in Karakus Tumulus, Adıyaman. Available online: https://www.arkeolojisanat.com/shop/blog/karakus-tumulusundeki-tokalasma-sutunu-depremde-yikildi_3_1372036.html (accessed on 19 September 2023).
- Anatolian Apostolic Attorneyship. İskenderun. Available online: https://www.vicariatoapostolicodianatolia.org/index.php/iskenderun/ (accessed on 18 July 2023).
- Osseman, D. 2008, İskenderun Catholic Church, Hatay. Available online: https://en.wikipedia.org/wiki/Cathedral_of_the_Annunciation,_İskenderun (accessed on 19 September 2023).
- Wikimedia Foundation. Tokaçlı, Altınözü. Available online: https://tr.wikipedia.org/w/index.php?title=Tokaçlı,_Altınözü&veaction=edit§ion=1 (accessed on 15 May 2023).
- Mauersberger, A. 2021, St. Mary Church, Hatay. Available online: https://www.google.com/maps/place/Maria+Ana+Rum+Kiliesi/@36.1065592,36.2695688,14z/data=!4m6!3m5!1s0x1525c77ce5f8cbc5:0x89146f3b015bf57d!8m2!3d36.1015733!4d36.2597011!16s%2Fg%2F11ggv_yfzq?entry=ttu (accessed on 19 September 2023).
- Temiz, F.M. Ulucami; Turkish Religious Foundation: Ankara, Turkey, 2019; pp. 622–623. [Google Scholar]
- Antakya Municipality, 2015, Ulu Mosque, Hatay. Available online: https://www.antakya.bel.tr/icerik/41/640/ulu-cami.aspx (accessed on 19 September 2023).
- Culture and Tourism Ministry of Turkey. Ortodoks Kilisesi. Available online: https://www.kulturportali.gov.tr/turkiye/hatay/gezilecekyer/ortodoks-kilisesi.2015 (accessed on 20 June 2023).
- Acar, G. 2014, Greek Orthodox Church, Hatay. Available online: https://www.kulturportali.gov.tr/turkiye/hatay/gezilecekyer/ortodoks-kilisesi (accessed on 19 September 2023).
- Zhu, X.X.; Wang, Y.; Montazeri, S.; Ge, N. A Review of Ten-Year Advances of Multi-Baseline SAR Interferometry Using TerraSAR-X Data. Remote Sens. 2018, 10, 1374. [Google Scholar] [CrossRef]
- Geospatial Information Authority of Japan. Monitoring the Earth Deformation from Space. Available online: https://vldb.gsi.go.jp/sokuchi/sar/qanda/qanda-e.html#:~:text=Observations%20by%20the%20SAR%20satellite,are%20made%20from%20the%20east (accessed on 19 September 2023).
- Nedelcu, S.; Brisco, B. Comparison between Range-Doppler and Rational-Function methods for SAR Terrain Geocoding. Can. J. Remote Sens. 2018, 44, 191–201. [Google Scholar] [CrossRef]
- Curlander, J.C.; McDonough, R.N. Synthetic Aperture Radar: System and Signal Processing; John Wiley and Sons: New York, NY, USA, 1991. [Google Scholar]
- Lee, J.-S. Digital Image Smoothing and the Sigma Filter. Comput. Vis. Graph. Image Process. 1983, 24, 255–269. [Google Scholar] [CrossRef]
- İhlas Haber Ajansı. 2023, Habib-i Neccar Mosque, Hatay. Available online: https://www.youtube.com/watch?v=PaNEqrxdgg4 (accessed on 19 September 2023).
- İhlas Haber Ajansı. 2023, St. Mary Church, Hatay. Available online: https://www.sondakika.com/haber/haber-hatay-da-700-yillik-meryem-ana-ortodoks-kilisesi-15646237/ (accessed on 19 September 2023).
- Demirören Haber Ajansı. 2023, Handshake Relief Column in Karakus Tumulus, Adıyaman. Available online: https://www.dha.com.tr/foto-galeri/adiyamanda-tarihi-tokalasma-sutunu-devrildi-yakinindaki-cendere-koprusu-ayakta-kaldi-2206422/1 (accessed on 19 September 2023).
- Adıyaman Provincial Directorate of Culture and Tourism. 2013, East Columns of Karakus Tumulus, Adıyaman. Available online: https://www.kulturportali.gov.tr/turkiye/adiyaman/gezilecekyer/karakus-tumulusu--anit-mezar (accessed on 19 September 2023).
- İhlas Haber Ajansı. 2023, St. Mary Church, Hatay. Available online: https://www.youtube.com/watch?v=imLIkPuWyEE (accessed on 19 September 2023).
- Kitle Haber, 2023, Ulu Mosque, Adıyaman. Available online: https://www.youtube.com/watch?v=lktFQTXjFq4 (accessed on 19 September 2023).
- İhlas Haber Ajansı. 2023, Handshake Relief Column in Karakus Tumulus, Adıyaman. Available online: https://www.vitrinhaber.com/deprem-tonlarca-agirliktaki-tokalasma-sutunlarini-yikti (accessed on 19 September 2023).
Figure 1.
Tectonic map of the eastern Mediterranean region showing the east Anatolian fault responsible for the catastrophic twin earthquakes. The black square shows the area of impact [6].
Figure 1.
Tectonic map of the eastern Mediterranean region showing the east Anatolian fault responsible for the catastrophic twin earthquakes. The black square shows the area of impact [6].

Figure 2.
Map of the study area and cultural heritage sites analyzed in this study. Numbers on the map correspond to pictures of the cultural heritage sites.
Figure 2.
Map of the study area and cultural heritage sites analyzed in this study. Numbers on the map correspond to pictures of the cultural heritage sites.

Figure 3.
Adıyaman Ulu Mosque [17].
Figure 3.
Adıyaman Ulu Mosque [17].

Figure 4.
Habib-i Neccar Mosque [19].
Figure 4.
Habib-i Neccar Mosque [19].

Figure 5.
Kurtuluş Mosque [21].
Figure 5.
Kurtuluş Mosque [21].

Figure 6.
Handshake relief [23].
Figure 6.
Handshake relief [23].

Figure 7.
İskenderun Latin Catholic Church [25].
Figure 7.
İskenderun Latin Catholic Church [25].

Figure 8.
Saint Mary Orthodox Church [27].
Figure 8.
Saint Mary Orthodox Church [27].

Figure 9.
Hatay Ulu Mosque [29].
Figure 9.
Hatay Ulu Mosque [29].

Figure 10.
Greek Orthodox Church [31].
Figure 10.
Greek Orthodox Church [31].

Figure 11.
Workflow.

Figure 12.
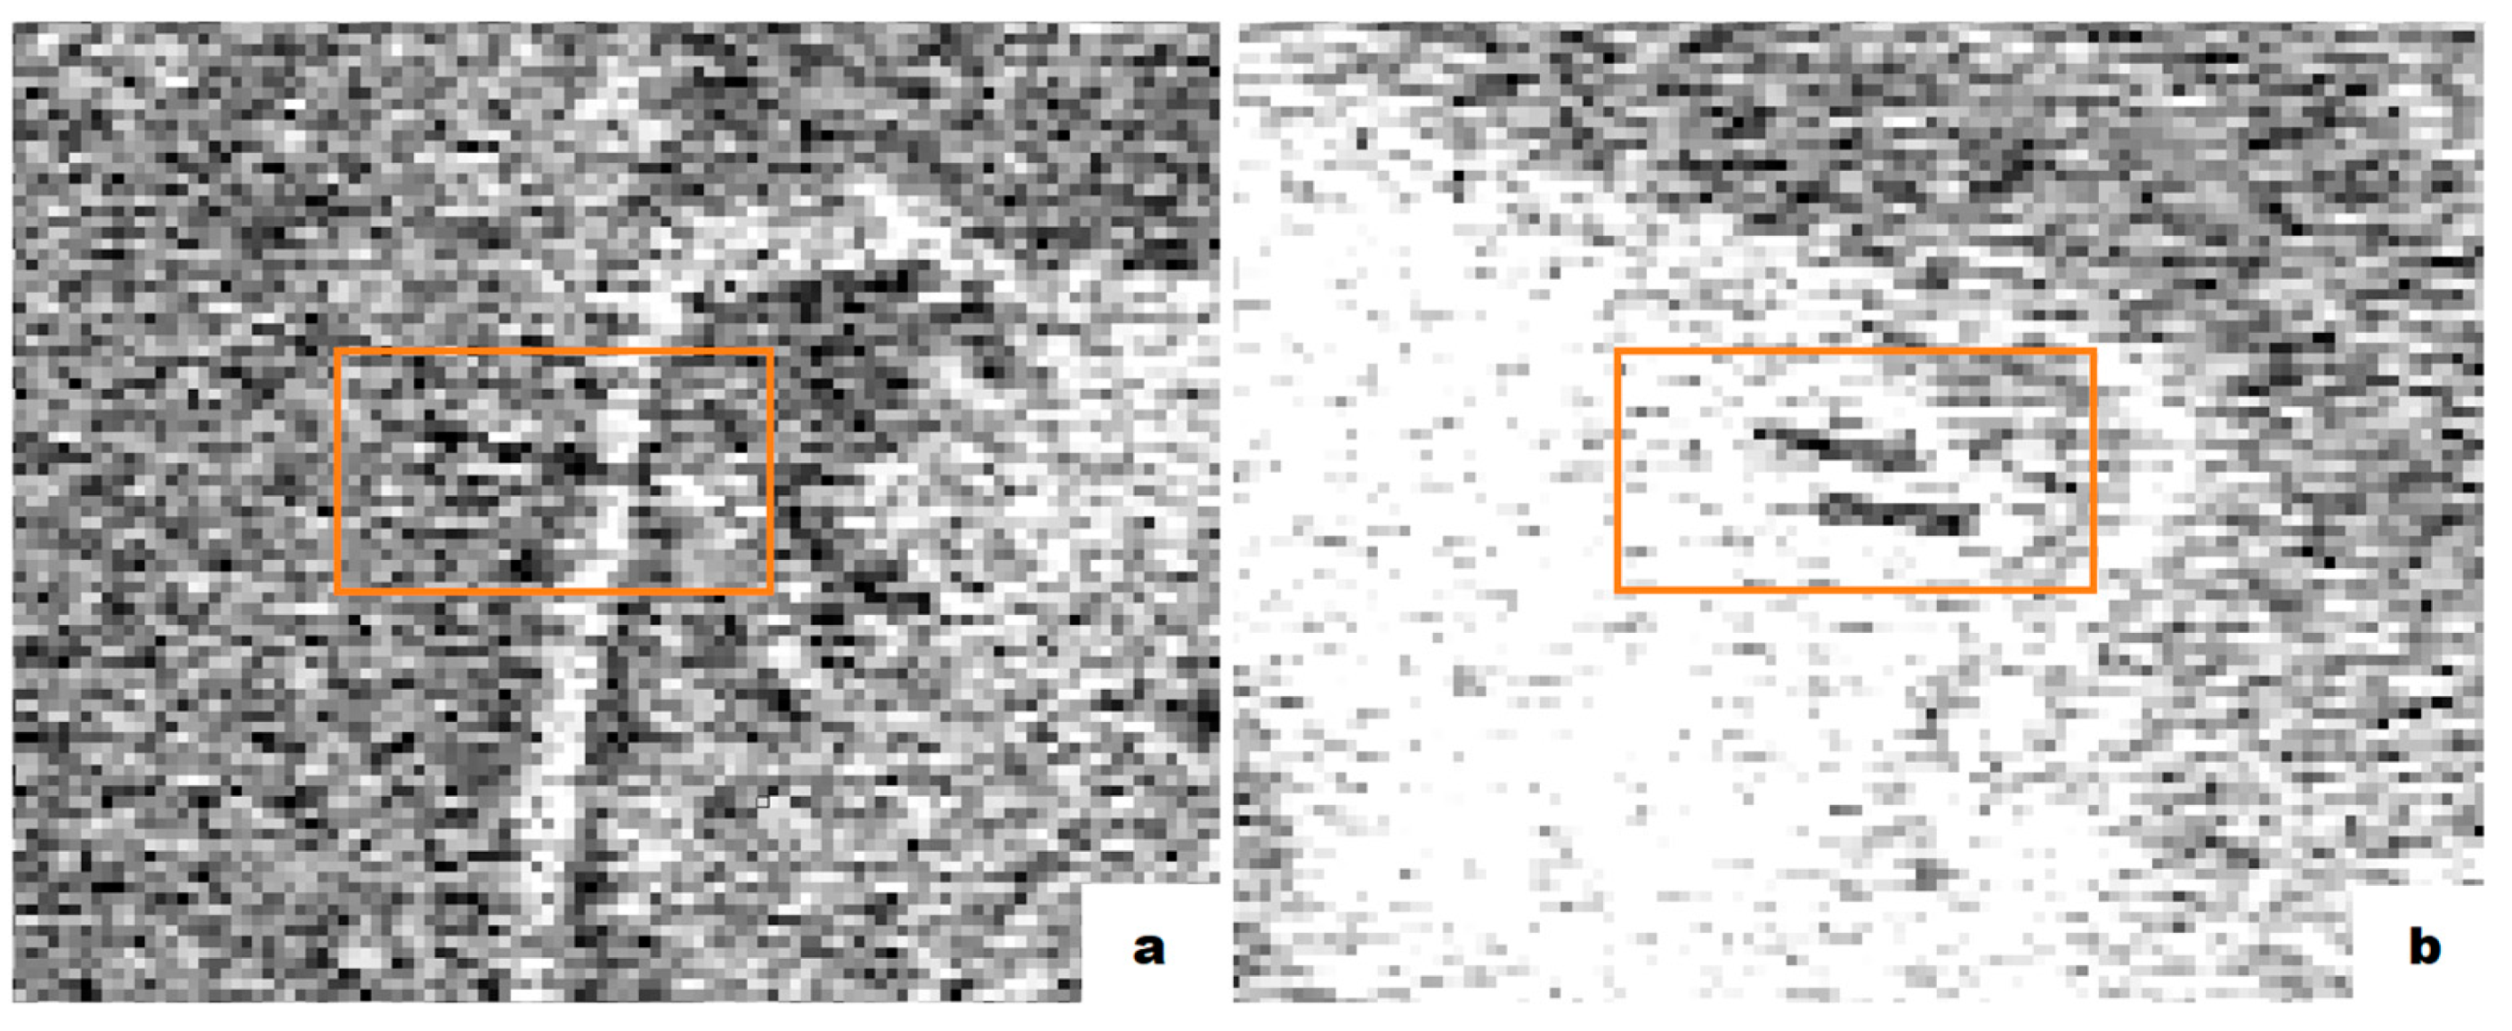
Comparison of Lee Sigma Speckle filter (a) and Median filter (Non-linear) (b).

Figure 13.
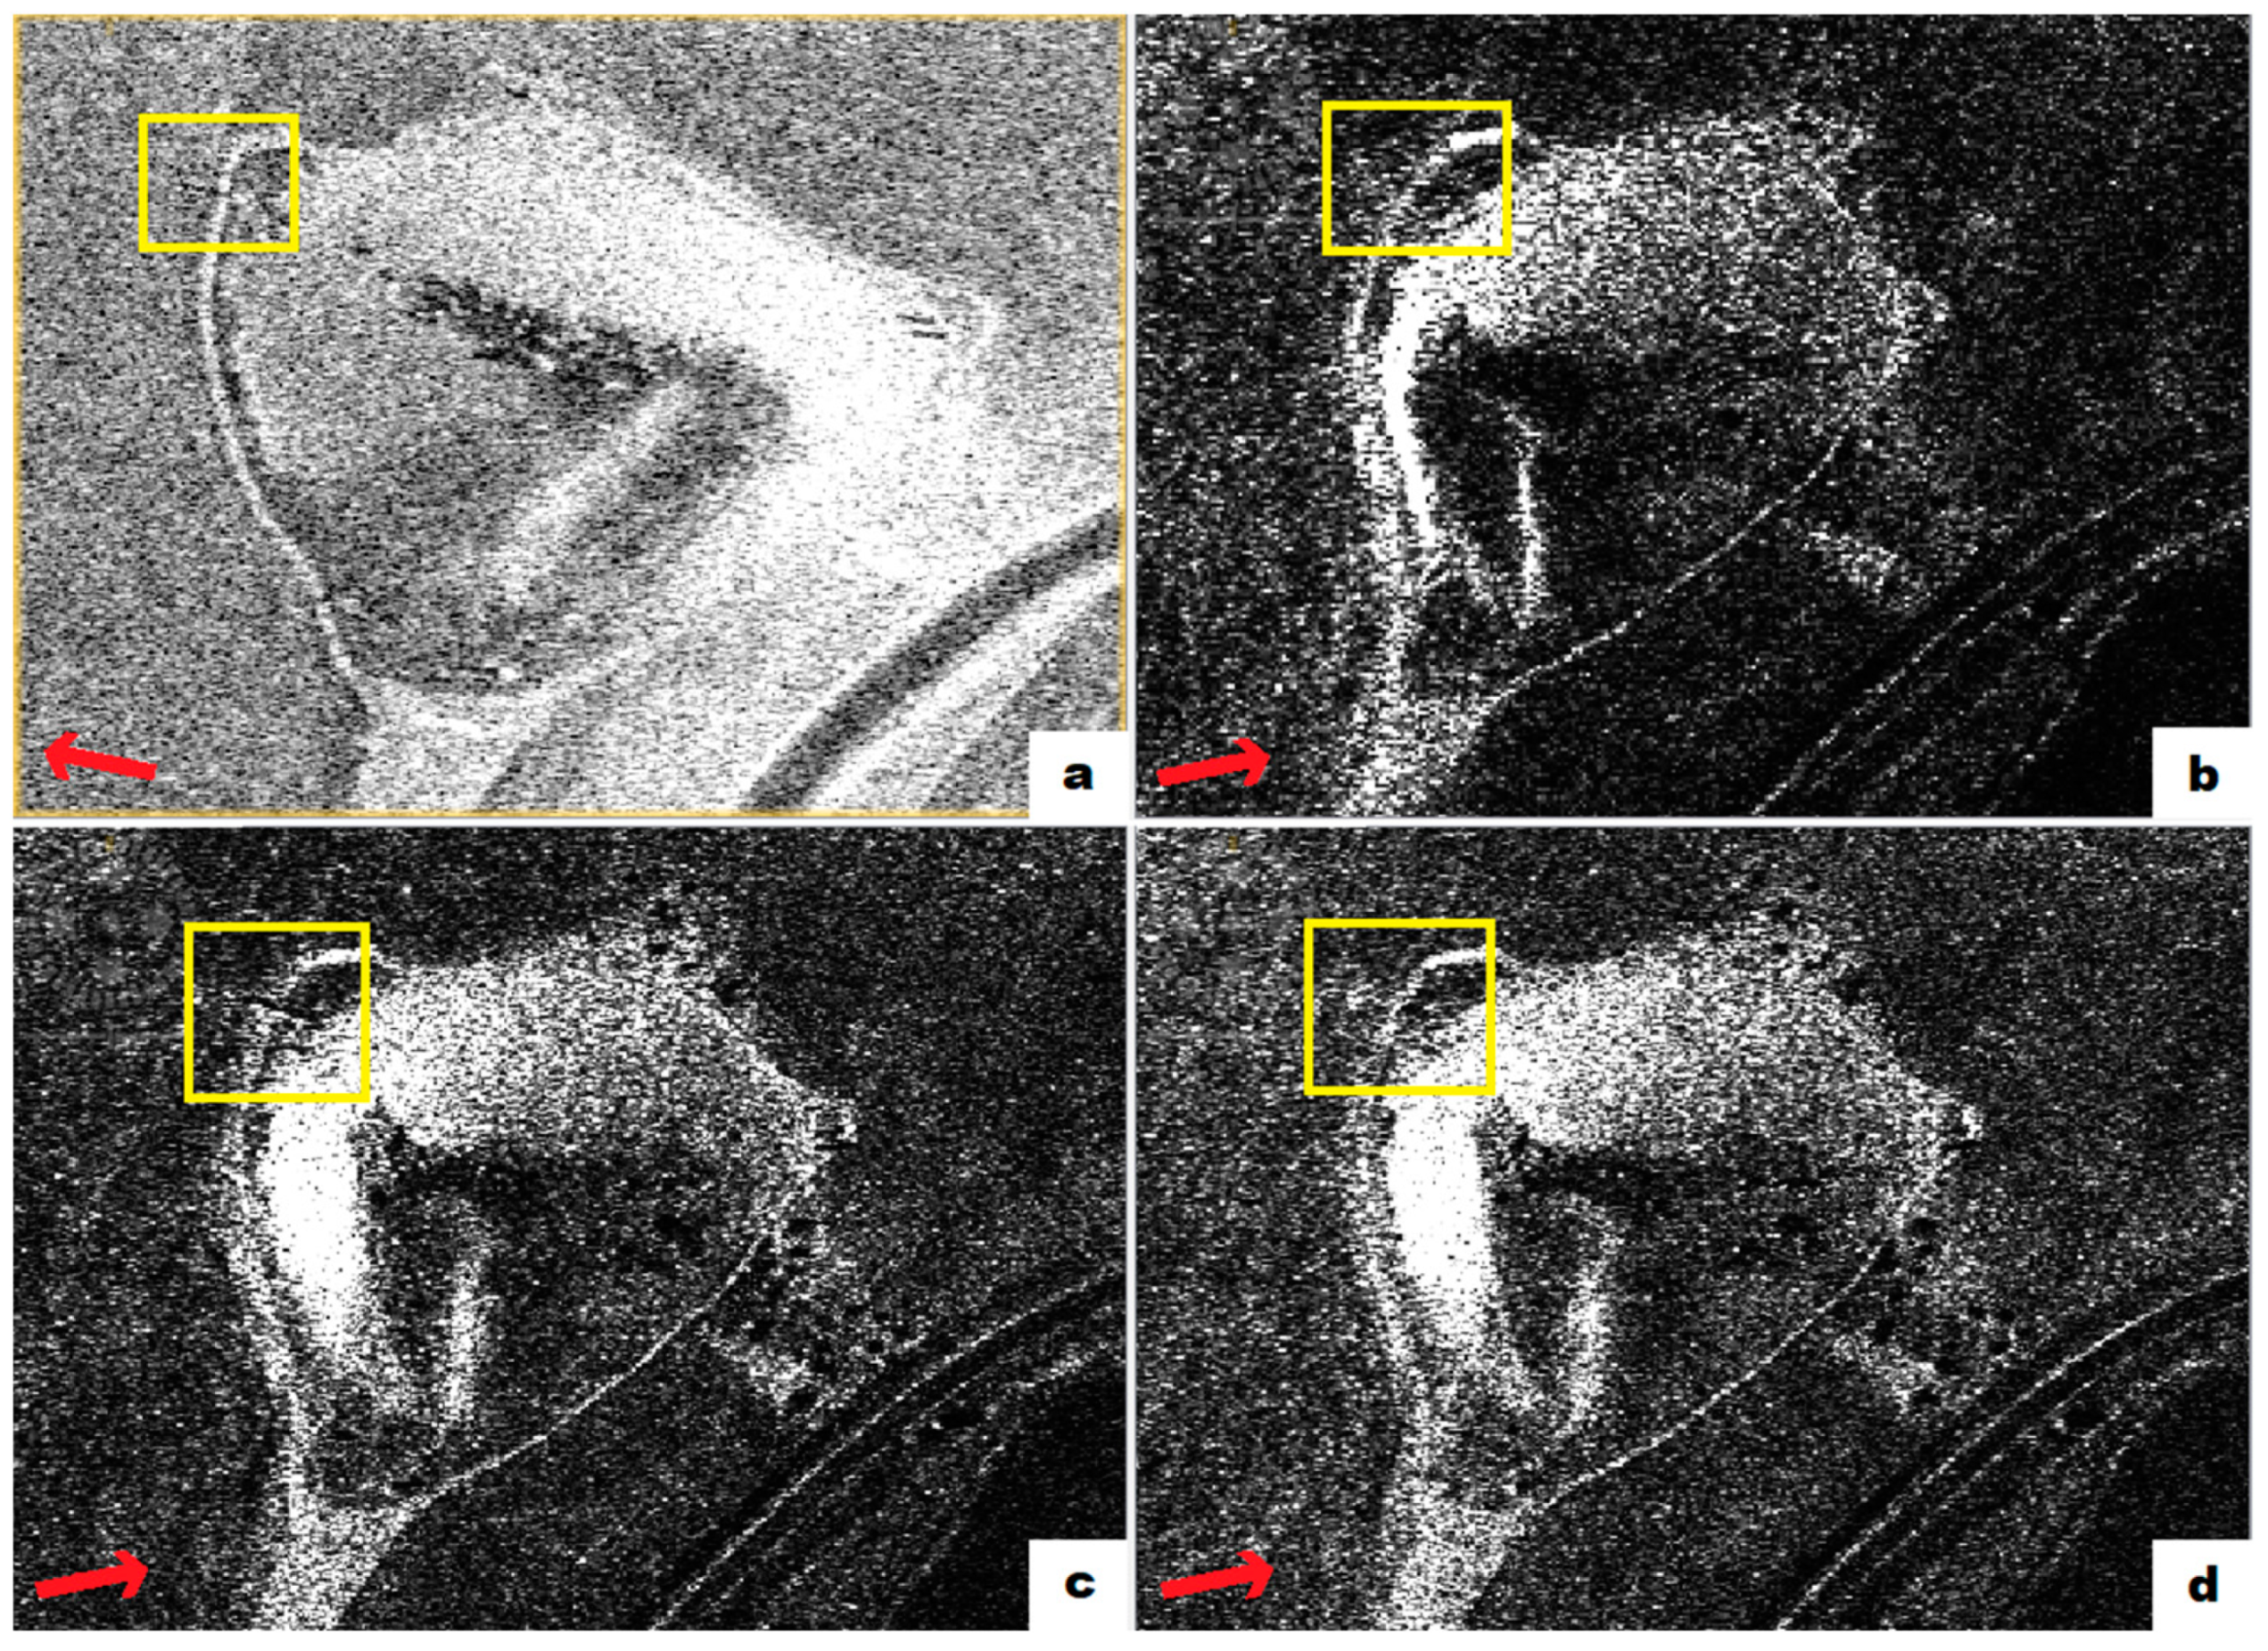
Mechanism for detecting different types of structural damage. Partially collapsed: (a) UAV image [37], (b) SAR image, (c) Filtered SAR image (Red lines and circle corresponds to the damage in UAV and SAR image). Totally collapsed: (d) UAV image [38], (e) SAR image, (f) Filtered SAR image (Shapes and colors in the UAV image corresponds to the backscatter in the SAR image). Special Condition: (g) UAV image of collapsed column [39], (h) Terrestrial image of standing columns [40], (i) SAR images (Drawing highlights the angle difference between backscatter of fallen column and shadow of standing column).
Figure 13.
Mechanism for detecting different types of structural damage. Partially collapsed: (a) UAV image [37], (b) SAR image, (c) Filtered SAR image (Red lines and circle corresponds to the damage in UAV and SAR image). Totally collapsed: (d) UAV image [38], (e) SAR image, (f) Filtered SAR image (Shapes and colors in the UAV image corresponds to the backscatter in the SAR image). Special Condition: (g) UAV image of collapsed column [39], (h) Terrestrial image of standing columns [40], (i) SAR images (Drawing highlights the angle difference between backscatter of fallen column and shadow of standing column).

Figure 14.
Hatay ulu mosque. (a) Google Earth image before the earthquake, (b) Google Earth image after earthquake, (c) SAR image, (d) Filtered SAR image. (Yellow polygons indicate structure and red arrows indicate the viewing direction of the sensor)(SAR Acquisition date: 23 March 2023—© DLR, 2023).

Figure 15.
Greek Orthodox Church. (a) Google Earth image before the earthquake, (b) Google Earth image after earthquake, (c) SAR image, (d) Filtered SAR image. (Yellow polygons indicate structure and red arrows indicate the viewing direction of the sensor) (SAR Acquisition date: 23 March 2023—© DLR, 2023).

Figure 16.
Saint Mary Church. (a) Google Earth image before the earthquake, (b) UAV image after the earthquake [41], (c) SAR image, (d) Filtered SAR image. The yellow square shows the church area where we expected strong backscatter from the roof, like other structures. The orange square shows the part of the standing roof corner of the church. (Yellow polygons indicate structure, orange polygon indicate standing roof corner and red arrows indicate the viewing direction of the sensor) (SAR Acquisition date: 12 May 2023—© DLR, 2023).

Figure 17.
Adıyaman Ulu Mosque. (a) Google Earth image before the earthquake, (b) Google Earth image after earthquake, (c) SAR image, (d) Filtered SAR image, (e) Aerial view indicating the rubble heap with green square [42], (f) Approximate height of the rubble (Green line) and the brightly scattering makeshift aluminum fence (Red marking) [42]. The orange square indicates the area where the standing part of the roof is northwest. The blue arrow in ‘e’ indicates north. (Yellow polygons indicate structure and red arrows indicate the viewing direction of the sensor) (SAR Acquisition date: 30 March 2023—© DLR, 2023).

Figure 18.
Habib-i Neccar mosque. (a) Google Earth image before the earthquake, (b) Google Earth image after earthquake, (c) SAR image, (d) Filtered SAR image. The orange circle indicates the area where the mosque’s roof is collapsed. (Yellow polygons indicate structure and red arrows indicate the viewing direction of the sensor) (SAR Acquisition date: 23 March 2023—© DLR, 2023).

Figure 19.
Latin Catholic Church. (a) Google Earth image before the earthquake, (b) Google Earth image after earthquake, (c) SAR image, (d) Filtered SAR image. The orange circle indicates the abscissa where the roof is still standing. (Yellow polygons indicate structure and red arrows indicate the viewing direction of the sensor) (SAR Acquisition date: 20 April 2023—© DLR, 2023).

Figure 20.
Kurtuluş Mosque. (a) Google Earth image before the earthquake, (b) Google Earth image after earthquake, (c) SAR image, (d) Filtered SAR image. The orange circle indicates the collapsed dome where we do not acquire strong backscatter. (Yellow polygons indicate structure and red arrows indicate the viewing direction of the sensor) (SAR Acquisition date: 29 March 2023—© DLR, 2023).

Figure 21.
Karakus Tumulus (a) and collapsed handshake relief (b) (Yellow circle shows the location of the collapsed column).
Figure 21.
Karakus Tumulus (a) and collapsed handshake relief (b) (Yellow circle shows the location of the collapsed column).

Figure 22.
(a) Collapsed column on the northwest of the tumulus, (b) Shadow of standing columns on the northeast of the tumulus. (Orange polygon shows the location columns) (SAR Acquisition date: 12 March 2023, Incidence angle center: 44.26°—© DLR, 2023).
Figure 22.
(a) Collapsed column on the northwest of the tumulus, (b) Shadow of standing columns on the northeast of the tumulus. (Orange polygon shows the location columns) (SAR Acquisition date: 12 March 2023, Incidence angle center: 44.26°—© DLR, 2023).

Figure 23.
Illustration of backscatter of the collapsed column from descending orbit in Figure 22a [43] (The color variation highlights the strength of the signal. Darker shades bounces back to the sensor.)

Figure 24.
Acquired SAR images of Karakus Tumulus. Out of four images, only in image (c) can we clearly see the collapsed column. (SAR Acquisition dates; (a) 12 March 2023, Incidence angle center: 44.26°, (b) 21 April 2023, Incidence angle center: 27.49°, (c) 26 April 2023, Incidence angle center: 43.16°, (d) 7 April 2023, Incidence angle center: 43.16°—© DLR, 2023) (Yellow polygons indicate structure and red arrows indicate the viewing direction of the sensor).

Figure 25.
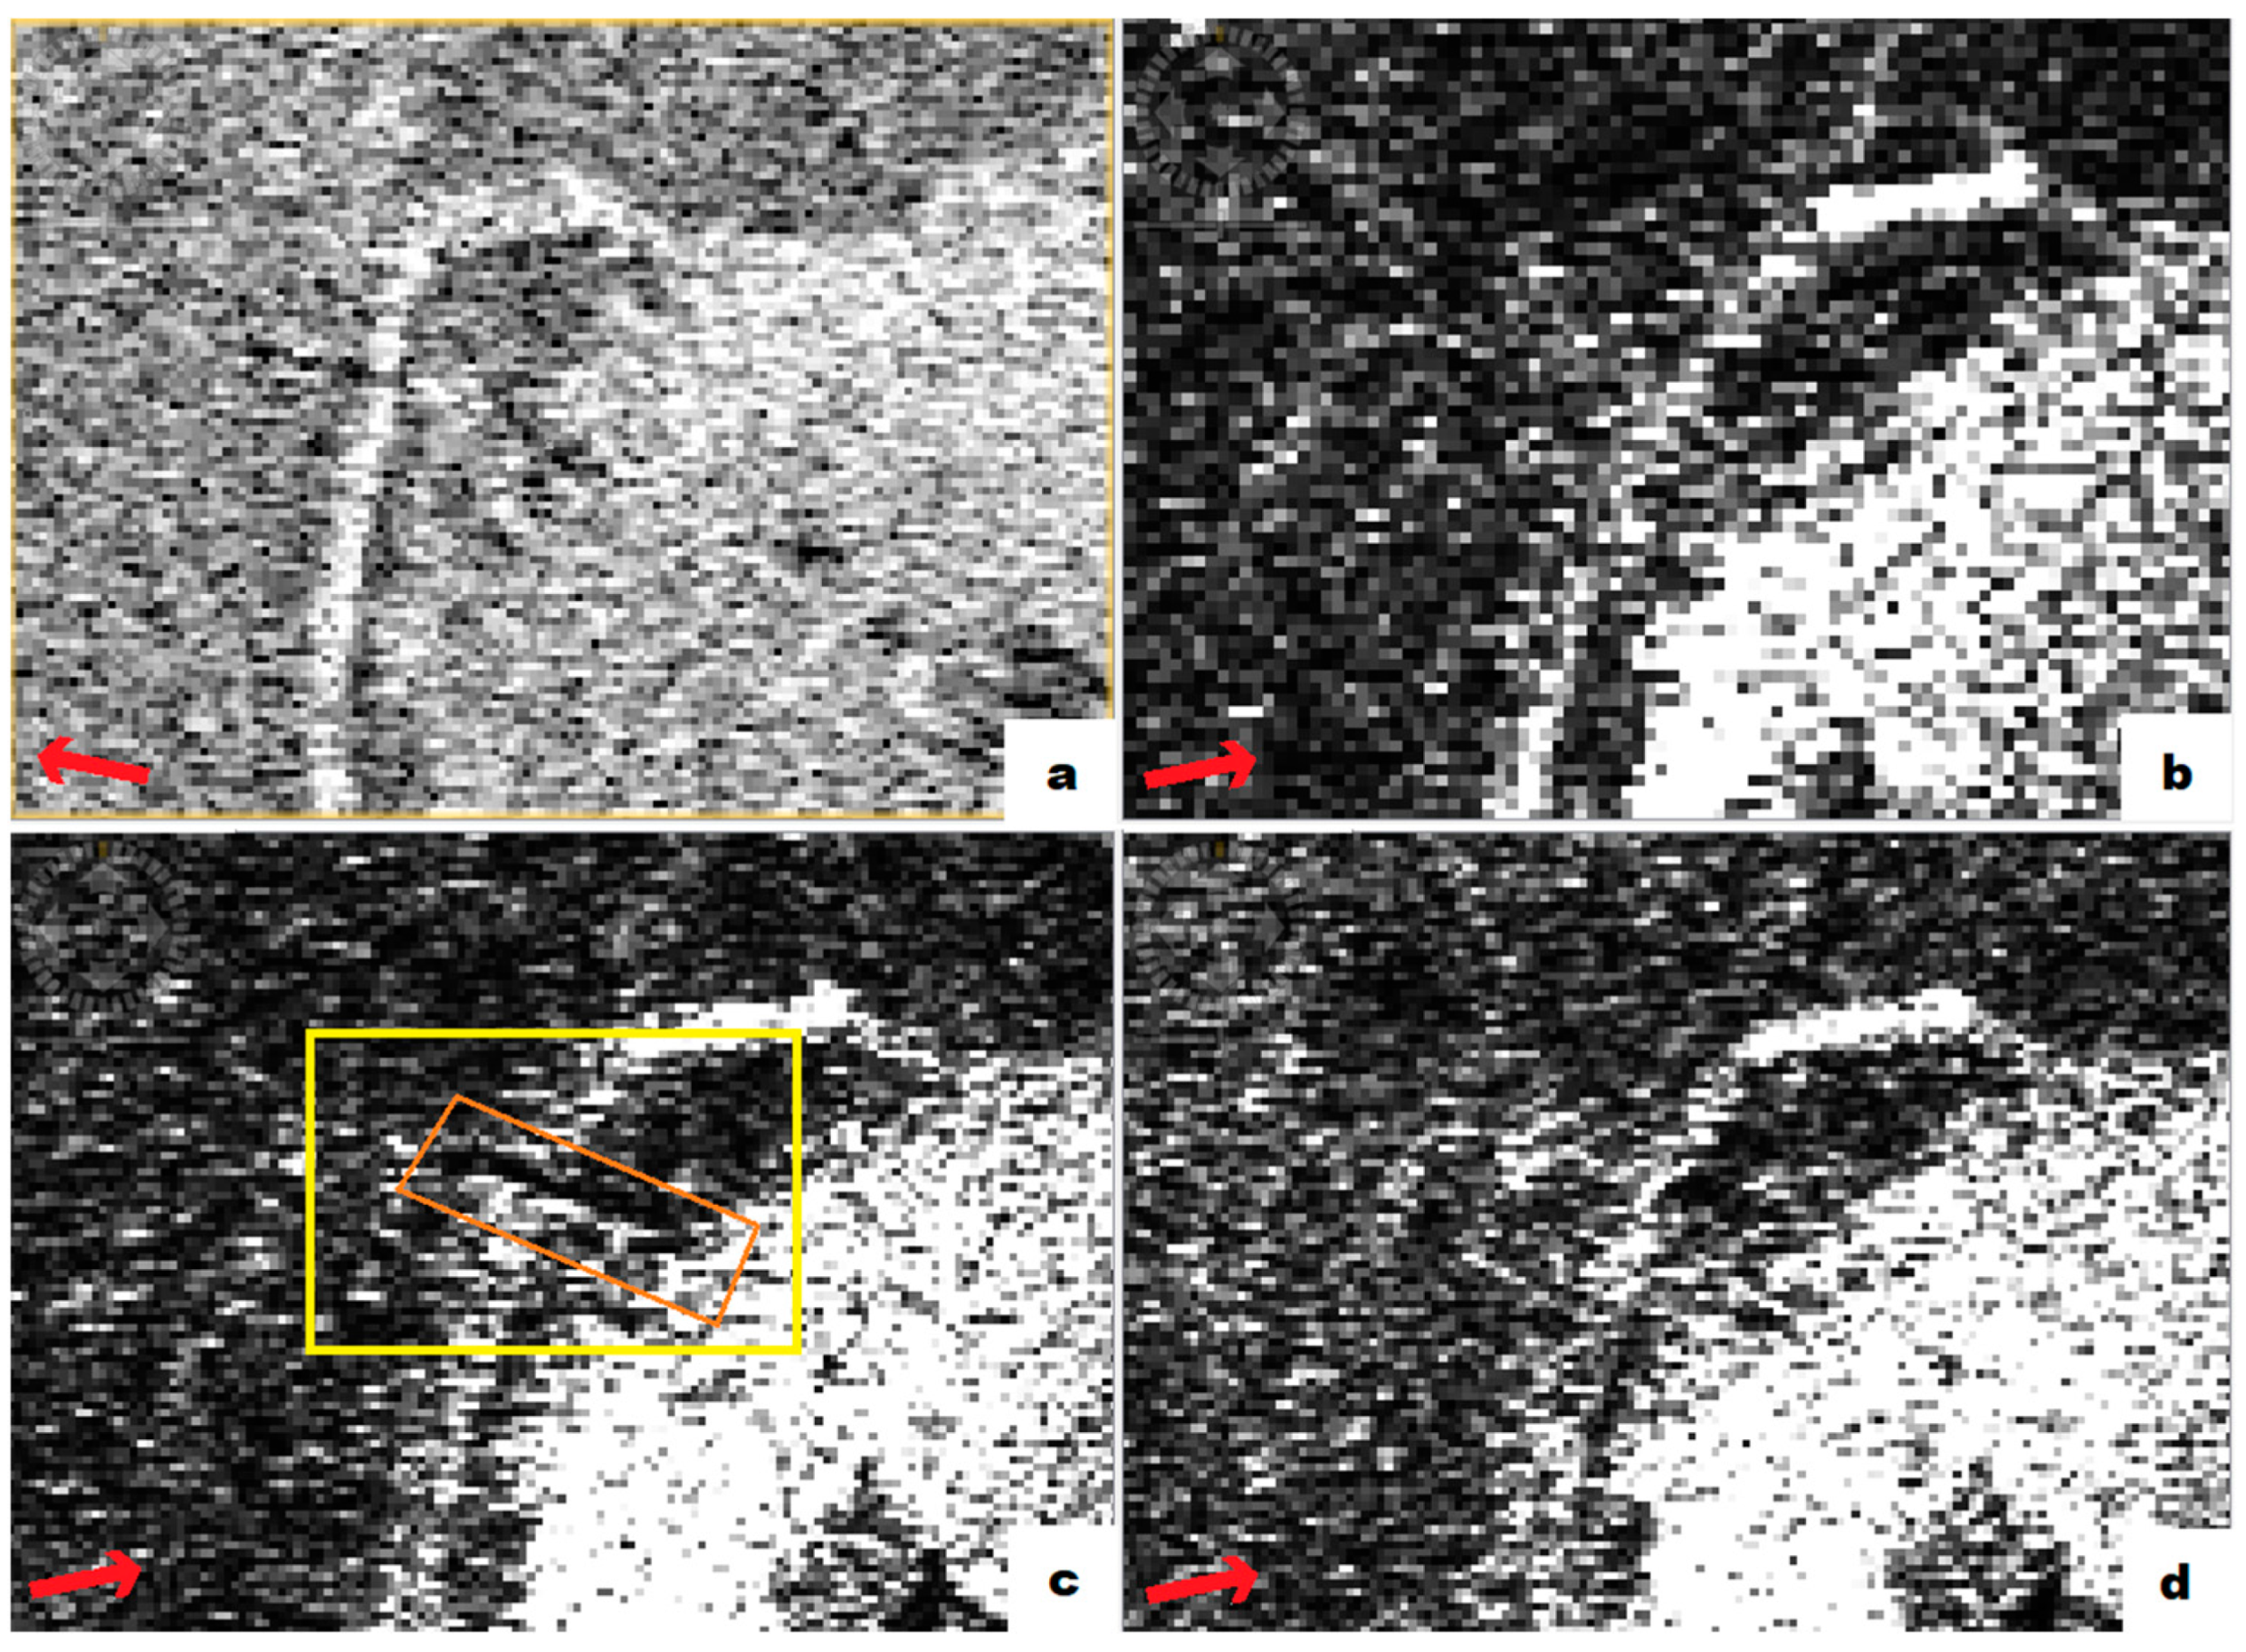
Zoomed SAR images into the collapsed column. The yellow polygon in image (c) indicates the area where the column is, orange polygon shows the collapsed column and red arrow indicate the viewing direction of the sensor (SAR Acquisition dates; (a) 12 March 2023, Incidence angle center: 44.26°, (b) 21 April 2023, Incidence angle center: 27.49°, (c) 26 April 2023, Incidence angle center: 43.16°, (d) 7 April 2023, Incidence angle center: 43.16°—© DLR, 2023).
Figure 25.
Zoomed SAR images into the collapsed column. The yellow polygon in image (c) indicates the area where the column is, orange polygon shows the collapsed column and red arrow indicate the viewing direction of the sensor (SAR Acquisition dates; (a) 12 March 2023, Incidence angle center: 44.26°, (b) 21 April 2023, Incidence angle center: 27.49°, (c) 26 April 2023, Incidence angle center: 43.16°, (d) 7 April 2023, Incidence angle center: 43.16°—© DLR, 2023).

Figure 26.
Filtered SAR images of the collapsed column. The yellow polygon in image (c) indicates the area where the column is, orange polygon shows the collapsed column and red arrow indicate the viewing direction of the sensor (SAR Acquisition dates; (a) 12 March 2023, Incidence angle center: 44.26°, (b) 21 April 2023, Incidence angle center: 27.49°, (c) 26 April 2023, Incidence angle center: 43.16°, (d) 7 April 2023, Incidence angle center: 43.16°—© DLR, 2023).

Figure 27.
SAR image of the Karakus Tumulus. Yellow squares show all four standing column shadows. (SAR Acquisition date: 24 August 2023—© DLR, 2023).
Figure 27.
SAR image of the Karakus Tumulus. Yellow squares show all four standing column shadows. (SAR Acquisition date: 24 August 2023—© DLR, 2023).

Figure 28.
(a) Shadow angle difference between the collapsed column and the standing one. (SAR Acquisition date: 12 March 2023), (b) The shadows of all standing columns are now aligned in the image taken after the column was re-erected. Yellow, orange and red lines are drawn to show the angle differences between columns and shadows. (SAR Acquisition date: 24 August 2023—© DLR, 2023).


Table 1.
Characteristics of the sites.
| Heritage Sites | Number in Figure 2 | City | District | Approx. Age (Century) | Material | Damage |
|---|---|---|---|---|---|---|
| Karakus Tumulus | 1 | Adıyaman | Kahta | 2nd–1st BC | Stone Pillar | Special Case |
| Ulu Mosque | 2 | Adıyaman | Merkez | 16th | Stone Blocks | Partially Collapsed |
| Kurtuluş Mosque | 3 | Gaziantep | Şahinbey | 17th | Stone Bricks | Partially Collapsed |
| Greek Orthodox Church | 4 | Hatay | Antakya | 19th | Stone, Stone Blocks | Totally Collapsed |
| Ulu Mosque | 5 | Hatay | Antakya | 13th | Stone, Stone Blocks | Totally Collapsed |
| Habib-i Neccar | 6 | Hatay | Antakya | unknown | Stone Blocks | Partially Collapsed |
| Saint Mary Church | 7 | Hatay | Altınözü | 14th | Stone, Stone Blocks | Totally Collapsed |
| Latin Catholic Church | 8 | Hatay | İskenderun | 19th | Red bricks (Terra-Cota) | Partially Collapsed |
Table 2.
Product properties. (HH: Horizontal-Horizontal, VV: Vertical-Vertical).
| Image | Satellite | Acquisition Mode | Polarization | Pass | Incident Angle Center (°) | Relative Orbit | Azimuth Resolution/Range Resolution (m) | Date of Acquisition |
|---|---|---|---|---|---|---|---|---|
| Adıyaman City Center | TDX1 | Staring Spotlight | HH | ASCENDING | 24.59 | 54 | 0.23/0.60 | 30 March 2023 |
| Hatay Saint Mary Church | TDX1 | Staring Spotlight | HH | ASCENDING | 39.65 | 39 | 0.23/0.60 | 12 May 2023 |
| Gaziantep City Center | TDX1 | High-Resolution Spotlight | HH | ASCENDING | 47.66 | 39 | 1.10/1.20 | 29 March 2023 |
| Hatay City Center | TDX1 | High-Resolution Spotlight | HH, VV | ASCENDING | 51.54 | 115 | 2.20/1.20 | 23 March 2023 |
| Karakus Tumulus 1 | TDX1 | Staring Spotlight | HH | DESCENDİNG | 44.26 | 107 | 0.23/0.60 | 12 March 2023 |
| Karakus Tumulus 2 | TDX1 | Staring Spotlight | HH | ASCENDING | 27.49 | 54 | 0.23/0.60 | 21 April 2023 |
| Karakus Tumulus 3 | TDX1 | Staring Spotlight | HH | ASCENDING | 43.16 | 130 | 0.23/0.60 | 26 April 2023 |
| Karakus Tumulus 4 | TDX1 | Staring Spotlight | HH | ASCENDING | 43.16 | 130 | 0.23/0.60 | 7 April 2023 |
| Hatay—İskenderun | TDX1 | Staring Spotlight | HH | ASCENDING | 39.70 | 39 | 0.23/0.60 | 20 April 2023 |
Disclaimer/Publisher’s Note: The statements, opinions and data contained in all publications are solely those of the individual author(s) and contributor(s) and not of MDPI and/or the editor(s). MDPI and/or the editor(s) disclaim responsibility for any injury to people or property resulting from any ideas, methods, instructions or products referred to in the content. |
© 2023 by the authors. Licensee MDPI, Basel, Switzerland. This article is an open access article distributed under the terms and conditions of the Creative Commons Attribution (CC BY) license (https://creativecommons.org/licenses/by/4.0/).
Share and Cite
MDPI and ACS Style
Boyoğlu, C.S.; Chike, I.; Caspari, G.; Balz, T. Assessing the Impact of the 2023 Kahramanmaras Earthquake on Cultural Heritage Sites Using High-Resolution SAR Images. Heritage 2023, 6, 6669-6690. https://doi.org/10.3390/heritage6100349
AMA Style
Boyoğlu CS, Chike I, Caspari G, Balz T. Assessing the Impact of the 2023 Kahramanmaras Earthquake on Cultural Heritage Sites Using High-Resolution SAR Images. Heritage. 2023; 6(10):6669-6690. https://doi.org/10.3390/heritage6100349
Chicago/Turabian StyleBoyoğlu, Cem Sönmez, Ifeanyi Chike, Gino Caspari, and Timo Balz. 2023. "Assessing the Impact of the 2023 Kahramanmaras Earthquake on Cultural Heritage Sites Using High-Resolution SAR Images" Heritage 6, no. 10: 6669-6690. https://doi.org/10.3390/heritage6100349