1. Introduction
The pathophysiology of decompression sickness (DCS) has been previously investigated in a multitude of studies over many decades culminating in more recent findings [
1] and guidelines [
2]. Previous studies have included blood biomarker analyses and evaluated potential pathophysiological responses to decompression stress, encompassing haematology [
3], cytokine responses [
4], inflammatory markers [
5], coagulation markers, endothelial function including microparticles (MP) [
6,
7], oxidative stress, and markers of brain insult/stress. Recent comprehensive findings are reported in detail elsewhere [
8]. In brief, these data support an acute phase inflammatory response, with elevation of circulating neutrophils (mean ~70%) and monocytes (~40%) alongside a consistent (mean five-fold) increase in interleukin-6, resolving by the following day. Complement activation (increased peptide C5a), elevated C-reactive protein (CRP) levels and neutrophil activation (increased neutrophil gelatinase-associated lipocalin, NGAL) all persisted the next day, together with elevated total endothelial MP (EMP), reflecting endothelial activation and/or injury [
8] with relevance to risk of more serious DCS. In contrast, modest early elevation of circulating platelets and platelet factor 4 were consistent only with normal diurnal variation [
9,
10], although a statistically significant increase in circulating tissue factor (coagulation factor III, thromboplastin) was apparent the day after decompression.
The fundamental mediators of injury in DCS are bubbles generated in tissues supersaturated with inert gas [
11]. Besides ‘foreign body’ surface interaction with blood proteins and cellular components, promoting inflammation, bubbles also interact with and damage the vascular endothelium and initiate pro-coagulant responses, such that severe DCS is often associated with coagulopathy [
11,
12]. Calibrated automated thrombogram (CAT) is a real-time measure of thrombin generation and has been purported to offer a functional assay of the haemostatic-thrombotic mechanism [
13] which to date has not been utilised to study the effects of decompression stress.
Following a recent decompression chamber study [
1] investigating the risk of hypobaric (low-pressure) DCS in parachutist despatchers working at high altitude (exposing physically active men twice to an equivalent altitude of 25,000 ft), we sought to assess blood coagulation kinetics via CAT.
Within the overarching study, besides symptoms of DCS, the response to decompression stress was evaluated by grading venous gas emboli (VGE) ‘bubble’ loads on the right side of the heart using echocardiography (2D four-chamber view with Doppler audio as recommended [
2]). Three participants experienced limb (knee) pain DCS, which curtailed their exposures, two during the first ascent and one in the second [
1]. The incidence of DCS was greater than previously anticipated, attributable to despatchers’ high levels of physical activity at altitude. During decompression, early, heavy and persistent VGE loads were typical, especially during the initial ascent and particularly in older participants (over 40 years of age). However, no bubbles were seen on the left side, indicating complete filtration in the lungs.
In this overall context, we wished to explore further whether the severe (hyperoxic) decompression stress obviously imposed during the recent study may have resulted in a change to coagulation kinetics post exposure and whether any changes were present 24 h later. The main aim of the study therefore was to analyse the coagulation kinetics, using CAT, of plasma in samples taken at baseline (resting), immediately after hypobaric exposure and also in a recovery sample taken 24 h from the baseline sample. Our null hypothesis was that these exposures were not associated with any change in any parameter of coagulation kinetics at any point post-exposure.
2. Materials and Methods
The study adhered to the principles of the Declaration of Helsinki. The research was funded by the UK Ministry of Defence (MOD) and the experimental protocol was approved in advance by the MOD Research Ethics Committee, an independent body constituted and operated in accordance with national and international guidelines. The investigation of coagulation kinetics was a post-hoc assessment using blood samples obtained from the protocol described here and previously [
8]. Participants were recruited through an advert placed on the QinetiQ intranet and on notice boards inviting potential volunteers to contact named investigators on the study team.
Participants were 15 healthy non-smoker men, comprising five aged under 30 years (mean 24, range 20–28) and 10 aged over 40 years (mean 46, range 41–50). They avoided dysbaric environments (flying, diving, parachuting, mountaineering) for 72 h prior to decompression and 24 h afterwards. They also avoided alcohol and strenuous physical exertion for 48 h prior to decompression and 24 h afterwards. Participants undertook two ascents to 25,000 ft, the first for 60 min and the second for 90 min, each preceded by 60 min of denitrogenation and breathing 100% oxygen throughout, separated by an hour at ground level breathing air normally. They simulated the duties of parachutist despatchers, including brief periods of load carriage prior to each ascent. Predominantly ambulatory activities at altitude simulated equipment checks prior to parachutist despatch and included numerous squats.
Decompressions were undertaken using the high-performance hypobaric chamber of the Altitude Research Facility at MOD Boscombe Down, Wiltshire, UK. An initial 20 mL pre-exposure baseline (T0) venous blood sample was collected by antecubital venepuncture between 08:00 and 08:30 h in all participants. The second post-exposure (T8) sample was collected immediately following completion of the second ascent, typically around 16:00 h. The following day a final, mid-morning ‘recovery’ sample was taken approximately 24 h after commencing their initial ascent (T24). Three instances of limb pain DCS curtailed experiments, all resolving during recompression to ground level and managed with 100% oxygen for an hour following descent, after which these participants’ T8 samples were collected.
Two 2.5 mL citrated samples for plasma were immediately double-centrifuged, first at 1500× g for 10 min and then, after careful pipetting to leave a generous residue, at 5000× g for 20 min. Platelet-free plasma samples were then packaged and transported to the Clinical Laboratory at Defence Science and Technology Laboratory (DSTL), Porton Down, Wiltshire, UK for storage at −80 °C, within two hours of sampling, for later batch transfer on dry ice to the University of Hull, UK.
2.1. Inclusion and Exclusion Criteria
An all-male subject population was sought as an assessment of DCS risk as female participants may be biased by phase of the ovarian cycle and any use of hormonal contraception, which are likely also to complicate recruitment of a female sample of reproductive age. In the context of the current study there was considerable potential for introducing bias that could only be mitigated by recruiting an additional female cohort at least the same size as the male sample. Thus, restricting the study to male volunteers enhanced the opportunity of achieving a meaningful outcome with a limited sample size.
Inclusion criteria were as follows: Participants were male, non-smokers who were required to: be medically fit with no medical contraindications to participation; undertake and pass the entry screening process and be able to move independently (vision) and communicate clearly over a headset (hearing) and microphone (speech) system; had not undergone any dental treatment or been exposed to a hypobaric or hyperbaric environment (e.g., flying, diving, parachuting, mountaineering) within the 72 h prior to decompression, or planned to do so for 24 h after decompression; be prepared to avoid alcohol and strenuous physical exertion for 48 h prior to decompression, and for 24 h after decompression. In addition, participants must have shown no underlying predisposition to severe DCS. Participants who have previously experienced minor (Type I) DCS symptoms in a laboratory setting were not excluded. Participants must also have been able to tolerate breathing from respiratory apparatus through an aircrew oxygen mask, be suitable for and able to tolerate prolonged recumbent MRI, be free from significant patent foramen ovale and excess pre-existing white matter hyperintensities (WMH).
Exclusion criteria were as follows: Females were excluded to minimise both risk of bias and overall sample size, as detailed in the section above. The remaining exclusion criteria in detail were: A history of significant lung disease (e.g., bullous emphysema, spontaneous pneumothorax, thoracotomy, pulmonary resection, pneumonia within the previous six months, chronic obstructive pulmonary disease, cystic fibrosis, asthma, exercise induced bronchoconstriction, tuberculosis or any chronic infective or inflammatory respiratory disorder); Active or recent upper or lower respiratory tract infection; Any history of open heart surgery or any past or present cardiovascular disease (e.g., high or low blood pressure, congenital heart disease, ischaemic heart disease, congestive cardiac failure, significant arrhythmia, myocardial infarction or other cardiac ailment); Abdominal surgery within the last six months; History of chronic ear, sinus or nasal conditions (e.g., sinusitis, severe or current rhinitis or chronic otitis media); History of recurrent ear or sinus barotrauma unless linked to a temporary minor ailment which has since completely resolved; History of recent surgery to the ear or nasopharynx (within the previous six months); History of recurrent or unexplained loss of consciousness, neurological problems, fits, faints or convulsions (including any seizures after age six years); Any history of severe (neurological or respiratory) DCS; Any other medical, psychological or physiological condition considered unacceptable by the senior medical officer during medical screening; History of migraine or severe headache requiring medical treatment; Past severe head injury (of greater severity than Mild Traumatic Brain Injury); Past intracranial surgery; Current smokers; History of past stroke or suggestive of transient ischaemic attack; Any significant neurological symptoms, dizzy spells, vertigo or fainting; Serious past or current psychiatric illness requiring medication; Ongoing active participation in boxing or high-risk contact sports including rugby; History of optic neuritis.
2.2. Calibrated Automated Thrombogram (CAT)
Of the 15 subjects, 12 had sufficient plasma for complete (T0, T8 and T24) analysis and these samples were analysed by the method described by Hemker et al. [
13] for thrombin generation in real time. Samples (80 µL) were plated in quadruplicate into wells on Immulon transparent round bottom 96-well microtiter plates (ThermoFisher Life Sciences, Loughbrough, UK). PPP reagent (20 µL, Stago, Theale, UK) containing 5 pM tissue factor and phospholipids, was added to two of the four wells for each sample and thrombin calibrator at 615 nM (20 µL, Stago, Theale, UK) was added to the remaining two wells. The plates were then agitated and incubated for 10 min prior to reaction initiation by automated addition of 20 µL of a FluCa Kit solution (Stago, Theale, UK) containing 0.1 M CaCl
2 and a fluorogenic substrate (Z-Gly-Gly-Arg-amino-methyl-coumarin fluorophore). The real-time fluorescence emission was measured by Fluoroscan Ascent
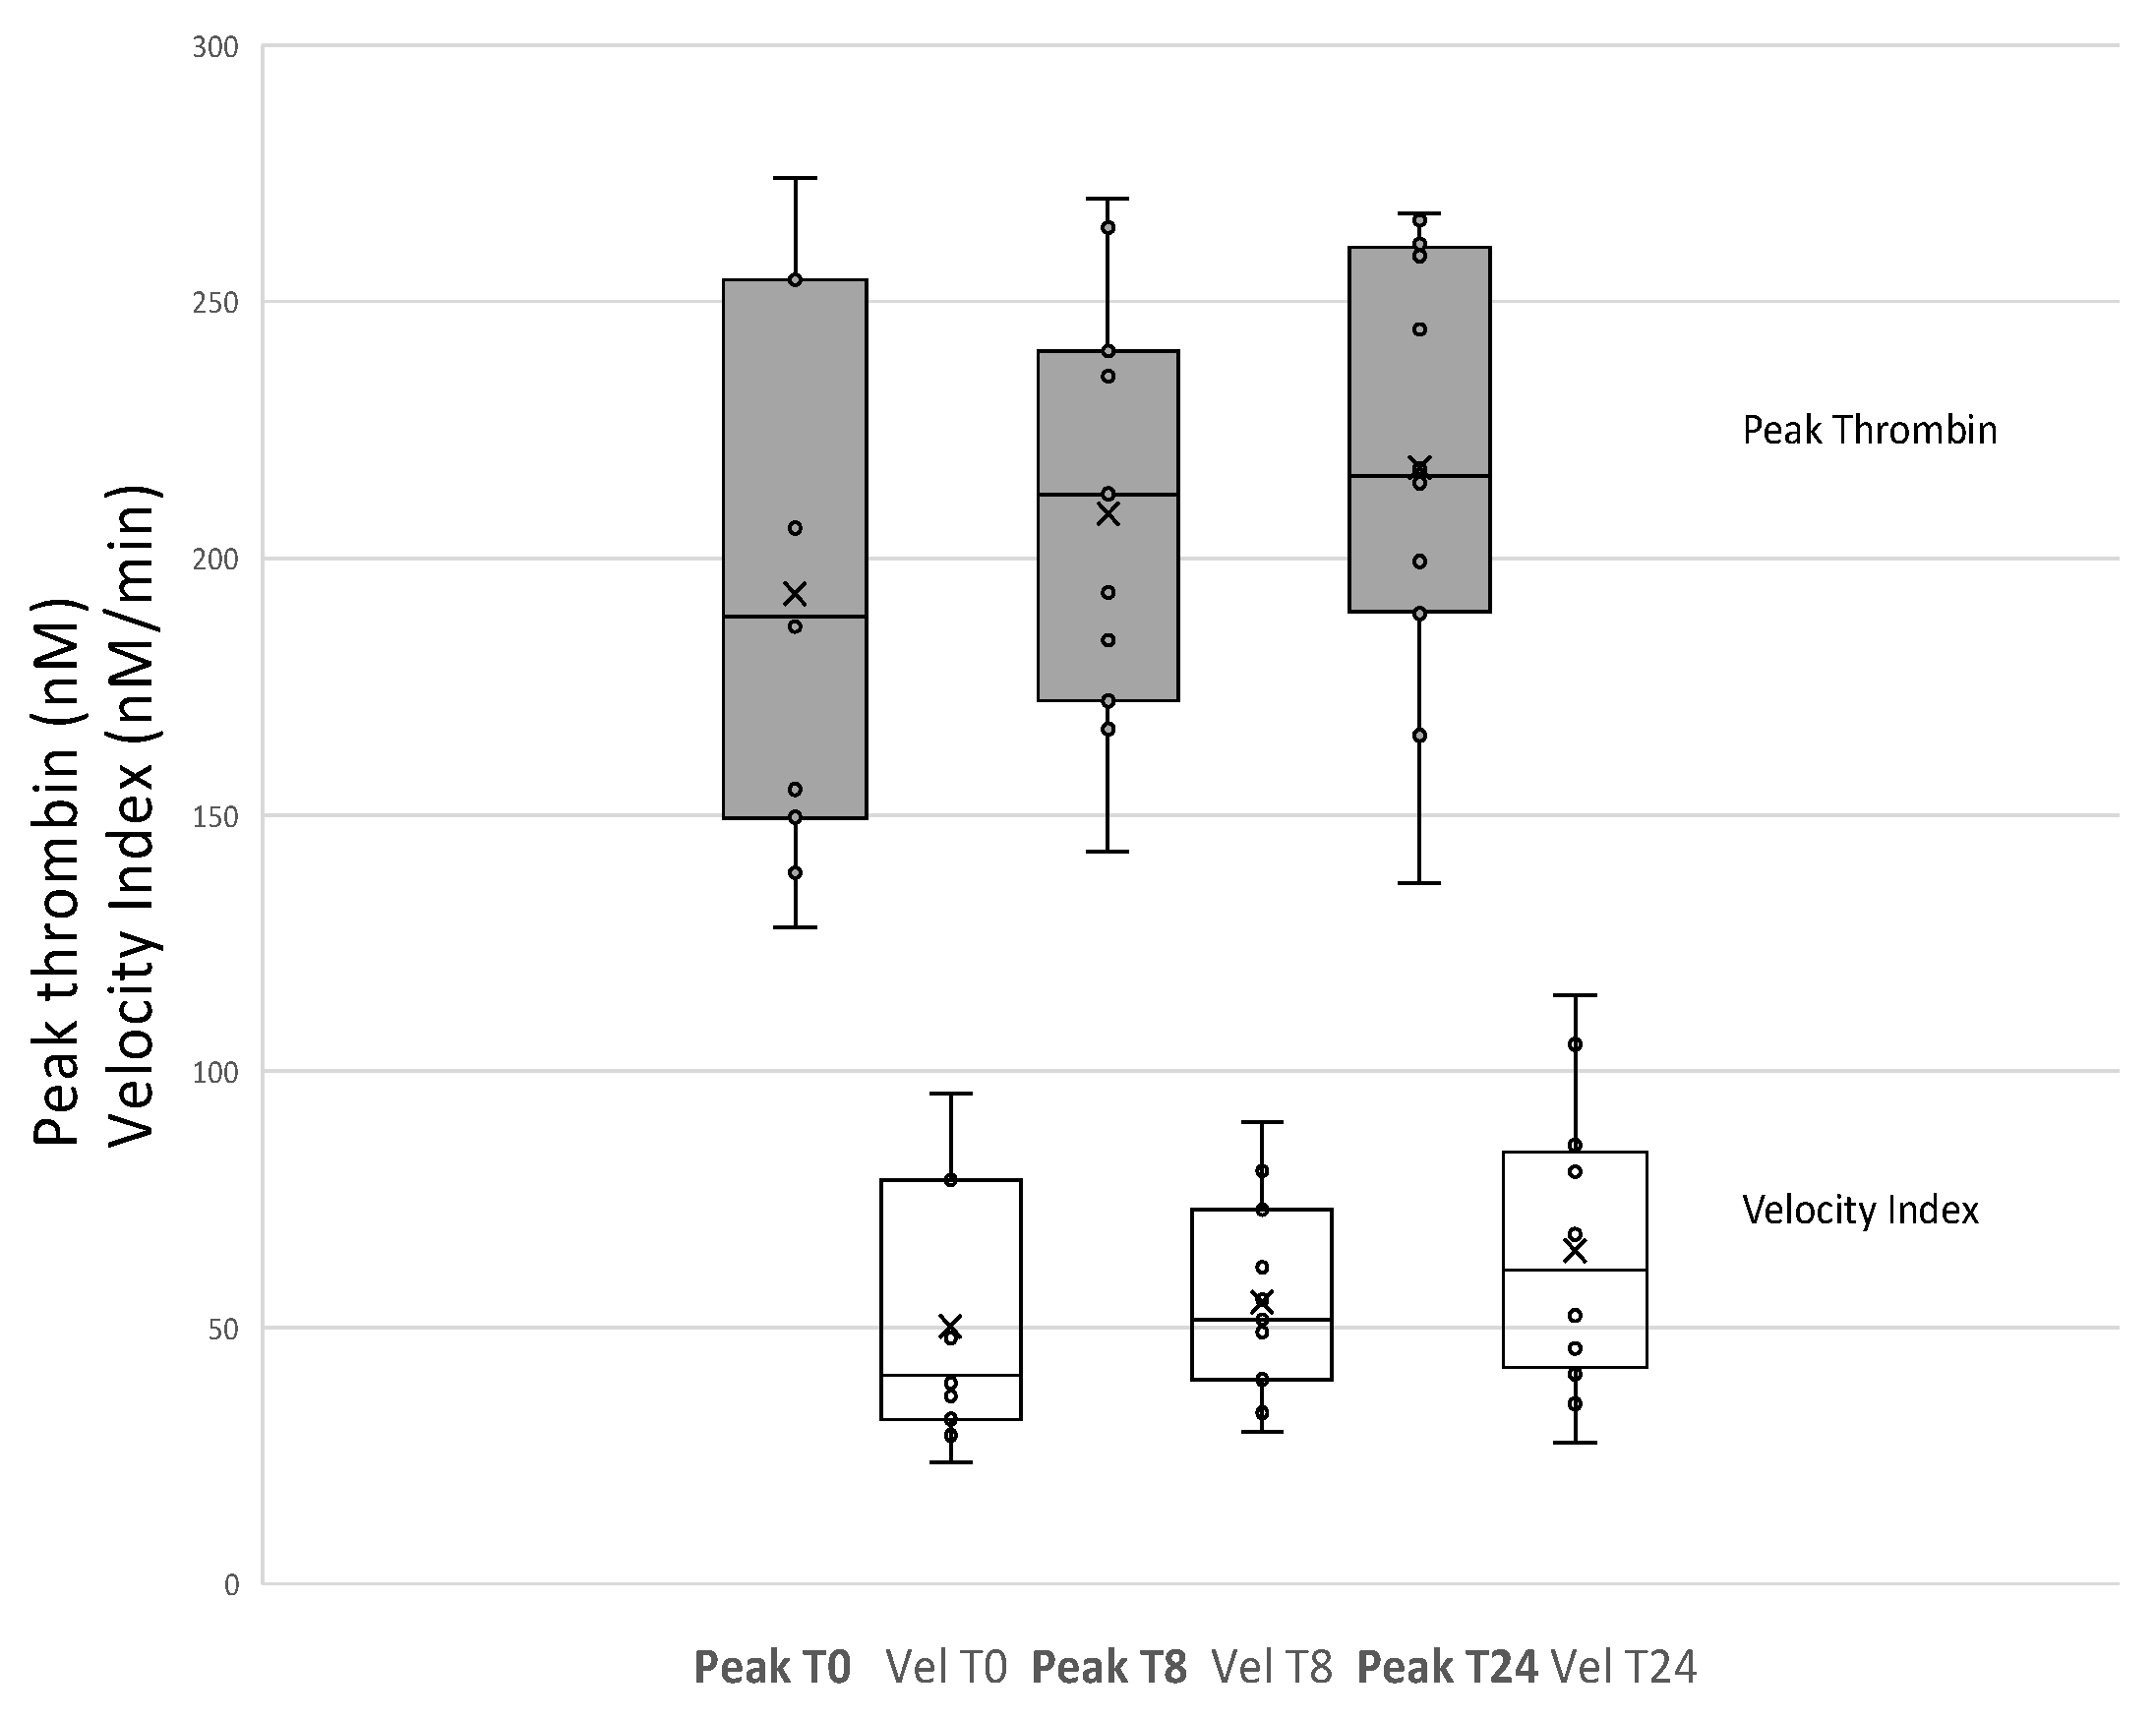
® fluorometer (Thermolab systems OY, Helsinki, Finland) with excitation/emission wavelengths 390 nm/460 nm. Thrombin generation was measured for 1 h and thrombin generation curves were produced using Thrombinoscope™ software version 3.0.0.29 (Thrombinoscope B.V., Maastricht, The Netherlands). The parameters obtained from CAT are the lag time (LAG), velocity index (VEL), time to peak thrombin (TTP), endogenous thrombin potential (ETP) and peak thrombin (PEAK).
2.3. Analysis
Due to individual variability, values at T8 and T24 were compared with individuals’ own baseline parameters (T0). Paired t-tests were carried out on the whole group (n = 12) for each parameter for changes from baseline (T0) to post exposure (T8) and also from post exposure (T8) to 24 h (T24) using Excel statistics package.
4. Discussion
We report for the first time the use of calibrated automated thrombogram to investigate coagulation profiles in a human hypobaric decompression stress model. No significant alterations were found in ETP showing that thrombin potential is not affected by the systemic response to decompression stress.
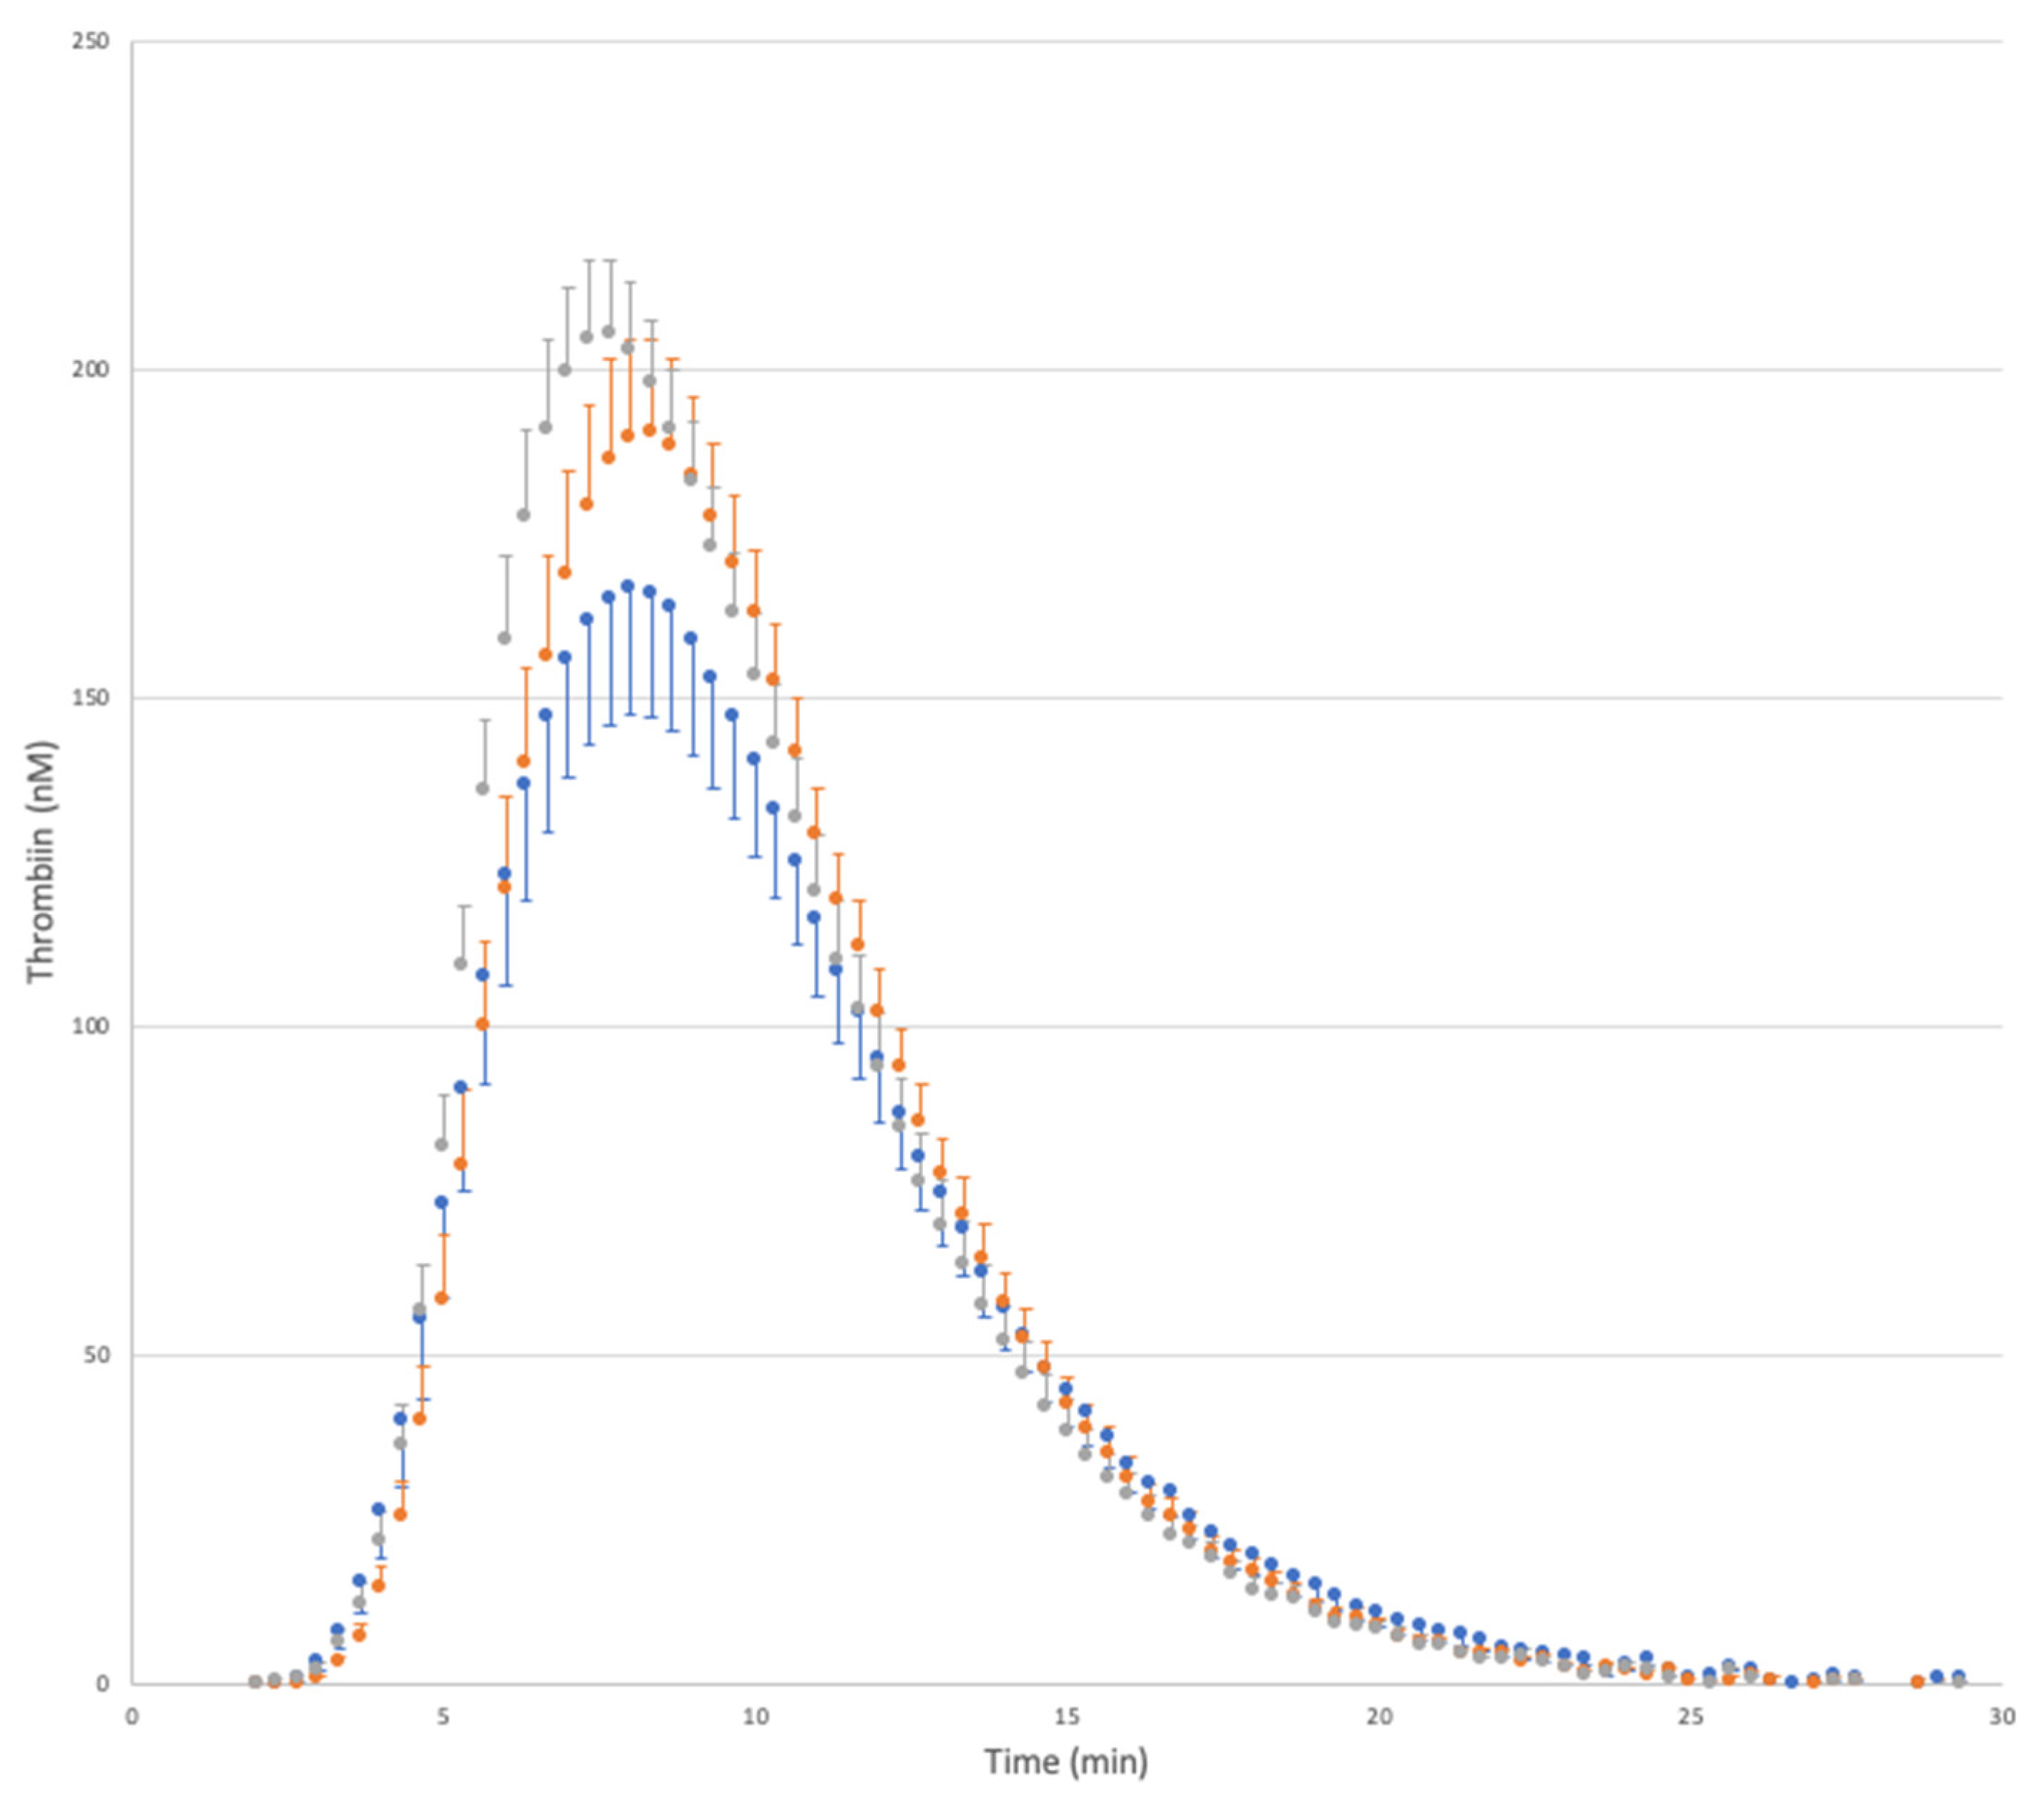
In terms of VEL we did observe a sustained and significant increase from baseline through T8 and then 24 h post protocol (
Figure 1). The increased speed of thrombin generation coupled with a trend for a higher thrombin peak suggests that a shift in coagulation profile occurs post decompression to a sharper, more defined profile whilst the area under the curve remains the same (ETP). This ‘sharper’ profile was also accompanied by a non-significant decrease (i.e., earlier) start time of the tail of thrombin generation (
p = 0.11 baseline to 24 h) and could equate to a slight increase in procoagulant activity following decompression stress in this study.
Caution must be taken when interpreting lag times as thrombin generation is measured every 20 s throughout the assay so while the assay is a real-time measure of thrombin generation, the individual sampling of each well of a 96-well plate can only be determined maximally every 20 s. This means for example, that a lag time a few seconds after 4 min would be reported as 4.33 min and this can clearly be seen in the median lag time obtained (
Table 1) where T0 samples had a median of 4 min and both T8 and T24 samples had a median lag time of 4.33 min (equating to the next measurement time). These issues inherent in the reporting of lag times make it difficult to draw any conclusions based on these data and associated statistics especially on a relatively low sample size. The influence of sampling frequency becomes of lesser importance as the assay proceeds but does still affect the time to peak values as again observed in
Table 1.
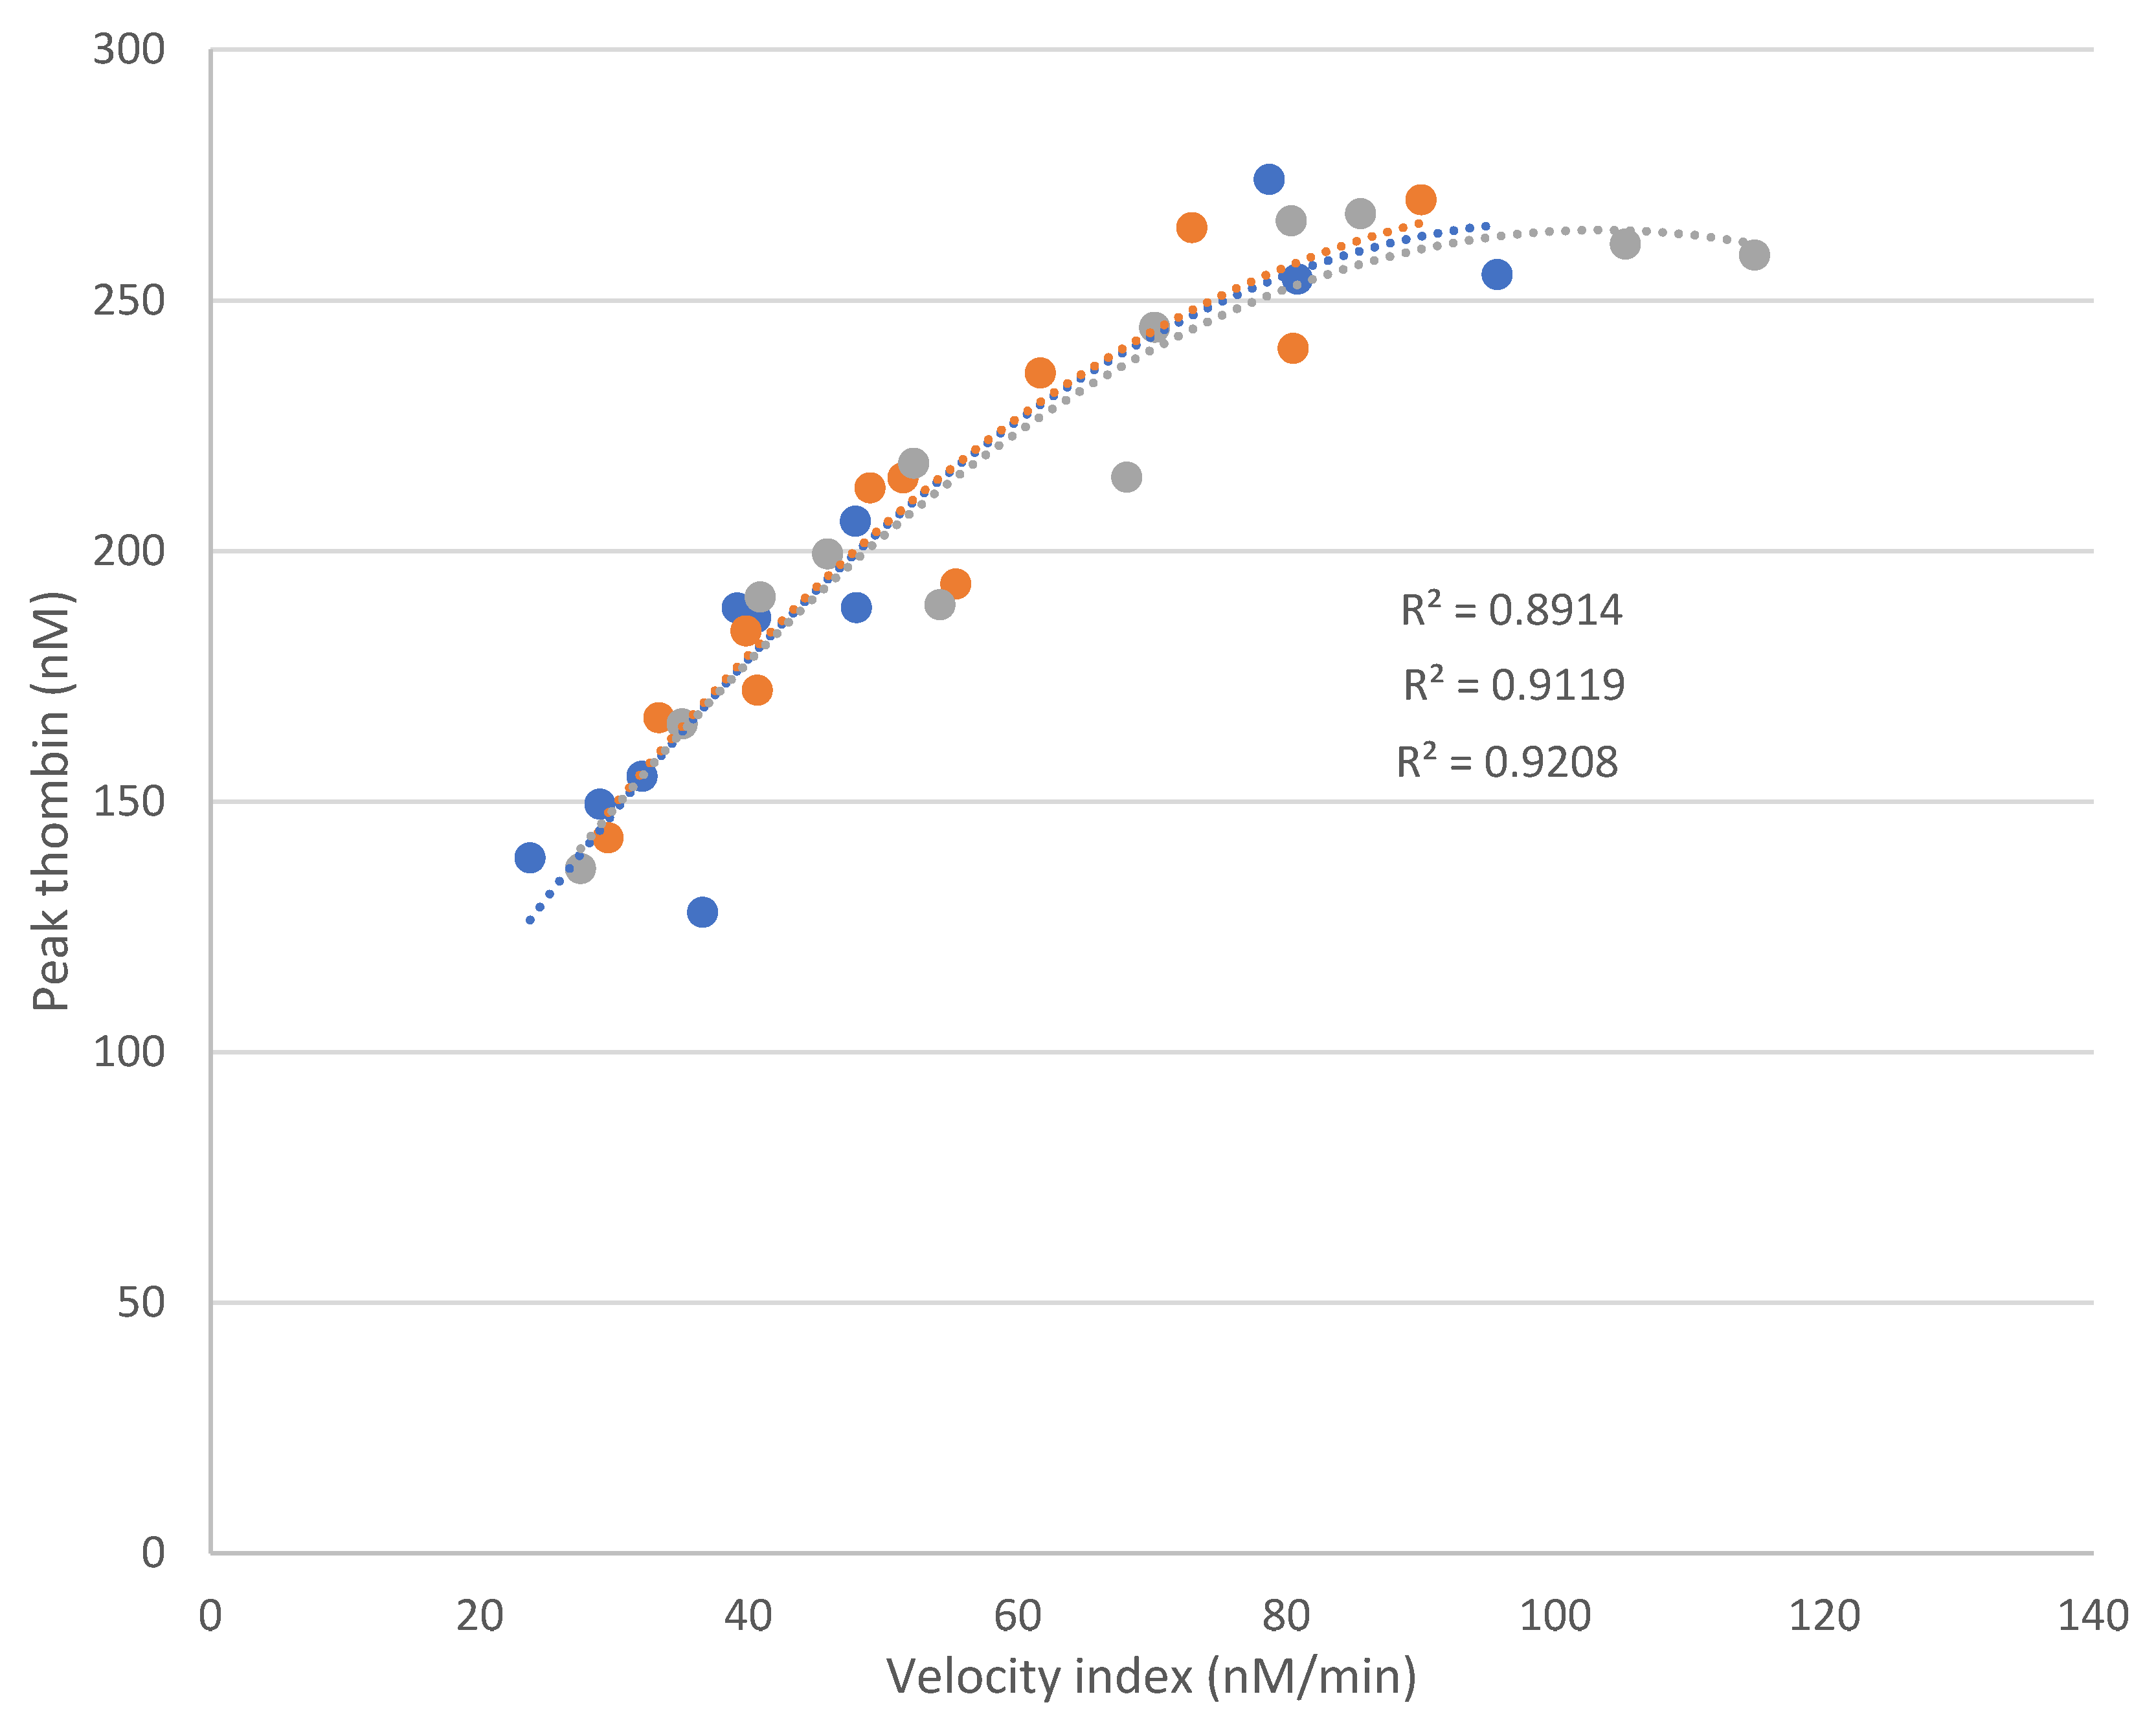
The relationship between peak thrombin and VEL showed a strong positive correlation overall and also at each individual time point (
Figure 3). As ETP remains relatively constant throughout the study then these parameters in combination are indicative of the observed profile shift towards a more procoagulant tendency. This persists the day after decompression, alongside elevated levels of circulating tissue factor and evidence of an unresolved inflammatory response (elevated CRP, C5a, NGAL and total EMP) [
8], however, none of these parameters were found to be correlated with the data generated and presented here.
The first study to investigate EMP release in response to simulated decompression stress demonstrated an increase in EMP release following decompression [
12]. Subsequently other groups have taken forward this research and shown detailed interactions of MP released in response to decompression [
14,
15,
16,
17]. MP in healthy subjects are not thought to be procoagulant [
18]. Since EMP release is increased within the current protocol [
8] the data here concur that any nascent release of EMP most likely does not contribute to the ETP. EMP are likely not involved in the coagulation process but they are indicative of endothelial damage and/or activation which may contribute to the changes observed. A recommendation would be to assess numbers of circulating tissue factor-bearing MP in relation to decompression and their potential contribution to the changes in CAT parameters.
A previous study did not detect activation of the extrinsic coagulation pathway in response to decompression following either air or heliox breathing although the data suggested possible activation of fibrinolysis [
19]. The markers measured in that study were comprehensive, consisting of soluble tissue factor, tissue factor pathway inhibitor, factors XII, X, VII, and I, prothrombin fragment F1+2, thrombin-antithrombin complex, platelet count, prothrombin time, activated partial thromboplastin time, plasmin-antiplasmin complex (PAP) and D-Dimers. The same group latterly reported no effects of decompression on thrombin activatable fibrinolysis inhibitor [
20] but did observe increased D-Dimer levels in those with neurological symptoms. Furthermore, severe neurological DCS was shown to be associated with low-grade disseminated intravascular coagulation in previous studies [
21,
22]. In addition, incomplete recovery from severe neurological DCS was associated with a significantly higher concentration of D-Dimers [
23] suggesting some degree of coagulation occurred in these divers. It has also been demonstrated that decompression stress led to an earlier onset of clot formation at 75 min through to 5 h post-dive. This hypercoagulable state was continuous until 5 h after the dive and was shown to resolve at 24-h post-dive [
24]. The current findings agree somewhat with this study in that we also observed a shift towards a more pro-thrombotic state although the methodologies in terms of protocol and analysis are very different. Other studies have shown DCS to be associated with low grade inflammation [
25,
26] which may be related to the potential increase in procoagulant activity shown here by VEL and peak thrombin.
Serious DCS is associated with coagulopathy [
27]. The current study imposed considerable hypobaric decompression stress, with prolonged hyperoxia and substantial bubble loads of venous gas emboli. In this context, the absence of any meaningful effect on circulating platelet count or evidence of platelet activation was surprising. Nonetheless, subtle evidence of altered coagulant status includes the elevation of circulating tissue factor and the persistent disturbance of thrombotic homeostasis reported here. These changes may reflect enhanced susceptibility to subsequent decompression stress, with increased risk of more severe DCS in the event of repeat exposure prior to complete resolution of procoagulant and pro-inflammatory responses.
Limitations of the present study include the lack of a control group and data to discern the effect of the exercise component in isolation. Any potential contribution of diurnal variation is therefore not accounted for but the changes observed here and more specifically those reported previously [
8] would appear to be more likely attributable to the protocol rather than diurnal variation due to the timing of the changes observed (i.e., post-exposure and 24 h from baseline). It would be expected on a diurnal variation basis that parameters measured here would essentially return to baseline values on a 24 h cycle. Due to the complex and time-consuming nature of studies such as this, the data obtained should be expanded upon and used as a basis for further investigations. A mixed sex population could also be recruited into future studies with a large enough cohort to enable any sex-specific changes to be analysed.
In summary, hypobaric decompression stress induced changes in blood coagulation which remained after 24 h and can be interpreted as a more procoagulant profile. This finding warrants further investigation into the underlying cause of this profile shift.

 ,
, 


