
Partial Contribution of Socioeconomic Factors to the Mortality Rate of the Working-Age Population in Russia

 , , , and
Abstract
:1. Introduction
2. Literature Review
3. Data and Methods
3.1. Data
3.2. Methods
- -
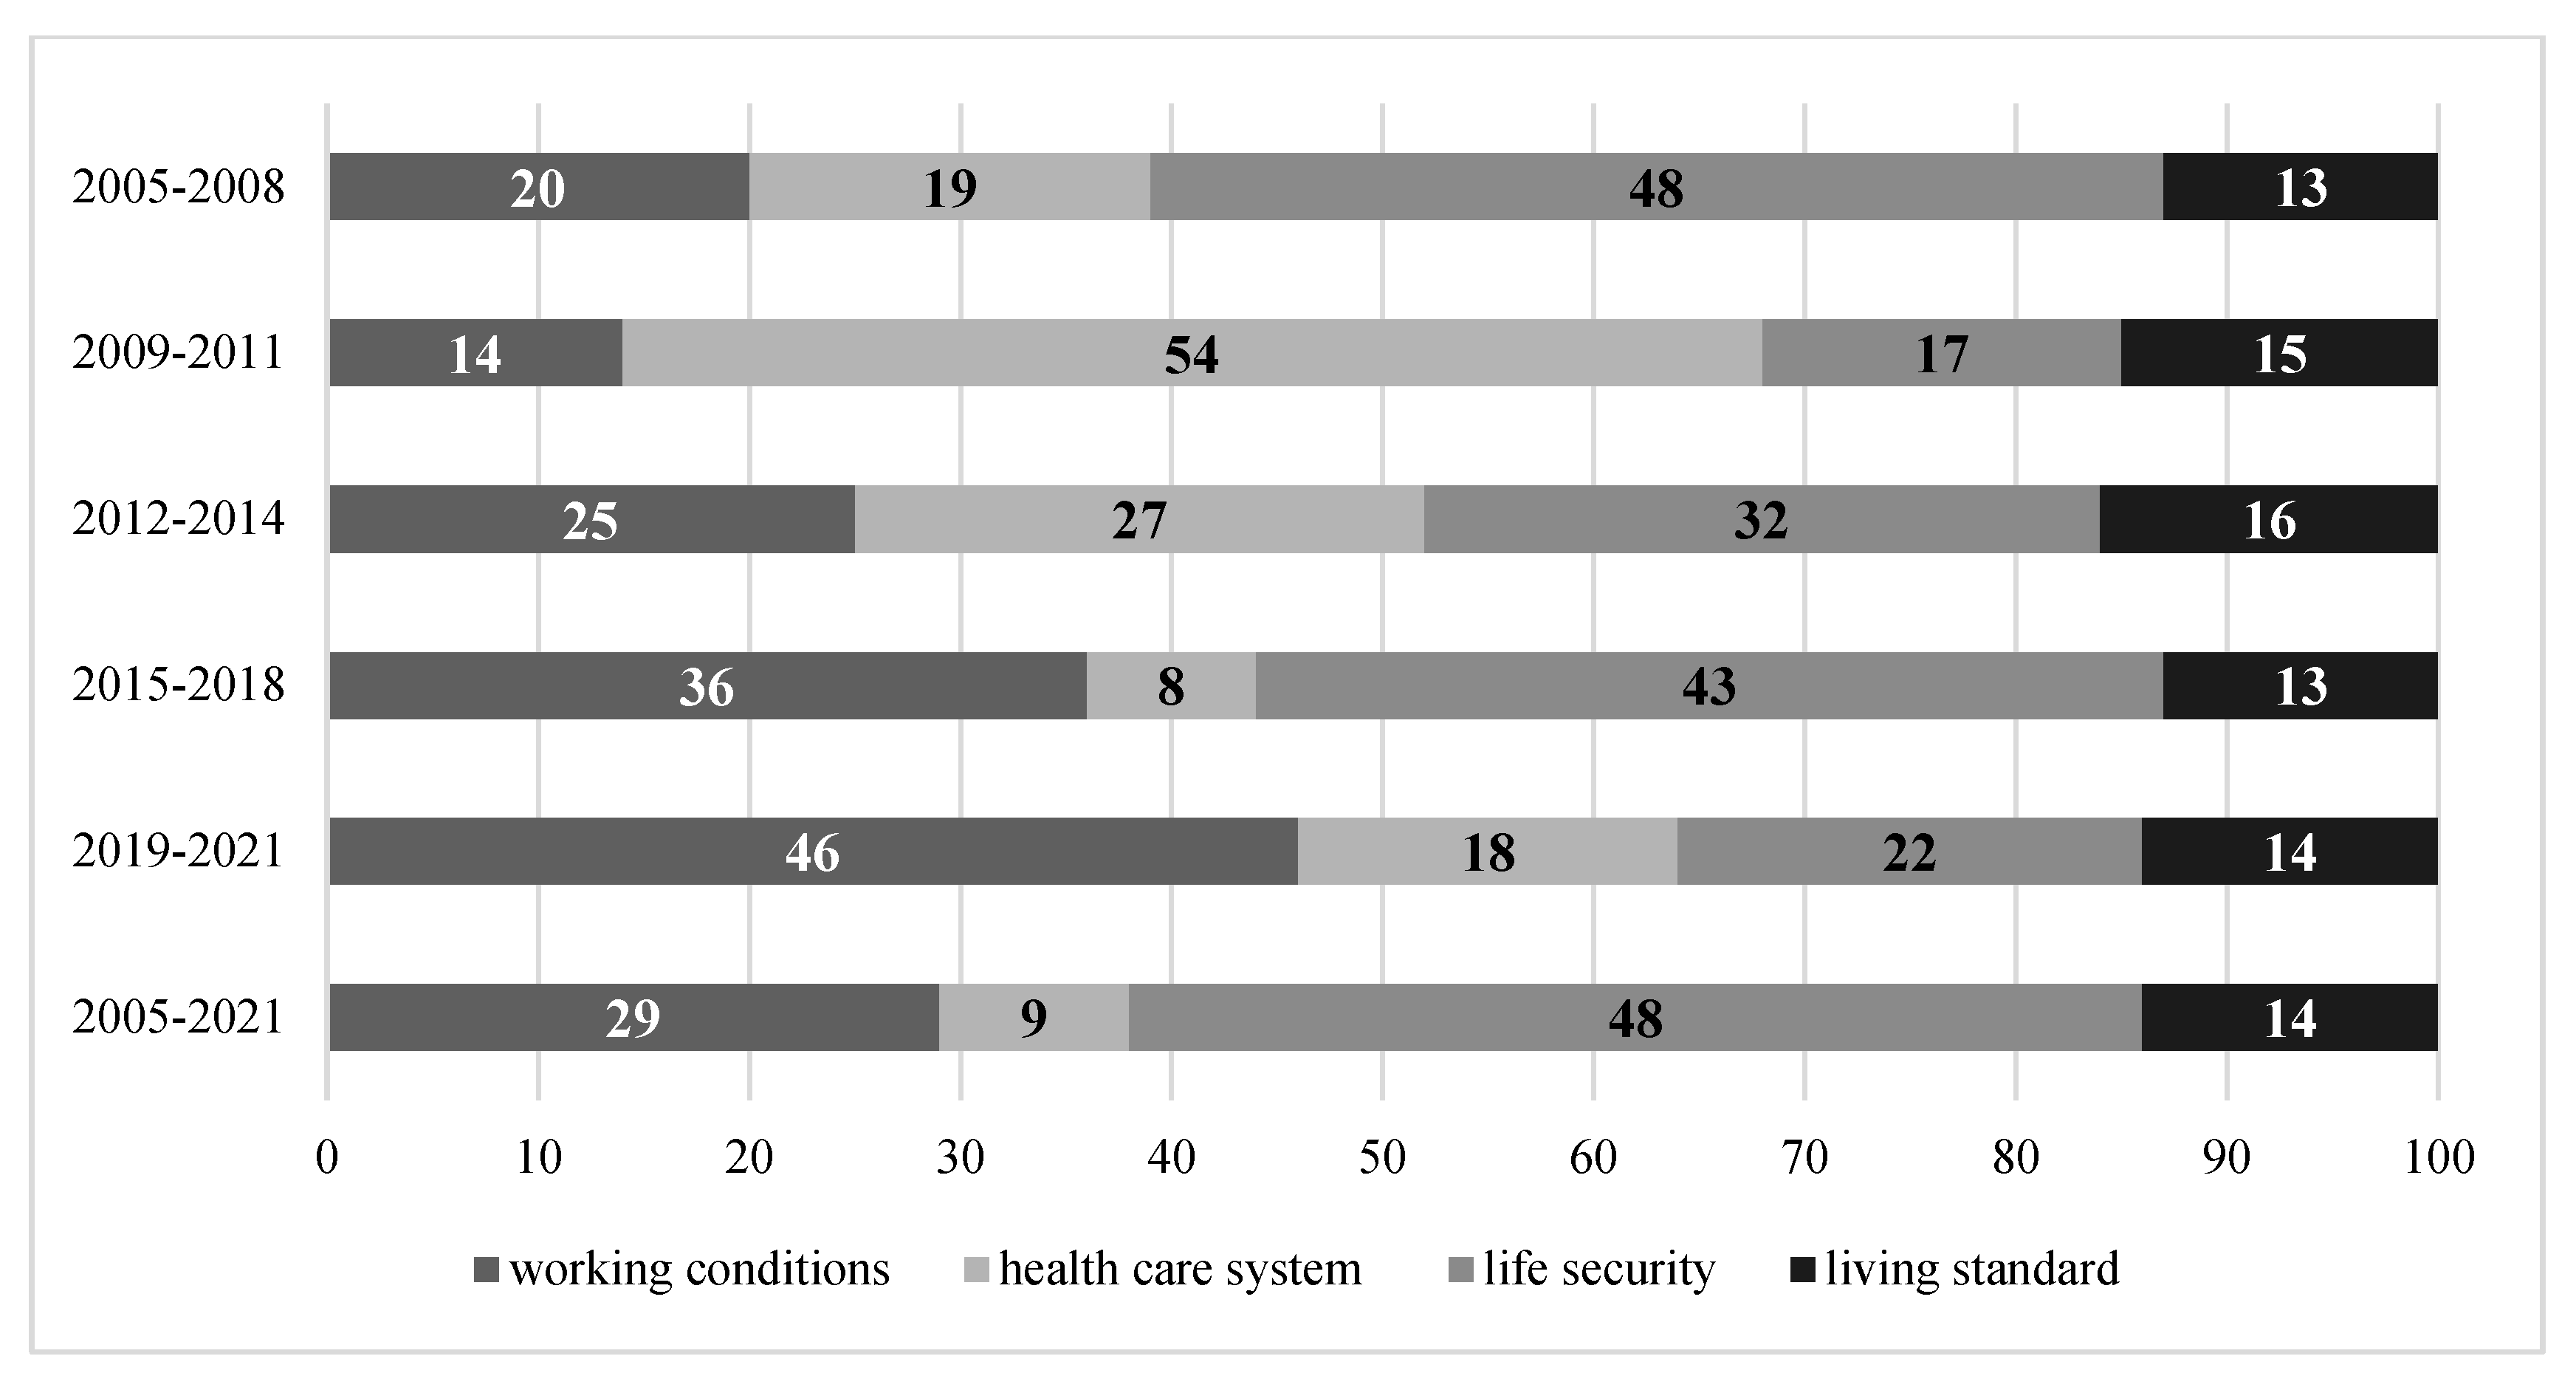
- 2005–2008: precrisis period (the end of 2008—global financial crisis);
- -
- 2009–2011: crisis (consequences of the global financial crisis);
- -
- 2012–2014: postcrisis (recovery period after the global financial crisis);
- -
- 2015–2018: sanctions period (after the annexation of the Crimea to Russia);
- -
- 2019–2021: period of increasing sanctions and the COVID-19 pandemic.
4. Results
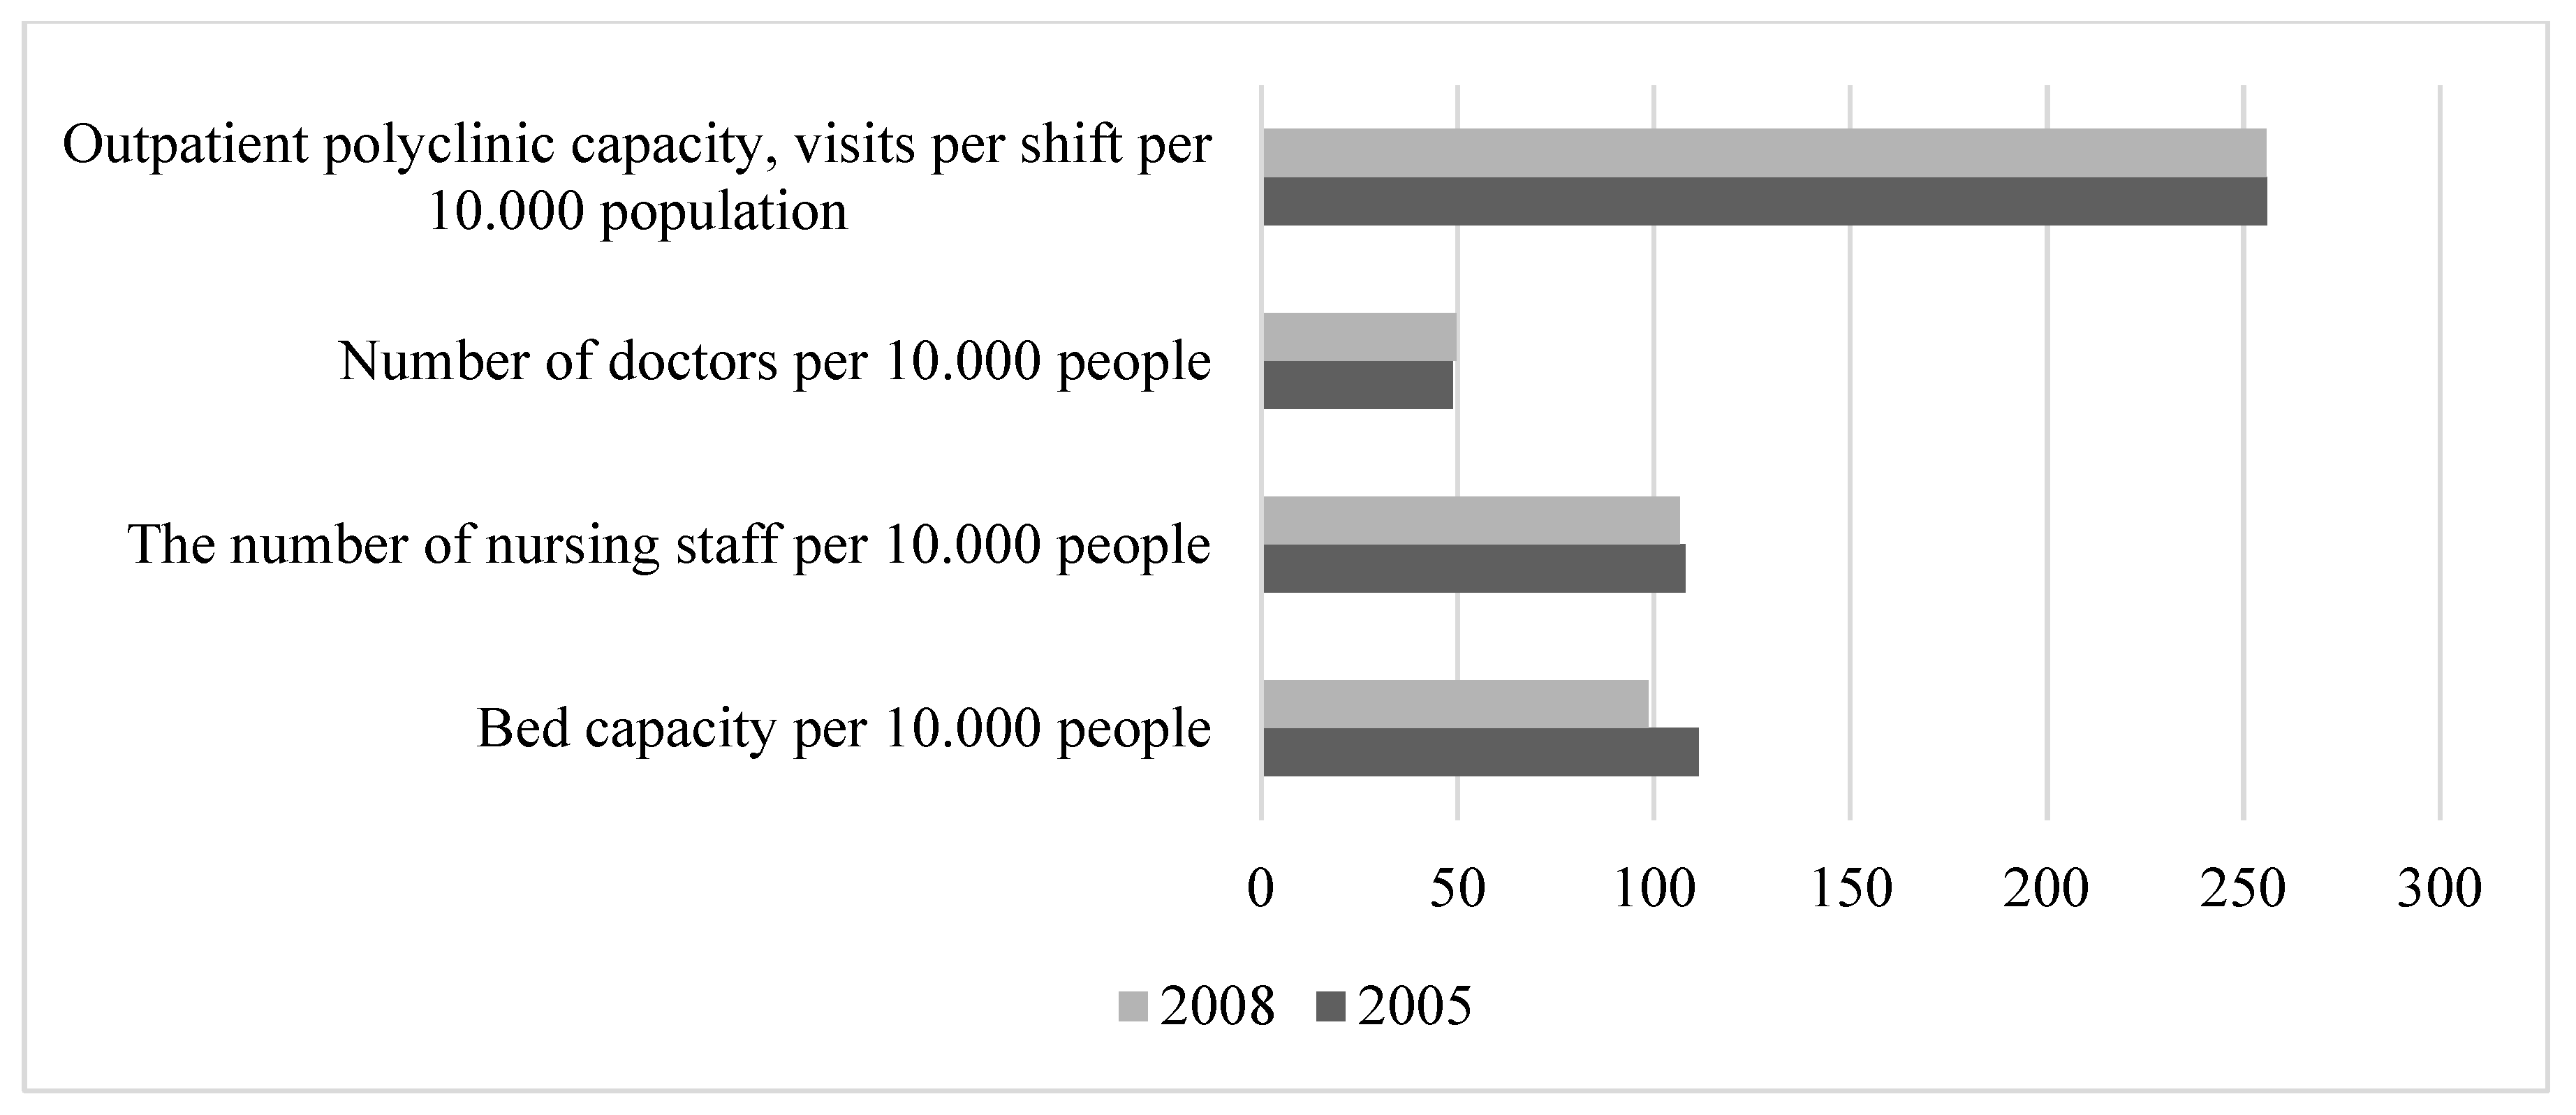
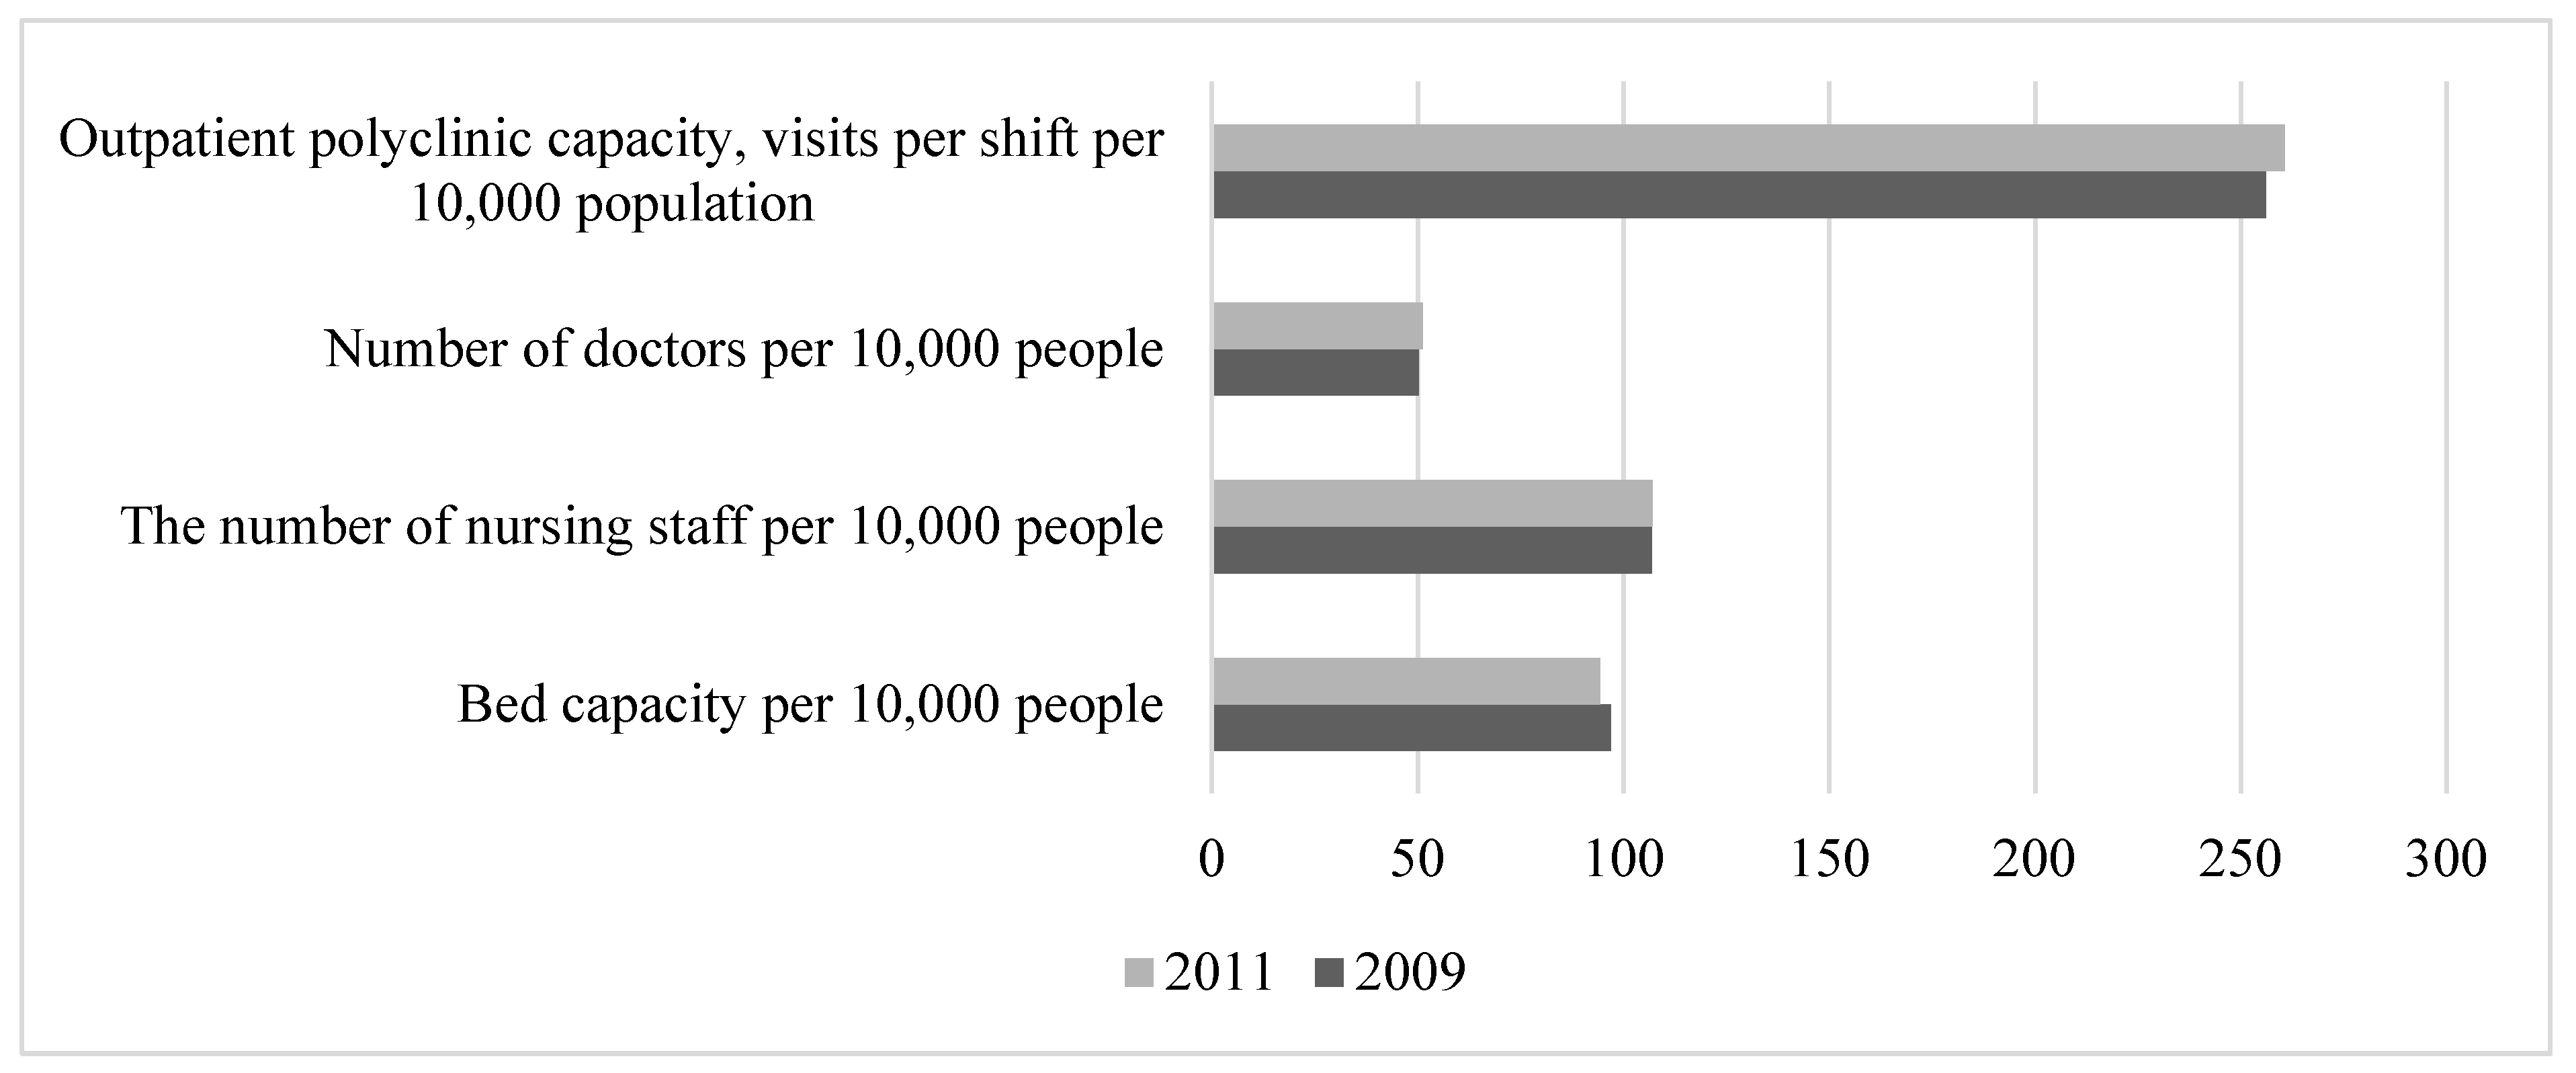
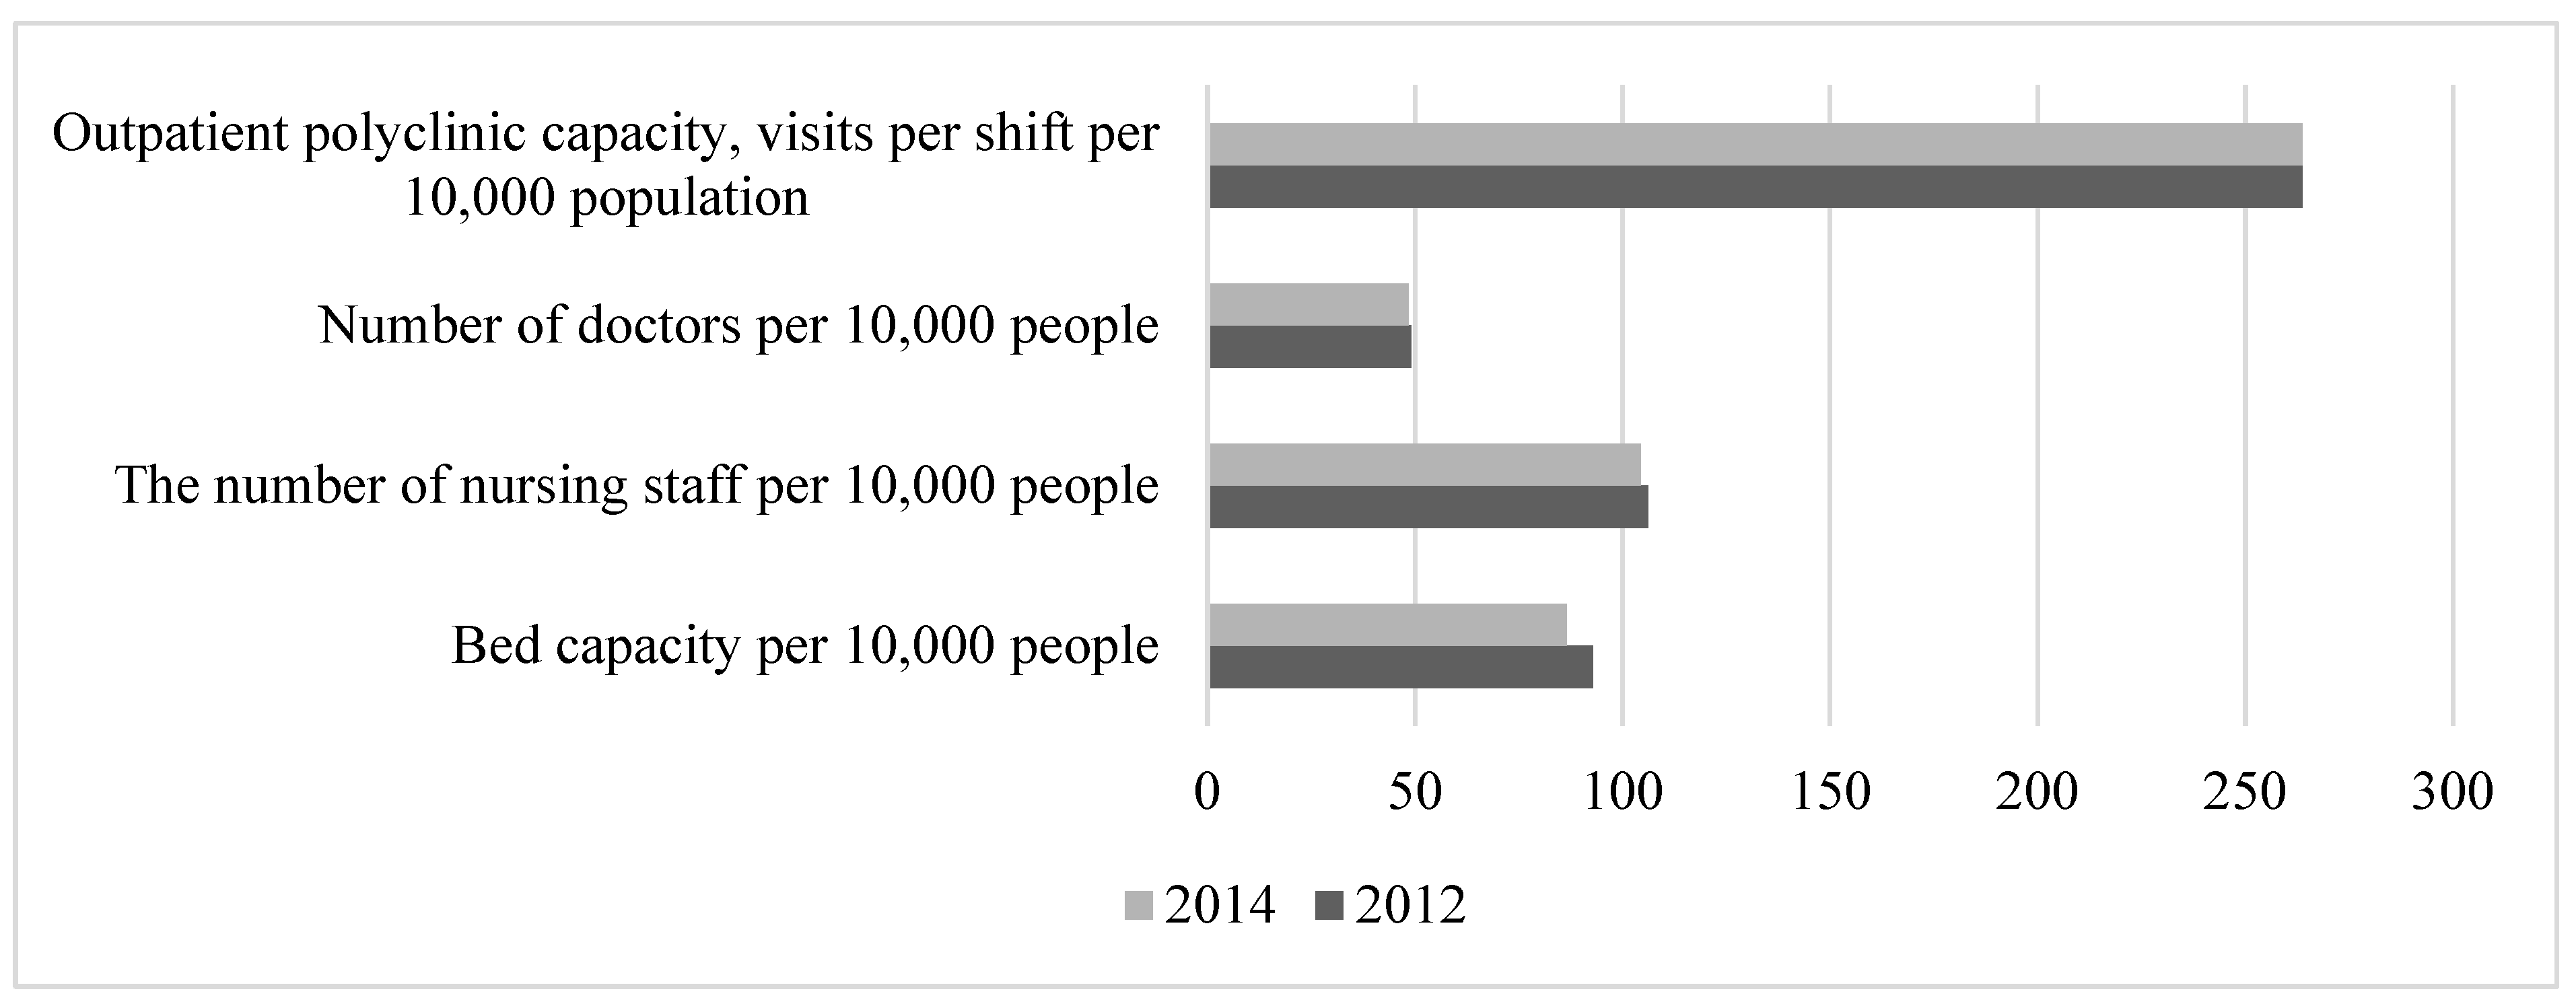
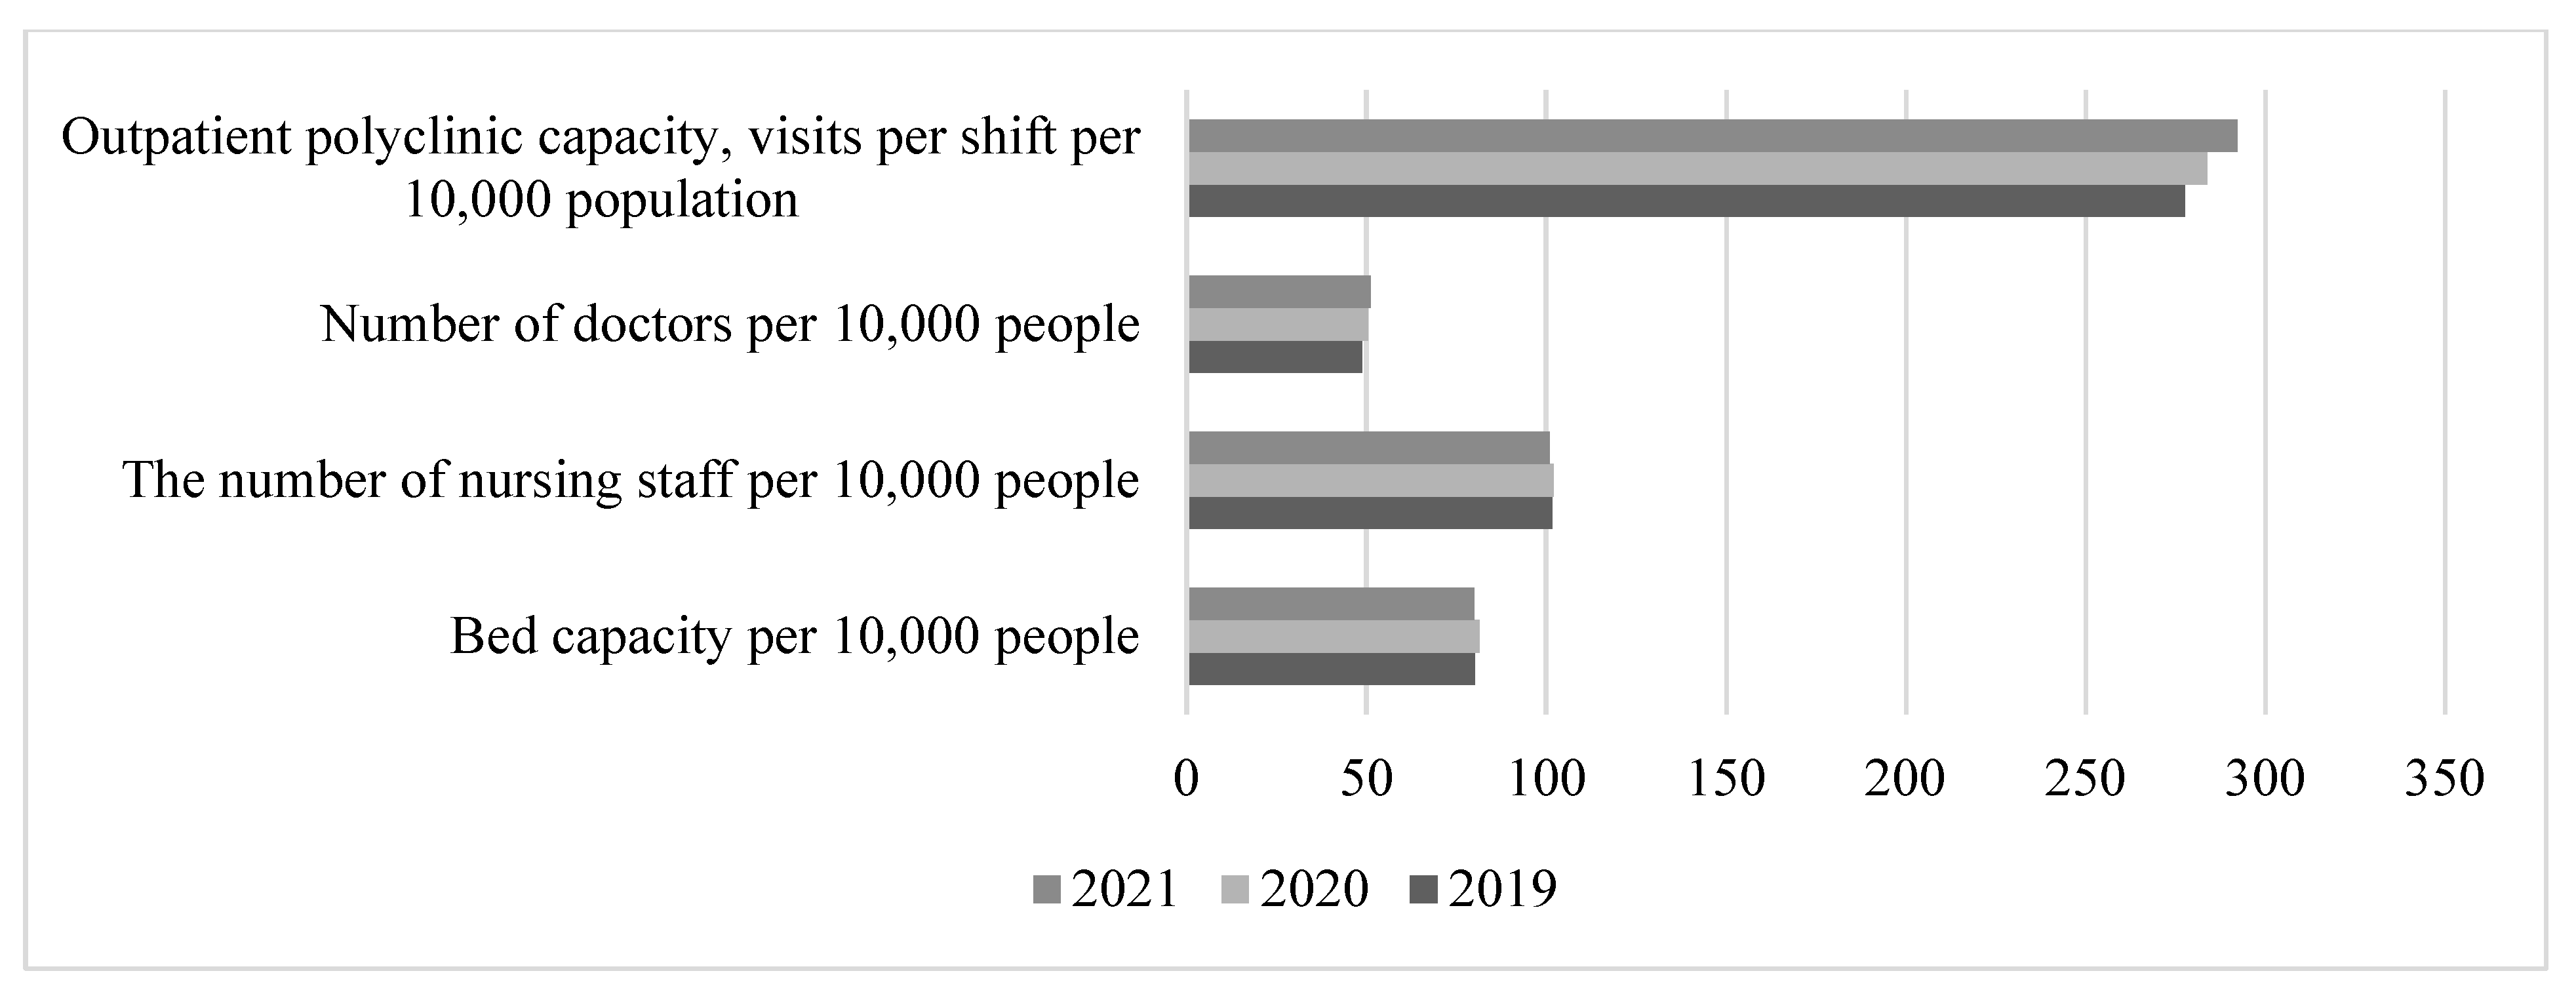
- The number of beds decreased from 111.0 per 10,000 people in 2005 to 79.8 in 2021, with more beds required after the COVID-19 pandemic, and the number of beds is continuing to decrease.
- The number of nursing staff decreased from 108.0 per 10,000 people in 2005 to 100.8 in 2021.
- The number of visits per 10,000 people in outpatient clinics increased from 256.0 in 2005 to 292.2 in 2021.
- There was a slight increase in the number of doctors, from 45.9 per 10,000 people in 2005 to 48.8 in 2021.
5. Conclusions
Author Contributions
Funding
Institutional Review Board Statement
Informed Consent Statement
Data Availability Statement
Conflicts of Interest
References
- Azer, I.; Mohamad, S.A.; Hashim, H.; Mansor, F.; Azudin, M.Z. Self-Esteem, Quality of Life and Financial Well-Being: A Review on Psychological Health Factors of Single Mothers. Malays. J. Soc. Sci. Humanit. 2022, 7, e001842. [Google Scholar] [CrossRef]
- Bonin-Guillaume, S.; Arlotto, S.; Blin, A.; Gentile, S. Family Caregiver’s Loneliness and Related Health Factors: What Can Be Changed? Int. J. Environ. Res. Public Health 2022, 19, 7050. [Google Scholar] [CrossRef]
- Duffner, L.; Deckers, K.; Cadar, D.; Steptoe, A.; de Vugt, M.; Köhler, S. Social health factors and dementia risk—assessing potential pathways in a population-based cohort study. Alzheimer’s Dement. J. Alzheimer’s Assoc. 2022, 18 (Suppl. S11), e065441. [Google Scholar] [CrossRef]
- Gao, F.; Zhou, L.; Gao, Y.; Zhang, Y.; Zuo, A.; Zhang, X. Effects of physical and mental health factors and family function on the self-perception of aging in the elderly of Chinese community. Brain Behav. 2022, 12, e2528. [Google Scholar] [CrossRef]
- Wang, D.; Gao, H.; Xu, X.; Han, D.; Yi, K.; Hou, G. Analysis of influence of physical health factors on subjective wellbeing of middle-aged and elderly women in China. BMC Public Health 2022, 22, 1127. [Google Scholar] [CrossRef]
- Spector, S.I.; Nifantova, R.V.; Bogdanov, S.I. Why do Urals people die: Economic-population aspect. Econ. Reg. 2006, 3, 47–55. [Google Scholar]
- Tapilina, V.S. Socio-economic differentiation and health of the Russian population. ECO 2002, 2, 114–125. [Google Scholar]
- Baevsky, R.M.; Berseneva, A.P. Assessment of the adaptive capabilities of the body and the risk of developing diseases. Medicine 1997, 26, 20–23. [Google Scholar]
- Zubov, A.A.; Kozlov, V.I. On the Complex Approach to the Study of the Phenomenon of Longevity; The Phenomenon of Longevity: Collected Works; Nauka: Moscow, Russia, 1982. [Google Scholar]
- Prokhorov, B.B. The dynamics of socioeconomic reform in Russia: Medico-demographic indices. Stud. Russ. Econ. Dev. 2006, 5, 124–138. [Google Scholar] [CrossRef]
- Firza, N.; Monaco, A. Forecasting Model Based on Lifestyle Risk and Health Factors to Predict COVID-19 Severity. Int. J. Environ. Res. Public Health 2022, 19, 12538. [Google Scholar] [CrossRef]
- Roberts, K.E.; Beckenkamp, P.R.; Ferreira, M.L.; Duncan, G.E.; Calais-Ferreira, L.; Gatt, J.M.; Ferreira, P. Positive lifestyle behaviours and emotional health factors are associated with low back pain resilience. Eur. Spine J. 2022, 31, 3616–3626. [Google Scholar] [CrossRef]
- Moore, S.; Satel, J.; Pontes, H.M. Investigating the Role of Health Factors and Psychological Well-Being in Gaming Disorder. Cyberpsychol. Behav. Soc. Netw. 2021, 25, 94–100. [Google Scholar] [CrossRef]
- Wilson, L.F.; Xu, Z.; Doust, J.; Mishra, G.D.; Dobson, A.J. Associations of socioeconomic and health factors with dental non-attendance: A comparison of three cohorts of women. Community Dent. Oral Epidemiol. 2022, 2022, 12776. [Google Scholar] [CrossRef]
- Østergaard, M.L.D.; Aponte-Canencio, D.M.; Barajas Ortiz, Y.; Velez Botero, H.J.; Simon Modvig, J.; Brasholt, M. Vulnerability factors in conflict-related mental health. Med. Confl. Surviv. 2023, 39, 63–80. [Google Scholar] [CrossRef]
- Camp, J.; Bernstein, L.; Patrick, J.H. Women’s Health: Paradoxical Health Disparities among Asian American Women. Innov. Aging 2022, 6 (Suppl. S1), 787–788. [Google Scholar] [CrossRef]
- Sana, S.; Kollmann, J.; Magnée, T.; Merkelbach, I.; Denktaş, S.; Kocken, P.L. The role of socio-demographic and health factors during COVID-19 in remote access to GP care in low-income neighbourhoods: A cross-sectional survey of GP patients. BMC Prim. Care 2022, 23, 289. [Google Scholar] [CrossRef]
- Sun, Z.; Hu, Y.; Yu, C.; Guo, Y.; Pang, Y.; Sun, D.; Pei, P.; Yang, L.; Chen, Y.; Du, H.; et al. Low-risk Lifestyle and Health Factors and Risk of Mortality and Vascular Complications in Chinese Patients with Diabetes. J. Clin. Endocrinol. Metab. 2022, 107, e3919–e3928. [Google Scholar] [CrossRef]
- Petrova, G.; Merdzhanova, E.; Lalova, V.; Angelova, P.; Raycheva, R.; Boyadjiev, N. Study of the nutritional behavior as a risky health factor of adolescents from different ethnic groups in the municipality of Plovdiv, Bulgaria. J. IMAB—Annu. Proc. (Sci. Pap.) 2022, 28, 4456–4460. [Google Scholar] [CrossRef]
- Tong, S.; Zhu, Y.; Li, Z. Correlation Study between Rural Human Settlement Health Factors: A Case Study of Xiangxi, China. Comput. Intell. Neurosci. 2022, 2022, 2484850. [Google Scholar] [CrossRef]
- Kwak, T.-J.; Kim, E.-H. The relationship between physical activity changes and mental health factors in adolescents due to COVID-19. Korean J. Sport. Sci. 2022, 31, 911–921. [Google Scholar] [CrossRef]
- Sun, S.; Butte, A.; Sushil, M. Modeling on Social Work Notes for Exploring Social Determinants of Health Factors. Value Health 2022, 25, S613–S614. [Google Scholar] [CrossRef]
- Olisarova, V.; Kaas, J.; Staskova, V.; Bartlova, S.; Papp, K.; Nagorska, M.; Korucova, R.; Reifsnider, E. Health literacy and behavioral health factors in adults. Public Health 2021, 190, 75–81. [Google Scholar] [CrossRef] [PubMed]
- Baljepally, V.S.; Metheny, W. Rural-urban disparities in baseline health factors and procedure outcomes. J. Natl. Med. Assoc. 2022, 114, 227–231. [Google Scholar] [CrossRef] [PubMed]
- Schmits, E.; Glowacz, F. Changes in Alcohol Use During the COVID-19 Pandemic: Impact of the Lockdown Conditions and Mental Health Factors. Int. J. Ment. Health Addict. 2022, 20, 1–12. [Google Scholar] [CrossRef]
- Schultz-Knudsen, M.; Janbek, J. The role of religion in health promotion: How the Danish health authorities use arguments from Islam. Tidsskr. Islam. 2023, 16, 106–135. [Google Scholar] [CrossRef]
- Rademaker, M.M.; Stegeman, I.; Brabers, A.E.; de Jong, J.D.; Stokroos, R.J.; Smit, A.L. Associations between Demographics, Tinnitus Specific-, Audiological-, General- and Mental Health Factors, and the Impact of Tinnitus on Daily Life. J. Clin. Med. 2022, 11, 4590. [Google Scholar] [CrossRef]
- Bright, S.J.; Hübel, C.; Young, K.S.; Bristow, S.; Peel, A.J.; Rayner, C.; Mundy, J.; Mundy, A.B.; Purves, K.L.; Kalsi, G.; et al. Sociodemographic, Mental Health, and Physical Health Factors Associated with Participation within Re-Contactable Mental Health Cohorts: An Investigation of the GLAD Study; Research Square: Durham, NC, USA, 2022. [Google Scholar] [CrossRef]
- Dayyab, F.; Iliyasu, G.; Habib, M.A.; Habib, A.G. Ecological Study of the Association between Coronavirus Disease 2019 Pandemic with Socioeconomic, Geographic, and Public Health Factors. J. Niger. Infect. Dis. Soc. 2022, 1, 19–22. [Google Scholar] [CrossRef]
- Anam, S.; Shar, N.A. Effect of environmental, economic and health factors on COVID-19 transmission. Bioinformation 2022, 17, 37–45. [Google Scholar] [CrossRef]
- Gao, G.; Hu, J.; Wang, Y.; Wang, G. Regional Inequalities and Influencing Factors of Residents’ Health in China: Analysis from the Perspective of Opening-Up. Int. J. Environ. Res. Public Health 2022, 19, 12069. [Google Scholar] [CrossRef]
- Odaba, S.; Hartarska, V. Farmer Suicides: Effects of Socio-Economic, Climate, and Mental Health Factors. J. Ment. Health Policy Econ. 2021, 24, 61–71. [Google Scholar]
- Nurhayati, A.; Purnama, L.B.; Pujiono, P.; Aripin, S. Structural Equation Modeling using Partial Least Squares for Occupational Safety and Health Factors and Work Environment Factors Toward Occupational Diseases on Labors in Industry X Cimahi City. Maced. J. Med. Sci. 2022, 10, 1779–1783. [Google Scholar] [CrossRef]
- Orlova, E. Labour productivity management using health factors: Technique and models. Upravlenets 2020, 11, 57–69. [Google Scholar] [CrossRef]
- Jakovljevic, M.; Sugahara, T.; Timofeyev, Y.; Rancic, N. Predictors of (in)efficiencies of Healthcare Expenditure Among the Leading Asian Economies—Comparison of OECD and Non-OECD Nations. Risk Manag. Healthc. Policy 2020, 13, 2261–2280. [Google Scholar] [CrossRef]
- Ranabhat, C.L.; Jakovljevic, M.; Dhimal Mand Kim, C.-B. Structural Factors Responsible for Universal Health Coverage in Low- and Middle-Income Countries: Results from 118 Countries. Front. Public Health 2020, 7, 414. [Google Scholar] [CrossRef]
- Kozlova, O.A.; Trushkova, E.A.; Makarova, M.N. Assessment of the interconnection between availability of healthcare resources and population’s life duration: Regional aspect. Probl. Territ. Dev. 2020, 3, 116–127. [Google Scholar] [CrossRef]
- Makarova, M.N.; Trushkova, E.A. Comparative analysis of environmental factors in the formation of public health in the regions of Russia. Corp. Gov. Innov. Econ. Dev. North 2019, 4, 146–156. [Google Scholar] [CrossRef]
- Kozlova, O.A.; Nifantova, R.V.; Makarova, M.N. Methods of the assessment of economic losses caused by the mortality of the population employed in regional economy. Econ. Reg. 2017, 13, 511–523. [Google Scholar] [CrossRef]
- Ivanov, V.; Suvorov, A. Modern Development Problems of Russian Health Care (Part 1). Stud. Russ. Econ. Dev. 2021, 6, 59–70. [Google Scholar] [CrossRef]


| Index | Correlation Coefficient | Index | Correlation Coefficient |
|---|---|---|---|
| Number of reported crimes per 100,000 people | 0.614 | Budget expenditure per capita, thousand RUB | 0.216 |
| Number of hospital beds per 10,000 people | 0.599 | Number of private cars per 1000 people, units | 0.133 |
| Outpatient polyclinic capacity, visits per shift per 10,000 people | 0.544 | Ratio of average monthly wage to subsistence minimum, times | 0.079 |
| Share of workers in hazardous and dangerous jobs (by category of hazard), % of total economic employment | 0.432 | Share of budget expenditure on social assistance, % | 0.060 |
| Nursing staff availability per 10,000 people | 0.409 | Total unemployment rate, % | −0.390 |
| Share of household expenditure on alcoholic beverages, % | 0.389 | Density of paved public roads, km of track per 10,000 km2 of territory | −0.419 |
| Total illness rate per 1000 people | 0.338 | Share of employed population with higher education, % | −0.449 |
| Share of industry in the GVA of Russian regions, % | 0.291 |
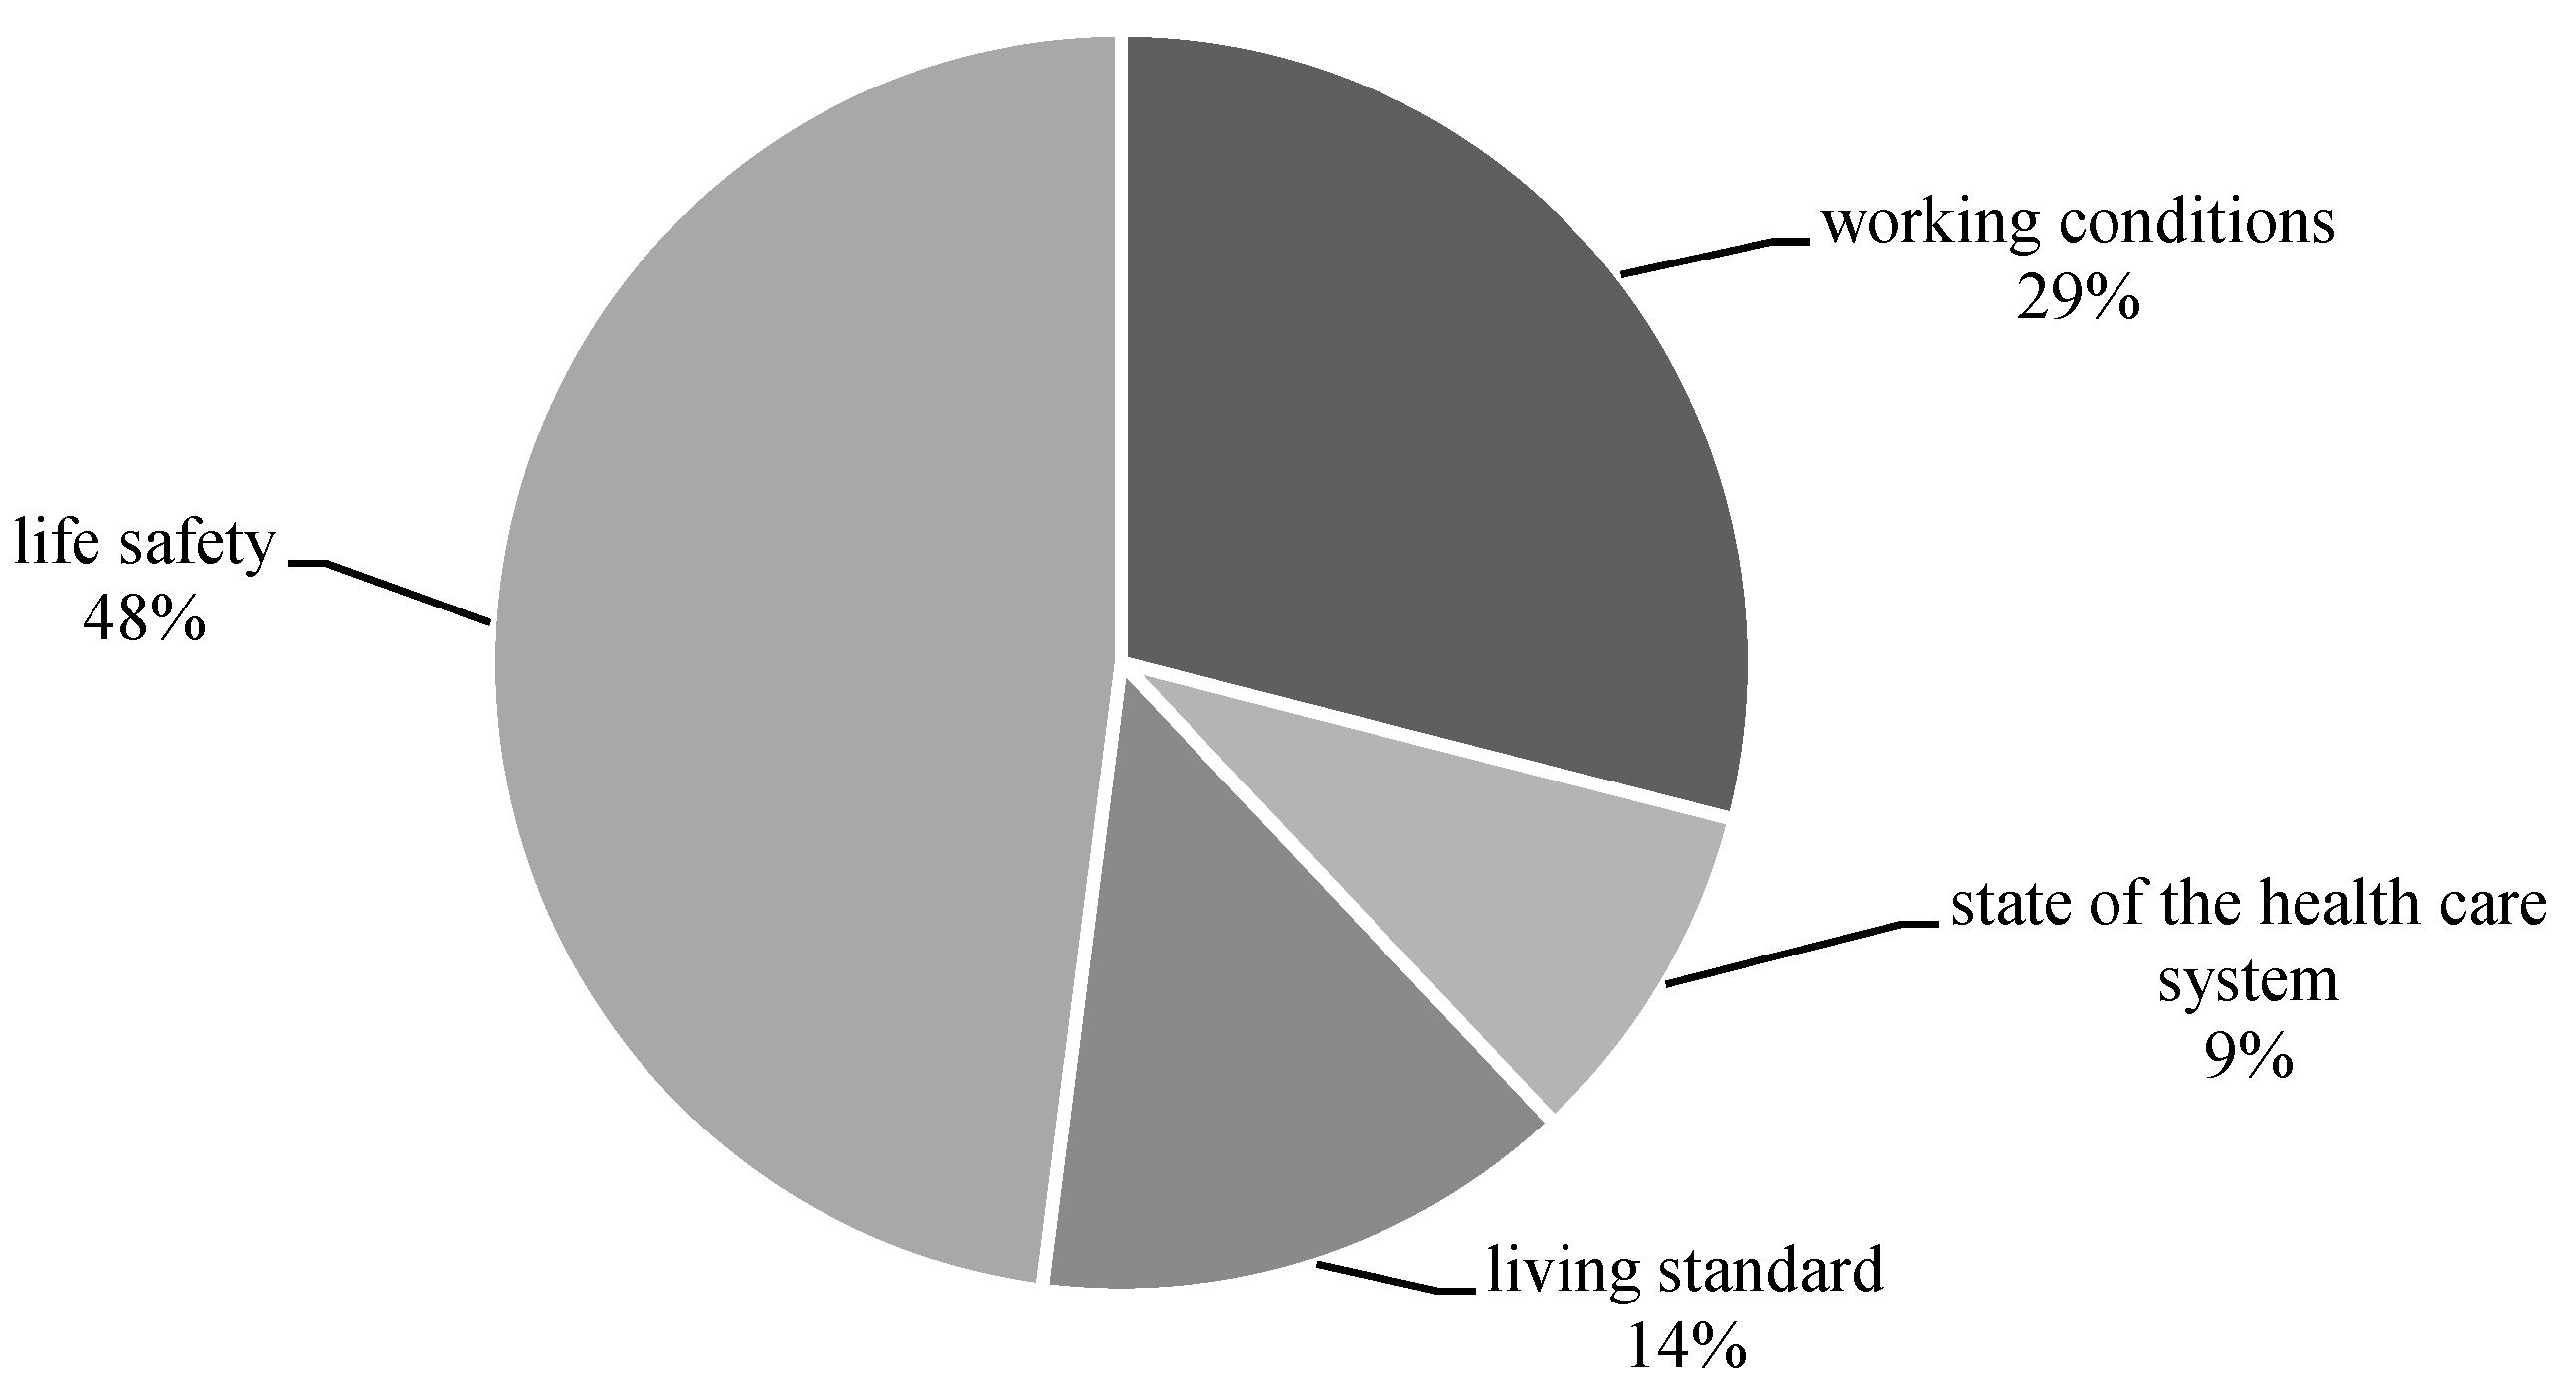
| Factor Block | Indices |
|---|---|
| Working conditions |
|
| State of the healthcare system |
|
| Life safety |
|
| Living standards |
|
Disclaimer/Publisher’s Note: The statements, opinions and data contained in all publications are solely those of the individual author(s) and contributor(s) and not of MDPI and/or the editor(s). MDPI and/or the editor(s) disclaim responsibility for any injury to people or property resulting from any ideas, methods, instructions or products referred to in the content. |
© 2023 by the authors. Licensee MDPI, Basel, Switzerland. This article is an open access article distributed under the terms and conditions of the Creative Commons Attribution (CC BY) license (https://creativecommons.org/licenses/by/4.0/).
Share and Cite
Jakovljevic, M.; Kozlova, O.; Makarova, M.; Neklyudova, N.; Pyshmintseva, O. Partial Contribution of Socioeconomic Factors to the Mortality Rate of the Working-Age Population in Russia. Healthcare 2023, 11, 1507. https://doi.org/10.3390/healthcare11101507
Jakovljevic M, Kozlova O, Makarova M, Neklyudova N, Pyshmintseva O. Partial Contribution of Socioeconomic Factors to the Mortality Rate of the Working-Age Population in Russia. Healthcare. 2023; 11(10):1507. https://doi.org/10.3390/healthcare11101507
Chicago/Turabian StyleJakovljevic, Mihajlo, Olga Kozlova, Maria Makarova, Natalia Neklyudova, and Olga Pyshmintseva. 2023. "Partial Contribution of Socioeconomic Factors to the Mortality Rate of the Working-Age Population in Russia" Healthcare 11, no. 10: 1507. https://doi.org/10.3390/healthcare11101507