
Parkinson’s Disease and Diabetes Mellitus: Individual and Combined Effects on Motor, Cognitive, and Psychosocial Functions

Abstract
:1. Introduction
2. Methods
2.1. Study
2.2. Participants
2.3. Measures Overview
2.4. PD Severity
2.5. Motor Function
2.6. Motor–Cognitive Function
2.7. Cognitive Function
2.8. Psychosocial Function
2.9. Statistics
3. Results
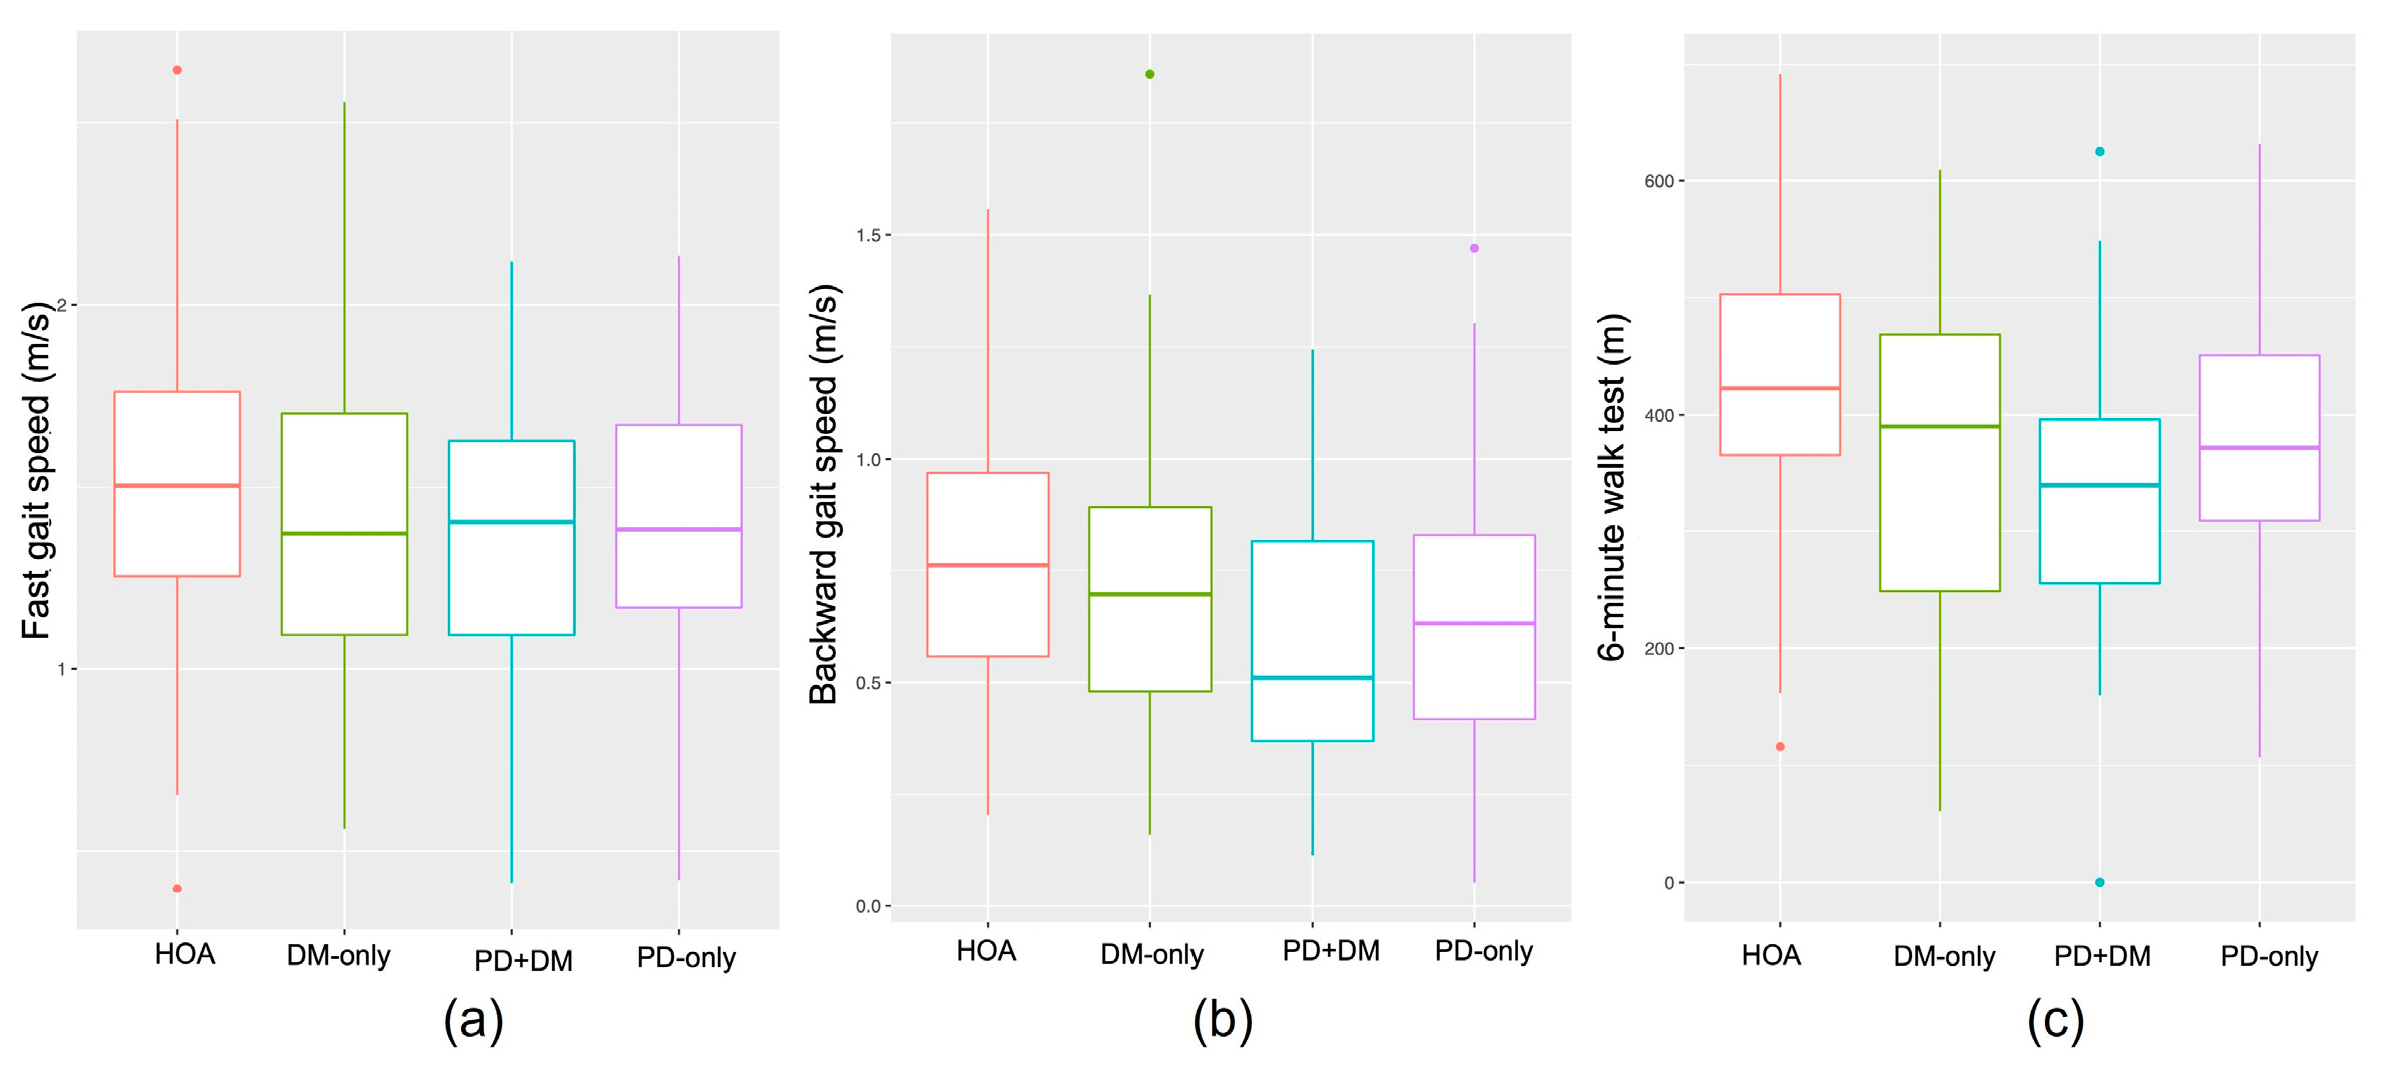
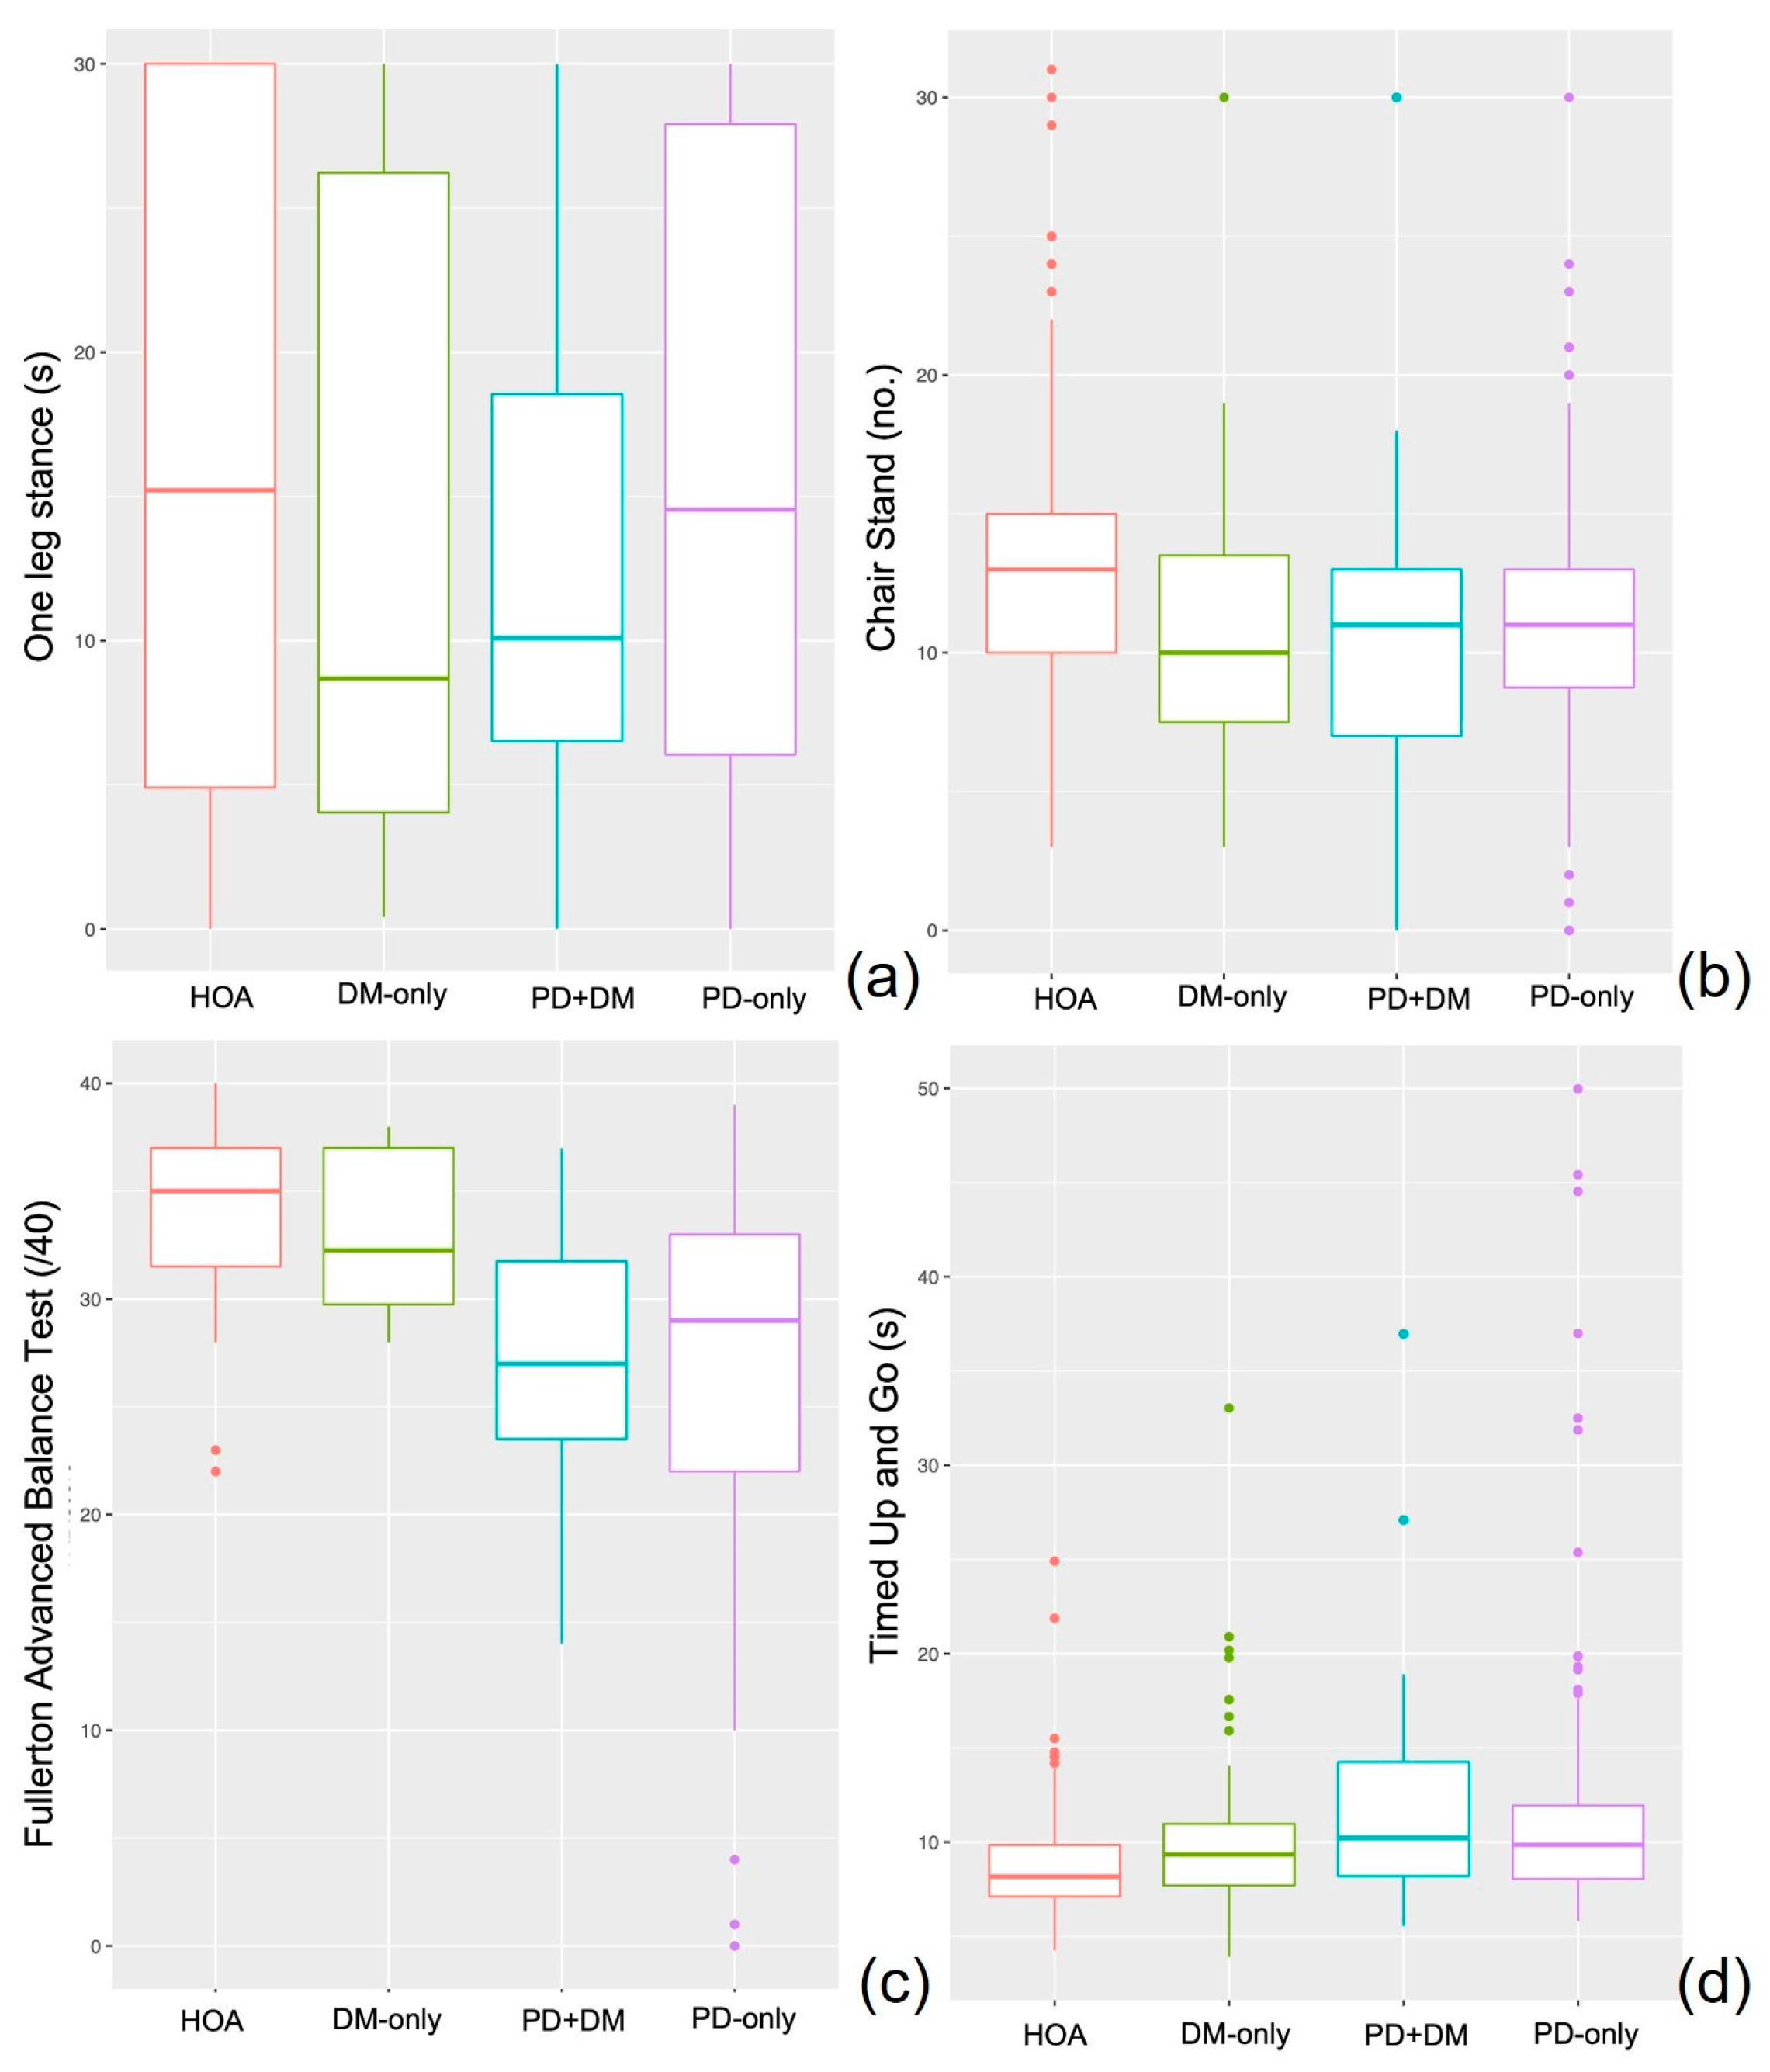
3.1. Motor Assessments
3.2. Motor–Cognitive Assessments
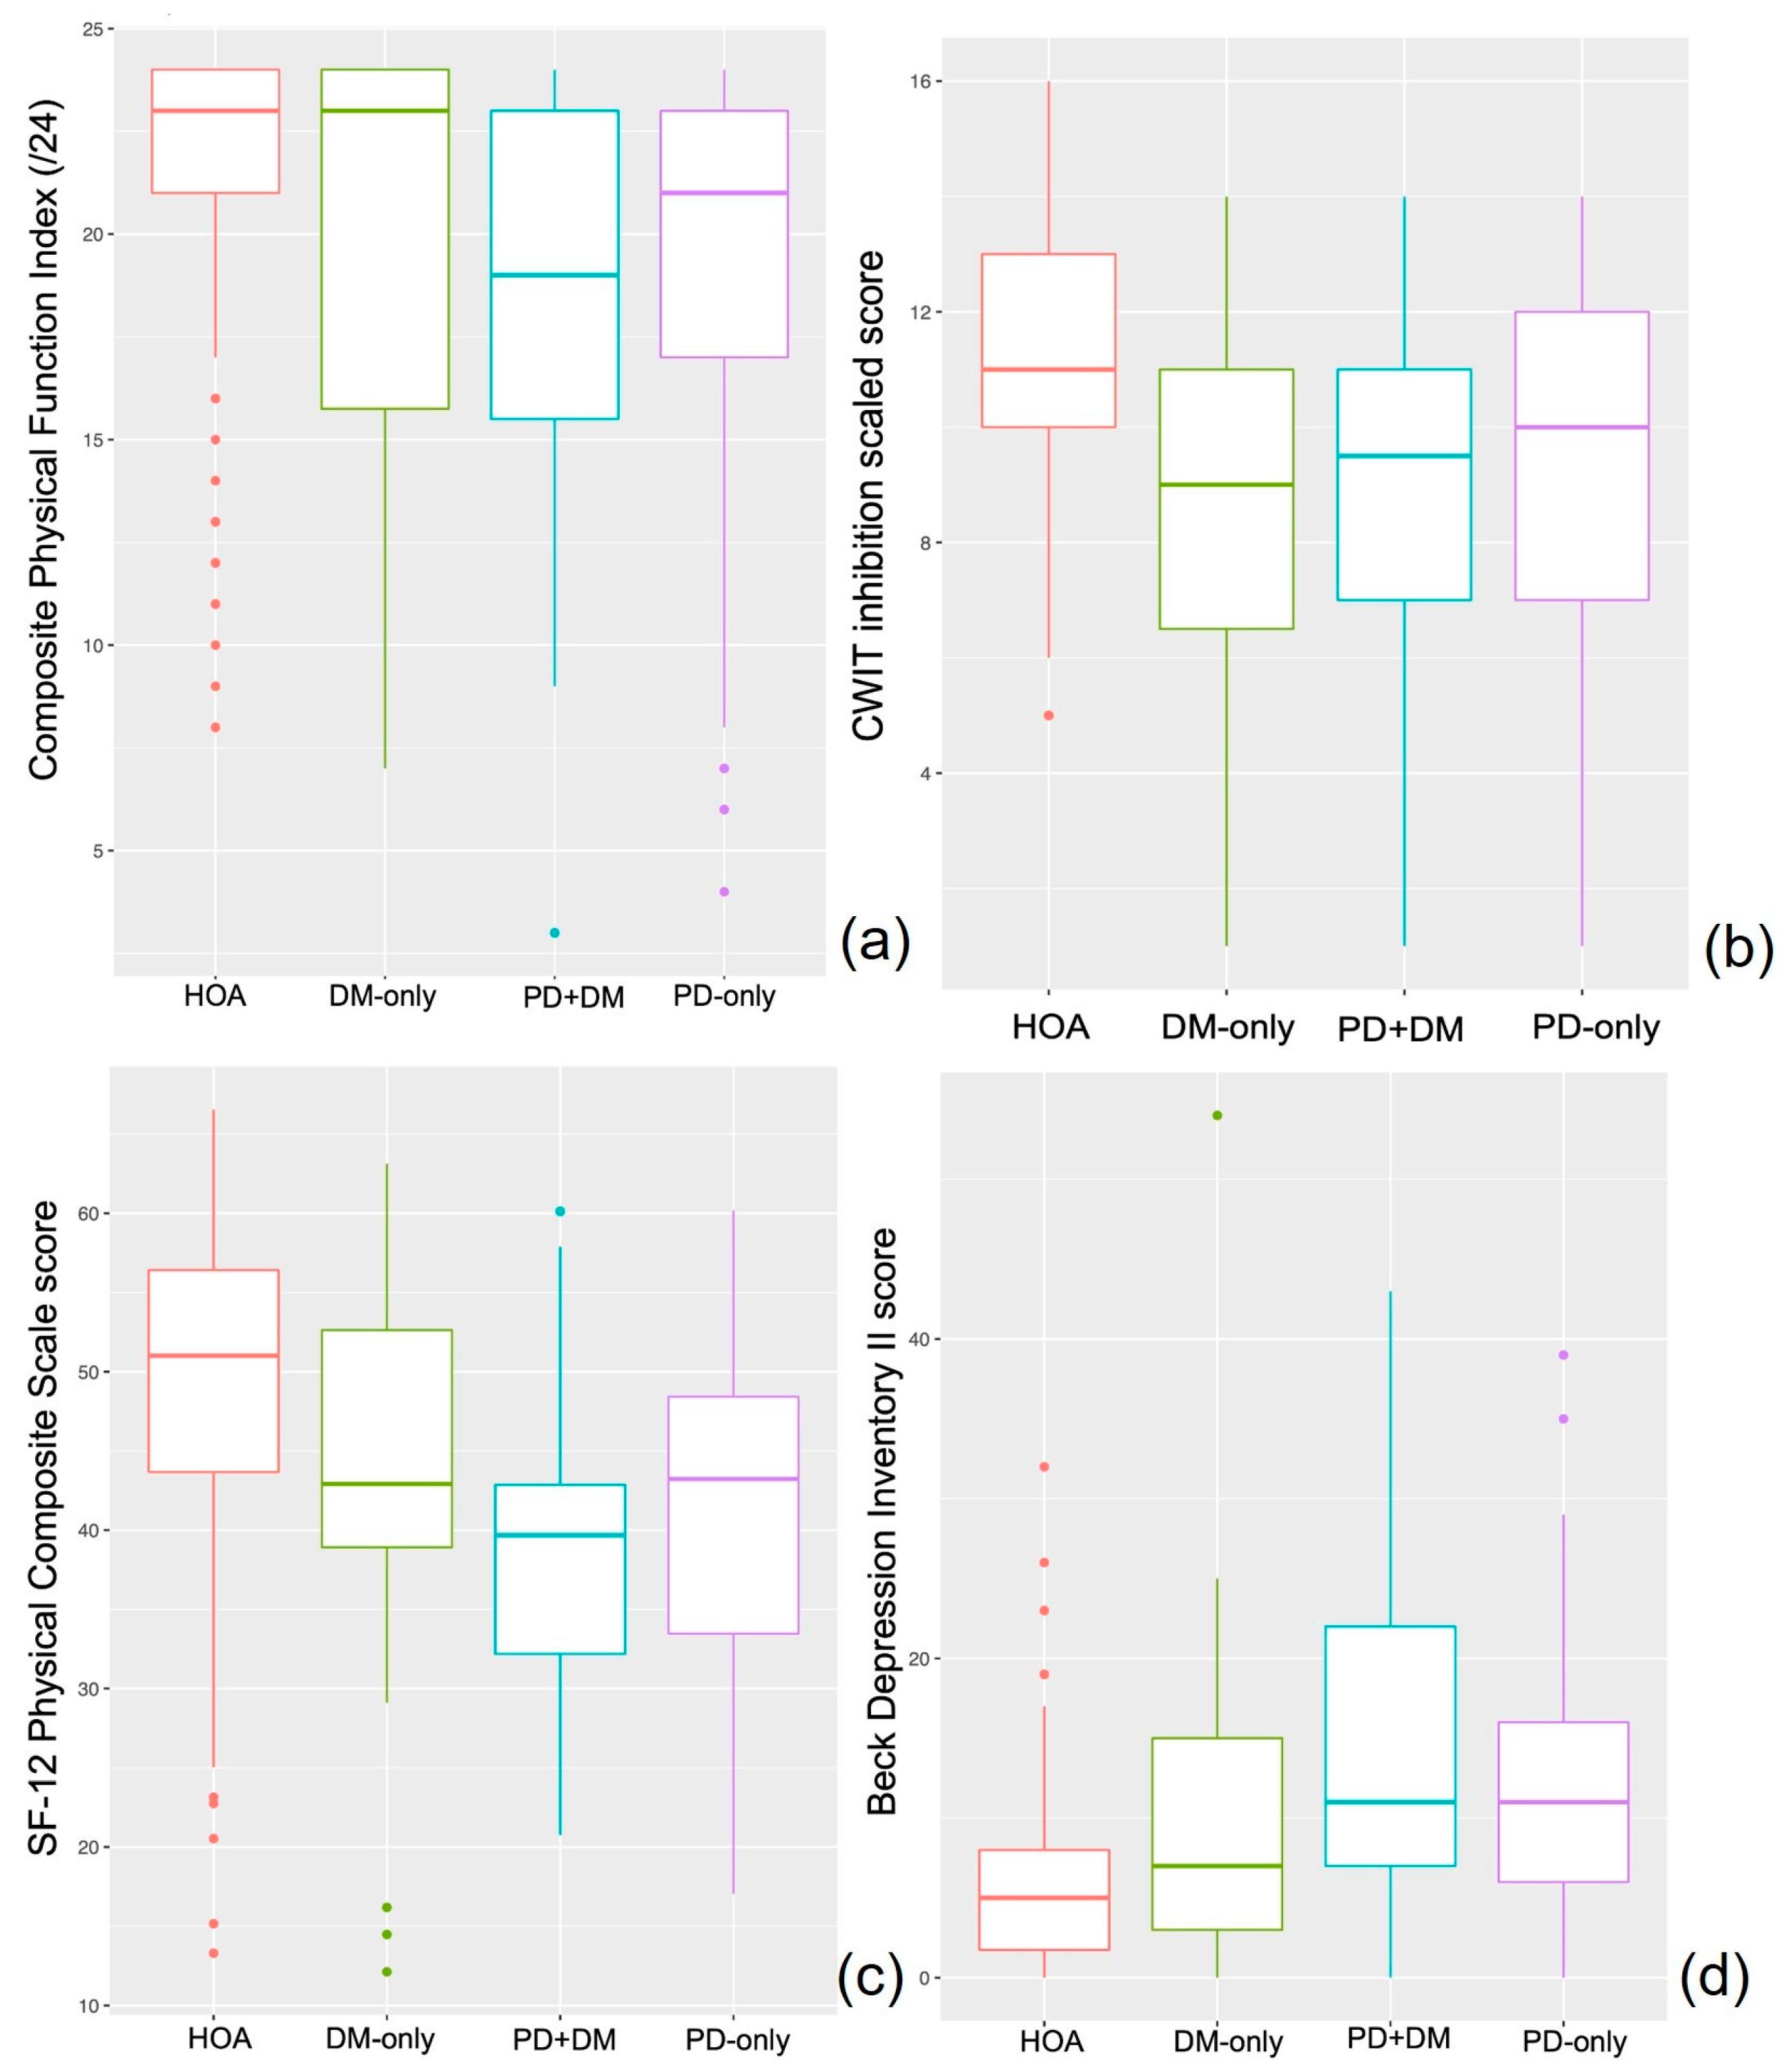
3.3. Cognitive Assessments
3.4. Psychosocial Assessments
3.5. Clinical Outcome Measures: Falls
3.6. Supplemental Analysis of Medication Status
4. Discussion
5. Limitations
6. Conclusions
Supplementary Materials
Author Contributions
Funding
Institutional Review Board Statement
Informed Consent Statement
Data Availability Statement
Acknowledgments
Conflicts of Interest
References
- Santiago, J.A.; Potashkin, J.A. Shared dysregulated pathways lead to Parkinson’s disease and diabetes. Trends Mol. Med. 2013, 19, 176–186. [Google Scholar] [CrossRef] [PubMed]
- Hu, G.; Jousilahti, P.; Bidel, S.; Antikainen, R.; Tuomilehto, J. Type 2 diabetes and the risk of Parkinson’s disease. Diabetes Care 2007, 30, 842–847. [Google Scholar] [CrossRef] [PubMed]
- Yu, H.; Sun, T.; He, X.; Wang, Z.; Zhao, K.; An, J.; Wen, L.; Li, J.Y.; Li, W.; Feng, J. Association between Parkinson’s Disease and Diabetes Mellitus: From Epidemiology, Pathophysiology and Prevention to Treatment. Aging Dis. 2022, 13, 1591–1605. [Google Scholar] [CrossRef] [PubMed]
- Liu, W.; Tang, J. Association between diabetes mellitus and risk of Parkinson’s disease: A prisma-compliant meta-analysis. Brain Behav. 2021, 11, e02082. [Google Scholar] [CrossRef]
- de Pablo-Fernández, E.; Courtney, R.; Rockliffe, A.; Gentleman, S.; Holton, J.L.; Warner, T.T. Faster disease progression in Parkinson’s disease with type 2 diabetes is not associated with increased α-synuclein, tau, amyloid-β or vascular pathology. Neuropathol. Appl. Neurobiol. 2021, 47, 1080–1091. [Google Scholar] [CrossRef]
- Athauda, D.; Evans, J.; Wernick, A.; Virdi, G.; Choi, M.L.; Lawton, M.; Vijiaratnam, N.; Girges, C.; Ben-Shlomo, Y.; Ismail, K.; et al. The Impact of Type 2 Diabetes in Parkinson’s Disease. Mov. Disord. 2022, 37, 1612–1623. [Google Scholar] [CrossRef] [PubMed]
- Aarsland, D.; Bronnick, K.; Fladby, T. Mild cognitive impairment in Parkinson’s disease. Curr. Neurol. Neurosci. Rep. 2011, 11, 371–378. [Google Scholar] [CrossRef]
- Salazar, R.D.; Ren, X.; Ellis, T.D.; Toraif, N.; Barthelemy, O.J.; Neargarder, S.; Cronin-Golomb, A. Dual tasking in Parkinson’s disease: Cognitive consequences while walking. Neuropsychology 2017, 31, 613–623. [Google Scholar] [CrossRef]
- Allet, L.; Armand, S.; Golay, A.; Monnin, D.; de Bie, R.A.; de Bruin, E.D. Gait characteristics of diabetic patients: A systematic review. Diabetes Metab. Res. Rev. 2008, 24, 173–191. [Google Scholar] [CrossRef]
- Gudala, K.; Bansal, D.; Schifano, F.; Bhansali, A. Diabetes mellitus and risk of dementia: A meta-analysis of prospective observational studies. J. Diabetes Investig. 2013, 4, 640–650. [Google Scholar] [CrossRef]
- Paul, L.; Ellis, B.M.; Leese, G.P.; McFadyen, A.K.; McMurray, B. The effect of a cognitive or motor task on gait parameters of diabetic patients, with and without neuropathy. Diabet. Med. 2009, 26, 234–239. [Google Scholar] [CrossRef] [PubMed]
- Hassan, A.; Sharma Kandel, R.; Mishra, R.; Gautam, J.; Alaref, A.; Jahan, N. Diabetes Mellitus and Parkinson’s Disease: Shared Pathophysiological Links and Possible Therapeutic Implications. Cureus 2020, 12, e9853. [Google Scholar] [CrossRef] [PubMed]
- Cereda, E.; Barichella, M.; Cassani, E.; Caccialanza, R.; Pezzoli, G. Clinical features of Parkinson disease when onset of diabetes came first: A case-control study. Neurology 2012, 78, 1507–1511. [Google Scholar] [CrossRef] [PubMed]
- Bohnen, N.I.; Kotagal, V.; Muller, M.L.; Koeppe, R.A.; Scott, P.J.; Albin, R.L.; Frey, K.A.; Petrou, M. Diabetes mellitus is independently associated with more severe cognitive impairment in Parkinson disease. Park. Relat. Disord. 2014, 20, 1394–1398. [Google Scholar] [CrossRef] [PubMed]
- Ong, M.; Foo, H.; Chander, R.J.; Wen, M.C.; Au, W.L.; Sitoh, Y.Y.; Tan, L.; Kandiah, N. Influence of diabetes mellitus on longitudinal atrophy and cognition in Parkinson’s disease. J. Neurol. Sci. 2017, 377, 122–126. [Google Scholar] [CrossRef]
- Miller, B.F. Encyclopedia & Dictionary of Medicine Nursing and Allied Health, 7th ed.; Saunders: Philadelphia, PA, USA, 2003. [Google Scholar]
- Rikli, R.E.; Jones, C.J. Development and validation of criterion-referenced clinically relevant fitness standards for maintaining physical independence in later years. Gerontologist 2013, 53, 255–267. [Google Scholar] [CrossRef]
- CJ, R.R.J. Senior Fitness Test Manual, 2nd ed.; Human Kinetics: Champaign, IL, USA, 2013; p. 176. [Google Scholar]
- Jørstad, E.C.; Hauer, K.; Becker, C.; Lamb, S.E. Measuring the psychological outcomes of falling: A systematic review. J. Am. Geriatr. Soc. 2005, 53, 501–510. [Google Scholar] [CrossRef]
- Battisto, J.; Echt, K.V.; Wolf, S.L.; Weiss, P.; Hackney, M.E. The Body Position Spatial Task, a Test of Whole-Body Spatial Cognition: Comparison Between Adults With and Without Parkinson Disease. Neurorehabil. Neural. Repair. 2018, 32, 961–975. [Google Scholar] [CrossRef]
- Goetz, C.G.; Tilley, B.C.; Shaftman, S.R.; Stebbins, G.T.; Fahn, S.; Martinez-Martin, P.; Poewe, W.; Sampaio, C.; Stern, M.B.; Dodel, R.; et al. Movement Disorder Society-sponsored revision of the Unified Parkinson’s Disease Rating Scale (MDS-UPDRS): Scale presentation and clinimetric testing results. Mov. Disord. 2008, 23, 2129–2170. [Google Scholar] [CrossRef]
- Jenkinson, C.; Fitzpatrick, R.; Peto, V.; Greenhall, R.; Hyman, N. The Parkinson’s Disease Questionnaire (PDQ-39): Development and validation of a Parkinson’s disease summary index score. Age Ageing 1997, 26, 353–357. [Google Scholar] [CrossRef]
- Giladi, N.; Tal, J.; Azulay, T.; Rascol, O.; Brooks, D.J.; Melamed, E.; Oertel, W.; Poewe, W.H.; Stocchi, F.; Tolosa, E. Validation of the freezing of gait questionnaire in patients with Parkinson’s disease. Mov. Disord. 2009, 24, 655–661. [Google Scholar] [CrossRef] [PubMed]
- Hentz, J.G.; Mehta, S.H.; Shill, H.A.; Driver-Dunckley, E.; Beach, T.G.; Adler, C.H. Simplified conversion method for unified Parkinson’s disease rating scale motor examinations. Mov. Disord. 2015, 30, 1967–1970. [Google Scholar] [CrossRef] [PubMed]
- Pal, G.; O’Keefe, J.; Robertson-Dick, E.; Bernard, B.; Anderson, S.; Hall, D. Global cognitive function and processing speed are associated with gait and balance dysfunction in Parkinson’s disease. J. Neuroeng. Rehabil. 2016, 13, 94. [Google Scholar] [CrossRef] [PubMed]
- Hackney, M.E.; Earhart, G.M. Backward walking in Parkinson’s disease. Mov. Disord. 2009, 24, 218–223. [Google Scholar] [CrossRef]
- Jones, C.J.; Rikli, R.E.; Beam, W.C. A 30-s chair-stand test as a measure of lower body strength in community-residing older adults. Res. Q. Exerc. Sport 1999, 70, 113–119. [Google Scholar] [CrossRef]
- Schlenstedt, C.; Brombacher, S.; Hartwigsen, G.; Weisser, B.; Möller, B.; Deuschl, G. Comparing the Fullerton Advanced Balance Scale with the Mini-BESTest and Berg Balance Scale to assess postural control in patients with Parkinson disease. Arch. Phys. Med. Rehabil. 2015, 96, 218–225. [Google Scholar] [CrossRef]
- Christopher, A.; Kraft, E.; Olenick, H.; Kiesling, R.; Doty, A. The reliability and validity of the Timed Up and Go as a clinical tool in individuals with and without disabilities across a lifespan: A systematic review. Disabil. Rehabil. 2021, 43, 1799–1813. [Google Scholar] [CrossRef]
- Hofheinz, M.; Schusterschitz, C. Dual task interference in estimating the risk of falls and measuring change: A comparative, psychometric study of four measurements. Clin. Rehabil. 2010, 24, 831–842. [Google Scholar] [CrossRef]
- McKee, K.E.; Hackney, M.E. The Four Square Step Test in individuals with Parkinson’s disease: Association with executive function and comparison with older adults. NeuroRehabilitation 2014, 35, 279–289. [Google Scholar] [CrossRef]
- Bristow, T.; Jih, C.S.; Slabich, A.; Gunn, J. Standardization and adult norms for the sequential subtracting tasks of serial 3’s and 7’s. Appl. Neuropsychol. Adult 2016, 23, 372–378. [Google Scholar] [CrossRef]
- Nasreddine, Z.S.; Phillips, N.A.; Bédirian, V.; Charbonneau, S.; Whitehead, V.; Collin, I.; Cummings, J.L.; Chertkow, H. The Montreal Cognitive Assessment, MoCA: A brief screening tool for mild cognitive impairment. J. Am. Geriatr. Soc. 2005, 53, 695–699. [Google Scholar] [CrossRef] [PubMed]
- Delis, D.C.; Kaplan, E.; Kramer, J. Delis Kaplan Executive Function System; Psychological Corporation: San Antonio, TX, USA, 2001. [Google Scholar]
- Brooks, L.R. The suppression of visualization by reading. Q. Exp. J. Psychol. 1967, 19, 289–299. [Google Scholar] [CrossRef] [PubMed]
- Kessels, R.P.; van den Berg, E.; Ruis, C.; Brands, A.M. The backward span of the Corsi Block-Tapping Task and its association with the WAIS-III Digit Span. Assessment 2008, 15, 426–434. [Google Scholar] [CrossRef]
- Ware, J., Jr.; Kosinski, M.; Keller, S.D. A 12-Item Short-Form Health Survey: Construction of scales and preliminary tests of reliability and validity. Med. Care 1996, 34, 220–233. [Google Scholar] [CrossRef] [PubMed]
- Stalvey, B.T.; Owsley, C.; Sloane, M.E.; Ball, K. The Life Space Questionnaire: A Measure of the Extent of Mobility of Older Adults. J. Appl. Gerontol. 1999, 18, 460–478. [Google Scholar] [CrossRef]
- Best, J.R.; Nagamatsu, L.S.; Liu-Ambrose, T. Improvements to executive function during exercise training predict maintenance of physical activity over the following year. Front. Hum. Neurosci. 2014, 8, 353. [Google Scholar] [CrossRef]
- Beck, A.T.; Steer, R.A.; Ball, R.; Ranieri, W. Comparison of Beck Depression Inventories -IA and -II in psychiatric outpatients. J. Pers. Assess 1996, 67, 588–597. [Google Scholar] [CrossRef]
- Powell, L.E.; Myers, A.M. The Activities-specific Balance Confidence (ABC) Scale. J. Gerontol. A Biol. Sci. Med. Sci. 1995, 50A, M28–M34. [Google Scholar] [CrossRef]
- Ingle, L.; Reddy, P.; Clark, A.L.; Cleland, J.G. Diabetes lowers six-minute walk test performance in heart failure. J. Am. Coll. Cardiol. 2006, 47, 1909–1910. [Google Scholar] [CrossRef]
- Bonnet, C.; Carello, C.; Turvey, M.T. Diabetes and postural stability: Review and hypotheses. J. Mot. Behav. 2009, 41, 172–190. [Google Scholar] [CrossRef]
- Pirart, J. Diabetes mellitus and its degenerative complications: A prospective study of 4,400 patients observed between 1947 and 1973 (3rd and last part) (author’s transl). Diabete Metab. 1977, 3, 245–256. [Google Scholar] [PubMed]
- Zis, P.; Grunewald, R.A.; Chaudhuri, R.K.; Hadjivassiliou, M. Peripheral neuropathy in idiopathic Parkinson’s disease: A systematic review. J. Neurol. Sci. 2017, 378, 204–209. [Google Scholar] [CrossRef] [PubMed]
- Gregg, E.W.; Yaffe, K.; Cauley, J.A.; Rolka, D.B.; Blackwell, T.L.; Narayan, K.M.; Cummings, S.R. Is diabetes associated with cognitive impairment and cognitive decline among older women? Study of Osteoporotic Fractures Research Group. Arch. Intern. Med. 2000, 160, 174–180. [Google Scholar] [CrossRef] [PubMed]
- Yogev, G.; Giladi, N.; Peretz, C.; Springer, S.; Simon, E.S.; Hausdorff, J.M. Dual tasking, gait rhythmicity, and Parkinson’s disease: Which aspects of gait are attention demanding? Eur. J. Neurosci. 2005, 22, 1248–1256. [Google Scholar] [CrossRef]
- Dionyssiotis, Y. Analyzing the problem of falls among older people. Int. J. Gen. Med. 2012, 5, 805–813. [Google Scholar] [CrossRef]
- Reijnders, J.S.; Ehrt, U.; Weber, W.E.; Aarsland, D.; Leentjens, A.F. A systematic review of prevalence studies of depression in Parkinson’s disease. Mov. Disord 2008, 23, 183–189, quiz 313. [Google Scholar] [CrossRef]
- Gorska-Ciebiada, M.; Saryusz-Wolska, M.; Ciebiada, M.; Loba, J. Mild cognitive impairment and depressive symptoms in elderly patients with diabetes: Prevalence, risk factors, and comorbidity. J. Diabetes Res. 2014, 2014, 179648. [Google Scholar] [CrossRef]
- Schrag, A.; Jahanshahi, M.; Quinn, N. How does Parkinson’s disease affect quality of life? A comparison with quality of life in the general population. Mov. Disord 2000, 15, 1112–1118. [Google Scholar] [CrossRef]
- Rubin, R.R.; Peyrot, M. Quality of life and diabetes. Diabetes Metab. Res. Rev. 1999, 15, 205–218. [Google Scholar] [CrossRef]
- Pagano, G.; Polychronis, S.; Wilson, H.; Giordano, B.; Ferrara, N.; Niccolini, F.; Politis, M. Diabetes mellitus and Parkinson disease. Neurology 2018, 90, e1654–e1662. [Google Scholar] [CrossRef]
- Wooten, G.F.; Currie, L.J.; Bovbjerg, V.E.; Lee, J.K.; Patrie, J. Are men at greater risk for Parkinson’s disease than women? J. Neurol. Neurosurg. Psychiatry 2004, 75, 637–639. [Google Scholar] [CrossRef] [PubMed]
- Huebschmann, A.G.; Huxley, R.R.; Kohrt, W.M.; Zeitler, P.; Regensteiner, J.G.; Reusch, J.E.B. Sex differences in the burden of type 2 diabetes and cardiovascular risk across the life course. Diabetologia 2019, 62, 1761–1772. [Google Scholar] [CrossRef] [PubMed]
- Kirkman, M.S.; Briscoe, V.J.; Clark, N.; Florez, H.; Haas, L.B.; Halter, J.B.; Huang, E.S.; Korytkowski, M.T.; Munshi, M.N.; Odegard, P.S.; et al. Diabetes in older adults. Diabetes Care 2012, 35, 2650–2664. [Google Scholar] [CrossRef]
- Fiory, F.; Perruolo, G.; Cimmino, I.; Cabaro, S.; Pignalosa, F.C.; Miele, C.; Beguinot, F.; Formisano, P.; Oriente, F. The Relevance of Insulin Action in the Dopaminergic System. Front. Neurosci. 2019, 13, 868. [Google Scholar] [CrossRef] [PubMed]


| HOA | PD-Only | DM-Only | PD+DM | p-Value | ||
|---|---|---|---|---|---|---|
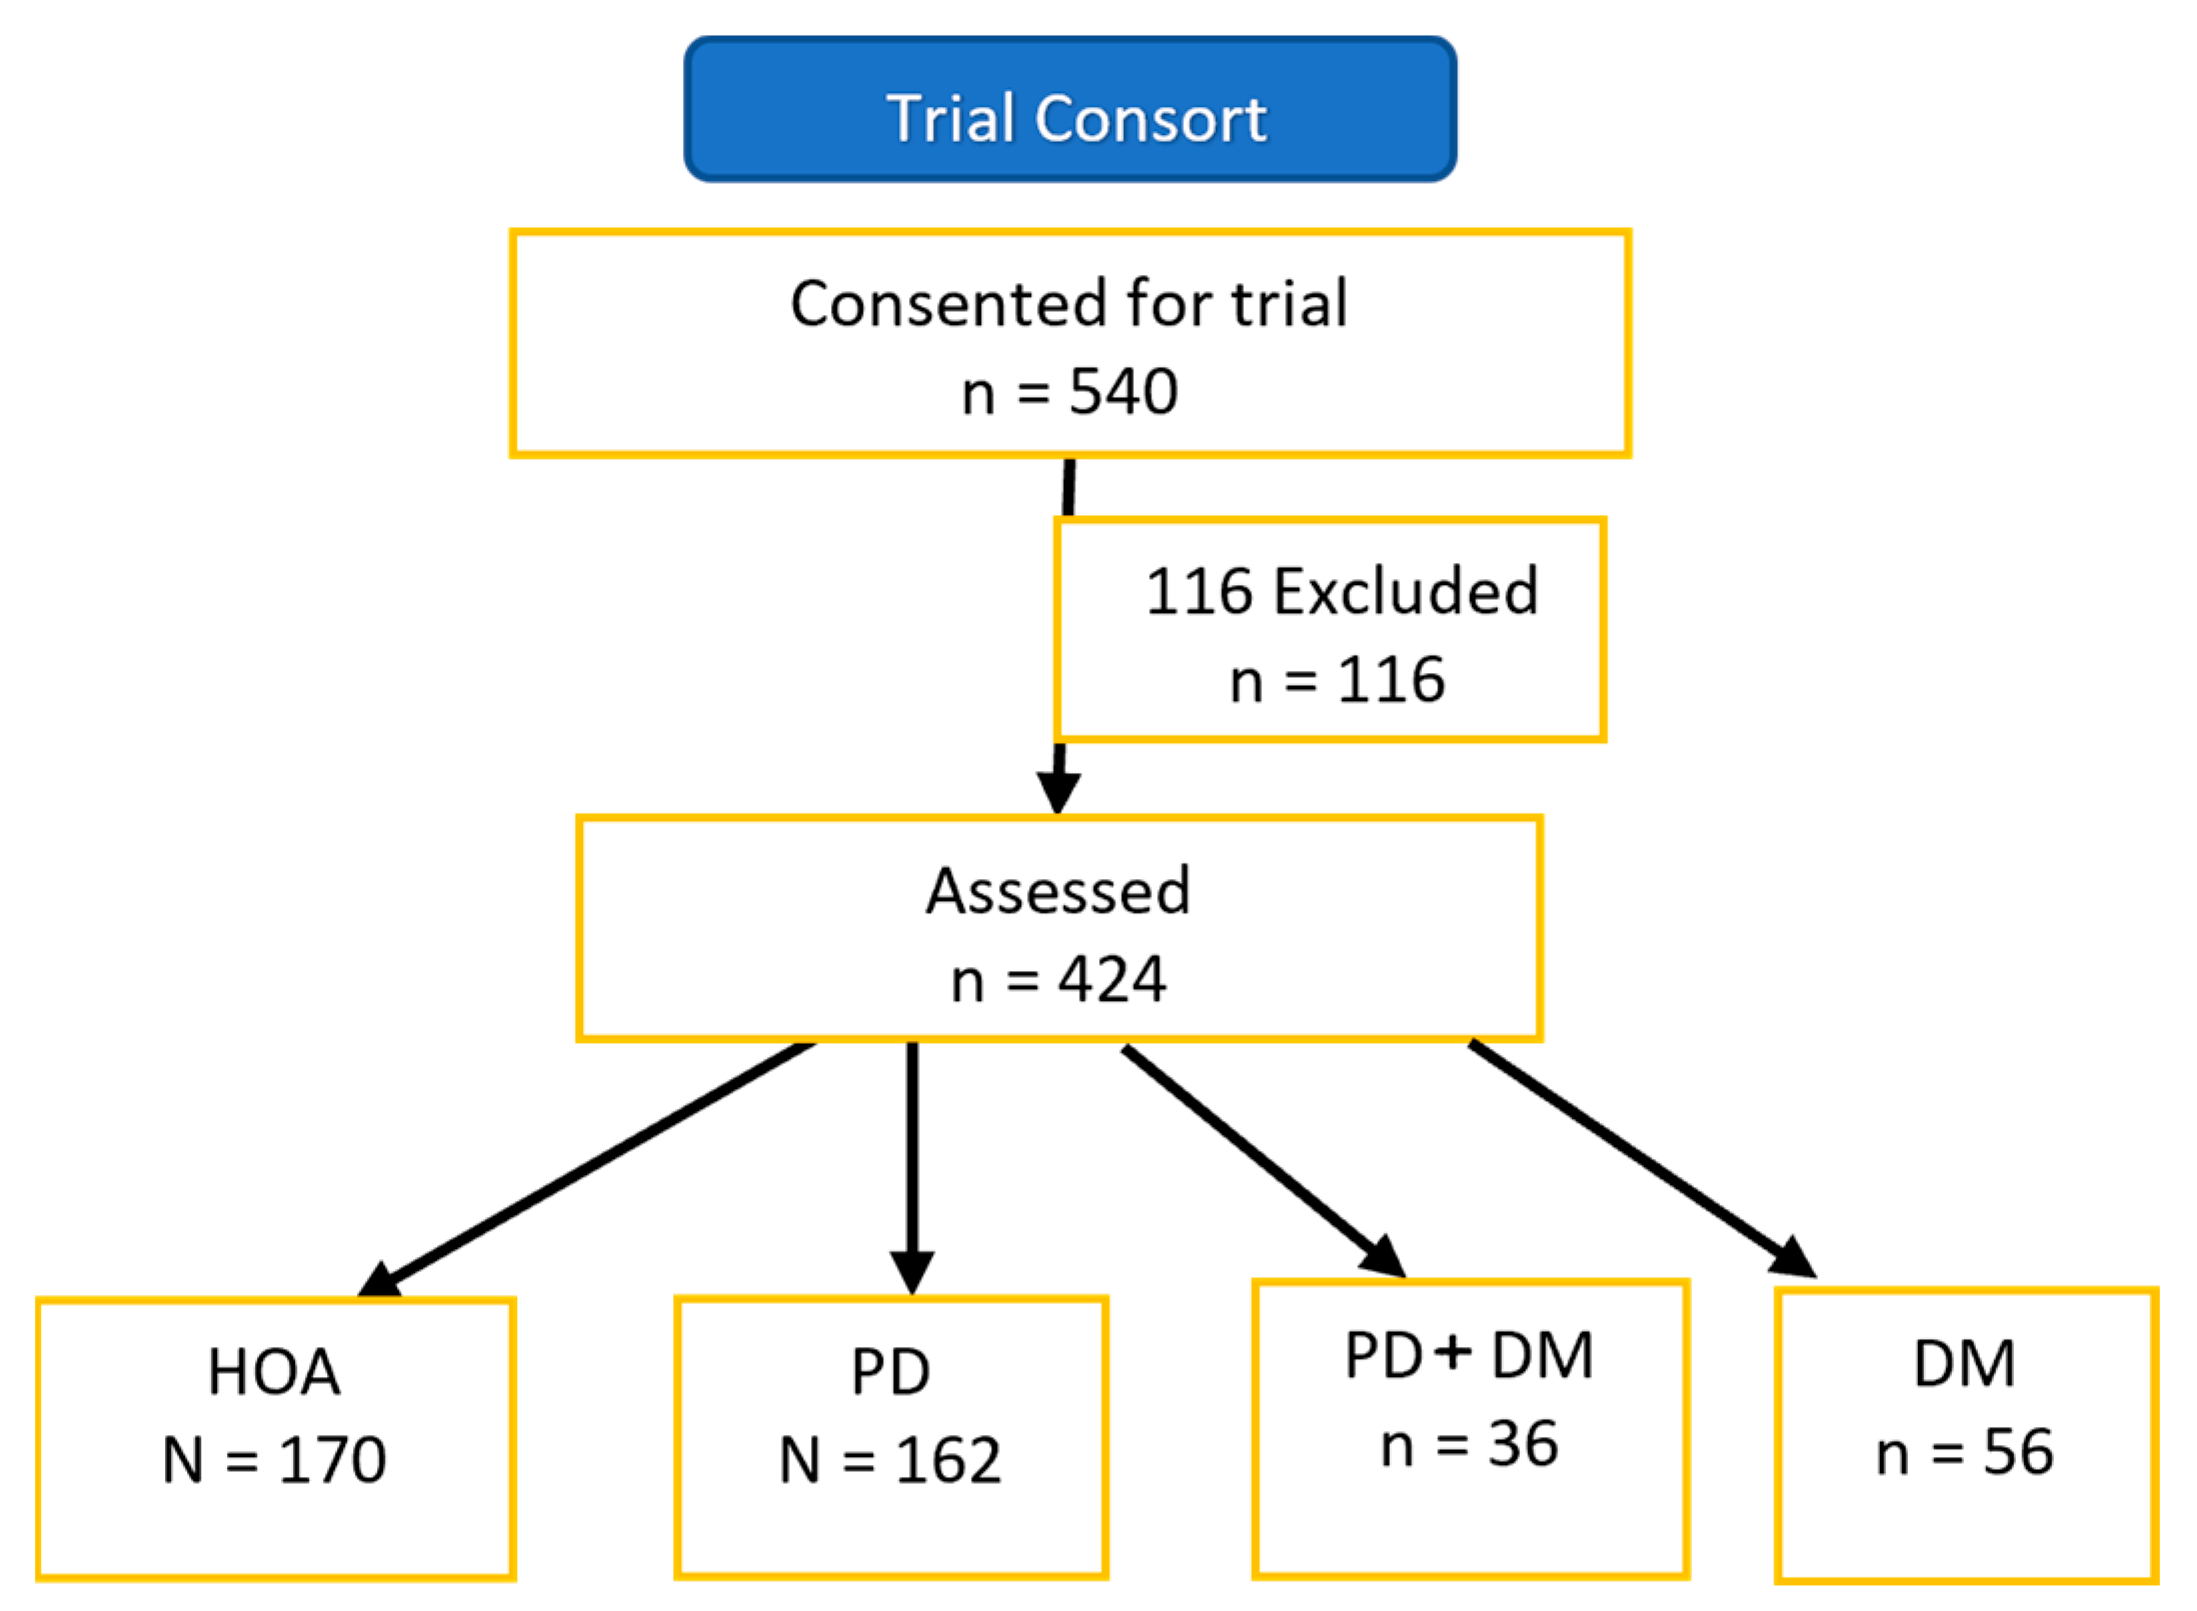
| n | 170 | 162 | 56 | 36 | ||
| Age | 69.1 ± 9.8 | 69.49 ± 8.1 | 68.89 ± 9.1 | 69.94 ± 7.6 | 0.927 | |
| Education (years) | 15.6 ± 2.7 | 16.42 ± 2.3 | 15.07 ± 2.4 | 16 ± 2.7 | 0.002 | |
| Body mass index (kg/m2) | 27.94 ± 6.1 | 25.73 ± 4.6 | 28.59 ± 5.2 | 29.07 ± 5.3 | <0.001 | |
| Number of medications | 2.78 ± 2.6 | 5.64 ± 4.1 | 5.26 ± 3.2 | 7.54 ± 3.9 | <0.001 | |
| Number of comorbidities | 2.39 ± 1.6 | 3.11 ± 1.7 | 5.16 ± 2.8 | 4.97 ± 1.7 | <0.001 | |
| Time with PD (years) † | 7.09 ± 4.9 | 5.17 ± 3.8 | 0.023 | |||
| Unified Parkinson’s disease Rating Scale III | 33.21 ± 11.5 | 37.79 ± 13.9 | 0.039 | |||
| PDQ 39 Summary Index † | 21.93 ± 13.8 | 27.97 ± 17.5 | 0.075 | |||
| FOGQ † | 6.3 ± 5.1 | 7.1 ± 5.9 | 0.678 | |||
| Sex (n (%)) | <0.001 | |||||
| Men | 30 (17.6) | 95 (58.6) | 22 (40) | 30 (83.3) | ||
| Women | 140 (82.4) | 67 (41.4) | 33 (60) | 6 (16.7) | ||
| Race (n (%)) | <0.001 | |||||
| Black | 89 (52.7) | 25 (15.4) | 32 (58.2) | 8 (22.2) | ||
| White | 61 (36.1) | 128 (79) | 20 (36.4) | 24 (66.7) | ||
| Other | 19 (11.2) | 9 (5.6) | 3 (5.5) | 4 (11.1) | ||
| Hoehn and Yahr (n (%)) ^ | 0.888 | |||||
| 1 | 6 (4.3) | 1 (3.6) | ||||
| 1.5 | 18 (12.9) | 3 (10.7) | ||||
| 2 | 57 (40.7) | 14 (50) | ||||
| 2.5 | 22 (15.7) | 3 (10.7) | ||||
| 3 | 35 (25) | 6 (21.4) | ||||
| 4 | 2 (1.4) | 1 (3.6) |
| HOA | PD-Only | DM-Only | PD+DM | p-Values Adjusted for Model 3/Model 4 | |||||||
|---|---|---|---|---|---|---|---|---|---|---|---|
| n | Mean ± SD | n | Mean ± SD | n | Mean ± SD | n | Mean ± SD | Main Effect of PD | Main Effect of DM | PDXDM | |
| Preferred forward gait speed (m/s) | 145 | 1.09 ± 0.2 | 140 | 1.01 ± 0.3 | 47 | 0.99 ± 0.3 | 26 | 0.97 ± 0.3 | 0.001/ | 0.062 | 0.34 |
| Fast forward gait speed (m/s) | 145 | 1.53 ± 0.4 | 140 | 1.39 ± 0.4 | 46 | 1.39 ± 0.4 | 26 | 1.36 ± 0.5 | <0.001 | 0.048 | 0.286 |
| Preferred backward gait speed (m/s) | 145 | 0.77 ± 0.3 | 139 | 0.63 ± 0.3 | 46 | 0.71 ± 0.3 | 26 | 0.57 ± 0.3 | <0.001 | 0.105 | 0.878 |
| Chair stands | 148 | 13.01 ± 5 | 140 | 10.98 ± 4.9 | 47 | 10.94 ± 5.1 | 27 | 10.41 ± 5.7 | <0.001 | 0.062 | 0.255 |
| 6MWT (m) | 144 | 422.9 ± 105 | 135 | 374.7 ± 102 | 47 | 366.7 ± 137 | 27 | 334.31 ± 132 | <0.001 | 0.002 | 0.562 |
| One leg stand (s) | 82 | 16.7 ± 11.5 | 131 | 15.97 ± 10.7 | 28 | 13.72 ± 11.6 | 24 | 11.96 ± 8.2 | 0.398 | 0.03 | 0.504 |
| 360° turn (steps) | 66 | 3.02 ± 1.2 | 117 | 5.85 ± 5.7 | 18 | 4.5 ± 5.1 | 18 | 4.91 ± 2.7 | <0.001 | 0.926 | 0.11 |
| 360° turn (s) | 66 | 6.21 ± 2.2 | 117 | 11.26 ± 6.4 | 17 | 6.59 ± 2.9 | 18 | 10.22 ± 4.1 | <0.001 | 0.498 | 0.257 |
| TUG-baseline (s) | 158 | 8.79 ± 2.7 | 154 | 11.43 ± 6.8 | 49 | 10.6 ± 5 | 33 | 12.13 ± 6.5 | <0.001 | 0.049 | 0.422 |
| TUG-cognitive (s) | 157 | 12.79 ± 5.0 | 153 | 16.21 ± 15.1 * | 49 | 14.51 ± 6.0 | 32 | 15.83 ± 8.3 | 0.001 | 0.377 | 0.44 |
| TUG-cognitive (Correct subtractions/s) | 157 | 0.3 ± 0.2 | 152 | 0.26 ± 0.3 | 49 | 0.26 ± 0.2 | 32 | 0.24 ± 0.3 | 0.002 | 0.218 | 0.731 |
| FSST (s) | 158 | 11.13 ± 5.1 | 134 | 12.15 ± 4.6 | 41 | 11.32 ± 3.7 | 30 | 12.57 ± 5.2 | 0.051 | 0.837 | 0.874 |
| HOA | PD-Only | DM-Only | PD+DM | p-Value Adjusted for Education, Sex, and Ethnicity | |||||||
|---|---|---|---|---|---|---|---|---|---|---|---|
| n | Mean ± SD | n | Mean ± SD | n | Mean ± SD | n | Mean ± SD | Main Effect of PD | Main Effect of DM | PDXDM | |
| Serial 3s counting (% correct) | 158 | 88.7 ± 18.9 | 155 | 93.46 ± 11 | 51 | 87.12 ± 20.8 | 34 | 83.54 ± 25.3 | 0.558 | 0.051 | 0.035 |
| MoCA score | 159 | 24.87 ± 3.9 | 143 | 25.34 ± 3.8 | 45 | 23.69 ± 3.1 | 34 | 24 ± 4.7 | 0.569 | 0.143 | 0.995 |
| CWIT inhibition scaled score | 98 | 11 ± 2.4 | 91 | 9.08 ± 3.9 | 27 | 8.56 ± 3.5 | 22 | 8.82 ± 3.7 | 0.034 | 0.034 | 0.012 |
| CWIT inhibition/switching scaled score | 97 | 10.06 ± 3.2 | 89 | 8.76 ± 4.1 | 26 | 8.54 ± 3.1 | 21 | 8.95 ± 3.4 | 0.009 | 0.486 | 0.068 |
| Tower test—achievement score | 112 | 10.1 ± 2.5 | 111 | 10.05 ± 3.4 | 32 | 9.25 ± 3.1 | 31 | 11.32 ± 2.5 | 0.719 | 0.343 | 0.014 |
| Tower test—time per move (s/total moves) | 112 | 9.4 ± 3.2 | 111 | 7.99 ± 4 | 32 | 7.66 ± 4.1 | 31 | 10.23 ± 4 | 0.082 | 0.477 | <0.001 |
| Tower test—mean first move (s) | 112 | 9.67 ± 2.9 | 111 | 10.87 ± 3.5 | 32 | 9.94 ± 3.2 | 31 | 12.68 ± 2.6 | 0.005 | 0.014 | 0.077 |
| HOA | PD-Only | DM-Only | PD+DM | p-Value Adjusted for Education, Sex, and Ethnicity | |||||||
|---|---|---|---|---|---|---|---|---|---|---|---|
| n | Mean ± SD | n | Mean ± SD | n | Mean ± SD | n | Mean ± SD | Main Effect of PD | Main Effect of DM | PDXDM | |
| SF-12 (PCS) | 160 | 49.21 ± 9.7 | 136 | 41.52 ± 9.4 | 50 | 44.45 ± 11.6 | 32 | 38.85 ± 10.1 | <0.001 | 0.006 | 0.533 |
| SF-12 (MCS) | 160 | 49.32 ± 8.9 | 136 | 45.8 ± 9.9 | 50 | 47.69 ± 10.4 | 32 | 42.89 ± 10.1 | <0.001 | 0.19 | 0.695 |
| Life space questionnaire | 95 | 6.27 ± 1.1 | 50 | 6.66 ± 1.3 | 33 | 6.09 ± 1.5 | 11 | 5.91 ± 1 | 0.641 | 0.229 | 0.223 |
| PASE | 124 | 108.5 ± 68.9 | 136 | 105.7 ± 71.1 | 33 | 111.1 ± 78.7 | 34 | 89.31 ± 67.2 | 0.29 | 0.235 | 0.275 |
| CPF | 165 | 21.27 ± 4.1 | 159 | 19.19 ± 5 | 56 | 19.39 ± 5.5 | 35 | 18.37 ± 5.4 | <0.001 | 0.010 | 0.361 |
| BDI-II | 124 | 5.99 ± 5.7 | 136 | 12.32 ± 7.7 | 33 | 10.03 ± 10.6 | 33 | 14.21 ± 10.9 | <0.001 | 0.038 | 0.273 |
| ABC | 126 | 60.67 ± 28.4 | 159 | 68.85 ± 24.1 | 39 | 58.47 ± 31.3 | 35 | 59.85 ± 26.4 | 0.391 | 0.108 | 0.388 |
| Quality of life § | 161 | 5.51 ± 1.22 | 157 | 5.10 ± 1.14 | 55 | 5.26 ± 1.30 | 34 | 5.16 ± 1.33 | 0.002 | 0.797 | 0.321 |
| Falls in last year (No.) | 159 | 0.54 ± 2.02 | 162 | 11.15 ± 50.13 | 52 | 3.04 ± 12.84 | 36 | 2.75 ± 3.86 | 0.003 | 0.572 | 0.125 |
| Fear of falling § | 166 | 1.98 ± 1.31 | 159 | 3.20 ± 1.65 | 55 | 2.30 ± 1.68 | 35 | 3.01 ± 1.20 | <0.001 | 0.266 | 0.196 |
Disclaimer/Publisher’s Note: The statements, opinions and data contained in all publications are solely those of the individual author(s) and contributor(s) and not of MDPI and/or the editor(s). MDPI and/or the editor(s) disclaim responsibility for any injury to people or property resulting from any ideas, methods, instructions or products referred to in the content. |
© 2023 by the authors. Licensee MDPI, Basel, Switzerland. This article is an open access article distributed under the terms and conditions of the Creative Commons Attribution (CC BY) license (https://creativecommons.org/licenses/by/4.0/).
Share and Cite
Barter, J.D.; Thomas, D.; Ni, L.; Bay, A.A.; Johnson, T.M., II; Prusin, T.; Hackney, M.E. Parkinson’s Disease and Diabetes Mellitus: Individual and Combined Effects on Motor, Cognitive, and Psychosocial Functions. Healthcare 2023, 11, 1316. https://doi.org/10.3390/healthcare11091316
Barter JD, Thomas D, Ni L, Bay AA, Johnson TM II, Prusin T, Hackney ME. Parkinson’s Disease and Diabetes Mellitus: Individual and Combined Effects on Motor, Cognitive, and Psychosocial Functions. Healthcare. 2023; 11(9):1316. https://doi.org/10.3390/healthcare11091316
Chicago/Turabian StyleBarter, Jolie D., Dwaina Thomas, Liang Ni, Allison A. Bay, Theodore M. Johnson, II, Todd Prusin, and Madeleine E. Hackney. 2023. "Parkinson’s Disease and Diabetes Mellitus: Individual and Combined Effects on Motor, Cognitive, and Psychosocial Functions" Healthcare 11, no. 9: 1316. https://doi.org/10.3390/healthcare11091316