Article

Geophysical and Geomatic Methods for the Knowledge, Conservation, and Management of Jordanian Cultural Heritage

1
Institute of Heritage Sciences (ISPC), National Council of Researches, Via Salaria Km. 29,300, Monterotondo St., 00015 Rome, Italy
2
Department of Agricultural, Environmental and Food Sciences, University of Molise, Via De Sanctis Snc, 86100 Campobasso, Italy
*
Author to whom correspondence should be addressed.
Geosciences 2023, 13(11), 349; https://doi.org/10.3390/geosciences13110349
Submission received: 5 October 2023 / Revised: 4 November 2023 / Accepted: 10 November 2023 / Published: 15 November 2023
(This article belongs to the Section Geoheritage, Geoparks and Geotourism)

Abstract

:
Jordan has a complex history that has left tangible traces in numerous archaeological sites scattered throughout the country. This unique heritage of inestimable cultural value must be documented, thoroughly researched, and protected in order to prevent its destruction and loss. In this context, knowledge and documentation can be achieved through the application of non-destructive geophysical and geomatic methods. This work represents a synthesis of the results of twenty years of projects carried out at the archaeological sites of Basta, Petra, Um-Hamat (Karak), Umm ar-Rasas, Wu’Ayra, Madaba, and Shawbak. This study enables the exploration of new buried structures in the ground and the documentation of the state of preservation of the structures. It provides an up-to-date overview of Jordan’s rich archaeological heritage and supports restoration projects.

1. Introduction

Jordan is characterized by a very heterogeneous territory, where green plateaus and lush valleys contrast with barren deserts and inaccessible areas. Nevertheless, the fertility, abundant water resources, and diverse mineral resources of the Jordan Valley have increased the strategic importance of the area as a borderland between ancient civilizations (such as Egypt, Assyria, Islam, Byzantium, Persia, Greece, and Rome) and its location on the main communication routes of the ancient world (Silk Road, Spice Route, and Frankincense Route). This has favored the occupation of these territories since the beginning of human history [1].
Stone tools from the Stone Age, made by nomadic hunters, testify to the first traces of human activity. It was only around 17,000 BC, with the drier climate, that they began to settle down, and then, in the period between 8000 and 4500 BC, the Neolithic civilization emerged, as shown by the sites of Beida [2], Basta [3], and Ajm Ghazal [4,5]. Later, during the Chalcolithic period (4500–3200 BC), the art of ceramics developed, and with the Bronze Age (3000–1200 BC) that of metal objects. Fortified cities such as Zerakhon [6], Jawa [7], Lehhum [1], Bab ad-Dhraa [8], Tell Sa’idiyyed [9], and Pella [10] were built and trade relations were established with Mesopotamia, Egypt, Anatolia, and the Aegean cities. Since the beginning of the Iron Age and for about six centuries, the Jordanian territory was divided into small kingdoms such as Edom, Moab, and Ammon, which left numerous pieces of ceramic evidence, jewelry, and inscriptions from Amman [1], Tell Safut [11], Dhiban [12], Tell Mazar [13], and Tell Deir Alla [14]. In the last two centuries of the Iron Age, the area belonged to the Persian empire of the Achaemenids, until the invasion of the army of Alexander the Great (332 BC) introduced the Greco-Roman civilization. At the same time, the Nabataeans began the settlement of southern Jordan and the development of its capital, Petra, which is still famous for its riches. In 106 BC, the city fell under Roman rule. Important cities such as Pella [15], Abila [16], Gadara [17], Philadelphia [18], and Gerasa [19] were also developed elsewhere. In 395 AD, Emperor Theodosius I divided the Roman Empire into two parts and assigned Jordan to the Eastern Roman Empire, which was also called Byzantine because its capital was Byzantium. This period led to radical changes in religious and artistic terms, as witnessed by the churches built in Madaba [20], Umm ar-Rasas [20,21], Rihab [22], Amman [22], Mount Nebo [20], and Jerash [23]. In the 7th century AD, a new religious and political doctrine, Islam, developed and numerous castles were built along the caravan routes that connected Damascus with the Arabian Peninsula. After the Crusader invasions (1095–1291), which left the castles of Karak [24] and Shawbak [24,25], there was a period of economic and political prosperity in Jordan. In the 16th century, Jordan fell to the Ottoman Empire until 1918, when the modern state came into being.
This brief historical introduction finds traces in the many archaeological and cultural sites scattered throughout Jordan. Many sites have been systematically studied, much research is underway, and much remains to be discovered, and analyzed in detail. On the other hand, however, there is a need to preserve and enhance these sites for the benefit of present and future generations.
From 2000 to the present, a fruitful collaboration has been undertaken between the University of Molise, the Institute for Technologies Applied to Cultural Heritage (ITABC), now the Institute of Heritage Sciences (ISPC), which is part of the National Research Council (CNR) of Italy, and the Department of Antiquities of Jordan with the aim of improving and implementing data on Jordan’s diverse and unique cultural heritage. The focus of this article is to summarize the main results of the scientific activities achieved through the application of geophysical and geomatic methods in Jordan at seven archaeological sites (Figure 1).
In the following sections, we first provide an outline of the methodological approach we used; then, for each site, the presentation of the archaeological background and the discussion of the results reached are shown. Since the research activities span a large period, an evolution of the methods and materials used was inevitable. Where this was the case, some reflections on the improvements introduced are highlighted. The results allowed for the successful management of the archeological sites in terms of identification, protection, conservation, valorization, and recovery.

2. Materials and Methods

This article contains a collection of applications of geophysical prospecting and geomatic surveys at heterogeneous sites. Since the research conducted at the different sites had different objectives, a case-by-case evaluation of the methodologies used was necessary. At each site studied, the first step focused on the analysis of bibliographic and documentary sources, including archaeological, architectural, and geological data. The collection of previous data was essential for the interpretation of new data and for the planning of new research projects. A computerized archive was created for each site, integrating the existing data. In order to select the appropriate method to solve the particular research objective, a careful evaluation of the stratigraphy, the ambient noise in the study area, the typology of the surfaces to be treated, and the principles of operation, as well as the applicability of the various techniques available was carried out.

2.1. Geophysical Prospections

Several methods have been systematically described in the literature that provide useful results to map the subsurface archaeological features in a non-invasive way, through the use of electromagnetic methods [26,27], magnetometry [28,29,30], electrical resistivity tomography (ERT) [31,32,33,34], ground penetrating radar (GPR) [35,36,37,38,39] or a combination of these methods [40,41,42,43]. In the contexts studied, ERT and GPR were preferred over other methods.
ERT has a longer acquisition time than other methods, but it is still effective because it provides easily interpretable results, is highly adaptable to different soil conditions, and is ideal for detecting very deep structures. Field surveying involves measuring the potential difference between a pair of electrodes on the ground, which is generated by a direct current that is conducted into the subsurface through a second pair of electrodes. By changing the position and spacing of the electrodes according to certain rules, horizontal and vertical resistivity changes in the subsurface can be investigated. The dipole-dipole electrode configuration (DD), which is moved along a profile on the ground, is the most suitable arrangement for collecting ERT data, and its arrangement is much more sensitive to latent resistivity differences than other conventional arrangements. For this reason, it can be particularly effective in highlighting archaeological structures that cause strong lateral resistivity contrasts at the boundary with the surrounding subsurface [44].
The method was applied to investigations at Petra, Um-Hamat (Karak), Wu’Ayra, Shawbak castle, and Madaba to achieve a good compromise between the depth of investigation and the resolution of results. The acquisition of data was performed with a portable resistivity meter ELMES ADD-01 (Elmes Company, Warsaw, Poland) in Petra, Um-Hamat (Karak), Wu’ayra, and Madaba, and a multi-electrode resistivity meter A3000E (M.A.E. s.r.l., Frosolone, Italy) in Shawbak castle.
The definition of the acquisition parameters was determined on a case-by-case basis, taking into account the nature of the structures to be investigated and the depth of investigation required. Depending on the width and length of the suspected buried structures, the spacing of the electrodes was defined between 0.5 m and 1 m.
The measured apparent resistivity data were processed to remove the drag effects typical of DD array and to model the survey targets by converting the values to real electrical resistivity values displayed as a function of the depth below the surface. To this end, a probability tomography approach was used to map the sources of the anomalies in the surveyed soils. The theory was first established for the self-potential method [45] and then adapted to the resistivity method [46,47,48]. The primary approach was able to discriminate between high and low resistivities in the field data sets given a reference background resistivity but excluded the estimation of the intrinsic resistivities of the source bodies. The method has been successfully used to delineate buried archaeological structures in archaeological sites. Following [46], the apparent resistivity data sets recorded at Wu’ayra and Shawbak castle were processed to determine the occurrence of electrical resistivity anomalies.
In 2009, a data-adaptive probability-based ERT inversion method (PERTI) [49] was derived directly from the principles of probability tomography to estimate the true resistivities and identify the most probable solution from the set of possible solutions. In the work, this approach was used to process data from Petra, Um-Hamat (Karak), and Madaba.
GPR provides high resolution images and the ability to derive depth information about the anomalies to identify the spatial evolution of the structures. It is also the least invasive technique suitable for working on paved surfaces. A GPR survey uses radar equipment with transmitter–receiver antennas characterized by different frequencies to transmit electromagnetic signals into the soils and surfaces. Depending on the material properties and the presence of buried targets, the radar pulse may be attenuated, scattered, dispersed, or reflected to the surface. Reflection times are related to the speed of propagation of the wave in the materials.
GPR was used in the Basta and Umm ar-Rasas surveys of the two Byzantine churches and the Stylite tower area. The surveys were carried out with an IDS Georadar (IDS GeoRadar s.r.l., Pisa, Italy) equipped with a multi-frequency TRMF antenna (200–600 MHz). GPR profiles were acquired at uniform intervals of half a meter in grids adapted to the available areas. The data were processed using IdsGred_ 5.2 [50] and GPR-SLICE 7.0 [51] software to obtain 2D horizontal maps at different depth ranges. The following standard methods were used: conversion by subtracting the DC drift (wobble) in the data; time-zero correction; band-pass filtering and background noise subtraction; the control of automatic gain; creation of horizontal slices (time slices); rasterization with the inverse distance algorithm; creation of high-resolution images.

2.2. Geomatic Surveys

As for geomatics in archaeology, low altitude aerial photography and ground-based methods have been widely used in documentation studies through the surveying and 3D modelling of archaeological sites. Archaeological sites are documented through passive close-range reconnaissance (aerial photography using unmanned devices such as balloons, drones, kites, model airplanes, airships, and masts) and active and passive ground reconnaissance (laser scanning and terrestrial photography). Close-range aerial photography using platforms operating at low altitudes has been dated to the late nineteenth and early twentieth centuries [52,53,54,55]. A comprehensive overview is given in [56], while in [57], a summary of the available platforms is proposed with their main advantages and disadvantages. However, masts, poles, booms, towers, kites, balloons, and airships seem to be less intensively used in recent years [58,59,60,61,62,63], due to the development of Remotely Piloted Aircraft Systems (RPASs). The latter applications have made significant progress in the field of aerial photography for documenting archaeological excavations [57,64,65,66,67], three-dimensional surveys of monuments and historic buildings [68,69,70,71], and surveys of archaeological sites and landscapes [72,73,74,75,76].
Ground sensing is performed using image-based methods such as terrestrial photogrammetry (passive method), distance-based methods such as laser scanning (active method), or an integration of both techniques.
For many years, considering several collaborations with some Italian universities, Jordan was an experimental laboratory for archaeological survey methodology and digital representations of the Survey Group of CNR. Through the experiments carried out in the last 20 years in famous and important case studies, it is now possible to make a summary of the results obtained and the techniques used.
Within this framework, it is possible to describe the development of the methodology for the study of some of most representative monuments of Jordan. The collaboration between Jordan and the Department of Historical and Geographical Studies at the University of Florence began in the 2000s and lasted about 10 years. This collaboration took place at the Crusader castle of Wu’ayra, then at the Crusader castle of Shawbak and that of Al-Habis within Petra, and finally at the ancient Nabataean center of Petra. The experience and results of these activities were later incorporated into the more recent, and still ongoing, project to study the ancient center of Umm ar-Rasas.
The sites listed were methodological experimental fields in which it was possible to develop and test different data acquisition and processing techniques aimed at the objective restitution and graphic and archaeological documentation necessary for an in-depth critical reading.
The main objective was to integrate different survey techniques to obtain new information for historical archaeological research.
Several case studies were used to illustrate the development of an integrated survey methodology. In some cases, the same surveys were repeated several years apart but with different instruments to compare data and validate the methodology. In other cases, however, new measurements were made in areas not yet surveyed. Field activities included topographic surveys with a GNSS, photographic straightening, photo modeling, laser scanning, and photo scanning.
In 2000, after data on the accuracy of the GNSS were published and made available, it was possible to starting using this instrument in archaeology. The instrument, equipped with a single frequency, could only display the number of satellites needed to measure specific latitudes and at certain times of the day. The instrument was initially used for the planimetric restitution of the Cassero of the Crusader castle at Wu’Ayra. Specifically, the points surveyed on the ground were used to create a digital terrain model (DTM) to understand the layout of archaeological structures in the area, and as a base map for GIS applications. Today’s instruments can process the point data in real time (RTK), but in 2000, it was necessary to perform the accuracy calculations only in post-processing and under certain conditions of the satellite view. The kinematic mode was preferred because it could acquire a point on the ground among the different points of the chain at each epoch (2 s). The points of the chain were the fixed points whose exact coordinates were known, exactly in the projection WGS84, UTM 36 N. The world of archaeology began to move into the realm of map projection and global projective geometry. In order to perform an orthophoto mosaic and perspective straightening of the castle, it was necessary to place targets on the ground and record shots of the area with a kite and an analogue camera. The result was surprising, and thanks to special software for the management of satellite images (Erdas ER Mapper, Planetek, Italia), it was possible to straighten the area in question within certain limits. The positioning of the images was affected by the wind, and strong distortions are present at the edges of the model since it was difficult to take images according to a regular grid.
In the meantime, digital photogrammetry developed with considerable progress, and further attempts were made at Wu’Ayra and Petra. As is well known, when the first digital cameras came on the market, semi-automatic software for digital photogrammetry using the Structure from Motion (SfM) method (PhotoModeler Technologies, Vancouver, Canada) was also launched, requiring the operator to manually identify corresponding points between images to build the numerical model and resolve ambiguities in the epipolar geometry. Archaeological patterns have always had features with points that are often easy to recognize, and so a series of images taken with a pneumatic rod were processed for some of the canalizations at Petra. At the same time, it was decided to fly a gas balloon with a small compact camera for aerial photography from 50 m on the ground to get an overall view from above. The gas balloon was also used for the Shawbak Crusader castle to view the entire monument through a series of straightened images.
In the photographic recordings, a certain rigor of overlap had to be observed that is typical of archaeological aerial photointerpretation and the principles of photogrammetry. However, the greater ease with which the balloon could be moved could ensure the proper convergence of the images for a faithful reconstruction of the areas. Therefore, part of the images was used to create an orthophoto mosaic and for general perspective straightening, while another part was used to experiment with new photo modeling software and analyze the results.
The manual process of recognizing homologous points was the crucial act in the section of the model. It was not enough to identify 10 or 15 points to obtain a good geometric match. Several factors can affect the quality of the data, including most importantly the number of points, their geometric arrangement, and the number of images on which the same points are seen. These factors are also amplified by the selection of points to be used. Since the points must describe the area and provide a reliable three-dimensional model, their spatial arrangement must follow the morphology to be measured as closely as possible. Moreover, for such a large area, it is necessary to have a statistically valid number of points in order to obtain a homogeneous return of the shapes. There is also the fact that the points and the model had to be georeferenced. For this reason, the field mission also used a dual-frequency differential GNNS (SR500, Leika, Wetzlar, Germany)), which can acquire the points in real time (RTK) with centimeter-level accuracy and instantaneous corrections. However, the GNSS constellation always had the limitation that the correct time of day had to be found so that a sufficient number of satellites could be displayed simultaneously.
Photogrammetry has always been a tool that combines the principles of perspective with the characteristics of photography and has been able to adapt to new and different technological requirements during the last century. Thus, a transformation took place from analogue photogrammetry to analytical photogrammetry to digital photogrammetry. Thus, in 2008, in collaboration with the company Menci Software (Menci s.r.l., Arezzo, Italy), it was possible to develop experimental stereoscopic photogrammetry hardware with three cameras that simulated human vision with parallel acquisition in all respects.
Knowing the distance of the base between the cameras and applying the principles of trigonometry, it is possible to determine the coordinates of an inaccessible point, as it was done during excavations using theodolites in archaeology. Thus, a color point cloud was created from a photograph of the same object taken from three different viewpoints. The distance between the photo cameras, of course, affected the distance to the object and the accuracy of the tracing. The device was adapted to fly on a helium balloon at 50 m altitude. Each image could simultaneously capture coordinate points over an area of 3000 m2. This system was used both at the Shawbak Crusader castle to map the visible area and to study the geomorphology of the terrain within the walls. The system was also used at Petra on the Palace Tomb, in this case to map the architectural façade and investigate the pathologies of the surface deterioration. Again, the clouds had to be georeferenced because the photogrammetric system operates in a local system.
Since 2010, photogrammetric techniques have found the geometric solution to break away from a rigid stereoscopic system, and today, terms like photo modeling or multi-image photogrammetry are commonly used. The stereoscopic system does not allow one to obtain metric point clouds, because there are no known references or distances, but one can still obtain a numerical point cloud model that can be georeferenced later. Two specific softwares, Agisoft Photoscan 1.8.2 (St. Petersburg, Russia) and Reality Capturing 1.2.2 (Cary, NC, USA), were used for the projects to process and analyze the data collected at Wu’Ayra castle according to the new representation strategies. The same approach was used for Petra and Shawbak castle, so that new results and more accurate data could be obtained.
At the same time, it was decided to use the properties of photogrammetry for the study of mosaic floors, moving from an architectural to a detailed scale. In this case, several variables play a role, including the focal length of the instrument and the possibility of achieving a degree of accuracy that allows the representation of even the smallest changes in elevation. This degree of accuracy is important in order to understand degradation phenomena and, in general, the study of soil morphology, by integrating these results with those obtained from geophysical studies. In this case, the method was tested by constructing a metal infrastructure in which a full-frame reflex camera was placed half a meter above the ground to map and reconstruct the mosaic surface of St. Stephen’s Church in the Umm ar-Rasas.
Photogrammetric systems were integrated with data; data of total stations were obtained from a GNSS where appropriate, but most importantly, laser scanner data were utilized. The laser scanner is a tool now used in many archaeological and architectural contexts, the characteristics of which are well-known, and which is the subject of numerous publications. The laser scanner has found its application in complex contexts, thanks now to its small size and its ability to cover, in many cases, large distances between 100 m and 300 m (FARO Focus 3D 120, Faro Company, Lake Mary, FL, USA). In recent activities in Jordan, the goal has been to link photogrammetric surveys with laser data, which is more accurate, and from which metric data, useful for scaling photogrammetric numeric models, can be obtained. In some cases, such as the Palace Tomb at Petra, the integration of the two systems was essential given the size of the monument. As is well known, the laser for each image has its own projection center from which shadows are cast, especially those from the architectural moldings. Photogrammetric systems do not have a specific projection center, but thanks to the use of a helium balloon, it was possible to map the non-visible parts to obtain a comprehensive and accurate representation of one of the most important monuments of Petra.

3. Results

Over the years, seven archaeological sites have been explored: the Neolithic site of Basta, the Nabataean tombs of Petra (Treasury Tomb and Palace Tomb), the Roman fortification of Um-Hamat in Karak, the Tower of Stilita, the Church of Bishop Sergius and the Church of Saint Stephen in Umm ar-Rasas, the Crusader castle of Wu’Ayra, the Crusader castle of Shawbak, and the Archaeological Park West in Madaba. The sites are very heterogeneous in terms of their dating (from the Neolithic to the Mediaeval period), type of site (necropolis, castles, churches, towers, or fortresses), and the geological and environmental context. In each case, the investigations were carried out in the vicinity of known archaeological structures. In the following subsections, the sites are arranged in a chronological order, from the oldest to the most recent, and for each of them a brief historical archaeological description is provided which precedes the presentation of the results.

3.1. Basta

3.1.1. Archaeological Background

Basta is located in Ma’an governorate, 36 km southeast of Petra. Geologically, it is located in the transition zone characterized by the presence of limestone, dolomite, and marl formations to the west, and bituminous limestones, marls, calcareous marls, and bituminous calcareous marls to the east. In the Basta archaeological area, Late Cretaceous limestones, sandy limestones, and dolomites form the bedrock. Between 1986 and 1992, three areas with an extension of 860 m2 were excavated, although the size of the site is estimated at about 10 ha. The finds belong to the Pre-Pottery Neolithic B (LPPNB) (7500–7000 BC), as evidenced by the radiocarbon dating method. The houses at Basta were built of limestone and the floors were made of wood derived from the native trees of the area or imported from nearby regions [3,77] (Figure 2).
The natural slope of the land was levelled by the construction of large terraces on which the buildings were erected. No cemeteries were found, but individual graves were found in the houses under the floors to remind future generations of the relationship of families and individuals to their houses. The tools found were made of limestone, flint, and bone, as this group of people lived before the discovery of pottery. The population practiced agriculture, raised animals, and exchanged their goods with the population in the same region. The decline of the city occurred in 5.000 BC, probably due to the shortage of widely exploited natural resources and an earthquake [77].
The houses excavated so far and visible today have an irregular geometry with partially non-orthogonal walls and non-parallel buildings.

3.1.2. Results and Discussion
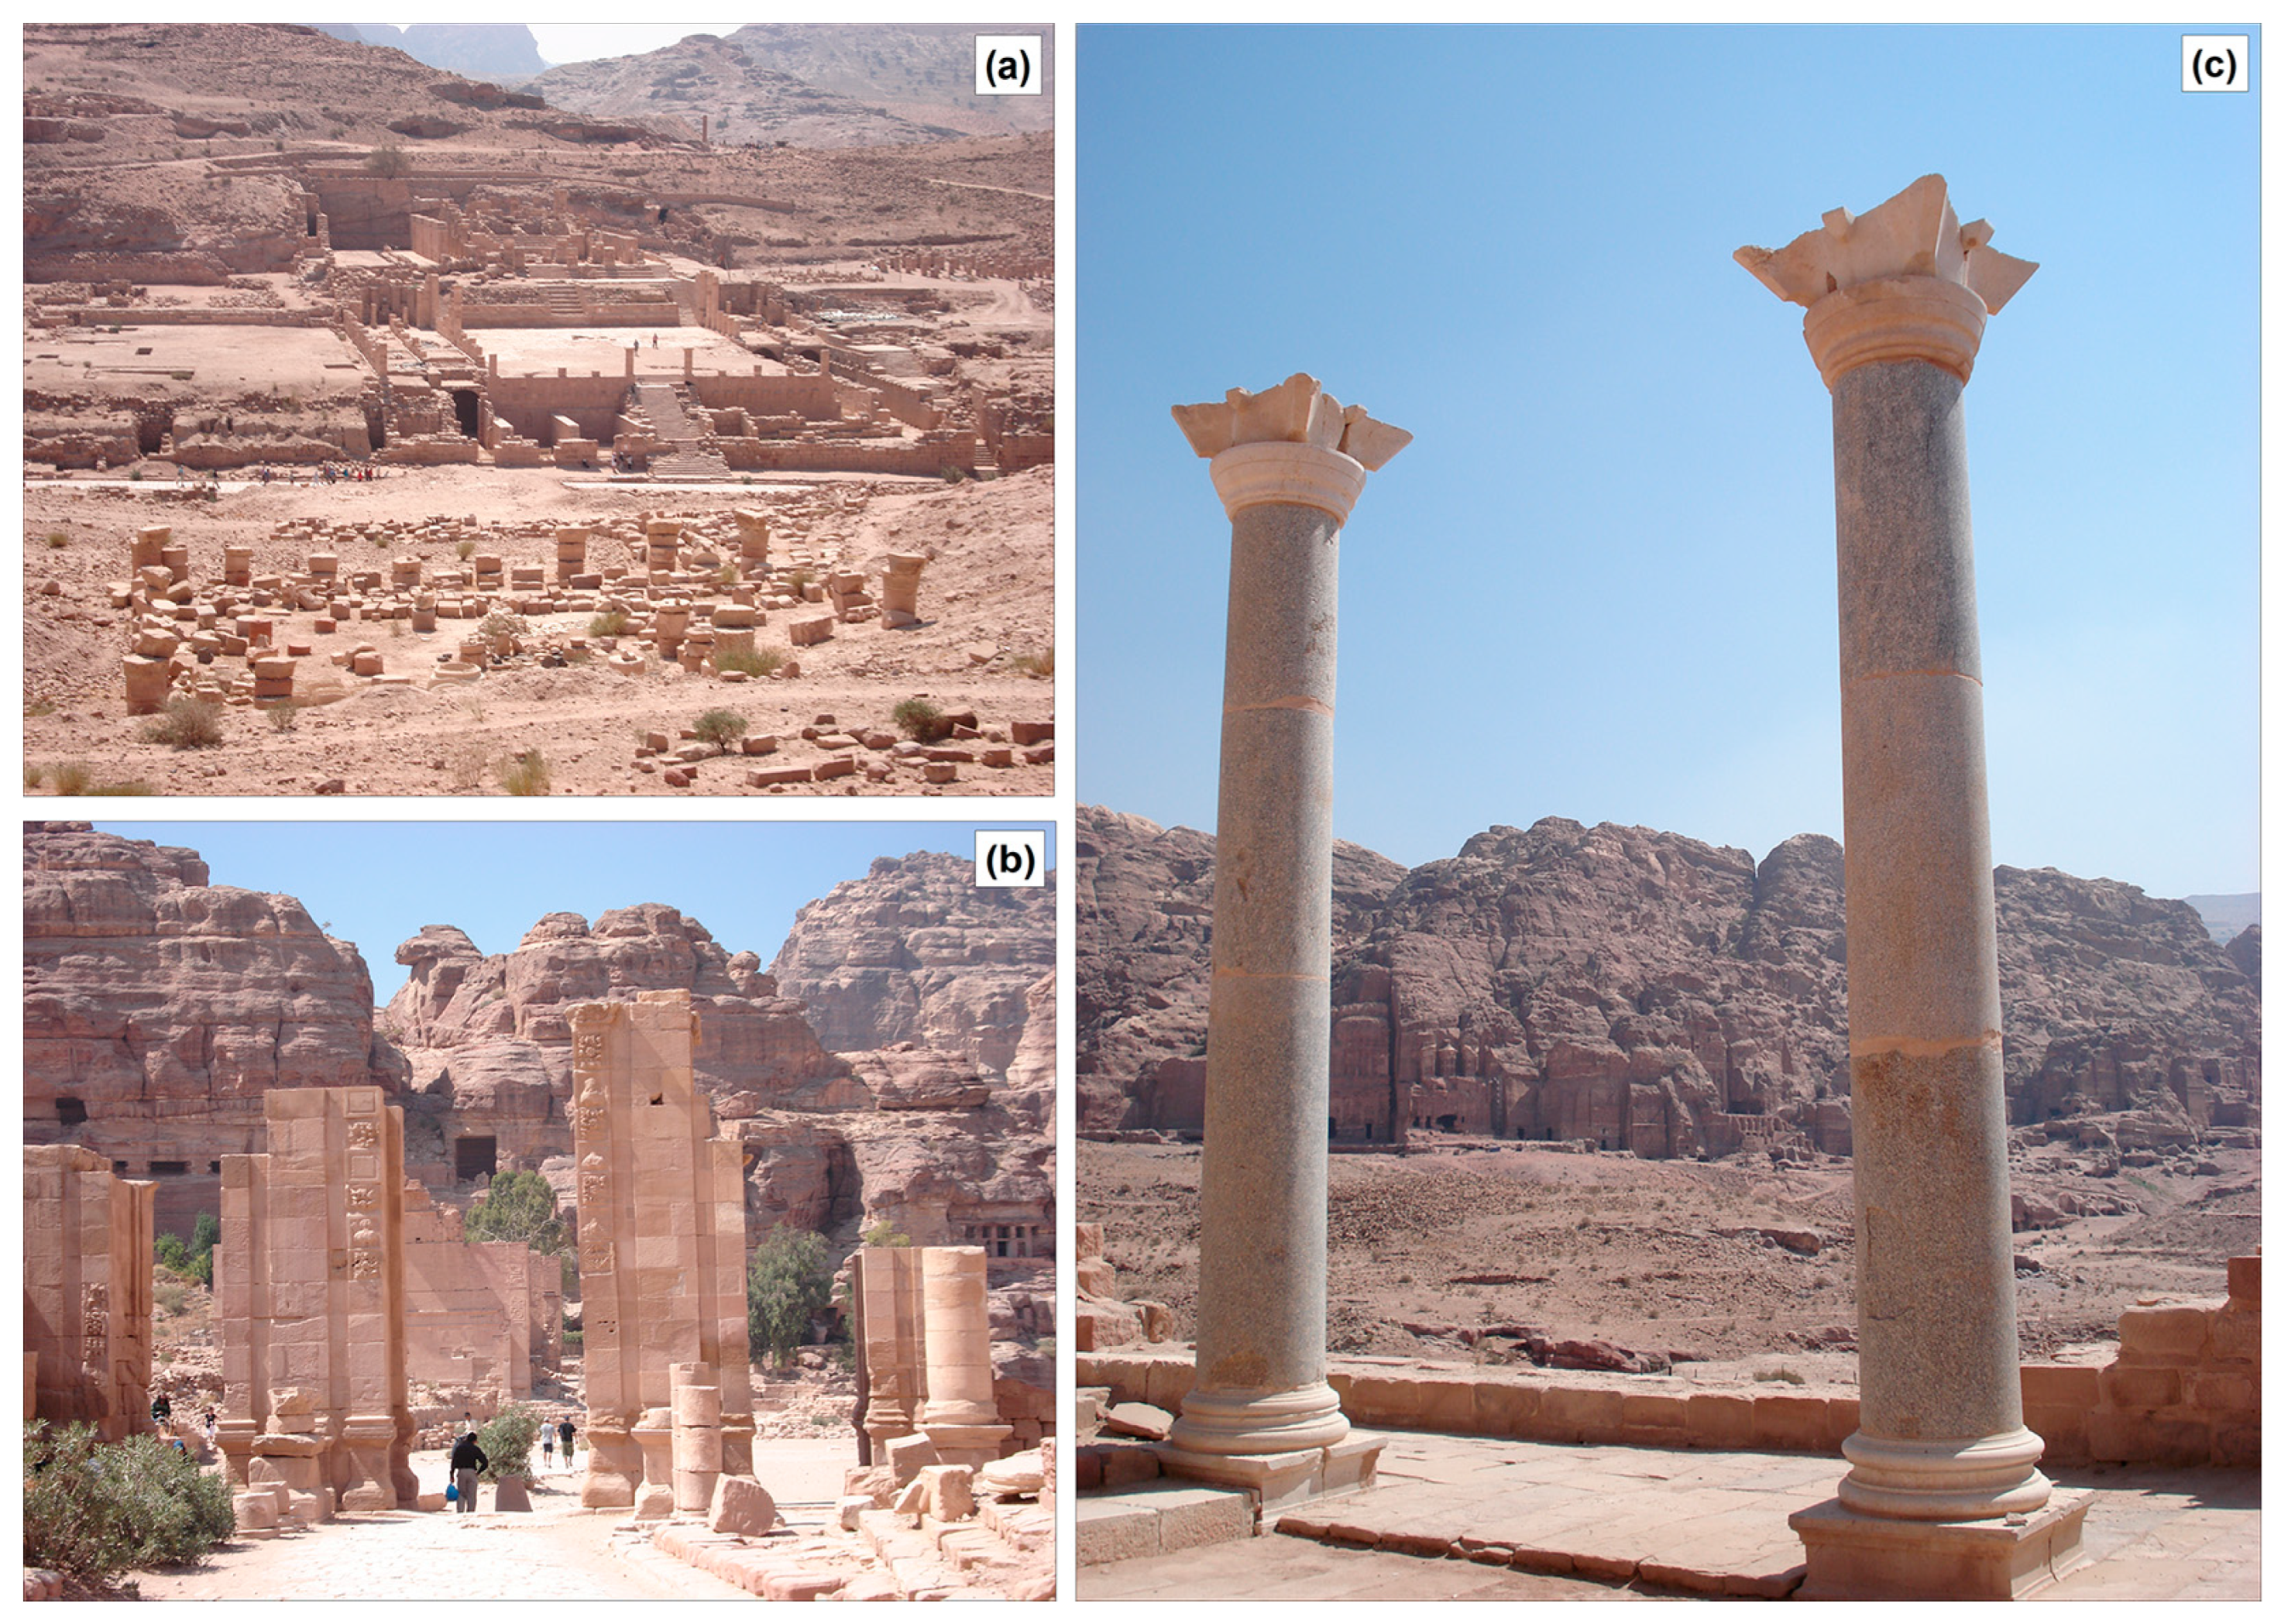
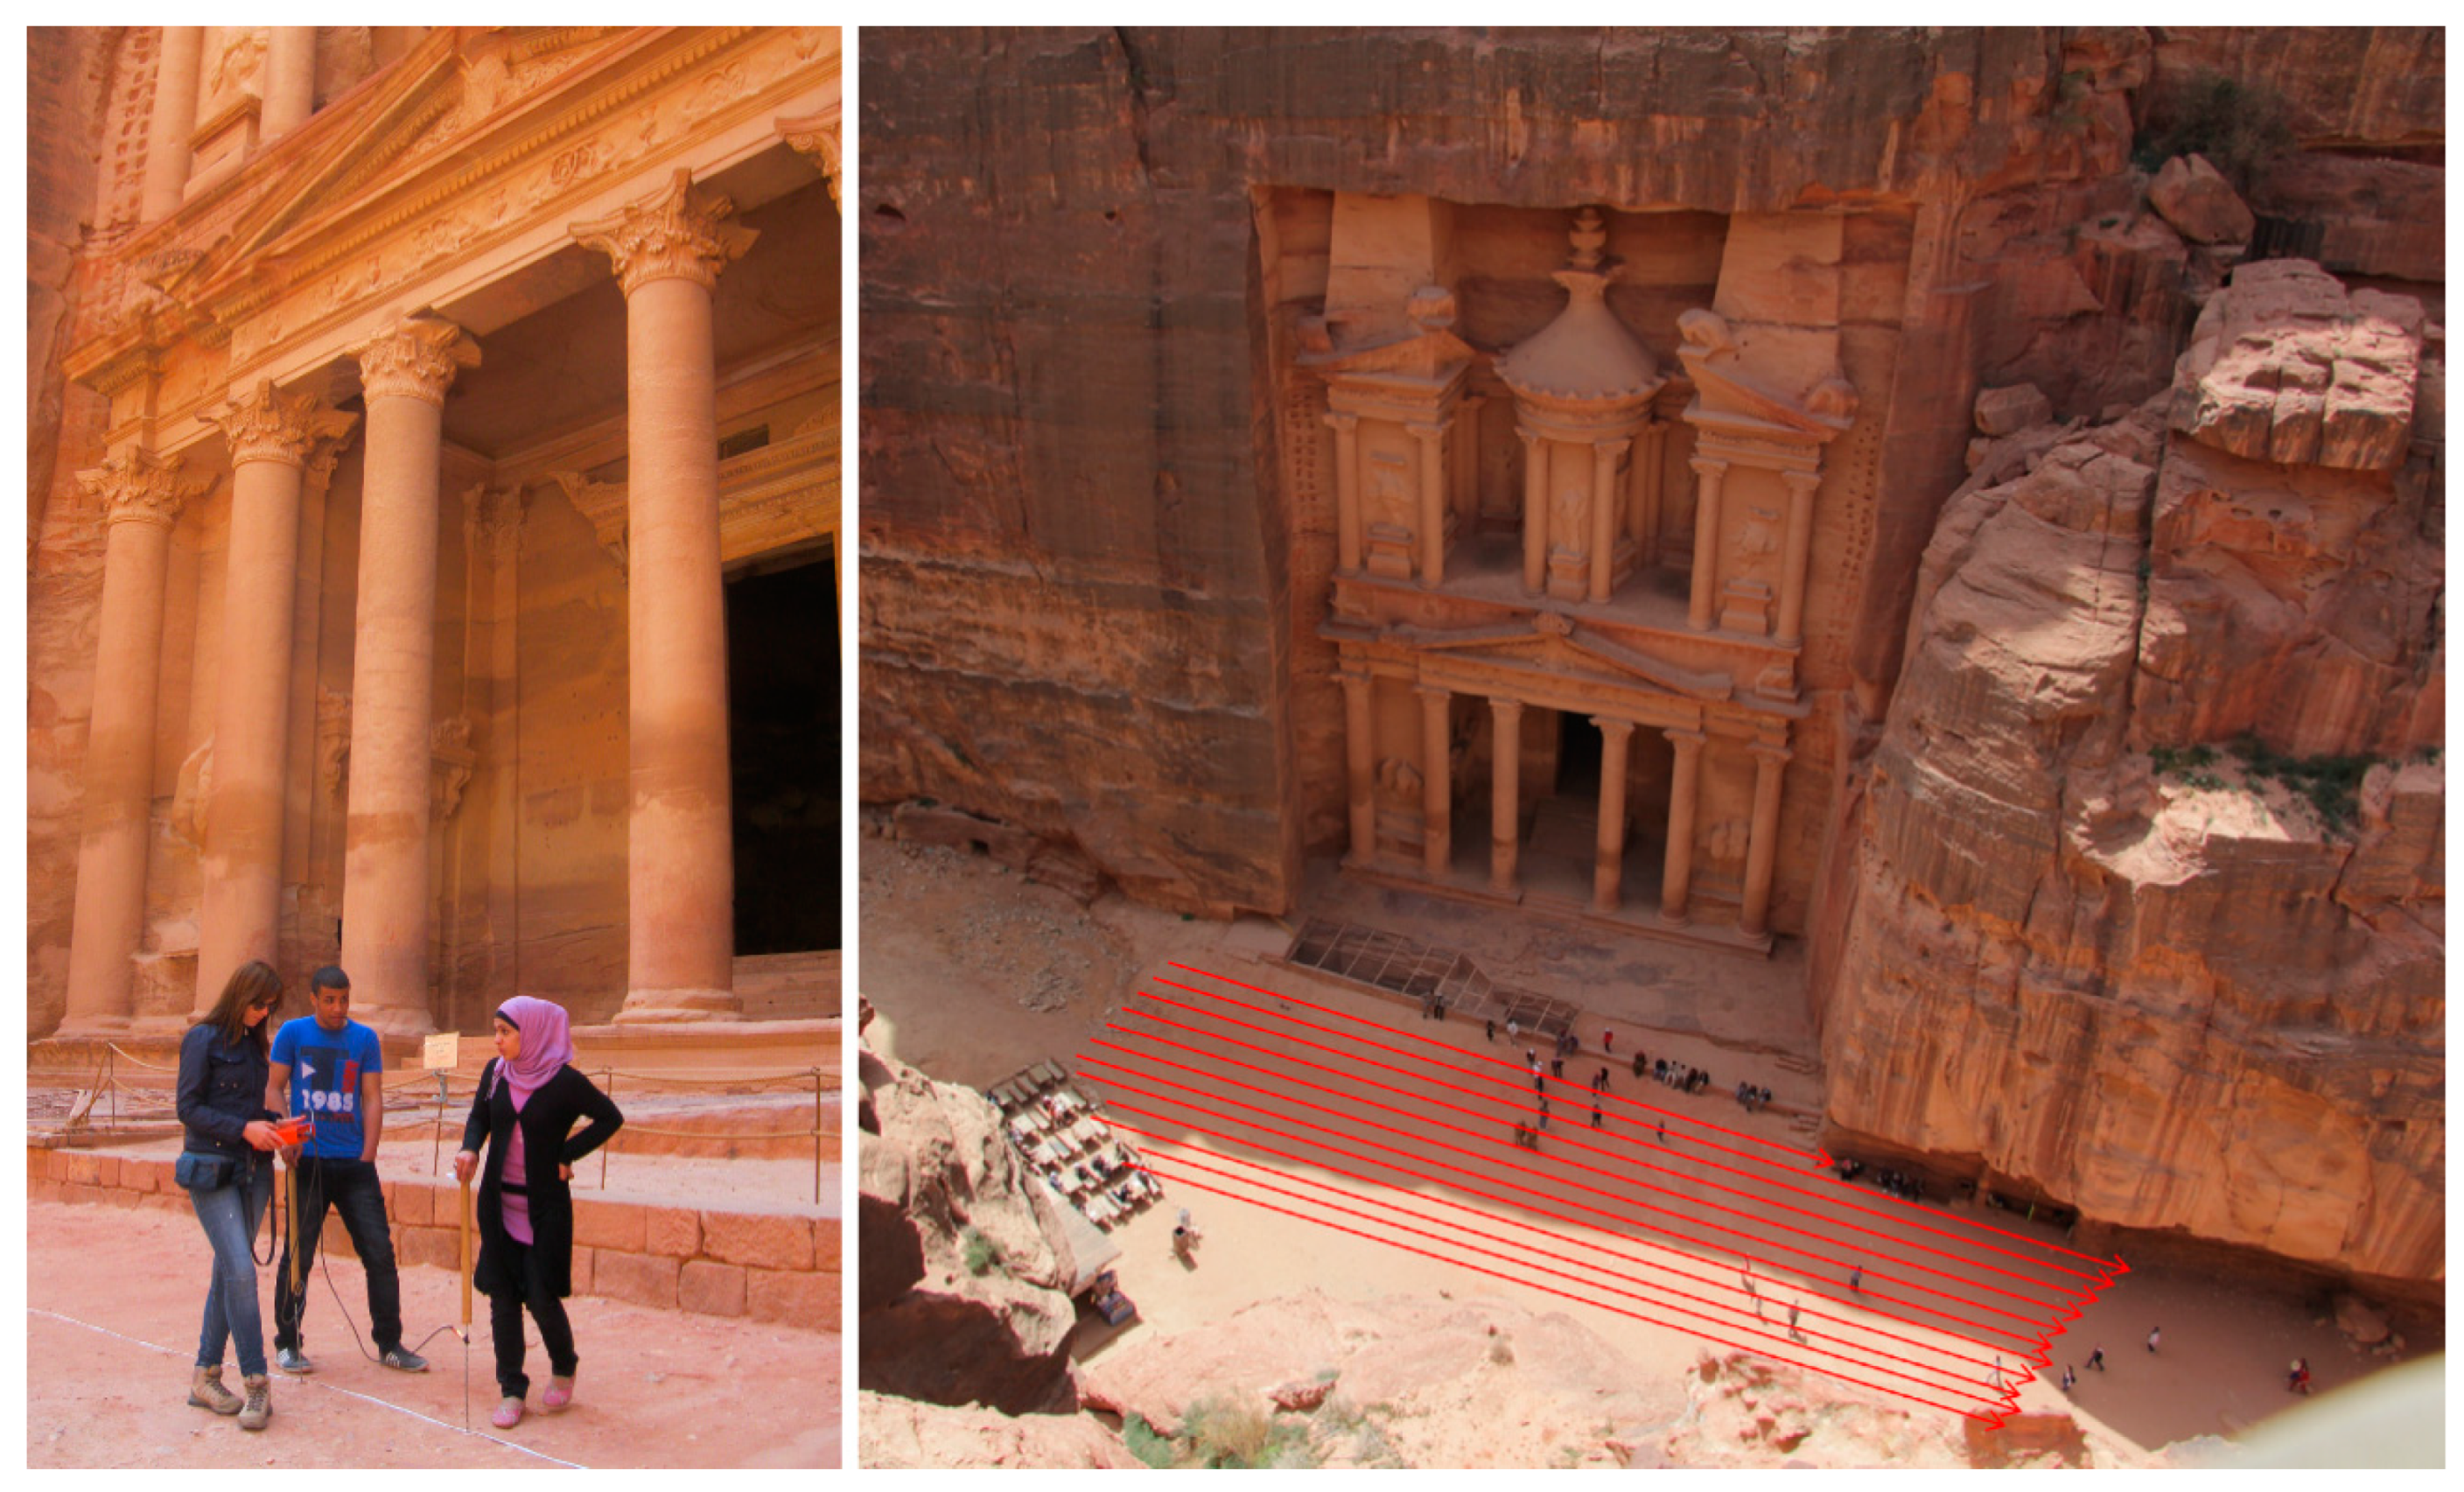
In 2016, GPR surveys were conducted south of the excavation area in collaboration with Al-Hussein Bin Talal University of Ma’an. The survey revealed a distribution of amplitude maxima of the electromagnetic signal that is consistent with what has already been brought to light. Figure 3a shows the GPR slice relative to 0.2–0.5 m in depth using a color scale that highlights high amplitude values that could be due to buried remains. Figure 3b traces the interpretation lines of the anomalies to facilitate the reading of the results. The orientation of the walls follows different diagonals and different living spaces may be buried underground. Of note is the distribution of maximum amplitudes in the band adjacent to the southern limit of the excavation site in continuation with the structures already studied and visible. Moreover, the imaginary geometries in the southernmost part of the investigated field are rotated by about 45 degrees towards the northwest. The reason for this irregularity could be a change in the settlement layout at this location or the presence of archaeological structures belonging to two different chronological phases. Direct excavation work at the sites in question may provide more details about the nature of the geophysical anomalies found.

3.2. Petra

3.2.1. Archaeological Background

Petra is located on the left edge of the Rift Valley in central and southern Jordan. The rediscovery of Petra took place in 1812, when the city was visited by the Swiss geographer J.L. Burckhardt, who, on his journey from Syria to the south, passed through Amman towards the territory of Edom and then arrived at the village of Elji near Petra in Jordan. The city of Petra has experienced a series of phases of occupation over a very long period. The first evidence of human presence dates back to the Neolithic period (X–VIII century BC) in the site of Beidha, not far from Petra. After that, during the Edomite and Nabataean phases (VIII–VII century BC), there was a period of the highest artistic and technical expression of the center, which lasted until the Hellenistic age, which is also when the first relations with Rome began. After the annexation to the Roman Empire in 106 AD, Petra became one of the most important cities of the Limes Arabicus. It has been recorded that the spread of Christianity occurred in the city during the Byzantine period (IV century AD). In this period, pre-existing structures were transformed into places of worship. From this period, there has been a continuity in the life of the structures (Islamic period), under the dynasties of the Umayyads, from 661 AD, and then the Abbasids and Fatimids. During the occupation of Transjordan by the Crusaders under the king of Jerusa, Baldwin I (1100–1118 AD), a new territorial system was created, characterized by the construction of castles. The Crusaders’ conquest threatened the caravan traffic and especially the access routes to the Islamic cities to such an extent that the Muslim princes (Salah al-Din) had to attack the main Crusader castles and finally conquered them in 1187. Under the subsequent Ayyubid dynasty, it is likely that Petra was finally abandoned to decay [1].
Today, Petra is a place of immense wealth for its unique cultural and natural heritage, so much so that UNESCO declared it a World Heritage Site in 1985. Figure 4 shows the location of the main archaeological findings within the archaeological park.
The site contains numerous Nabataean tombs, all of which are carved into the rock and whose preservation is threatened by weathering. Starting from the rest house, east of the archaeological area, along the ancient riverbed flanked by increasingly narrow sandstone terraces, the first monuments appear, the Jinn Blocks (1 in Figure 4), three square towers carved into the rock. Further on the left is the Obelisk Tomb (2 in Figure 4), characterized by four pyramid-shaped obelisks at the top and a central chamber surmounted by a pediment at the bottom. After a few hundred meters, one reaches the entrance to the gorge, the Siq (7 in Figure 4), which is about 2 km long and has extraordinary reddish and yellowish sandstone rocks. Noteworthy are the channels dug in the rock at a height of about 2 m to channel rainwater. At the end of the path appears the majestic facade of the Treasure Tomb (8 in Figure 4, Figure 5a). On the right side, the ravine widens, and one can see the Tomb of the 17 Tombs (10 in Figure 4), which consists of 14 floor tombs and 3 tombs in the inner hall. These are followed by numerous monuments in the same style, such as the Urn Tomb, the Uneishu Tomb, the Nabataean Tombs, the Silk Tomb, the Palace Tomb (Figure 5b), and the Corinthian Tomb (Figure 5b) (19–24 in Figure 4). On the left side is the 1st century BC theatre consisting of 33 tiers (12 in Figure 4). North of it, the so-called Lower City (Figure 6a) develops, where Roman urban development was concentrated, as evidenced by monuments such as the Nymphaeum, the Temple of the Winged Lions, the Great Temple, the Monumental Gate (Figure 6b), and the Via Colonnata (Figure 6c) (13–17 in Figure 4). To the southwest, other tombs include the Lion Monument, the Tomb of the Roman Soldier, the Triclinium, and the Tombs of Wadi Nmeir (33, 35–37 in Figure 4). To the northwest, in another narrow ravine, in a peripheral location, is the Deir or Monastery, characterized by architecture similar to that of the Treasury Tomb (47 in Figure 4, Figure 5c).
Water has always played an important role in Petra. In ancient times it was a necessity and a primary source for the social and economic development of the area, but it also had a cultural significance related to the deities associated with it, which were revered and represented as objects of worship. Today, as then, water represents a source of danger, as rivers become scarce and extreme meteorological phenomena cause devastating damage in the region. In ancient times, the water resource was managed through technical-artistic architectural and hydraulic solutions for its extraction, storage, and distribution. The rocks that made Petra one of the most beautiful caravan cities of the Ancient Near East are today, together with the water, the main element causing the deterioration of the city itself. Recent studies [78] have highlighted the main causes of the decline of the monuments. These include expansion and contraction phenomena caused by strong daily temperature variations, heavy rainfall, and water washouts that contribute significantly to the removal of surface material, wind erosion confined to certain areas, and the presence of some salts that exacerbate the degradation processes. Thundershowers, although not very frequent, nevertheless lead to the phenomenon of flash floods, i.e., sudden floods with torrential water masses.
One of the most important phases was the phase related to the analysis of the state of conservation of the main Nabataean tombs, using modern data collection techniques based on a protocol aimed at advanced graphic representation. For this purpose, a methodological line was followed based on a multidisciplinarity of competences (geology, archaeology, physics, geophysics, topography, and informatics). Here are presented the activities carried out on the Treasure Tomb and the Palace Tomb.
The facade of the building of the Treasure Tomb is about 40 m high and 30 m wide and has a very ornate double Corinthian order. The lower part consists of a six-columned pronaos crowned by a triangular pediment; in the two lateral blind intermediate columns, there are some unreadable reliefs. The upper part, on the other hand, consists of a central circular temple with a conical cover, flanked by two side wings that take up the lower blind intermediate columns and are finished with a half-front.
The Palace Tomb is part of the royal tombs that look directly on the city of Basin. Although it is mutilated in the upper part, it is considered the most monumental part of the city. The structure is of extreme formal complexity and owes its name to the fact that it was believed to imitate the architecture of the great Hellenistic-Roman palaces.
The only thing that is certain is that its appearance is different from all other Nabataean rock structures and that it is unique, since it was built using two different construction techniques: the excavation and carving of the rock wall and the construction of the part with the square blocks on top of the monument.

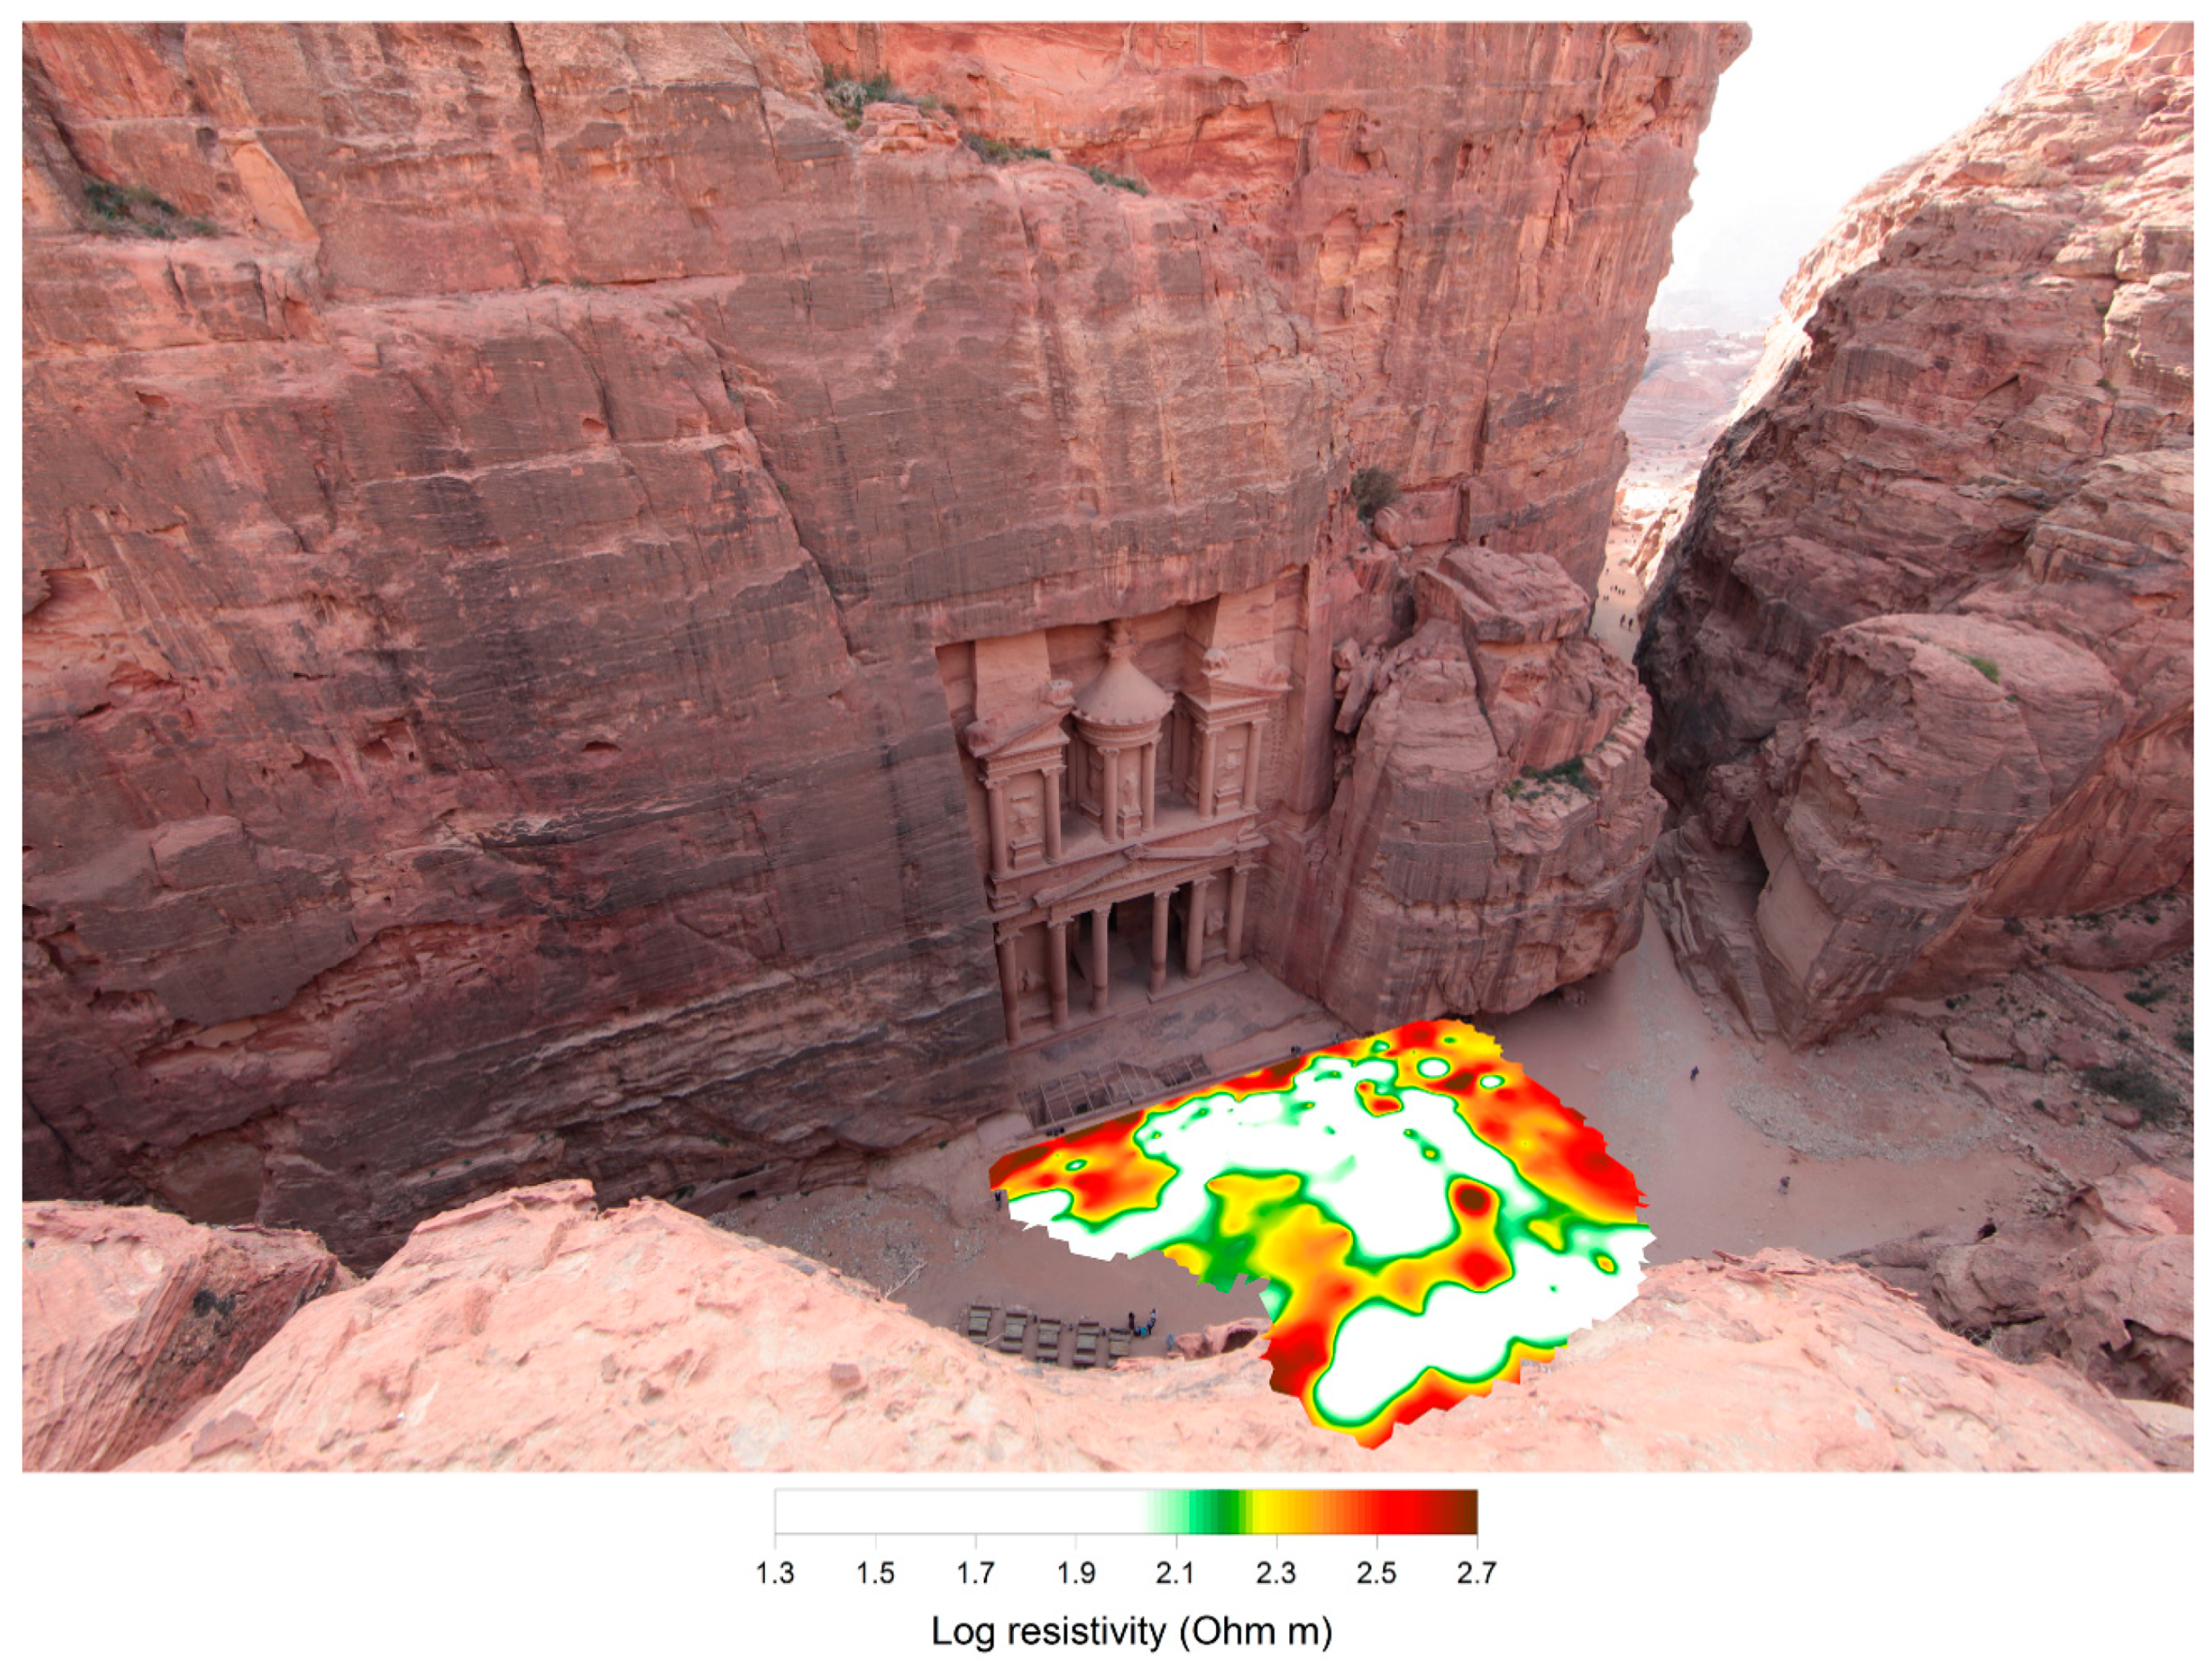
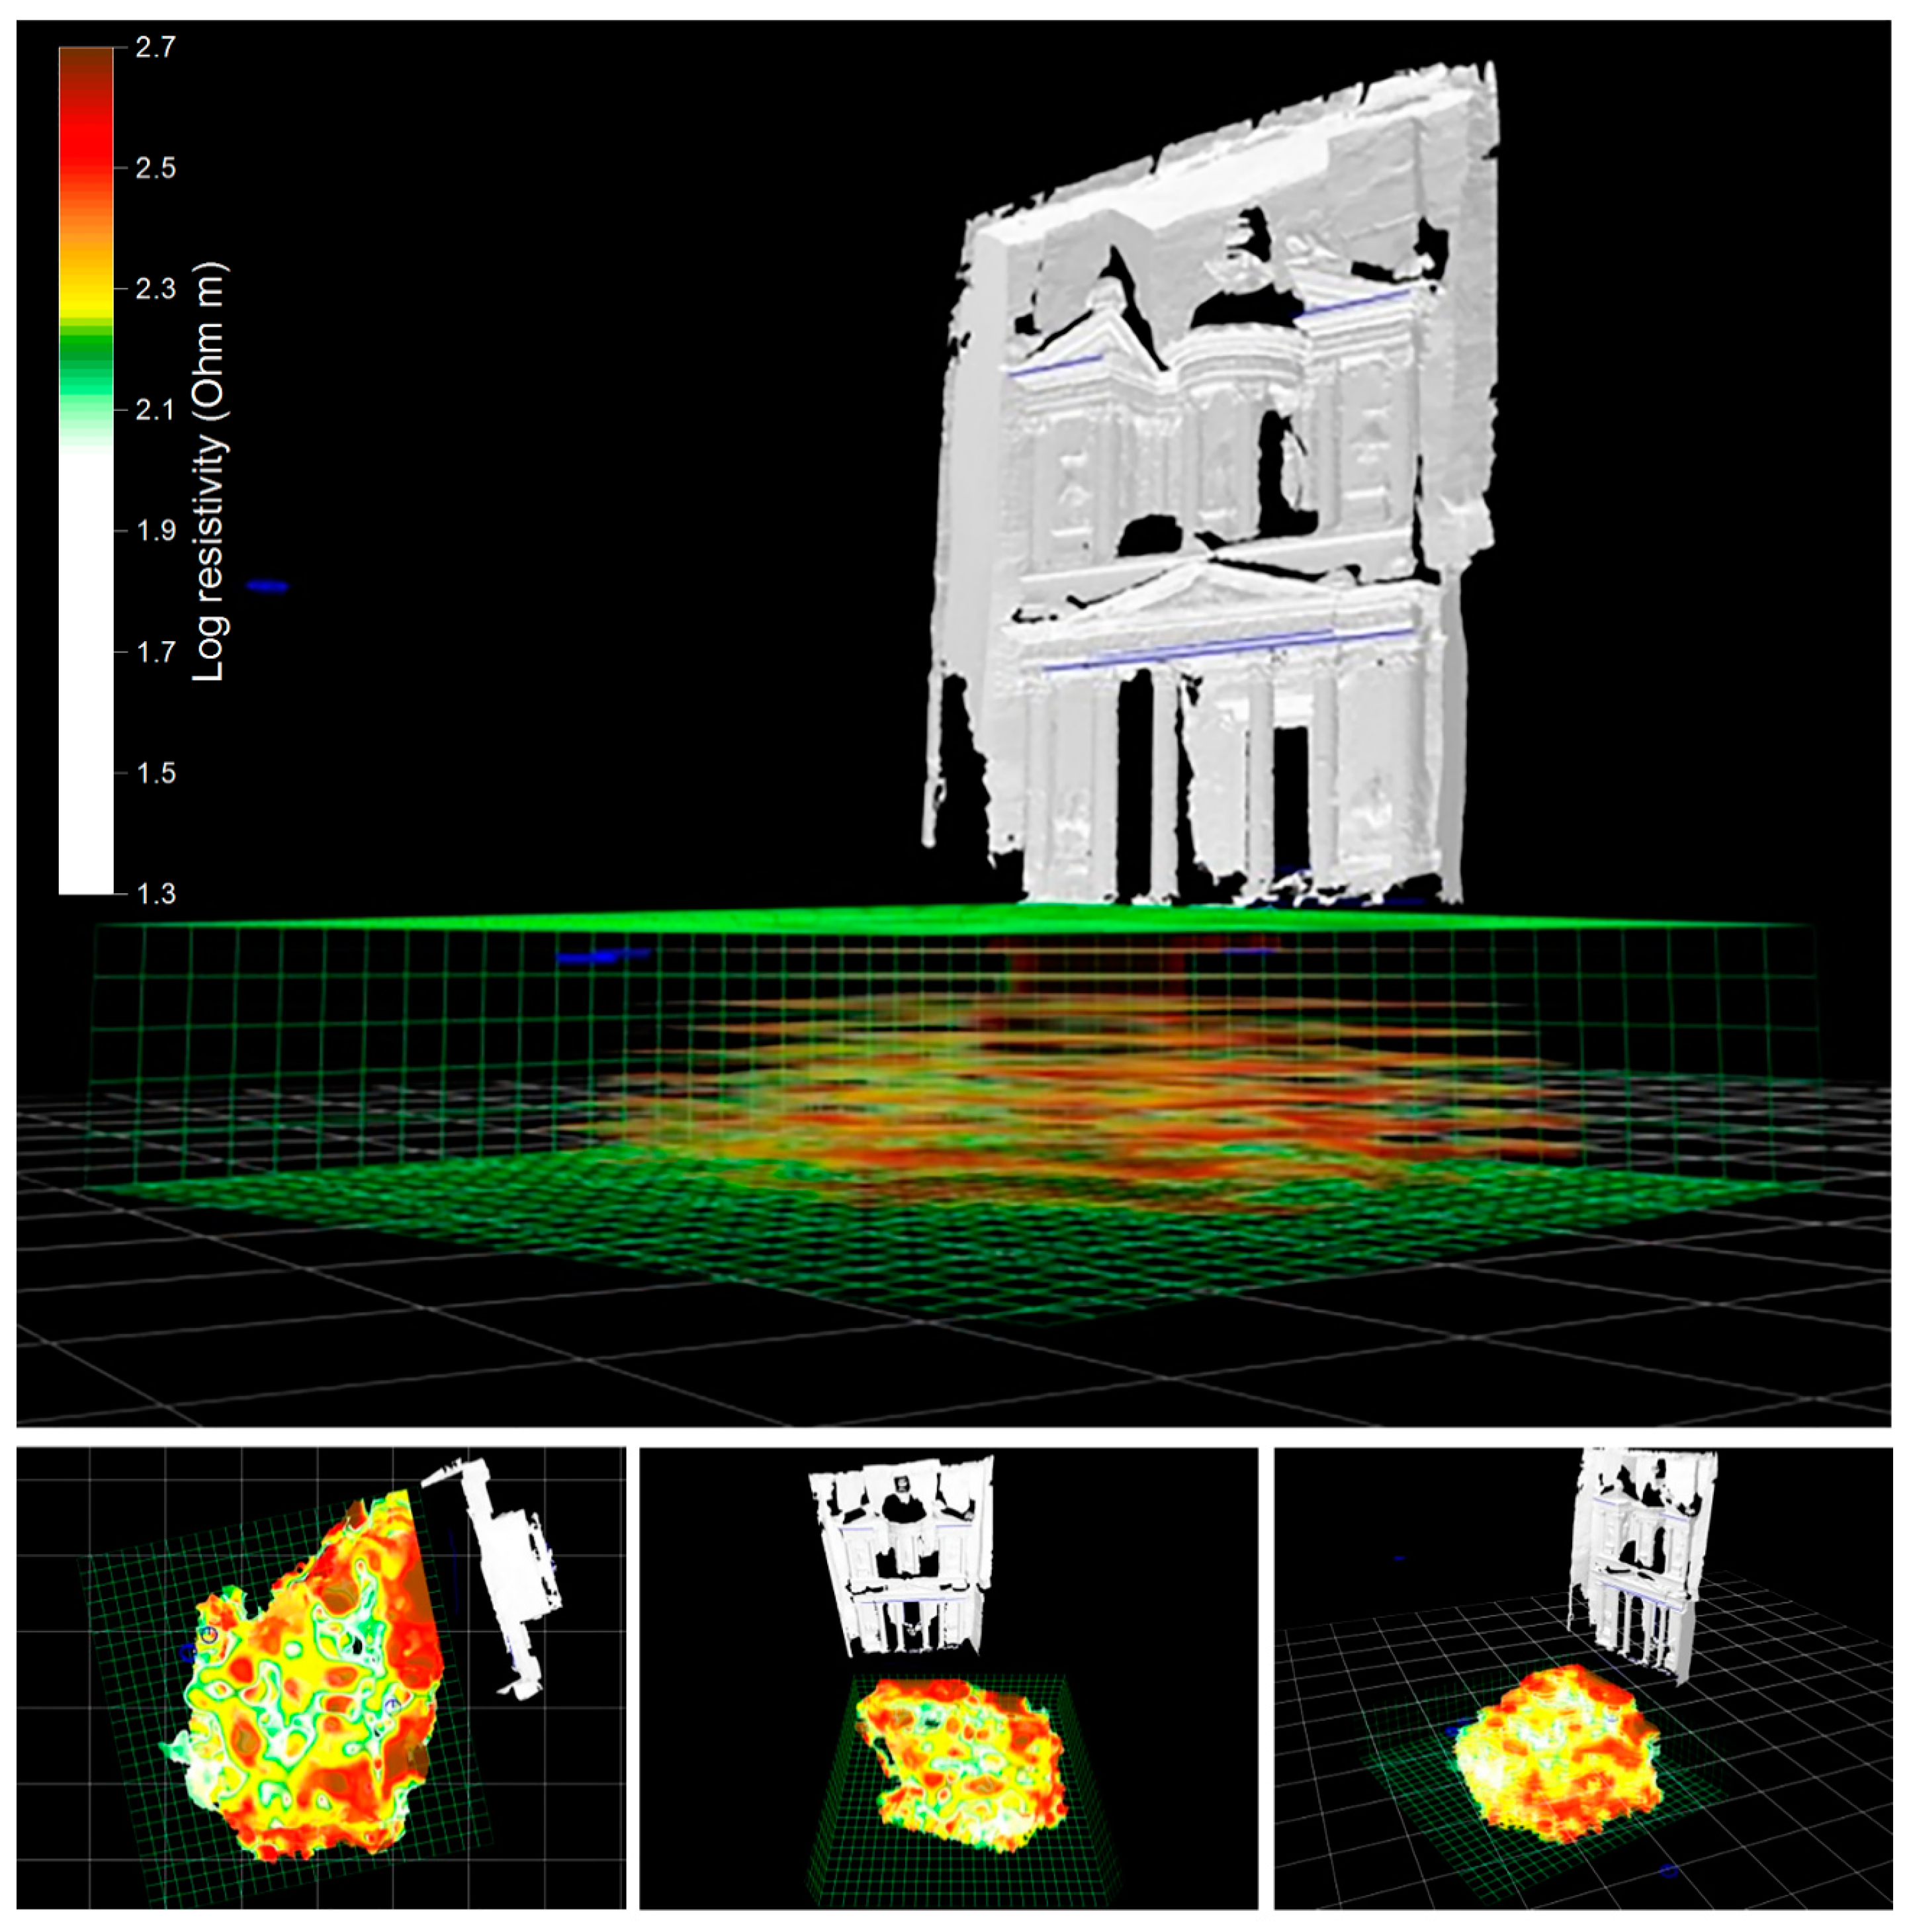
3.2.2. Results and Discussion: The Treasure Tomb

The knowledge and the new discoveries of this extraordinary World Heritage Site require different and more accurate information. A comprehensive knowledge of the site is required, not only to provide accurate documentation, but also to allow for an analysis at different levels for each contribution. In this framework, the task was to put the geophysical prospection that is useful for the subsurface investigation in a 3D context and relate it to the historical structures around the site.
Therefore, as a first step, in 2012 ERT surveys were conducted [79]. Therefore, an area of approximately 35 × 50 m2 was laid out in the square in front of the tomb. A total of 35 parallel dipole-dipole profiles were arranged, keeping a distance of 1 m, and in some cases 1.5 m, from each other (Figure 7). Along each profile, the dipoles were moved in increments of 1 m, up to a maximum pseudo-depth of 9 m. The surveyed area is characterized by good contrasts in resistivity values, representing high resistivity values with defined geometric shapes and interesting alignments consistent with the archaeological evidence. The color scale used in the processed images was chosen to show only the most important values of average resistivity. In particular, the horizontal section with a depth of 6 m shows resistivity anomalies (in shades of red) of regular shape that, starting from the base of the Treasure Tomb, develop vertically into the front square and include a zone of low resistivity (blank) (Figure 8). This figure could indicate the presence of other structures on the sides and in front of the monument and an internal clearing to them.
In addition, ERT results were integrated with 3D models of the visible heritage. To this end, a strip of photogrammetric images captured outside the tomb was processed using the SfM method [80,81]. The input images were taken from the same viewpoints to obtain a set of panoramic photographs with equal-angle projections. The SfM approach allowed the recovery of a good 3D reconstruction of the objects visible in multiple images through automated operations: image matching, camera calibration, and the creation of a dense point cloud. The 3D model of the Treasure Tomb was combined with the 3D geophysical reconstruction of the buried structures, as shown in Figure 9.
To obtain better resolution of the data, a laser scanning survey was conducted from different angles outside and inside the Treasure Tomb (Figure 10a). The individual scans were connected using reference targets and natural points acquired by a topographic survey with the total station. This method is a quick and easy tool to capture millions of colored points in a short time, which can describe the studied object in detail.
The survey, performed with a different resolution of the scanning grid, resulted in 30 ground level scans of the square in front of the tomb. Additional scans were conducted at different levels of the rock complex in front of the tomb to complete the data collection in relation to the higher part of the monument. In Figure 10b, data processing of a single scan is shown as an example (raw data are displayed in reflectance). A laser scanner acquisition was also tested during the night to check the quality of the device and to avoid the presence of tourists. Figure 11 shows the reflection orthophoto of the tomb created with data taken at night, a time when light and shadow do not affect the result.
Other important scanner data came from the acquisition of the interior of the tomb (14 scans) to complete the 3D model with the different interior spaces. Finally, some of the detailed parts of the tomb were examined. Each scan was pre-processed and merged to obtain a 3D model without gaps, and in this way, some information in the form of planar cross-sections was obtained to study the building structures, improve the knowledge of the technical construction, and gain new knowledge for restoration (Figure 12).
Figure 13 shows some snapshots of the 3D model of the Treasure Tomb inside. The images show details of the numerous fractures present and are a representation of the current state of preservation, which will be monitored over time.

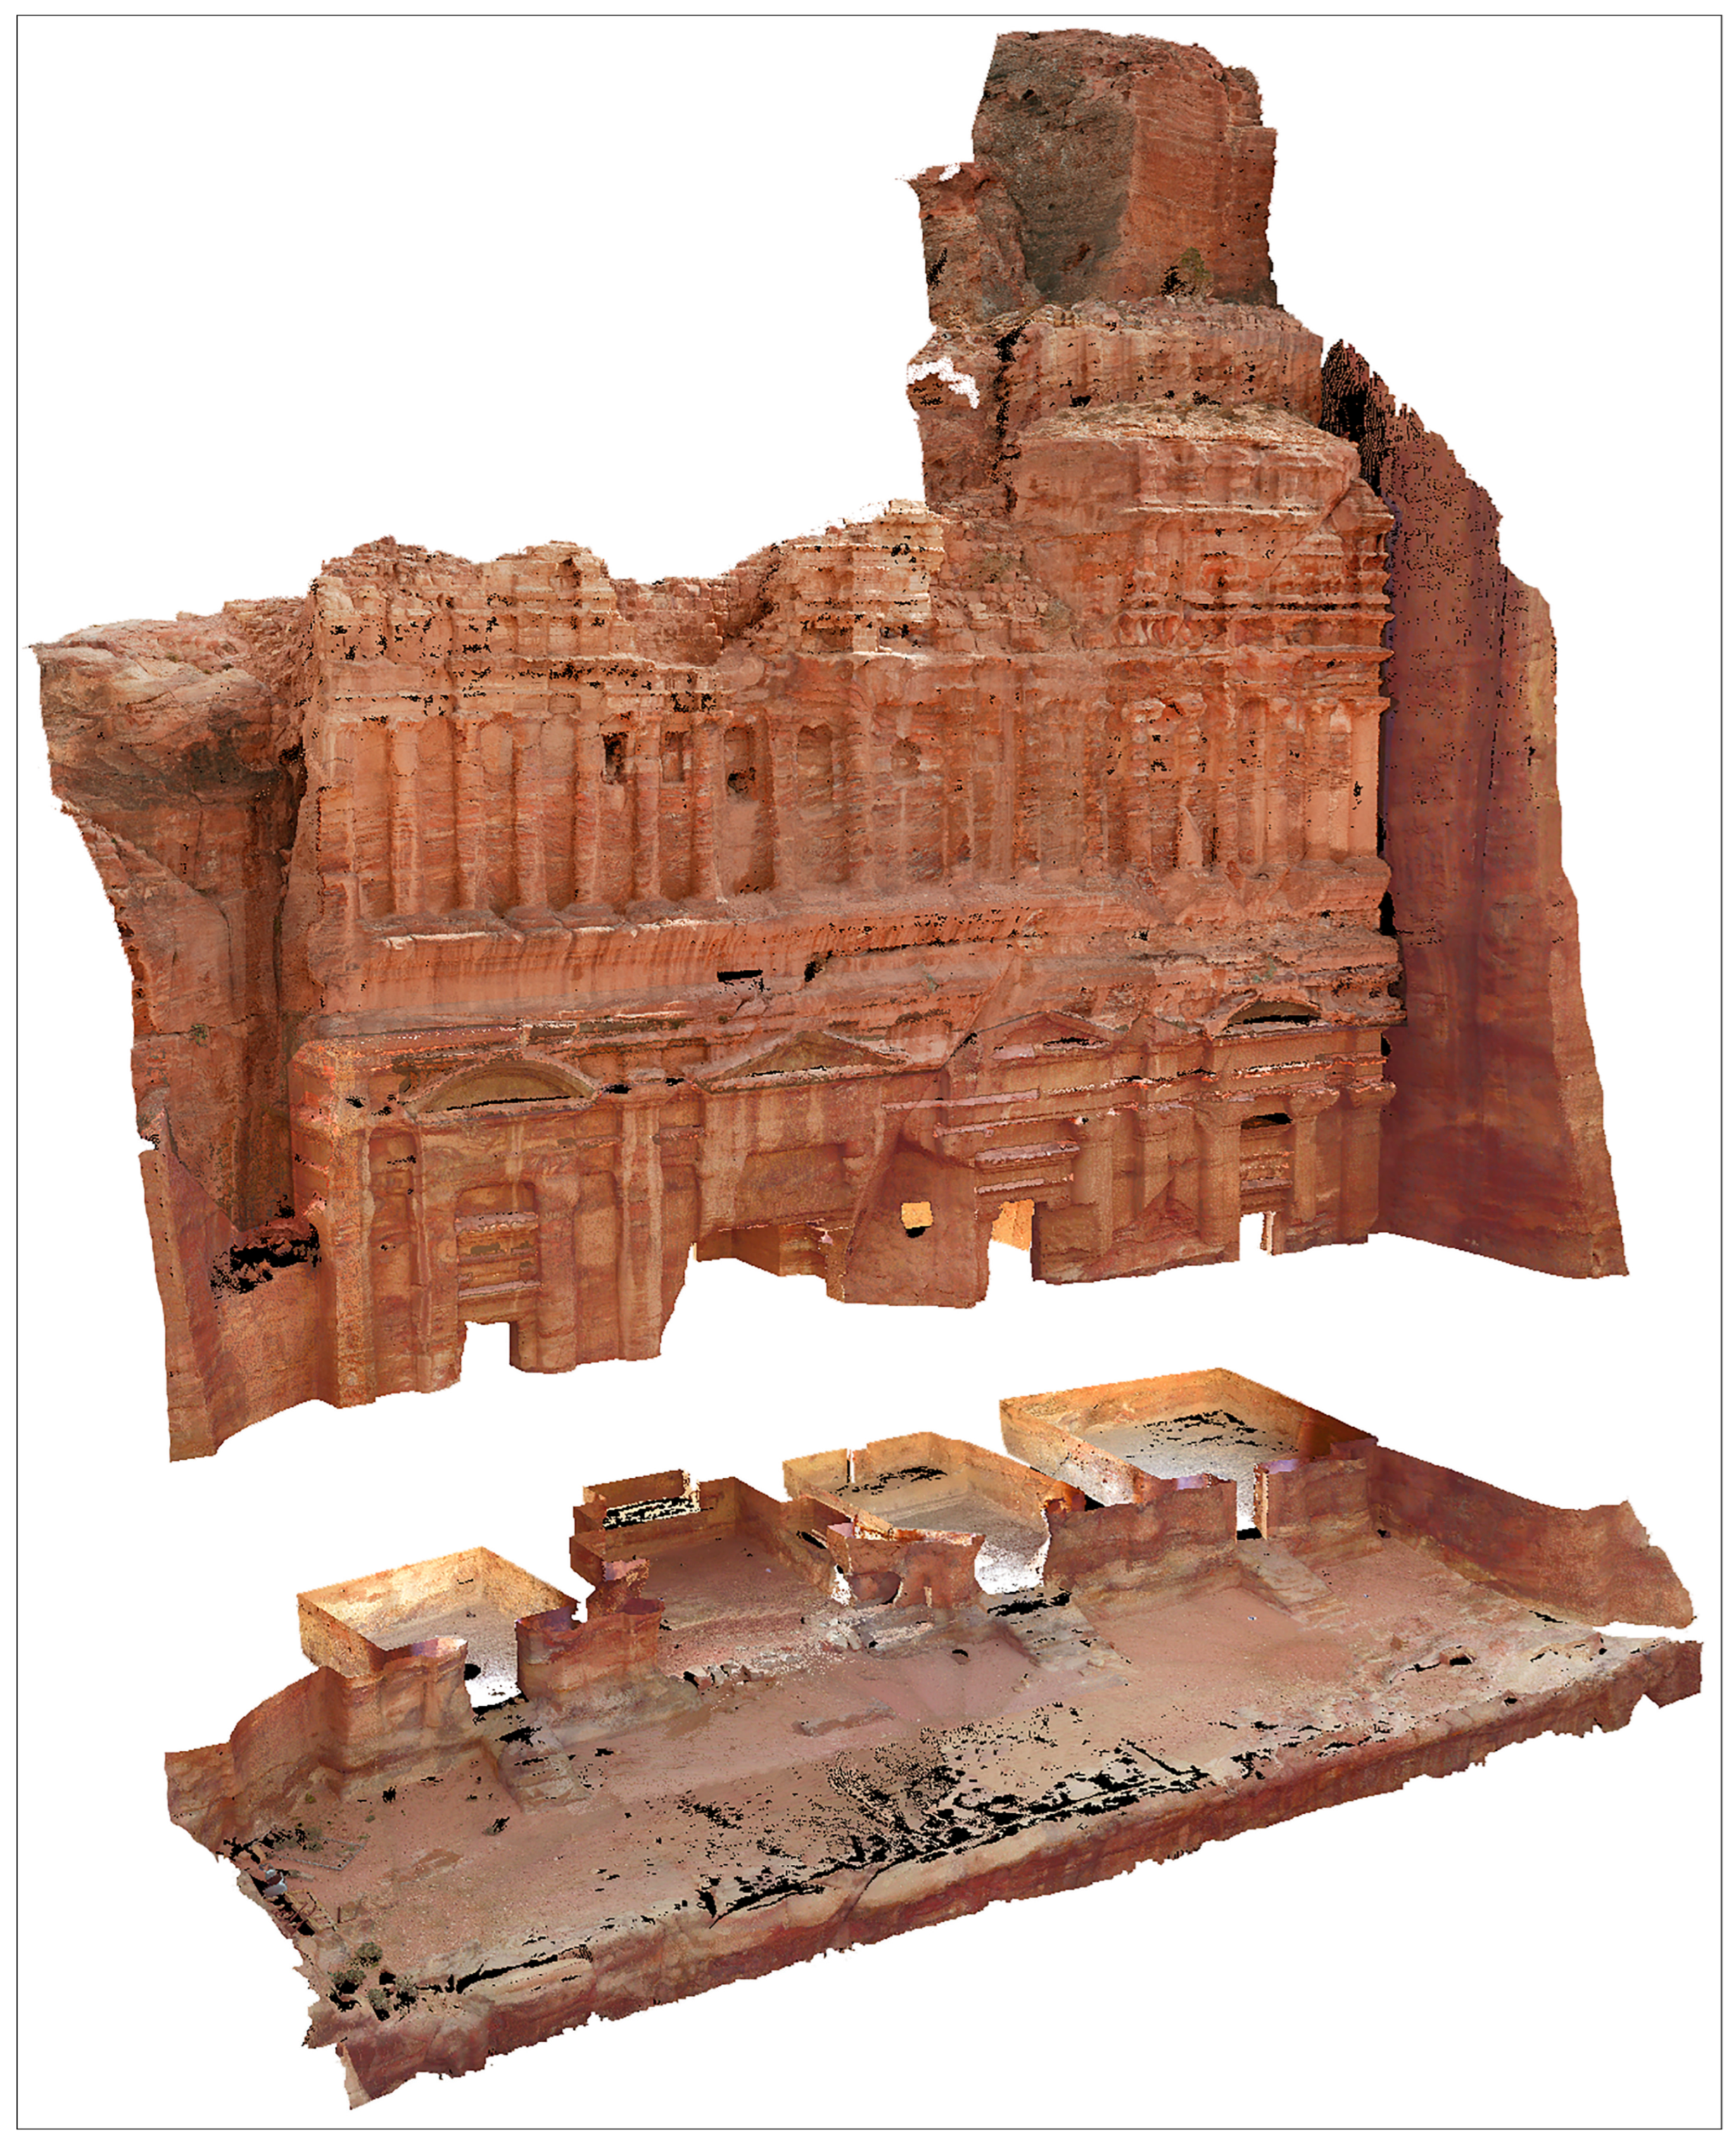
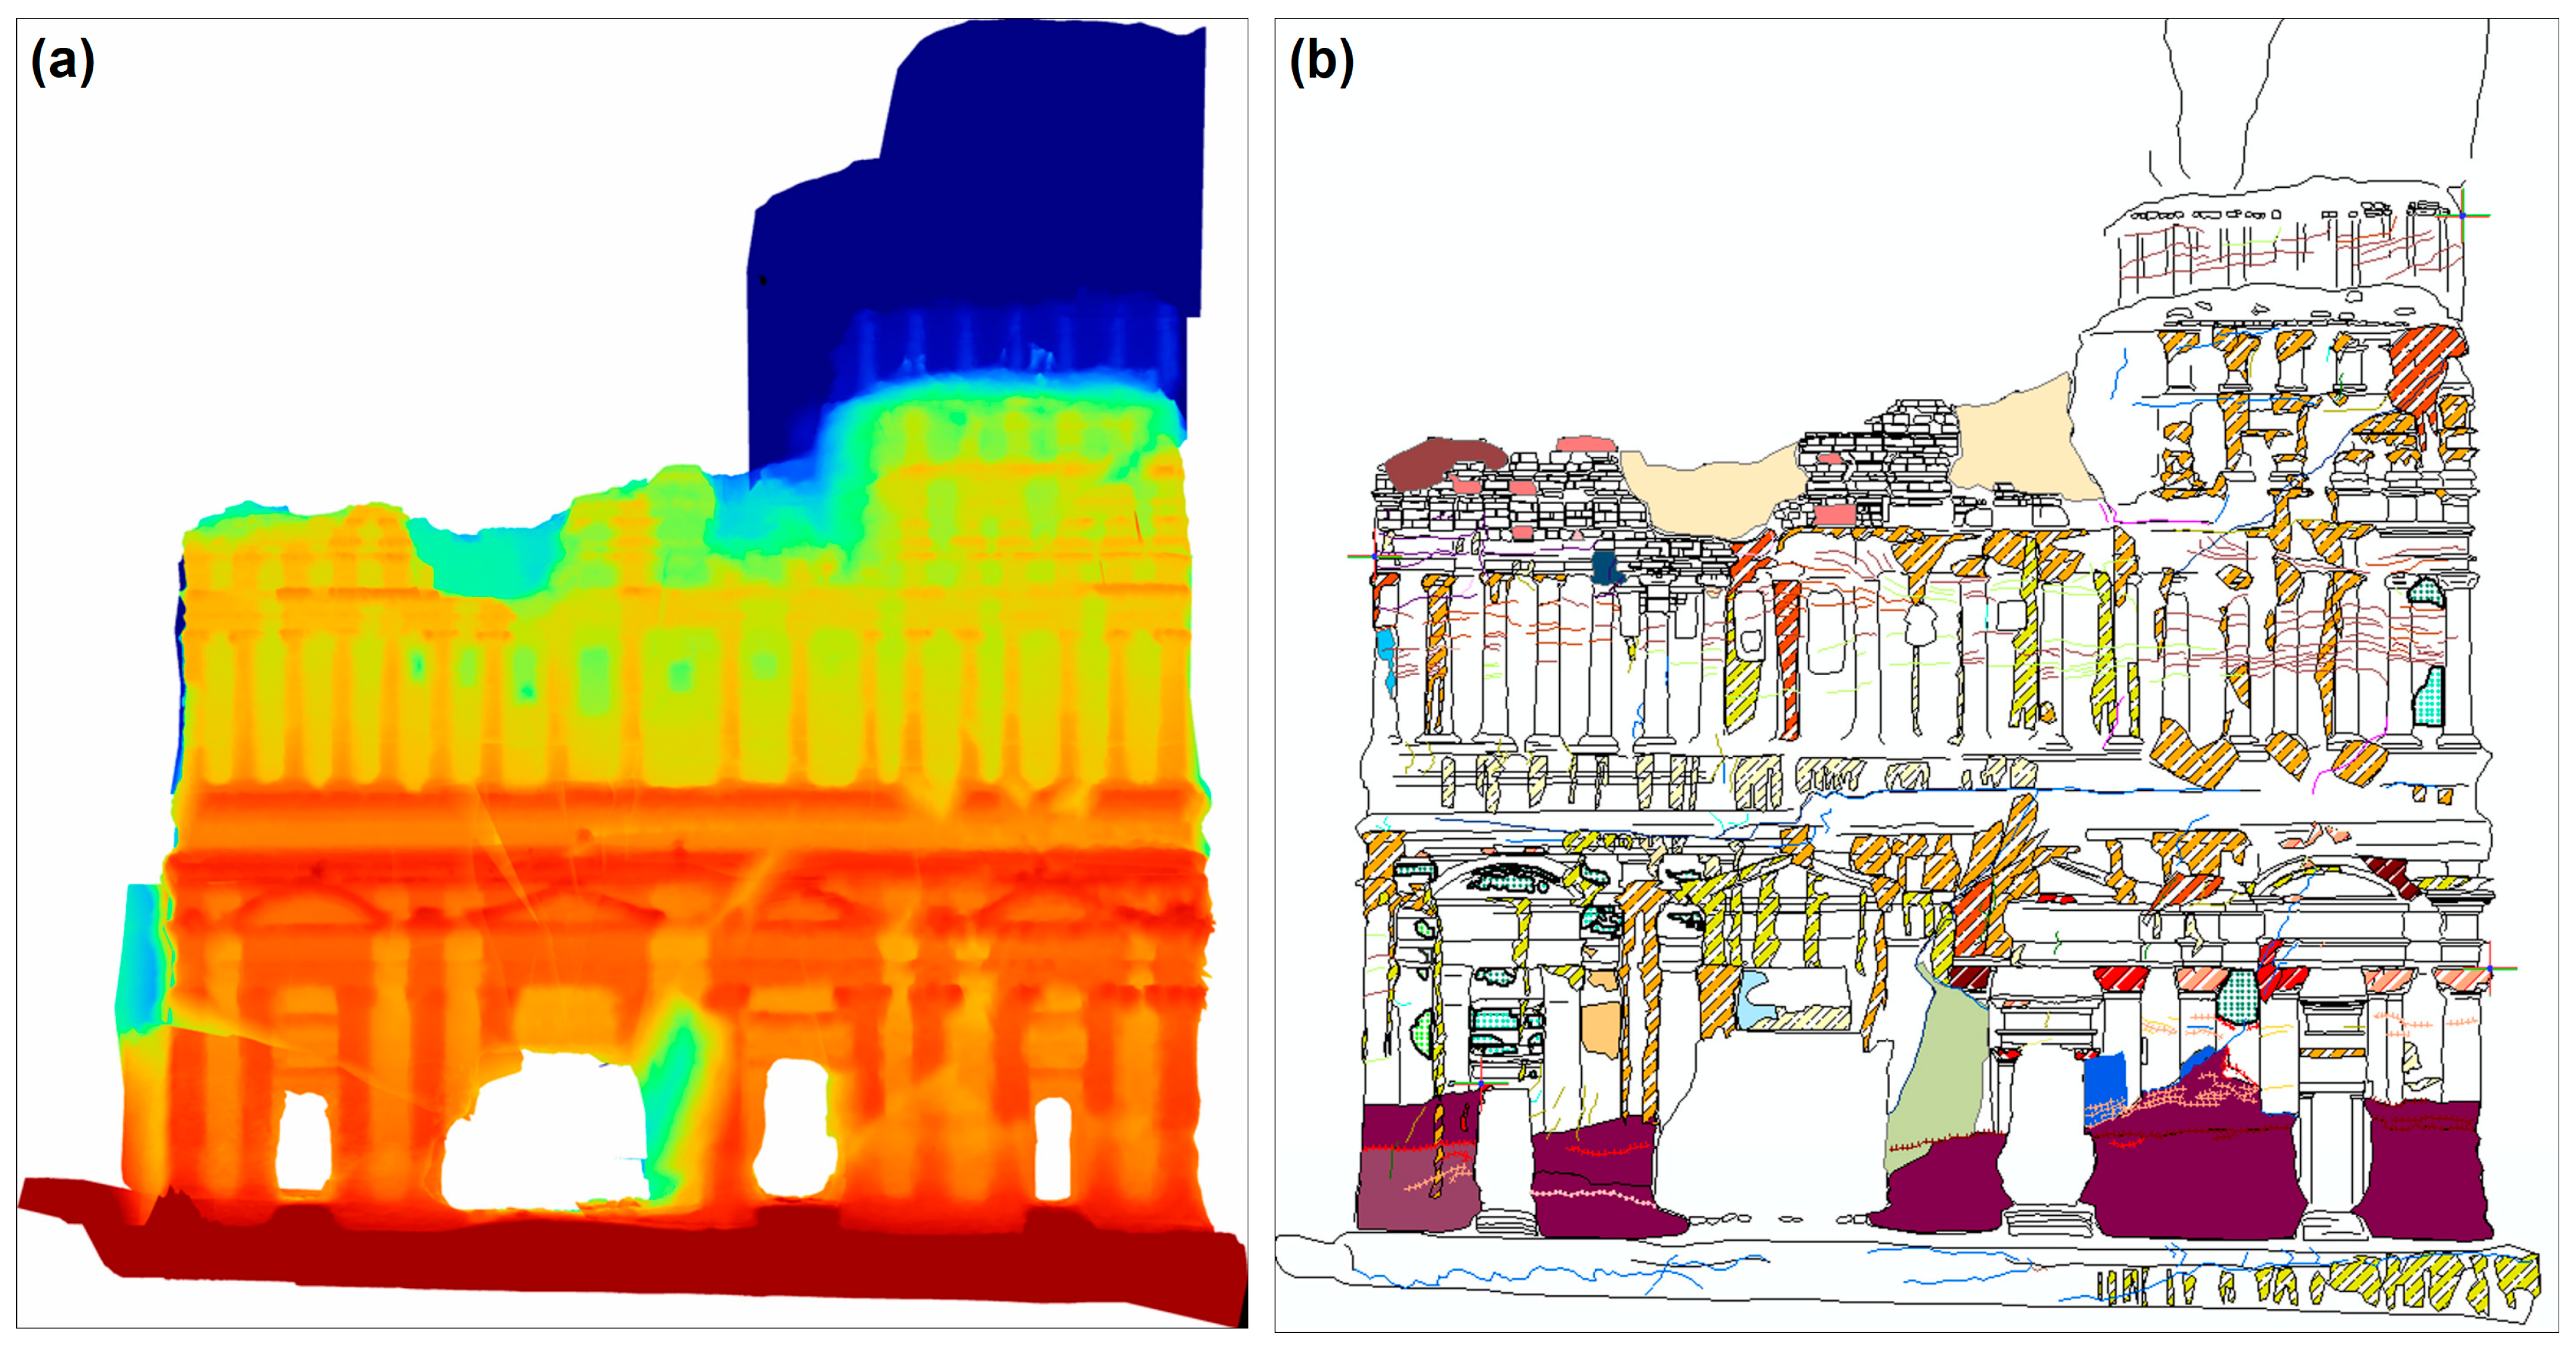
3.2.3. Results and Discussion: The Palace Tomb

The research started in 2012 and it included the survey of the architectural complex [82]. This had to have very precise characteristics: information useful for conservation, such as the position and geometry of all forms and erosion phenomena; detailed information about the forms that characterize the monument. In this case, the photogrammetric system was the one that provided the most answers. The complexity of the morphology of the monuments of Petra, and in particular the size of the funerary palace, made it necessary to develop a special photogrammetric recording system that is mobile and able to document the current state of deterioration of the architectural surface of the monument. This system consists of an aerostatic balloon to which two metal rods and three calibrated digital cameras are anchored by a sophisticated system of tie rods and counterweights. In addition to photogrammetric and laser scanner data, total station and GNSS control points were acquired to georeference the monument in a single reference system. The three-dimensional model of the monument was the documentary basis for all subsequent elaborations (Figure 14).
The numerical model was used to produce a series of outputs which are useful for studying the deterioration of the architectural façade. The first useful output was the creation of a digital elevation model (DEM) (Figure 15a), which highlighted the more or less deteriorated areas with false colors and helped to study the position of the architectural orders. Based on the color scale, the clear difference in decay between the first and second architectural order can be seen (Figure 15b). The other output was the creation of a high-resolution orthophoto mosaic that shows every single detail of the architectural facade. Based on the obtained image, the most important features could be computer edited to create a vector drawing of the façade prospectus. All the data collected and processed were used to create a GIS and thematic maps of the monument, which could provide a complete map of the current state of deterioration for future consolidation actions and a better understanding of the mutual relationships of the different phenomena.

3.3. Um-Hamat

3.3.1. Archaeological Background

Umm Hamat is located in the area of Karak. Several travelers reported on the site in the 19th century, most notably Musil [83]. He reported the existence of a rectangular fortified camp on a slight hill, which was probably of Roman origin [84]. In Figure 16, red arrows mark relics of the outer walls; no information is available about the interior, as the ruins were converted into sheep pens in more recent times by rearranging stones. Due to the sparse data available on the site to date, a geophysical survey was planned in 2012 in an area located within the boundary walls of the main building.

3.3.2. Results and Discussion
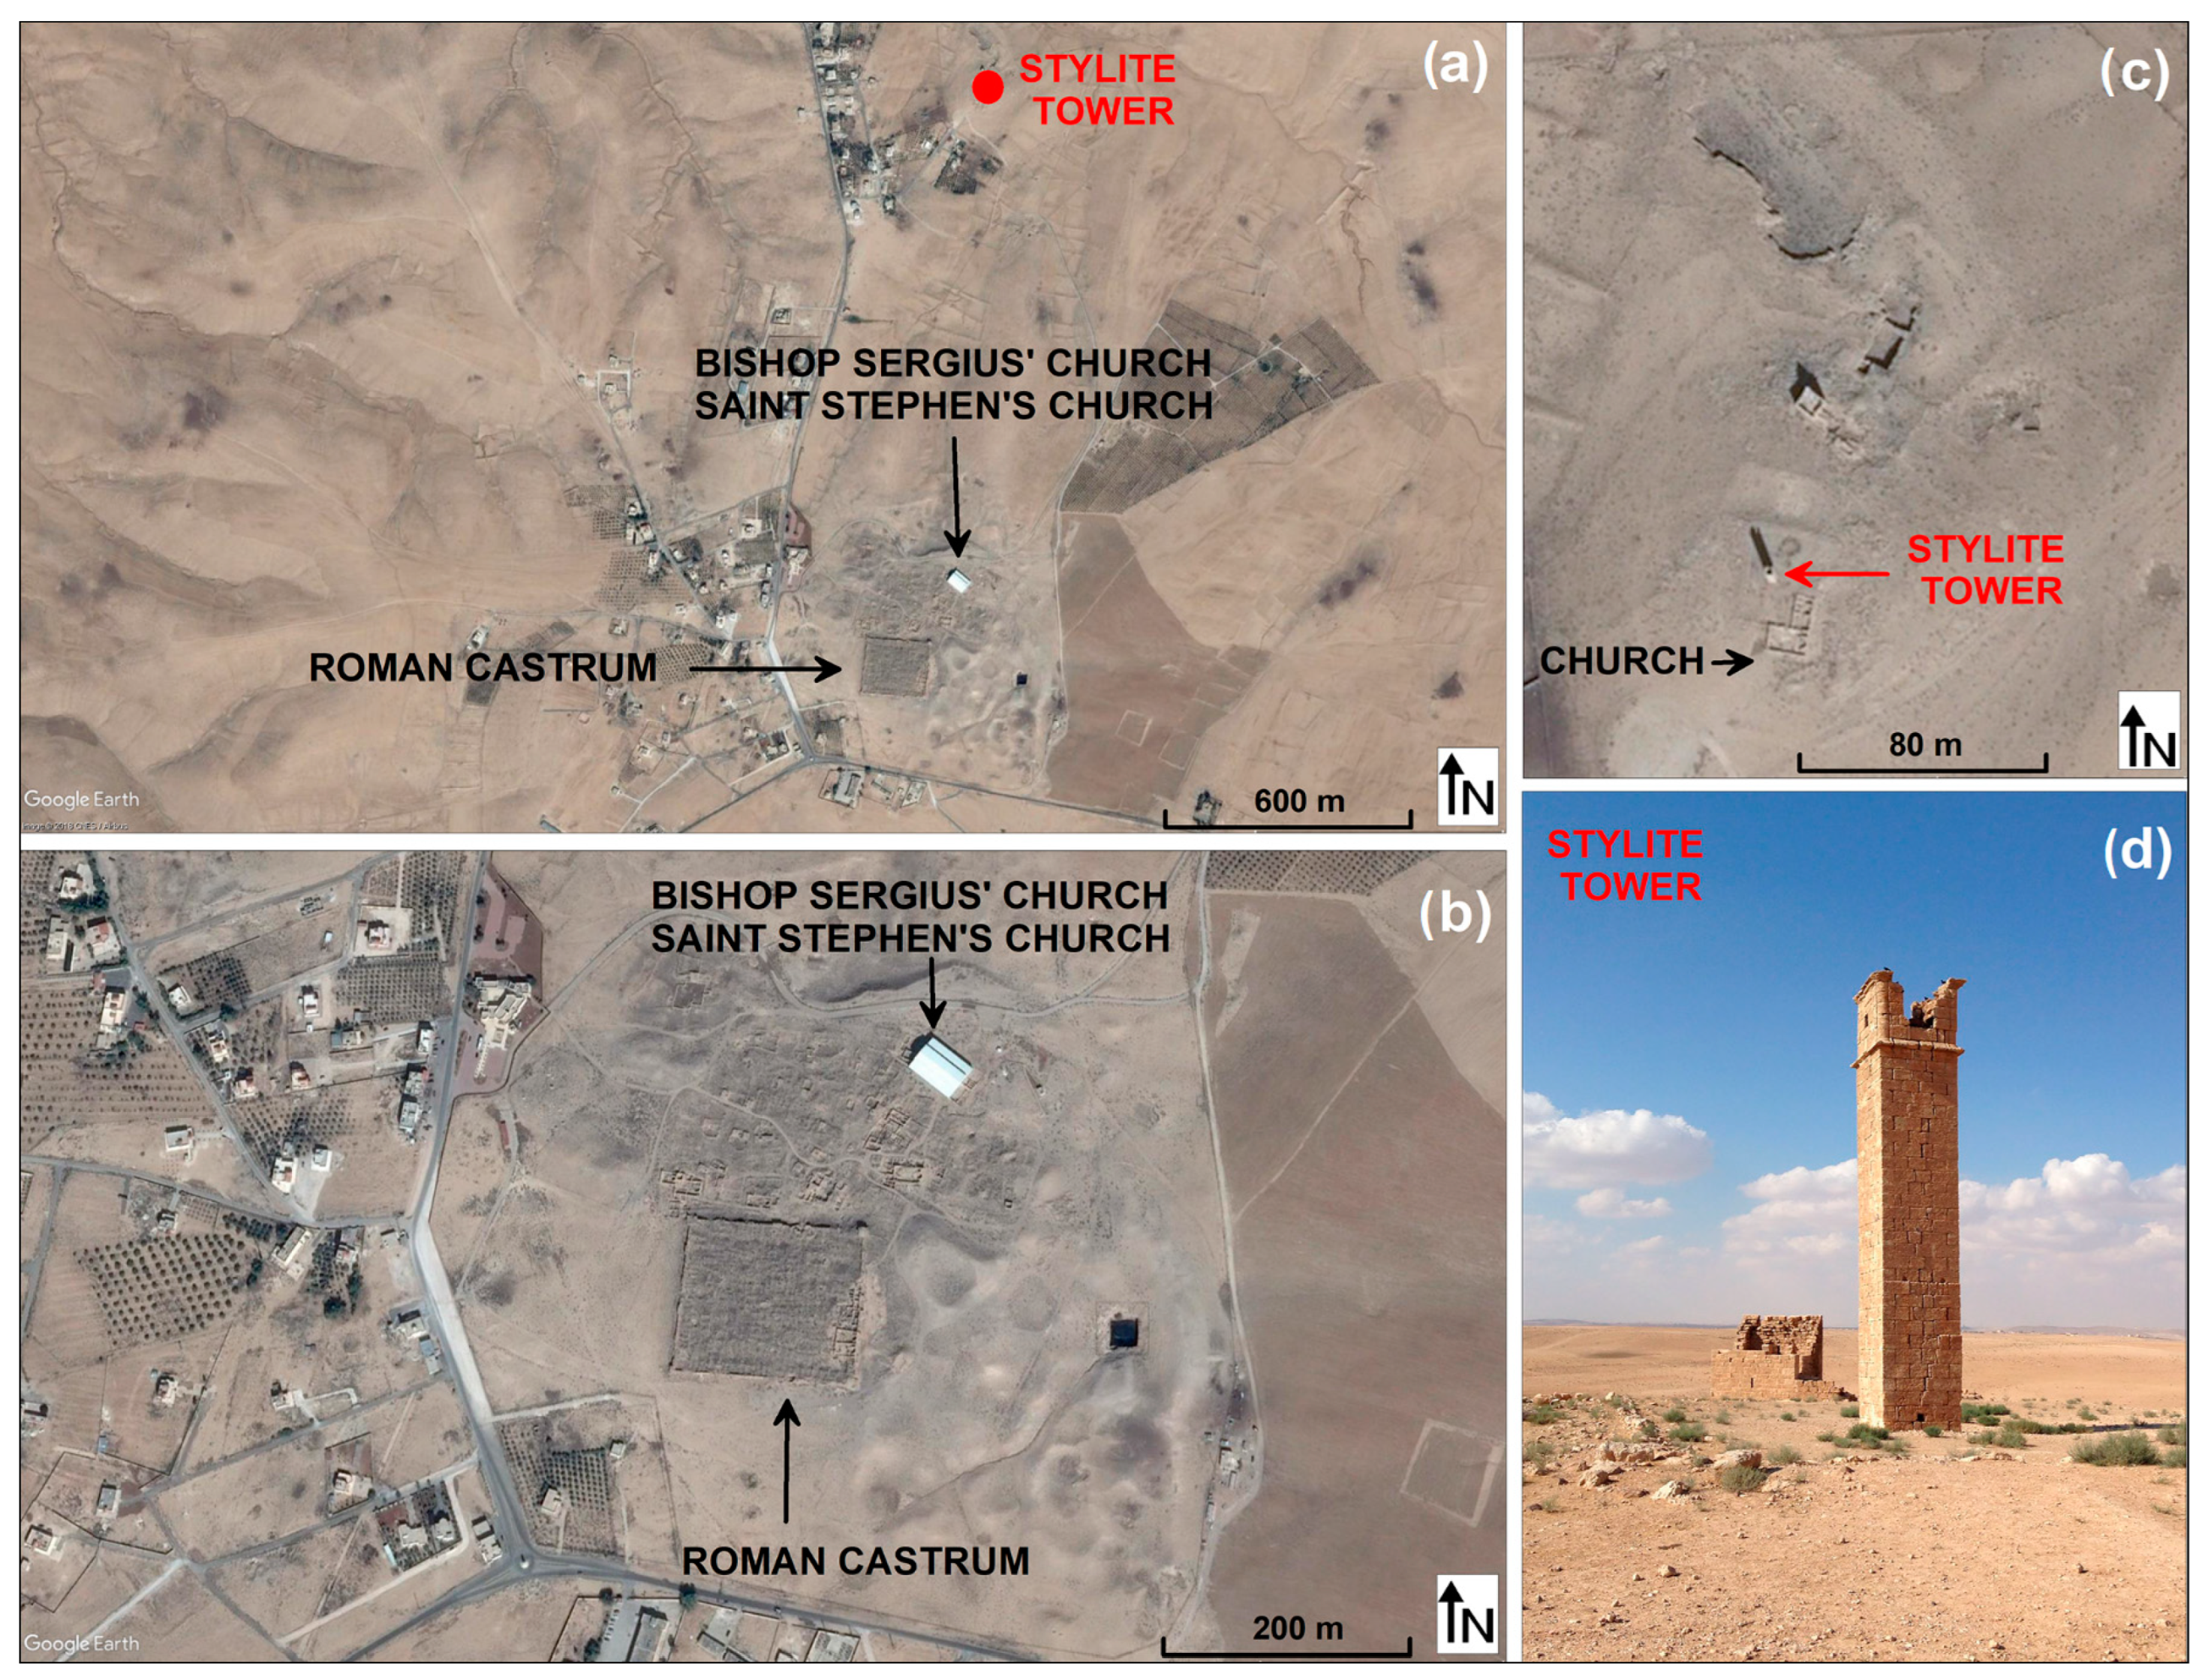
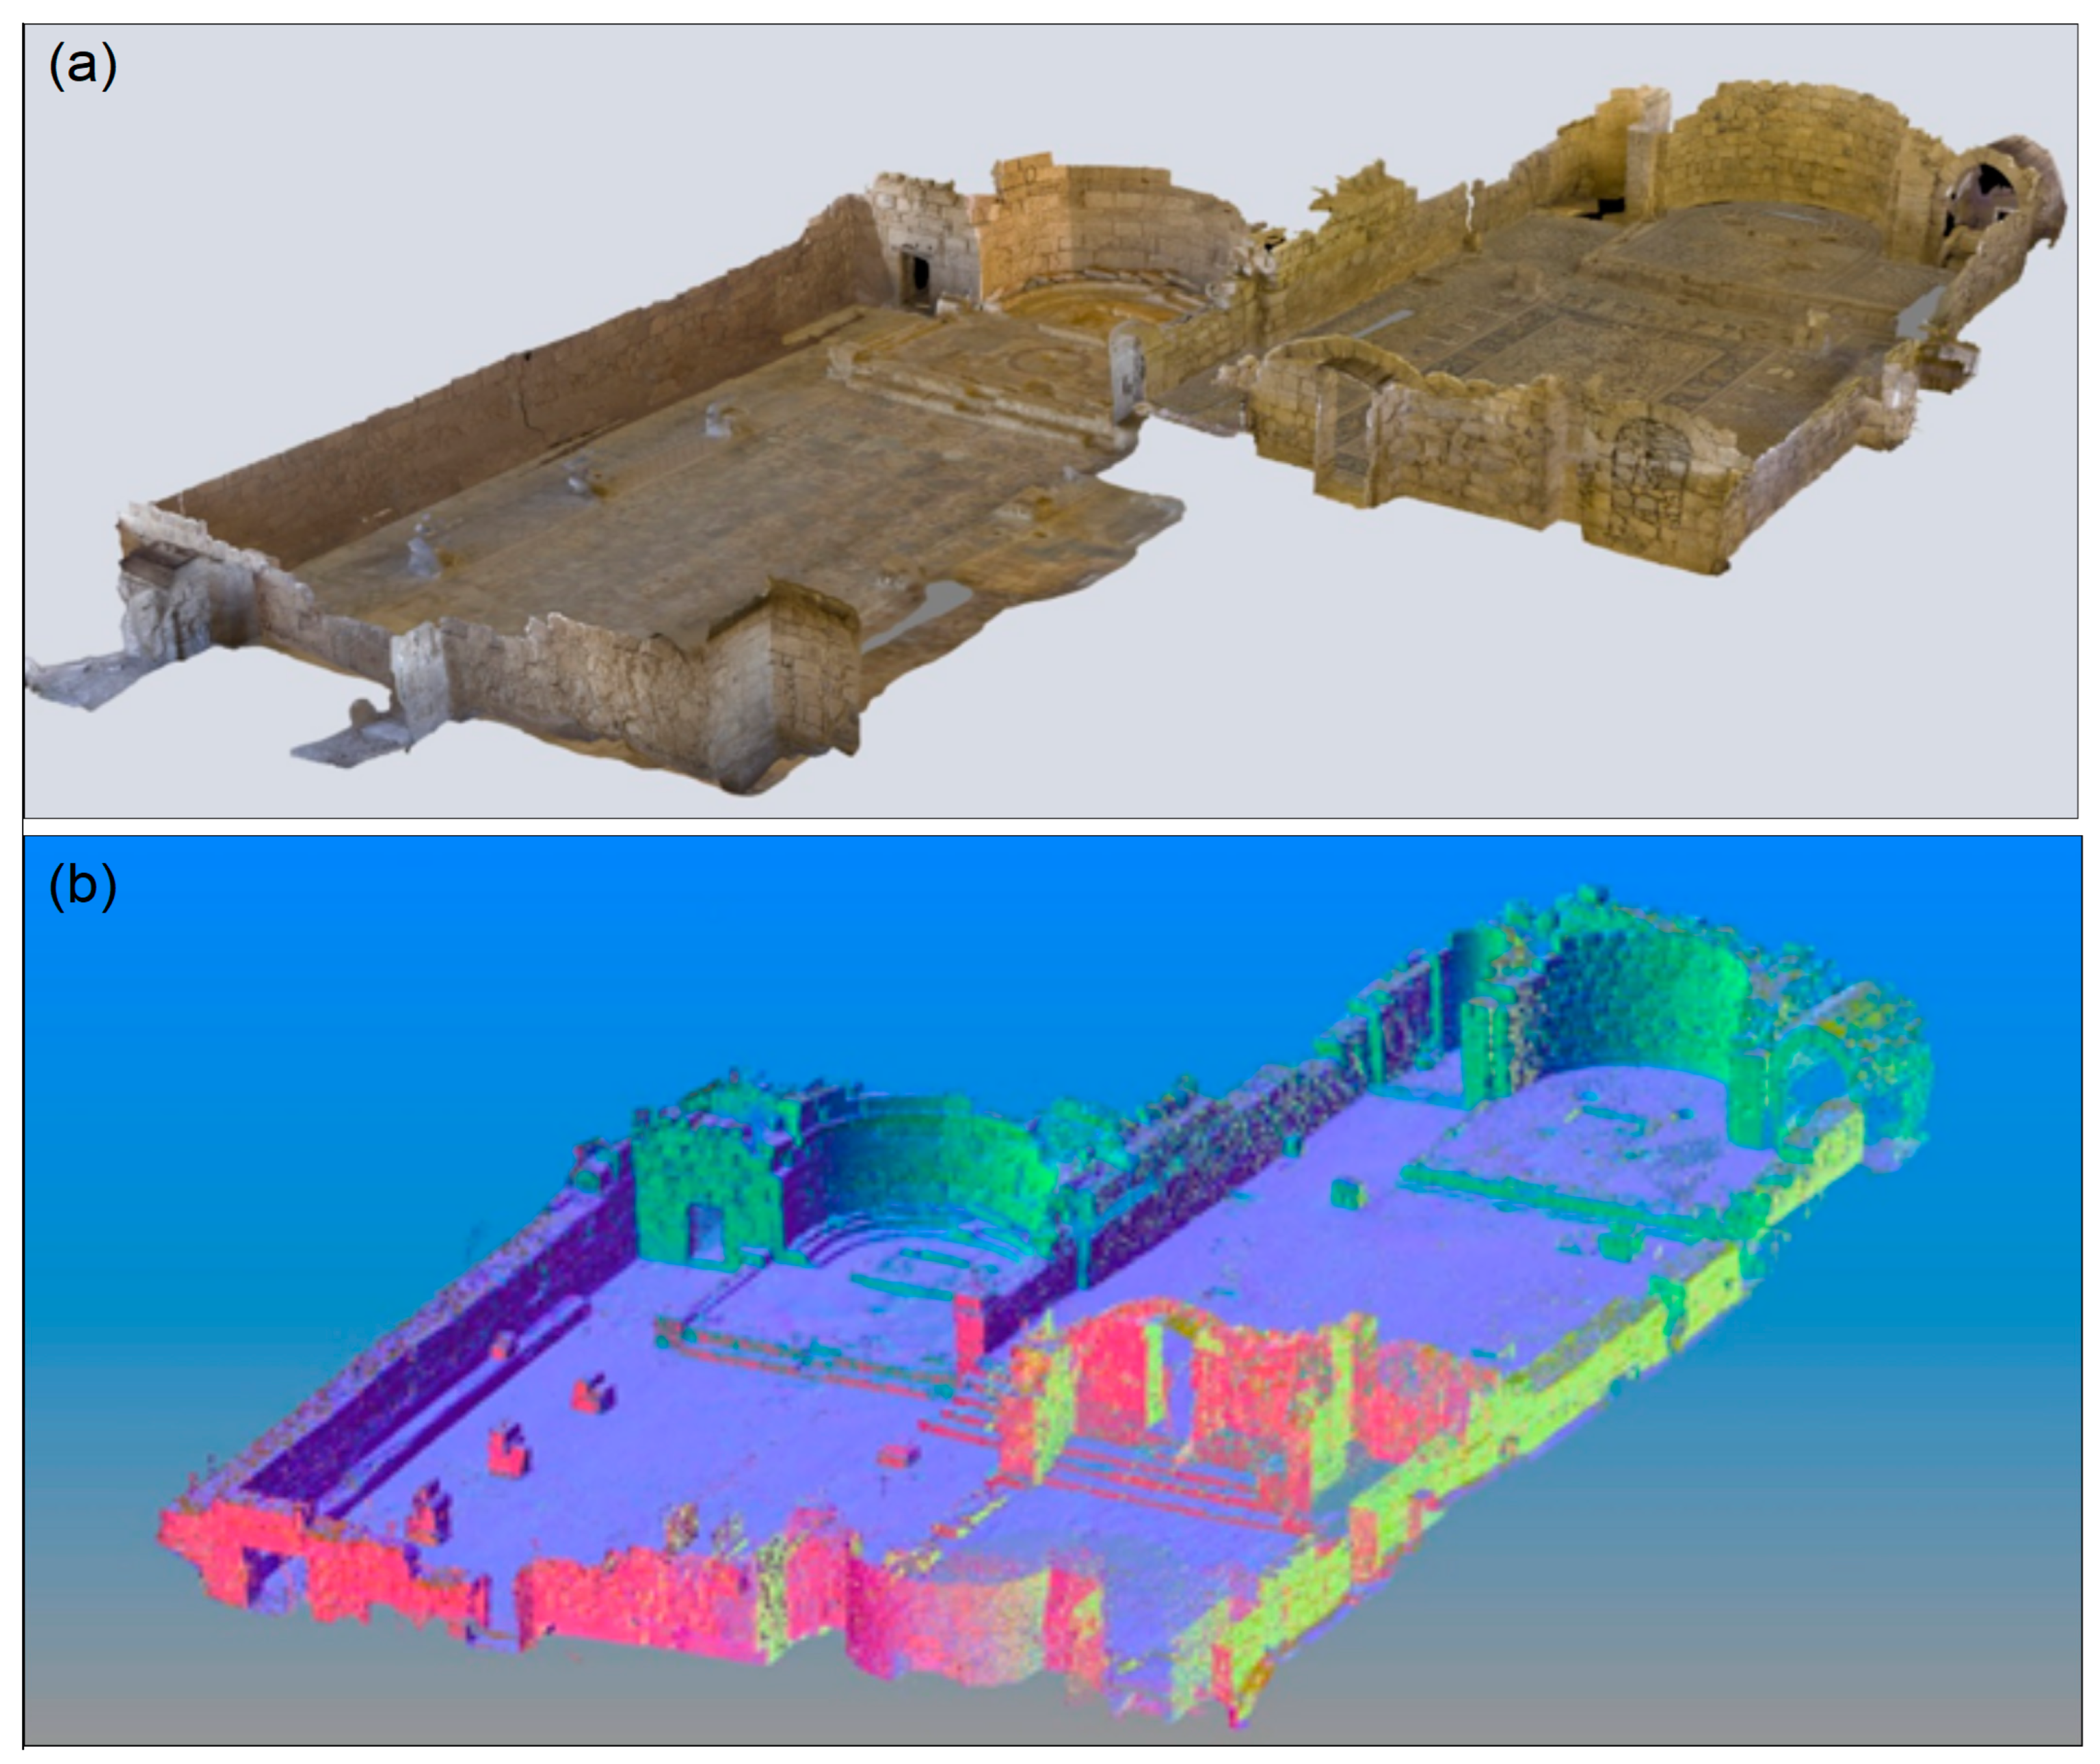
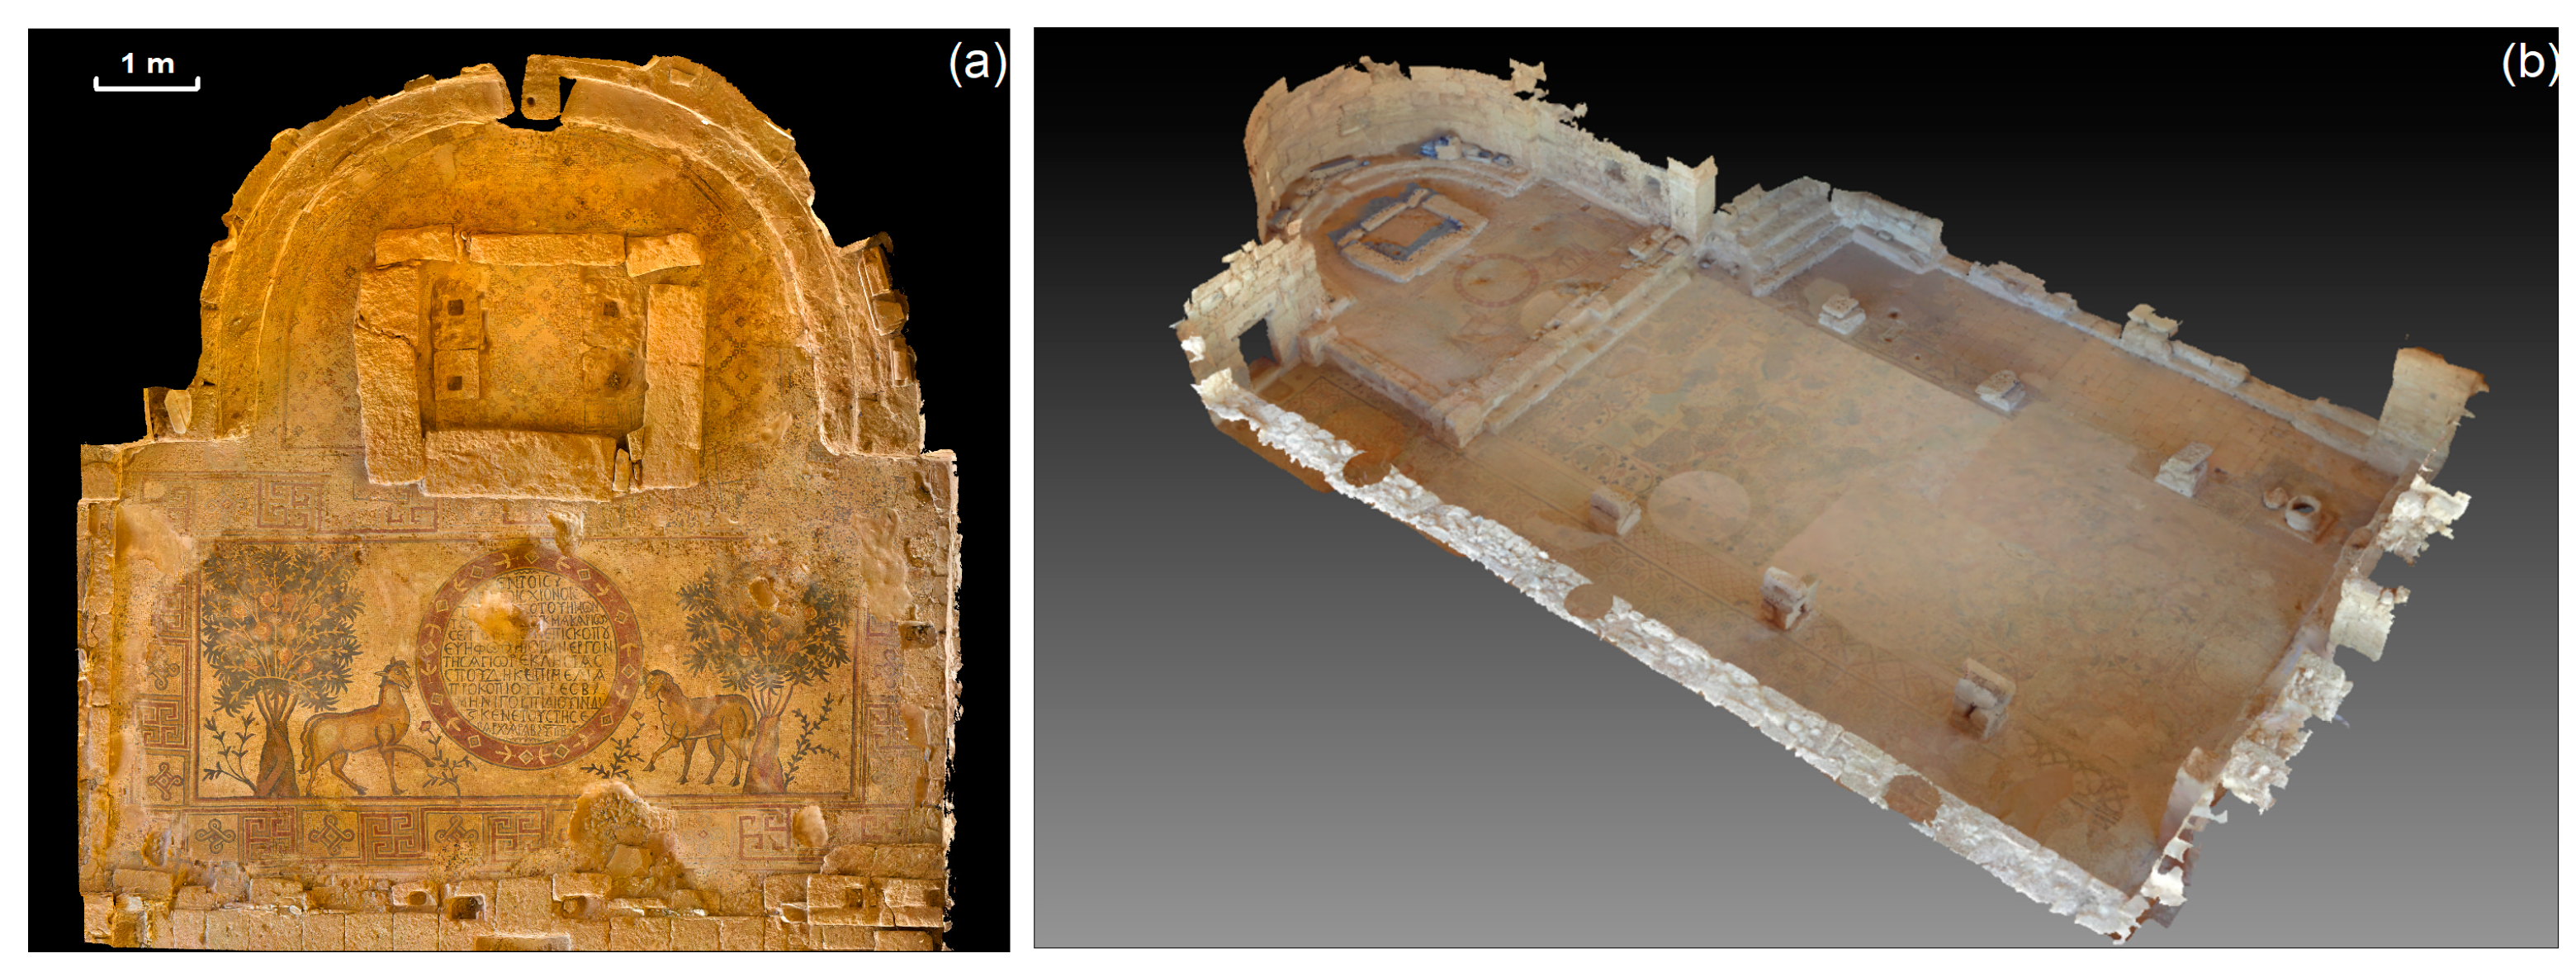
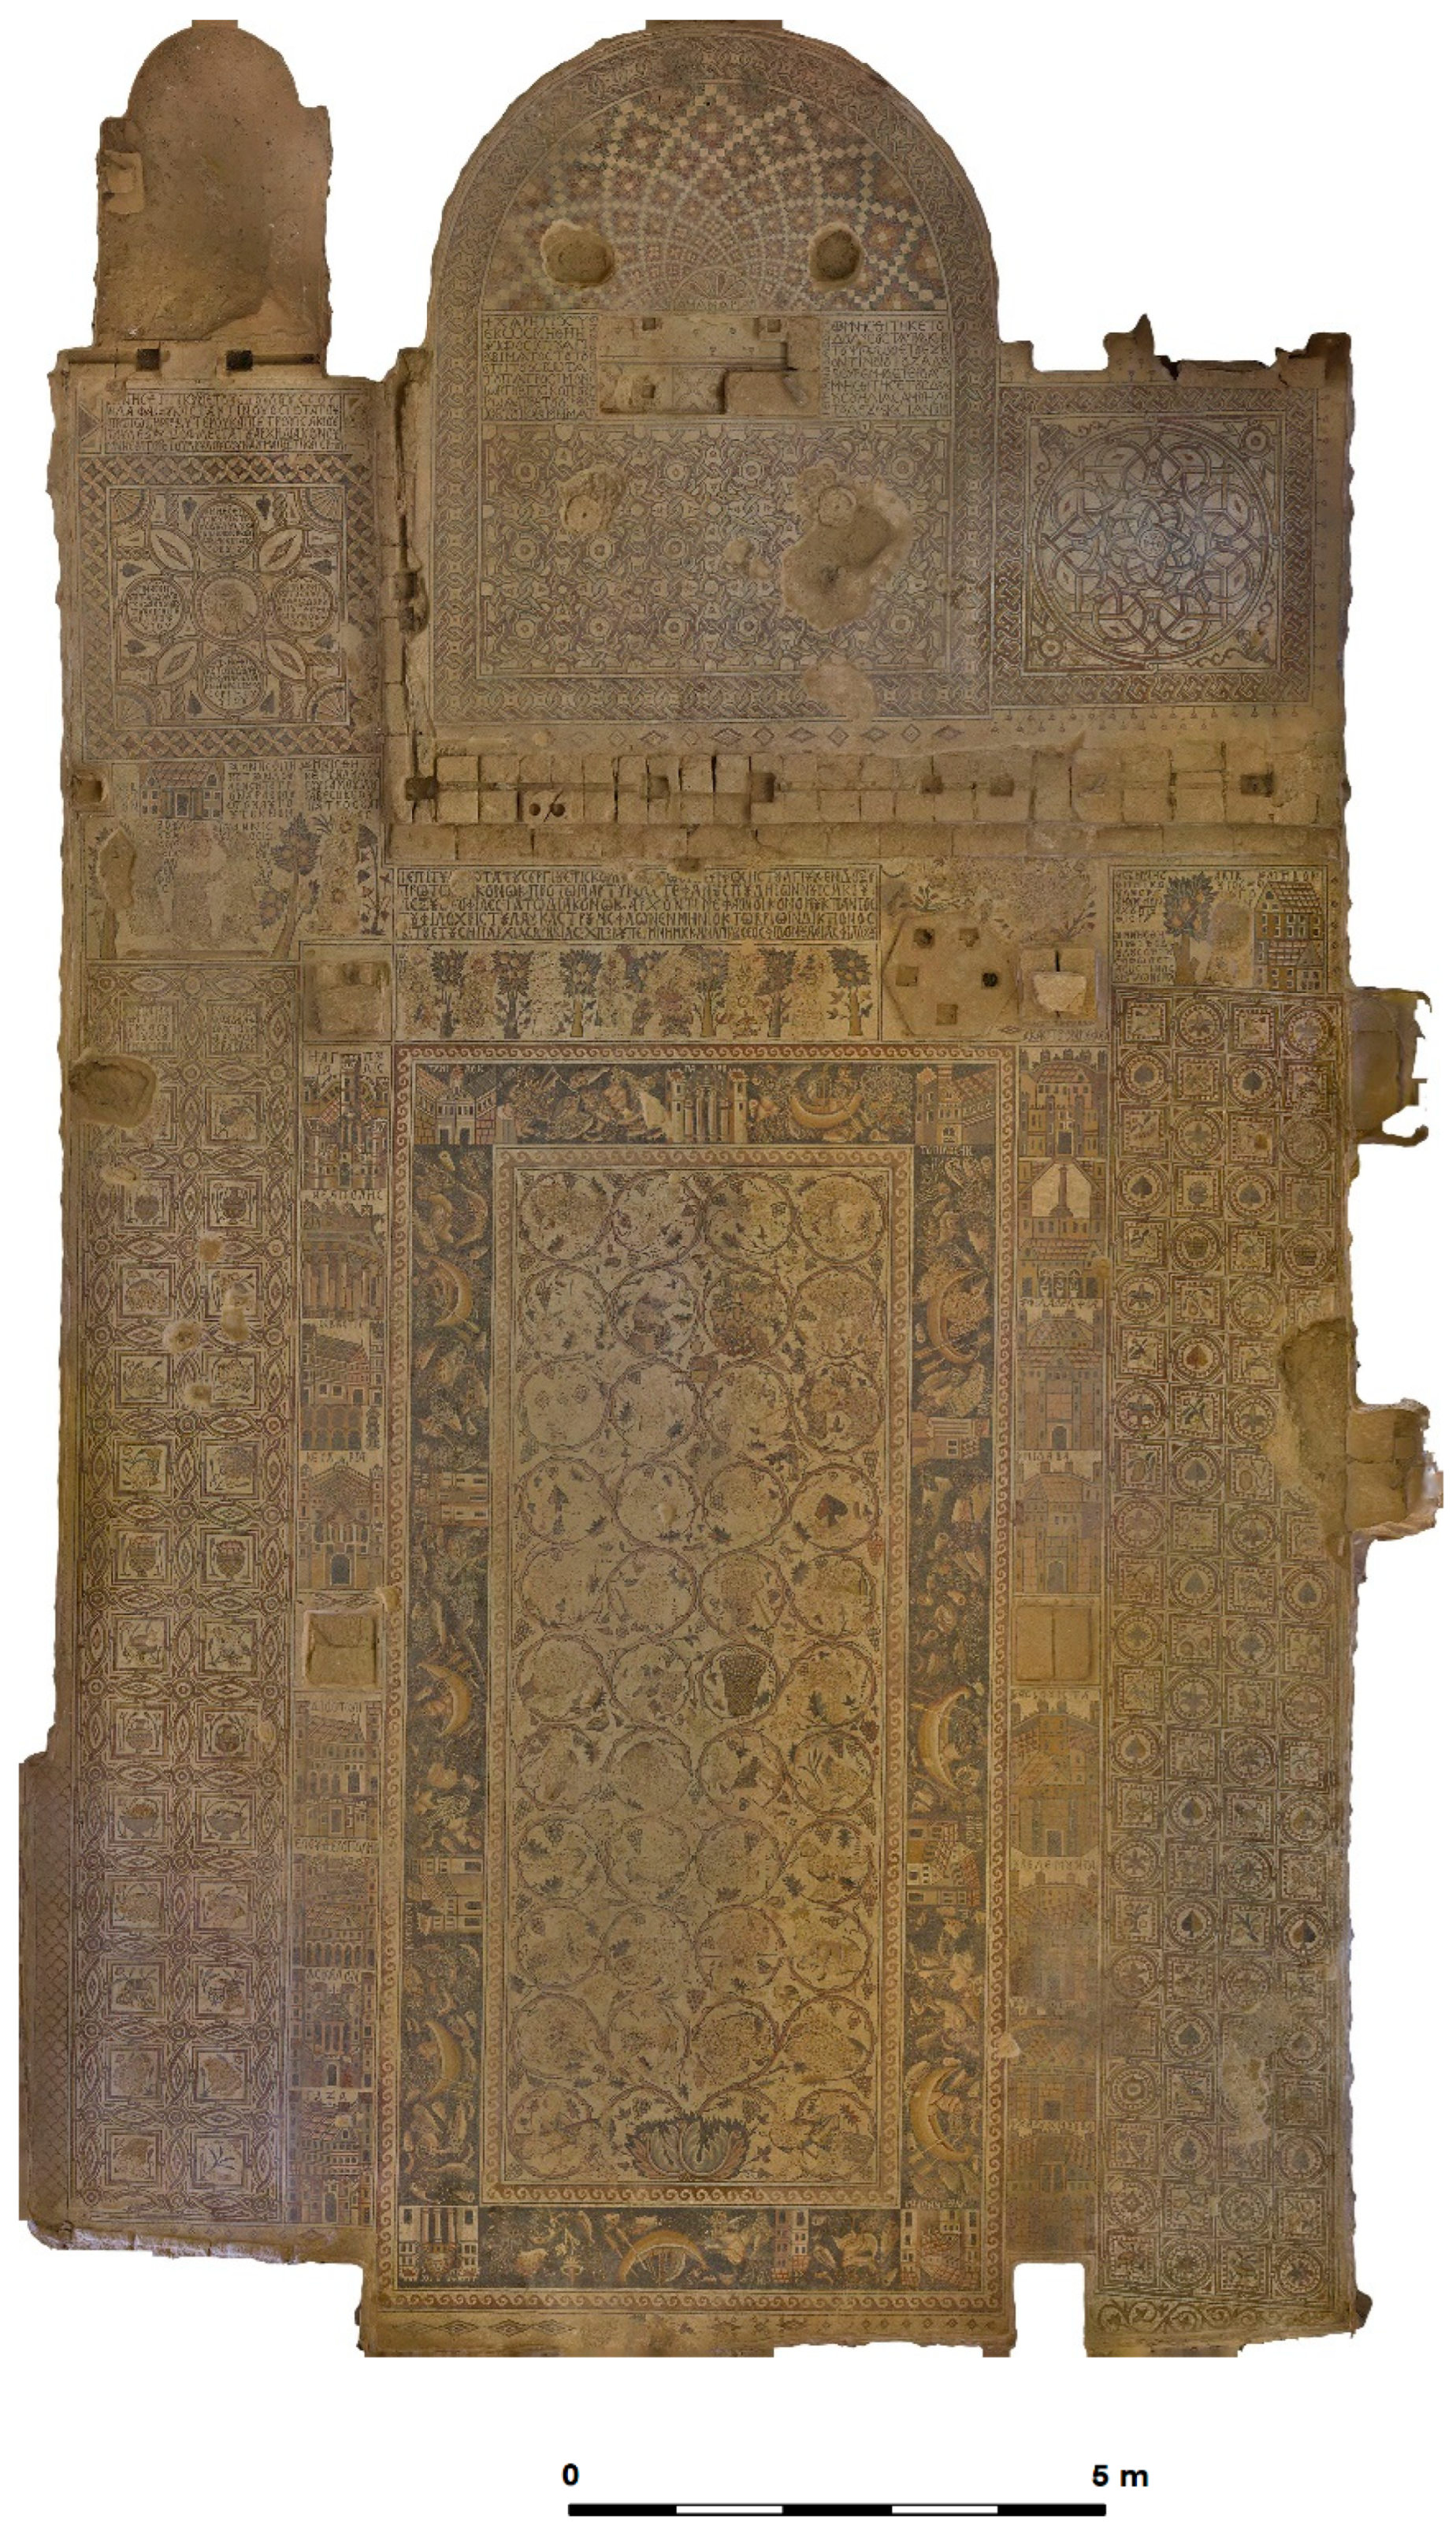
ERT prospecting revealed various resistivity heights at a depth of 1 m, arranged in a very regular pattern, suggesting the presence of many rooms buried in the ground (Figure 17). A direct excavation would be essential to determine the nature of the anomalies and to increase knowledge of the site.

3.4. Umm ar-Rasas

3.4.1. Archaeological Background

The archaeological site of Umm ar-Rasas is located 30 km southeast of the city of Madaba in Jordan, north of the Wadi Mujib, and covers about 10 ha on the Moab plateau. From 1986 to 2007, archaeological research was conducted by the Franciscan Archaeological Institute of Mount Nebo [85,86]. In 2004, it was included in the UNESCO World Heritage List. As of 2013, a research project was launched with the aim of revisiting previous research, documenting the existing structures, and preparing the groundwork for the conservation, restoration, and use of the site [87,88,89,90].
The remains consist of a vast area fortified by a massive wall measuring 158 × 140 m, on which there are numerous buildings and which was once a Roman castrum (Figure 18a,b). In the northern part of the archaeological site, both residential and sacred structures have been identified that can be dated from the Byzantine to the early Islamic period, up to the IX century AD (Figure 18a,b) [86].
Umm ar-Rasas is identified with ancient Kastron Mefaa, a place name known in biblical times, which was a military camp in Roman times, then an important Byzantine city, and finally a Christian city under Islamic rule.
The most important religious complex is St. Stephen’s Church, named after the pro-deacon and proto-martyr to whom it was dedicated, a built-up complex that emerged between the VI and VIII centuries AD. At least four interconnected buildings formed the complex: the Tabernacle Church, the oldest, the Church of Bishop Sergius, with its baptismal font and funeral chapel at the front, St. Stephen’s Church, and the Court Church, which rose between the other three churches (Figure 18a,b).
The two churches house some mosaic floors of exceptional quality and rich in inscriptions, portraits, scenes of daily life, geometric and vegetal motifs and, not to forget, the representation of many cities from Palestine, Egypt, and Jordan. In the church of Bishop Sergius, these mosaics are dated precisely to the year 586 AD by a mosaic inscription on the front of the altar pedestal, where the name of the commissioner, Bishop Sergius of Madaba (576–603 AD), is mentioned. Over time, they have been altered both for reasons of restoration and iconoclasm, as is the case with many other contemporary religious complexes. The legibility of the parts depicting figural elements was largely affected by censorship measures on the figural representations, in which the tesserae were removed one by one and then reattached, without any precise scheme for filling the gaps in the floor. In the Church of St. Stephen, built after the Church of Bishop Sergius and dated to 717 AD, the representations of people and animals were also defaced. It should be noted, however, that the interventions in the figures of the mosaic floor were made by Christian workers because of the way they were carried out. They paid scrupulous attention to the complete preservation of the floor, both for the beauty and decency assured to the cult building and for its value as an offering to the members of the local community, whose names were written on the mosaic representations along with the images.
The Stylite tower, an exceptional example in its category, is located one and a half kilometers from the residential zone of the site in a northerly direction (Figure 18a,c,d). It has no stairs, and the only door is located 14 m above the ground on the south wall of a domed chamber at the top of the monument. In addition to the three windows on the other walls, there is a channel in the western wall that connects the room to the base of the tower. From the outside, the room is decorated with a double cornice and four columns at the corners, made of segments attached to the wall. The bases show the head of a bird of prey in relief. The capitals are decorated with interwoven geometric patterns. Originally, the tower was plastered, as evidenced by the traces still visible on the walls [91].
The general plan of the site shows that the tower is located in the center of a courtyard in a fortress on the highest terrace. At the southeast corner of the courtyard is a small church flanked on the north by two interconnected rooms [91,92].
The church has three naves, a raised presbytery, and three doors in the north wall facing the tower. It is poorly built and decorated with a double-beaten limestone floor. The tower and church do not appear to be directly related to the quadrangular tower and buildings located on the slope of the northern terrace [91]. Although some scholars believe that the tower served observation purposes and acted as a sentry against the dangers emanating from the surrounding areas [93], the most accepted hypothesis is that it had a religious function associated with the imprisonment of a monk or a stylite, according to a particular form of Christian asceticism originating from Syria [93,94].
The Stylite tower was the subject of research carried out between 1986 and 2007 by the Franciscan Archaeological Institute on Mount Nebo under the auspices of the Department of Antiquities of the Hashemite Kingdom of Jordan.

3.4.2. Results and Discussion: Churches VI and VIII Century AD

The work started in 2013, and it was a useful experiment for the integration of photogrammetric surveys and laser scanning. In this way, the results guarantee, with the first activity, the descriptive accuracy in the colors and in the details of the surveyed surface; on the other hand, the use of the laser scanning methods allows for the representation of the geometrical deformations of the mosaic floors with great precision in the range of a few millimeters. Figure 19 and Figure 20 show 3D views of the two churches obtained by laser scanning methods and the actual arrangement of the surfaces (Figure 19b). Figure 21 shows the orthogonal image of the entire mosaic floor of St. Stephen’s Church, obtained by photogrammetric methods.
The analysis of the floor of the Church of Bishop Sergius revealed an elevation of the floor by 0.10 m in the central nave towards the apse; instead, a depression was found near the entrance door, the presence of which is probably related to an underground water tank located on the northwest side of the building, where traces of a water channel are visible. In St. Stephen’s Church, there are also uplifts of the floor on the right side of the central nave, while slight subsidence can be seen on the rest of the floor, especially on the part of the floor closer to the Church of Bishop Sergius (Figure 22). The causes of these deformations could be related either to geological instabilities in the area or to other underground man-made structures (tombs, wall structures, or tanks). The following investigations aim at interpreting these deformations with certainty. In this context, conducting high-resolution photogrammetric surveys could serve as a starting point for a conservation and restoration project to be planned for the preservation of the mosaic floors.
Figure 23 shows the results of the GPR surveys in relation to the 0.5–0.7 m depth window that overlaps with the map of the churches. The anomalies seen in these plots show the spatial distribution of the amplitudes of the reflections at specific depths within the grid. Within the slice, low amplitude variations express small reflections from the subsurface and therefore indicate the presence of a homogeneous ground. High amplitudes denote significant discontinuities in the soil and indicate the presence of probable buried objects. As for St. Stephen’s Church, the most superficial map highlights several anomalies perpendicular to the left aisle, a longitudinal anomaly in the middle of the central part of the church, and an anomaly in the space in front of the apse (on the right edge), which is marked with pink arrows in Figure 23. The presence of probable structures buried under the pavement prior to the construction phase of the church, during a phase of settlement of the material, could have caused the deformation detected by the laser scanner survey, especially at the point marked A. In the Church of Bishop Sergius, the prospection at the entrance of the structure showed anomalies of regular shape, probably due to cavities and therefore to possible underground cisterns belonging to an older chronological phase. The work is still ongoing, and the main objective of the research is to produce a complete map of the hidden structures inside the city walls by integrating different geophysical methods such as electrical resistivity tomography, GPR, and induced electromagnetic methods, which generally allow for a successful discovery. This application will be useful to promote archaeological excavations and site valorization projects.
All results will be stored in an ad hoc geodatabase, which is the result of collaboration and discussion between all members of the research group consisting of archaeologists, art historians, geophysicists, and conservators [95,96,97,98]. The geodatabase evolves over time in several steps, starting with the development of a GIS platform to archive the acquired interdisciplinary data and ending with the development of analytical models for data management (Figure 24). Thus, the GIS technology offers both methodological and interpretive advantages: on the one hand, it enables an interdisciplinary dialogue between different research questions through efficient data management and registration; on the other hand, it facilitates the interpretation of the information obtained from spatial queries [95,96]. In addition, the geodatabase can be used to monitor the state of preservation of the mosaic, thus providing valuable support for the planning of future restoration measures.

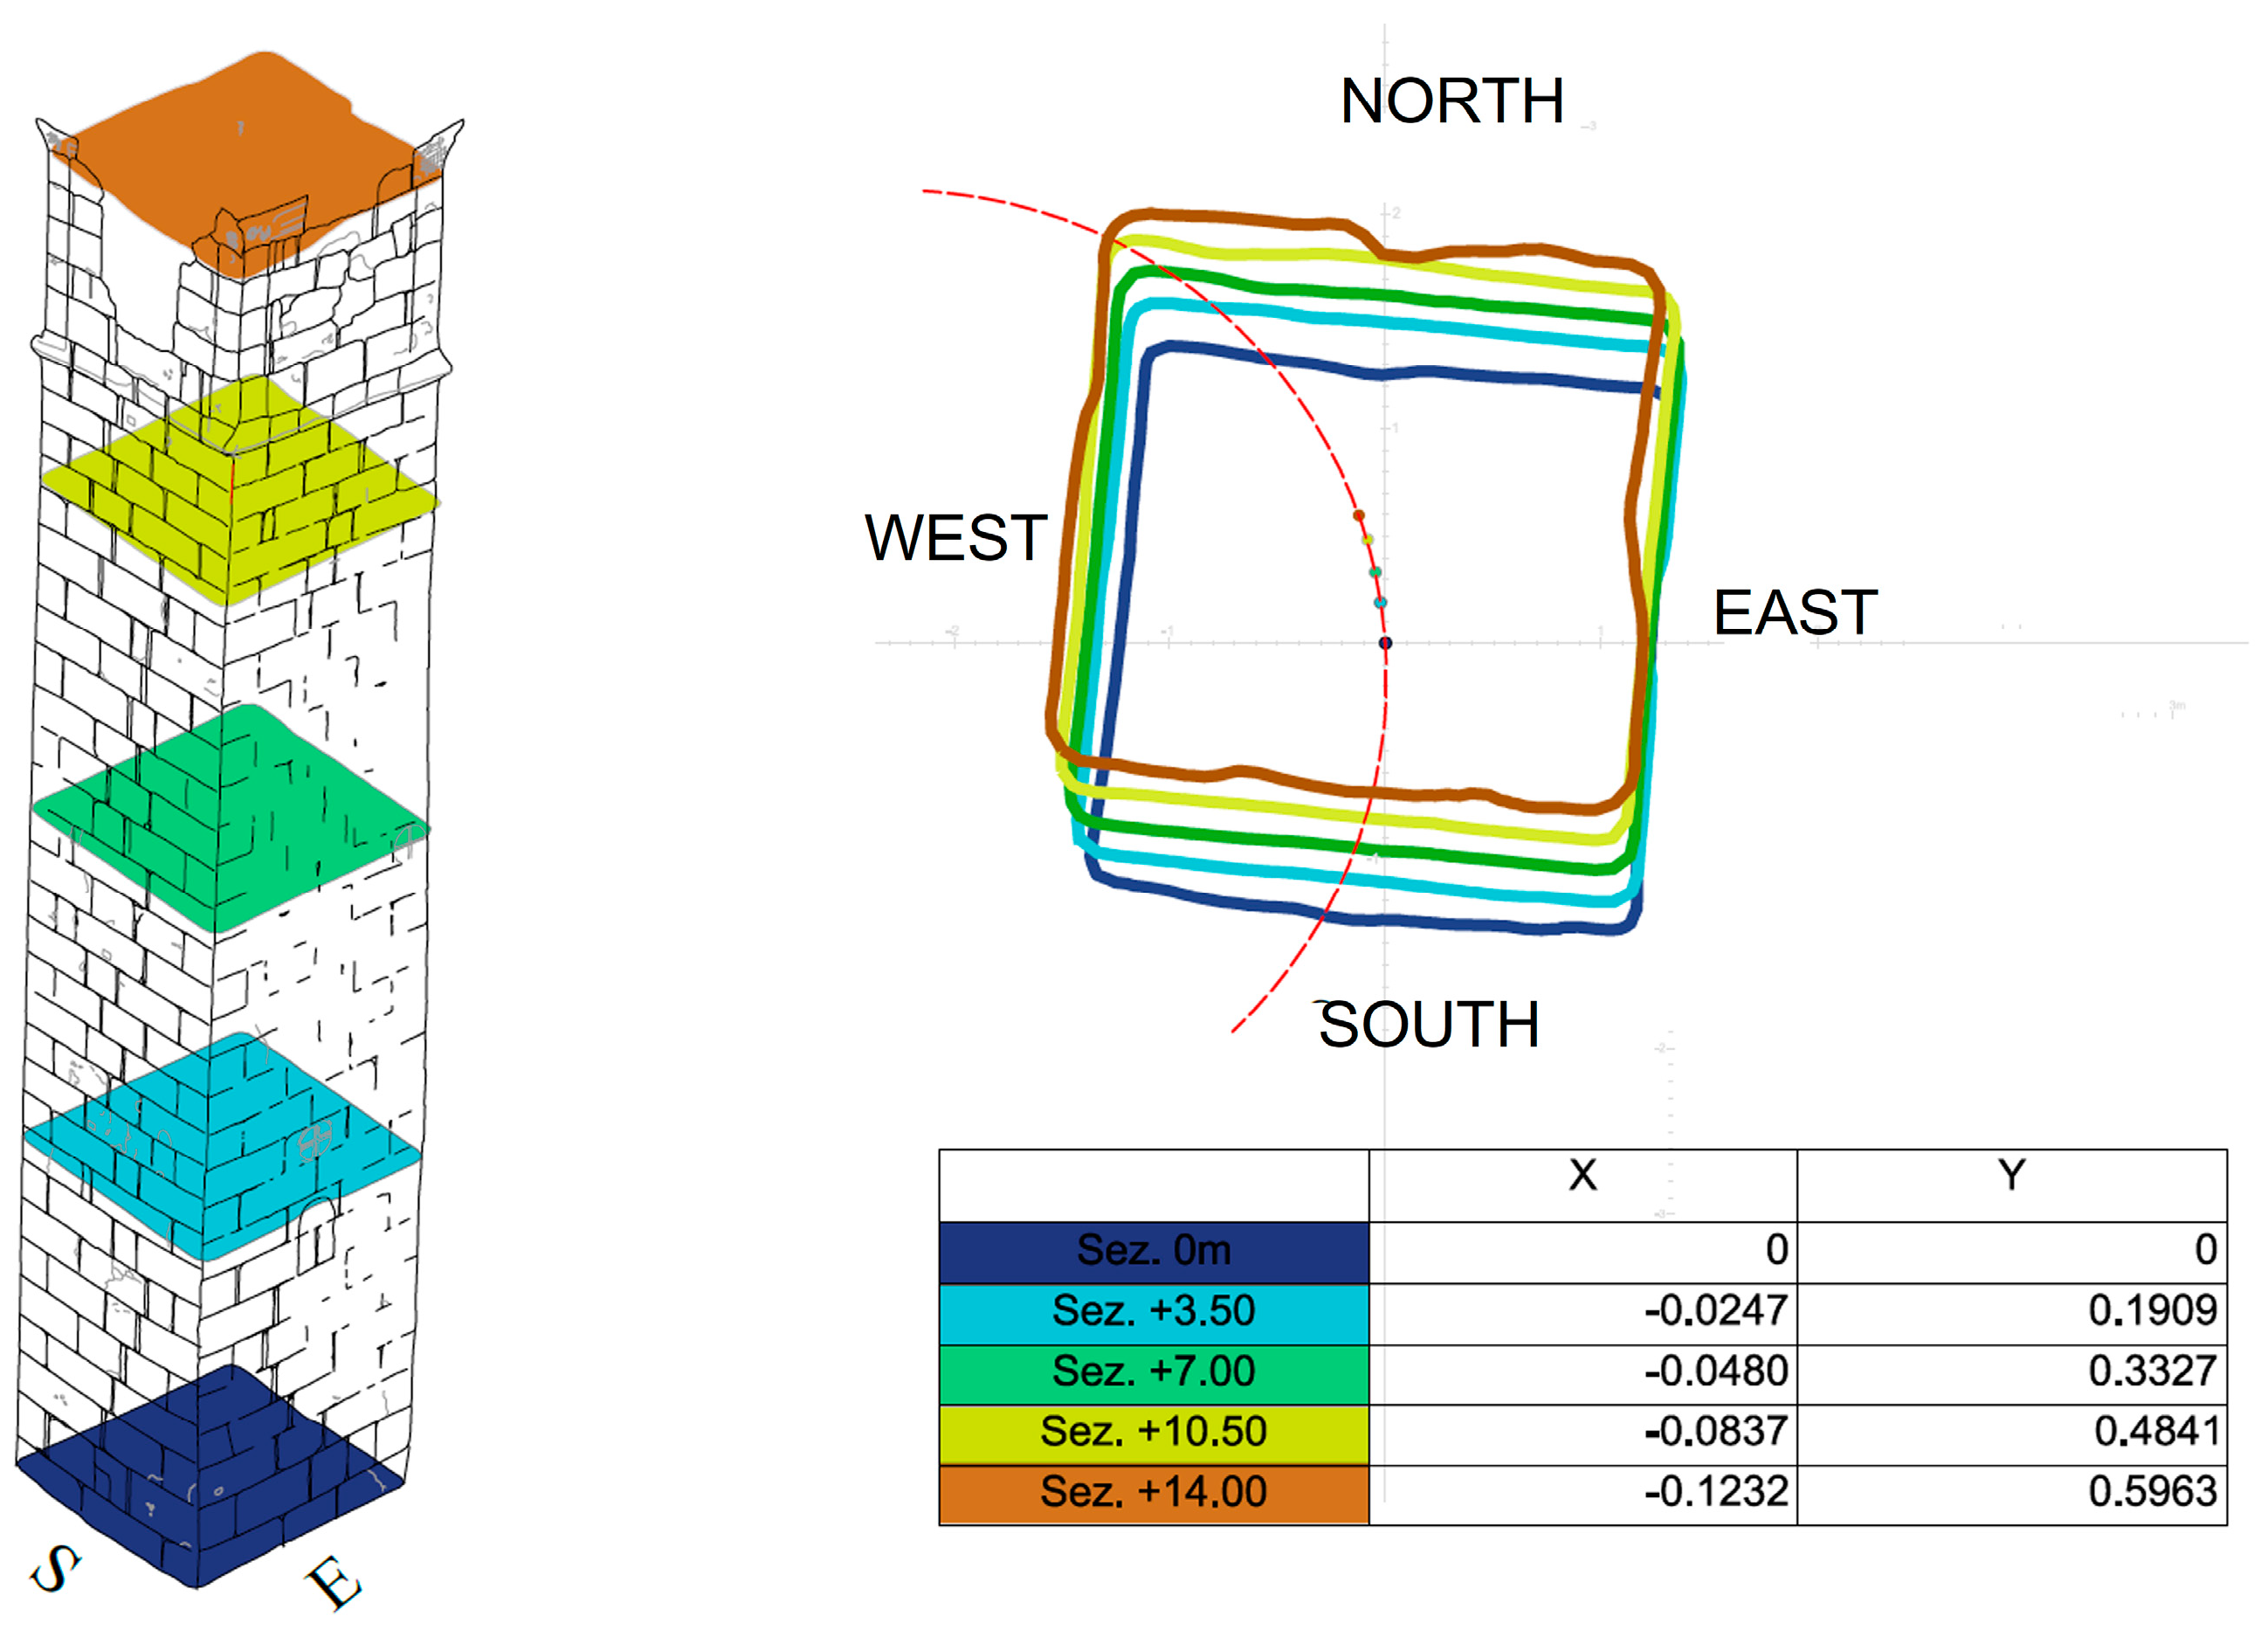
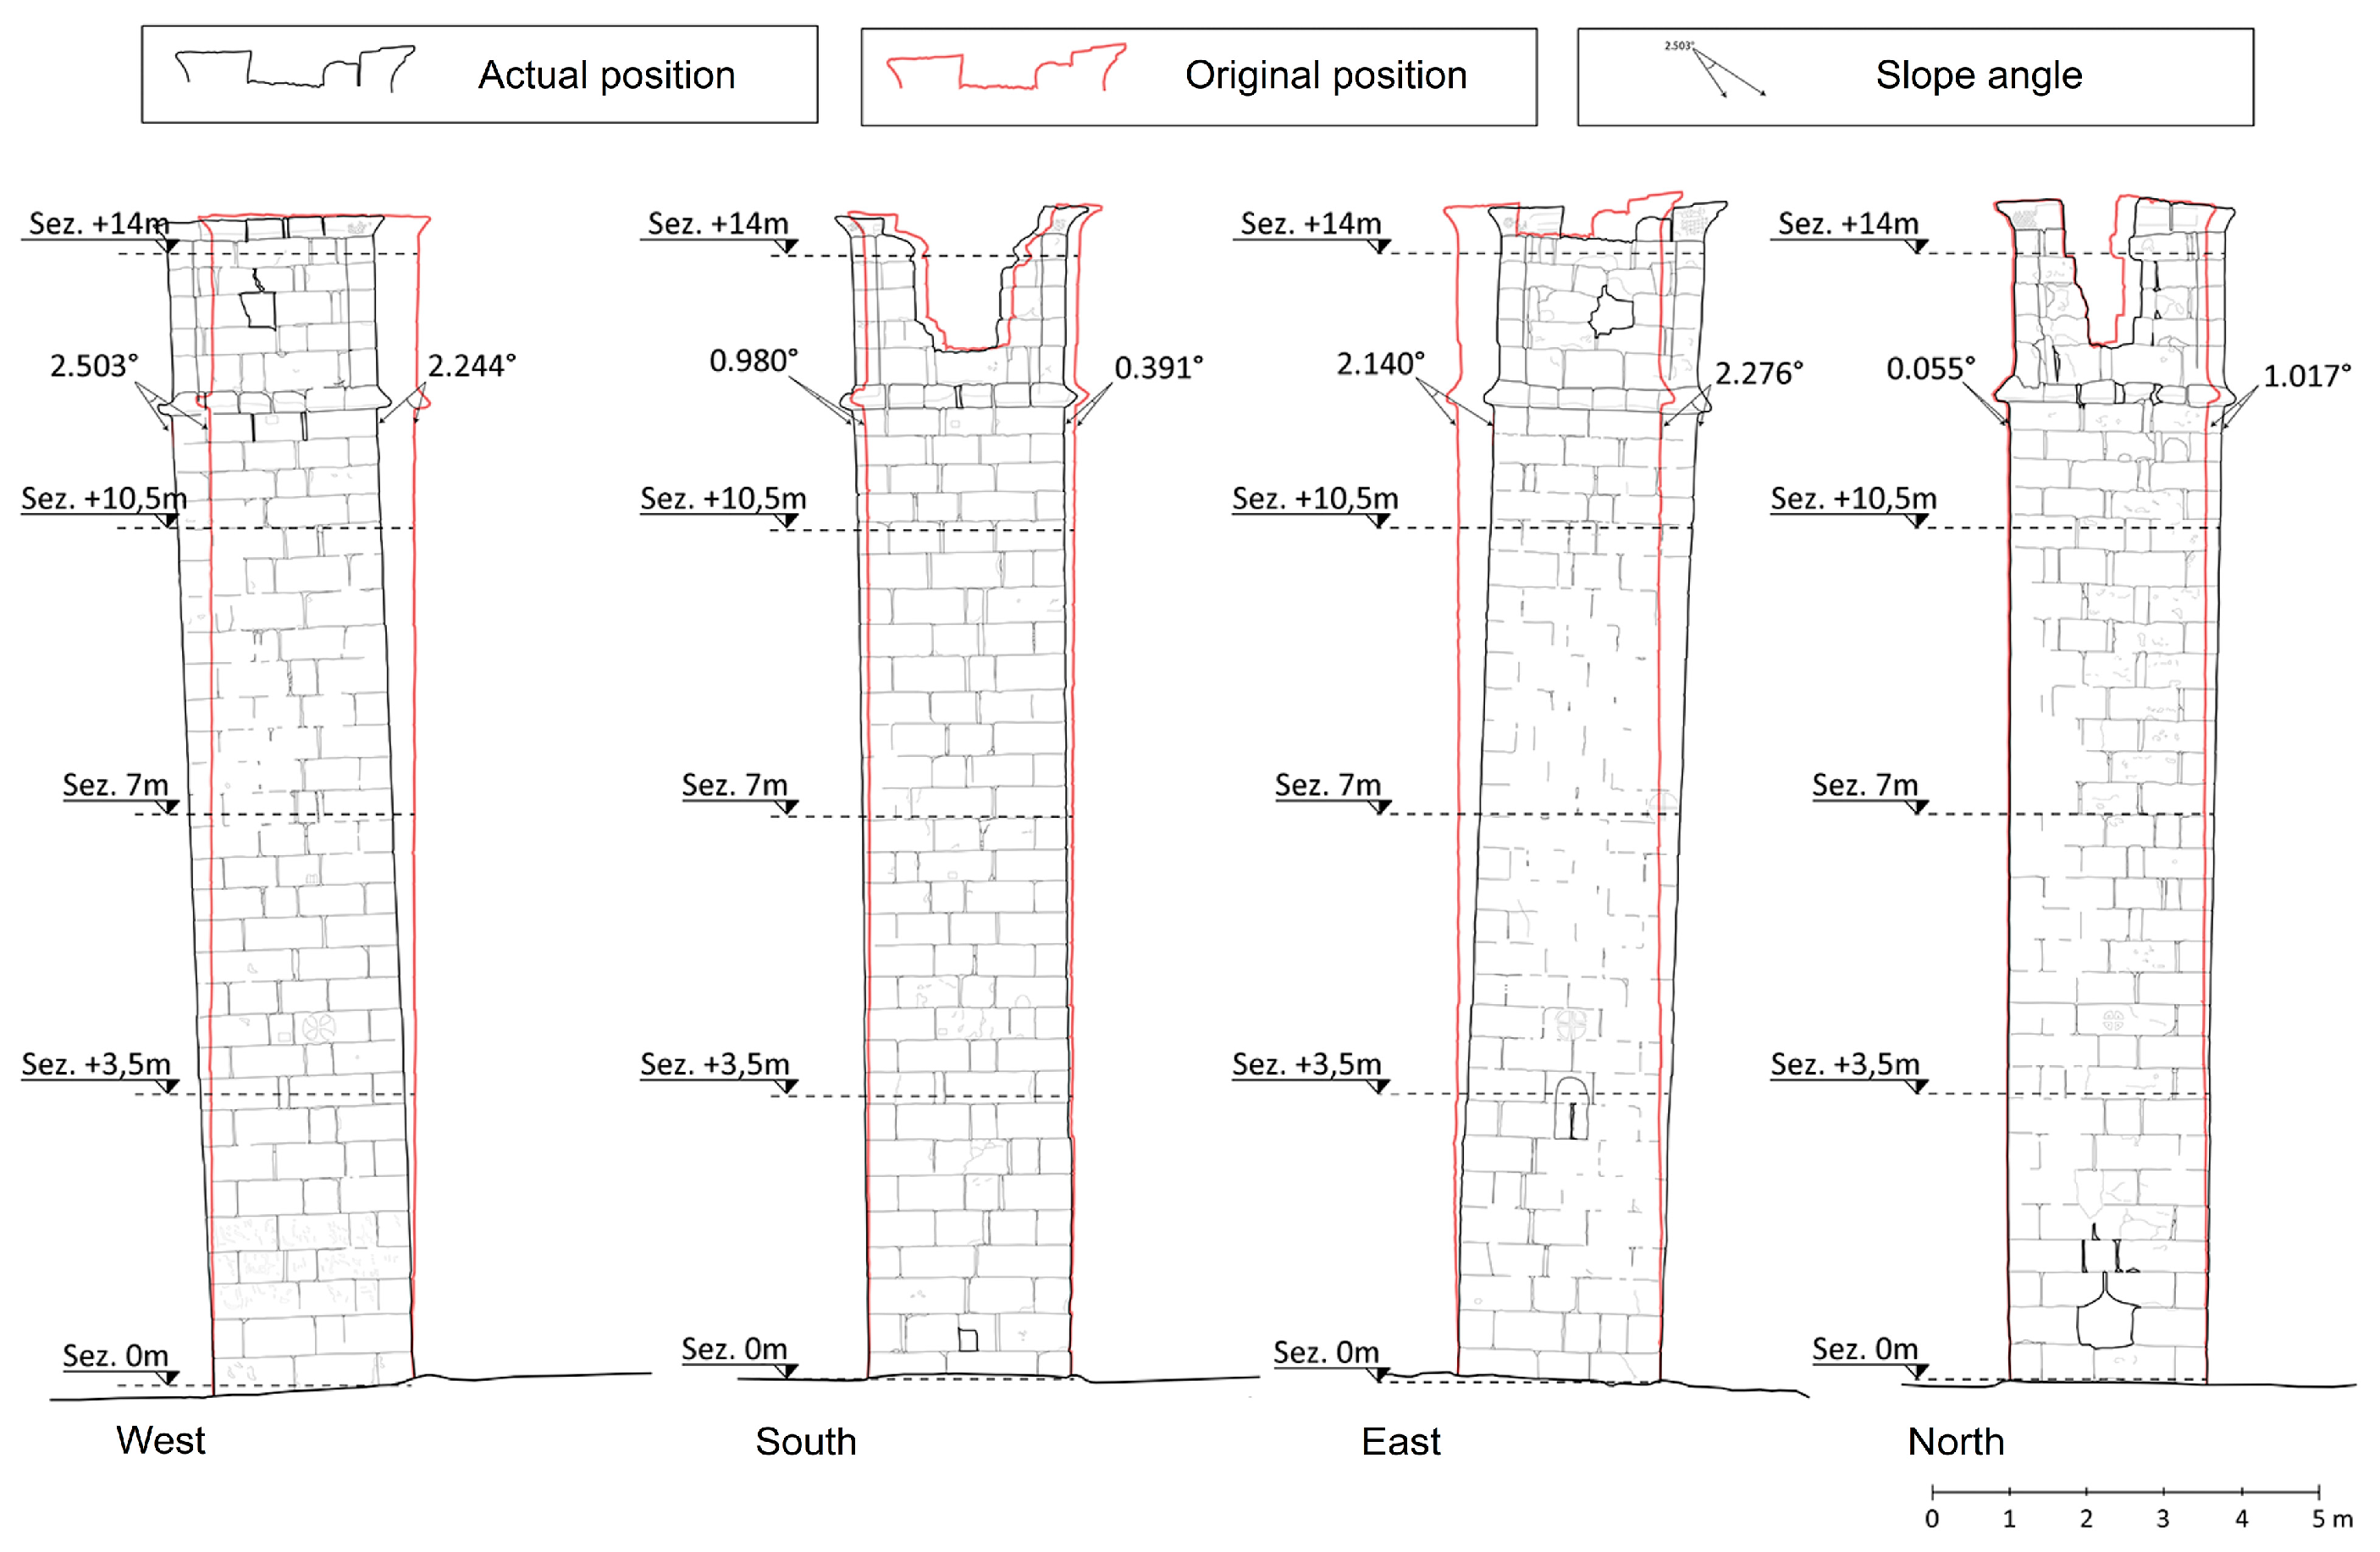
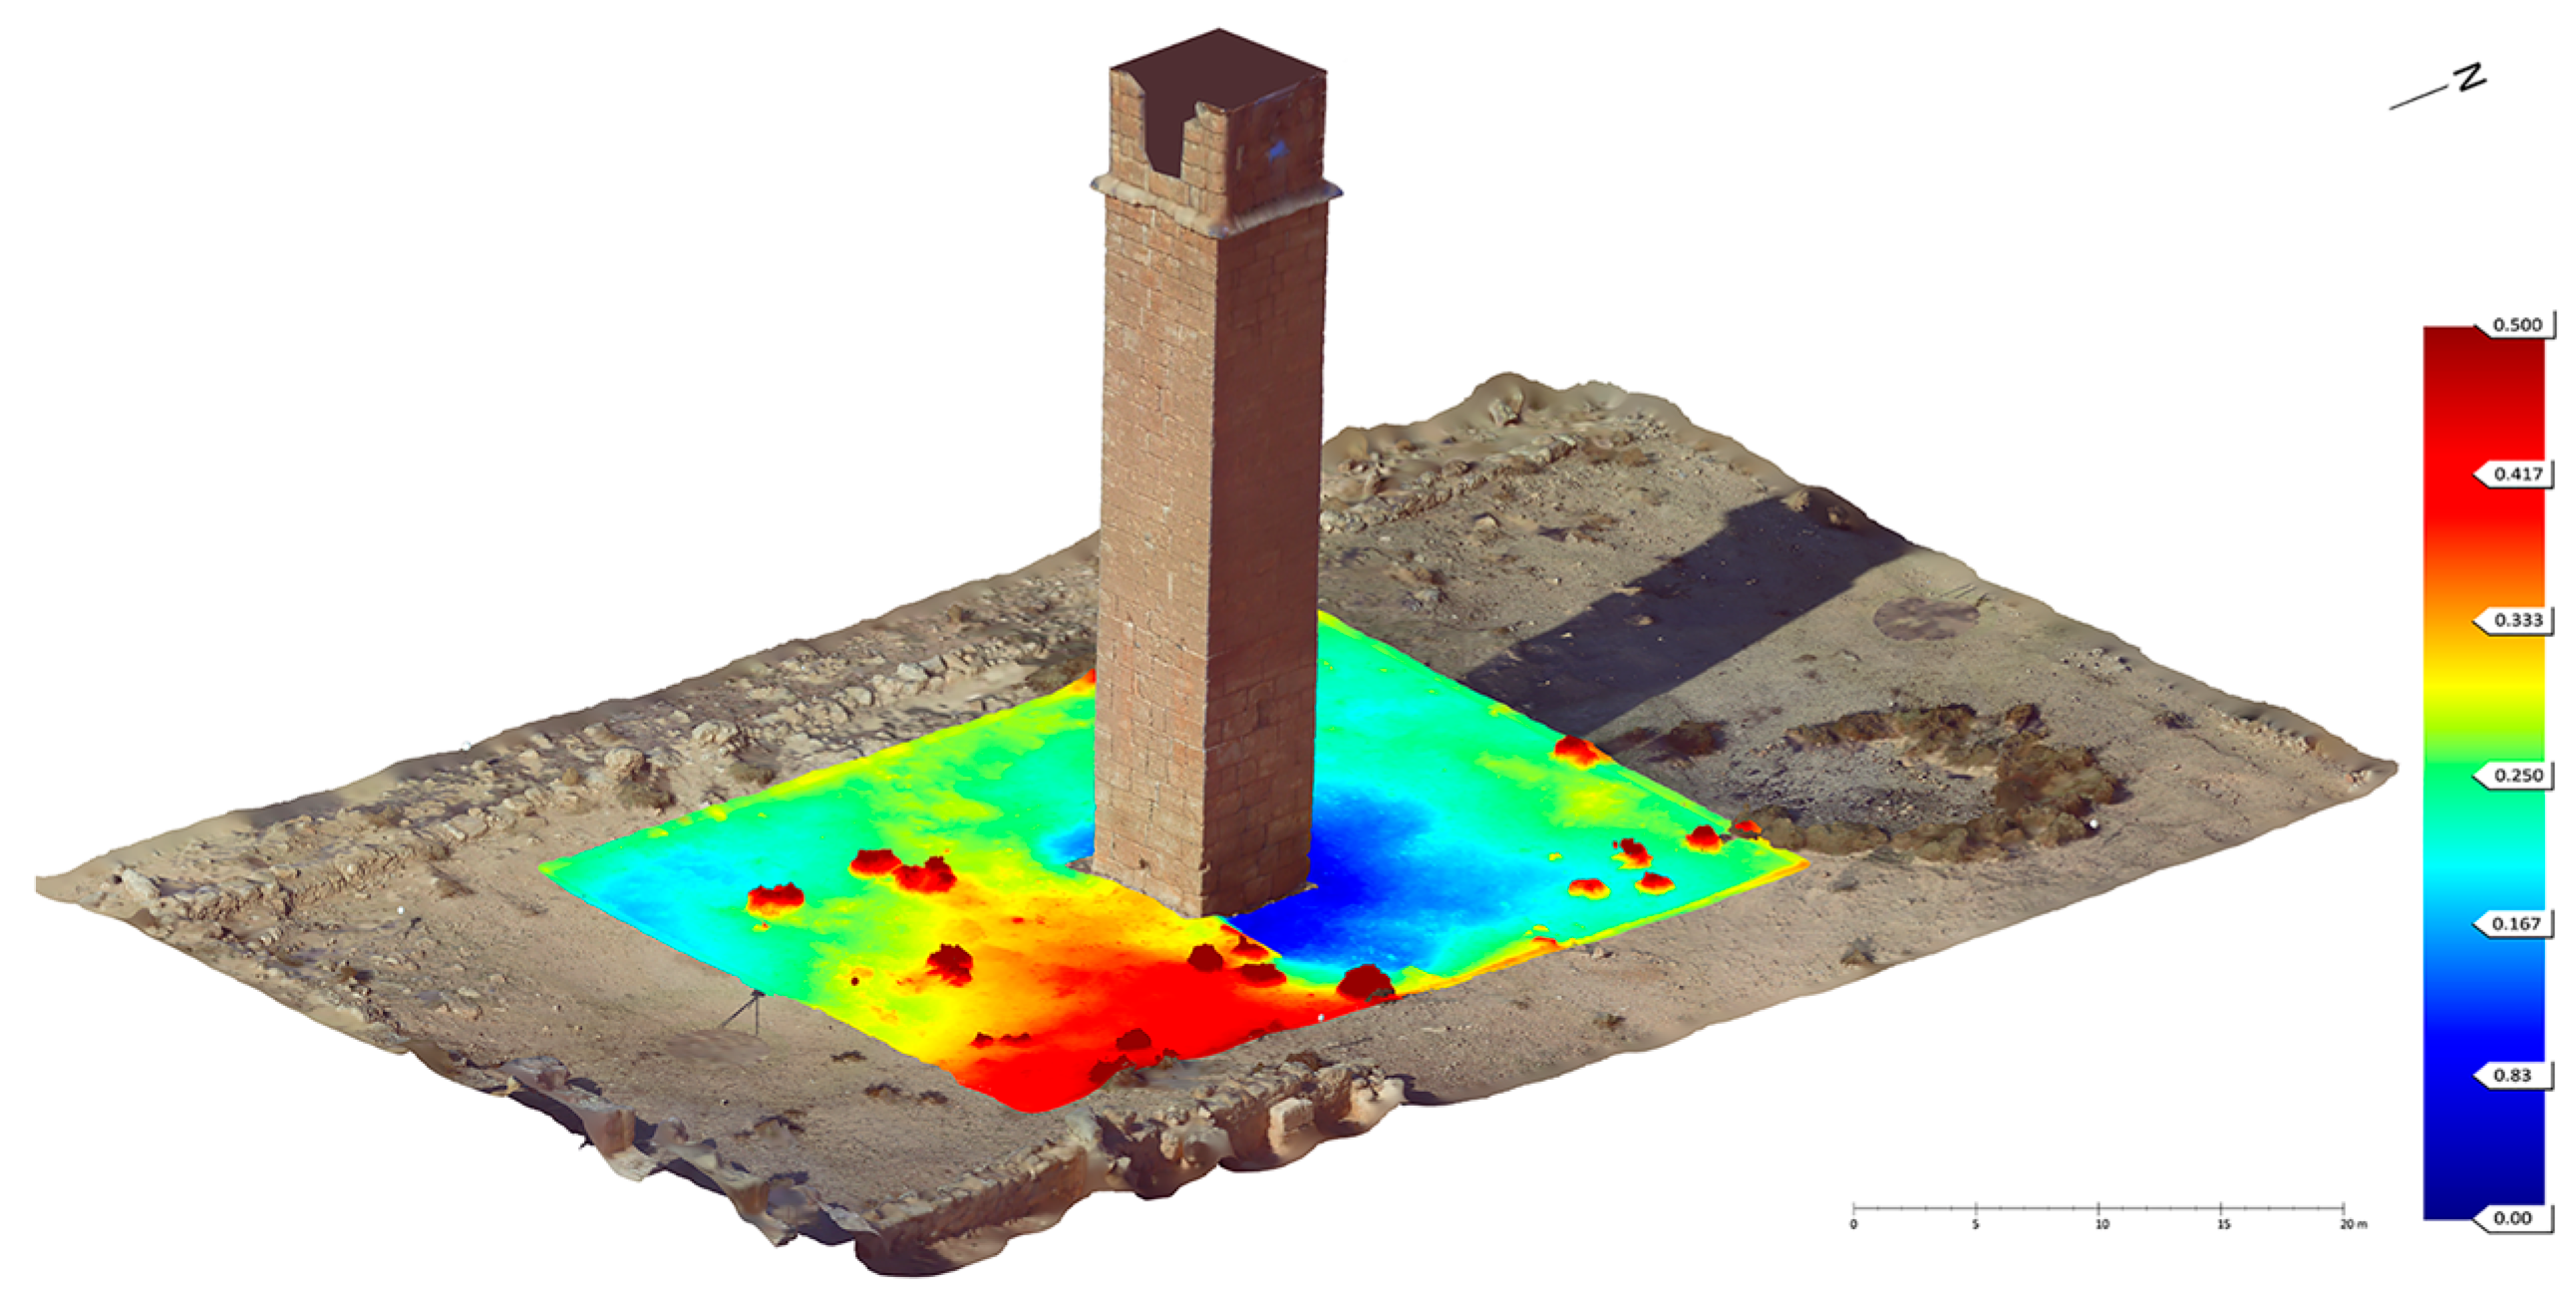
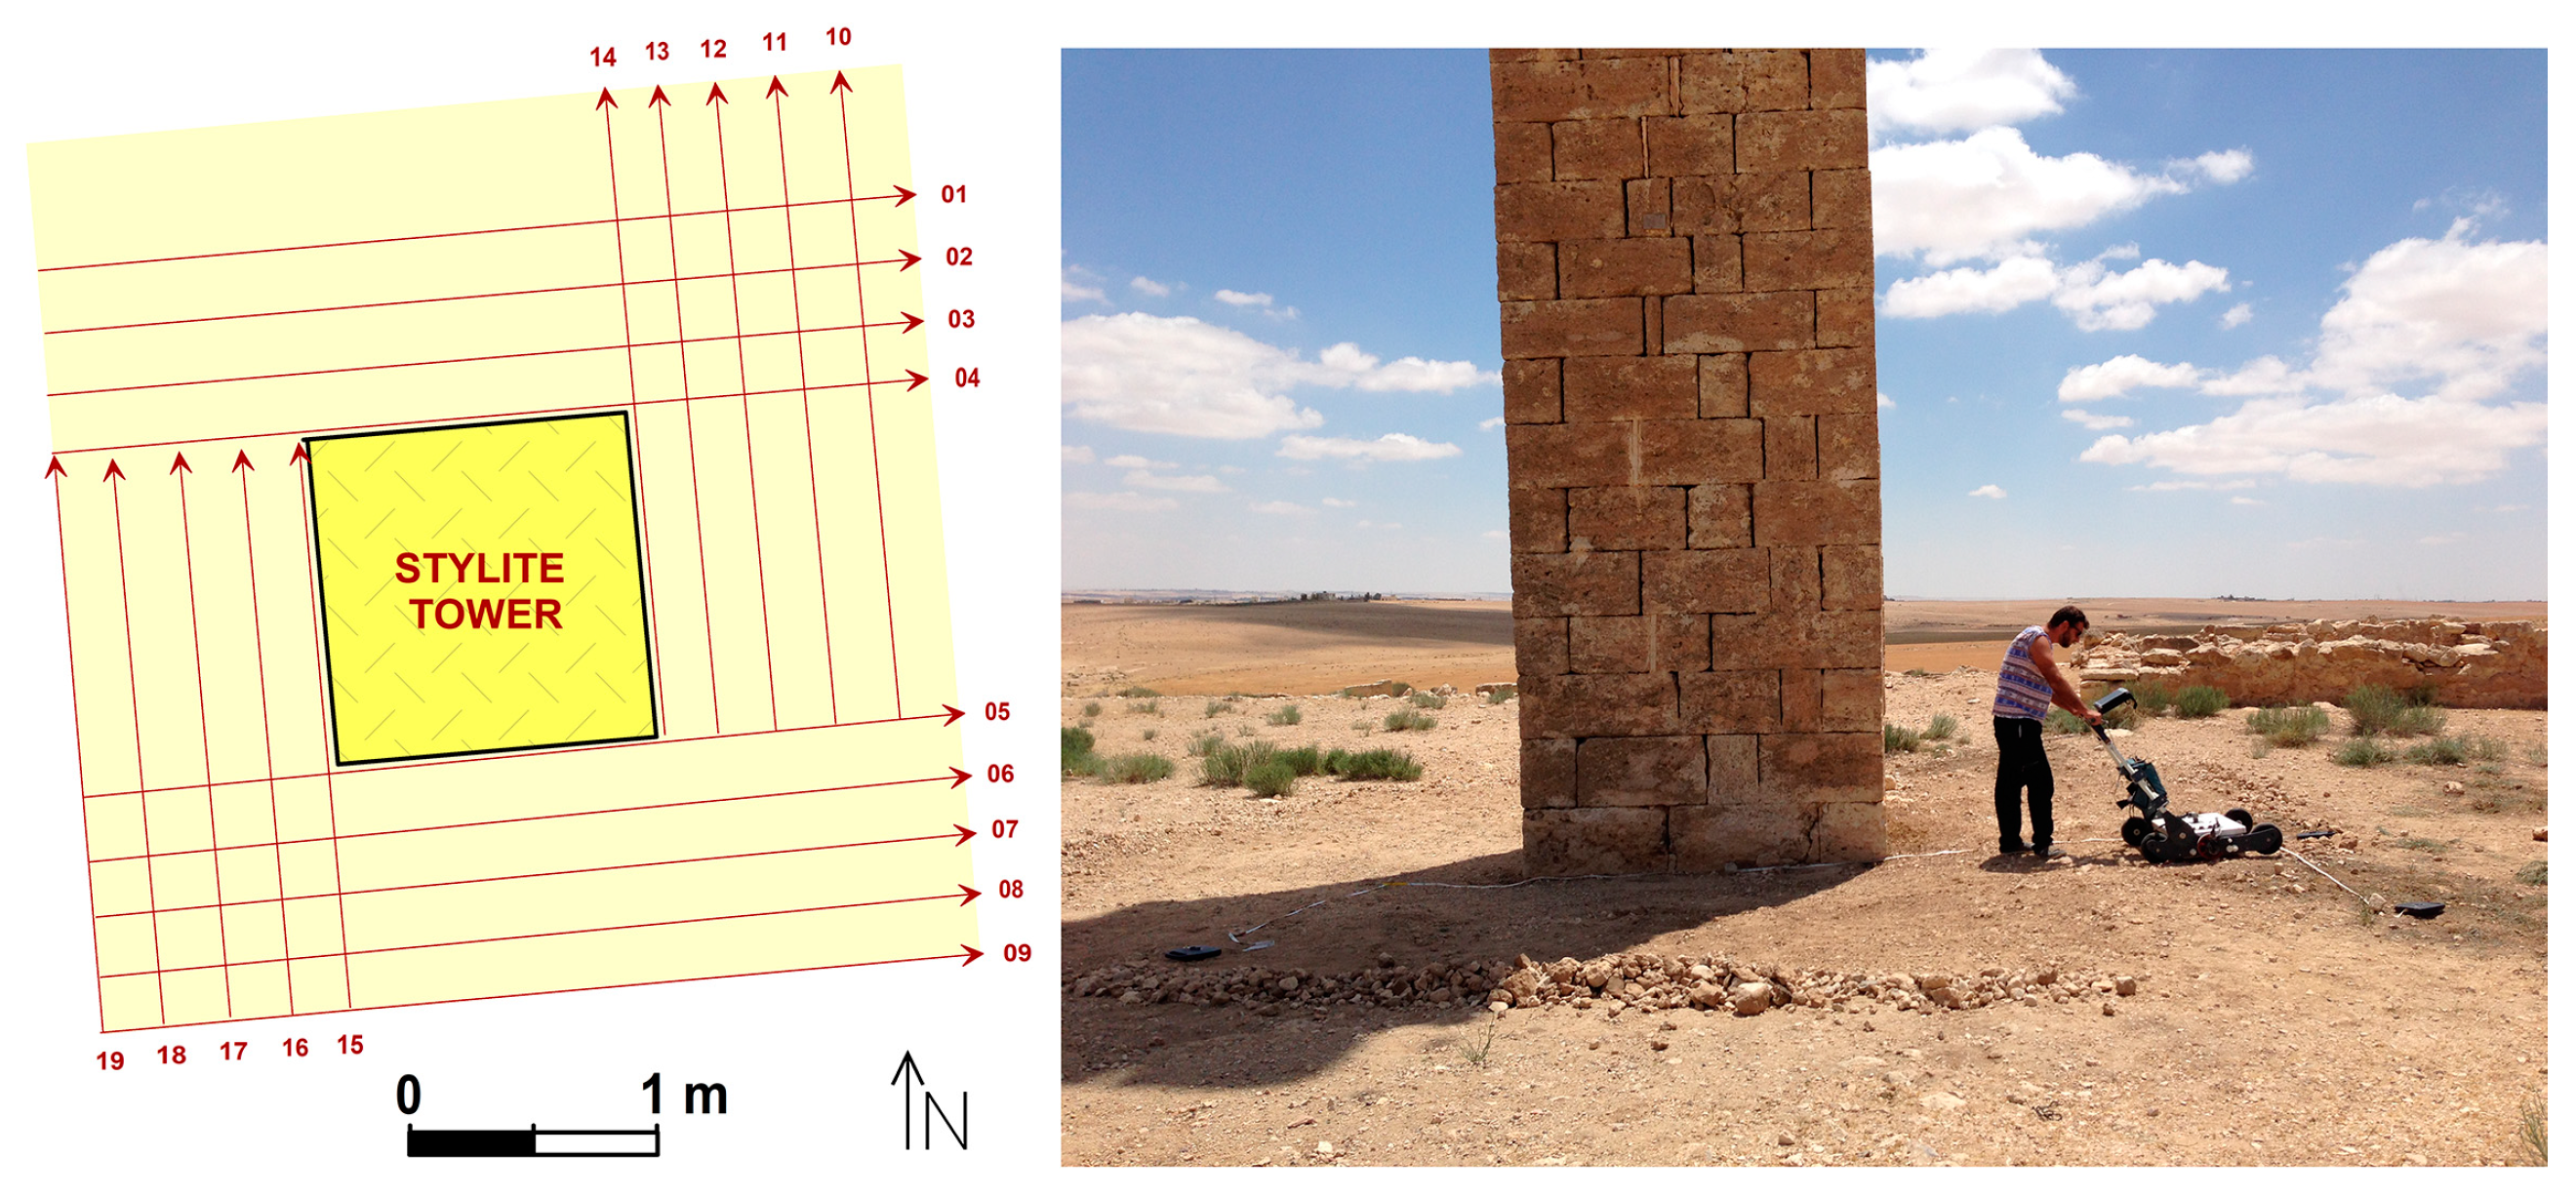
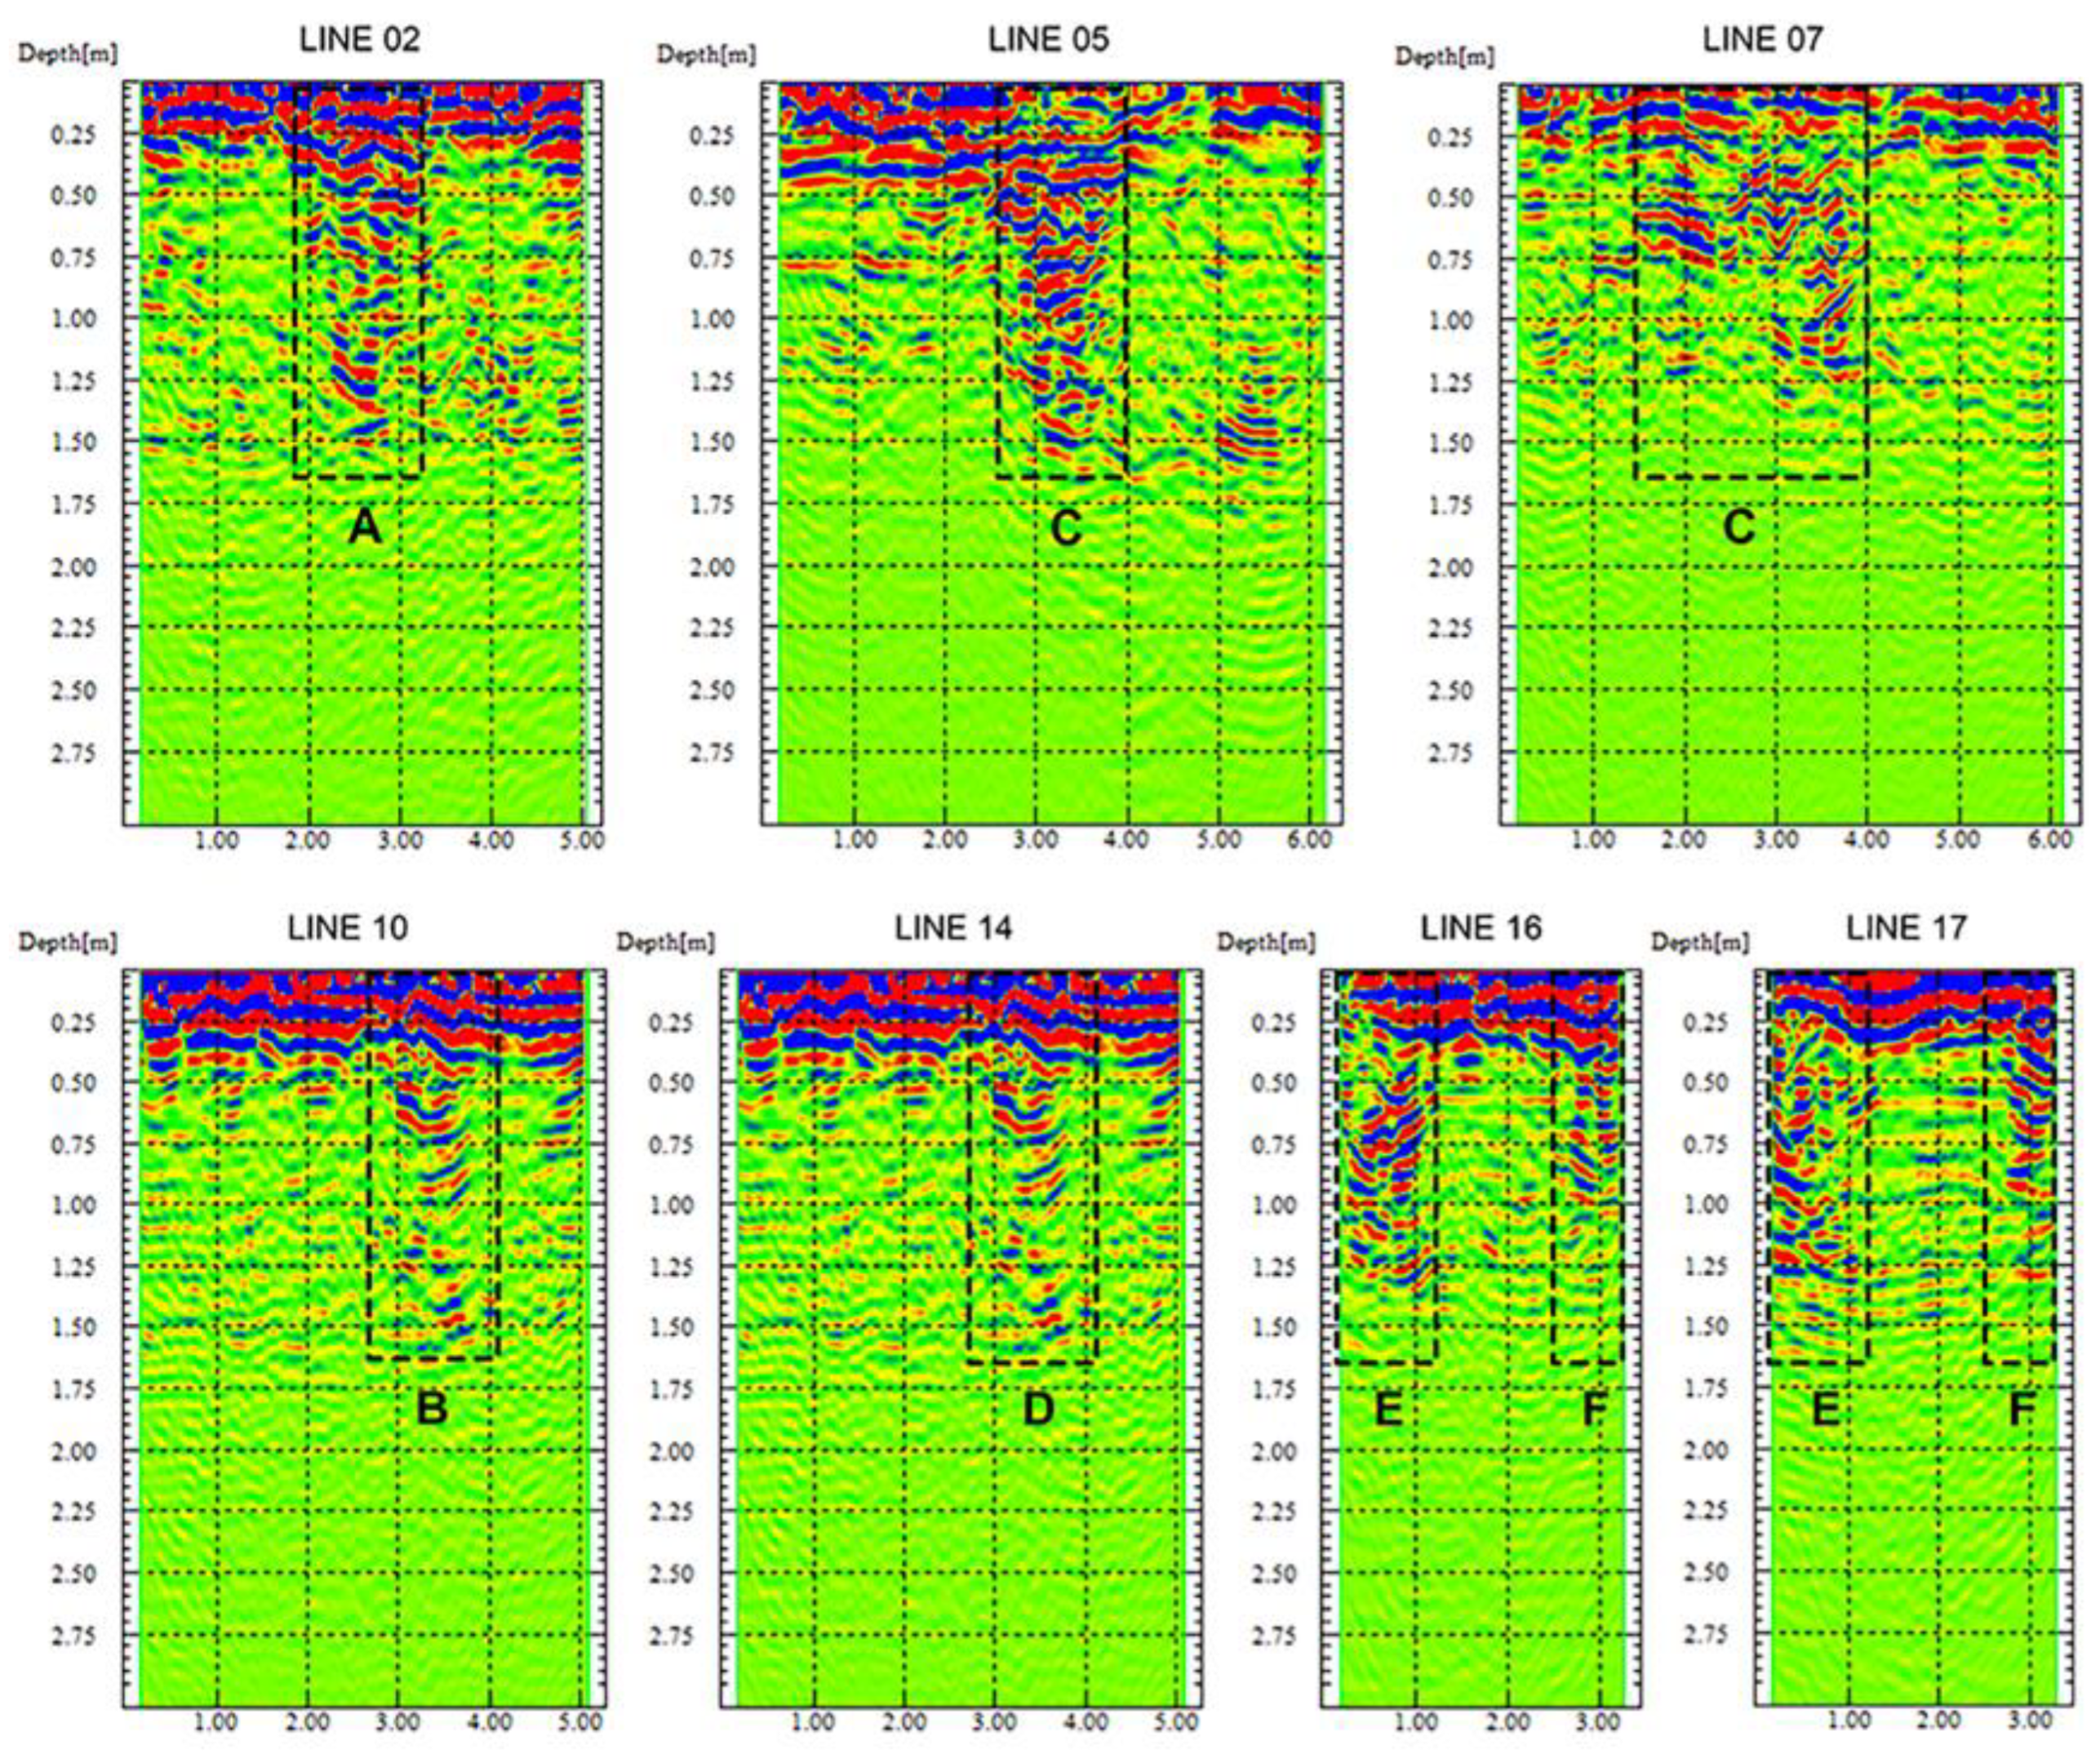
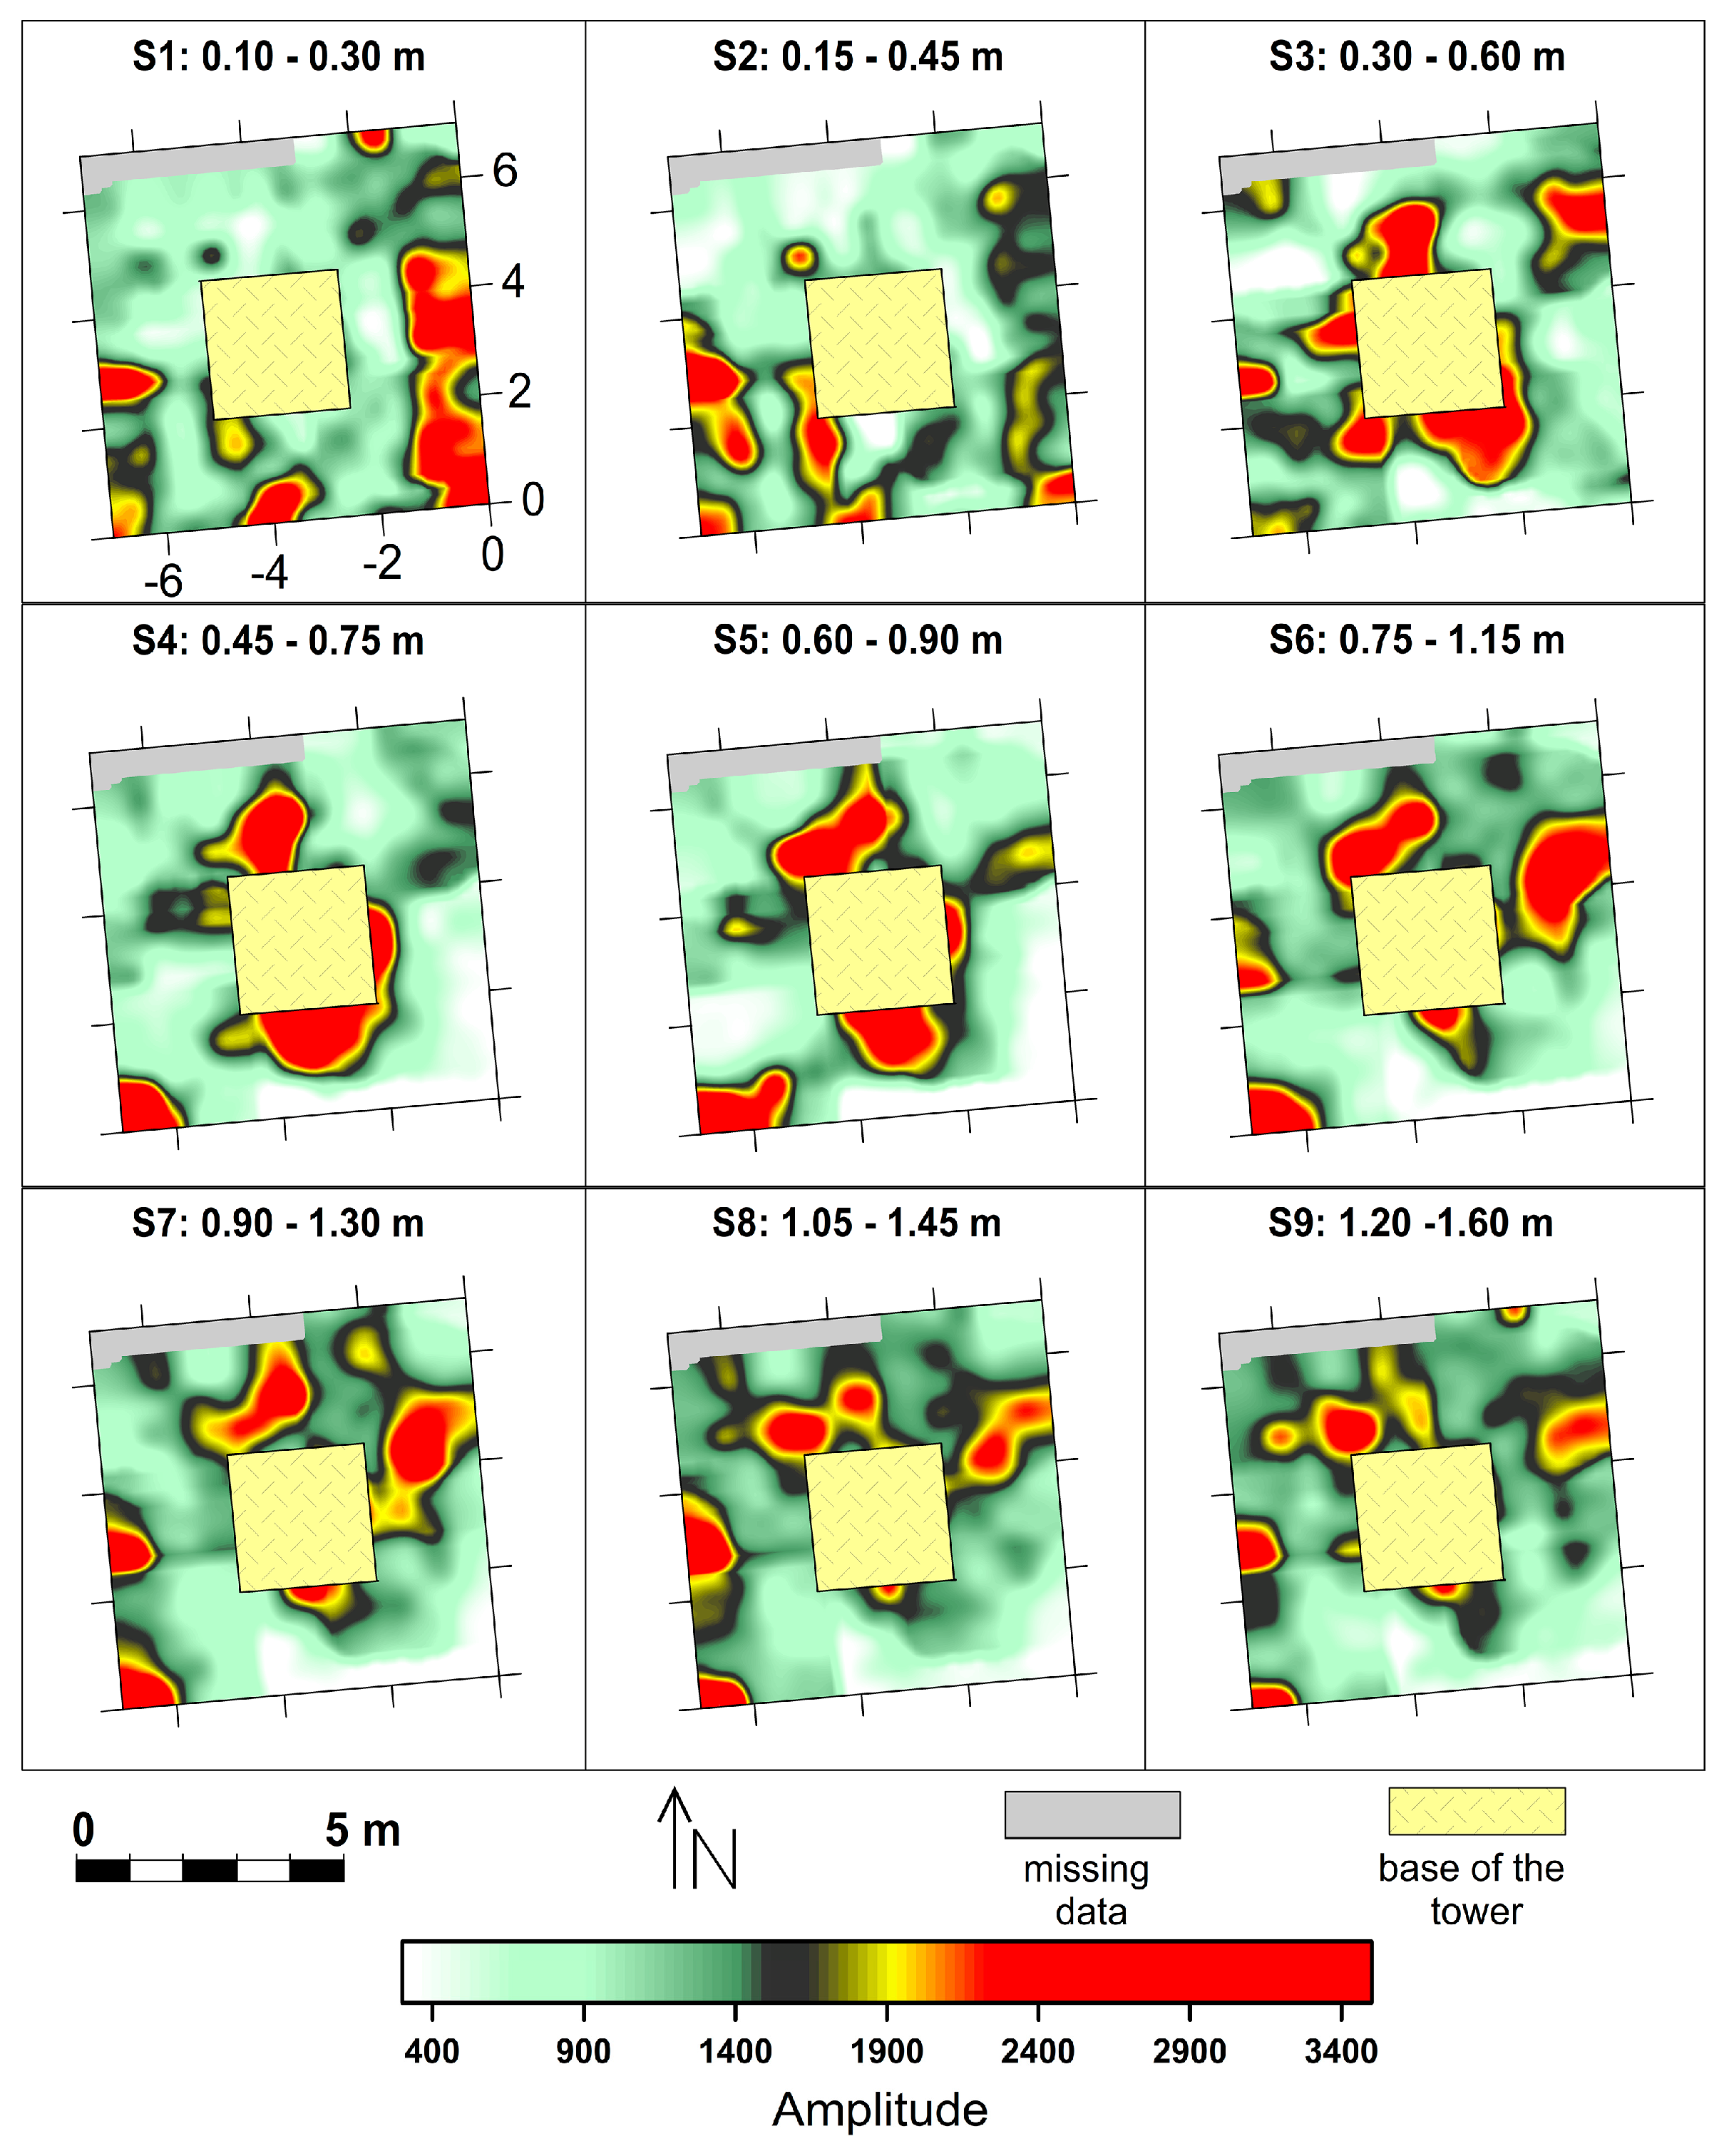
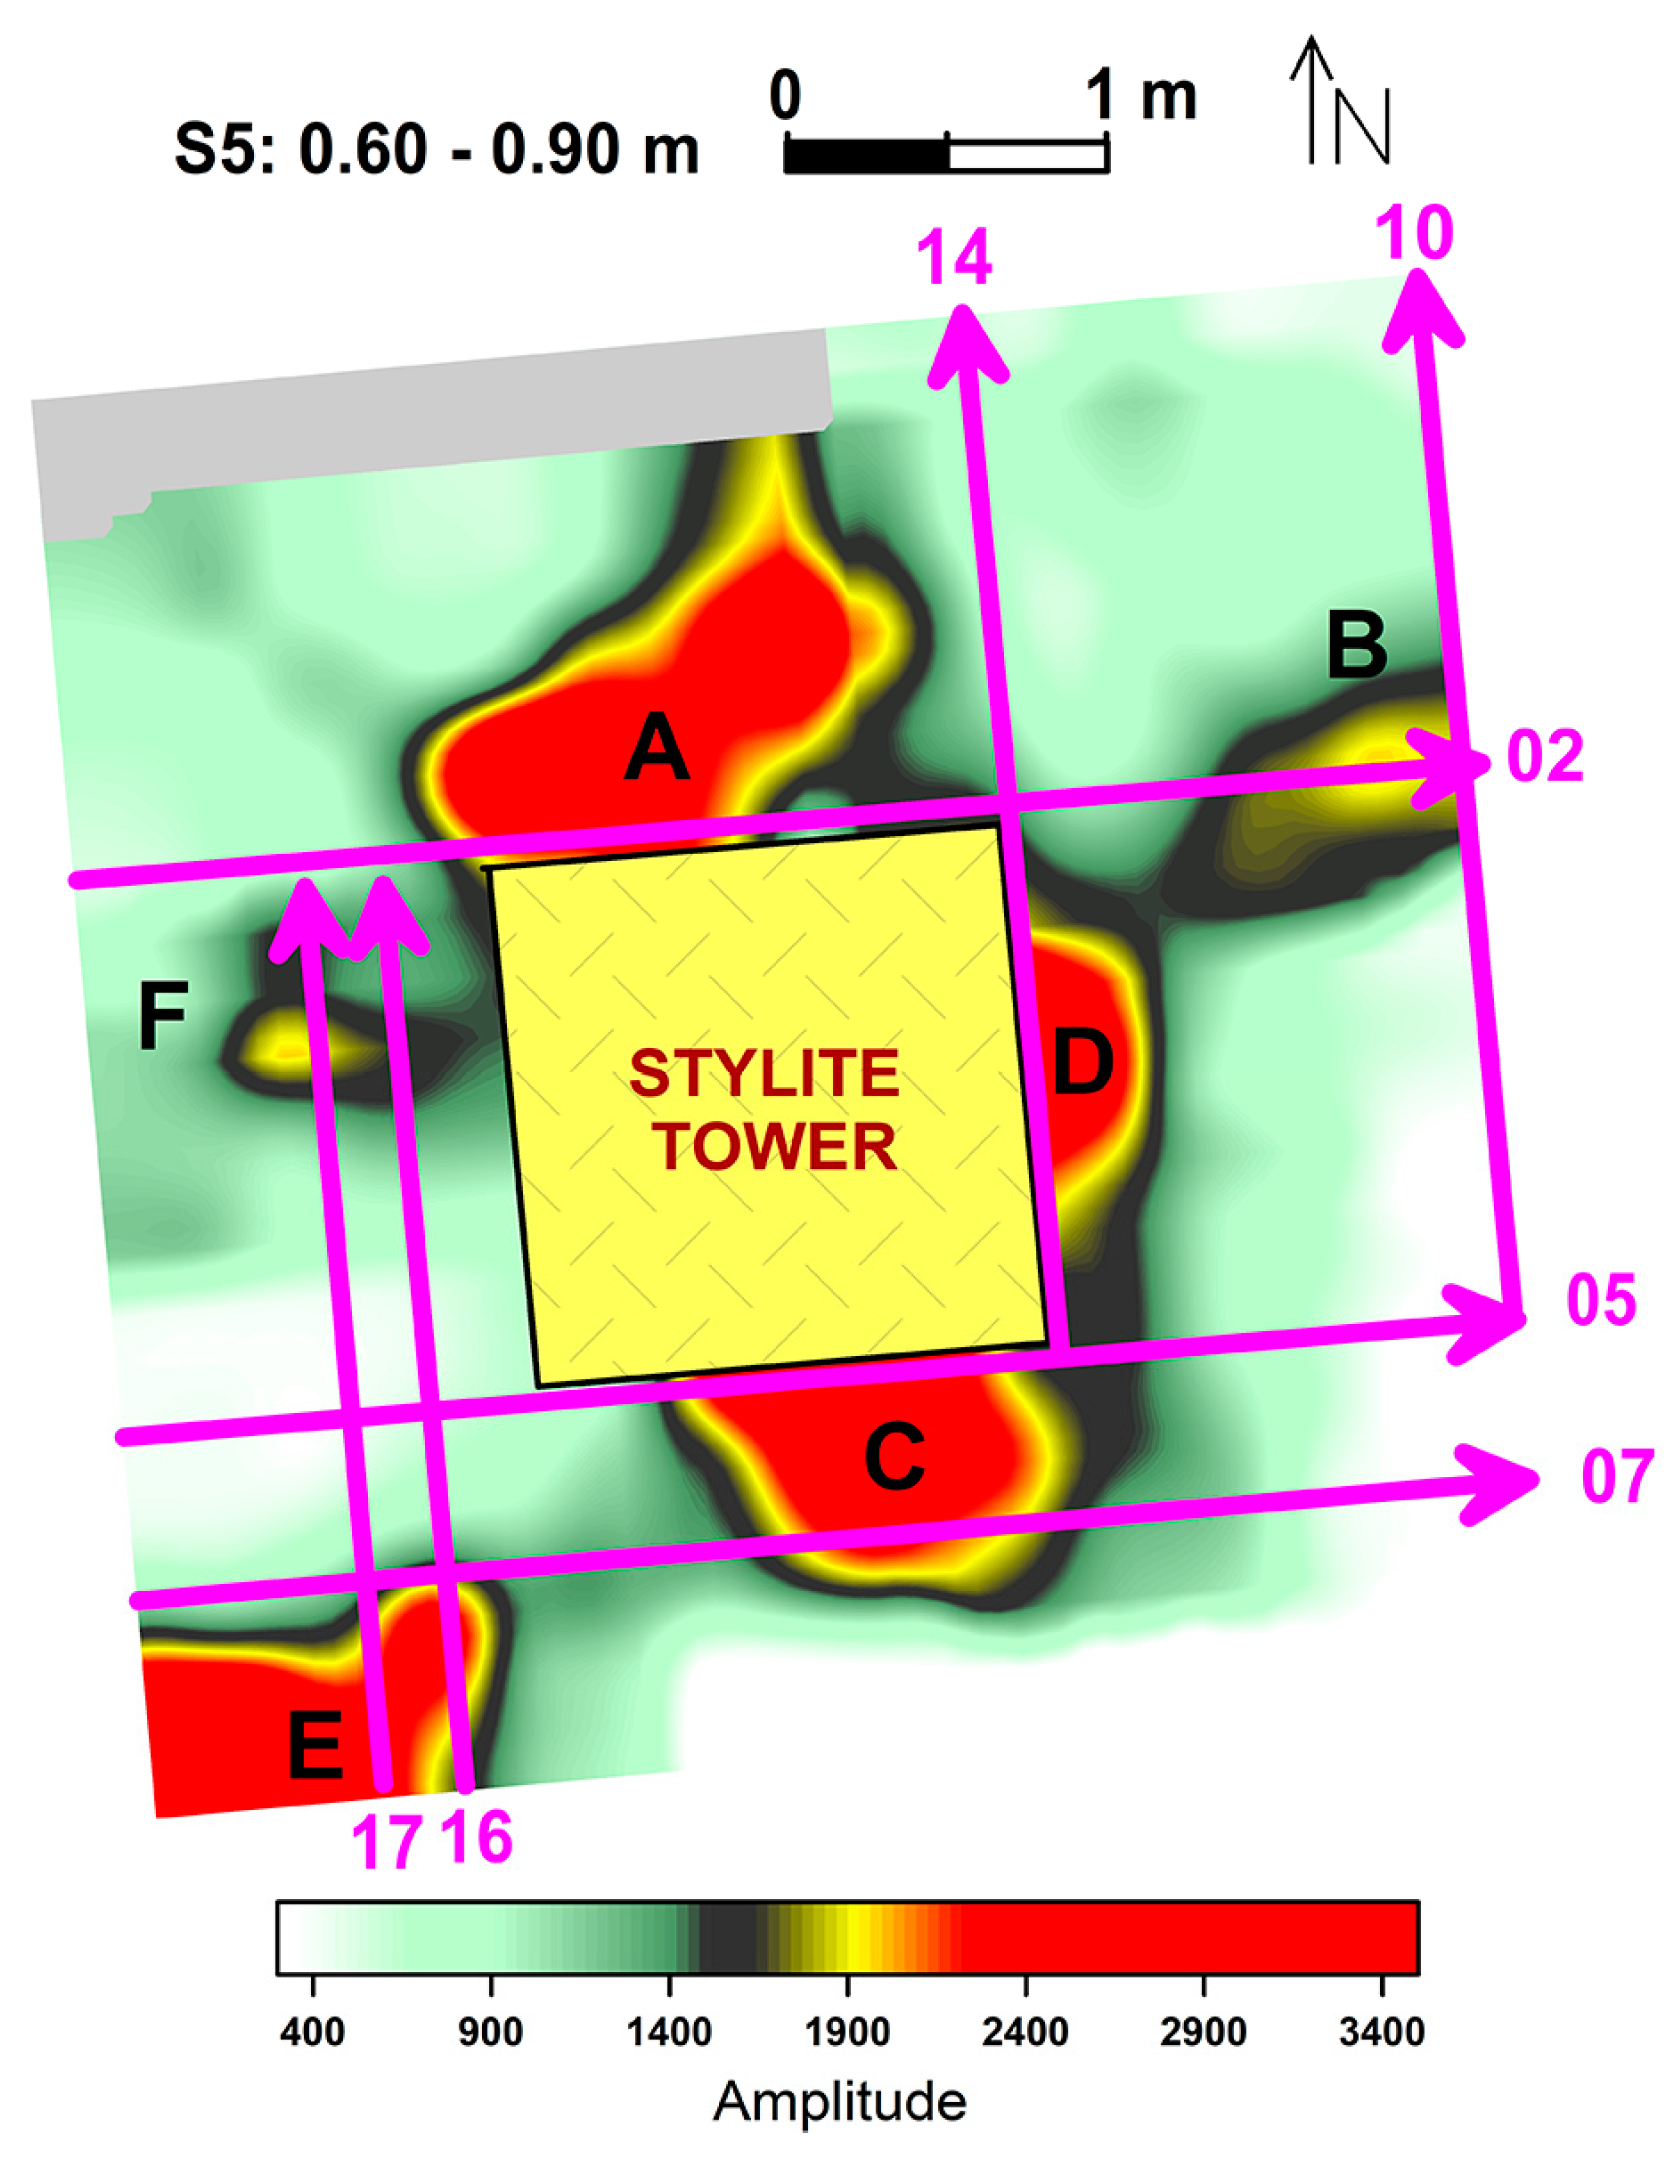
3.4.3. Results and Discussion: The Stylite Tower
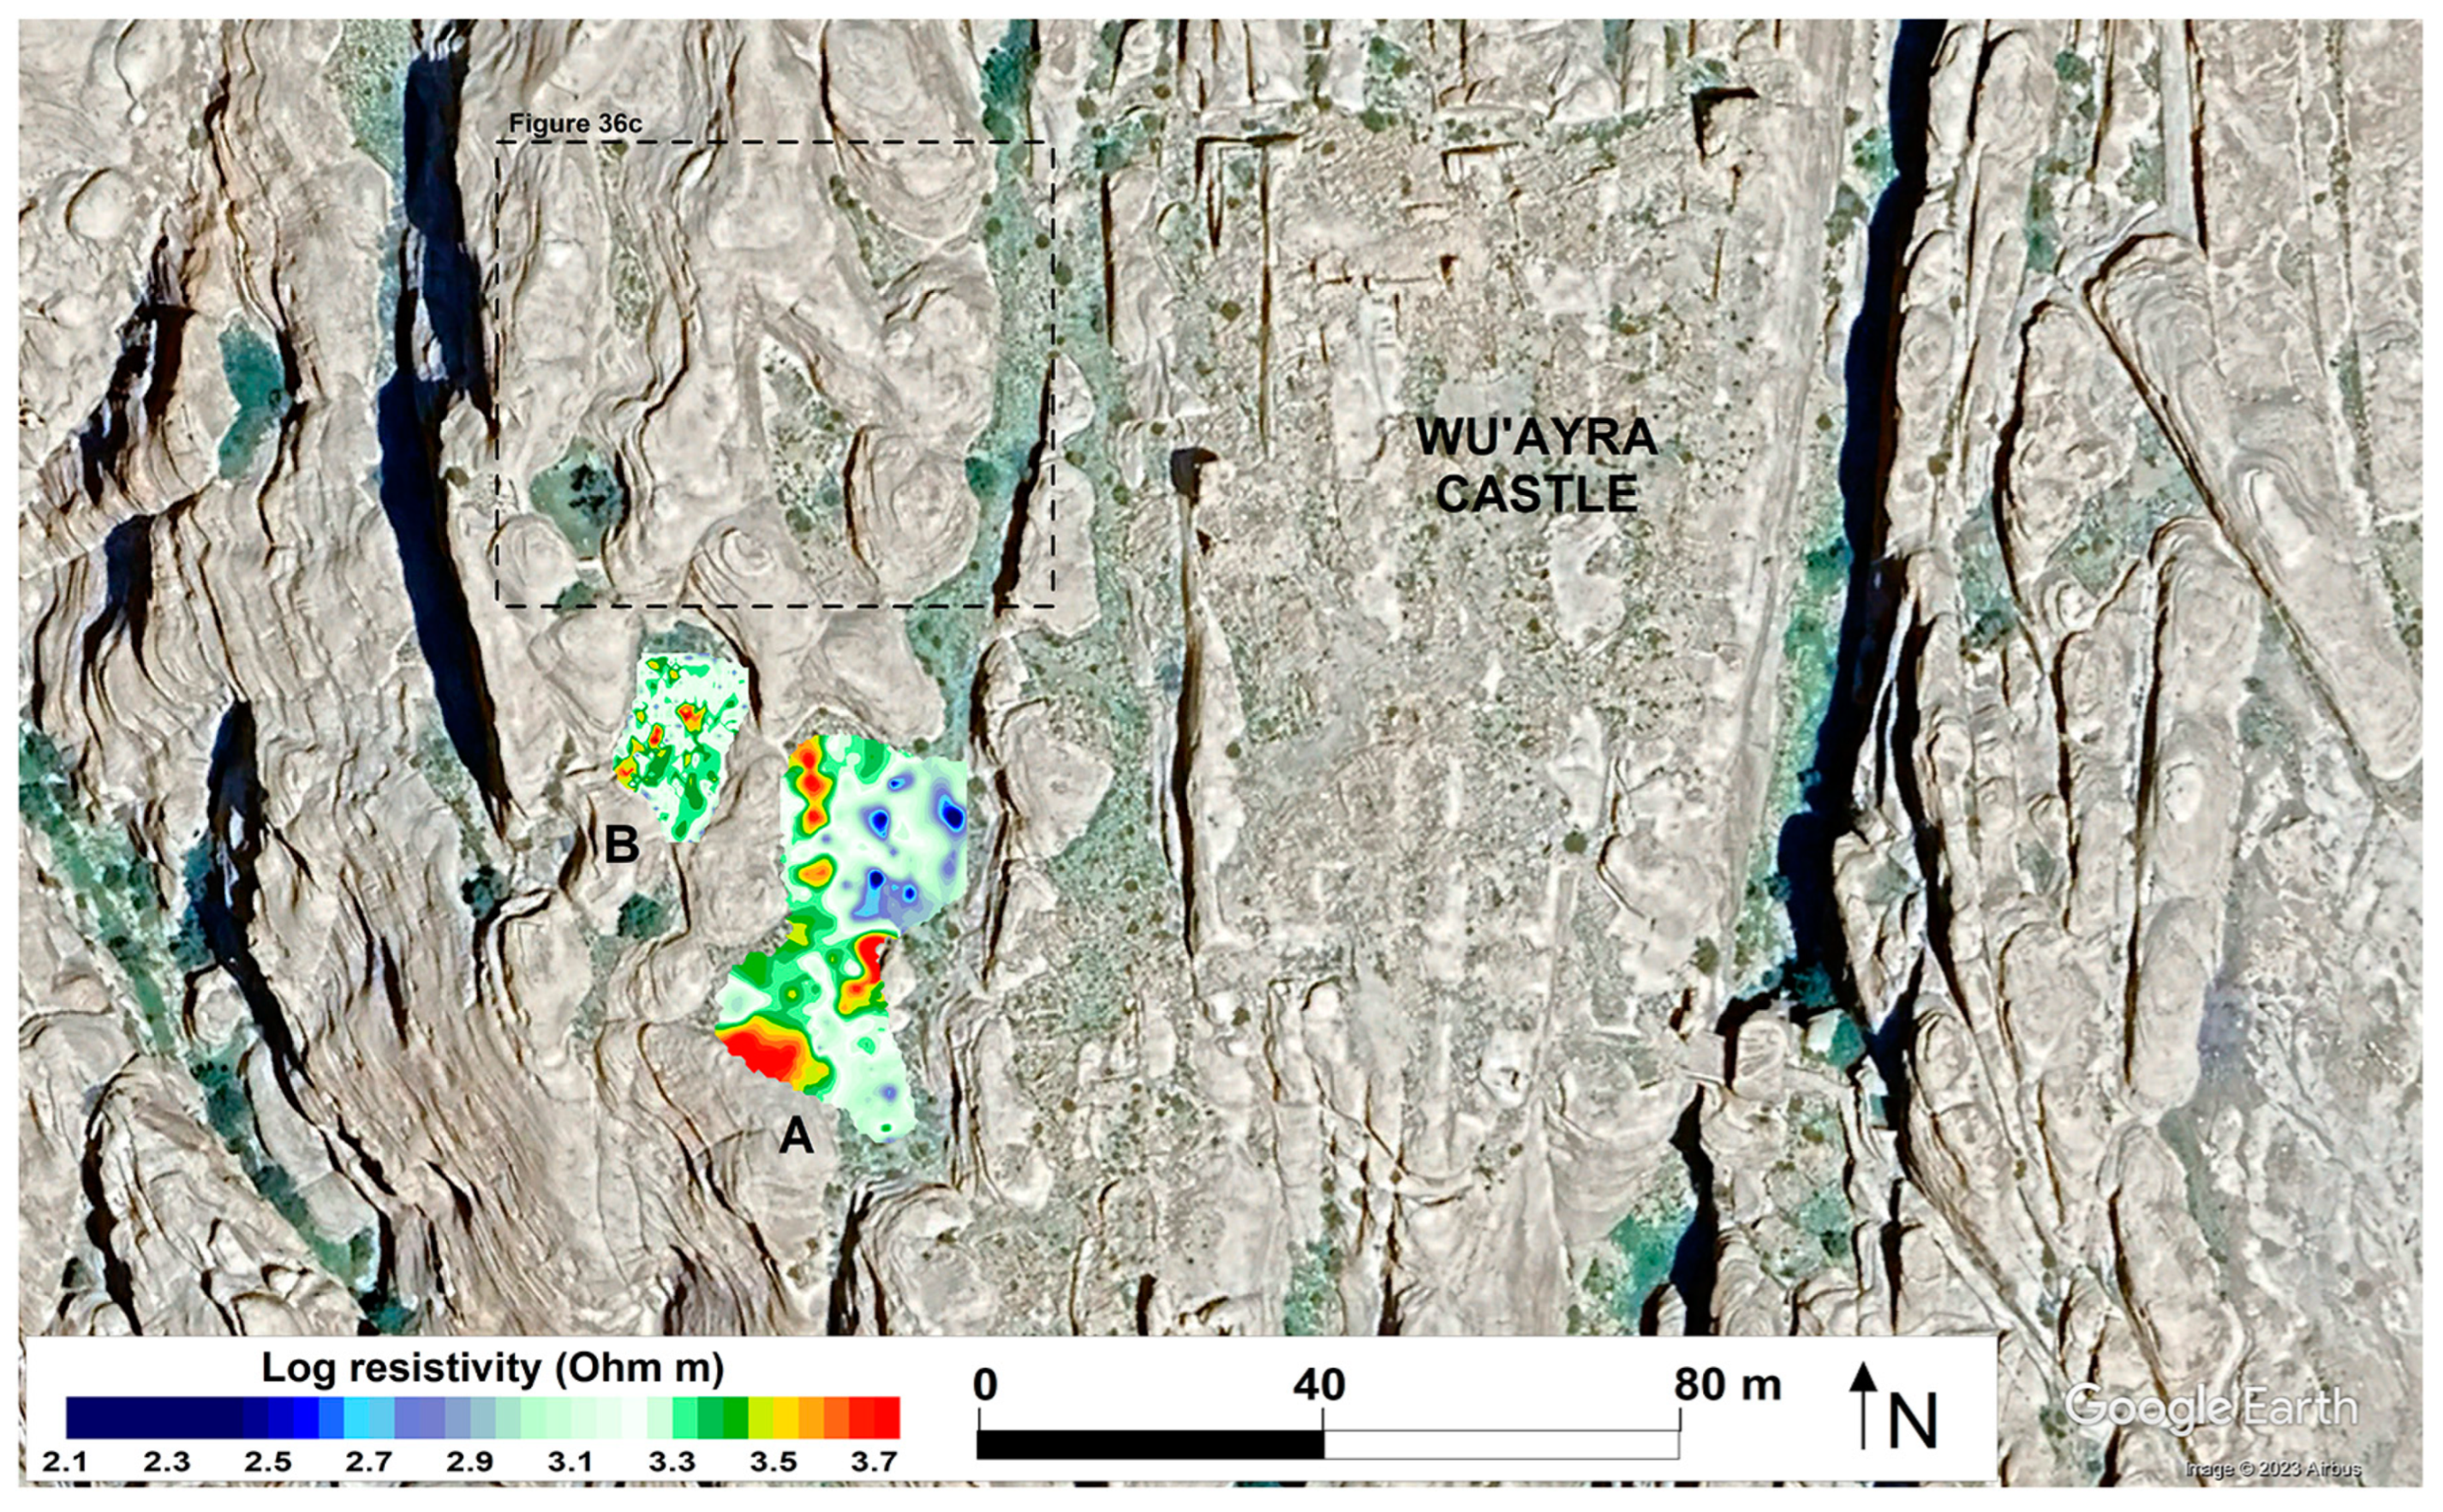
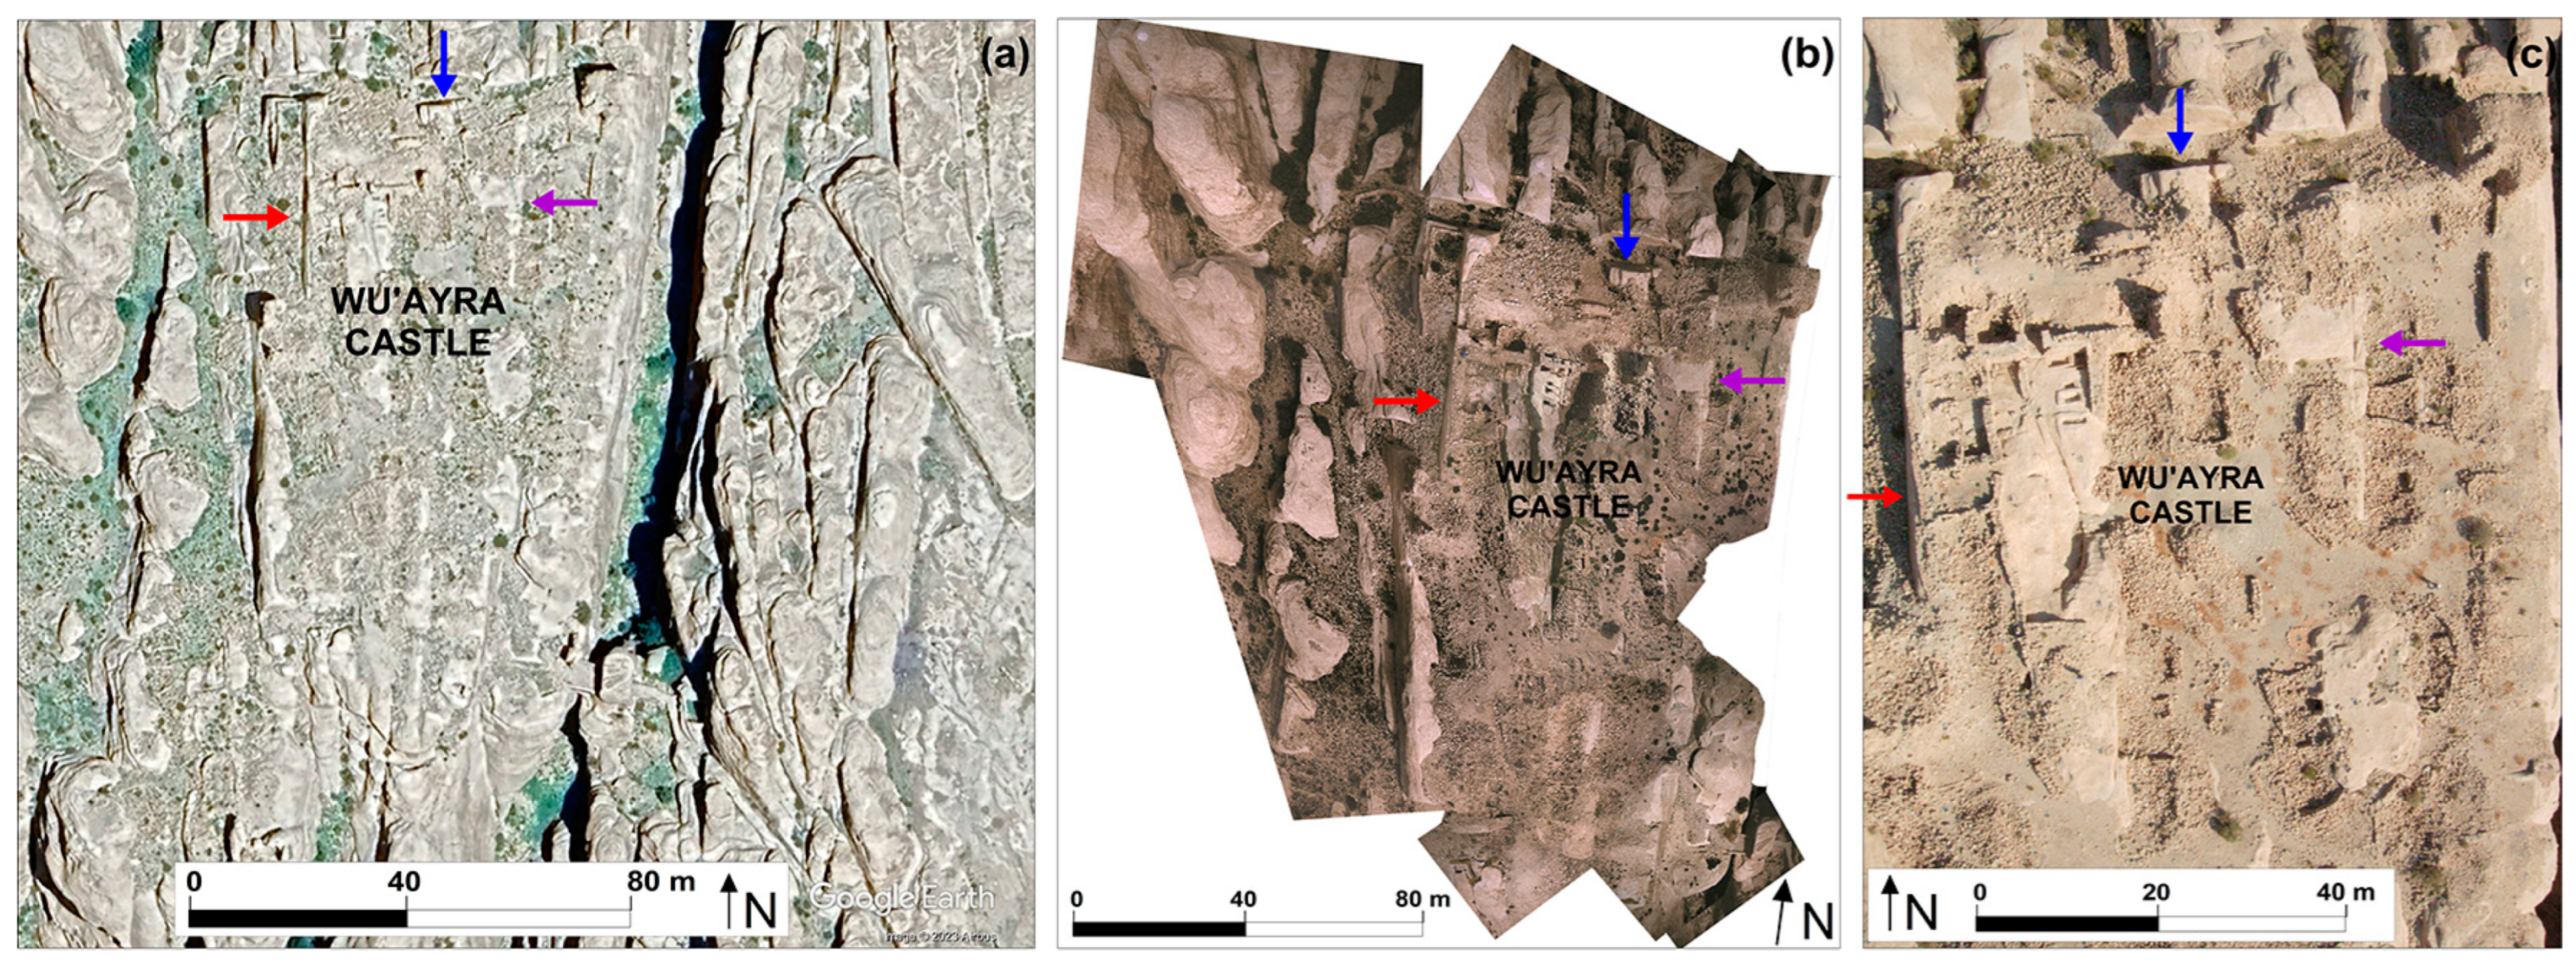
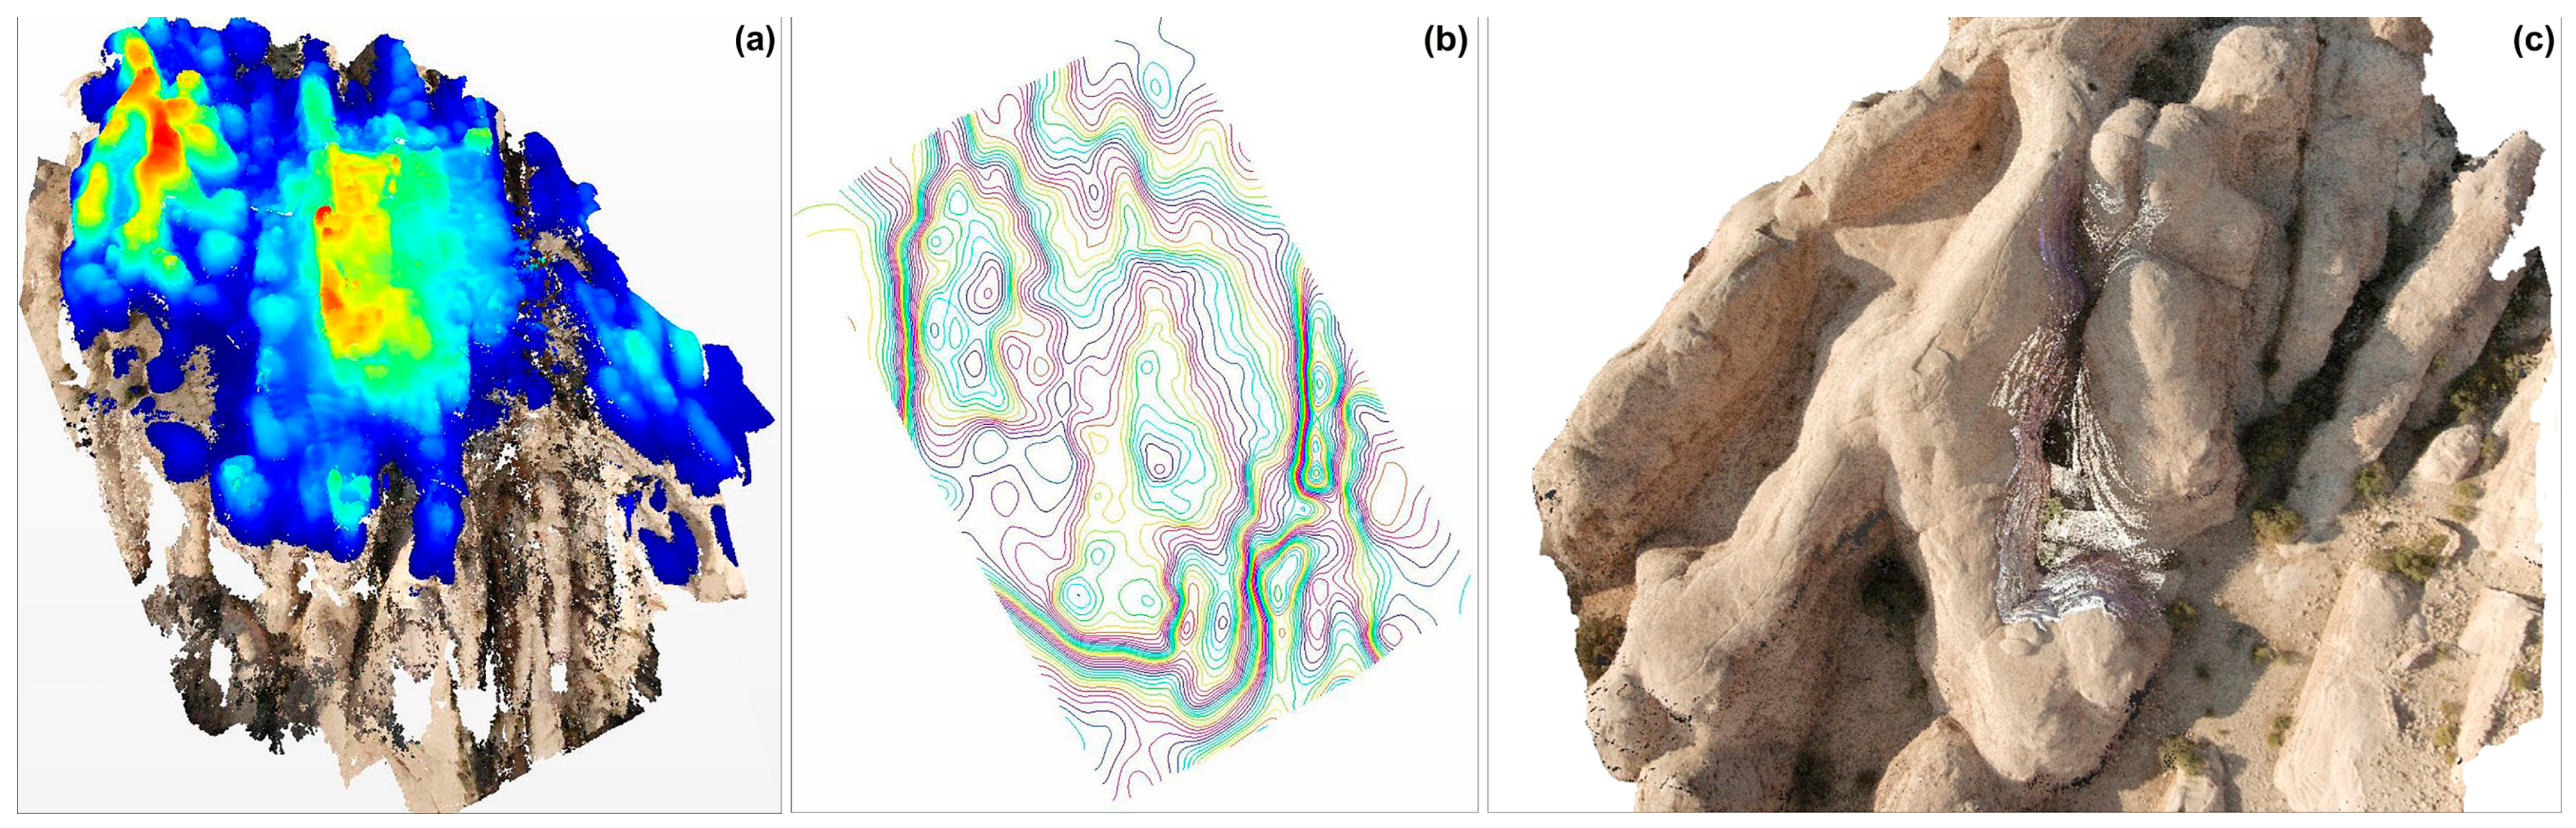
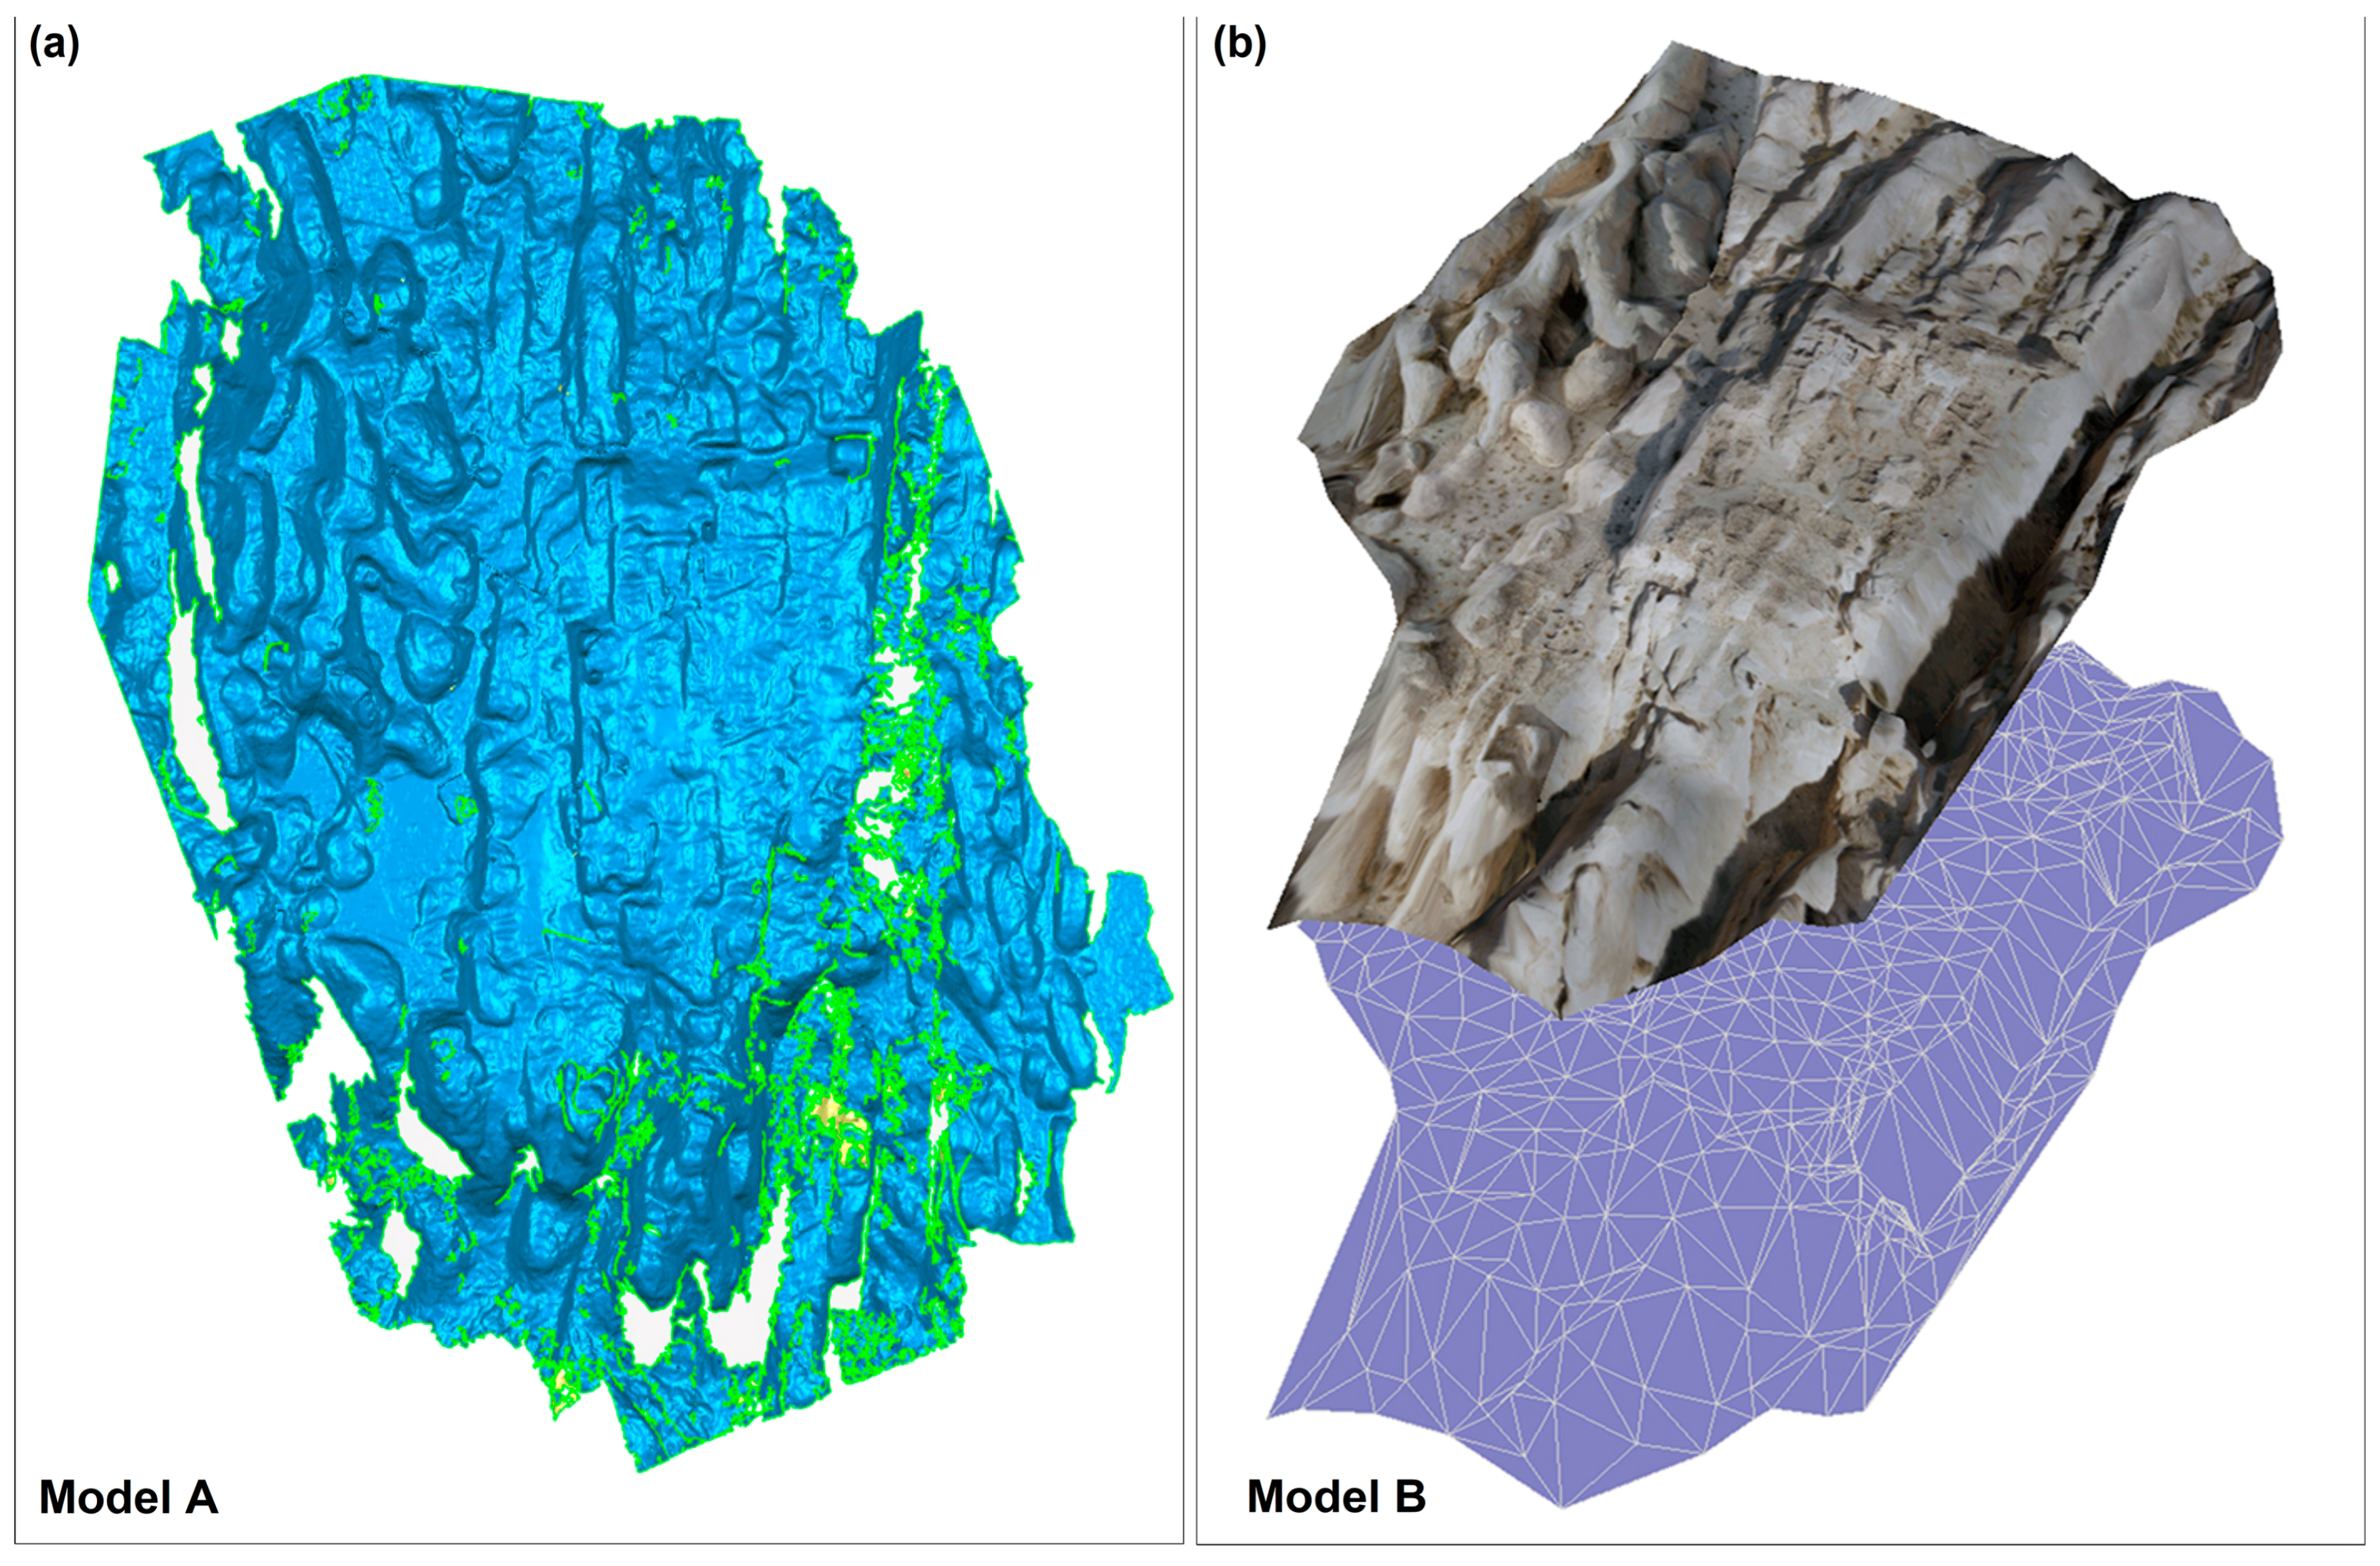
The 3D metric survey was performed in 2016. As a result, a 3D model of the exterior of the tower was created, consisting of about 12 million points (1 point every 6 mm to 10 m between the surfaces and emitter). Figure 25 shows a three-dimensional view of the RGB point cloud. The 3D model made it possible to represent the geometric deformations of the structure with great precision in the range of a few millimeters. The analysis of the model allowed a deeper investigation of the engineering and design decisions that could underlie the design of the tower. The size relationship is probably related to the Byzantine measurement system. The base is perfectly square, and the sides have dimensions between 2.52 and 2.59 m, corresponding to 8 Byzantine feet [99]. Although the top of the monument has not been studied because it is incomplete today, we can suppose that the realization of the tower was designed using Byzantine metric units, taking into account the biblical meaning of the numbers.
The point cloud was used to extract plans and sections. Figure 26 shows an example indicating the location of five horizontal sections in relation to the main body of the building at different elevations. From the drawings, it can be seen that the center of gravity of the tower deviates from the bottom to the top towards the northwest and the upper part is slightly rotated.
Figure 27 reports a technical diagram of the four facades (north, south, east, and west), the location of the vertical sections, and the skewed profile of the Stylite tower (current profile, previous profile, and angle of unevenness). The comparison between the four sections shows that the tower is out of plumb by 2.28 degrees compared to an ideal vertical axis. Figure 28 shows the digital elevation model (DEM) of the tower’s floor superimposed on the 3D model. Within the color scale, the red and blue colors represent the highest and lowest depths of the soil, respectively. The DEM shows that the slope of the tower is where the soil has a shallower depth, to the northwest. Figure 29, Figure 30, Figure 31 and Figure 32 show the main results of the GPR investigation. For brevity, we show six radargrams of the entire data set in Figure 30 to give an idea of the type of input data used to process the depth slices. Black dotted rectangles and letters mark the occurrence of various shallow anomalies in the 0–1.6 m depth range. Lines 02, 05, 07, and 14 were recorded near the north, south, and east sides of the tower, respectively. They demonstrate the presence of anomalies (A, C, and D in Figure 30) that can be associated with coarse and compact rocks, most likely due to blocks used for the construction of the towers, and the remains of structures immersed in geological strata with a fine matrix. On the west side, lines 16 and 17 indicate two anomalies at the beginning and end of the sections (E and F in Figure 30), while in the middle of the section near the tower there is an unexpected uniformity of materials, suggesting the absence of buried structural elements at this location. Line 10, recorded on the east side of the grid data collection, shows a narrow anomaly (B in Figure 30) that is probably related to the presence of a compact stone in the soil.
All the anomalies are better seen in Figure 31, where the horizontal sections overlapping on the Stylite tower map are shown in the 0.1–1.6 m depth range. The anomalies seen in these plots show the spatial distribution of the amplitudes of the reflections at specific depths within the grid. Low amplitude variations within the slice express small reflections from the subsurface and therefore indicate the presence of relatively homogeneous material. High amplitudes indicate significant discontinuities in the soil and indicate the presence of likely buried objects or compact stones. The results show that starting from the most superficial layers near the northwestern side of the tower, only low-amplitude anomalies are highlighted, which can be attributed to the presence of geological layers with a fine matrix. Elsewhere, high amplitude anomalies indicate the presence of coarse and compact rocks. In particular, the sections related to the 0–0.45 m depth window show that only low-amplitude anomalies are present around the tower. At greater depths, on the southern, eastern, and northern sides of the structure, anomalies with high amplitude occur and persist throughout the depth studied. In the soil areas flanking the west side of the tower, the presence of homogeneous material is evident throughout. This is evident, for example, in Figure 31, which shows the A-F anomalies discussed in the analysis of the radargrams. The lack of buried structural elements on the west side of the tower could have contributed to its inclination, in addition to other aspects such as topographic deformations, natural structural deterioration, and seismic loading that occurred over time.
The entire analysis proves that the monument is in a precarious condition that is of great concern both for the preservation of the building itself and for the safety of the many tourists who visit the archaeological site.
An in situ experimental campaign is proposed to determine if the consolidation work carried out in recent years has been sufficient to halt the ongoing processes. This campaign will involve measuring the tower’s ambient vibrations and monitoring the cracks. After that, it will be possible to develop an accurate structural model to evaluate the residual resistance of the tower and design an effective retrofit measure to save it from local and global collapse by integrating the results of this work with other ongoing work [100,101].

3.5. Wu’Ayra Castle

3.5.1. Archaeological Background

The Wu’Ayra castle was built in the early 12th century as part of the reorganization of the Valley of Petra in Jordan. Wu’Ayra was part of an elaborate system of defenses that included the contemporary castles of Shawbak and Al-Habis and that secured control over the southeastern Dead Sea region. The Crusader occupation of Wu’Ayra ended with its conquest by Salah al-Din in 1188 AD, shortly before the fall of Shawbak [102].
Wu’Ayra proves to be the largest and most complex of the fortresses in the Petra region, characterized by long defensive walls, observation towers, and cisterns dug into the rock (Figure 33a). The archaeological complex presents a functional distinction between the castle proper and the fortified area, with structures that follow the morphology of the terrain. Various studies have highlighted that the walls were built to enclose and defend all types of natural accesses, complemented by watchtowers on the main peaks of the area [103]. Wu’Ayra occupies an area of about 15,000 m2 distributed across three different levels. As in the past, the ruins can only be reached by a bridge over the Wadi Wu’Ayra, marked by a small tunnel dug in the rock [104].

3.5.2. Results and Discussion

Since 2000, numerous recording campaigns were carried out to survey the monumental area of Wu’Ayra, which served as a basis for testing different recognition techniques. The campaigns that followed over time (2000–2014) aimed to graphically recreate the archaeological area and the geomorphology of a very complex and extensive site in all its ramifications [105].
In the first phase of the work, in 2000, ERT surveys were conducted in the area where the probable necropolis of the site is located. To do this, two shallow areas, labelled A and B in Figure 33b, were staked in the western part of the castle using the ADD-01 resistive meter. Several parallel dipole-dipole profiles were arranged following the morphology of the ground at a distance of 1 m from each other. Along each profile, the dipoles were moved in 1 m increments, up to a maximum pseudo-depth of 6 m. Figure 34 shows the resulting electrical topographies overlaid on a Google Earth satellite image. Based on the analysis, it is possible to detect the presence of some high resistivity cores arranged in a north-south direction, the dimensions of which indicate the presence of burial concentrations. Direct verification of the anomalies is desirable to verify the correctness of the interpretation.
As regards geomatic surveys [106], the first international experiment (2000) was carried out with GNSSs (Global Navigation Satellite Systems) and focused on the highest part of the fortress, the so-called Cassero. The objectives were to georeference an existing archaeological plan of the castle and, at the same time, to numerically control its representation. The purpose of the mission was to determine the visibility plans between the different Crusader fortresses in the Petra area.
This initial phase of experimentation has led to considerable interest in the study of numerical models of wall stratigraphy and archaeological excavations. Over the years, a need developed to represent the site by integrating numerical and chromatic data with photographic images that would allow for better interpretations of wall structures. To satisfy this need, it was decided to capture images from above using a kite (survey work in 2001). The on-site photographs were then taken using an analogue photographic device with professional high-definition film, in order to minimize the areas without a sensitive surface. The choice of these films was due to the fact that, in 2001, there were no compact digital cameras with better resolution capabilities than analogue cameras. Given the complexity of the situation, both from a logistical and a purely topographical point of view, it was decided to work in two separate survey campaigns: in the first year (2001), the aerial surveys were carried out, while in the second year (2002), the individual images were post-processed with the architectural elements clearly visible on the ground and geo-referenced accordingly. This device provided high-resolution images from a height of 25 m (resolution of 2 cm). The data were processed using satellite georeferencing software (Erdas ER Mapper, Planetek, Italia), to create a comprehensive orthophoto mosaic of Cassero (Figure 35b). In the image, the obtained orthophoto is compared with the current Google Earth satellite image (Figure 35a) and similar points are marked with colored arrows. One of the constraints that conditioned this process was the wind, due to which some areas were not photographed. During the survey work in 2007, the research group combined digital balloon photography with topographic survey techniques to obtain a general orthophoto of the entire archaeological complex through a photographic rectification of the individual images. The use of a balloon made it possible to take high-resolution photographs (2 cm from a height of 60 m) with a single compact digital camera (12 MP) (Figure 35c). Remote instrumentation allowed the camera’s tilt to be adjusted 90° vertically and 360° horizontally. In addition, imaging was performed with a GNSS in two different operating modes, capturing a total of about 300 points (target GNSS and salient points). The overall result was quite satisfactory for a qualitative analysis of the spatial evolution of the monumental complex in relation to its surroundings, but the problems related to the different projection planes partially affected the reliability of the final representation.
In conjunction with the development of increasingly reliable mathematical models, starting in 2011 the research group decided to use the dataset to attempt the development of a numerical point cloud model of the entire castle, created through manual photo modeling. The data were subjected to a methodological experiment on the use of digital photogrammetry, based on the manual detection of homologous points following a specific working protocol. In the last year (2014), some laser scanning tests were carried out in different sectors of the castle in order not to interrupt the series of methodological experiments.
After 2014, the activity focused on the reorganization of all previously collected data based on the latest developments in digital photogrammetry. The process of data recovery and processing can be summarized as follows: the recovery and processing of photographs taken with a balloon in 2007 (the photographs were taken with a COOLPIX P3 compact camera, focal length 7.5 mm, resolution 12 MP); the recovery of coordinates acquired with the corresponding reference systems (coordinates were acquired in the WGS84 system and transformed to the UTM36 projection system for Jordan); data processing using 3D data processing software (Agisoft Photoscan 1.8.2, JRC 3D Reconstructor 4.4.0); the comparison of the results obtained with the different data processing techniques. The numerical model obtained has good characteristics from a qualitative point of view, since it highlights the morphology of the area in relation to the archaeological area. The average error of the model obtained after inserting the coordinates of the GNSS is about 0.059 m. Considering that the differential GNSS acts simultaneously on the phase and the code of the signal (average error of about ±1 cm), and that the measurements depend on some variables, such as the number and the position of the satellites, the electromagnetic noise generated by external terrestrial sources [107], and that to this there must be added a possible additional error in the positioning of the targets on the model and the use of a compact digital camera (with small optics and small sensor), the final result is approximately within the error limits calculated based on the scale of the area representation. The obtained result seems to be more reliable in the central parts, where there is a larger number of images. The lateral reconstruction is less reliable, especially in the northern and eastern parts of the archaeological site. This is because the original aim of the recordings was to document the area of Cassero in the central part. Moreover, due to the naturalistic boundaries, it was not possible to film in the outer areas. The point cloud was then converted into triangulated surfaces (meshes) to obtain planar curves and graphic images that adequately represent the morphology of the site (Figure 36a). Subsequently, the georeferenced model was used to create a plane parallel to the horizontal projection plane and another plane at a constant distance from the original plane (equidistance of 1 m). In this way, the software generated sections that corresponded to the outlines of the fortress (Figure 36b).
During the last mission, laser scanner images were taken in the N/N-W section of a small area of the archaeological site belonging to a staircase carved into the rock. The medium resolution laser scanner images (1/4 of the total resolution, i.e., approximately 44,000,000 points with one point every 6 mm at a distance of 10 m) were made to produce detailed maps on the architectural solutions for the fortress. Since both the photogrammetric and laser scanner point clouds were available, it was decided to compare the two models and highlight any discrepancies. Overlaying the two georeferenced datasets (Figure 36c) shows that the two models have a significant discrepancy (about 0.3 m), especially on the z-axis, which is probably due to the different positioning of the acquisition centers, but also to a different instrumental sensitivity.
The two numerical models in question include the model reconstructed based on a recent software for the automatic correlation of points (numerical model of 2015 developed with Agisoft Photoscan 1.8.2) and the model developed based on old manual correlation systems (numerical model of 2010 developed with Photomodeler 6) (Figure 37) [105]. For simplicity, the most recent model will be referred to as A, while the less recent model will be referred to as B. The first difference between the two models is the number of points, which in the case of A is on the order of millions, while in the case of B is on the order of thousands. Another difference is the chromatic characteristic, which in case A is inherited from the same images used for processing, while in case B the points defined in space do not have this characteristic. The two models are very similar in their results, since they highlight a number of elements useful for the study of the terrain on which the castle is located.
In a final step, information for the construction of leveling curves has also been considered, the representation of which is a problem, especially because the way it is done has changed and has been delegated to automatic extraction procedures. Leveling curves are, in calculation, nothing more than horizontal sections parallel to a projection plane chosen by the operator, of which the operator can calculate an infinite number depending on the distance and repetition. The problem concerns how these curves are represented. Often, the mathematical calculation extracts segmented polylines that are recalculated several times in the various superpositions of the models, leading to visualization problems and imperfect superpositions. Then, if the numerical models contain noise, the final visualization is affected by untrue data (Figure 38a). Therefore, on the one hand, the computation of these polylines is accelerated, but on the other hand, their visualization poses some problems even based on the available initial data. In the case of an unfiltered cloud, the result of the contour lines certainly helps to cope with a large amount of data, but the representation is not quite as well defined, describing very rough terrain areas where the rock is smooth, and one would expect some “softness” in the representations. The mathematical representation obviously tends to produce some sort of edge effect. On the numerical model of the point cloud, it is not possible to calculate the elevation curves due to the discontinuity of the points in some areas of the survey (Figure 38b). Therefore, it is necessary to perform a transformation of the points into a mesh model. Once a suitable orthographic space has been defined with the object to be studied, a reference grid is created by the software, which works like a laser scanner. The sampling of points is done according to a grid that the user selects according to the objectives of the work. One of the main advantages is to go from an unstructured cloud to a structured cloud, albeit with a smaller number of points, by defining a grid with homogeneous points throughout the model, regardless of the shapes that characterize it. This step greatly simplifies the subsequent processing to determine the level curves, which are represented in a more homogeneous way. Also in the mesh reconstruction, a regular mesh can help in the identification of discontinuities in the terrain, especially if we apply a reduction filter after this first operation, where the flat zones can be described by a few polygons, as opposed to a strong discontinuity, where the number of polygons should be larger. The number of points (10,000) was high enough to transform the mesh of a territorial type that is less angular, where the algorithm applied the construction of level curves (Figure 38c). The difference between the two results is most notable with respect to the scale of representation chosen. The strong discontinuities present in the raw data were well filtered for a representation closer to the real one. Moreover, this representational approach guarantees a more immediate and appropriate reading of the problem of interpreting the final data.

3.6. Shawbak Castle

3.6.1. Archaeological Background

The archaeological–monumental complex of Shawbak (Valley of Petra, southern Transjordan) represents one of the best-preserved medieval settlements in the Near East (Figure 39). The castle of Shawbak was built in 1115 AD as part of the plan to reorganize the Valley of Petra in Jordan. The archeological complex is located about 25 km north of Petra and occupies a strategic position in the main road system that connected the Dead Sea and Damascus with the Red Sea, Cairo, and the Arabian Peninsula.
The citadel has an articulated and continuous defensive apparatus with an almost elliptical plan, consisting of three walls interspersed with towers and projecting bastions, dating from its foundation by the Crusaders to the Mamluk period [25]. The fortress, built on the top of a hemispherical limestone hill, is one of the few examples of a Crusader castle that was reoccupied as a war and administrative fortress in the Ayyubid era after the defeat of the Europeans at Hattin in 1187 AD. The occupation of Shawbak by the Crusaders ended with its conquest by Salah al-Din in 1189 AD, after a two-year siege. The period from 1189 AD to 1260 AD marks a significant change for Shawbak: the old castle was transformed into a refined Islamic capital under the government of Salah al-Din’s heirs. The monumental fortress that can be seen today was the work of the Mamluk Sultan Husama al Lajin (1297–1298 AD), some thirty years after the fall of the last Ayyubid ruler of Shawbak.

3.6.2. Results and Discussion

Research activity began in 2000 and was intended to contribute to the development and integration of scientific methods and technological applications in archaeological research [108].
In 2000, a first major topographic survey of the entire foothills was conducted using a differential GNSS in kinematic mode. With this technique, it was possible to invert the numerical model of the entire hill and selectively choose the parts of the terrain to be resurveyed, especially those that were free of structures and slumps and covered by vegetation. The satellite system also made it possible to minimize the errors in the traverses that occurred during the surveys due to the use of total stations for the individual masonry structures. The creation of this dense and stable network of topographic points has made it possible, over the course of almost 20 years, to link all the measurement campaigns carried out by the various research teams that have taken turns in studying the monument in recent years. After this first topographic activity, it was decided to carry out further cognitive phases that would allow us to deepen both the links between the elevations of the fortress and the buried structures, and the evolution of the site itself on the terrain.
These analyses inside and outside the site were carried out using both geophysical methods and aerial photography through the use of balloons. This work began with the need to read and interpret the site from above, through the survey of the surrounding area in 2007, but this survey work soon reached its limits due to the complexity of the orography of the site and the large number of collapses within the site, which made it impossible to extract metric information from these images. These factors made it impossible to create projection maps that could make the images metric from above. The next step was to switch to photogrammetric imagery to recreate the study area in its complex three-dimensionality. In the first case, given the larger number of photographic images (more than a thousand), it was necessary to differentiate the data and remove those that could have caused ambiguities in the processing software. The raw data had originally been organized into “triplets” for stereoscopic digital return systems. To reduce processing times, newer software selected only the central section of the “triplet.” The photographic images did not originally show perfectly aligned fringes because of the use of a balloon (with three operators) controlled by three cables, moving over a rather rough terrain and severely constrained by natural and climatic limits. Based on the movements of the balloon, it was possible to divide the images into three different ideal swaths, divided into as many blocks that can be processed separately while ensuring a mutual superposition to meet the requirements of the point cloud reconstruction algorithms. From a qualitative point of view, the numerical model obtained has good characteristics that highlight the morphology of the terrain in relation to the archaeological area. The average error of the model obtained after entering the GNSS coordinates is about 2 cm. Considering that the differential GNSS works simultaneously with the phase and the signal code (average error of ± 1 cm) and that the measurements depend on some variables, such as the number and the positioning of the satellites, electromagnetic disturbances generated by external currents, and that to these is added another error in the positioning of the targets on the numerical model, the final result is within the error limits calculated based on the scale of the represented area. The numerical model from the photo modeling, understood as an unstructured cloud, was imported into JRC Reconstructor software and converted into a structured point cloud using the “virtual scan” tool. This tool allows certain properties of the three-dimensional data to be modified and has been shown to be particularly useful for managing point clouds by scanning for a regular mesh. The point cloud was then converted into triangular surfaces (mesh) to which the photographic texture was applied. The “virtual scan” tool also proved to be particularly efficient for the creation of various base maps of the castle, which, starting from the numerical model, allowed for the creation of plans, elevations, sections, contour lines, and digital terrain models (DEM) (Figure 40 and Figure 41).
In addition, the orthophoto of the castle was used as a basis for the implementation of the geophysical results. The data acquisition was performed in 2007 using a multi-channel resistivity meter that applies profiles of different lengths in regular grids. The number of electrodes for each measurement and the spacing between electrodes were determined based on logistical requirements and the depths to be reached. A total of eight areas were surveyed using an axial dipole-dipole configuration, with the exception of areas 2 and 5, where the mobile gradient configuration was used due to the difficulty of routing the current. Figure 42 shows a horizontal map with a depth of about 1 m, in which the resistivity anomalies in space are well illustrated. The main elements that can be attributed to buried structures are described below for each study area. Area (1): the map shows three circular anomalies of high resistivity connected by some regular alignments. Area (2): two linear anomalies with high resistivity values, arranged at right angles to each other, are detectable. Area (3): two perpendicular anomalies with high resistivity values are also detectable in this area and it has been confirmed that the excavation is two walls. Area (4): the map shows two large linear bodies perpendicular to each other. Area (5): a rectangular anomaly and a linear anomaly, both characterized by high resistivities, are detected. They seem to be consistent with the walls already excavated. Area (6): the map highlights an anomalous core likely associated with the corner of the existing structure (bottom and left). A linear anomaly is also visible in the upper area. Area (7): a straight body can be seen at the top, perfectly aligned with the building on the right side of the area. The rectangular anomaly in the center of the survey area could also be associated with this structure. Area (8): there is a single net anomaly that connects to the visible wall below. The electrical tomography allowed work to be conducted in very dry soil and on unconnected surfaces, which supports very well the attempt to analyze the historical events that have affected the castle over the centuries. Underground traces of remodeling, additions, demolitions, and reconstructions of various units were discovered.

3.7. Madaba

3.7.1. Archaeological Background
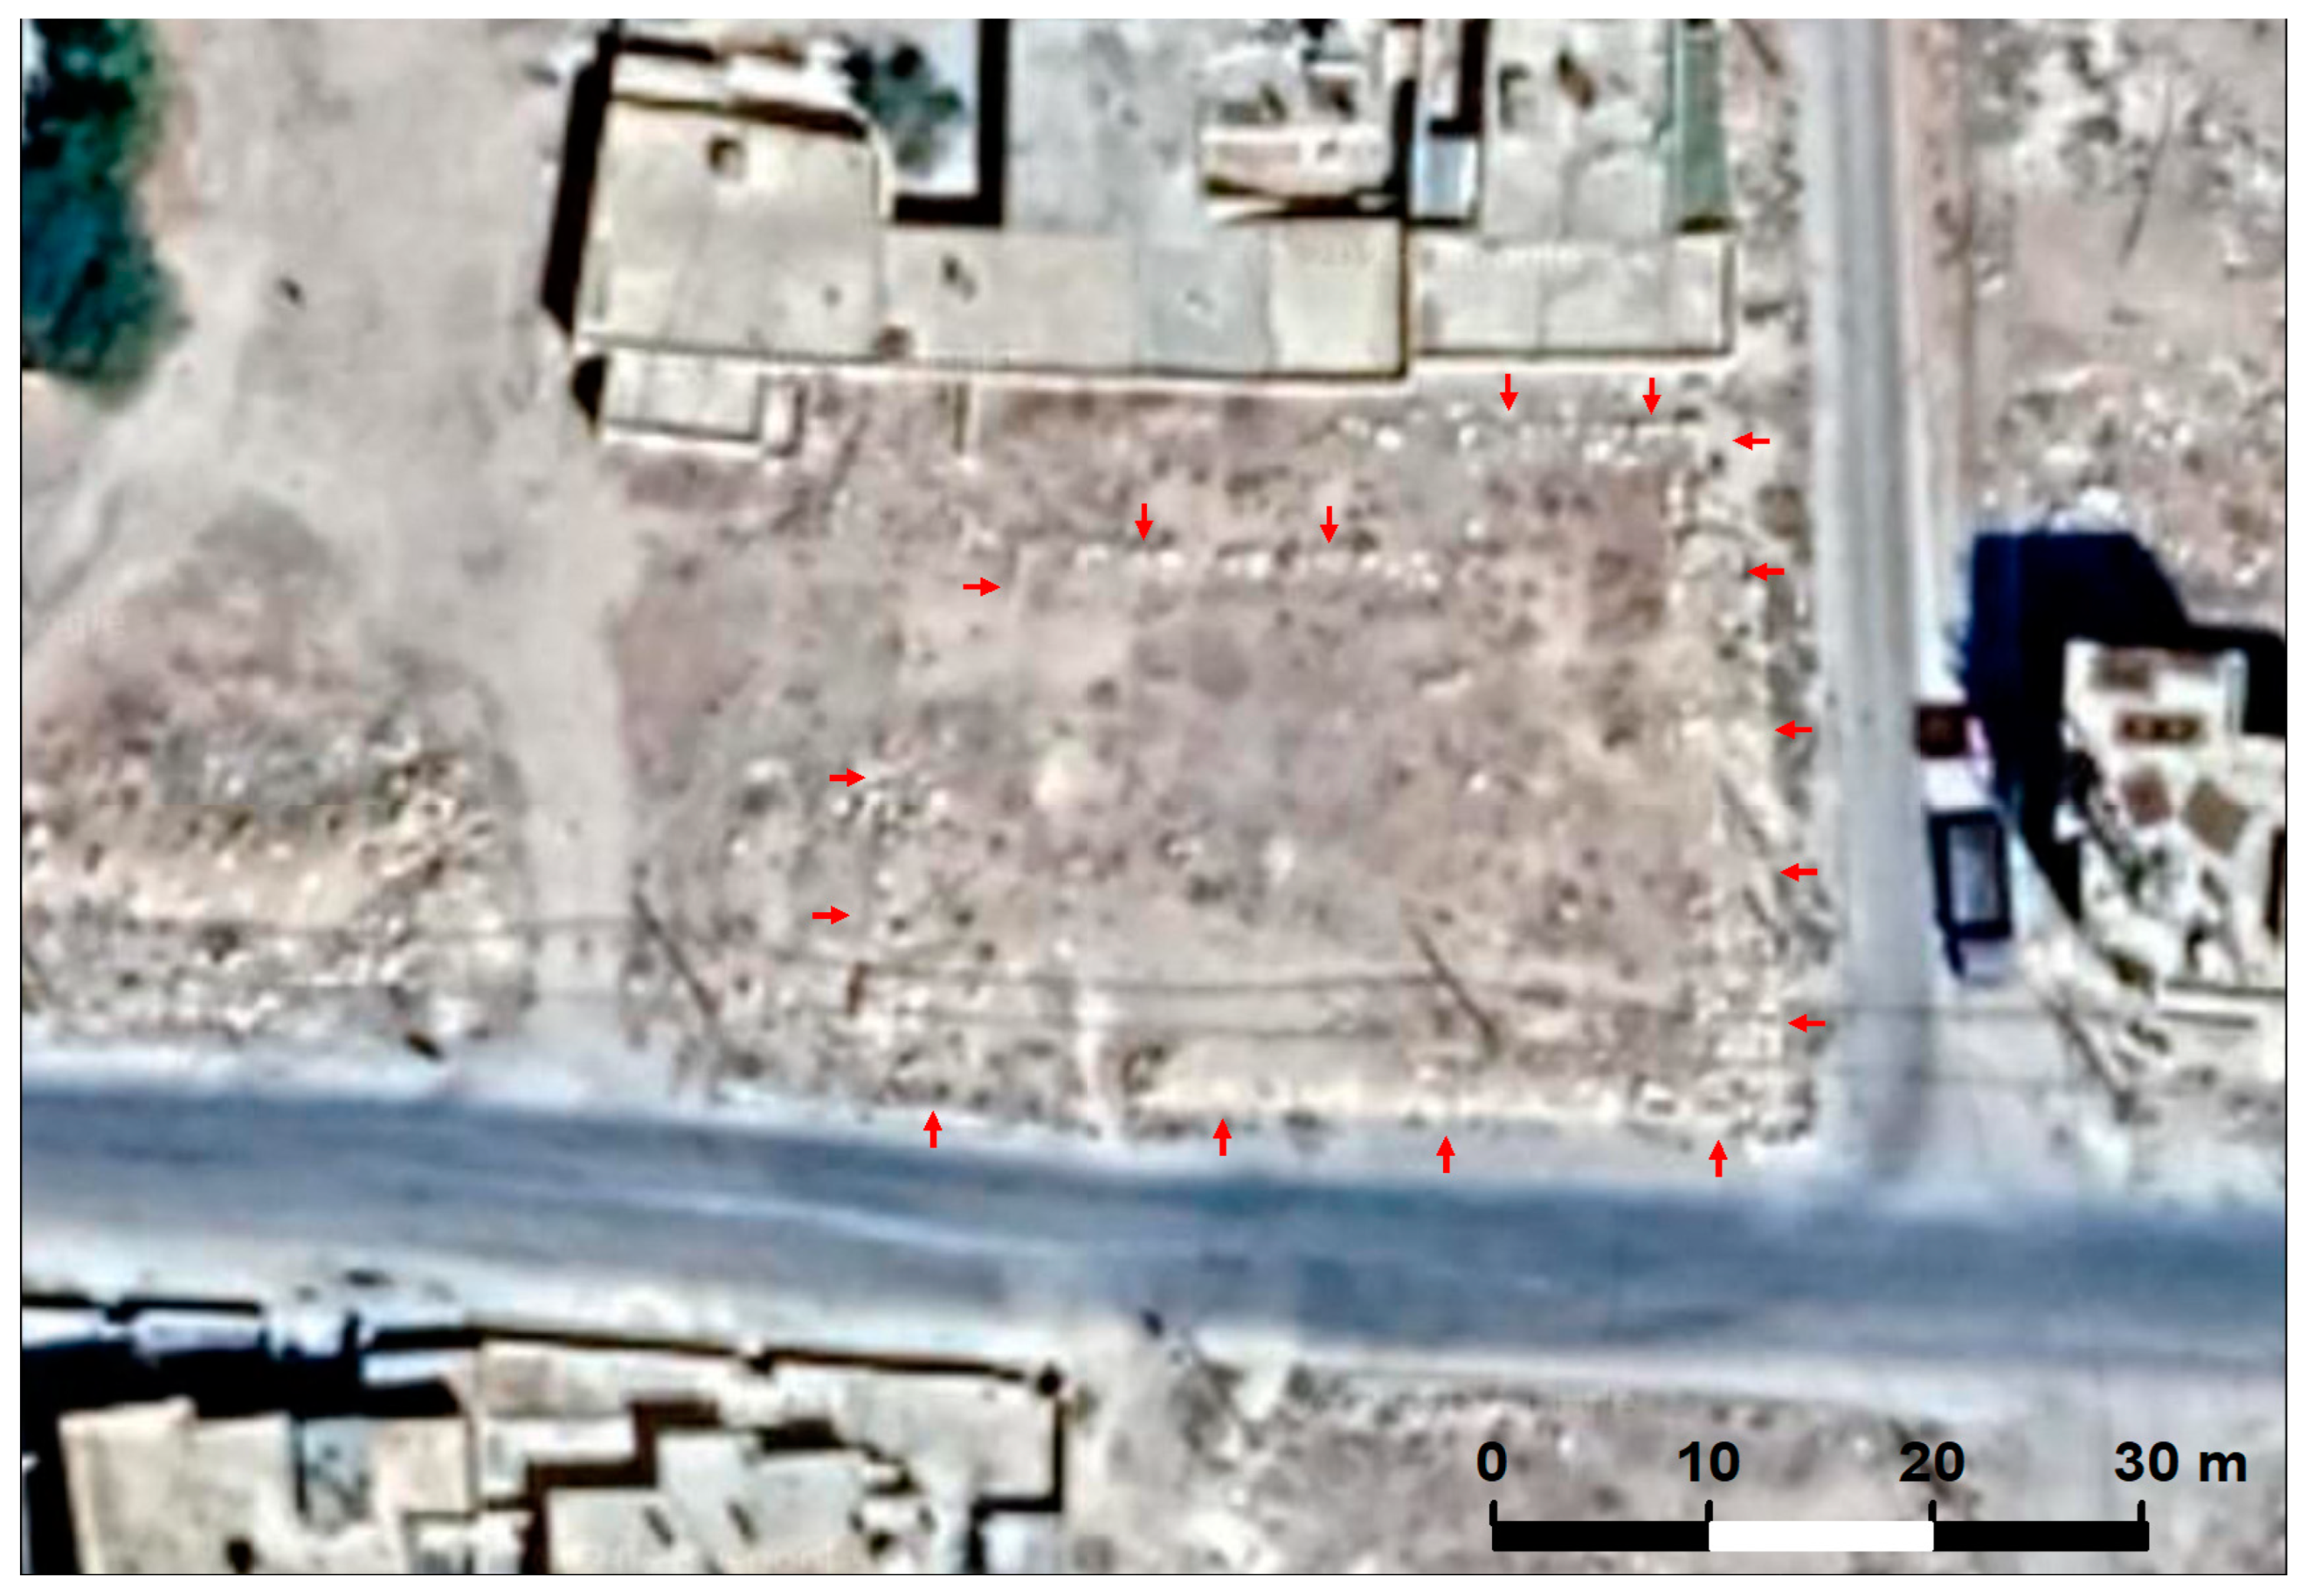
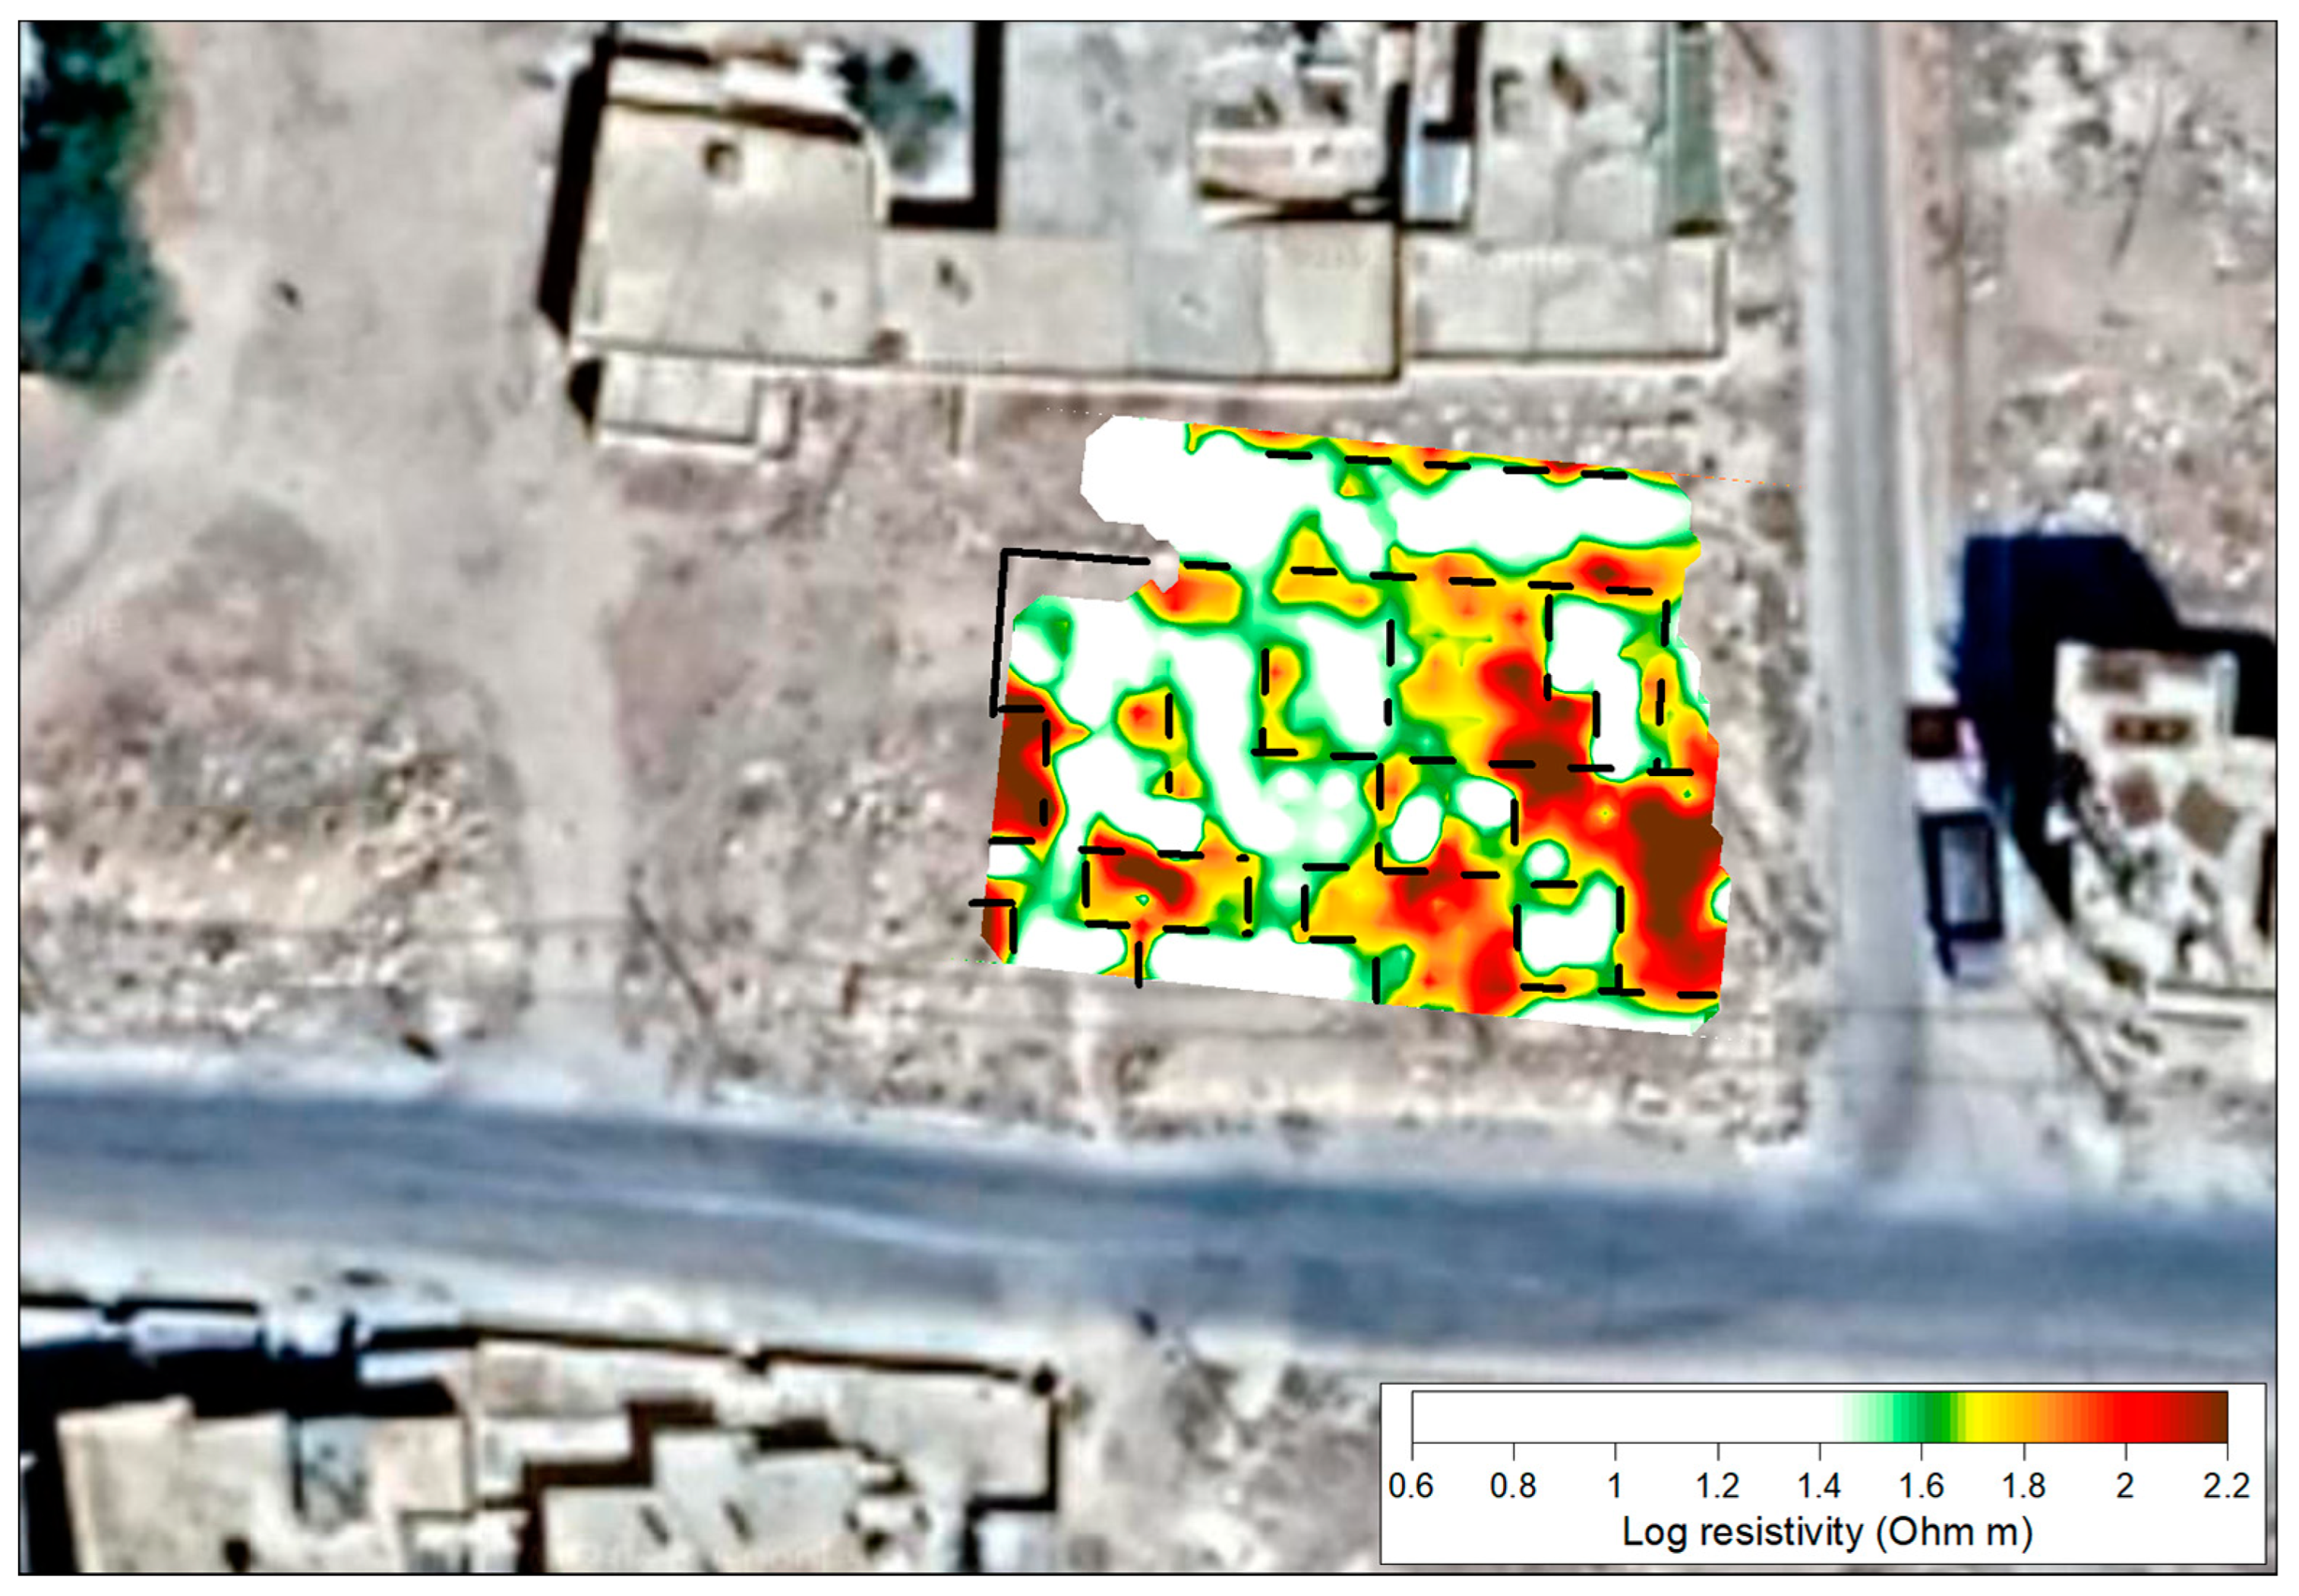
Madaba is one of the most visited cities in Jordan and is famous for its Byzantine mosaics [109,110,111]. Currently, the Archaeological Museum of Madaba is located away from the main tourist routes of the city. The proposal for a new regional archaeological museum for the city therefore focuses on choosing the area known as Madaba Archaeological Park West as the site for the new museum, as it is located on one of the main tourist routes in the city, in close proximity to St. George’s Church and the visitor center [112]. Today, structures from the major occupational phases remain visible (Figure 43): the Roman-Byzantine road, the “Burnt Palace”, an elite’s residence with beautiful mosaics, used in the Byzantine-Umayyad periods, and a group of traditional houses.
The Madaba Regional Archaeological Museum Project (MRAMP) is an international cooperation project between Italian (Perugia and Sapienza Universities), American (La Sierra and Gannon Universities) and Jordanian (Madaba DoA) institutions to set up a new regional museum in the city of Madaba, to showcase the collection of several thousands of artifacts coming from more than a dozen archaeological sites from the Madaba district/Madaba region and to valorize the rich cultural heritage of the area.

3.7.2. Results

In 2017, preliminary research activities on the site joined archaeological operations with a geoelectrical survey of the underground cisterns and water system. A total of 13 DD parallel profiles were measured (Figure 44) with an electrode spacing equal to 1 m. Figure 45 show 3D views of the investigated volumes in which the imaging of the PERTI results were drawn in the right position on the topographic map of the archaeological area (as signed in Figure 44).
The main features highlighted in the first 4 m depth range below the ground are as follows:
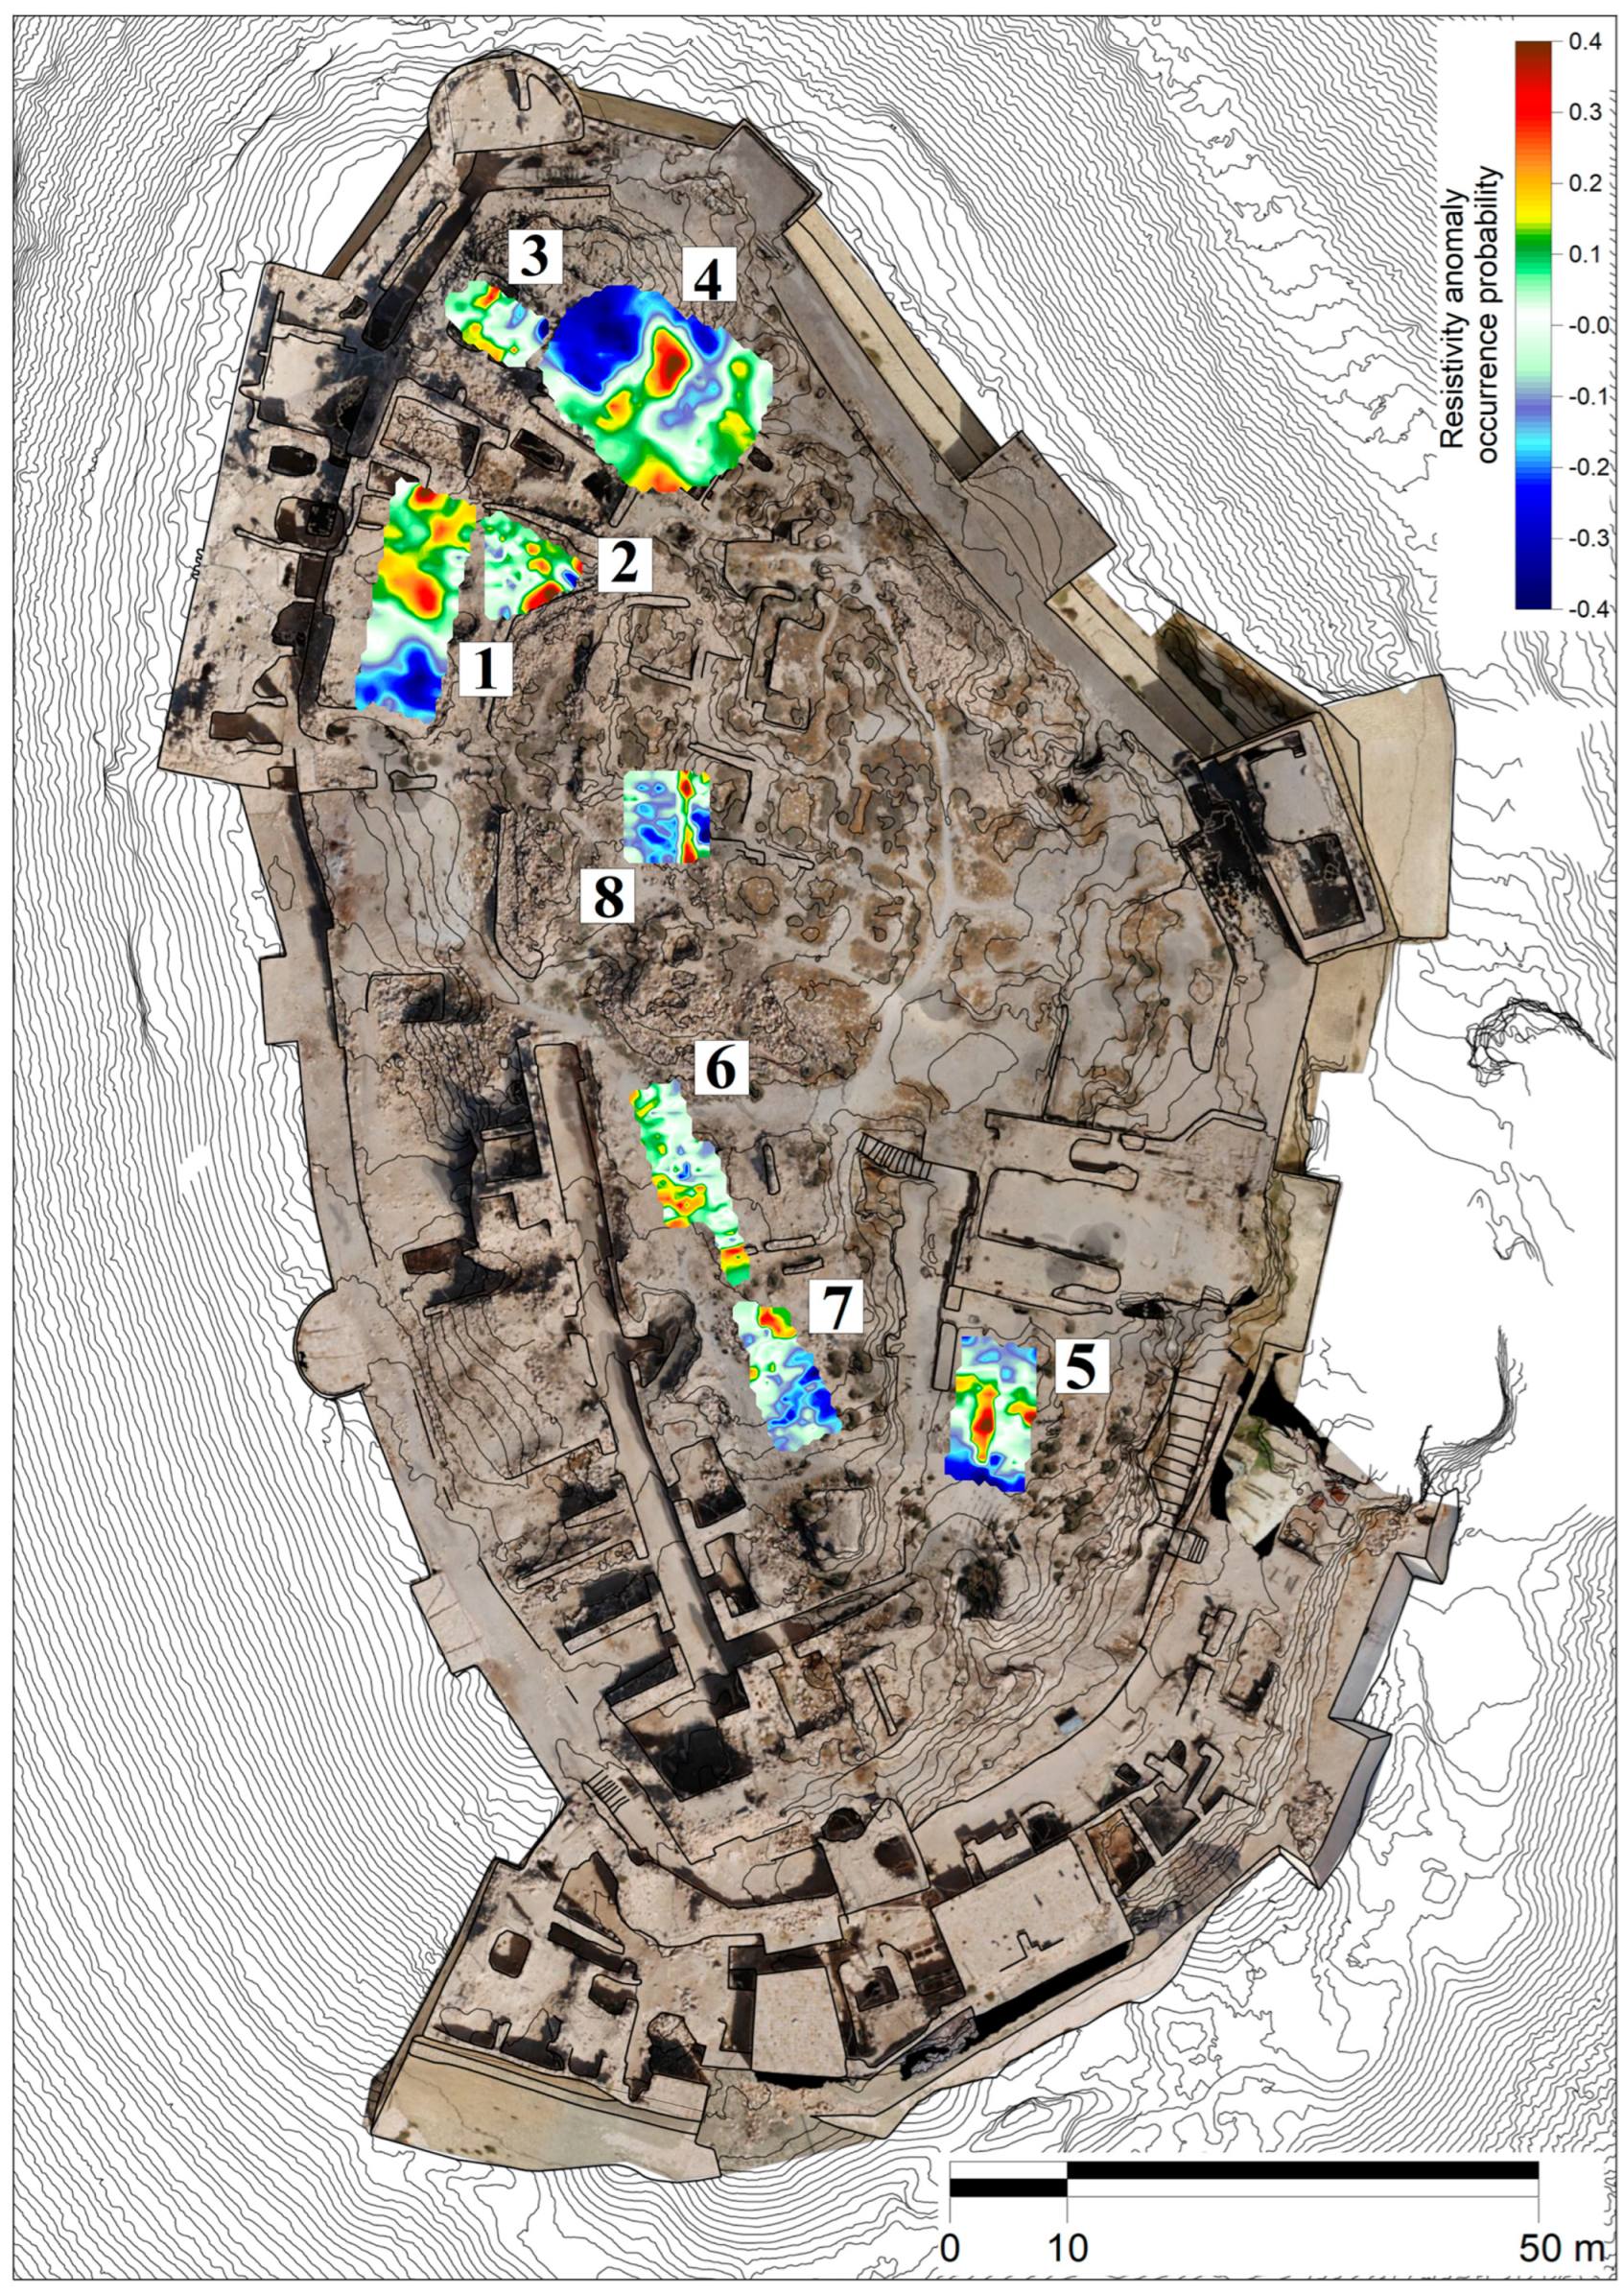
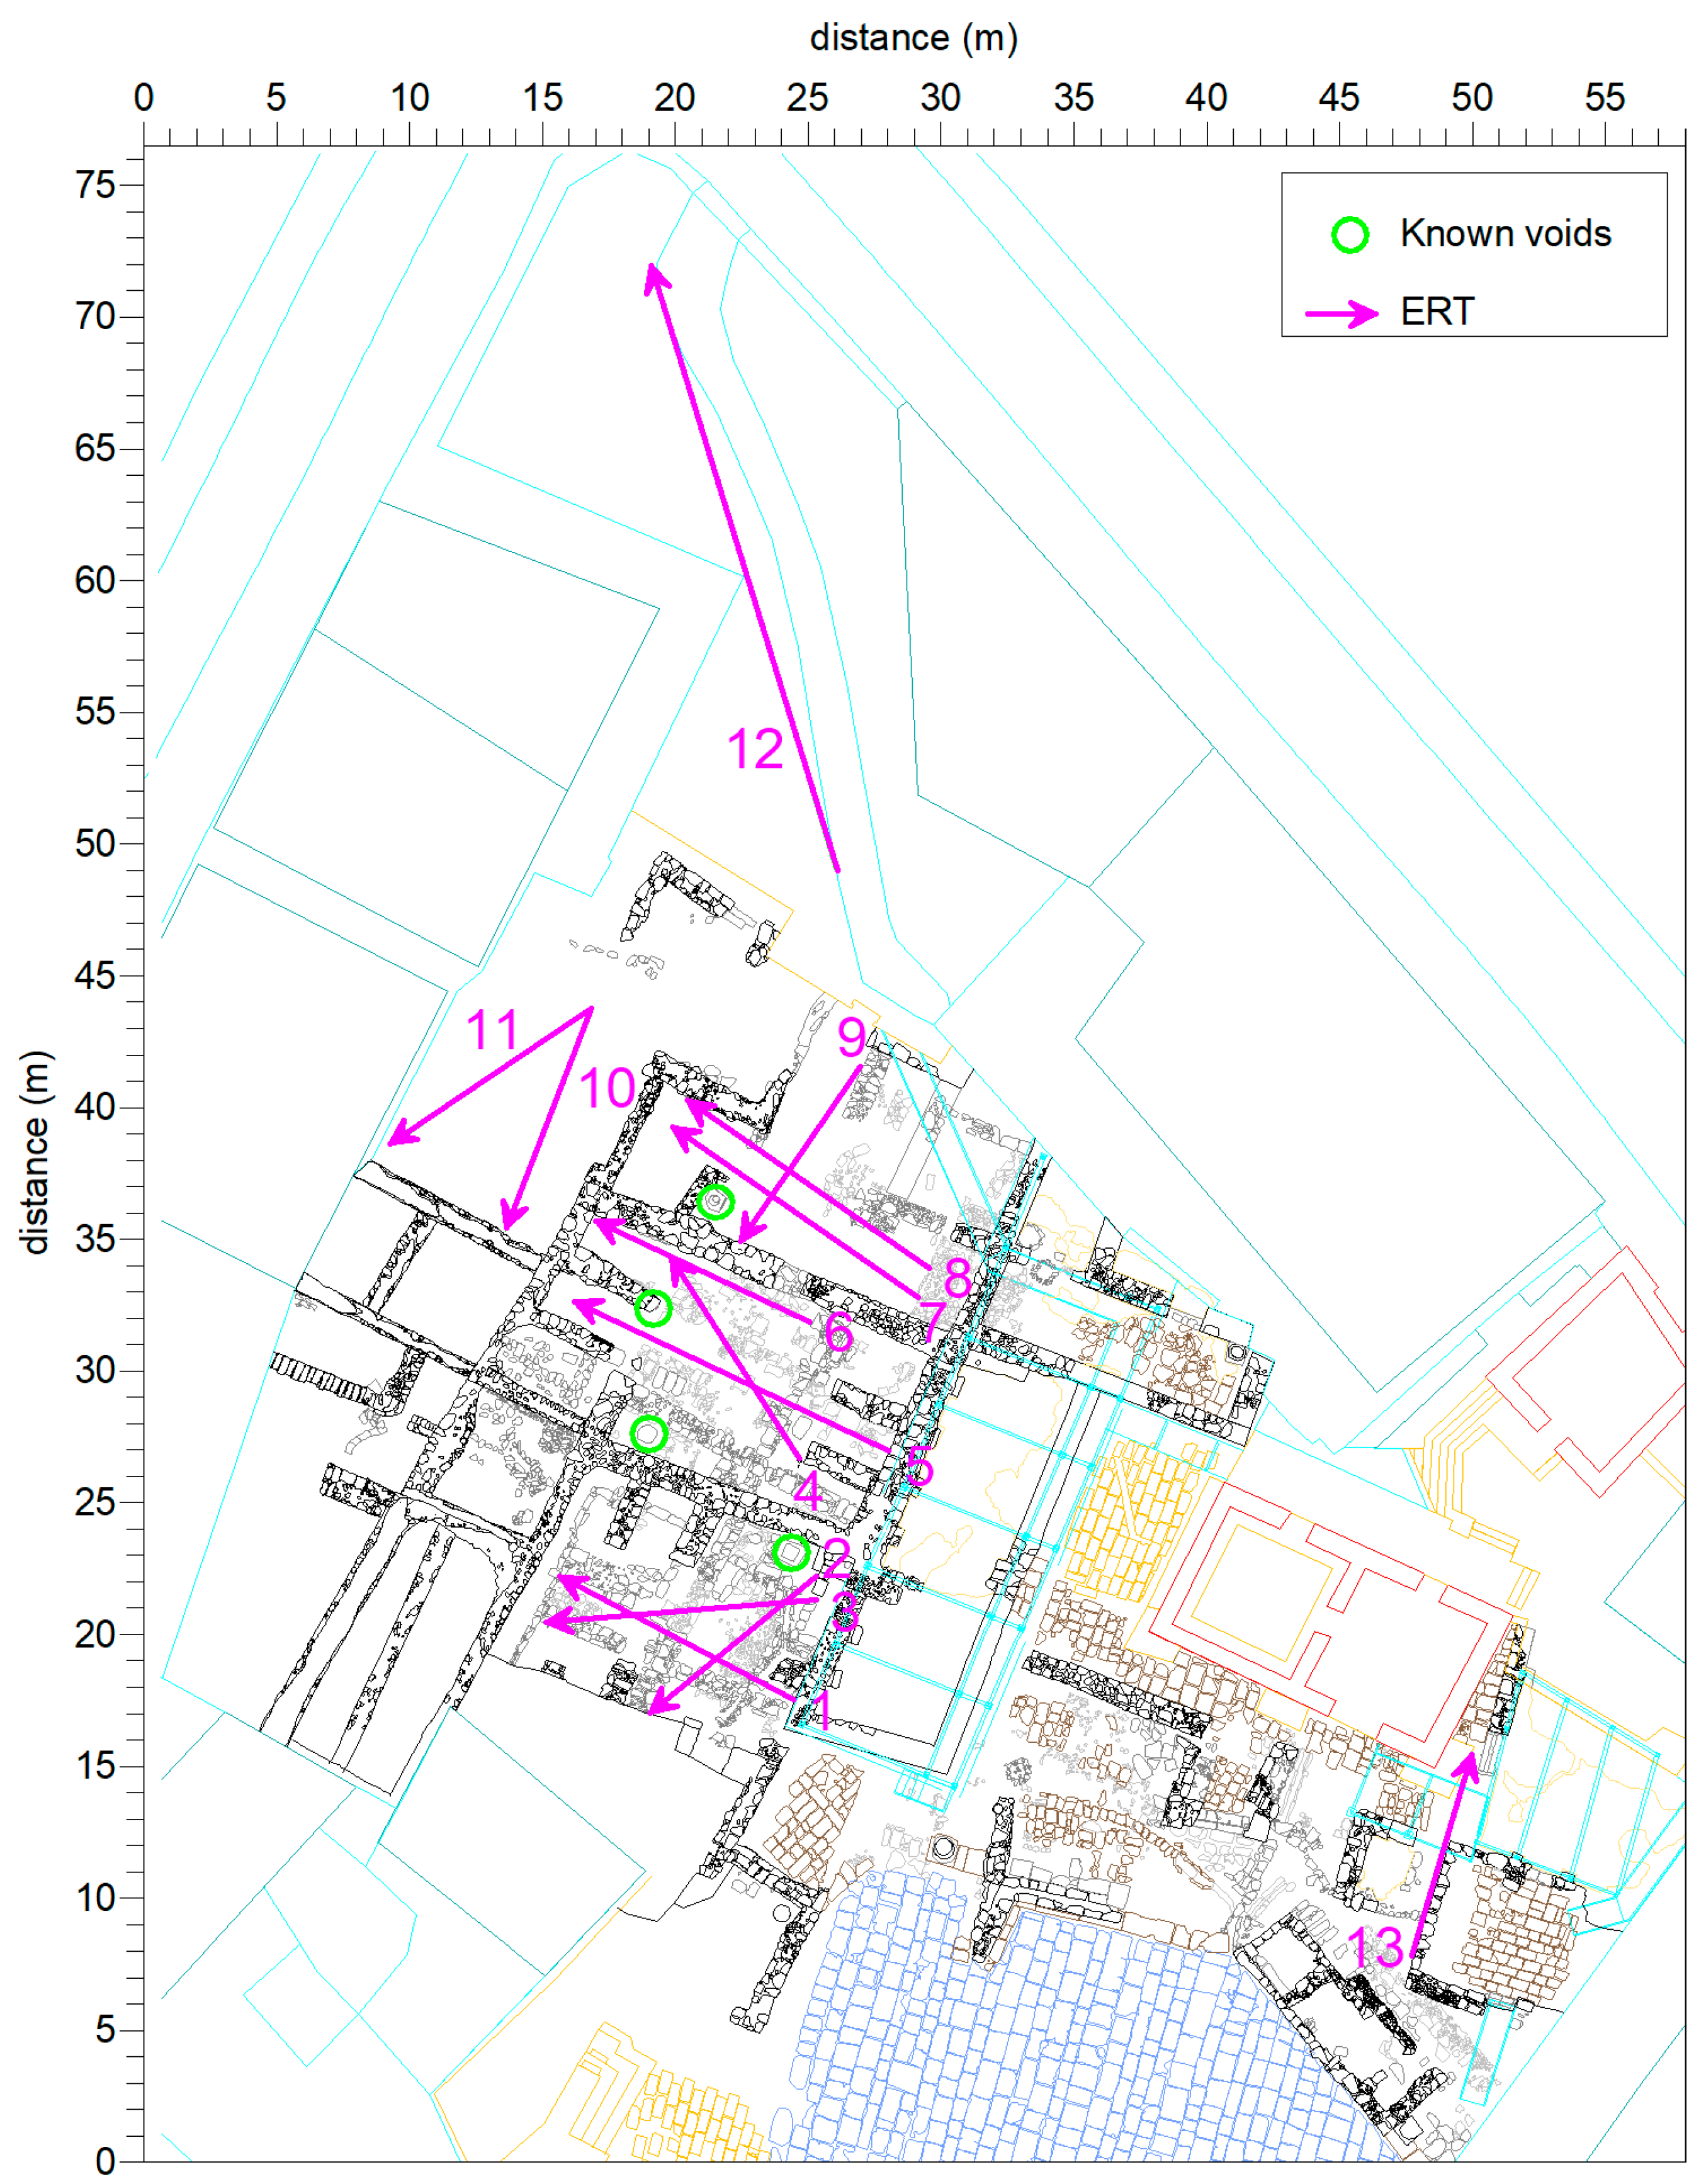
  • Deep highly resistive anomalies which can be ascribed to probable voids: Anomaly A1 (in ERT 7, 8, and 9, shown in Figure 45a,b); Anomaly A2 (in ERT 4, 5, and 6, shown in Figure 45a); Anomaly A3 (in ERT 7 and 8, shown in Figure 45a); Anomaly A4 (in ERT 2, shown in Figure 45b); Anomaly A5 (in ERT 13, shown in Figure 45g). All of these anomalies are very close to well-known cisterns and voids.
  • Shallow highly resistive anomalies which can be ascribed to probable archaeological elements buried into the subsoil: Anomaly B1 (in ERT 1 shown in Figure 43a); Anomaly B2 (in ERT 2, shown in Figure 45b); Anomaly B3 (in ERT 9, shown in Figure 45a); Anomaly B4 (in ERT 3, shown in Figure 45c); Anomalies B5, B6, B7, and B8 (in ERT 12, shown in Figure 45d); Anomaly B9 (in ERT 10, shown in Figure 45e); Anomaly B10 (in ERT 11, shown in Figure 45f). All of these highly resistive features appear immersed in a conductive cover composed of fine sediments.
The complete documentation of the underground structures in the Madaba Archaeological Park West allowed the architectural team of MRAMP to develop a preliminary model for an open museum, not only able to attract more foreign and local tourists to the area, but also to transform an endangered archaeological park in a new lively cultural center for the city of Madaba.

4. Conclusions

This paper shows the results of twenty years of projects focused on the application of non-destructive geophysical prospections and geomatic surveys in different archaeological contexts of Jordan, each of which had particular characteristics, taking into account the nature of the soil, the logistics of the area, and the type and size of probable finds in the subsoil (walls, tombs, structures, etc.). The selected case studies were also variable in terms of their age, ranging from the Neolithic to the Byzantine period. In each case, it was possible to increase our knowledge about the archaeological sites, which is useful for planning archaeological excavations or preventive protection projects.
As regards geophysical prospections, the evaluation of the survey methodologies that were used was a very important factor that could seriously undermine the success of research for archaeological purposes. This choice depended on many factors: geological, logistic, and purely geophysical factors. It was principally managed by the purpose of exploration and by the contrasts of geophysical properties in the elements present in the subsoil that may highlight, with more or less marked anomalies, the supposed structure. Depending on the type of problem, the environment in which researchers were working, and the type of instrumentation to be used, the methodology that could lead to better results was selected. Thus, GPR and ERT surveys were the preferred methods for the following reasons: (a) GPR provides high-resolution sections, but it has limited penetration; in the case of high conductivity rocks such as clay, penetration is reduced drastically to a few decimeters. It appears to be particularly unsuitable if it is applied on disconnected ground, but it is very useful when working on paved surfaces. In these cases, it is the less invasive methodology. For these reasons, it was applied to the case studies of Basta and Umm ar-Rasas, where it was required to work to discover very shallow structures on delicate surfaces. (b) The ERT method, although having longer acquisition times than other methods, is effective because it provides easily interpretable results, it is very versatile to variations in soil conditions, and it is ideal for the detection of very deep structures. It was chosen to solve the research problems in Petra, Um-Hamat, Wu’Ayra castle, Shawbak castle, and Madaba where it was required to work on unstable surfaces and/or it was necessary to reach deep layers of investigation.
As for the Basta site, the GPR survey was able to increase our knowledge about the site by pointing out the presence of structures in the shallow ground that corresponded to the previously known urban plan in the area southeast of the excavation area.
The ERT investigations at the Treasure Tomb in Petra have extended the studies to the area in front of the previously unexplored monument. The result, integrated with photogrammetric studies, allowed for a complete reconstruction of the structure from what is visible from above to what is assumed to be under the soil. In this regard, the high-resistivity zones are arranged in such a way that it is possible to imagine a distribution of compact material with a regular shape that develops vertically from the base of the Treasure Tomb into the front square and includes a zone of low resistivity that could indicate the absence of rocks or anthropic constructions. In addition, a laser scanning survey outside and inside the Treasure Tomb and the Palace Tomb enabled the creation of a high-resolution model that provides an important indication of the monument’s current deterioration and is useful for future monitoring and conservation. The numerical model has great potential in terms of outputs that can be created according to the needs of those responsible for managing the archaeological park.
The ERT surveys at Um-Hamat revealed various high-resistivity zones, suggesting the presence of many buried spaces in the ground. Given the sparse data available on the site to date, the result is an addition to knowledge about the site.
The research in Umm ar-Rasas concerned the Stylite tower and the Byzantine churches. The combined use of 3D metric surveys and non-invasive geophysical surveys has made it possible to obtain new information about the health of the Stylite tower that has never been collected before. The main results concern the creation of a detailed 3D model from which data were extracted on the technical and structural design decisions, the deterioration of the surfaces, and the morphological anomalies of the main body. An advanced cracking pattern of the surfaces, a slope, and a rotation of the main body from the bottom to the top in the northwestern direction are the main results of the analysis. The creation of a digital elevation model (DEM) of the base of the tower has revealed a possible relationship between the topographic heterogeneity around the base and the deformations of the tower. Specifically, the slope of the tower is located where the soil has a shallower depth, to the northwest. The GPR analysis of the soil flanking the tower revealed that the soil at the base of the tower is heterogeneous, consisting alternately of fine-mesh geologic strata and medium-sized rocks. In particular, the absence of buried structural elements on the west side of the tower is an important piece of information to add to all the other natural factors that contributed to the building’s movements. In the case of Byzantine churches, the survey provided a precise metric and photorealistic determination of the complex structure, resulting in a complete reconstruction of the visible architectural artefacts and the presumably buried tanks and walls.
The geophysical survey of Wu’Ayra castle provided clues to the probable presence of tombs, while the geomatic survey led to an increase in knowledge of the structures studied through various surveys, with methods that were unconventional from time to time. However, the development of detection systems has opened new frontiers of investigation. Most of the surveys conducted at the site present views of the settlement system from above and optimally describe all flat and sloping surfaces, but due to the nature of the measurement system, the vertical surfaces are less well-described. The experience gained at Wu’Ayra castle has led us to consider the following: each of the surveys carried out is fundamental in its instrumental specificity and therefore all efforts must be directed not only to a comparison between the different techniques but, starting from here, to the fullest possible integration of the different recording methods.
Electrical tomography at Shawbak castle made it possible to discover underground traces of structures in various areas, while the geomatic survey provided a very detailed model of the monument and the surrounding hill.
The complete documentation of the underground structures in Madaba Archaeological Park West allowed the architectural team of the project to develop the design of the new museum building, taking into account the presence of probable cavities in the ground.
In relation to geomatics, a discipline in which there have been significant developments in recent years at the methodological and instrumental levels, some considerations must be made.
One major consideration relates to the goals of research and the choice of certain instruments. In an era when instruments are increasingly automated and user-friendly, it is often easy to confuse methodology and objectives with instruments. One example of many is the use of RPASs, which have now replaced the helium balloon or airship. In this case, the use of RPASs and of instruments in general should be considered as an object to obtain a result or information, and not as a purpose of the research.
In addition to the surveys and their technological development, a large part of the research is done in the field of data processing and display methods. Data processing is the most important part of the various activities that have been carried out. The available data can certainly influence the quality of the results, but they are never the real goal; the real goal is always to respond to historical archaeological questions. More and more often, automatic processing procedures do not allow us to control the amount of data obtained in surveying campaigns. On the one hand, current digital and IT technologies have certainly accelerated the phase of data acquisition in the field; on the other hand, the infinite processing possibilities, and the possibility to interpolate and switch numerical models, often lead to different results, the error of which we cannot estimate. The methodological approach to the problem of data representation (virtual and two-dimensional) has been favored by the development of photo modeling systems, which today are able to provide point clouds of the studied object with a good degree of accuracy. The digital images acquired over the years have been reused in a contemporary way for the construction of different numerical models. A first consideration is precisely in the phase of the critical selection of the archaeological object to be studied. This phase, which was usually always moved to the plan of the survey, has now completely moved to the processing phase. The return of millions of points made the recording phase in the field completely non-critical. When using a balloon, this phenomenon became even more evident considering the difficulty of controlling the instrument. The approach (drone or balloon) is to capture as many images as possible and then select which ones to use for photo modeling. The critical selection phase does not refer only and exclusively to the aspect of selecting images, but rather to the recovery of formal and architectural features that comprehensively describe the archaeological object under study, as well as to the appropriate scale of the representation. The selection can now be made only starting from the construction of the numerical point cloud model. However, the numerical model must not be considered as the end of the experiment, but rather as the starting point for the final recovery of the data.
The last consideration concerns the development of the numerical model. In order to simplify the data and make them usable during the restitution phase, it is necessary to perform a series of operations that transform the points on the surface. Also, in this case, the work phase is often referred to automatic transformation processes that do not allow researchers to determine the reliability of the operation. Moreover, the transformation of the points on the surface still implies that interpolations are made on the original data, which must necessarily be taken into account. The operations are mainly associated with theoretical and procedural problems. In order to transform the points on the surface, the point cloud must be theoretically filtered and only then can the triangulation operations be performed. The problem is to determine the number of triangles necessary to correctly describe the archaeological complex when considering a structure composed of heterogeneous and complex data. In this sense, several paths can be followed, and one possible interpretation key is presented here. The issue of the triangulation of surfaces is also conditioned by the scale of the representation of the subject. To overcome the problem of overall triangulation, the point cloud must be broken down into different parts, depending on its complexity. It is necessary to rationally separate the architectural parts from the natural parts to create two large categories with which to proceed with further decompositions. The point cloud from photo modeling is an unstructured cloud, unlike the point clouds from laser scanners, which are inserted into a predefined (structured) grid. The structured cloud is based on a regular grid of coordinates of points whose projection center is known, while the unstructured cloud does not have these characteristics. With certain software tools, it is possible to convert the unstructured point cloud from a perspective or orthographic view into a structured cloud to produce data with similar characteristics to a laser scan. At a lower resolution, it is possible to apply filters in this way to rationalize the point cloud information, such as surface normals and discontinuities in depth and orientation. When shapes occur with predefined geometries, as in the case of defensive walls, towers, and archaeological structures, it is possible to lighten the information for surface reconstruction. However, greater difficulties arise in natural areas where shapes are more chaotic and require a greater amount of information. Last but not least, repair processes were applied where there were areas that were not detected or reconstructed (which are therefore pure interpolations); decimation processes to lighten the model according to the morphological features of the subject, and densification or refinement processes on the subject itself to increase the quality, were also applied. The goal of these considerations was to illustrate that the numerical model, however accurate, is not free of interpolations, although the restitution scale still allows a certain degree of freedom in data management.

Author Contributions

Conceptualization, A.A., M.C., R.G., V.G. and P.M.; investigation, A.A., M.C., R.G., V.G. and P.M.; writing—original draft preparation, M.C. and A.A.; writing—review and editing, A.A., M.C., R.G., V.G. and P.M.; project administration, R.G. and P.M. All authors have read and agreed to the published version of the manuscript.

Funding

The Italian Ministry of Foreign Affairs and International Cooperation (MAECI), Office VI, Archaeology Sector, funded the research at Umm ar-Rasas. Grant numbers: ARC-000988 (2014), ARC-001168 (2015), ARC-001319 (2016), ARC-001681 (2017), ARC-001789 (2018), ARC-434 (2019), ARC-755 (2020), ARC-894 (2021), ARC- 1196 (2022), ARC-1464 (2023).

Data Availability Statement

Data can be requested from the authors.

Acknowledgments

The Department of Jordanian Antiquities (DOA) supported all the aforementioned research. The activities at the Petra Archaeological Park were carried out in the frame of the following projects: (1) “Ancient hydrological network of Petra: study and restoration with a view to the conservation of architectural assets”, led by the University of Urbino (Italy); (2) “Spatial reconstruction of the ancient hydrological network of Petra. Study and numerical modeling with a view to the conservation of assets monumental”, led by CNR. In addition, an agreement between the University of Molise and the Department of Antiquities of Jordan (for geophysical surveys in Petra and other Jordanian archaeological sites) and an agreement between the CNR and the Petra Development Tourism Region Authority (for scientific cooperation in the field of research and enhancement of cultural heritage) were stipulated. Research at Basta and Um-Hamat were realized in collaboration with Al-Hussein Bin Talal University of Ma’an. The survey at Umm ar-Rasas was carried out in the frame of the project “Innovative methods, research and training activities for the conservation and valorisation of Umm ar-Rasas” funded by the Italian Ministry of Foreign Affairs and International Cooperation (MAECI). The studies at Wu’Ayra and Shawbak castles were in collaboration with the Department of Mediaeval Archaeology (Department of Historical and Geographical Studies) of the University of Florence in the frame of the project “Medieval Petra: archaeology of Crusader-Ayyubid settlement in Transjordan”, which led to the signing of a joint research protocol in 2001 (“Production and archaeological documentation through the definition of operational protocols and innovative interpretative models in the field of technologies applied to cultural heritage”). Research at Madaba was carried out with the cooperation between Perugia, La Sapienza, La Sierra, and Gannon Universities. We thank the Italian Ministry of Foreign Affairs and International Cooperation (MAECI), Office VI, Archaeology Sector, the Embassy of Italy, and the Department of Jordanian Antiquities (DOA) for the continuous support for the activities. The authors thank Pasquale Galatà for his participation in the field surveys and data processing, and Giordano Ocelli for the valuable CAD elaborations that allowed the authors to obtain the data on the inclinations and rotations of the Stylite tower.

Conflicts of Interest

The authors declare no conflict of interest.

References

  1. Casule, F.; Khouri, R.G. Arte e Storia Della Giordania; Bonechi: Florence, Italy, 1996. [Google Scholar]
  2. Byrd, B.F. Early Village Life at Beidha, Jordan: Neolithic Spatial Organization and Vernacular Architecture; the Excavations of Mrs. Diana Kirkbride-Helbæk; Oxford University Press: Oxford, UK, 2005. [Google Scholar]
  3. Alt, K.W.; Benz, M.; Müller, W.; Berner, M.E.; Schultz, M.; Schmidt-Schultz, T.H.; Knipper, C.; Gebel, H.G.K.; Nissen, H.J.; Vach, W. Earliest Evidence for Social Endogamy in the 9,000-Year-Old-Population of Basta, Jordan. PLoS ONE 2013, 8, e65649. [Google Scholar] [CrossRef] [PubMed]
  4. Rollefson, G.O. The Neolithic Village of ‘Ain Ghazal. AOF 1983, 29, 243–244. [Google Scholar]
  5. Grissom, C.A. Neolithic Statues from ‘Ain Ghazal: Construction and Form. AJA 2000, 104, 25–46. [Google Scholar] [CrossRef]
  6. Mittmann, S. Ḫirbet ez-Zeraqōn Eine Stadt der frühen Bronzezeit in Nordjordanien. AID 1994, 2, 10–15. [Google Scholar]
  7. Müller-Neuhof, B.; Abu-Azizeh, W.; Abu-Azizeh, L.; Meister, J. East of Jawa: Chalcolithic/early Bronze Age settlement activity in al-Ḥarra (north-east Jordan). ADAJ 2013, 57, 125–139. [Google Scholar]
  8. Rast, W.; Schaub, R.T. Bâb edh-Dhrâ’: Excavations at the Town Site (1975–1981); Eisenbrauns: Rochester, MI, USA, 2003. [Google Scholar]
  9. Pritchard, J.B. Tell es-Sa’idiyeh: Excavations on the Tell, 1964–1966; The University Museum, University of Pennsylvania: Philadelphia, PA, USA, 1985. [Google Scholar]
  10. Schumacher, G. Pella, 1st ed.; Cambridge Press: Cambridge, UK, 2010. [Google Scholar]
  11. Wimmer, D.H. The Excavations at Tell Safut. SHAJ 1987, 3, 279–283. [Google Scholar]
  12. Morton, W. The 1954, 55, and 65 Excavations at Dhiban in Jordan. In Studies in the Mesha Inscription and Moab, Archaeology and Biblical Studies; Dearman, A., Ed.; Atlanta Scholar Press: Atlanta, GA, USA, 1989; pp. 239–246. [Google Scholar]
  13. Yassine, K. The Open Court Sanctuary of the Iron Age I Tell el-Mazār Mound A. ZDPV 1984, 100, 108–118. [Google Scholar]
  14. Kafafi, Z.A.K.; Kooij, G. Tell Dēr ʿAllā during the Transition from Late Bronze Age to Iron Age. ZDPV 2013, 129, 121–131. [Google Scholar]
  15. Smith, R. Pella in Jordan 1. AJA 1984, 88, 426–427. [Google Scholar]
  16. Mare, H. Abila of the Decapolis in the Roman period: A time of revitalization and expansion. Stud. Hist. Archaeol. Jordan 2001, 7, 499–507. [Google Scholar]
  17. Ababneh, A. Heritage management and interpretation: Challenges to heritage site-based values, reflections from the heritage site of Umm Qais, Jordan. Archaeologies 2016, 12, 38–72. [Google Scholar] [CrossRef]
  18. Lichtenberger, A. The Decapolis. In A Companion to the Hellenistic and Roman Near East; Wiley Press: Hoboken, NJ, USA, 2021; pp. 213–222. [Google Scholar]
  19. Lichtenberger, A.; Raja, R. New archaeological research in the Northwest quarter of Jerash and its implications for the urban development of Roman Gerasa. AJA 2015, 119, 483–500. [Google Scholar] [CrossRef]
  20. Piccirillo, M. Chiese e Mosaici di Madaba; Franciscan Printing Press: Jerusalem, Israel, 1989. [Google Scholar]
  21. Piccirillo, M.; Alliata, E. Umm al-Rasas, Mayfa’ ah I. Gli Scavi del Complesso di Santo Stefano; Franciscan Printing Press: Jerusalem, Israel, 1994. [Google Scholar]
  22. Abu-Ghazalah, S.; Al-Hissan, A.K. Discovery of the Oldest Church of the World. Archit. Sci. Rev. 2002, 45, 295–297. [Google Scholar] [CrossRef]
  23. Arinat, M.; Shiyyb, A.M.; Abd-Allah, R. Byzantine glass Mosaics excavated from the “Cross Church”, Jerash, Jordan: An Archaeometrical Investigation. MAA 2014, 14, 43–53. [Google Scholar]
  24. Vannini, G. A medieval archaeology experience in Jordan. The medieval Petra Mission of University of Florence. ADAJ 2011, 55, 295–312. [Google Scholar]
  25. Vannini, G. Archeologia dell’insediamento Crociato-Ayyubide in Transgiordania. Il Progetto Shawbak; All’Insegna del Giglio: Sesto Fiorentino, Italy, 2007. [Google Scholar]
  26. De Smedt, P.; Saey, T.; Lehouck, A.; Stichelbaut, B.; Meerschman, E.; Islam, M.M.; Van Meirvenne, M. Exploring the potential of multi-receiver EMI survey for geoarchaeological prospection: A 90 ha dataset. Geoderma 2013, 199, 30–36. [Google Scholar] [CrossRef]
  27. Frfhlich Gugler, I.M.; Gex, P. Electromagnetic survey of a Celtic tumulus. J. Appl. Geophy. 1996, 35, 15–25. [Google Scholar] [CrossRef]
  28. Mathè, V.; Leveque, F.; Mathè, P.E.; Chevallier, C.; Pons, Y. Soil anomaly mapping using a caesium magnetometer: Limits in the low magnetic amplitude case. J. Appl. Geophy 2006, 58, 202–217. [Google Scholar] [CrossRef]
  29. Herwanger, J.; Maurer, H.; Green, A.G.; Leckebush, J. 3D inversions of magnetic gradiometer data in archaeological prospecting: Possibilities and limitations. Geophysics 2020, 65, 849–860. [Google Scholar] [CrossRef]
  30. Argote, D.L.; Tejero, A.; Chavez, R.E.; Lopez, P.A.; Bravo, R. 3D modelling of magnetic data from an archaeological site in north-western Tlaxcala state, Mexico. J. Archaeol. Sci. 2009, 36, 1661–1671. [Google Scholar] [CrossRef]
  31. Papadopoulos, N.G.; Yi, M.J.; Kim, J.H.; Tsourlos, P.; Tsokas, G.N. Geophysical investigation of tumuli by means of surface 3D electrical resistivity tomography. J. Appl. Geophys. 2010, 70, 192–205. [Google Scholar] [CrossRef]
  32. Yi, M.J.; Kim, J.H.; Song, Y.; Cho, S.J.; Chung, S.H.; Sush, J.H. Three-dimensional imaging of subsurface structures using resistivity data. Geophys. Prospect. 2001, 49, 483–497. [Google Scholar] [CrossRef]
  33. Elwaseif, M.; Slater, L. Quantifying tomb geometries in resistivity images using watershed algorithms. J. Archaeol. Sci. 2010, 37, 1424–1436. [Google Scholar] [CrossRef]
  34. Al-Saadi, O.S.; Schmidt, V.; Becken, M.; Fritsch, T. Very-high-resolution electrical resistivity imaging of buried foundations of a Roman villa near Nonnweiler, Germany. Archaeol. Prospect 2018, 25, 209–218. [Google Scholar] [CrossRef]
  35. Coolen, J.; Wallner, M.; Trausmuth, T.; Konig, A. New Insights into a Romanesque Basilica Church in the Deserted Town of Corvey, Germany, Based on a High-Resolution GPR Survey. Archeosciences 2021, 45, 35–38. [Google Scholar] [CrossRef]
  36. Cozzolino, M.; Di Meo, A.; Gentile, V. The contribution of indirect topographic surveys (photogrammetry and laser scanner) and GPR investigations in the study of the vulnerability of the Abbey of Santa Maria a Mare, Tremiti Islands (Italy). Ann. Geophys. 2019, 62, 1–9. [Google Scholar] [CrossRef]
  37. Urban, T.M.; Murray, C.A.; Vella, C.; Lahikainen, A. Ground-penetrating radar survey on the island of Pantelleria (Italy) reveals an ancient architectural complex with likely Punic and Roman components. J. Appl. Geophys. 2015, 123, 164–169. [Google Scholar] [CrossRef]
  38. Booth, A.D.; Szpakowska, K.; Pischikova, E.; Griffin, K. Structure of an ancient Egyptian tomb inferred from ground-penetrating radar imaging of deflected overburden horizons. Archaeol. Prospect. 2015, 22, 33–44. [Google Scholar] [CrossRef]
  39. Shi, Z.; Tian, G.; Hobbs, R.W.; Wo, H.; Lin, J.; Wu, L.; Liu, H. Magnetic gradient and ground penetrating radar prospecting of buried earthen archaeological remains at the Qocho City site in Turpan, China. Near. Surf. Geophys. 2015, 13, 477–485. [Google Scholar] [CrossRef]
  40. Simpson, D.; Lehouck, A.; Verdonck, L.; Vermeersch, H.; Van Meirvenne, M.; Bourgeois, J.; Thoen, E.; Docter, R. Comparison between electromagnetic induction and fluxgate gradiometer measurements on the buried remains of a 17th century castle. J Appl Geophys. 2009, 68, 294–300. [Google Scholar] [CrossRef]
  41. Persson, K.; Olofsson, B. Inside a mound: Applied geophysics in archaeological prospecting at the Kings’ Mounds, Gamla Uppsala, Sweden. J. Archaeol. Sci. 2004, 31, 551–562. [Google Scholar] [CrossRef]
  42. Zheng, W.; Li, X.; Lam, N.; Wang, X.; Liu, S.; Yu, X.; Sun, Z.; Yao, J. Applications of integrated geophysical method in archaeological surveys of the ancient Shu ruins. J. Archaeol. Sci. 2013, 40, 166–175. [Google Scholar] [CrossRef]
  43. Keay, S.; Earl, G.; Hay, S.; Kay, S.; Ogden, J.; Strutt, K.D. The role of integrated geophysical survey methods in the assessment of archaeological landscapes: The case of Portus. Archaeol. Prospect. 2009, 16, 154–166. [Google Scholar] [CrossRef]
  44. Ward, S.H. Resistivity and induced polarization methods. In Geotechnical and Environmental Geophysics, 1st ed.; Ward, S.H., Ed.; Society of Exploration Geophysicists: Houston, TX, USA, 1990; Volume 5, pp. 147–189. [Google Scholar]
  45. Patella, D. Introduction to ground surface self-potential tomography. Geophys. Prospect. 1997, 45, 653–681. [Google Scholar] [CrossRef]
  46. Mauriello, P.; Patella, D. Resistivity anomaly imaging by probability tomography. Geophys. Prospect. 1999, 47, 411–429. [Google Scholar] [CrossRef]
  47. Mauriello, P.; Patella, D. Resistivity tensor probability tomography. Prog. Electromagn. Res. B 2008, 8, 129–146. [Google Scholar] [CrossRef]
  48. Mauriello, P.; Patella, D. Geoelectrical anomalies imaged by polar and dipolar probability tomography. Prog. Electromagn. Res. 2008, 87, 63–88. [Google Scholar] [CrossRef]
  49. Mauriello, P.; Patella, D. A data-adaptive probability-based fast ERT inversion method. Prog. Electromagn. Res. 2009, 97, 275–290. [Google Scholar] [CrossRef]
  50. Available online: www.idsgeoradar.com (accessed on 24 May 2023).
  51. Goodman, D. GPR-SLICE. Ground Penetrating Radar Imaging Software. User’s Manual; Geophysical Archaeometry Laboratory: Woodland Hills, CA, USA, 2004. [Google Scholar]
  52. Capper, J.E. Photographs of Stonehenge as seen from a War Balloon. Archaeologia 1907, 60, 571. [Google Scholar] [CrossRef]
  53. Gosh, S. History of Photogrammetry; Laval University: Québec City, QC, Canada, 1981. [Google Scholar]
  54. Guaitoli, M. Lo Sguardo di Icaro, Le Collezioni dell’Aerofototeca Nazionale per la Conoscenza del Territorio; Campisano Editore: Rome, Italy, 2003. [Google Scholar]
  55. Ihde, D. Postphenomenology; Essays in the Postmodern Context; Northwestern University Press: Evanston, IL, USA, 1993. [Google Scholar]
  56. Verhoeven, G. Providing an archeological bird’s eye view—An overall picture of ground-based means to execute low-altitude aerial photography (LAAP) in Archeology. Archaeol. Prospect. 2009, 16, 233–249. [Google Scholar] [CrossRef]
  57. Campana, S. Drones in archaeology. State-of-the-art and future perspectives. Archaeol. Prospect. 2017, 24, 275–296. [Google Scholar] [CrossRef]
  58. Gabrielli, R.; Angelini, A.; Portarena, D. The Shawbak Castle from a balloon. An integrated methodological approach for the study of archaeological emergencies. Archeol. Aerea 2019, 11, 50–58. [Google Scholar]
  59. Altan, M.O.; Celikoyan, T.M.; Kemper, G.; Toz, G. Balloon photogrammetry for cultural heritage. In Proceedings of the Geo-Imagery Bridging Continents, XXth ISPRS Congress, Istanbul, Turkey, 12–23 July 2004. [Google Scholar]
  60. Ahmet, K. The Western Papaguerıa from the air: Digital imagery using kite and balloon aerial photography. In Enter the Past. The E-Way into the Four Dimensions of Cultural Heritage. CAA 2003. Computer Applications and Quantitative Methods in Archaeology; der Stadt Wien, M., Erbe, R.K., Wien, S., Eds.; Archaeopress: Oxford, UK, 2003; pp. 46–49. [Google Scholar]
  61. Bogacki, M.; Malkowski, W.; Misiewicz, K. Kite aerial photography (KAP) as a tool for completing GIS models. Ptolemais (Libya) case study. In Proceedings of the Remote Sensing for Archaeology and Cultural Heritage Management, 1st International EARSeL Workshop, CNR, Rome, Italy, 30 September–4 October 2008. [Google Scholar]
  62. Eisenbeiss, H.; Lambers, K.; Sauerbier, M.; Li, Z. Photogrammetric documentation of an archaeological site (Palpa, Peru) Using an Autonomous Model Helicopter. In Proceedings of the CIPA 2005 XX International Symposium, Torino, Italy, 26 September–1 October 2005. [Google Scholar]
  63. Hailey, T.I. The powered parachute as an archaeological reconnaissance vehicle. Archaeol. Prospect. 2005, 12, 69–78. [Google Scholar] [CrossRef]
  64. Sauerbier, M.; Eisenbeiss, H. UAVs for the documentation of archaeological excavations. ISPRS 2010, 38, 526–531. [Google Scholar]
  65. Seitz, C.; Altenbach, H. Project Archeye—The quadrocopter as the archaelogist’s eye. Int. Arch. Photogramm. Remote Sens. Spat. Inf. Sci. 2012, 38, 297–302. [Google Scholar] [CrossRef]
  66. Remondino, F.; Barazzetti, L.; Nex, F.; Scaioni, M.; Sarazzi, D. UAV photogrammetry for mapping and 3D modelling—Current status and future perspectives. In Proceedings of the ISPRS Zurich 2011 Workshop, Zurich, Switzerland, 14–16 September 2011; The International Archives of the Photogrammetry, Remote Sensing and Spatial Information Sciences. Volume 38. [Google Scholar]
  67. Rinaudo, F.; Chiabrando, F.; Lingua, A.; Spanò, A. Archaeological site monitoring: UAV photogrammetry could be an answer. ISPRS 2012, 39, 583–588. [Google Scholar] [CrossRef]
  68. Campana, S.; Sordini, M.; Rizzi, A. 3D Modeling of a Romanesque church in Tuscany: Archaeological aims and geomatic techniques. In Proceedings of the 3rd International Workshop on the 3D Virtual Reconstruction and Visualization of Complex Architectures, Trento, Italy, 25–28 February 2009. [Google Scholar]
  69. Fiorillo, F.; Jiménez Fernández-Palacios, B.; Remondino, F.; Barba, S. 3d Surveying and modelling of the archaeological area of Paestum, Italy. Virtual Archaeol. Rev. 2013, 4, 55–60. [Google Scholar] [CrossRef]
  70. Fiorillo, F.; Remondino, F.; Barba, S.; Santoriello, A.; De Vita, C.B.; Casellato, A. 3D digitization and mapping of heritage monuments and comparison with historical drawings. In Proceedings of the XXIV International CIPA Symposium, Strasbourg, France, 2–6 September 2013. [Google Scholar]
  71. Pueschel, H.; Sauerbier, M.; Eisenbeiss, H. A 3D model of Castle Landenberg (CH) from combined photogrammetric processing of terrestrial and UAV-based images. Int. Arch. Photogramm. Remote Sens. Spatial Inf. Sci. 2008, 37, 93–98. [Google Scholar]
  72. Remondino, F.; Gruen, A.; Von Schwerin, J.; Eisenbeiss, H.; Rizzi, A.; Sauerbier, M.; Richards-Rissetto, H. Multisensors 3D documentation of the Maya site of Copan. In Proceedings of the 22nd CIPA Symposium, Kyoto, Japan, 11–15 October 2009. [Google Scholar]
  73. Bendea, H.; Chiabrando, F.; Tonolo, F.G.; Marenchino, D. Mapping of archaeological areas using a low-cost UAV. The Augusta Bagiennorum test site. In Proceedings of the CIPA 2007 XXI International Symposium, Athens, Greece, 1–6 October 2007. [Google Scholar]
  74. Chiabrando, F.; Nex, F.; Piatti, D.; Rinaudo, F. UAV and RPV systems for photogrammetric surveys in archeological areas: Two tests in the Piedmont Region (Italy). J. Archaeol. Sci. 2011, 38, 697–710. [Google Scholar] [CrossRef]
  75. Sonnemann, T.F.; Malatesta, E.H.; Hofman, C.L. Applying UAS photogrammetry to analyze spatial patterns of indigenous settlement sites in the northern Dominican Republic. In Archaeology in the Age of Sensing; Forte, M., Campana, S., Eds.; Springer: New York, NY, USA, 2016; pp. 71–87. [Google Scholar]
  76. Orihuela, A.; Molina-Fajardo, M.A. UAV Photogrammetry Surveying for Sustainable Conservation: The Case of Mondújar Castle (Granada, Spain). Sustainability 2021, 13, 24. [Google Scholar] [CrossRef]
  77. Gebel, H.G.K.; Nissen, H.J.; Zaydoon, Z. Basta II: The Architecture and Stratigraphy; Ex Oriente: Launaguet, France, 2006; Volume 2. [Google Scholar]
  78. Franchi, R.; Gabrielli, R.; Angelini, A. L’antico sistema idrico di Petra. Studio e analisi per la conservazione del patrimonio architettonico. In Proceedings of the Acqua Preziosa, Amman, Jordan, 18 October 2016; Nigro, L., Nucciotti, M., Gallo, E., Eds.; Percorsi delle Civiltà Giordane Visti Negli Scavi Archeologici Italiani: Amman, Jordan, 2016. [Google Scholar]
  79. Cozzolino, M.; Di Giovanni, E.; Mauriello, P.; Piro, S.; Zamuner, D. Geophysical Methods for Cultural Heritage Management; Springer: Cham, Switzerland, 2018. [Google Scholar]
  80. D’Annibale, E.; Fangi, G. Interactive Modeling by projection of oriented spherical panorama, Ad Deir, Petra, Jordan. In Proceedings of the 3 International Workshop 3D ARCH, 3D Virtual Reconstruction and Visualization of Complex Architecture, Trento, Italy, 25–28 February 2009. [Google Scholar]
  81. D’Annibale, E. Image Based Modeling from Spherical Photogrammetry and Structure for Motion; The case of the Treasury, Nabatean Architecture in Petra. In Proceedings of the XXIIIrd International CIPA Symposium, Prague, Czech Republic, 12–16 September 2011. [Google Scholar]
  82. Gabrielli, R.; Angelini, A.; Franchi, R. Studio e restauro per la conservazione dei Beni Culturali: Il caso di studio della Tomba Palazzo a Petra, Giordania. In Scavare, Documentare, Conservare: Viaggio Nella Ricerca Archeologica del CNR; Carnevale, A., Ed.; CNR Edizioni: Rome, Italy, 2016; pp. 282–289. [Google Scholar]
  83. Miller, J.M. Archeological Survey of the Kerak Plateau: Conducted Turing 1978–1982 under the Direction of J. Maxwell Miller and Jack M. Pinkerton; Scholars Press: Atlanta, GA, USA, 1991. [Google Scholar]
  84. Musil, A. Arabia Petraea, 1st ed.; A. Hölder: Vienna, Austria, 1907. [Google Scholar]
  85. Piccirillo, M. Madaba, le Chiese e i Mosaici; Edizioni Paoline: Cinesello Balsamo, Italy, 1989. [Google Scholar]
  86. Piccirillo, M. La Palestina Cristiana I-VII Secolo; Centro Editoriale Dehoniano (EDB): Bologna, Italy, 2008. [Google Scholar]
  87. Angelini, A.; Cozzolino, M.; Gabrielli, R.; Galatà, P.; Gentile, V.; Mauriello, P. Integrated Methodologies for the Survey and the Documentation of Two Byzantine Churches at the UNESCO Archaeological Site of Umm ar-Rasas (Jordan). In Proceedings of the International Conference on Computational Science and Its Applications, Malaga, Spain, 4–7 July 2022. [Google Scholar]
  88. Cozzolino, M.; Gabrielli, R.; Galata, P.; Gentile, V.; Greco, G.; Scopinaro, E. Combined use of 3D metric surveys and non-invasive geophysical surveys at the Stylite Tower (Umm ar-Rasas, Jordan). Ann. Geophys. 2019, 62, 339. [Google Scholar]
  89. Gabrielli, R.; Greco, G. Umm Ar-Rasas: The Application of Integrated Methodologies for the Valorization of a Unesco Site. GJAA 2018, 6, 555–688. [Google Scholar]
  90. Galatà, P.; Zavagnini, A.; Gabrielli, R.; Portarena, D.; Franceschinis, M. Tecniche di documentazione dei tappeti musivi del sito archeologico di Umm Al-Rasas–Kastron Mefaa (Giordania). Archeol. Calcolatori. 2017, 28, 201–218. [Google Scholar]
  91. Piccirillo, M. Umm al-Rasas, Mayfaah I; Studium Biblicum Franciscanum: Jerusalem, Israel, 1994. [Google Scholar]
  92. Savignac, R. Sur le pistes de Transjordanie méridianale. Rev. Biblique 1936, 45, 234–262. [Google Scholar]
  93. Saller, S.; Bagatti, B. The Town of Nebo (Khirnbet el−Mekhayyat). With a Brief Survey of Other Christian Monuments in Transjordan; Franciscan Press: Jerusalem, Israel, 1949. [Google Scholar]
  94. Wilson, C. Preliminary Reports, Palestine Exploration Fund Quarterly Statement (PEFQSt); Maney Publishing: London, UK, 1889; p. 316. [Google Scholar]
  95. Felicetti, A.; Albiero, A.; Gabrielli, R.; Pierdicca, R.; Paolanti, M.; Zingaretti, P.; Malinverni, E.S. Automatic Mosaic Digitalization: A Deep Learning approach to tessera segmentation. In Proceedings of the 2018 IIEE International Conference on Metrology for Archaeology and Cultural Heritage, Cassino, Italy, 22–24 October 2018. [Google Scholar]
  96. Malinverni, E.S.; Pierdicca, R.; Di Stefano, F.; Gabrielli, R.; Albiero, A. Virtual museum enriched by GIS data to share science and culture. Church of Saint Stephen in Umm Ar-Rasas (Jordan). Virtual Archaeol. Rev. 2019, 10, 31–39. [Google Scholar] [CrossRef]
  97. Pierdicca, R.; Intrigila, C.; Piccinini, F.; Malinverni, E.S.; Giannetti, I.; Caruso, G. Multidisciplinary approach for the analysis of structural heritage at risk: The case study of stylite tower at Umm ar-Rasas (Jordan). Int. J. Archit. Herit. 2023, 17, 745–769. [Google Scholar] [CrossRef]
  98. Felicetti, A.; Paolanti, M.; Zingaretti, P.; Pierdicca, R.; Malinverni, E.S.M.S. Mosaic image segmentation based on deep cascading learning. Virtual Archaeol. Rev. 2021, 12, 25–38. [Google Scholar] [CrossRef]
  99. Salvatori, M. Manuale di Metrologia per Architetti Studiosi di Storia Dell’architettura ed Archeologi; Liguori: Naples, Italy, 2006. [Google Scholar]
  100. Clemente, P.; Delmonaco, G.; Puzzilli, L.; Saitta, F. Stability and seismic vulnerability of the Stylite Tower at Umm ar-Rasas. Ann. Geophys. 2019, 61, 3. [Google Scholar] [CrossRef]
  101. Clemente, P.; Delmonaco, G.; Puzzilli, L.; Saitta, F. Seismic analysis of the Stylite Tower at Umm ar-Rasas. In Structural Analysis of Historical Constructions: An Interdisciplinary Approach; Aguilar, R., Torrealva, D., Moreira, S., Pando, M.A., Ramos, L.F., Eds.; Springer: Cham, Switzerland, 2019; pp. 1780–1788. [Google Scholar]
  102. Vannini, G.; Nucciotti, M. Da Petra a Shawbak. Archeologia di una Frontiera; Giunti: Florence, Italy, 2009. [Google Scholar]
  103. Vannini, G.; Vanni Desideri, A.; Nucciotti, M.; Tonghini, C. Medieval Petra. Archaeology of the Crusader-Ayyubid fortified installations in Trans-Jordan; Archaeological Mission of the University of Florence. In Proceedings of the Civiltà del Passato, Dialogo del Presente, Missioni di Ricerca Italiana in Giordania, Amman, Jordan, 17 October 2002. [Google Scholar]
  104. Bini, M.; Bertocci, S. Castelli di Pietre. Aspetti Formali e Materiali dei Castelli Crociati Nell’area di Petra in Transgiordania; Edizioni Polistampa: Florence, Italy, 2004. [Google Scholar]
  105. Gabrielli, R.; Angelini, A.; Giunta, E.; Taffi, E. From 2D to 3D data: Al-Wu’ayra’s crusader castle. In Proceedings of the 5th International Congress on Science and Technology for the Safeguard of Cultural Heritage in the Mediterranean Basin, Istanbul, Turkey, 22–25 November 2011. [Google Scholar]
  106. Gabrielli, R.; Angelini, A.; Portarena, D. Strategie innovative di elaborazione e restituzione dati del castello crociato di Wu’Ayra. Archeol. Calcolatori. 2015, 26, 209–227. [Google Scholar]
  107. Angelini, A.; Gabrielli, R. Laser scanning e photoscanning. Tecniche di rilevamento per la documentazione 3D di beni architettonici e archeologici. Archeol. Calcolatori. 2013, 24, 379–394. [Google Scholar]
  108. Gabrielli, R.; Angelini, A.; Portarena, D. Il castello di Shawbak da pallone aerostatico. Un approccio metodologico integrato per lo studio delle emergenze archeologiche. Archeol. Aerea 2017, 11, 50–58. [Google Scholar]
  109. Piccirillo, M. La ricerca Archeologica Lungo il Cardo Romano di Madaba. Liber Annuus 1985, 35, 429–430. [Google Scholar]
  110. Piccirillo, M. The Mosaics of Jordan; Penn State University Press: University Park, PA, USA, 2003. [Google Scholar]
  111. Piccirillo, M. Il Parco Archeologico e la Scuola del Mosaico a Madaba in Giordania. Cronistoria di un progetto. In Siti e monumenti della Giordania. Rapporto Sullo Stato di Conservazione; Marino, L., Ed.; Edizioni Terra Santa: Florence, Italy, 1994; pp. 53–56. [Google Scholar]
  112. D’Andrea, M.; Polcaro, A.; Richard, S.; Clark, D.R. The new Madaba regional archaeological museum project (MRAMP). SHAJ 2019, 8, 475–487. [Google Scholar]
Figure 1. Location of Jordan on the global map with a detailed view of the archaeological sites of Basta, Petra, Karak (Um-Hamat), Umm ar-Rasas, Wu’ayra, Madaba, and Shawbak (Google Earth™ satellite image).
Geosciences 13 00349 g001
Figure 2. The archaeological site of Basta: remains from the period 7500–7000 BC.
Geosciences 13 00349 g002
Figure 3. The archaeological site of Basta: GPR slice relative to 0.2–0.5 m in depth (a) and interpretation of the main maxima of amplitude signed with pink lines (b).
Geosciences 13 00349 g003
Figure 4. Petra Archaeological Park: (1) Djinn blocks; (2) Obelisk Tomb; (3) Tunnob; (4) Al-Muthlim tunnel; (5) Dam; (6) Al-Madras; (7) Siq; (8) Treasure Tomb; (9) Outer Siq; (10) Tomb of the 17 Tombs; (11) Street of Facades; (12) Theatre; (13) Nymphaeum; (14) Byzantine Tower; (15) Temple of Winged Lions; (16) Great Temple; (17) Monumental Gate; (18) Qasr al-Bint; (19) Royal Urn Tomb; (20) Royal Uneishu Tomb; (21) Nabataean Tombs; (22) Royal Silk Tomb; (23) Royal Corinthian Tomb; (24) Royal Palace Tomb; (25) Royal Tomb of Sextus Florentinus; (26) Nabataean Quarry; (27) Unfinished Tomb; (28) Columbarium; (29) Jebal Habis Crusader Fortress; (30) Necropolis of Jabal Umm al Biyara; (31) Serpent Monument; (32) High Place of Sacrifice; (33) Lion Monument; (34) Garden Temple; (35) Tomb of Roman Soldier; (36) Triclinium; (37) Tombs of Wadi Nmeir; (38) Renaissance Tomb; (39) Tomb with Broken Pediment; (40) Site of al-Katutah; (41) Column of Pharaoh; (42) Western site of al-Katutah; (43) Triclinium of the Lion; (44) Painted Biclinium; (45) Qattar ad-Deir; (46) Sanctuaire Et Hermitage; (47) Al-Deir; (48) House of Dotorotheos; (49) Mughur al-Nasara Necropolis; (50) Conway Tower; (51) Turcomanno’s Tomb; (52) Byzantine Church; (53) Blue Chapel; (54) Ridge Church; (55) Villa on Ez-Zantur Hill.
Geosciences 13 00349 g004
Figure 5. Archaeological Park of Petra, the Nabataean tombs: Treasury Tomb (a), Royal Palace Tomb (left) and Corinthian Royal Tomb (right) (b), Al-Deir (c).
Geosciences 13 00349 g005
Figure 6. Petra Archaeological Park, the Roman city: a view of the lower city (a), the monumental gate (b), the colonnade (c).
Geosciences 13 00349 g006
Figure 7. Electrical resistivity tomography acquisition (left) and location of grid data (right). Arrows indicate the acquired ERT profiles. Reprinted with permission from [79]. Copyright the authors.
Geosciences 13 00349 g007
Figure 8. Integration between a panoramic photograph and resistivity tomography with respect to a depth of 6 m. Reprinted with permission from [79]. Copyright the authors.
Geosciences 13 00349 g008
Figure 9. Different views of the integration between three-dimensional reconstructions and geophysical results. Reprinted with permission from [79]. Copyright the authors.
Geosciences 13 00349 g009
Figure 10. Laser scanner data acquisition (a) and data processing of a single scan in which raw data are displayed in reflectance using a cutting plane indicated with yellow and blue lines (b).
Geosciences 13 00349 g010
Figure 11. Orthophoto of the facade of the Treasure Tomb.
Geosciences 13 00349 g011
Figure 12. Planar cross-sections indicated with different colors of the interior Treasure Tomb (a) and distance maps of the interior Treasure Tomb from various viewpoints (bd).
Geosciences 13 00349 g012
Figure 13. Snapshots of the 3D model of the Treasure Tomb inside. Blue areas indicates voids.
Geosciences 13 00349 g013
Figure 14. Numerical model of the Palace Tomb obtained from the processing of photogrammetric and laser scanner data. Adapted with permission from [82]. Copyright the authors.
Geosciences 13 00349 g014
Figure 15. DEM of the monument with a chromatic scale ranging between blue (deep layers) and dark red (shallow layers) (a) and degradation map (b) of the Palace Tomb. Adapted with permission from [82]. Copyright the authors.
Geosciences 13 00349 g015
Figure 16. Um-Hamat: location of archaeological structures in a Google Earth™ satellite image.
Geosciences 13 00349 g016
Figure 17. Um-Hamat: electrical resistivity tomography relative to a depth of 1 m in a Google Earth™ satellite image.
Geosciences 13 00349 g017
Figure 18. The archaeological site UNESCO of Umm ar-Rasas (Jordan): the entire site (a), the Roman castrum and Byzantine churches (b), and the Stylite tower (c,d) in satellite images ©2018 CNES/airbus from Google Earth™. Reprinted with permission from [87]. Copyright the authors.
Geosciences 13 00349 g018
Figure 19. 3D perspective view of the two churches obtained by laser scanning processing: 3D model of the two churches in their actual spatial arrangement (a); qualitative inclination map of the walls where the colors indicate the direction of the surfaces (b). Reprinted with permission from [87]. Copyright the authors.
Geosciences 13 00349 g019
Figure 20. Detail of the apse (a) and perspective 3D view of the model of the Church of Bishop Sergius created with laser scanner (b). Reprinted with permission from [87]. Copyright the authors.
Geosciences 13 00349 g020
Figure 21. High-resolution orthographic view of mosaic floor of Saint Stephen’s Church obtained by integrating photogrammetric and laser scanning techniques. Reprinted with permission from [87]. Copyright the authors.
Geosciences 13 00349 g021
Figure 22. Model of the variation in height of the floor of the churches. Reprinted with permission from [87]. Copyright the authors.
Geosciences 13 00349 g022
Figure 23. Slices related to the 0.5–0.7 m depth window overlap on the map of the churches: the blue arrows indicate the location of the probable tanks, while the pink arrows highlight the probable buried archaeological structures. Reprinted with permission from [87]. Copyright the authors.
Geosciences 13 00349 g023
Figure 24. Thematic map of the mosaic pavement of St. Stephen’s Church enriched with the application of GIS technology. Reprinted with permission from [87]. Copyright the authors.
Geosciences 13 00349 g024
Figure 25. RGB visualization of the points cloud. Reprinted with permission from [88]. Copyright the authors.
Geosciences 13 00349 g025
Figure 26. Horizontal sections of the 3D model and position of the barycenter of the sections. Reprinted with permission from [88]. Copyright the authors.
Geosciences 13 00349 g026
Figure 27. The four facades of the tower with the indication of the deviation from the original position. Reprinted with permission from [88]. Copyright the authors.
Geosciences 13 00349 g027
Figure 28. DEM of the surface around the tower. Reprinted with permission from [88]. Copyright the authors.
Geosciences 13 00349 g028
Figure 29. GPR measurement with indication of a red arrow for each profile (left) and data acquisition (right). Reprinted with permission from [88]. Copyright the authors.
Geosciences 13 00349 g029
Figure 30. Display anomalies on selected radargrams from the entire data set. Reprinted with permission from [88]. Copyright the authors.
Geosciences 13 00349 g030
Figure 31. GPR depth-slices. Reprinted with permission from [88]. Copyright the authors.
Geosciences 13 00349 g031
Figure 32. GPR slice with respect to the 0.60–0.90 m depth range, indicating the anomalies discussed in the analysis of the radargrams in Figure 8. Reprinted with permission from [88]. Copyright the authors.
Geosciences 13 00349 g032
Figure 33. View of the remains of the castle of Wu’Ayra (a) and the area of the necropolis with indication of the area of interest for geophysical investigations (b).
Geosciences 13 00349 g033
Figure 34. Wu’Ayra castle: electrical resistivity tomography relative to 1 m depth in a Google Earth™ satellite image. Location of the area interested by photogrammetry and laser scanner is here reported with a dotted square.
Geosciences 13 00349 g034
Figure 35. Wu’Ayra castle: Google Earth™ satellite image (a), orthophoto taken with kite (b) and balloon (c). The quotation marks indicate analogous points in the three maps. Adapted with permission from [106]. Copyright the authors.
Geosciences 13 00349 g035
Figure 36. Wu’Ayra castle: perspective view of the numerical point cloud model of the whole castle developed with automatic recognition systems for homologous points. A false color representation highlights the higher elevation areas (a); perspective view of contour lines of the whole castle extracted from the numerical point cloud model processed in Agisoft Photoscan 1.8.2 (b); perspective view of the integration between the numerical model generated by photogrammetry and the model obtained with the laser scanner, the location of which is reported in Figure 34c (c). Adapted with permission from [106]. Copyright the authors.
Geosciences 13 00349 g036
Figure 37. Model A, created with automatic photogrammetry systems and processed with Agisoft Photoscan 1.8.2 (a); Model B, the mesh model triangulated with manual photogrammetry systems (b). Adapted with permission from [106]. Copyright the authors.
Geosciences 13 00349 g037
Figure 38. Processing of contour lines on the discontinuous point model (a), after regularization of the numerical model (in the second case the curves are more regular and reliable) (b), and on the topographic mesh (the point cloud was smoothed by using a virtual scan and then converted into a mesh. The result of the curves is more suitable, and free from information changes) (c). Adapted with permission from [106]. Copyright the authors.
Geosciences 13 00349 g038
Figure 39. View of the castle of the Shawbak.
Geosciences 13 00349 g039
Figure 40. Shawbak castle: orthophoto overlaid with contour lines generated by the numerical model. Adapted with permission from [108]. Copyright the authors.
Geosciences 13 00349 g040
Figure 41. Shawbak castle: DEM overlaid with contour lines generated by the numerical model. Adapted with permission from [108]. Copyright the authors.
Geosciences 13 00349 g041
Figure 42. Shawbak castle: electrical resistivity tomography relative to 1 m in depth on the orthophoto overlaid with contour lines generated by the numerical model.
Geosciences 13 00349 g042
Figure 43. Madaba Archaeological Park West.
Geosciences 13 00349 g043
Figure 44. Madaba Archaeological Park West: location of the 13 DD parallel profiles. The green circles represent well-known voids or cisterns.
Geosciences 13 00349 g044
Figure 45. Madaba Archaeological Park West: 3D view, ERT n. 1, 4, 5, 6, 7, and 8 (a), n. 2 and 9 (b), n. 3 (c) n. 12 (d), n. 10 (e), n. 11 (f), n. 13 (g).
Geosciences 13 00349 g045
Disclaimer/Publisher’s Note: The statements, opinions and data contained in all publications are solely those of the individual author(s) and contributor(s) and not of MDPI and/or the editor(s). MDPI and/or the editor(s) disclaim responsibility for any injury to people or property resulting from any ideas, methods, instructions or products referred to in the content.

